
Submitted:
11 April 2024
Posted:
11 April 2024
You are already at the latest version
Abstract
This study investigates the impact of climate change on the efficiency of organic honey production in Türkiye using a machine learning approach. The eXtreme Gradient Boosting (XGBoost) algorithm is employed for the Machine Learning (ML) modelling. The analysis includes data on organic honey production performance from 2004 to 2023, spanning a period of 20 years, and 8 different climate variables (16 variables depending on daytime and nighttime values). The dataset created to investigate the impact of climate change on organic honey yield comprises 28 columns and 120,960 rows. The study aimed to determine the significance of different climatic variables on the efficiency of organic honey production. The study found that, in addition to daytime solar radiation and temperature, wind speed and direction were also important factors. The sensitivity analysis has shown that minor alterations in the variables have a significant impact on the model's predictions. Additionally, non-linear relationships between the variables and honey production were identified. These findings suggest that it may be beneficial to consider implementing climate change adaptation and mitigation strategies in agricultural policies and beekeeping practices. The study suggests that machine learning has the potential to provide valuable insights into the complex relationship between climate change and agricultural production. This could aid in the sustainability and economic optimization of the sector.
Keywords:
Climate Change
; Organic Beekeeping
; Sustainable Agriculture
; Natural Source Management
1. Introduction
Türkiye is a country that has gained global recognition in the field of organic beekeeping [1,2,3]. Organic beekeeping is a type of beekeeping that adheres to the authoritative regulations of organic agriculture, ensuring the preservation of natural integrity at every stage of honey production and the use of only natural nectar and pollen [4]. Bee products, such as organic honey, beeswax, and propolis, have both culinary and therapeutic applications [3]. In 2022, Türkiye produced 1352 tons of organic honey, followed by 1298 tons in 2023. Türkiye's rich flora contains approximately three-quarters of the world's honey plant flora, making it an ideal location for organic beekeeping. The Kaz Mountains' 206-hectare honey forest, in particular, supports the production of high-quality honey by local bees through the cultivation of endemic honey plants [5].
Türkiye's diverse geography spans seven distinct regions, each with its own unique climate and vegetation that contribute to the landscape of organic honey production [6]. The Marmara Region has a temperate climate, while the Black Sea region has rugged terrain. The potential and challenges of organic beekeeping throughout the country are shaped by this climatic diversity. It is important to acknowledge the varying conditions that affect organic beekeeping in different regions of the country.
However, it appears that fluctuations in recent years have had an impact on Türkiye's potential for organic honey production, which has prompted an investigation into the underlying factors affecting efficiency [7]. It is believed that a comprehensive study is necessary to fully understand the dynamics between climate change and organic honey production, which has emerged as a focal point [8].
It is worth noting that the production of honey by bees is affected by climatic conditions, particularly temperature. The ideal temperature range is between 20°C and 30°C for honey bees. This temperature range optimizes bees' efficiency in foraging activities and, as a result, honey production. However, the rise in global temperatures may cause an increase in temperatures, which could lead to elevated stress levels in bees and adversely affect their foraging behavior. Temperatures exceeding 30°C can impede bees' access to food sources and decrease honey production due to thermal stress [9,10]. It is advisable to refrain from making subjective evaluations unless they are explicitly marked as such. Moreover, it is worth noting that honey production can be influenced by various environmental factors, including microclimate changes and habitat degradation. These factors, when combined with beekeeping management, can lead to indirect impacts on honey yield [9,10]. As a result, it is crucial to improve beekeeping practices to accommodate climate changes and complement them with habitat restoration to guarantee sustainable honey production.
This study investigates to explore the correlation between climate change and organic honey yield in Türkiye. To analyze the impact of climate, 10-meter wind (U and V components), 2-meter temperature, solar radiation, thermal radiation, precipitation, surface pressure, and humidity variations on honey production efficiency of Türkiye, the XGBoost algorithm, a machine learning tool, will be utilized [11].
It is worth noting that the description and understanding of the complex relationships between organic honey production and climate change can be challenging for statistical methods. This is due to the limitations of statistical models, which often assume linear relationships and may not accurately model complex non-linear relationships [12]. Furthermore, these methods may encounter difficulties in accounting for all variables in the dataset and capturing interactions. Therefore, in order to fully understand the relationship between organic honey production and climate change, it may be beneficial to take a flexible approach. It has been noted that machine learning techniques are particularly adept at identifying complex and non-linear relationships [13,14]. One such algorithm, XGBoost, has been shown to be especially effective in identifying and predicting patterns in large datasets [15]. Machine learning techniques could be considered as a suitable tool to analyse the relationships between organic honey production and climate change in more detail and to predict future trends. It may be necessary to use machine learning techniques to overcome the limitations of traditional statistical methods and provide a more comprehensive analysis [16].
Using data spanning of two decades from the Turkish Statistical Institute (TURKSTAT), significant trends and changes in organic honey production have been identified and correlated with climatic variables [17]. An in-depth analysis aims to not only identify the climatic factors that influence production but also propose region-specific strategies to increase organic honey yields in the context of changing environmental conditions.
The realm of data and analysis, our objective is not only to reveal the impacts of climate change on organic honey yield but also to discover methods to encourage resilience and sustainability in Türkiye's beekeeping sector. In the subsequent sections, we will explain our approach, present our discoveries, and propose a course of action towards a more robust and adaptable future for organic honey production in Türkiye.
2. Materials and Methods
2.1. Data Collection and Data Arrangement
Data pertaining to organic honey production quantities, number of farmers, and hive counts spanning the period from 2004 to 2023 were sourced from TURKSTAT [17]. To ensure data accuracy, these datas were cross-checked with the Eurostat database. The analysis revealed organic honey production activities across 7 distinct regions and 58 cities throughout Türkiye (Figure 1).
Türkiye is comprised of seven distinct geographical regions. The Marmara Region has generally temperate climate conditions, which make it a suitable environment for organic honey production due to the high diversity of flora and agricultural areas. The Mediterranean Region experiences hot and dry summers and mild and rainy winters [19]. The Aegean Region's diverse plant life and climatic conditions create a suitable environment for organic honey production. No changes in content have been made, and the text is free from filler words and unnecessary jargon. Citrus fruits, olives, and various herbs contribute to this process. The text adheres to conventional structure, with factual and unambiguous titles and consistent technical terms. The region experiences a Mediterranean climate, characterized by hot, dry summers and mild, rainy winters, which provide ideal conditions for organic beekeeping [20]. The language used is clear, objective, and value-neutral, with no biased or emotional language. The grammar, spelling, and punctuation are correct, and the text follows a logical flow of information with causal connections between statements. The climatic conditions of the Black Sea region present both advantages and disadvantages for organic honey production [21]. It is important to acknowledge both the potential benefits and drawbacks of the region's climate for organic honey production. While the high humidity and abundant precipitation allow for the development of rich vegetation and a variety of plant species, creating a suitable environment for organic beekeeping, excessive precipitation and humidity may negatively impact the work of bees during certain periods, making honey harvests difficult. Moreover, it is worth noting that the mountainous terrain of the Black Sea Region could potentially affect beekeeping activities. The Central Anatolia region is known for its continental climate characteristics, which may present certain challenges for organic honey production [22]. Nevertheless, some high mountainous regions and plateaus in this area could be suitable for organic beekeeping. On the other hand, the Eastern Anatolia Region experiences a cold and continental climate, which renders it unsuitable for organic honey production [23]. Nevertheless, it is worth noting that the high mountain areas in the region may present an opportunity for organic beekeeping, owing to the natural diversity of plants. It should be mentioned that the Southeastern Anatolia Region is recognized for its hot and arid climate [24].
For the climate change analyses, eight variables were used for each year, including the 12 months, 00:00 at night, and 12:00 during the day. The data used for the analyses was obtained from the European Union's Copernicus Climate Change Service [25]. The study utilized a range of climate variables, including the 10-meter u-wind component (m/s), 10-meter v-wind component (m/s), 2-meter temperature (°C), surface pressure (Pa), total precipitation (m), humidity (kg.s/m²), top solar radiation (W.s/m²), and top thermal radiation (W.s/m²). The dataset created for investigating the impact of climate change on organic honey yield consists of 28 columns and 120960 rows.
2.2. Machine Learning Algorithm
The study utilized RStudio software, which is an open-source tool, for machine learning and the eXtreme Gradient Boosting (XGBoost) algorithm were selected due to their benefits [26,27]. RStudio is favored for its open-source nature and extensive user support. Furthermore, the comprehensive packages and tools provided by RStudio create an appropriate environment for data analysis and machine learning. The XGBoost algorithm is widely recognized for its superior performance on large datasets and its ability to identify complex relationships and interactions, particularly through its gradient boosting method [28,29,30]. In comparison, other commonly used machine learning algorithms, such as Random Forest and Support Vector Machine (SVM), may have slower training times and lower performance when compared to XGBoost. Therefore, based on the data and analysis requirements, it was determined that the combination of RStudio and XGBoost was the most suitable option [28,29,30].
A machine learning model was created using the XGBoost algorithm in the R programming language, and hyperparameter optimization was performed to correlate the effects of temperature and precipitation changes with the positive and negative effects of honey production amount, number of hives, and number of farmers. As shown in Figure 2, a diagram was established with the XGBoost algorithm.
In the algorithm shown in Figure 2, data loading and preprocessing of the data are performed in the first step. Unnecessary columns and cities with insufficient data for analysis were removed from the data-set, and the data-set was divided into training and testing subsets in the proportion of 70% and 30%, respectively. In the second step, model creation is carried out. The XGBoost model used certain parameters during model training. These are nrounds, max_depth, eta, gamma, colsample_bytree, in_child_weight, subsample parameters. For each of these parameters, a hyperparameter grid was created to perform accurate analyzes for the regions in the data set. In the third step, the model was improved according to the best hyperparameter values obtained from the hyperparameter grid. In the last step, the optimal hyperparameters were determined, and the training error and testing error of the model were analyzed. In model training, D classification and regression trees (or Classification and Regression Trees (CART)) are created one by one. Each tree created in the model is trained using the residues of the previous tree. In other words, the new tree tries to predict the outcome by correcting the mistakes made by the previously trained tree [31].
where F is the function space of CART models and each fd corresponds to an independent CART structure denoted as q. In other words, q is the set of rules of an independent CART that classifies each “i" into a single leaf. Accordingly, the correlation between actual and predicted values is calculated [31]. In order to determine the relationship between variables, correlation analyzes within XGBoost machine learning were also used. Correlation takes a value between -1 and 1. If the value is 1, it means perfect positive correlation, and -1 means perfect negative correlation.
3. Results
3.1. Organic Honey Production
Figure 3 shows the organic honey production performances in Turkey from 2004 to 2023. Particularly noteworthy is the performance graph characterized by farmer, hive and honey production, which shows a peak in production efficiency in 2004 followed by a sharp decline in 2005. This sharp decline is thought to be caused by the regulatory measures implemented in 2004 to ensure compliance with the requirements for organic farming certification [32]. It is surmised that many farmers discontinued organic honey production, primarily due to the stringent certification process introduced in 2004. In the years following the implementation of these regulations, there were fluctuations in the number of farmers involved in organic honey production. These fluctuations are indicative of the impact that stringent regulatory oversight had on the participation of individuals within the industry.
Typically, one would expect an increase that a rise in the number of farmers to correlate with an increase in both the number of hives and organic honey production, as shown in Figure 3. However, in the years 2008, 2009, 2013, 2014, 2018, and 2021, this correlation was not consistently observed, resulting in a moderate level of honey production efficiency. This discrepancy suggests the presence of underlying issues that warrant further investigation.
3.2. Climate Change on Türkiye
Climate change has significant impacts on various aspects of life, including lifestyle, health, economy, and the natural environment. These impacts may leave irreversible traces that may not be repaired by future generations. Therefore, it is crucial to proactively identify and rectify any irreparable damages. As known that the organic honey production is particularly affected by two critical parameters of climate change: temperature and precipitation variability. Changes in climatic factors can disrupt the timing and intensity of plant flowering, which can affect bees' pollen and nectar sources, ultimately impacting organic honey production. Extreme temperatures can also cause stress and water loss in bee colonies, while weather variability and heavy precipitation can increase the prevalence of bee diseases and pests. Concurrently, climate change may alter the composition and flavor profiles of honey by causing changes or migration of plant species. Furthermore, it may disrupt the migratory behavior of bees, potentially causing deviations from established migration routes or prolonging their stay in specific areas. In this study, contrary to what is known, in addition to temperature and precipitation changes, wind, surface pressure and humidity factors will be evaluated and a comprehensive result will be tried to be formed.
Figure 4 displays the yearly climate variables of Türkiye for 2004-2023. Climatic data from the last two decades suggests that there may be potential impacts on organic honey production due to the observed increase in 2-metre temperature (C3) values at night. This phenomenon of 'night warming' could lead to changes in the flowering timings and nectar collecting behaviour of bees. Additionally, regional differences in total precipitation (C4), although not showing clear trends, may affect the diversity of flowers accessible to bees and thus the aromatic profiles of honey. It has been observed that higher levels of humidity during daytime hours (C5) can affect the moisture content and storage quality of honey by requiring bees to expend more energy to reduce the moisture content before sealing the combs. Additionally, fluctuations in wind components (C1 & C2) and a general increase in speed have been found to affect bee flight paths and nectar collection efficiency. It has been observed that an increase in solar radiation (C7) can have a stimulating effect on plant growth and nectar production. However, it can also accelerate the deterioration of exposed combs. Conversely, a decrease in night thermal radiation (C8) may indicate lower night cooling due to global warming. These changes in climate can potentially affect the quality and quantity of organic honey production by influencing flowering periods, nectar quality, and bee behaviour.
3.3. Machine Learning for Organic Honey Yield
Machine learning analysis was conducted to assess the influence of climatic variables on the efficiency of organic honey production in Türkiye. The XGBoost algorithm was used in ML, employing the ‘xgbTree’ model which is tree-based analysis approach. It is worth noting that when conducting machine learning, several critical factors should be taken into consideration. To ensure data quality, it is recommended that appropriate techniques are used to address missing values during data preprocessing. Additionally, it is important to select the most suitable model for the dataset, optimize hyperparameters, and effectively train and evaluate the model. When assessing the performance of machine learning models on both training and test datasets, it is particularly important to choose appropriate evaluation metrics. To ensure accurate interpretation of results and optimize time efficiency, it is important to carefully address challenges such as overfitting and underfitting. Therefore, it is recommended to thoroughly adjust model parameters to effectively overcome such challenges.
In the study of the effects of climate change on organic honey production, a hyperparameter grid was automatically generated by the code system to adjust the hyperparameters of the XGBoost model. By optimally setting the seven different hyperparameters for model training [33], machine learning can provide accurate prediction results. The parameters and their values used in the code system are of great importance. The value of Nrounds determines the number of rounds the model will be trained, and selecting a higher value may require more training time but can potentially enhance the model's performance. In this study, we analyzed values of 250, 500, and 1000. The parameter Max_depth represents the maximum depth of the decision tree, and deeper trees can learn more complex relationships but may lead to overlearning. The parameter Max_depth represents the maximum depth of the decision tree, and deeper trees can learn more complex relationships but may lead to overlearning. For the purpose of this study, it was decided to select two different depths, namely 3 and 6. The learning rate, represented by Eta, was also taken into consideration as it determines the amount the model learns in each round. It is generally recommended to choose a small value for Eta. In this study, values of 0.1, 0.3, and 0.5 were selected. Additionally, the minimum reduction amount required to split the decision tree, known as Gamma, was also considered. Typically, zero or a small value is chosen for Gamma. Within the scope of the study, different values were tested for the Gamma parameter (0, 0.05, and 0.1), as well as for the 'colsampe_bytree' parameter (0.6, 0.7, and 0.8) to increase the diversity of trees. Within the scope of the study, different values were tested for the Gamma parameter (0, 0.05, and 0.1), as well as for the 'colsampe_bytree' parameter (0.6, 0.7, 0.8 and 0.9) to increase the diversity of trees. Additionally, the 'min_child_weight' parameter was used to reduce overlearning by setting a minimum weight for each node. These parameters were carefully selected to ensure the best possible results. For the purposes of this study, Min_child_weight values of 1, 3, and 5 were selected, along with subsample values of 0.6, 0.7, 0.8 and 0.9, in order to determine the percentage of randomly sampled data points for each tree.
Table 1 display ML performance parameters; RMSE (Root Mean Square Error), MAE (Mean Absolute Error) and R2 coefficients resulting from XGBoost machine learning. The RMSE represents the square root of the mean of the squares of the difference between the actual and predicted values. A lower RMSE value indicates better model predictions. The MAE represents the average of the absolute differences between actual and predicted values, similar to RMSE but without squares. Similarly, a lower MAE value indicates better model performance. The R2 value is a measure of the proportion of variance in the dependent variable that is explained by the independent variables in a regression model. It ranges from 0 to 1, with higher values indicating a better fit. The R2 value indicates the extent to which the model explains the variance of the independent variables. An R2 value approaching 1 indicates that the model fully explains the variance of the independent variables, but as it moves away from 1, the explanatory power of the model decreases.
The values for RMSE and MAE in Table 1 consistently show a low and close pattern. Additionally, the R2 value, which approaches 1, suggests that the model effectively explains the variance using the independent variables. The convergence of these metrics overall indicates the success of the XGBoost learning model. Moreover, the observation brings attention to the existence of uniform alterations throughout nearly all variables.
Figure 5 displays an image summarizing the success of the ML model in combining the importance and impacts of climate change. In order to evaluate the success of the XGBoost algorithm, a comparison between predictions and observed values is recommended. The graph depicts a green line (1:1 line) representing a perfect prediction, which is an exact match between the true value and the predicted value [34]. The graph illustrates the distribution of actual values compared to predicted values. The blue line represents the curve of best fit for the predicted values, and its slope may vary depending on the distribution of the data. The accuracy of the model can be assessed by examining the proximity of the points to the green line. The blue line represents the curve of best fit for the predicted values, and its slope may vary depending on the distribution of the data.
Table 2 presents the ranking of feature importance and the contribution of climate variables to the model predicting the impact of climate change on organic honey production efficiency. The table ranks the features based on their importance in predicting organic honey yield. According to the machine learning model, the most significant attribute was 'Top solar radiation (Daytime)'. According to the model's ranking, it appears that the variable with the highest importance is the amount of sunlight received during the day. This variable seems to suggest that it plays a crucial role in honey production. It is possible that an increase in sunlight could lead to an increase in flowering and nectar production by plants, which in turn could provide a richer food source for honey bees. The model ranks 'Top thermal radiation (Daytime)' as the second most important attribute. It is worth noting that daytime thermal radiation, similar to solar radiation, can have an impact on the foraging activities of bees and plant growth, as well as indicating higher ambient temperatures. Additionally, the model highlights the significance of '2-meter temperature (Daytime)'. While it is true that higher temperatures during the day can be beneficial for bee activity and honey production up to a certain point, it is important to note that excessively high temperatures can have adverse effects. Therefore, it is crucial to maintain a balanced temperature for optimal bee activity and honey production.
After a thorough analysis of the feature importance table, it appears that the production of organic honey is largely influenced by the daily weather conditions. The top five factors are related to temperature and heat fluctuations throughout the day and night, with the most notable impact being observed in the amount of precipitation and humidity levels. Under normal conditions, temperature, precipitation, and humidity are traditionally considered important factors in honey production by bees [35,36]. A study conducted by Gajardo-Rojas et al. in Chile in 2022 revealed that changes in temperature and precipitation have significant effects on honey production [36]. Similarly, Landaverde et al. found that temperature, precipitation, and wind have negative effects on honey production in El Salvador [37]. However, it is worth noting that neither study specifies the degree of importance of each climatic variable on honey production efficiency. However, according to this machine learning analysis, wind effects have been found to be more significant than the amount of precipitation and humidity. Specifically, the efficiency of honey production is affected by the daytime U and V component winds after temperature. The U and V-wind components are two vectors that define the horizontal direction of the wind [38]. Wind speed and direction are determined by combining the U and V-components. The V-component represents the east-west wind direction, with positive values indicating wind blowing from the east and negative values indicating wind blowing from the west. The U component represents the north-south wind direction, with positive values indicating a northerly wind and negative values indicating a southerly wind. When examining Table 2 and Figure 3 in conjunction, it seems that the production of organic honey is influenced by winds blowing from the North and East. As a result, this affects the flight patterns of honey bees, which has an adverse effect on honey production.
Table 3 presents the sensitivity analysis values of the model variables. It demonstrates the impact of changes in each variable on the model's performance. Although the variables top solar radiation (Nighttime), 10-meter U/V winds (Nighttime/Daytime), and total precipitation (Night/Day) have relatively low importance scores in the feature importance table, their high sensitivity values indicate that the model's predictions are significantly affected by changes in these factors. It is worth noting that even slight fluctuations in nighttime solar radiation, wind speed, or precipitation can greatly affect the model's output. This highlights the possibility of non-linear correlations between these variables and honey production.
According to the feature importance table, the variables of temperature (Day/Night), thermal radiation (Day/Night), and surface pressure (Day/Night) are considered more significant and have moderate sensitivity values. According to the model, it appears that alterations in these factors may have a relatively minor effect on honey yield when compared to the variables that are ranked highest. According to the feature importance table, the variables of Temperature (Day/Night), Upper Thermal Radiation (Day/Night), and Surface Pressure (Day/Night) are considered more significant and have moderate sensitivity values. According to the model, it appears that alterations in these factors may have a relatively minor effect on honey yield when compared to the variables that are ranked highest.
The data from this machine learning model indicate that daytime solar radiation and temperature play a crucial role in organic honey production. It is well known that honey bees require sunlight and favorable temperatures for foraging and hive activities. The machine learning model seems to have produced successful results in terms of logic, given the vital importance of these needs. The analysis indicates that factors such as radiation, wind, and precipitation may have a role in honey yield through complex interactions with daytime conditions.
Furthermore, the machine learning model has identified non-linear relationships between independent variables. The varying rankings of variables in the Sensitivity Analysis and Feature Importance tables suggest that some variables may have non-linear relationships with honey yield. Investigating these relationships through visualisations or statistical tests may provide deeper insights.
The study also highlights the importance of evaluating the impact of climate change on biological mechanisms in organic honey production efficiency. Discovering the biological mechanisms behind how climate variables affect honey bee health, foraging behaviour, and plant nectar production may enable beekeeping enterprises to take stronger measures [39]. This could also enhance agricultural production from an ecological perspective.
The interaction between climate change and organic honey production efficiency may have significant consequences for the agricultural economy [37,40]. Based on the data from the machine learning model, it appears that daytime solar radiation and temperature have a substantial impact on honey production. This is due to increased plant diversity and nectar production, which enables bees to produce higher quantities of better-quality honey. The agricultural economy could potentially benefit from an increase in the quantity and quality of bee products, which may lead to an increase in market demand and income potential.
It is worth noting that the interaction between climate change and organic honey production efficiency may have a positive impact on both the quantity and quality of bee products. However, in order to promote the sustainability of agricultural production and optimize economic returns, it is important to develop agricultural policies and beekeeping strategies that take into account the complexity of this interaction and the interrelationships of various climatic factors. However, in order to promote the sustainability of agricultural production and optimize economic returns, it is important to develop agricultural policies and beekeeping strategies that take into account the complexity of this interaction and the interrelationships of various climatic factors. Therefore, it is necessary to implement climate change adaptation and mitigation strategies.
4. Conclusions
The study utilized the XGBoost machine learning model to examine the impact of climate change on organic honey production in Türkiye. The results suggest that climate change has a notable and varied impact on organic honey production. The XGBoost model effectively anticipated the effects of climate change on organic honey production. Furthermore, the model's accuracy and predictive ability were confirmed by low RMSE and MAE values, as well as high R2 coefficients. The study has found that machine learning techniques can effectively aid in understanding the impacts of climate change on the agricultural sector. It was observed that the order of temperature, precipitation, and humidity change - the main climatic factors affecting honey production - has been disrupted in both organic and conventional honey production. According to recent research, it has been discovered that wind is the second most influential factor on honey production, following temperature and heat changes. The study also found that winds blowing from the North and East have a greater impact on honey production than precipitation and humidity, both during the daytime and at nighttime. This information is of great importance to the agricultural economy, as climate change can directly affect the quantity and quality of honey production. Organic honey producers in Türkiye may consider positioning their hives and bees in higher areas and away from regions that receive north and/or east winds, as this could potentially improve their production efficiency and contribute to the quality of the honey produced.
References
- Organic beekeeping situation in turkey, Available online: https://ispecjournal.com/index.php/ispecjas/article/view/70/88 (accessed on 14 March 2024).
- Özkirim, A. Beekeeping in Turkey: Bridging Asia and Europe. Asian Beekeeping in the 21st Century 2018, 41–69. [Google Scholar] [CrossRef]
- Stevanovi´c, S.; Michalczyk, M.; Oztokmak, A.; Ozmen Ozbakir, G.; Çaglar, O. Conservation of Local Honeybees (Apis Mellifera L.) in Southeastern Turkey: A Preliminary Study for Morphological Characterization and Determination of Colony Performance. Animals 2023, Vol. 13, Page 2194 2023, 13, 2194. [Google Scholar] [CrossRef]
- Aleskerova, Y.; Todosiichuk, V. Analysis of Economic Aspects of Organic Beekeeping Production. Green, Blue and Digital Economy Journal 2021, 2, 1–9. [Google Scholar] [CrossRef]
- Erdal Ertürk, Y.; Yılmaz, O. Türkiye’de Organik Arıcılık. COMU Journal of Agriculture Faculty 2013, 35–42. [Google Scholar]
- Smith, D.R. Genetic Diversity in Turkish Honey Bees. Uludağ Arıcılık Dergisi 2002, 02, 10–17. [Google Scholar]
- Cakirli Akyüz, N.; Theuvsen, L. Organic Agriculture in Turkey: Status, Achievements, and Shortcomings. Organic Agriculture 2021, 11, 501–517. [Google Scholar] [CrossRef]
- Terin, M.; Yildirim, İ.; Aksoy, A.; Sari, M.M. Agricultural Academy. Bulgarian Journal of Agricultural Science 2018, 24, 17–22. [Google Scholar]
- Pignagnoli, A.; Pignedoli, S.; Carpana, E.; Costa, C.; Dal Prà, A. Greenhouse Gas (GHG) Emissions from Honey Production: Two-Year Survey in Italian Beekeeping Farms. Animals 2023, 13, 766. [Google Scholar] [CrossRef]
- Barahona, N.A.; Vergara, P.M.; Alaniz, A.J.; Carvajal, M.A.; Castro, S.A.; Quiroz, M.; Hidalgo-Corrotea, C.M.; Fierro, A. Understanding How Environmental Degradation, Microclimate, and Management Shape Honey Production across Different Spatial Scales. Environ Sci Pollut Res Int 2024, 31, 12257–12270. [Google Scholar] [CrossRef]
- Mateo, F.; Tarazona, A.; Mateo, E.M. Comparative Study of Several Machine Learning Algorithms for Classification of Unifloral Honeys. Foods 2021, 10. [Google Scholar] [CrossRef]
- Williams, W.L.; Zeng, L.; Gensch, T.; Sigman, M.S.; Doyle, A.G.; Anslyn, E. V. The Evolution of Data-Driven Modeling in Organic Chemistry. ACS Cent Sci 2021, 7, 1622–1637. [Google Scholar] [CrossRef]
- Davatzikos, C.; Ruparel, K.; Fan, Y.; Shen, D.G.; Acharyya, M.; Loughead, J.W.; Gur, R.C.; Langleben, D.D. Classifying Spatial Patterns of Brain Activity with Machine Learning Methods: Application to Lie Detection. Neuroimage 2005, 28, 663–668. [Google Scholar] [CrossRef]
- Li, L.; Rong, S.; Wang, R.; Yu, S. Recent Advances in Artificial Intelligence and Machine Learning for Nonlinear Relationship Analysis and Process Control in Drinking Water Treatment: A Review. Chemical Engineering Journal 2021, 405, 126673. [Google Scholar] [CrossRef]
- Tırınk, S.; Öztürk, B. Evaluation of PM10 Concentration by Using Mars and XGBOOST Algorithms in Iğdır Province of Türkiye. International Journal of Environmental Science and Technology 2023, 20, 5349–5358. [Google Scholar] [CrossRef]
- Gahegan, M. On the Application of Inductive Machine Learning Tools to Geographical Analysis. Geogr Anal 2000, 32, 113–139. [Google Scholar] [CrossRef]
- TÜİK - Veri Portalı . Available online: https://data.tuik.gov.tr/Kategori/GetKategori?p=Tarim-111 (accessed on 6 March 2024).
- Physical Location Map of Turkey, within the Entire Continent . Available online: http://www.maphill.com/turkey/location-maps/physical-map/entire-continent/ (accessed on 26 March 2024).
- Lionello, P.; Abrantes, F.; Gacic, M.; Planton, S.; Trigo, R.; Ulbrich, U. The Climate of the Mediterranean Region: Research Progress and Climate Change Impacts. Reg Environ Change 2014, 14, 1679–1684. [Google Scholar] [CrossRef]
- Varol, T.; Ertuğrul, M.; Varol, T. Climate Change and Forest Fire Trend in the Aegean and Mediterranean Regions of Turkey.
- Bär, R.; Rouholahnedjad, E.; Rahman, K.; Abbaspour, K.C.; Lehmann, A. Climate Change and Agricultural Water Resources: A Vulnerability Assessment of the Black Sea Catchment. Environ Sci Policy 2015, 46, 57–69. [Google Scholar] [CrossRef]
- Doĝan, U. Fluvial Response to Climate Change during and after the Last Glacial Maximum in Central Anatolia, Turkey. Quaternary International 2010, 222, 221–229. [Google Scholar] [CrossRef]
- Bakirci, K.; Kirtiloglu, Y. Effect of Climate Change to Solar Energy Potential: A Case Study in the Eastern Anatolia Region of Turkey. Environmental Science and Pollution Research 2022, 29, 2839–2852. [Google Scholar] [CrossRef]
- Tayanç, M.; İm, U.; Doğruel, M.; Karaca, M. Climate Change in Turkey for the Last Half Century. Clim Change 2009, 94, 483–502. [Google Scholar] [CrossRef]
- Copernicus . Available online: https://climate.copernicus.eu/ (accessed on 3 April 2024).
- Gono, D.N.; Napitupulu, H. ; Firdaniza Silver Price Forecasting Using Extreme Gradient Boosting (XGBoost) Method. Mathematics 2023, Vol. 11, Page 3813 2023, 11, 3813. [Google Scholar] [CrossRef]
- Cordoni, F.G.; Missiaggia, M.; Scifoni, E.; -, al; Yao, X. ; Shen, C.; Xu -, S.; Wang, Z.; Liu, X.; Ji, Z.; et al. Extreme Gradient Boosting (XGBoost) Method in Making Forecasting Application and Analysis of USD Exchange Rates against Rupiah. J Phys Conf Ser 2021, 1722, 012016. [Google Scholar] [CrossRef]
- Sun, J.; Dang, W.; Wang, F.; Nie, H.; Wei, X.; Li, P.; Zhang, S.; Feng, Y.; Li, F. Prediction of TOC Content in Organic-Rich Shale Using Machine Learning Algorithms: Comparative Study of Random Forest, Support Vector Machine, and XGBoost. Energies (Basel) 2023, 16, 4159. [Google Scholar] [CrossRef]
- Ramdani, F.; Furqon, M.T. The Simplicity of XGBoost Algorithm versus the Complexity of Random Forest, Support Vector Machine, and Neural Networks Algorithms in Urban Forest Classification. F1000Research 2022 11:1069 2022, 11, 1069. [Google Scholar] [CrossRef]
- Huang, J.C.; Tsai, Y.C.; Wu, P.Y.; Lien, Y.H.; Chien, C.Y.; Kuo, C.F.; Hung, J.F.; Chen, S.C.; Kuo, C.H. Predictive Modeling of Blood Pressure during Hemodialysis: A Comparison of Linear Model, Random Forest, Support Vector Regression, XGBoost, LASSO Regression and Ensemble Method. Comput Methods Programs Biomed 2020, 195, 105536. [Google Scholar] [CrossRef] [PubMed]
- Pesantez-Narvaez, J.; Guillen, M.; Alcañiz, M. Predicting Motor Insurance Claims Using Telematics Data—XGBoost versus Logistic Regression. Risks 2019, Vol. 7, Page 70 2019, 7, 70. [Google Scholar] [CrossRef]
- Okudum, R.; Şeremet, M.; Alaeddinoğlu, F. Organik Tarım Üzerinde Konvansiyonelleşme ve Kırsal Kalkınma Tartışmaları. Türk Coğrafya Dergisi. [CrossRef]
- Bischl, B.; Binder, M.; Lang, M.; Pielok, T.; Richter, J.; Coors, S.; Thomas, J.; Ullmann, T.; Becker, M.; Boulesteix, A.L.; et al. Hyperparameter Optimization: Foundations, Algorithms, Best Practices, and Open Challenges. Wiley Interdiscip Rev Data Min Knowl Discov 2023, 13, e1484. [Google Scholar] [CrossRef]
- Ma, J.; Yu, Z.; Qu, Y.; Xu, J.; Cao, Y. Application of the XGBoost Machine Learning Method in PM2.5 Prediction: A Case Study of Shanghai. Aerosol Air Qual Res 2020, 20, 128–138. [Google Scholar] [CrossRef]
- Vercelli, M.; Novelli, S.; Ferrazzi, P.; Lentini, G.; Ferracini, C. A Qualitative Analysis of Beekeepers’ Perceptions and Farm Management Adaptations to the Impact of Climate Change on Honey Bees. Insects 2021, Vol. 12, Page 228 2021, 12, 228. [Google Scholar] [CrossRef]
- Gajardo-Rojas, M.; Muñoz, A.A.; Barichivich, J.; Klock-Barría, K.; Gayo, E.M.; Fontúrbel, F.E.; Olea, M.; Lucas, C.M.; Veas, C. Declining Honey Production and Beekeeper Adaptation to Climate Change in Chile. https://doi.org/10.1177/03091333221093757, 2022; 46, 737–756. [Google Scholar] [CrossRef]
- Landaverde, R.; Rodriguez, M.T.; Parrella, J.A. Honey Production and Climate Change: Beekeepers’ Perceptions, Farm Adaptation Strategies, and Information Needs. Insects 2023, 14, 493. [Google Scholar] [CrossRef]
- Bowen, A.J.; Flay, R.G.J.; Panofsky, H.A. Vertical Coherence and Phase Delay between Wind Components in Strong Winds below 20 m. Boundary Layer Meteorol 1983, 26, 313–324. [Google Scholar] [CrossRef]
- Lemi, T. Effects of Climate Change Variability on Agricultural Productivity. International Journal of Environmental Sciences & Natural Resources 2019, 17. [Google Scholar] [CrossRef]
- Le Conte, Y.; Navajas, M. Climate Change: Impact on Honey Bee Populations and Diseases. Rev. sci. tech. Off. int. Epiz 2008, 27, 499–510. [Google Scholar]
Figure 1.
Geographical location of Türkiye [18].
Figure 1.
Geographical location of Türkiye [18].
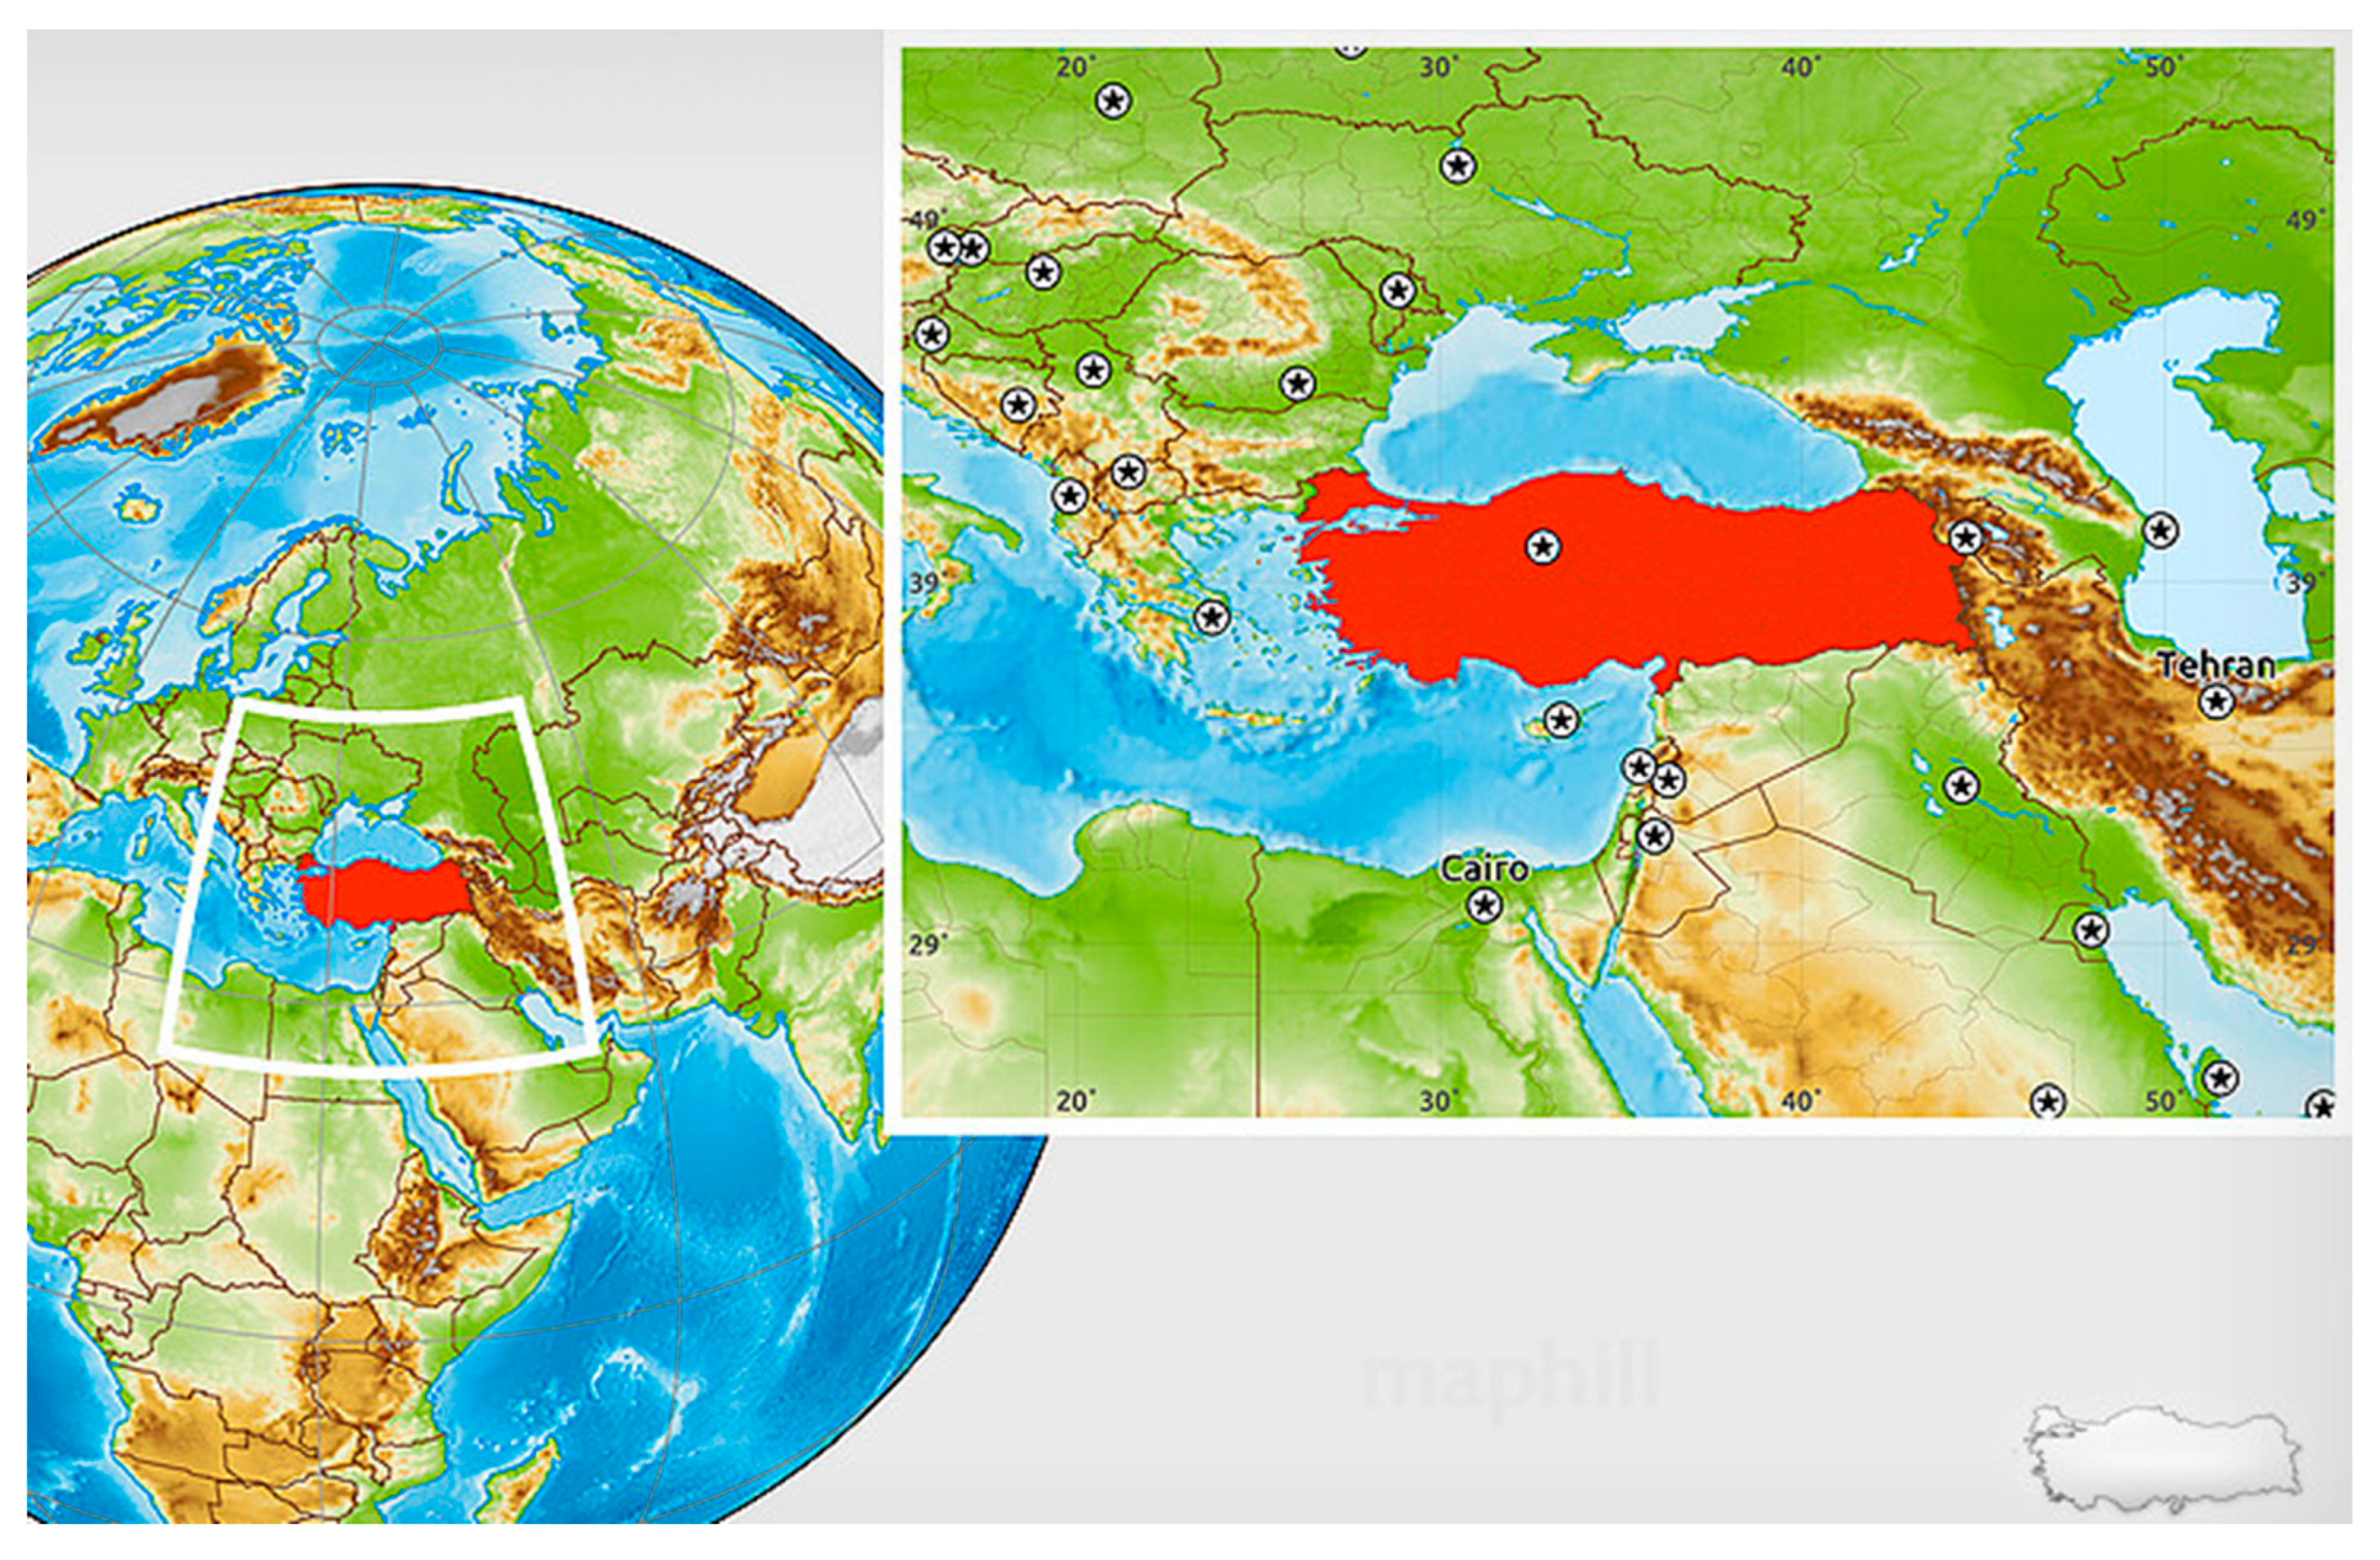
Figure 2.
XGBoost algorithm for organic honey.
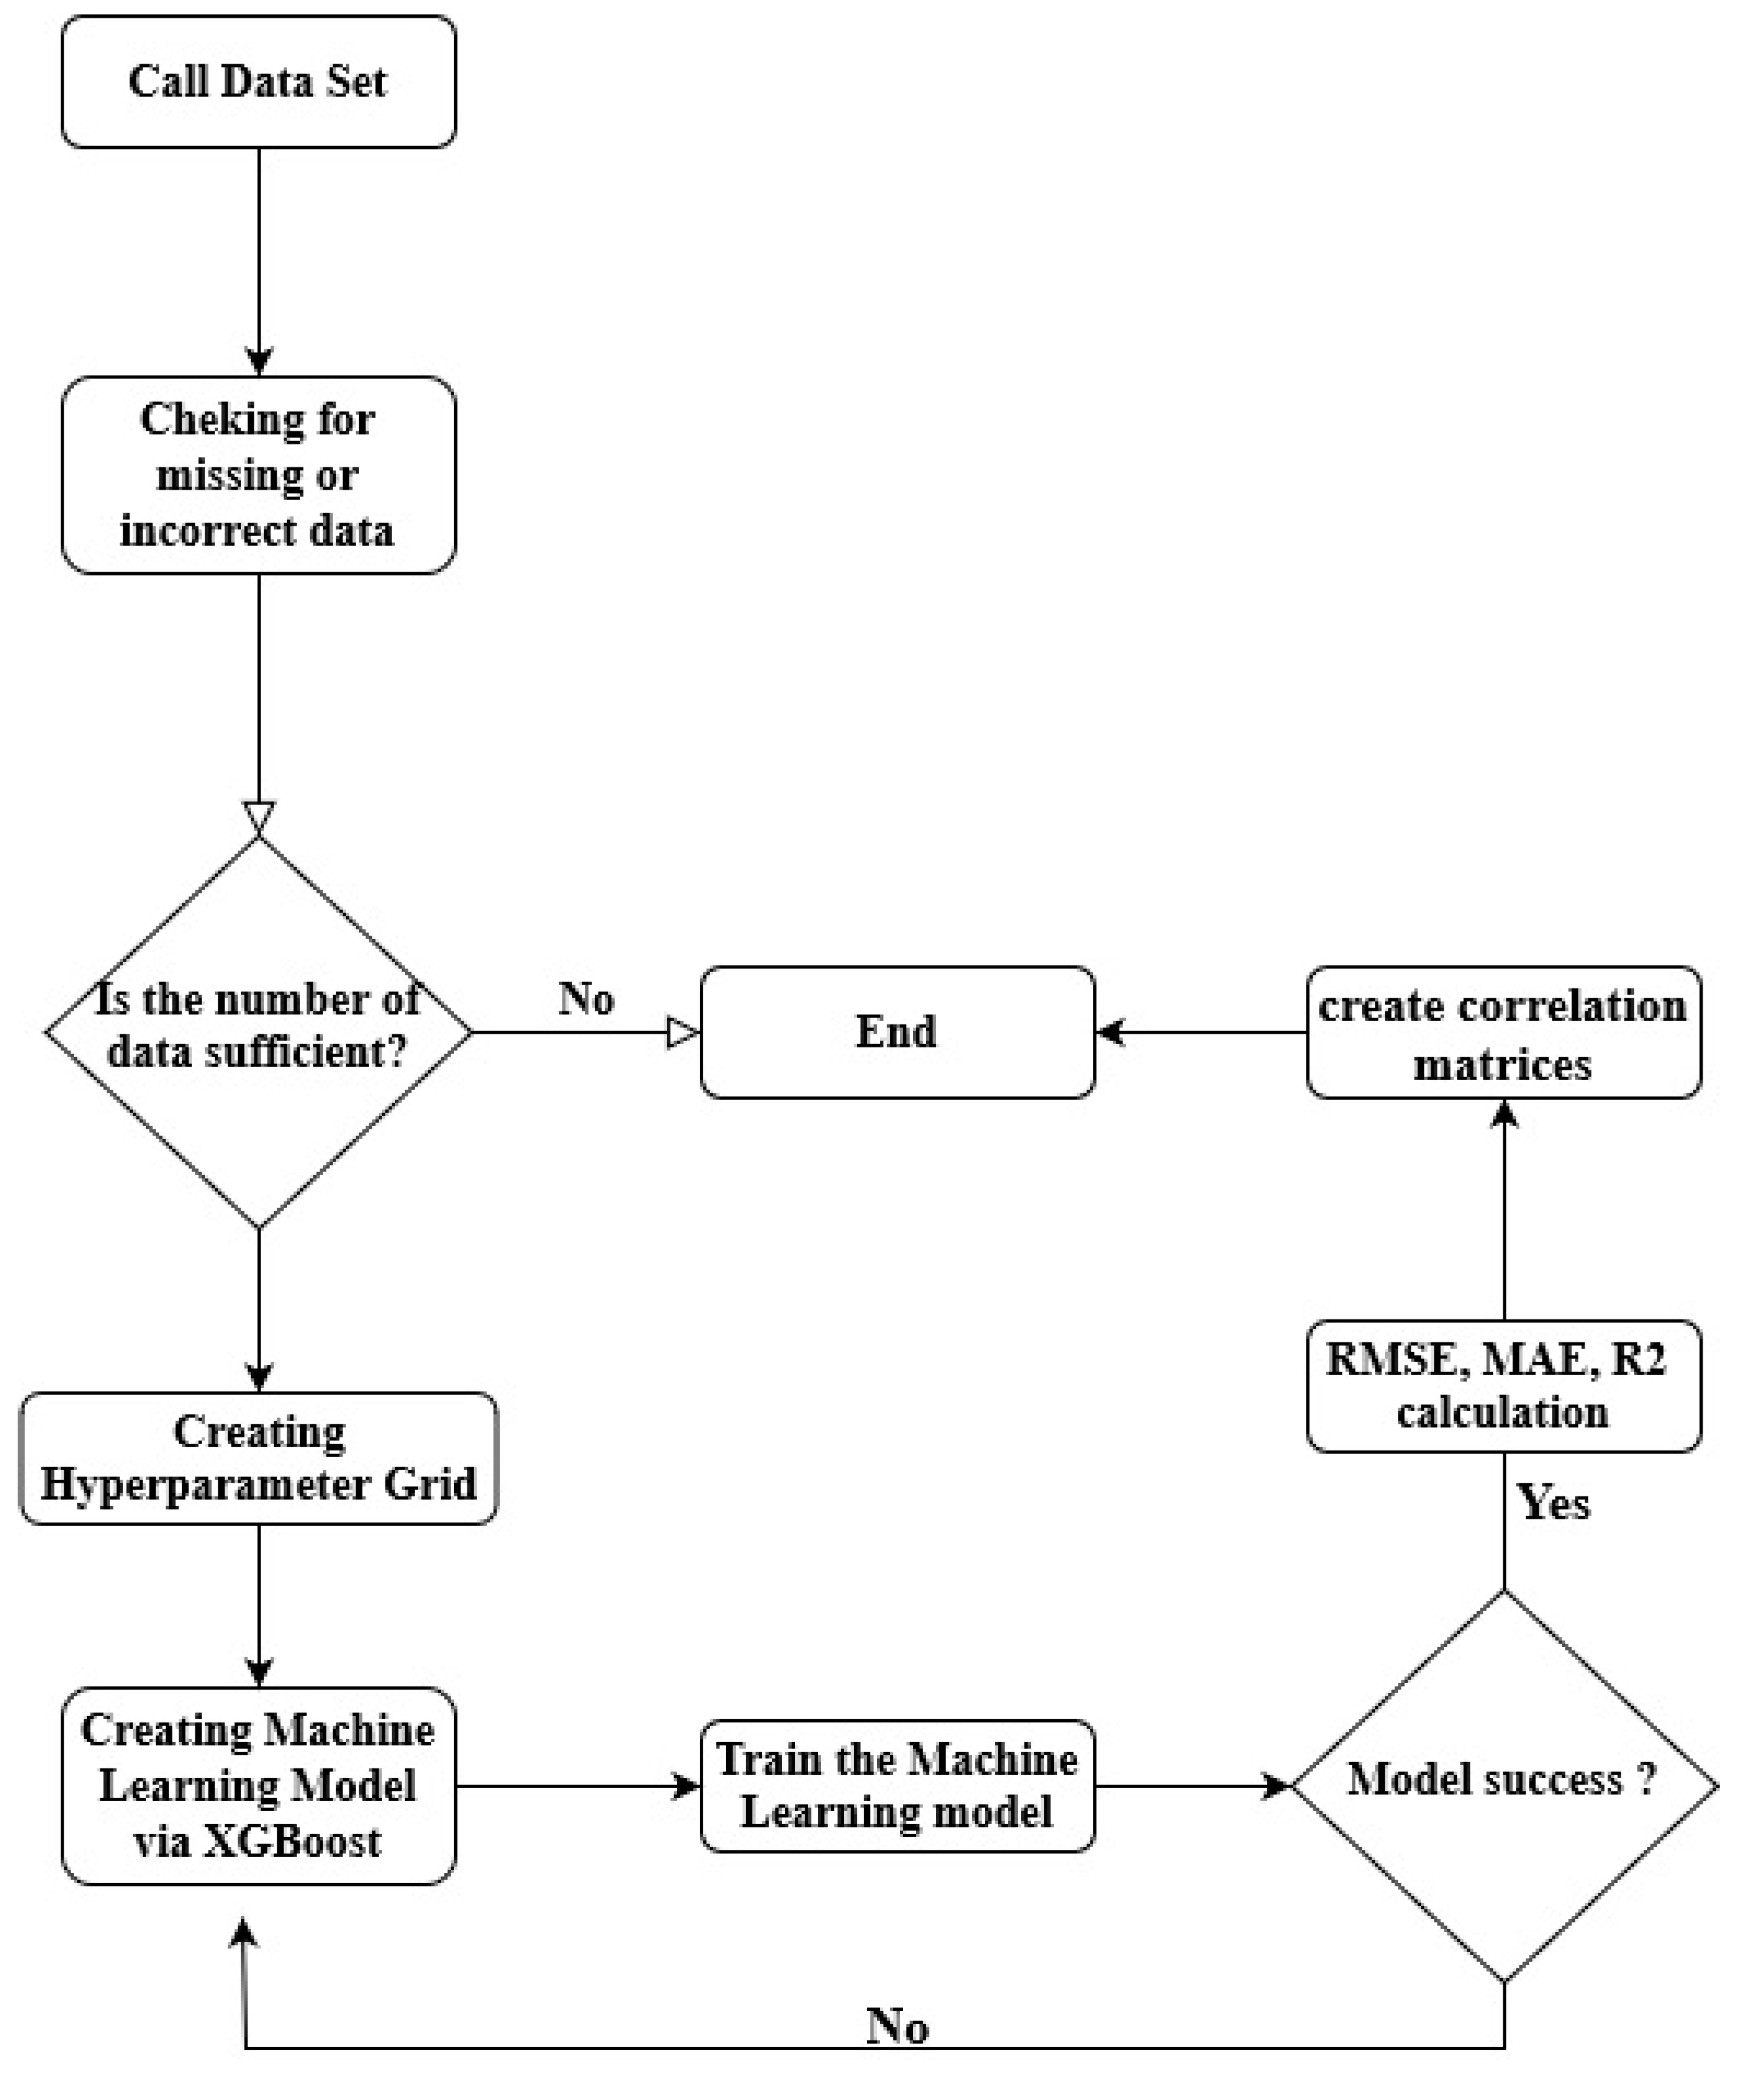
Figure 3.
Türkiye's organic honey production performance.
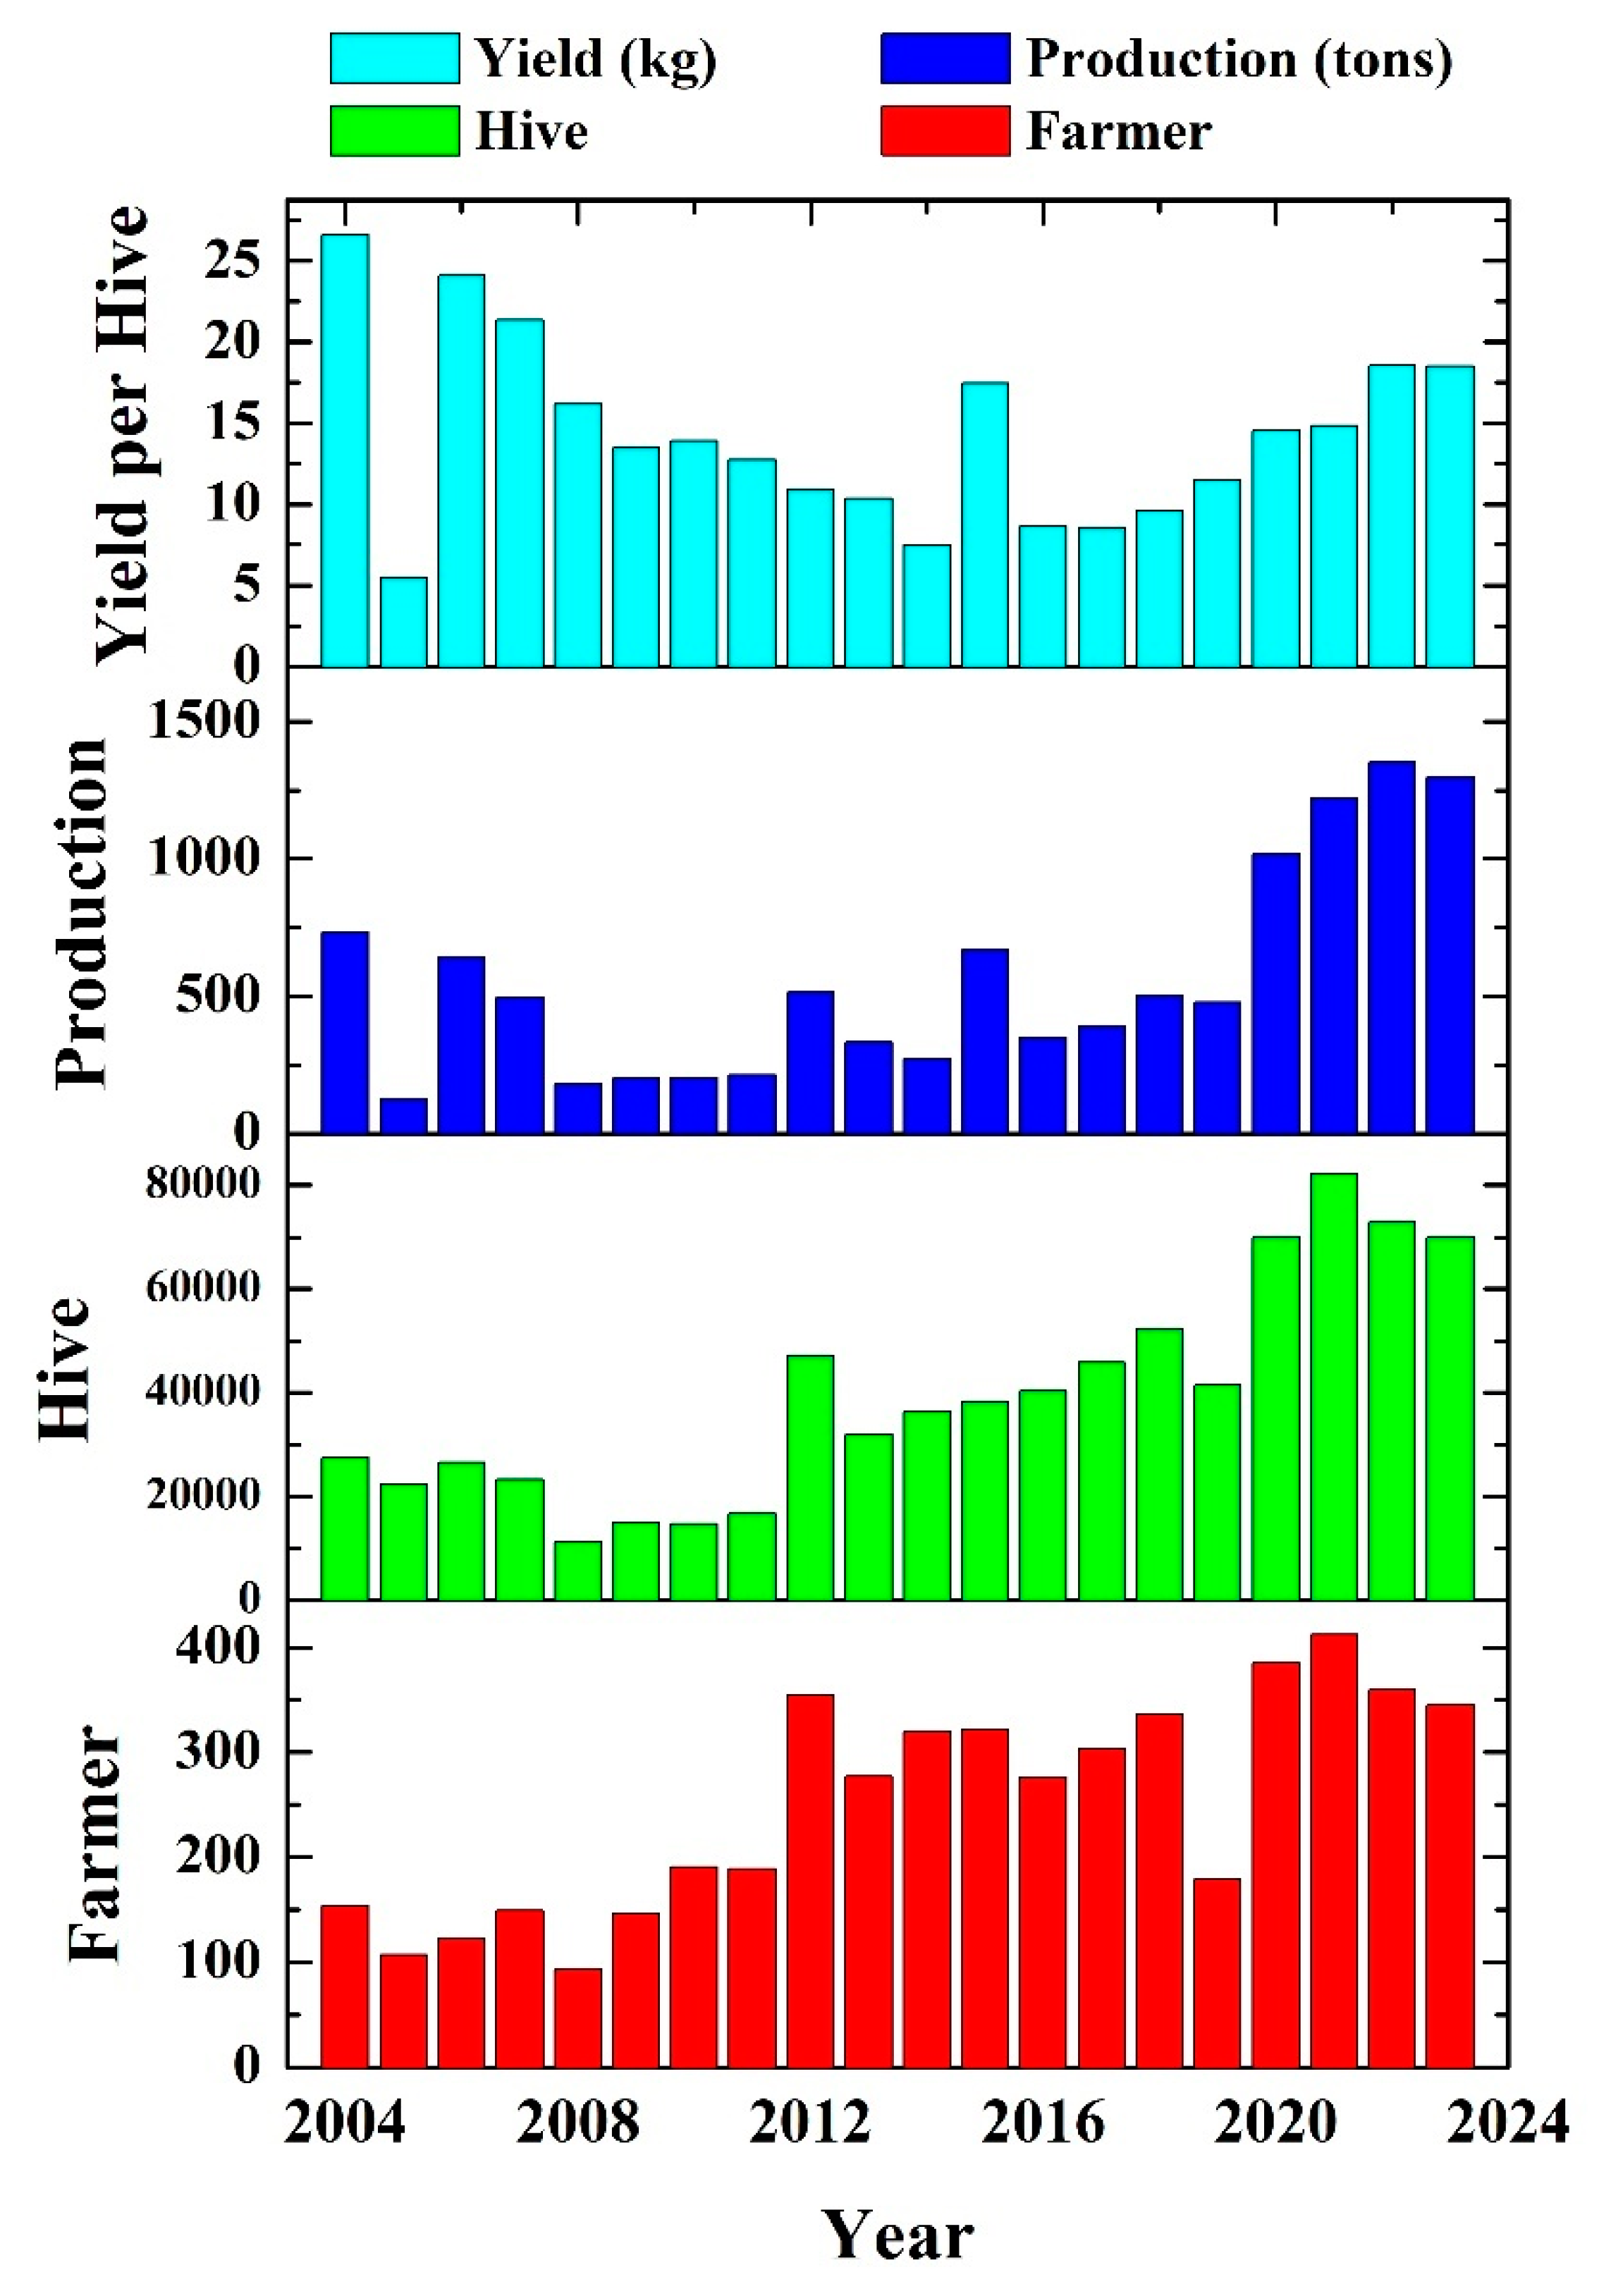
Figure 4.
Daytime and Nighttime climate variables last 20 years. (C1: 10-meter U wind component [m/s]; C2: 10-meter V wind component [m/s]; C3: 2-meter temperature [C]; C4: Total precipitation [m]; C5: Humidity [kg.s/m2]; C6: Surface pressure [Pa]; C7: Top solar radiation [W.s/m2]; C8: Top thermal radiation [W.s/m2]).
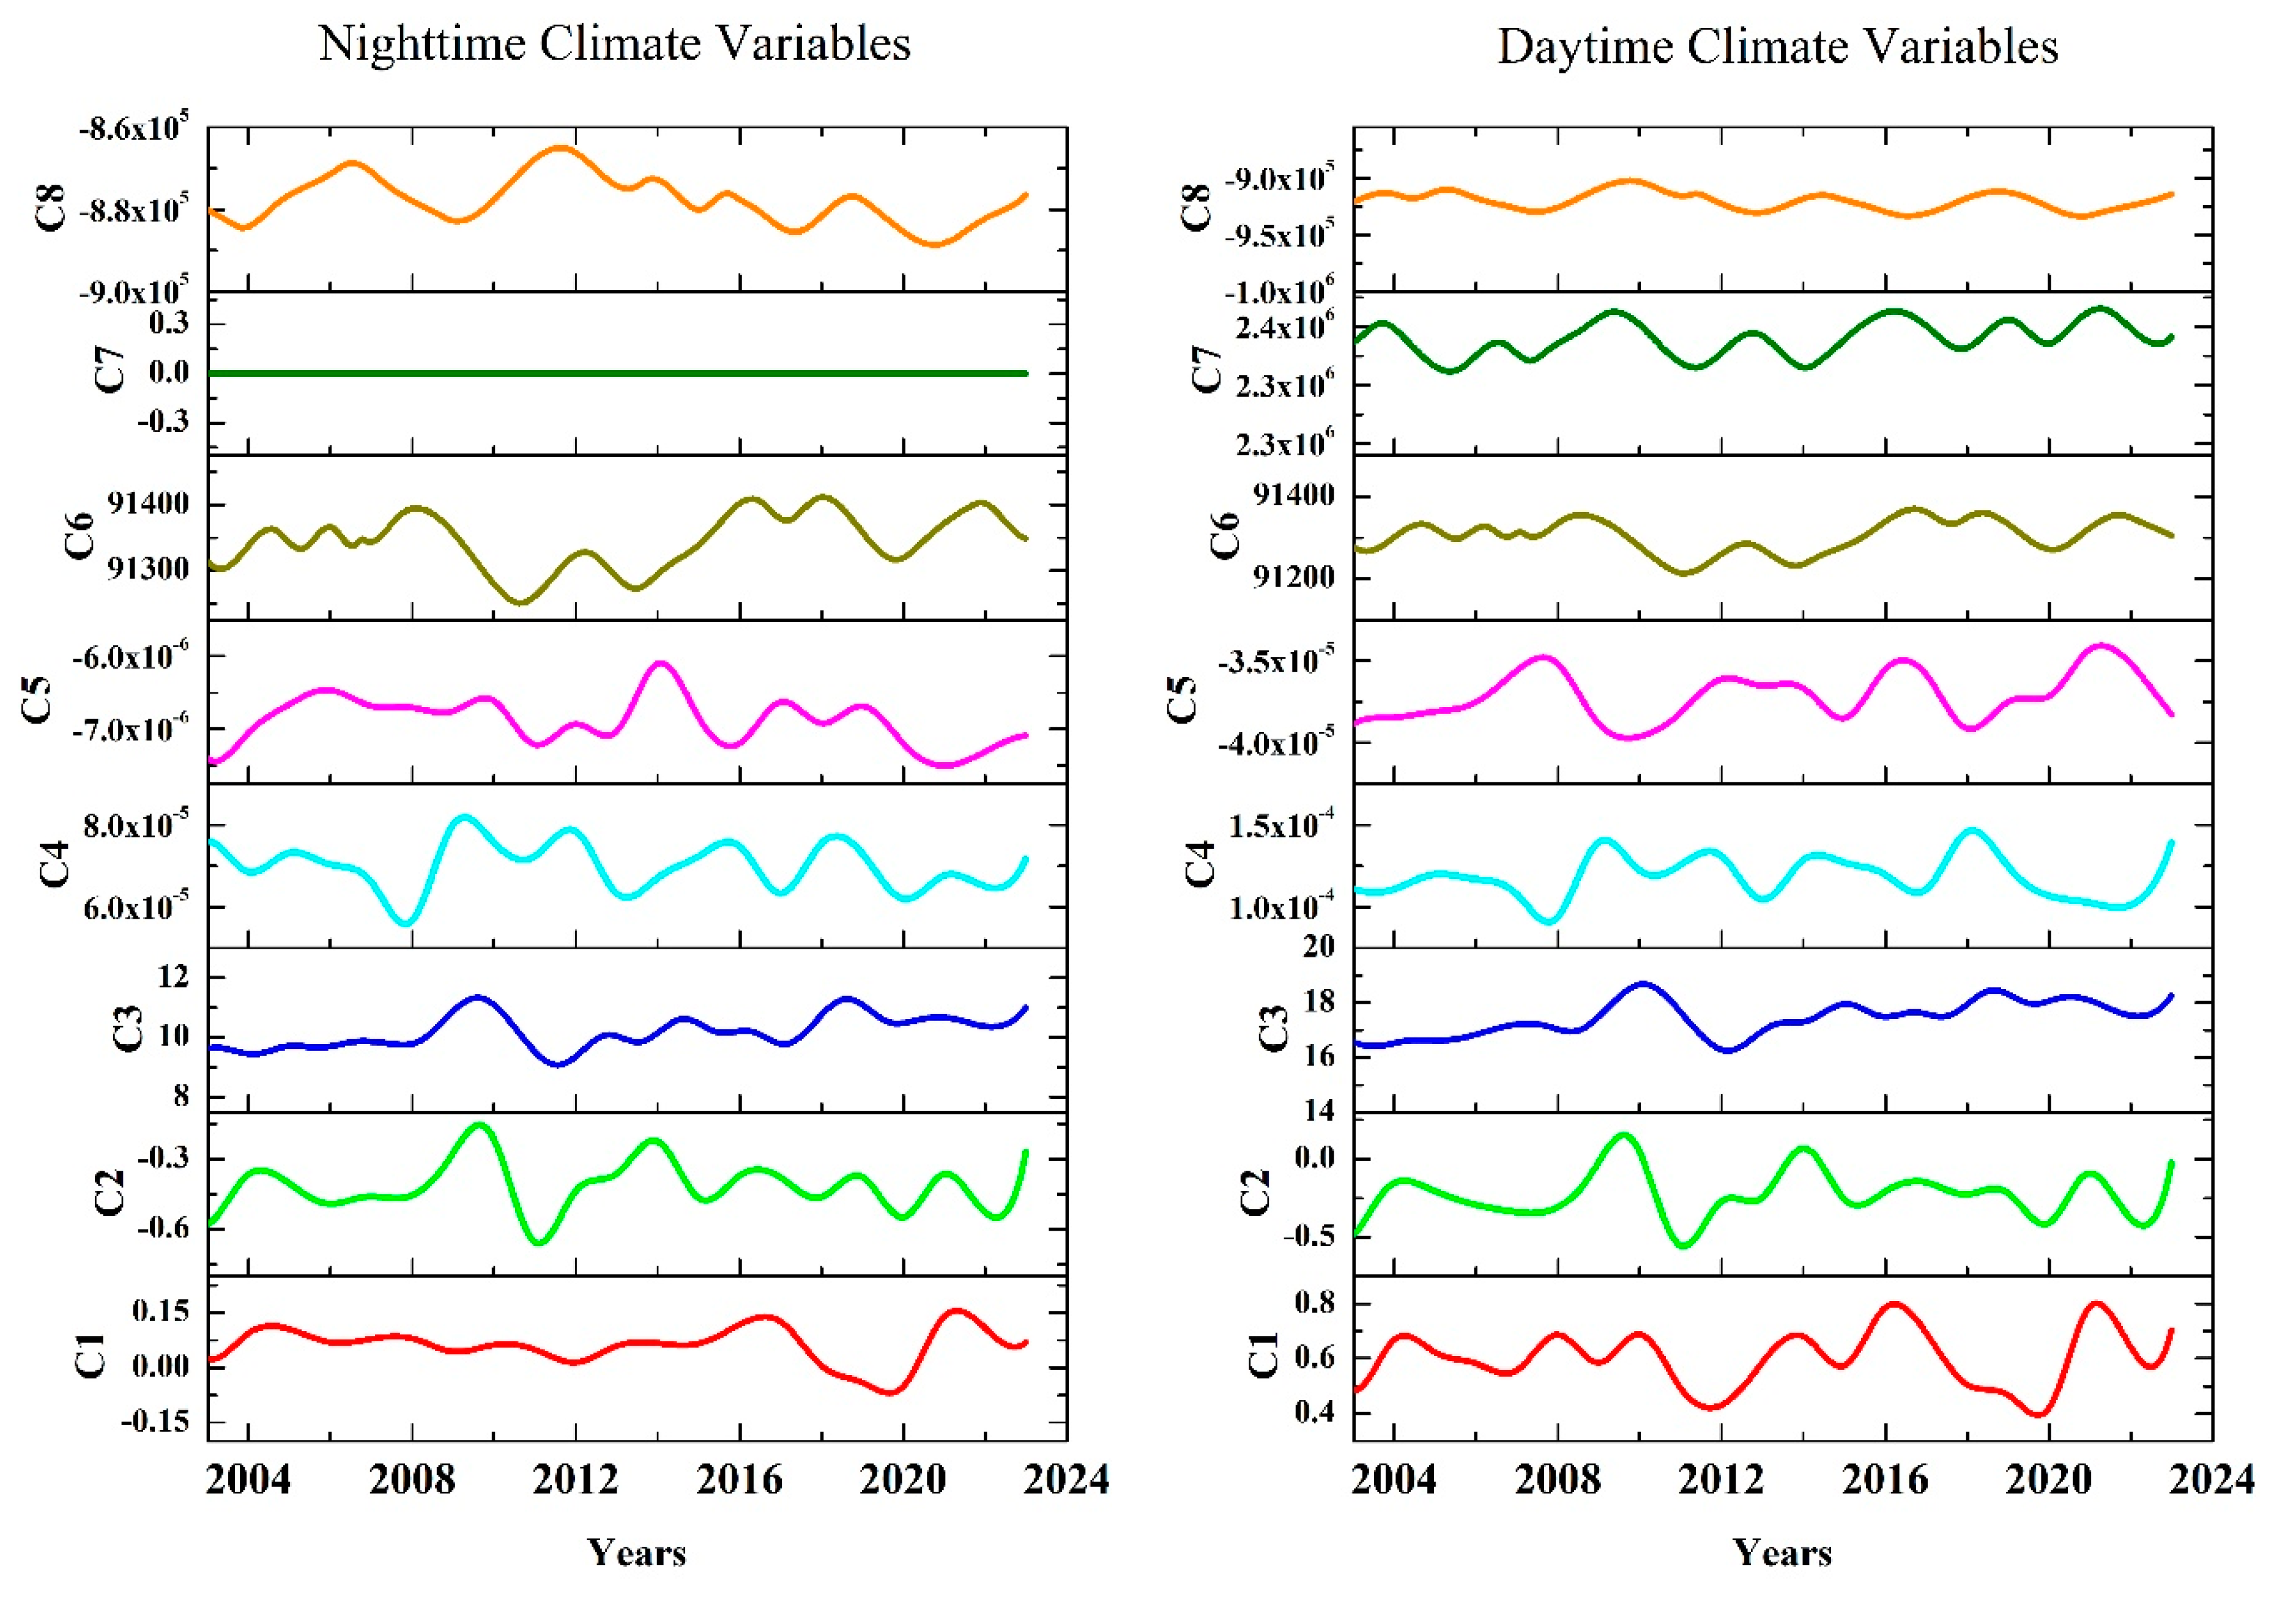
Figure 5.
Model success performance according to prediction values.
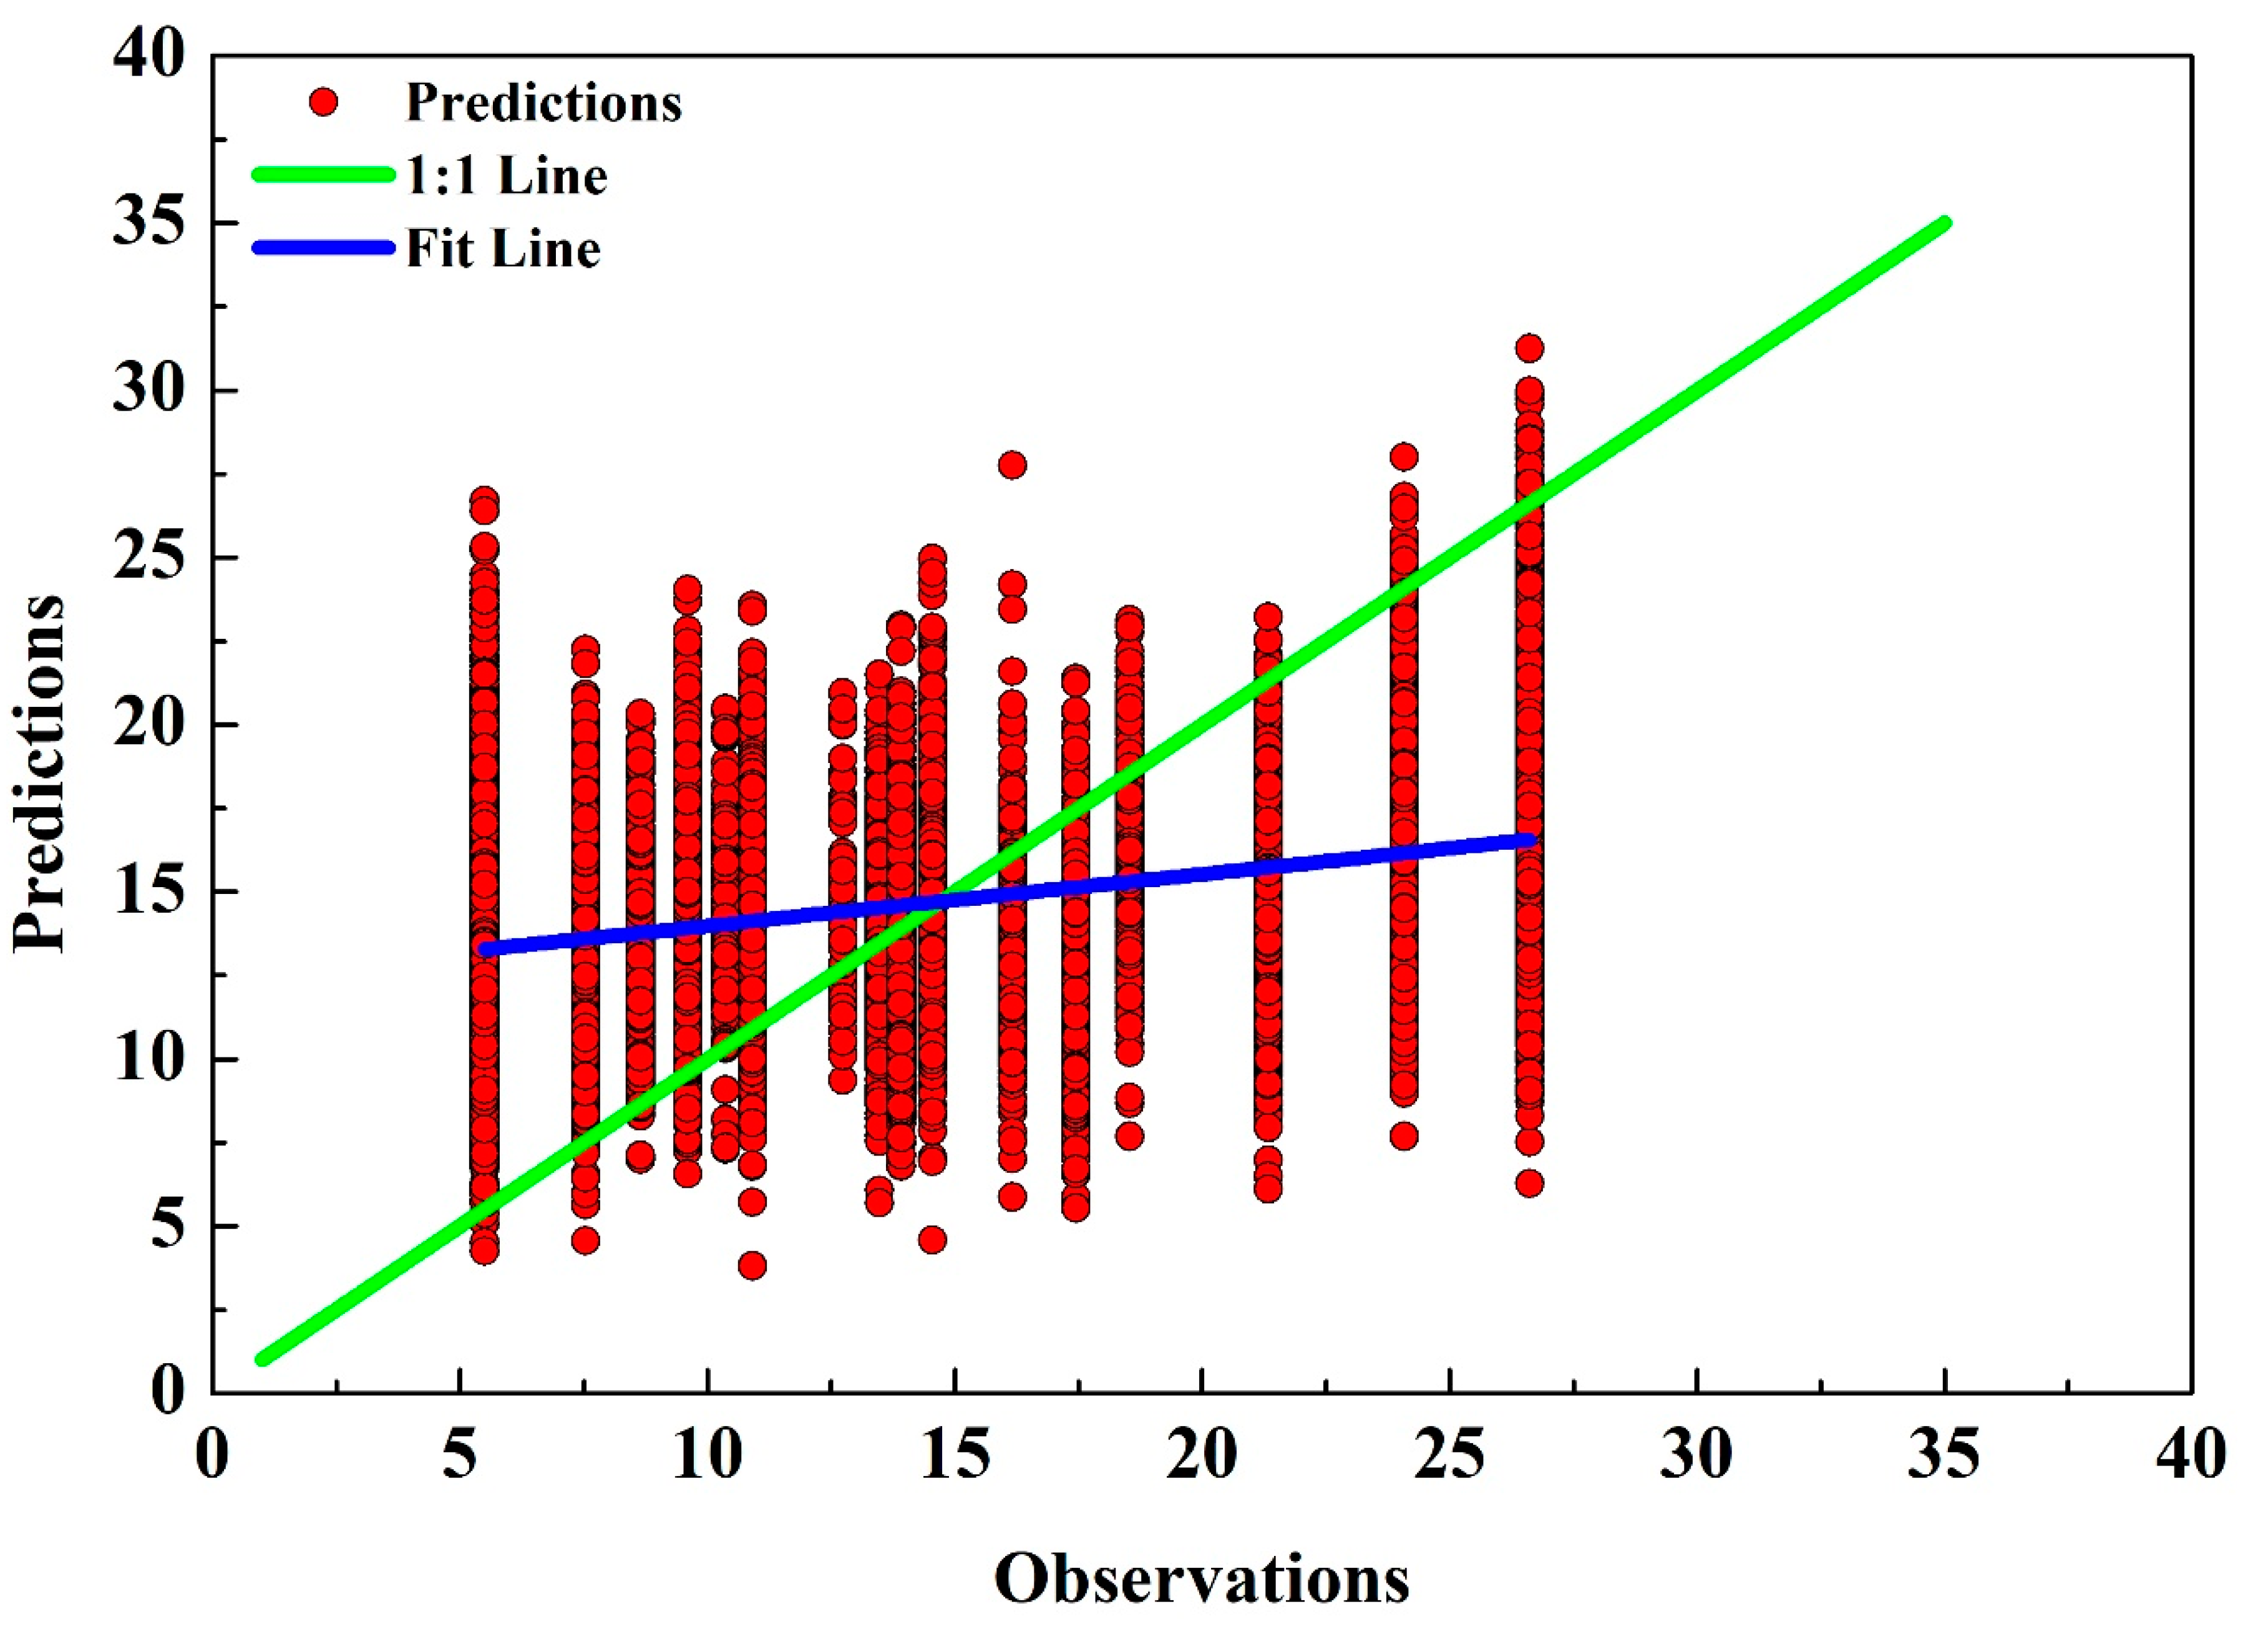

Table 1.
Best hyperparameter settings for the XGBoost model applied in organic honey yield.
| Hyperparameters | Values |
|---|---|
| nrounds | 500 |
| max_depth | 9 |
| eta | 0.3 |
| gamma | 0 |
| colsample_bytree | 0.9 |
| min_child_weight | 3 |
| subsample | 0.9 |
| Performance Parameters | Values |
| RMSE | 1.38317 |
| MAE | 1.03812 |
| R2 | 0.78493 |
Table 2.
Feature importance for organic honey yield.
| Importance Level | Feature | Gain | Cover | Frequency |
|---|---|---|---|---|
| 1 | Top solar radiation (Daytime) | 0.09059515 | 0.08744304 | 0.07077136 |
| 2 | Top thermal radiation (Daytime) | 0.08399873 | 0.08117384 | 0.06785828 |
| 3 | 2-meter temperature (Daytime) | 0.08203138 | 0.09039404 | 0.06629731 |
| 4 | Top thermal radiation (Nighttime) | 0.08199702 | 0.09630029 | 0.06948521 |
| 5 | 2-meter temperature (Nighttime) | 0.07341991 | 0.08106766 | 0.07414614 |
| 6 | 10-meter U-wind (Daytime) | 0.07337569 | 0.07362262 | 0.07587200 |
| 7 | 10-meter V-wind (Daytime) | 0.06866239 | 0.06897497 | 0.07506953 |
| 8 | 10-meter V-wind (Nighttime) | 0.06601100 | 0.07524847 | 0.07822445 |
| 9 | Humidity (Daytime) | 0.06586092 | 0.05029741 | 0.06457145 |
| 10 | Surface pressure (Nighttime) | 0.05971670 | 0.04765959 | 0.06813310 |
| 11 | Humidity (Nighttime) | 0.05883414 | 0.04883785 | 0.06471435 |
| 12 | Total precipitation (Nighttime) | 0.05749842 | 0.03658732 | 0.06279062 |
| 13 | 10-meter U-wind (Nighttime) | 0.05693347 | 0.07092535 | 0.07497059 |
| 14 | Total precipitation (Daytime) | 0.05668634 | 0.04762505 | 0.06436259 |
| 15 | Surface pressure (Daytime) | 0.02437875 | 0.04384252 | 0.02273302 |
| 16 | Top solar radiation (Nighttime) | 0 | 0 | 0 |
Table 3.
Sensistivity analyses of ML model for climate variables.
| Variable | Mean dropout loss | ||
|---|---|---|---|
| Importance Level | Sensitivity Level | Full Model | 1.383171 |
| 16 | 16 | Top solar radiation (Nighttime) | 1.383171 |
| 13 | 15 | 10-meter U-wind (Nighttime) | 2.54861 |
| 8 | 14 | 10-meter V-wind (Nighttime) | 2.676877 |
| 7 | 13 | 10-meter V-wind (Daytime) | 2.800314 |
| 12 | 12 | Total precipitation (Nighttime) | 2.830632 |
| 6 | 11 | 10-meter U-wind (Daytime) | 2.848633 |
| 11 | 10 | Humidity (Nighttime) | 2.855943 |
| 9 | 9 | Humidity (Daytime) | 2.989901 |
| 14 | 8 | Total precipitation (Daytime) | 3.025835 |
| 15 | 7 | Surface pressure (Daytime) | 3.316515 |
| 10 | 6 | Surface pressure (Nighttime) | 3.481531 |
| 5 | 5 | 2-meter temperature (Nighttime) | 4.385817 |
| 2 | 4 | Top thermal radiation (Daytime) | 4.689841 |
| 3 | 3 | 2-meter temperature (Daytime) | 5.135982 |
| 1 | 2 | Top solar radiation (Daytime) | 5.470182 |
| 4 | 1 | Top thermal radiation (Nighttime) | 6.179276 |
| Base line | 6.972226 |
Disclaimer/Publisher’s Note: The statements, opinions and data contained in all publications are solely those of the individual author(s) and contributor(s) and not of MDPI and/or the editor(s). MDPI and/or the editor(s) disclaim responsibility for any injury to people or property resulting from any ideas, methods, instructions or products referred to in the content. |
© 2024 by the authors. Licensee MDPI, Basel, Switzerland. This article is an open access article distributed under the terms and conditions of the Creative Commons Attribution (CC BY) license (http://creativecommons.org/licenses/by/4.0/).
Copyright: This open access article is published under a Creative Commons CC BY 4.0 license, which permit the free download, distribution, and reuse, provided that the author and preprint are cited in any reuse.


