
Submitted:
27 March 2024
Posted:
28 March 2024
You are already at the latest version
Preprints on COVID-19 and SARS-CoV-2
Abstract
The rapid development of new retail and the impact of COVID-19 have catalyzed the blowout growth of community group purchasing. The emergence of community group purchasing collection and delivery points (CGPCDPs) has become a new way to solve the "last mile" problem of new retail delivery. Based on the point of interest (POI) data of CGPCDPs of Nansha District, Guangzhou City, this study uses text analysis, spatial analysis, model analysis, and other methods to analyze the operation mode, spatial distribution, and influencing factors of CGPCDPs. The conclusions are as follows: CGPCDPs initiators are mainly shopkeepers. They depend mainly on wholesale and retail shops. Service targets are mainly urban and rural communities, followed by industrial areas. The distribution of CGPCDPs has apparent spatial differentiation. At the macro scale, it shows the characteristics of "central agglomeration and peripheral dispersion". It is distributed along the "northwest-southeast" direction and presents a "dual-core multi-center" pattern. At meso-micro scale, different built environments in developed areas of cities, villages in the city (ChengZhongCun) and rural areas show distinct distribution patterns. The MGWR regression model has a better fitting effect than OLS and GWR. The main influencing factors are population density, construction land, house price, supporting place, residence density, urban community, and road proximity.
Keywords:
Community group purchasing collection and delivery points
; Location selection
; Mixed geographically weighted regression
; Influence mechanism
; Nansha District
1. Introduction
In the background of e-commerce, traditional retail has gradually declined due to the impact of the e-commerce internet. New retail integrating online services, offline experience and modern logistics has developed rapidly since its introduction. Community group purchasing is one of popular new retail types which serves the community and focuses on the fresh food market. Due to the increasing demand for fresh product in China, much capitals and enterprises have entered this enormous community fresh market with new community group purchasing brands since 2016. In addition, with the outbreak of COVID-19 in 2020, the implementation of the ban policy and restrictions on residents’ travel, people’s demand for online shopping has increased, so the large-scale popularization of community-based services including community group purchasing has been promoted. With major Internet giants such as Didi, Meituan, and Pinduoduo joining, community group purchasing has become competitive.
Community group purchasing is a retail model that relies on small community areas to sell and deliver the large sale of fresh goods through the social relationships of acquaintances and semi-acquaintances (Zhang, 2019). It originated in the second and third-tier cities, with a prominent expansion from rural areas to urban areas (Xin, 2020). Community group purchasing mainly adopts the “pre-sale + self-pickup” mode and uses pick-up points as the platform for goods delivery, transit, and sale. It provides fresh products such as fruits and vegetables, meat, and seafood for its user group, mainly married women (Zheng and Liu, 2020). The goods ordered online will be delivered to the self-pickup points the next day. The essence of this business model is community scene + group purchasing + social attributes + C2B retail (Zhang Wei, 2019). According to the role of initiators, the basic group purchase modes can be categorized into “baoma + community” and “store manager + community”. Classified by the commodity supply chain, there are three supply modes: front warehouse distribution, origin distribution, delivery to the selling warehouse, and direct delivery to the consumers (Zheng and Liu, 2020).
The ‘last mile’ problem has always been one of the significant problems restricting the development of e-commerce, leading to delivery failures, high end-to-end distribution costs, low delivery service quality, poor delivery timeliness, low convenience of pick-up, severe environmental pollution, and the inability to meet the diversified needs of consumers (Esper et al., 2003; Esser and Kurte, 2006; Ehmke and Mattfeld, 2012; Zhang and Chen, 2015; Wu, 2017; Zhan et al., 2016; Deng, 2018; Baldi et al., 2019). The generation of Collection and Delivery Points(CDPs)is regarded as an essential solution to the problem of the last-mile distribution of goods (Weltevreden, 2008; Morganti et al., 2014b), which is defined as the last leg in business-to-consumer delivery service, wherein a consignment is delivered to a particular location (e.g., a consumer’s residence or a collection point) (Gevaers et al., 2011). There are two types of CDPs: automated parcel stations (APSs)/locker points and pick-up points (PPs)/service points. APSs are unattended collections of lockers (using luggage locker technology and personal identification number codes) that accommodate the delivery and collection of parcels and returned goods (McKinnon and Tallam, 2003), while PPs use existing shops where customers can pay, collect, and return their parcels, such as grocery shops, fuel stations, pharmacies, and post offices (Weltevreden, 2008). Compared to APSs, PPs are safer and simpler in operation, with larger storage capacity for flexible parcel sizes and shapes (Weltevreden, 2008). In addition, PPs are more likely to combine with other commercial activities, attracting people who pick up parcels to consume and increase shops’ revenue (McKinnon and Tallam, 2003).
Community group purchasing collection and delivery points (CGPCDPs) is one of the common types of PPs, which are attended and make use of existing shops. However, the existing research on Cainiao station and Xingshengyouxuan (two typical CGPCDPs in China) has shown that CGPCDPs have unique characteristics compared with PP (Table 1). For example, PPs have two operation modes: self-operated and joint venture (Liu et al., 2019) and mainly serve communities, schools, and business districts (Xue et al., 2019). The types of packages that can be deposited include groceries, fresh products, letters, small packages, electrical appliances, and other goods, which generally have a storage time of 3 to 7 days. In contrast, most CGPCDPs adapt a joint venture model, mainly storing fresh products (Zheng and Liu, 2020), so it has refrigeration demand and shorter storage time. Moreover, CGPCDPs mainly focus on community services (Zhang, 2019). Sometimes multiple CGPCDPs will serve one community. Lastly, in addition to shops, CGPCDPs will also depend on self-operated PP and residences. In summary, it is necessary to conduct an in-depth study on CGPCDPs because of their unique characteristics, putting forward the first problem to be solved:
- What are the operating model, service objects and basic characteristics of CGPCDPs?
The research on the spatial distribution of PPs is mainly based on the national (Morganti et al., 2014a; Weltevreden, 2008) and regional (Li et al., 2018, 2019; Xue et al., 2019) macro scale. It is found that PPs are usually located in the village centers and community centers in urban areas (Weltevreden, 2008; Esser and Kurte, 2005). Weltevreden (2008) further pointed out that cities, communities, and convenience centers are more suitable for PPs than villages and remote areas because PPs are used more frequently within a 5-minute drive of residence. In cities, PPs are concentrated in the main commercial streets. Even in in suburbs and rural areas, PPs are usually located in the most “urban” areas. Regional and local train stations are the preferred targets for PP location selection (Morganti et al., 2014b). The spatial distribution of PPs is influenced by population density, traffic accessibility, household internet penetration, ownership of modern electronic devices, shopping trip frequency, and residential property types (Morganti et al., 2014a; Weltevreden, 2008; Dong et al., 2012). Li et al. (2018, 2019) and Xue et al. (2019) found that the spatial distribution of PPs in China matches the distribution of residential land. PPs are less distributed in urban fringe areas and tend to be close to the entrances and exits of communities, companies, industrial parks, shopping malls and other facilities. They further pointed out that regional economic development level, residents’ purchasing power, population distribution, transportation convenience, and land use type determine the potential PP location. In addition, Tan (2016) and Huang (2017) found that residents’ social attributes, residence, employment, travel, and other behaviors, as well as PPs’ service radius and business hours, will also affect the location of PPs.
Some studies have explored the spatial distribution characteristics of PPs and several factors related to PPs’ spatial distribution. However, CGPCDPs have unique characteristics and spatial requirements compared with PPs. Few studies have involved the spatial distribution characteristics and factors of CGPCDPs, so it raises two research questions to be solve:
- 2.
- What is the spatial distribution pattern of CGPCDPs?
- 3.
- What factors and mechanisms affect the spatial distribution of CGPCDPs?
This research aims to solve these three problems from the geography perspective. A case study was conducted in Nansha District, Guangzhou, the frontier city of new retail development from the micro-scale. Take Xingshengyouxuan CGPCDPs as an example, which is a unicorn company in the field of community group purchasing. The goal of this research is to provide a reference for solving the last-mile distribution problem of e-commerce logistics, contributing to the healthy development of new retail and the community life circle planning.
The second part of this article introduces the study area, research data and research methods. The third part presents the operation mode and basic characteristics of CGPCDPs. The fourth part adapts spatial analysis tools to explore the distribution characteristics of CGPCDPs. The fifth part explores the influencing factors of the spatial distribution of CGPCDPs. The sixth part concludes and discusses further research directions.
2. Materials and Methods
2.1. Study Area
Guangzhou City is located in south China, and is known as the “thousand-year commercial capital”. It has continuously been listed in the GaWC International Metropolis list and was rated as the Alpha world’s first-tier city in 2018. In 2018, Guangzhou ranked fifth in the comprehensive national index of new retail city development, indicating that it is a frontier city for the new retail development and a key market of Xingshengyouxuan. Nansha District (22°26 ‘ N ~ 23°06’ N, 113°13 ‘ E ~ 113°43’ E) is located in the southernmost part of Guangzhou city (Figure 1). By the end of 2019, its permanent population is 796,100. Nansha District is the geographic and geometric center of the Guangdong-Hong Kong-Macao Greater Bay Area, a sub-center of Guangzhou, a state-level new district, and a pilot free trade zone. Nansha District has formed a diverse living environment in rapid urbanization process. In the Urban Master Plan of Nansha New District in Guangzhou City (2012-2025), it includes central urban areas: Nansha Street, Zhujiang Street, Hengli Island, and the northern part of Longxue Island, two main urban centers: Jiaomen River Center and Zhujiang Coastal Center, and villages which are categorized into urban village, urban fringe village, and agricultural village (Figure 2).
2.2. Data Sources
Xingshengyouxuan was established in 2017. In just a few years, the annual GMV has increased from 800 million to about 40 billion, and the number of CGPCDP has risen from 20,000 to more than 500,000. Its business has spread to 15 provinces (municipalities) such as Hunan, Hubeiand Guangdong, more than 6,500 cities and towns, and more than 50,000 counties. In 2020, it was listed on the Hurun Global Unicorn List and was the first “unicorn” enterprise in Hunan province with a more than 1 billion US dollar valuation.
The data were collected from the following databases: ①The point of interest (POI) data of CGPCDPs of Nansha District were crawled from Xingsheng optimization website (https://www.xsyxsc.com/) with Python., Through data cleaning, elimination, coordinate correction and address information correction and completion, by mid-August, 2021, we have collected 1353 CGPCDPs of Xingshengyouxuan. ②POI data of related facilities such as residential areas, convenience stores, supermarkets, shopping malls and transportation stations were collected from Baidu map (https://map.baidu.com/) with Python. ③Housing price data comes from China’s housing platform Beike.com (https://bj.ke.com/) in mid-August. Each record contains the community’s name, latitude and longitude, and housing price. ④Road network data comes from OpenStreetMap (https://www.openstreetmap.org/), population distribution data comes from mobile phone signaling data analysis in 2019 (Dong M F,2020), and satellite remote sensing data comes from Baidu Map (https://map.baidu.com/). Finally, the vector data of China National Geographic Information Center’s 1:300,000 National Basic Geographic Database is an auxiliary data source.
2.3. Research Methods
2.3.1. Standard Deviational Ellipse
The standard deviation ellipse is mainly used to study the spatial distribution characteristics of discrete data sets. The average center of the ellipse is the center of gravity of geographical elements in space. The azimuth Angle represents the main trend of its distribution, the direction of the long axis represents the main distribution direction of data, and the area represents the concentration degree of discrete points (Adeline and Adrien, 2016; Zhao and Zhao, 2014). The research uses the standard deviation ellipse to study the direction of the spatial distribution of CGPCDPs. The specific calculation formula is as follows:
where and are the coordinates of element i; {,} represents the average center of the element; is equal to the total number of elements.
2.3.2. Kernel Density Estimation
Kernel density estimation (KDE) believes that there is a measurable event density at any location in the region, which can be estimated by the number of event points in the unit area around it, aiming at examining the spatial distribution of random variables (Xie and Yan, 2008, 2013). This research uses the KDE to visually reveal the macroscopic distribution pattern of CGPCDPs in the study area. The specific calculation formula is as follows:
where is the number of samples; is the bandwidth, namely the search radius; is the kernel function.
2.3.3. Spatial Regression Model
- (1)
- Ordinary Least Squares(OLS)
OLS is a global regression model that implicitly assumes that the observed values in the study area are independent and constant, and that the error terms are not correlated without considering spatial correlation (Hutcheson, 2011; Pohlmann and Leitner, 2003). The calculation formula is as follows:
where is the CGPCDPs density value of the location i; is the intercept; is the explanatory variable; is the regression coefficient of variable i; is the random error.
- (2)
- Geographically Weighted Regression(GWR)
GWR is an improved spatial linear regression model that estimates local parameters at each location, assuming non-stationary relationships between response variables and explanatory variables (Brunsdon et al., 1996; Charlton, Fotheringham and Brunsdon, 2009; Fotheringham et al., 1998). The model applies the spatial weight matrix to the linear regression model, vividly showing the spatial structure differentiation. The calculation formula is as follows:
where is the CGPCDPs density value of the location; is the intercept; is the regression parameter j; is the value of the explanatory parameter j; is the random error.
- (3)
- Multi-scale Geographically Weighted Regression(MGWR)
GWR considers spatial changes in the regression modeling process, but the setting of the spatial scale is still constant (Fotheringham et al., 2017; Oshan et al., 2019). MGWR is an extension of GWR and uses different bandwidths for each influencing factor instead of a single constant bandwidth to measure the relationship between the independent variable and dependent variable space changes at various scales (Fotheringham et al., 2017; Yu et al., 2019). The calculation formula is as follows:
where is the bandwidth used to calibrate the relationship j, and the remaining parameters are the same as equation (5). Compared with GWR, MGWR can accurately describe spatial heterogeneity, reduce collinearity, and reduce deviation in parameter estimation (Fotheringham et al., 2017; Oshan et al., 2019).
The research constructs OLS, GWR and MGWR models respectively to explain the influencing factors and driving mechanisms of the spatial differentiation of CGPCDP distribution.
3. The Basic Characteristics of CGPCDPs
3.1. Operation Mode
Taking Xingshengyouxuan as an example, the operation mode of community group purchasing (Figure 3) is: Taking the community as a unit, the community group purchasing group is established by recruiting initiators to gather consumers with similar consumption needs. Initiators are responsible for product promotion, daily operation, attracting group members to place orders, and organizing orders. Then, the platform provides centralized procurement from suppliers and uses the established logistics network to deliver the products to CGPCDPs the next day. Next, initiators notify the customer to pick up the goods after the goods are distributed, and the users pick up the goods by themselves. Community group purchasing is oriented to the daily needs of the community residents, and sales are carried out by initiators who have social relationships with acquaintances or semi-acquaintances. In addition, it adopts the pre-sale and “purchase by sale” models, storing goods in CGPCDPs are adjacent to consumers, so that they can save storage and logistics costs. CGPCDPs can be joined at zero cost, only providing goods storage and self-pickup space, and getting the flow of people and revenue commission.
3.2. Initiator Characteristics
Table 2 shows that the initiator are mainly shopkeepers (such as supermarkets and convenience stores), residents, and express stationmasters. Among them, shopkeepers have the highest priority, accounting for 75.31%, mainly because physical stores naturally have offline pick-up scenes and the conditions to store fresh goods. Followed by residents and express stationmaster, accounting for 17.22% and 3.55% respectively. Further study on the gender ratio of various initiators found no significant gender difference between shopkeepers and station managers. However, among residents, the number of women initiators is significantly higher than that of men. This is related to China’s social division between “men dominate outside, and women dominate”. Compared with men, women have more leisure time and are more willing to do business to support their families.
3.3. Support Types
According to “China National Economic Industry Classification (GB/T 4754-2017)” and “China Retail Industry Classification (GB/T 18106-2021)” (std.samr.gov.cn), the supporting types of CGPCDPs are divided into 9 categories (Table 3). It is found that most CGPCDPs appear in the form of joint ventures, mainly depending on Wholesale & retail, Recreation & entertainment, accommodation & catering, and other types. Wholesale and retail especially convenience stores, supermarkets, and stores are the first choice for CGPCDPs because of their comprehensive layout, advantageous location, and storage space conditions, accounting for 55.51%. Next is the residence, accounting for 18.03%, which belongs to residents who voluntarily operate low-cost or no-cost local operations to earn additional income. Accommodation and catering, logistics and warehousing, and life services are also common places where CGPCDPs depend. It is worth mentioning that the proportion of fresh stores with high consistency of products provided by CGPCDPs is also high. According to the survey, the main reason is probably that entering CGPCDPs can bring additional income even they share similar goods.
3.4. Service Objects
Different functional areas have different needs for CGPCDPs. CGPCDPs are committed to solving the last mile distribution problem, which is generally distributed near the target of its service. With CGPCDPs as the center and 500 m as the radius, the neighboring facilities (communities, companies, industrial parks, etc.) are determined. The service objects are selected according to the principle of minimum distance. A further determination is made in combination with field investigation and satellite images. Table 4 shows that CGPCDPs mainly serve communities (including urban and rural communities), accounting for 87.88%. It was followed by the industrial zone, accounting for 9.31%, mainly because of the many high-tech, equipment, automobile, and marine industries in Nansha District.
4. Spatial Pattern of CGPCDPs
4.1. Macro Distribution Characteristics of CGPCDPs
4.1.1. The Overall Pattern
Figure 4 shows that the spatial distribution of CGPCDPs in Nansha District is unbalanced, which is dense in the north and scattered in the south. It is mainly concentrated in Nansha Street, Zhujiang Street, Huangge Town, Dagang Town, and Dongyong town, with rapid economic development, long-term urban construction, and a large population. It is sparsely distributed in Wanqingsha town and Longxue Street in the south. Calculate the average predicted distance and nearest neighbor index of CGPCDPs in the urban community, urban village, urban edge village and agricultural village, Using the mean nearest neighbor (Liu and Xue, 2019; Hao et al., 2018), calculate the average predicted distance and nearest neighbor index of CGPCDPs in the urban community, urban village, urban edge village, and agricultural village. The average predicted distance and nearest neighbor indexes are 94.72m and 0.14 for the urban community, 121.97m and 0.26 for urban villages, 153.86m and 0.33 for urban edge villages, and 177.63m and 0.35 for agricultural villages. It is found that the distribution of CGPCDPs presents the patter of “central agglomeration and peripheral dispersion”. To be specific, it is concentrated in urban communities and urban villages and has a trend of diffusion and reduction to peripheral urban edge villages and agricultural villages. It is closely related to the population distribution, urban construction, and residents’ demand in Nansha District.
Further, we analyze the spatial distribution of its support facilities (Figure 4) including wholesale and retail, residential and accommodation, and catering (accounting for 82.34%), and others. All the support facilities of CGPCDPs are mainly distributed in urban communities and urban villages. Wholesale and retail are covered in urban and rural areas, with a wide range and a large number. Residences are mainly concentrated in urban areas but rarely in rural areas, mainly related to traffic convenience, attraction, and sufficiency. There is no apparent urban-rural difference in accommodation, catering and other types, but all their distributions are relatively scattered due to their numbers.
4.1.2. Spatial Distribution Direction Characteristics
The distribution of CGPCDPs is directional, that is, the degree of dispersion in each direction is different. This research uses the standard deviation ellipse analysis method to analyze the difference in the degree of dispersion of CGPCDPs. It can be seen from Figure 6 that the length of the major axis and the minor axis of the standard deviation ellipse are quite different. The spatial distribution of CGPCDPs shows a “northwest-southeast” trend, which means the distribution is concentrated in the northwest and scattered in the southeast. This mainly because the direction of the urban spatial development and axis of the Nansha District. It connects with the downtown area of Guangzhou to the north and develops marine and port industries to the south.
4.1.3. Spatial Agglomeration Characteristics
The kernel density analysis of CGPCDPs in Nansha District revealed prominent distribution hotspots (Figure 7). It presents a “dual-core and multi-center” overall distribution pattern. The first core is located in the Jiaomen River area, north of the Nansha Sub-district, the main urban center of the Nansha District. It undertakes the function of urban public services. Jiaomen bus terminus, Jinzhou, and Jiaomen subway stations are located here, with a dense population, complete supporting facilities, convenient transportation, and high income of residents. The second core is the northern area of Dagang Town, the old town center of Dagang Town, with a dense population, high construction density, and strong consumer demand. The multiple centers are located in the south of Lanhe Town, the north of Dongchong Town, the south of Huangge Town, the middle of Zhujiang Street, the middle of Wanqingsha Town, and the central and northern areas of Kongxue Street. Most of these areas are the town (street) centers and high-speed railway station neighborhoods, which are the most densely populated and have a high level of economic development. In addition, the distribution density of CGPCDPs mainly decreases from the center to the edge, and there are many areas with extremely low density or even zero regions, which are non-construction land areas.
4.2. Meso-Micro Distribution Pattern of CGPCDPs
Through the previous analysis, it is found that the distribution of CGPCDPs has spatial heterogeneity. To specifically examine the spatial differences and characteristics of CGPCDPs under different built environments, four regions (an urban area A, an urban village area B, an urban border village area C with industry as the mainstay, and a rural area with agriculture as the mainstay D) were selected (Figure 8).
A: Located in the Jiaomenhe Community of Nansha Street, it is the main center of the Nansha District, with convenient transportation and a dense population. CGPCDPs are densely distributed with rich types of support. They are usually adjacent to residential areas and have a significant “many-to-one” distribution trend: multiple CGPCDPs in a residential area. There are mainly three spatial distribution modes. The first is adjacent to the inner center of the residential area and has multi-directional high accessibility. The second is located at the edge of the residential area along the side of the main road, adjacent to the main entrances and exits of the residential area, and is around the central pedestrian passage. The third is located on both sides of the roads or intersections on the periphery of the residential area, serving the residents’ daily consumption of the surrounding communities.
B: Located in Weiyu Village and Dagang Town, it has high building density, high population density, and many small-scale commerce and catering businesses. CGPCDPs are densely distributed, with rich supporting types, and a uniform distribution trend. It is mainly concentrated on both sides of main roads in urban villages, and the layout is directional because the population and construction density of urban villages are too large. However, there is no prominent density center, and a structural paradigm of “spreading big cakes”.
C: Located in Dongshen Village and Dongyong Town, there are many electronic and logistics industries such as Mark Industrial Zone and Guangzhou Linyi New Energy Technology Company. The number of CGPCDPs is small and the distribution is relatively scattered. They are mainly distributed around the factory or on both sides of the roads where residents live.
D: Located in Minjian Village and Minxing Village, Wanqingsha Town, and Nansha District, the construction land is scattered, and many agricultural lands are distributed. A village usually has one or two CGPCDPs, mainly depending on the wholesale and retail shops, which are scattered, mainly distributed on both sides of the main roads, and mostly the “urban core” of rural areas, which gets similar conclusions with the study of Morganti (2014b).
5. Influencing Factors of CGPCDPs Spatial Differentiation
5.1. Selection of Influencing Factors
The study found that the location of CGPCDPs in Nansha District showed apparent differences in distribution at different scales. This feature can be explained by a spatial regression model that considers spatial features. Therefore, this research constructs OLS, GWR, and MGWR models to analyze the influencing factors of spatial distribution of CGPCDPs. Possible explanation is that consumers’ social and financial attributes, population density, distance from transportation nodes and social and economic centers, accessibility of transportation, and land use types may affect the distribution of CGPCDPs. Considering the spatial distribution characteristics of CGPCDPs in Nansha District, several indicators are drawn up from: socioeconomic, traffic location and spatial environment. After multiple linear stepwise regression, the variables with high collinearity and low contribution rate were eliminated, and finally, 9 main influencing factors were selected (Table 5).
5.2. Model construction and testing
The Nansha District was divided into 738 regular hexagonal grids with an area of 1 km2. The values of dependent variables and independent variables of each grid were calculated. Then, OLR, GWR, and MGWR were used for analysis, and the results are shown in Table 6. From the overall fit R2 of the model, the R2 value of the MGWR model is 0.985, which is the best overall fit among the three models, indicating that MGWR can explain 98.5% of the CGPCDPs density distribution in the Nansha District. In addition, the Residual Sum of Squares (RSS) and AICc of the MGWR model are the smallest among the three models. Therefore, compared with the OLR and GWR models, MGWR has the best fitting effect and can describe the spatial variation and scale difference between CGPCDPs density and its influencing factors more accurately.
According to the local variable coefficients of MGWR (Table 7), the spatial bandwidth of each variable is different. That is, the influence of each variable on CGPCDPs distribution is operated at various scales. Except for the fact that the density of the road network and traffic station is insignificant in the 95% confidence interval, the other influencing factors all have significant sample points. The number of significant samples of statistically significant factors (p≤5%), population density, distance from urban community centers, distance from roads, and supporting places is significant globally. In contrast, housing prices, construction land, and community density are significant locally.
5.3. Influence Mechanism
According to the regression coefficient results of MGWR (Table 7 and Figure 9), the influence mechanism of CGPCDPs’ spatial differentiation is explored from the socioeconomic, traffic location, and spatial environment levels.
5.3.1. Socioeconomic Factors
The bandwidth value of population density is 737, and the regression coefficient value is between 0.06 and 0.064, indicating that population density has a relatively stable positive influence on the distribution of CGPCDPs in the global scope. Because the population density can represent the consumer demand to a certain extent, the greater the population density, the greater the consumption demand of community group purchasing, and the more CGPCDPs. Housing prices are mainly affected in the local area of the Nansha District. The main regression coefficient is negative, indicating that the higher the housing price, the fewer CGPCDPs. The reason is that the price of community group purchasing goods is low, and the high housing price reflects the high-income level of residents, who are less interested in it. At the junction of Huangge Town and Nansha Street and in the northwest of Dongyong Town, housing prices positively impact the distribution of CGPCDPs because there are mainly industrial areas and newly built districts, and high housing prices mean more residents. The northwest area of Dongyong town is mainly because of its proximity to the Panyu district of Guangzhou, which is affected by regional factors.
5.3.2. Traffic Location Factors
The distance from the road affects the distribution of CGPCDPs globally in the Nansha District, but there are differences between urban and rural areas. It has a positive impact in rural areas and a negative impact in urban areas, showing a transparent gradient from northwest to southeast. The reason is that the road network in rural areas is sparse, and the residential area is far from the road. The road network in urban areas is dense, the residential area is adjacent to the road, and there are many places where CGPCDPs depend on both sides of the streets. The factor bandwidth of distance from the urban community center is 43, which has apparent spatial heterogeneity, and the regression coefficient decreases outward from the urban community center. In the area around the urban community center, the greater the distance from the urban community center, the more CGPCDPs, mainly related to the house price level. In the area farther away from the urban community center, the farther the distance, the less the number of CGPCDPs, similar to the research results of Weltevreden (2008), and Esser and kurte (2005). Mainly because the rural population density is low, and there are conditions for self-supplied fresh products, the demand for CGPCDPs is relatively tiny.
5.3.3. Spatial Environmental Factors
The regression coefficient of construction land in most areas is positive. The more construction land, the greater the number of CGPCDPs. However, it shows a significant negative impact in the eastern area of Huangge Town. The reason is that construction land is mostly industrial land in the area, with less residential land and fewer potential consumers. The regression coefficient of supporting places of CGPCDPs is the largest and most positive, so it has the most significant influence on the distribution of CGPCDPs. The regression coefficient shows a decreasing change from northwest to southeast, mainly because the northwest is rural. There is a lack of supporting places for CGPCDPs, which decreases marginally the impact of urban areas on the distribution of CGPCDPs. The residential area is the service space of CGPCDPs, and the residential density has a positive incremental effect on the spatial distribution of CGPCDPs in the Nansha District. The greater the community density, the more CGPCDPs serve the population and the more CGPCDPs there are. However, the abnormal negative impact area in Dagang Town is mainly due to the concentration of self-built houses in Huangge Town. Although the number of residential areas is small, the population density is high, and the demand for CGPCDPs is high.
6. Discussion
PPs are essential to solving the “last mile” problem. Their spatial layout and location selection play an important role in transportation efficiency (Weltevreden, 2008; Morganti et al., 2014b). Under the new retail background, CGPCDPs, which focus on community life services, have unique characteristics and needs compared with PP for package transportation. Therefore, research in operation model, layout, and location selection, and influencing factors of CGPCDPs based on big data is necessary. On one hand, this research supplements the lack of space research on CGPCDPs with the qualitative methods in the field of business and logistics (Zhang, 2019). On the other hand, it makes up for the lack of the micro-scale study of PPs (Li et al., 2018, 2019, providing a new way to break new retail’s “last mile” logistics bottleneck.
Our research found that the distribution of CGPCDPs has significant differentiation in different scales and built environments, resulting from the interaction of consumers, operators, and the space environment. House price, distance from the urban community center and road and supporting places also have an essential impact on the distribution of CGPCDPs and have different impact effects in various regions and scales, deepening and supplementing the previous research results of scholars. How to optimize the location and layout of CGPCDPs in different built environments to improve the last-mile delivery efficiency requires further research. In addition, this paper explores the influencing factors of CGPCDP distribution. Similarly, the influence of CGPCDPs on residents’ behavior, retail business, and community planning is also worth further study.
CGPCDPs mainly depend on establishing commercial or living spaces in existing communities, and have the characteristics of multiple CGPCDPs serving one community. Integrating resources, achieving win-win between operators and CGPCDPs, and the cooperation and differentiated development between adjacent CGPCDPs are worth studying in the future. At the same time, the entry of CGPCDPs enriches the function of community space and improves the vitality of space. With the development and transformation of new retail, the number of CGPCDPs in urban and rural areas increases, and CGPCDPs have more potential to improve the allocation of public service facilities, establishing urban and rural community life circles (especially in rural areas), improving residents’ happiness, and eliminating urban-rural differences. Combined with practical cases, studying how to consider CGPCDPs in community life circle planning and urban design in urban and rural areas is urgent.
Finally, the market and the government regulate the development of community group purchasing. At present, China’s community group purchasing enterprises are rapidly expanding the market. The number of CGPCDPs is excessively high, and the future spatial pattern may change with the policy and enterprise strategy. How to reasonably control and plan the distribution of CGPCDPs and avoid the waste of resources needs continuous attention and research.
7. Conclusions
Based on the CGPCDP’s POI data in Nansha District, Guangzhou, this paper uses text analysis, spatial analysis, model analysis, and other methods to analyze CGPCDPs’ operation mode, spatial location, differentiation law, influencing factors, and driving mechanism. The main conclusion contains the following:
(1) Basic characteristics of CGPCDPs: Community group purchasing is a new retail model that serves the community and realizes the sale of fresh products through the social relationship of acquaintances and semi-acquaintances. CGPCDP initiators are mainly shopkeepers, residents, and express stationmasters, and there are gender differences among the residents. They depend on different types, mainly wholesale and retail shops, followed by residences, accommodation, and catering shops. Service targets are predominantly urban and rural communities, followed by industrial areas.
(2) Spatial distribution characteristics of CGPCDPs: The distribution of CGPCDPs has apparent spatial differentiation. At the macro scale, the distribution of CGPCDPs is dense in the north and scattered in the south, showing the differentiation characteristics of “central agglomeration and peripheral dispersion”. There are quantitative and spatial distribution differences in different support types. It is distributed along the “northwest-southeast” direction and presents a “dual-core multi-center”. At the meso-micro scale, there are three distribution patterns of CGPCDPs in urban areas: adjacent to the residential area center, along the edge of the residential area on one side of the main road, along both sides of the road outside the residential area or at the intersection. CGPCDPs are mainly distributed on both sides of main roads in urban villages. They are scattered on both sides of main streets, close to the “urban core” in rural areas.
(3) Spatial differentiation influence mechanism of CGPCDPs: OLS, GWR and MGWR regression models are constructed to investigate the influence mechanism of CGPCDPs spatial differentiation. MGWR regression model has a better fitting effect. Population density, construction land, house price, supporting place, residence density, urban community and road proximity are the main influencing factors, and there are significant differences in different regions.
Author Contributions
Yingying Wang and Gang Li Conceptualization; Data curation; Funding acquisition; Investigation; Methodology; Project administration; Yingying Wang and Feng Xu Formal analysis; Writing - original draft; Yingying Wang, Feng Xu, Gang Li Writing- review & editing. The author(s) read and approved the final manuscript.
Funding
This study was supported by the Tang Scholar Program of Northwest University (Grant No. 2016) and the Characteristic & Advantage Research Team Construction Project of Human-Environment Relations and Space Security of Northwest University (Grant No. 2019).
Informed Consent Statement
Authors declare that the work described has not been published previously, that it is not under consideration for publication elsewhere, that its publication is approved by all authors and tacitly or explicitly by the responsible authorities where the work was carried out, and that, if accepted, it will not be published elsewhere in the same form, in English or any other languages.
Data Availability Statement
All data generated or analyzed during this study are included in this published article. All the data used for several analyses are freely available and the resources are mentioned within the paper.
Acknowledgments
We thank our teammates for their valuable suggestions. Especially, we are grateful to the anonymous reviewers for providing numerous comments and suggestions, who helped to improve this manuscript.
Conflicts of Interest
The authors declare no conflict of interest.
References
- Baldi M M, Manerba D, Perboli G et al., 2019. A generalized bin packing problem for parcel delivery in last-mile logistics. European Journal of Operational Research, 274(3): 990–999. Morganti E, Dablanc L, Fortin F, 2014b. Final deliveries for online shopping: the deployment of pickup point networks in urban and suburban areas [J]. Research in Transportation Business and Management, 11:23-31.
- Brunsdon C, Fotheringham A S, Charlton M E, 1996. Geographically weighted regression: A method for exploring spatial nonstationarity, Geographical Analysis, 28 (4): 281-298. [CrossRef]
- Charlton M, Fotheringham S, Brunsdon C, 2009. Geographically weighted regression White paper. National centre for geocomputation, National University of Ireland Maynooth.
- Deng S M, 2018. Discussion on the ‘last mile’ distribution method of e-commerce logistics under the background of ‘Internet +’. Modern Economic Information, (22): 324.
- Dong Y, Pan C, Wei Y., 2012. Influence of land-use on travel pattern of shopping-mall: A subdivided method of multinomial logistic model and case study in nine sub-districts of Hangzhou, China[M]//Civil Engineering and Urban Planning 2012, 319-332.
- Ehmke J F, Mattfeld D C, 2012. Vehicle routing for attended home delivery in city logistics. Procedia-Social and Behavioral Sciences, 39: 622–632. [CrossRef]
- Esper T L, Jensen T D, Turnipseed F L et al., 2003. The last mile: an examination of effects of online retail delivery strategies on consumers. Journal of Business Logistics, 24(2): 177–203. [CrossRef]
- Esser K, Kurte J, 2005. B2C-Handel: Qualitative und quantitative Analyse des Konsumenten-und Anbieterverhaltens und deren verkehrliche Auswirkungen in Ballungsräumen (B2C-VERRA): Schlussbericht[M]. KE-Consult, Kurte & Esser, Wirtschafts-und Verkehrsberatung.
- Esser K, Kurte J, 2006. B2C E-commerce: impact on transport in urban areas. In: Proceedings of the 4th International Conference on City Logistics. Amsterdam: Elsevier Science.
- Fotheringham A S, Charlton M E, Brunsdon C, 1998. Geographically weighted regression: A natural evolution of the expansion method for spatial data analysis Environment and planning A, 30 (11): 1905-1927.
- Fotheringham A S, Yang W, Kang W, 2017. Multiscale geographically weighted regression (MGWR), Annals of the American Association of Geographers, 107 (6): 1247-1265.
- Gevaers R, Van de Voorde E, Vanelslander T, 2011. Characteristics and typology of last-mile logistics from an innovation perspective in an urban context[M]//City distribution and urban freight transport. Edward Elgar Publishing.
- Heitz A, Beziat A, 2016. The Parcel Industry in the Spatial Organization of Logistics Activities in the Paris Region: Inherited Spatial Patterns and Innovations in Urban Logistics Systems [J]. Transportation Research Procedia, 12:812-824.
- Huang T, 2017. Study on the layout of express self-pickup network based on GIS. Xi’an: Chang’ an University.
- Hutcheson G D, 2011. Ordinary least-squares regression, the SAGE dictionary of quantitative management research, 224-228.
- Kristin Y, Astrid B, Odd A, 2020. E-commerce and prevalence of last mile practices, Transportation Research Procedia, 46:293-30.
- Lachapelle U, Burke M, Brotherton A et al., 2018.Parcel locker systems in a car dominant city: Location, characterisation and potential impacts on city planning and consumer travel access[J]. Journal of Transport Geography, 71: 1-14.
- Li G, Yang L, He J X et al., 2018. The spatial pattern and organization relation of the pickup points based on POI data in Xi’an: focus on Cainiao stations. Scientia Geographica Sinica, 38(12): 2024–2030. Li G, Chen W Y, Yang L et al., 2019. Spatial pattern and agglomeration mode of parcel collection and delivery points in Wuhan City. Progress in Geography, 38(3): 407-416.
- Liu L, Li G, Yang L et al., 2019. Spatial distribution characteristics and influencing factors of express delivery points in Shenzhen [J]. Journal of Geo-information Science, 21(08):1240-1253.
- McKinnon A C, Tallam D, 2003. Unattended delivery to the home: an assessment of the security implications. International Journal of Retail & Distribution Management, 31(1), 30–41. [CrossRef]
- Morganti E, Seidel S, Blanquart C et al., 2014a. The impact of ecommerce on final deliveries: alternative parcel delivery services in France and Germany [J]. Transportation Research Procedia, 4(1):178-190.
- Oshan T M, Li Z, Kang W et al., 2019. MGWR: a Python implementation of multiscale geographically weighted regression for investigating process spatial heterogeneity and scale, ISPRS Int. J. Geo Inf., 8 (6): 269.
- Pohlmann J T, Leitner D W, 2003. A comparison of ordinary least squares and logistic regression. The Ohio Journal of Science, 103 (5): 118-126.
- Tan R S, Xu Y L, Chen Dong, 2016. Research on the spatial distribution of pickup points from the perspective of residents’ behavior: A case study of Cainiao network pick up points in Nanjing. World Regional Studies, 25(5): 111-120.
- Weltevreden J, 2008. B2c e-commerce logistics: the rise of collection and delivery points in The Netherlands. International Journal of Retail & Distribution Management, 36(8), 638-660.
- Wolf L J, Oshan T M, Fotheringham A S, 2017. Single and Multiscale Models of Process Spatial Heterogeneity [J]. Geographical Analysis, 50(3):223-246.
- Wu X Y, 2017. Successful delivery mode and experience enlightenment of ‘Lase One-kilometer’ from foreign E-commerce logistics. Prices Monthly, (12): 47–50.
- Xin X H, 2020. Research on community group purchasing operation mode and optimization strategy [J]. China Circulation Economy, (07):15-16.
- Xue S, Li G, Yang L, et al., 2019. Spatial pattern and influencing factor analysis of attended collection and delivery points in Changsha city, China [J]. Chinese Geographical Science, 29(6): 1078-1094. [CrossRef]
- Zhan B, Gu Z Q, Li Y, 2016. Research on optimization of ‘last mile’ distribution mode of e-commerce logistics under the background of ‘Internet +’. Logistics Technology, 35(01):1–4+11.
- Zhang J, Chen Y Y, 2015. The review of research on the ‘Last Mile’ in logistics. China Business and Market, (4): 23–32.
- Zhang W, 2019. Study on the community group purchasing operation model under the background of new retail [J]. Business& Economics, (11): 66-68.
- Zhao L, Zhao Z Q, 2014. Research on China’s economic differentiation based on characteristic ellipses [J]. Geographical Science, 34(8): 979-986.
- Zheng S H, Liu T, 2020. The status quo and development countermeasures of community group purchasing marketing model [J]. Northern Economy and Trade, (11):56-58.
Figure 1.
Location of the study area.
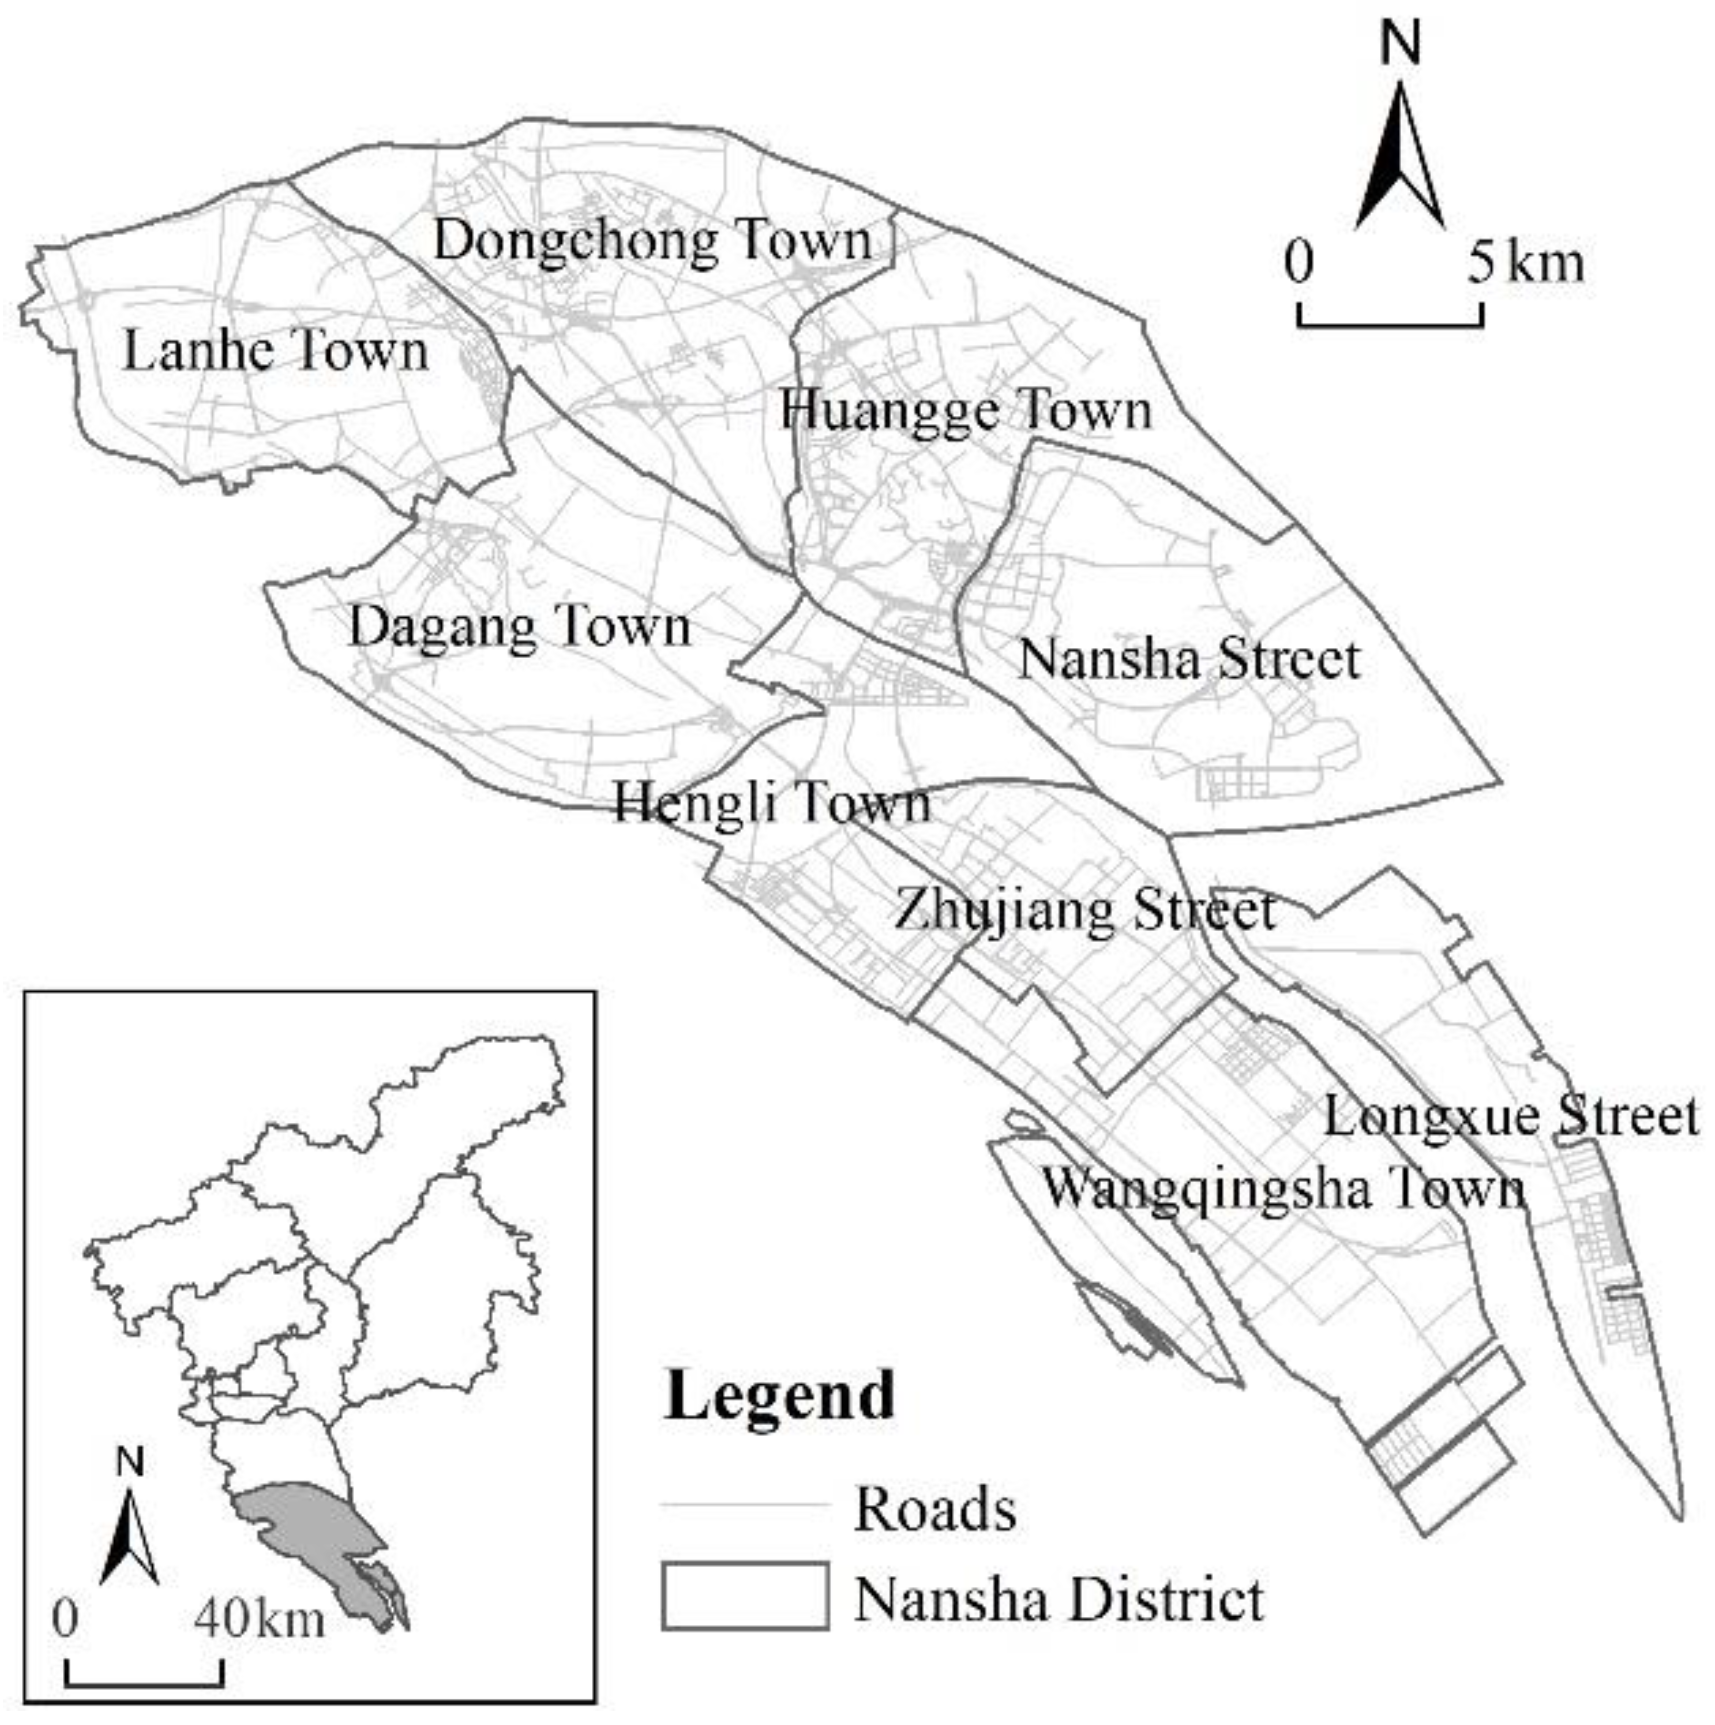
Figure 2.
The Urban Master Plan of Nansha District.
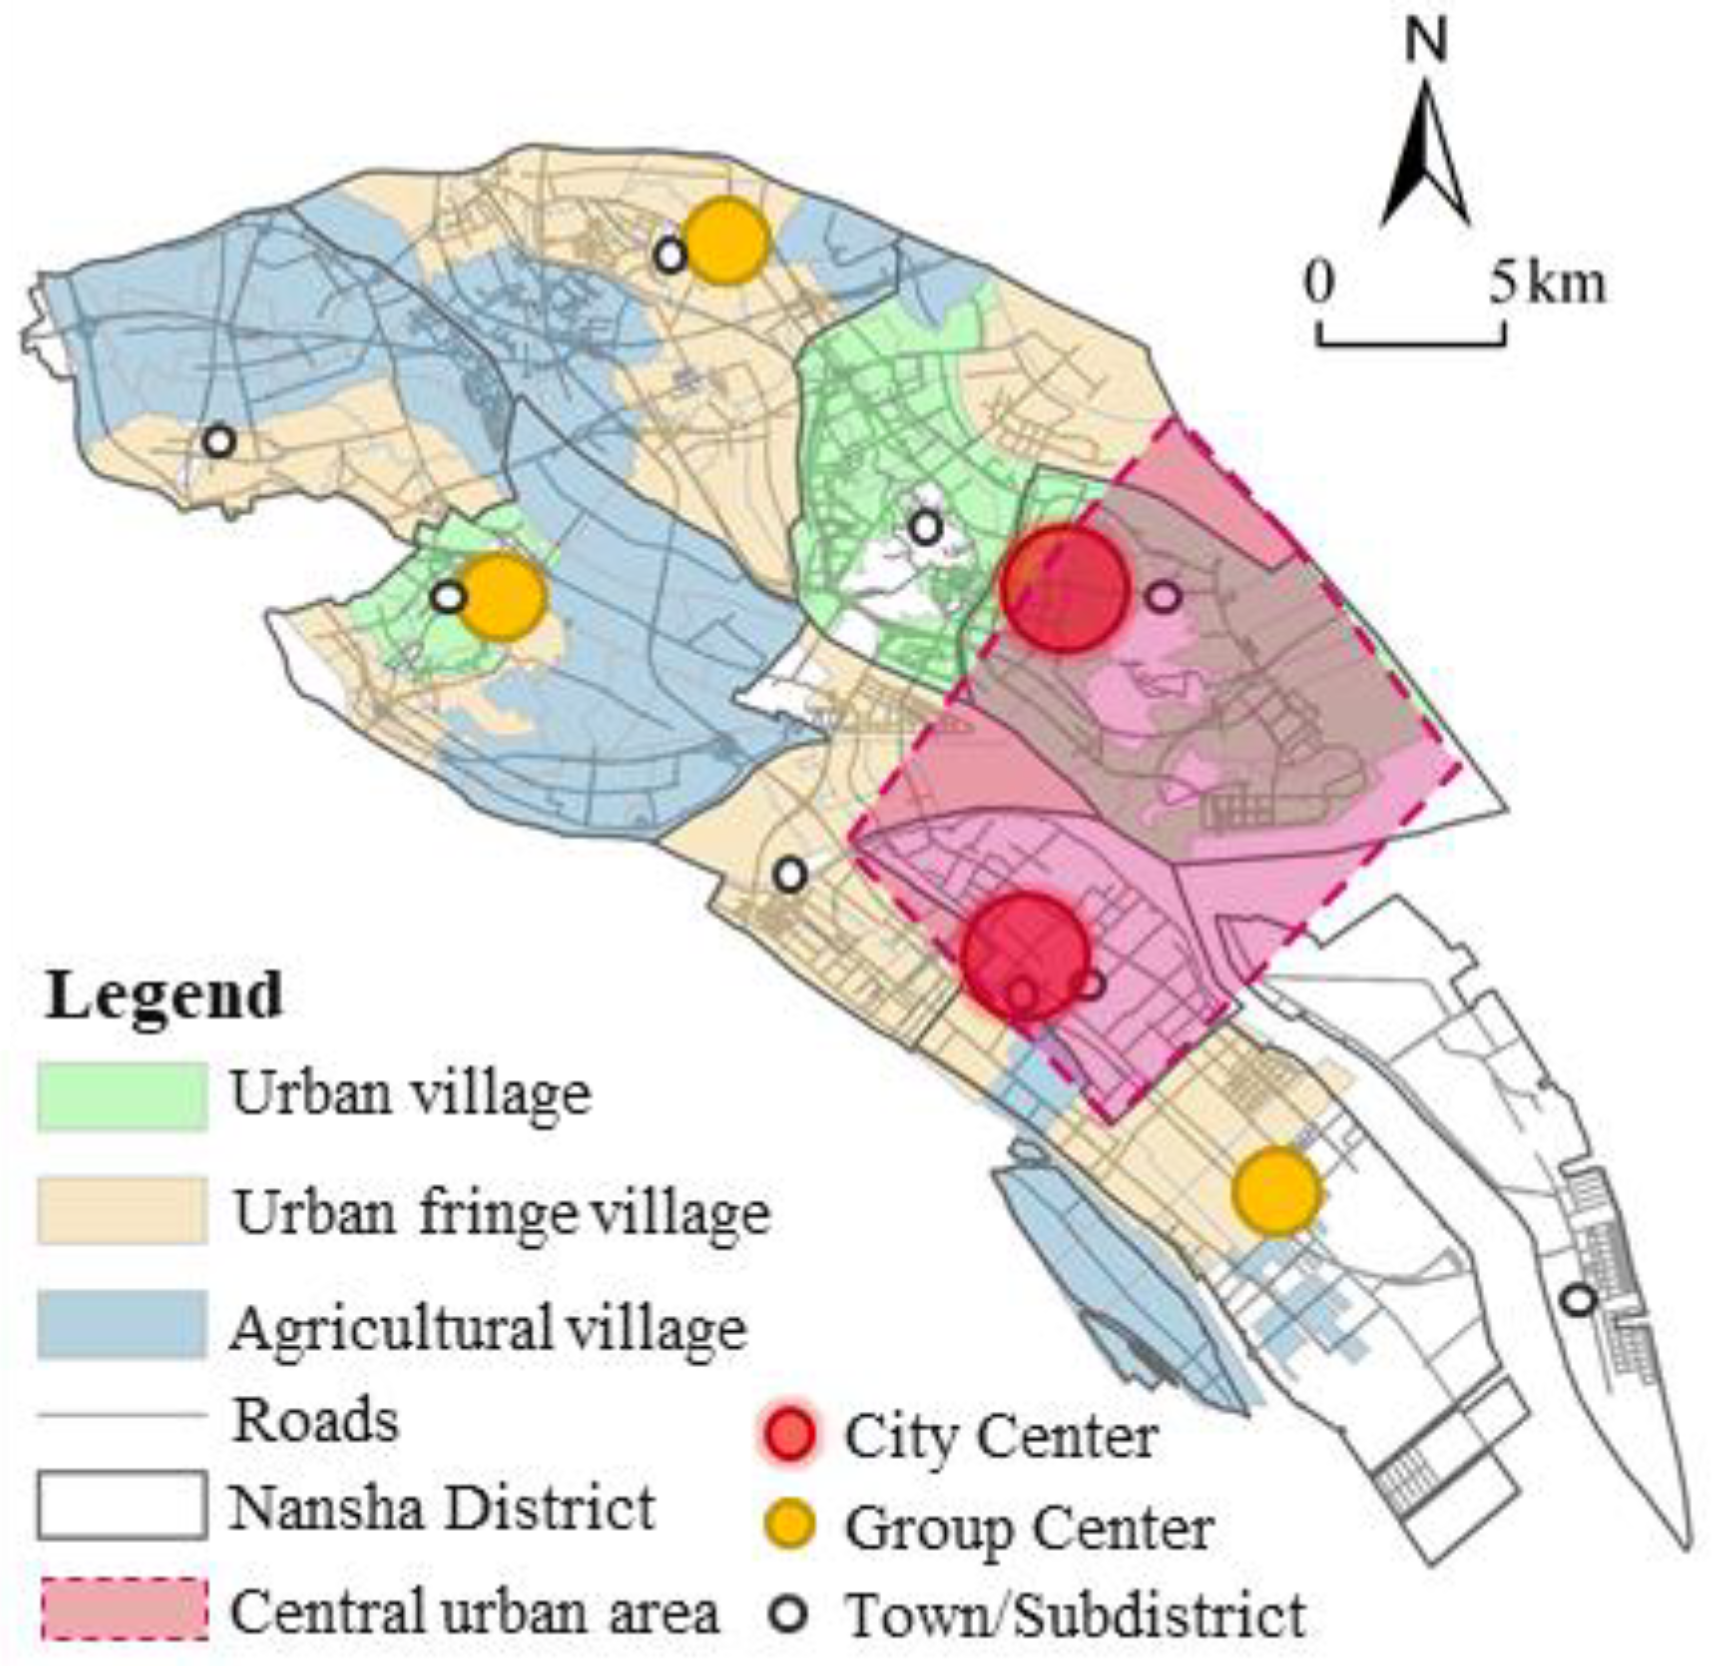
Figure 3.
Community group purchasing operation model.
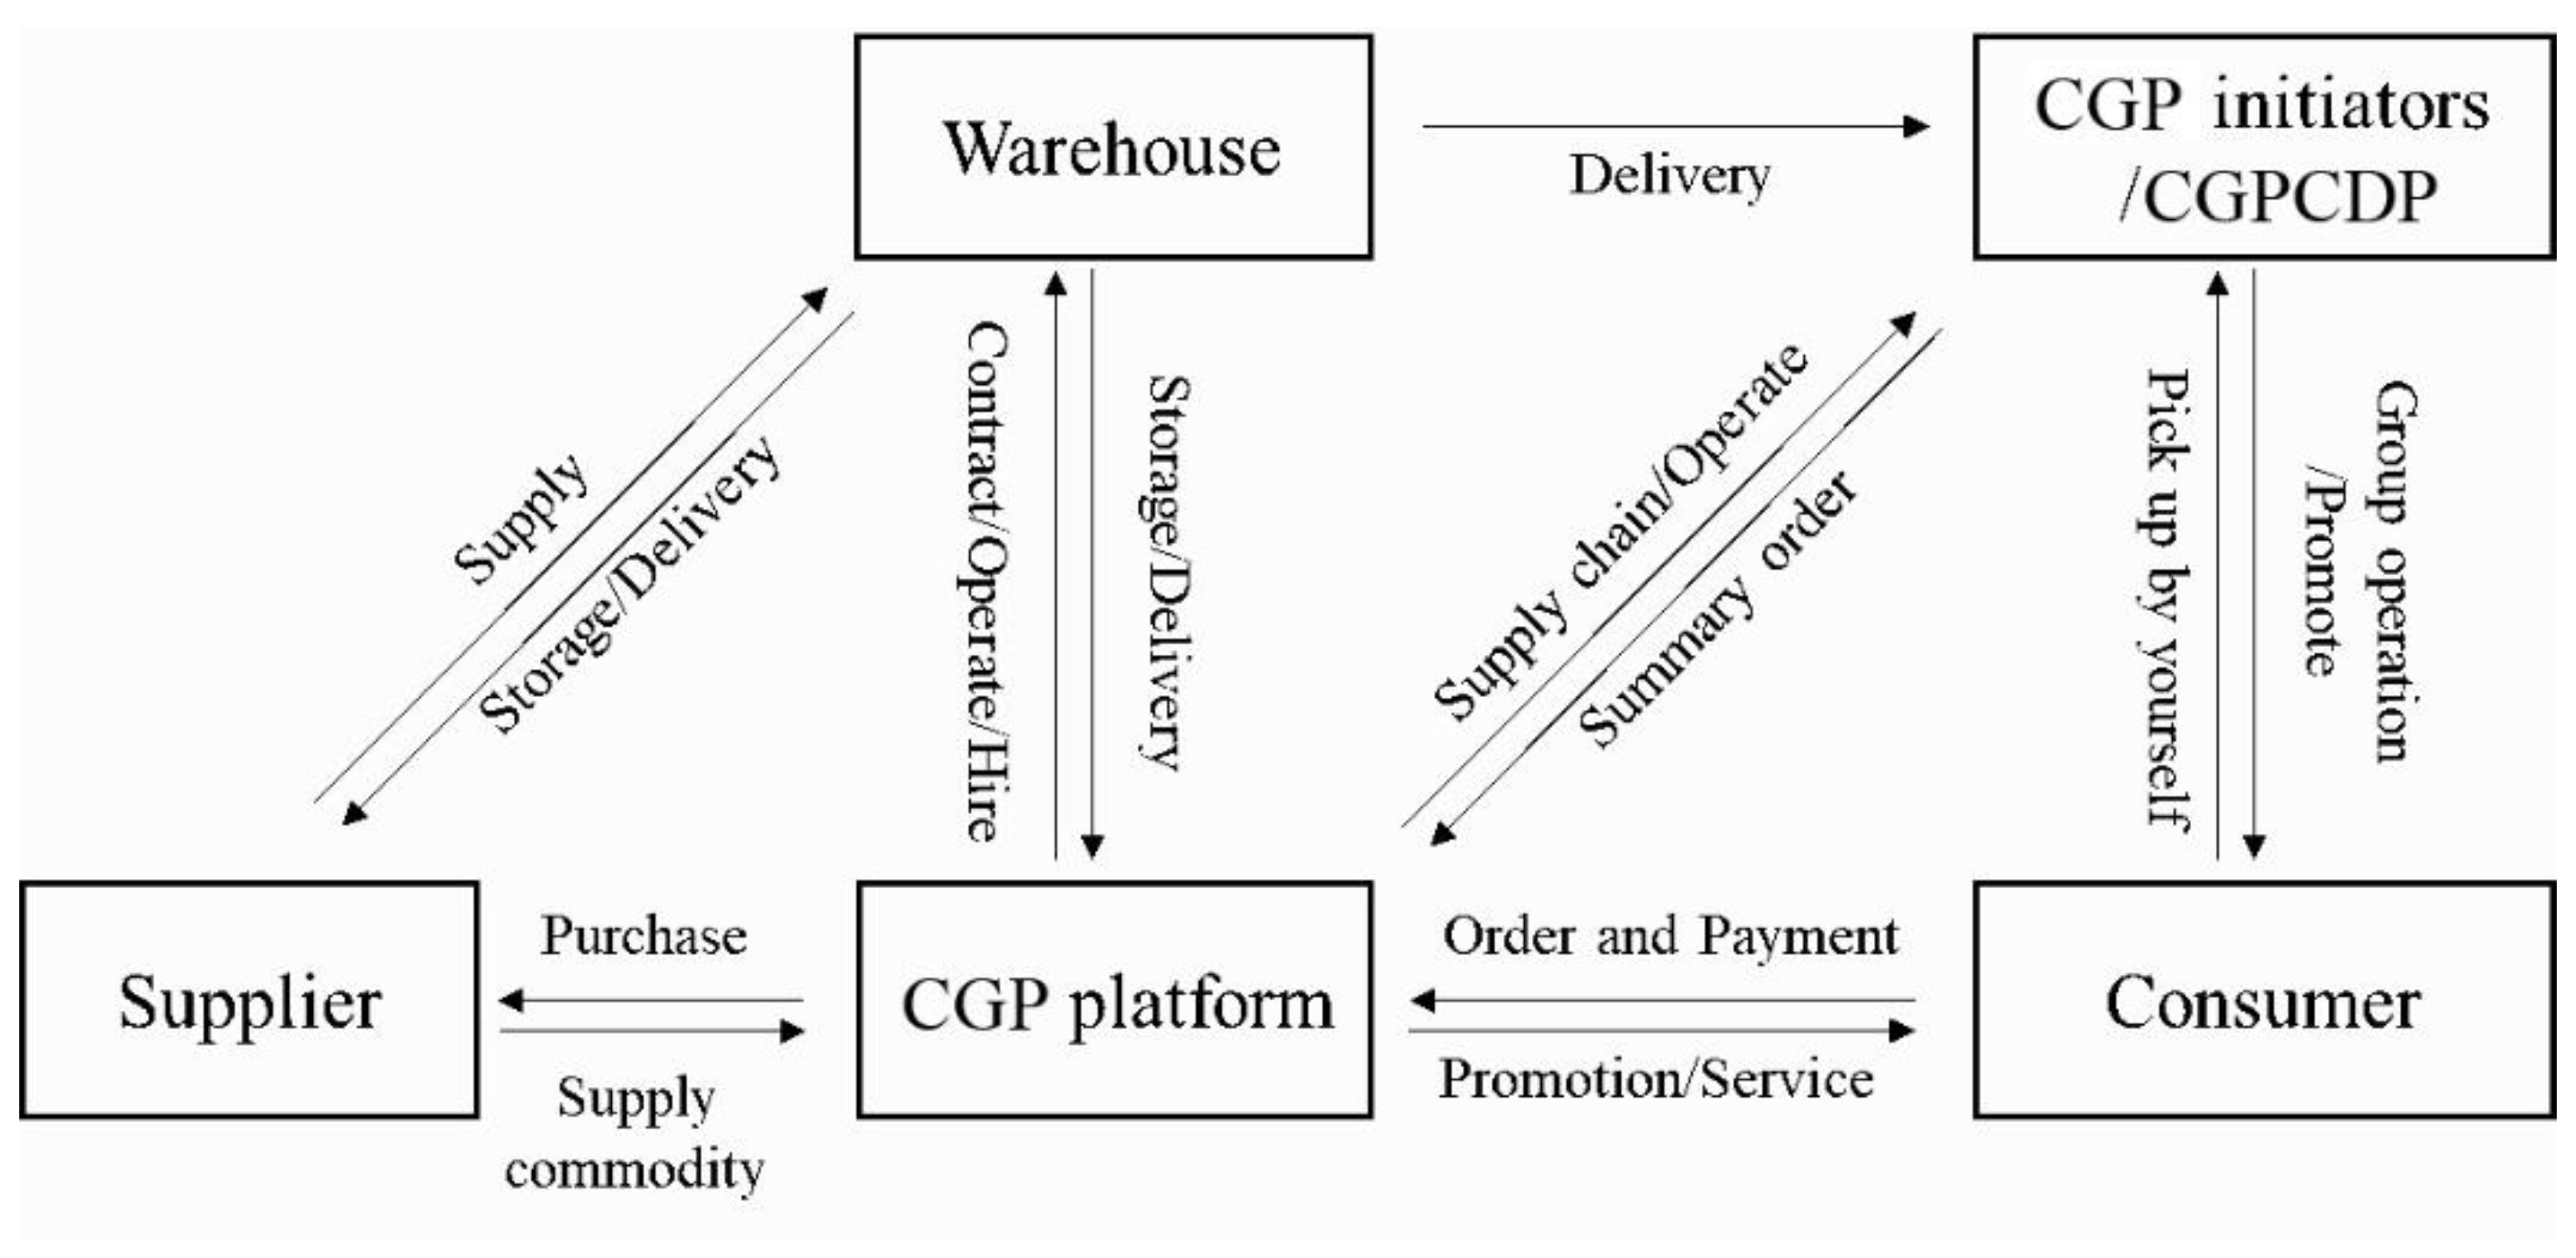
Figure 4.
Distribution of CGPCDPs.
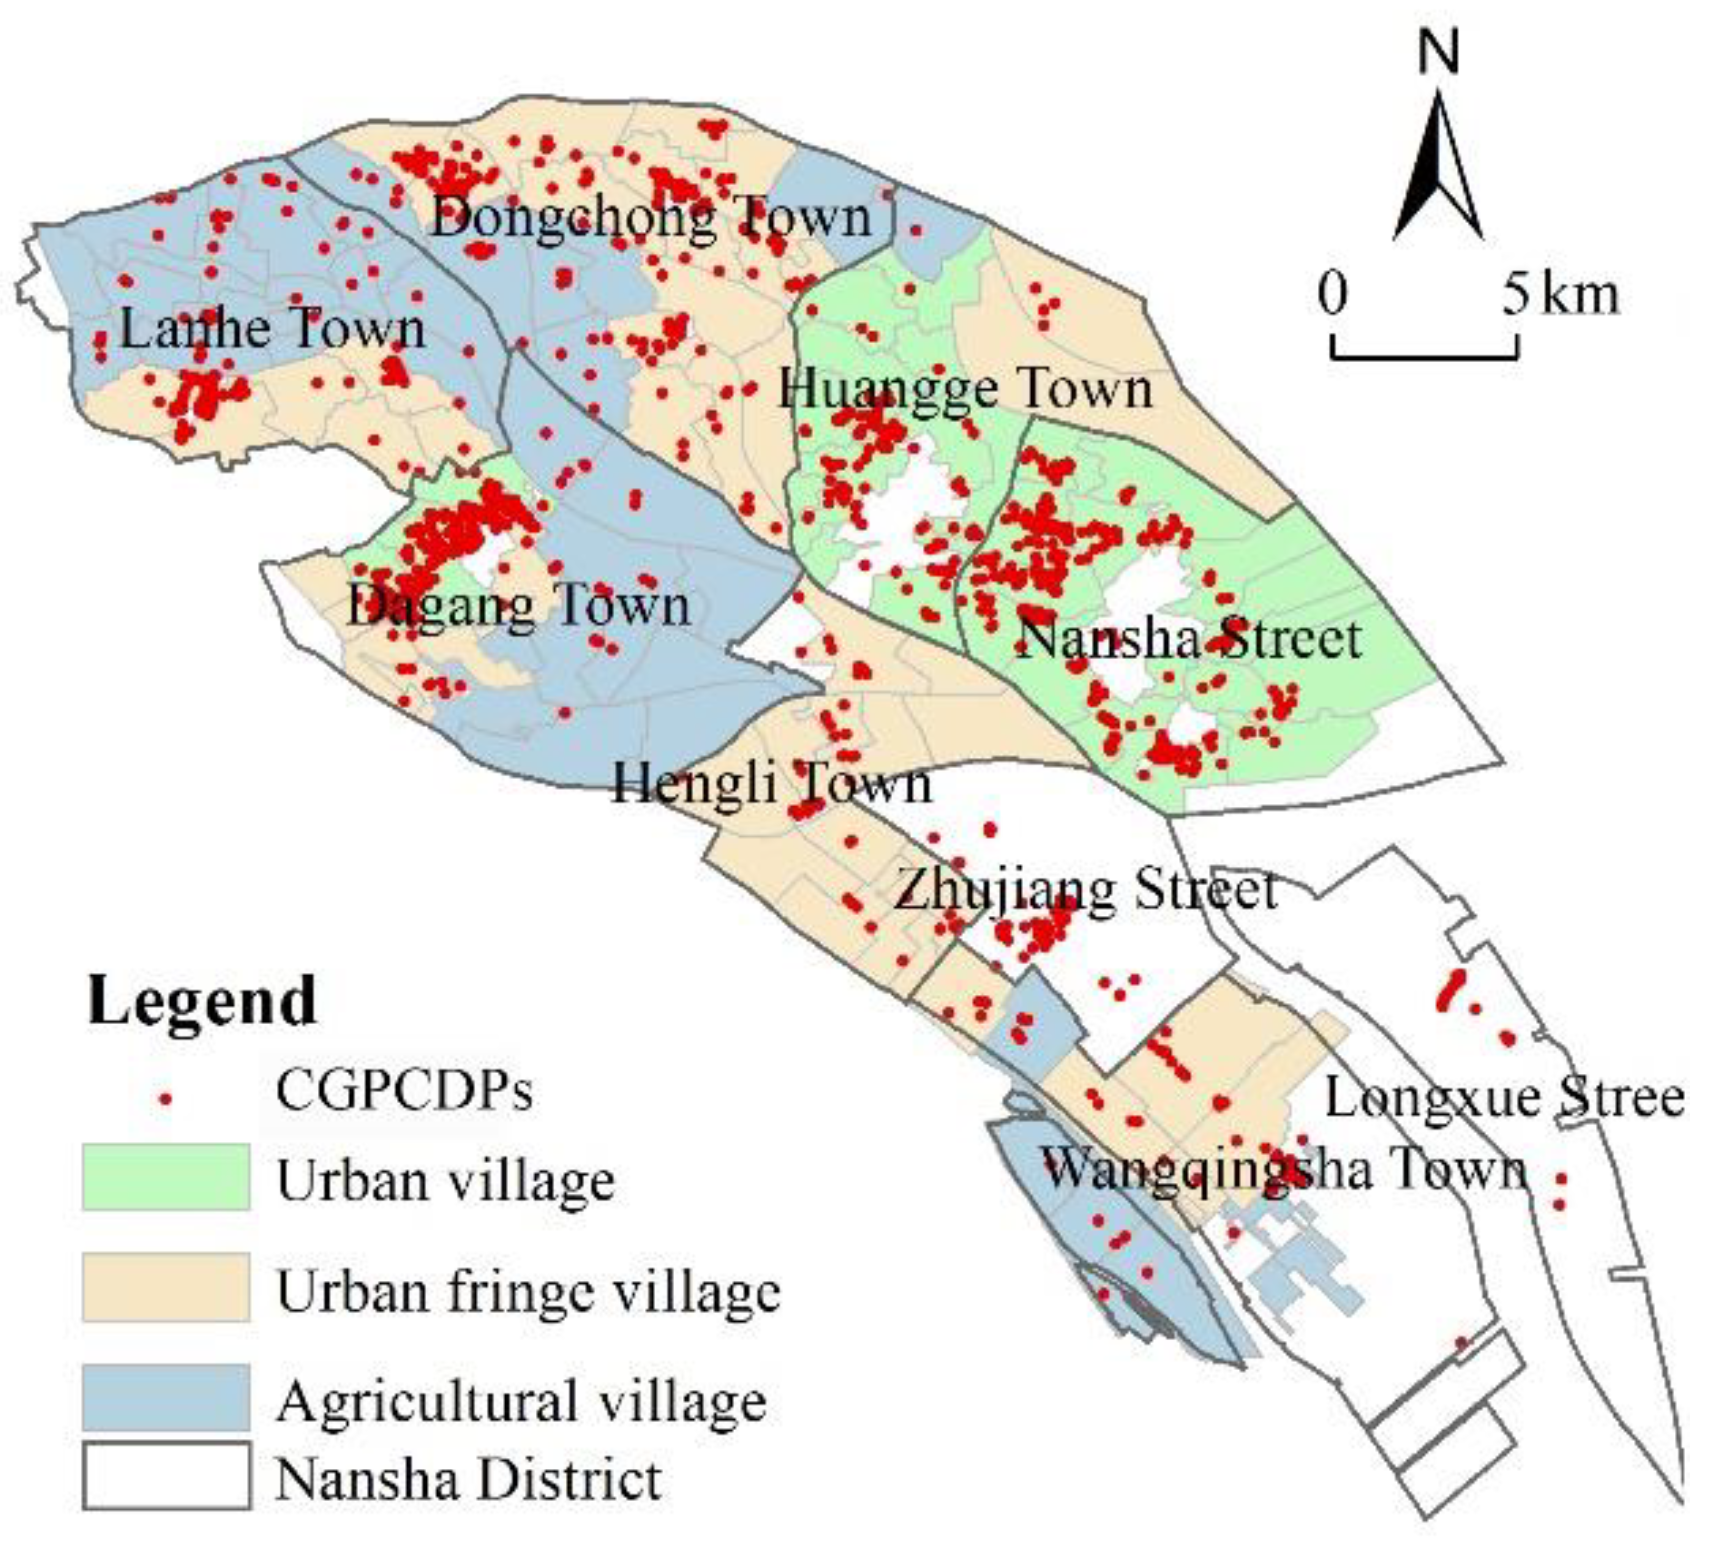
Figure 5.
Distribution of CGPCDPs for different support types.
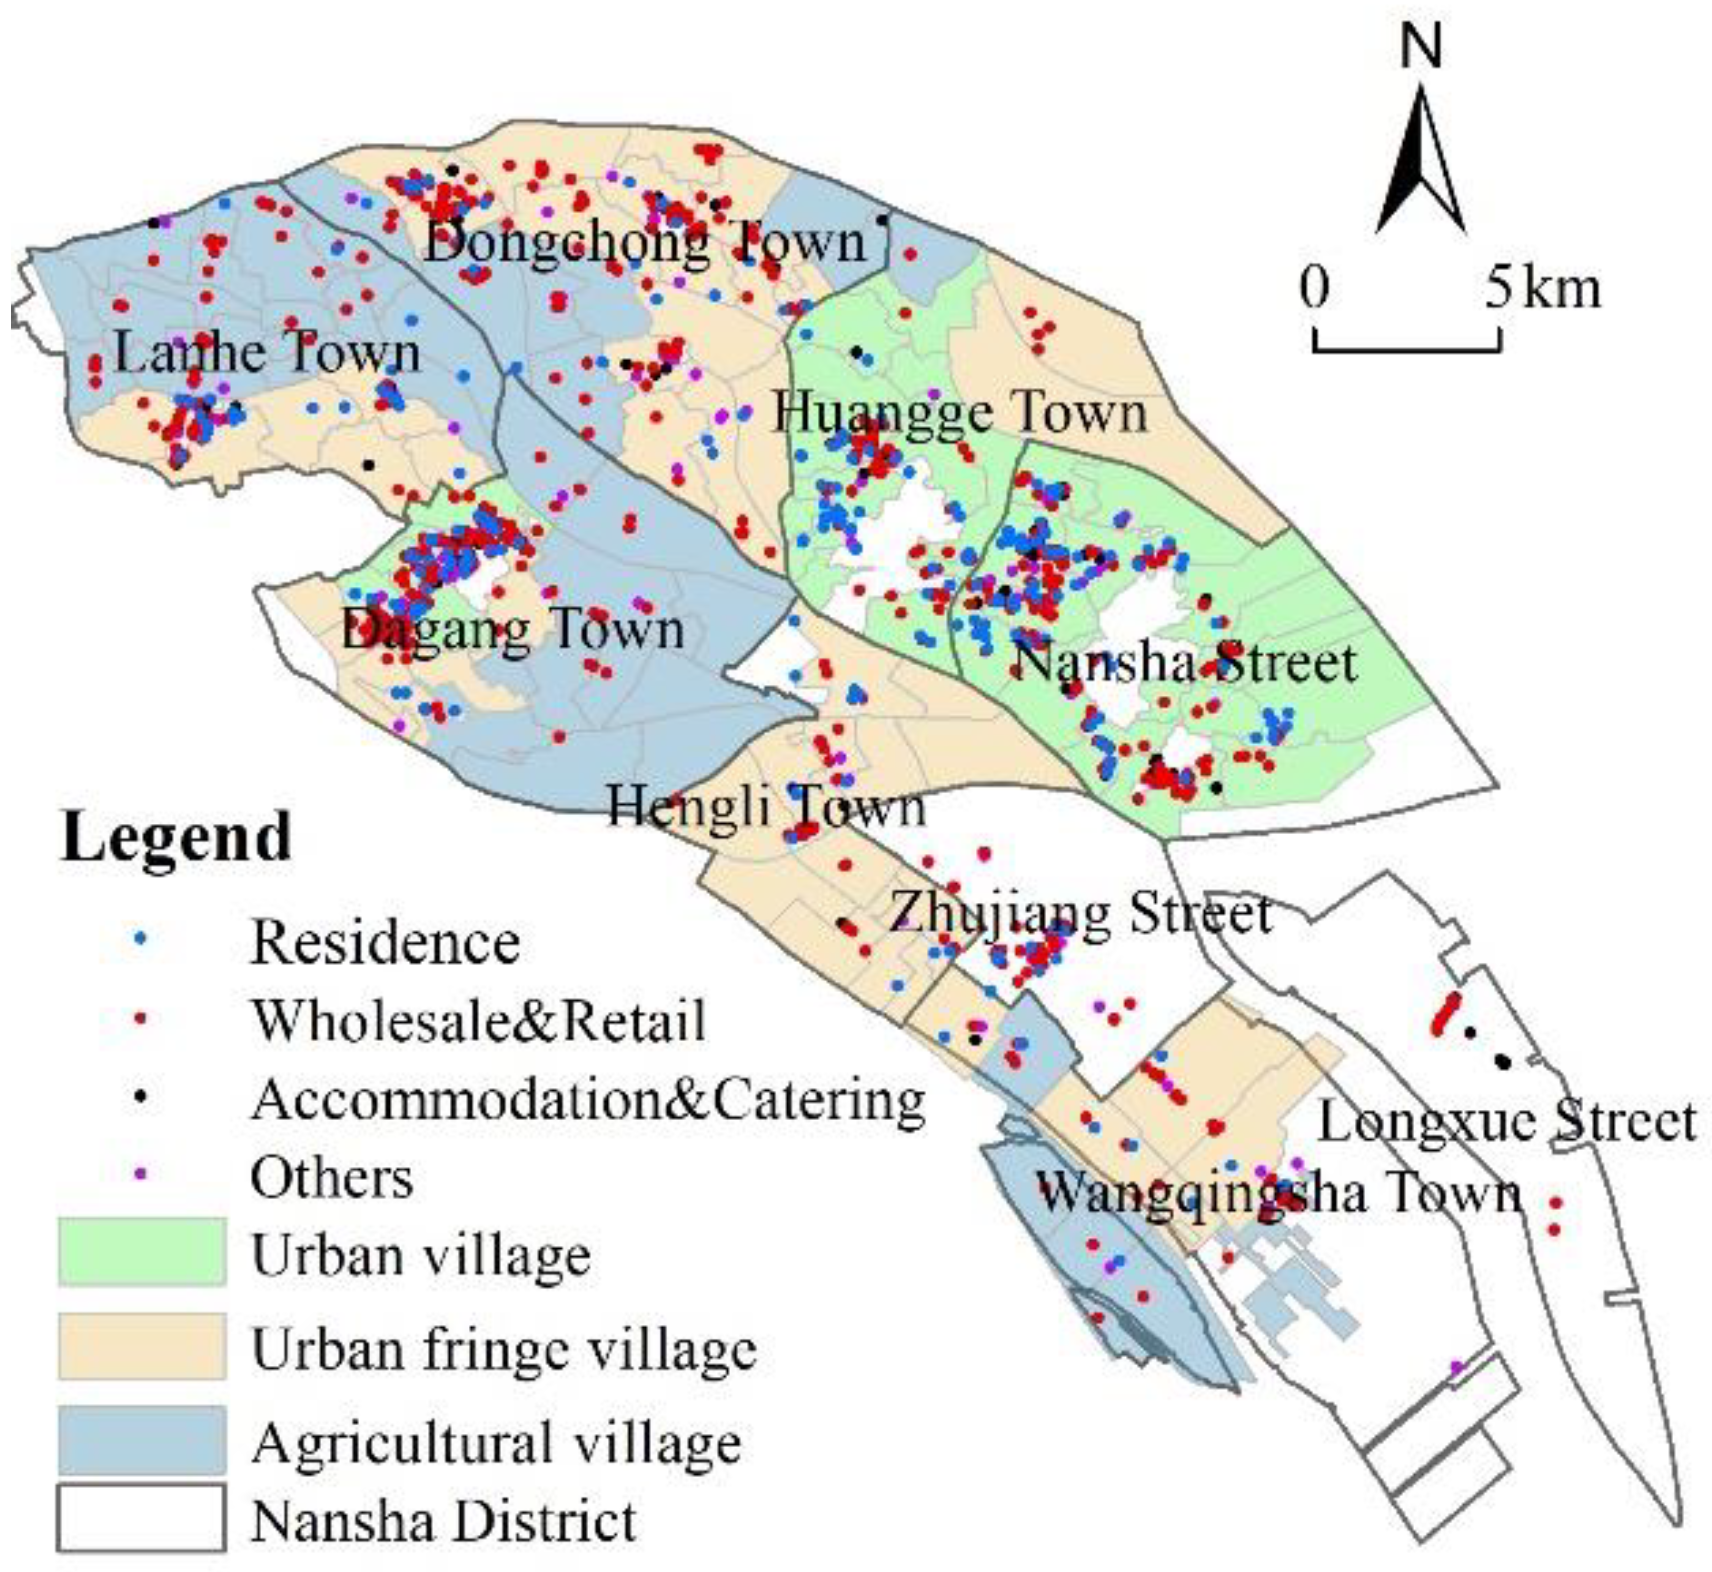
Figure 6.
Standard deviational ellipse diagram of CGPCDPs.
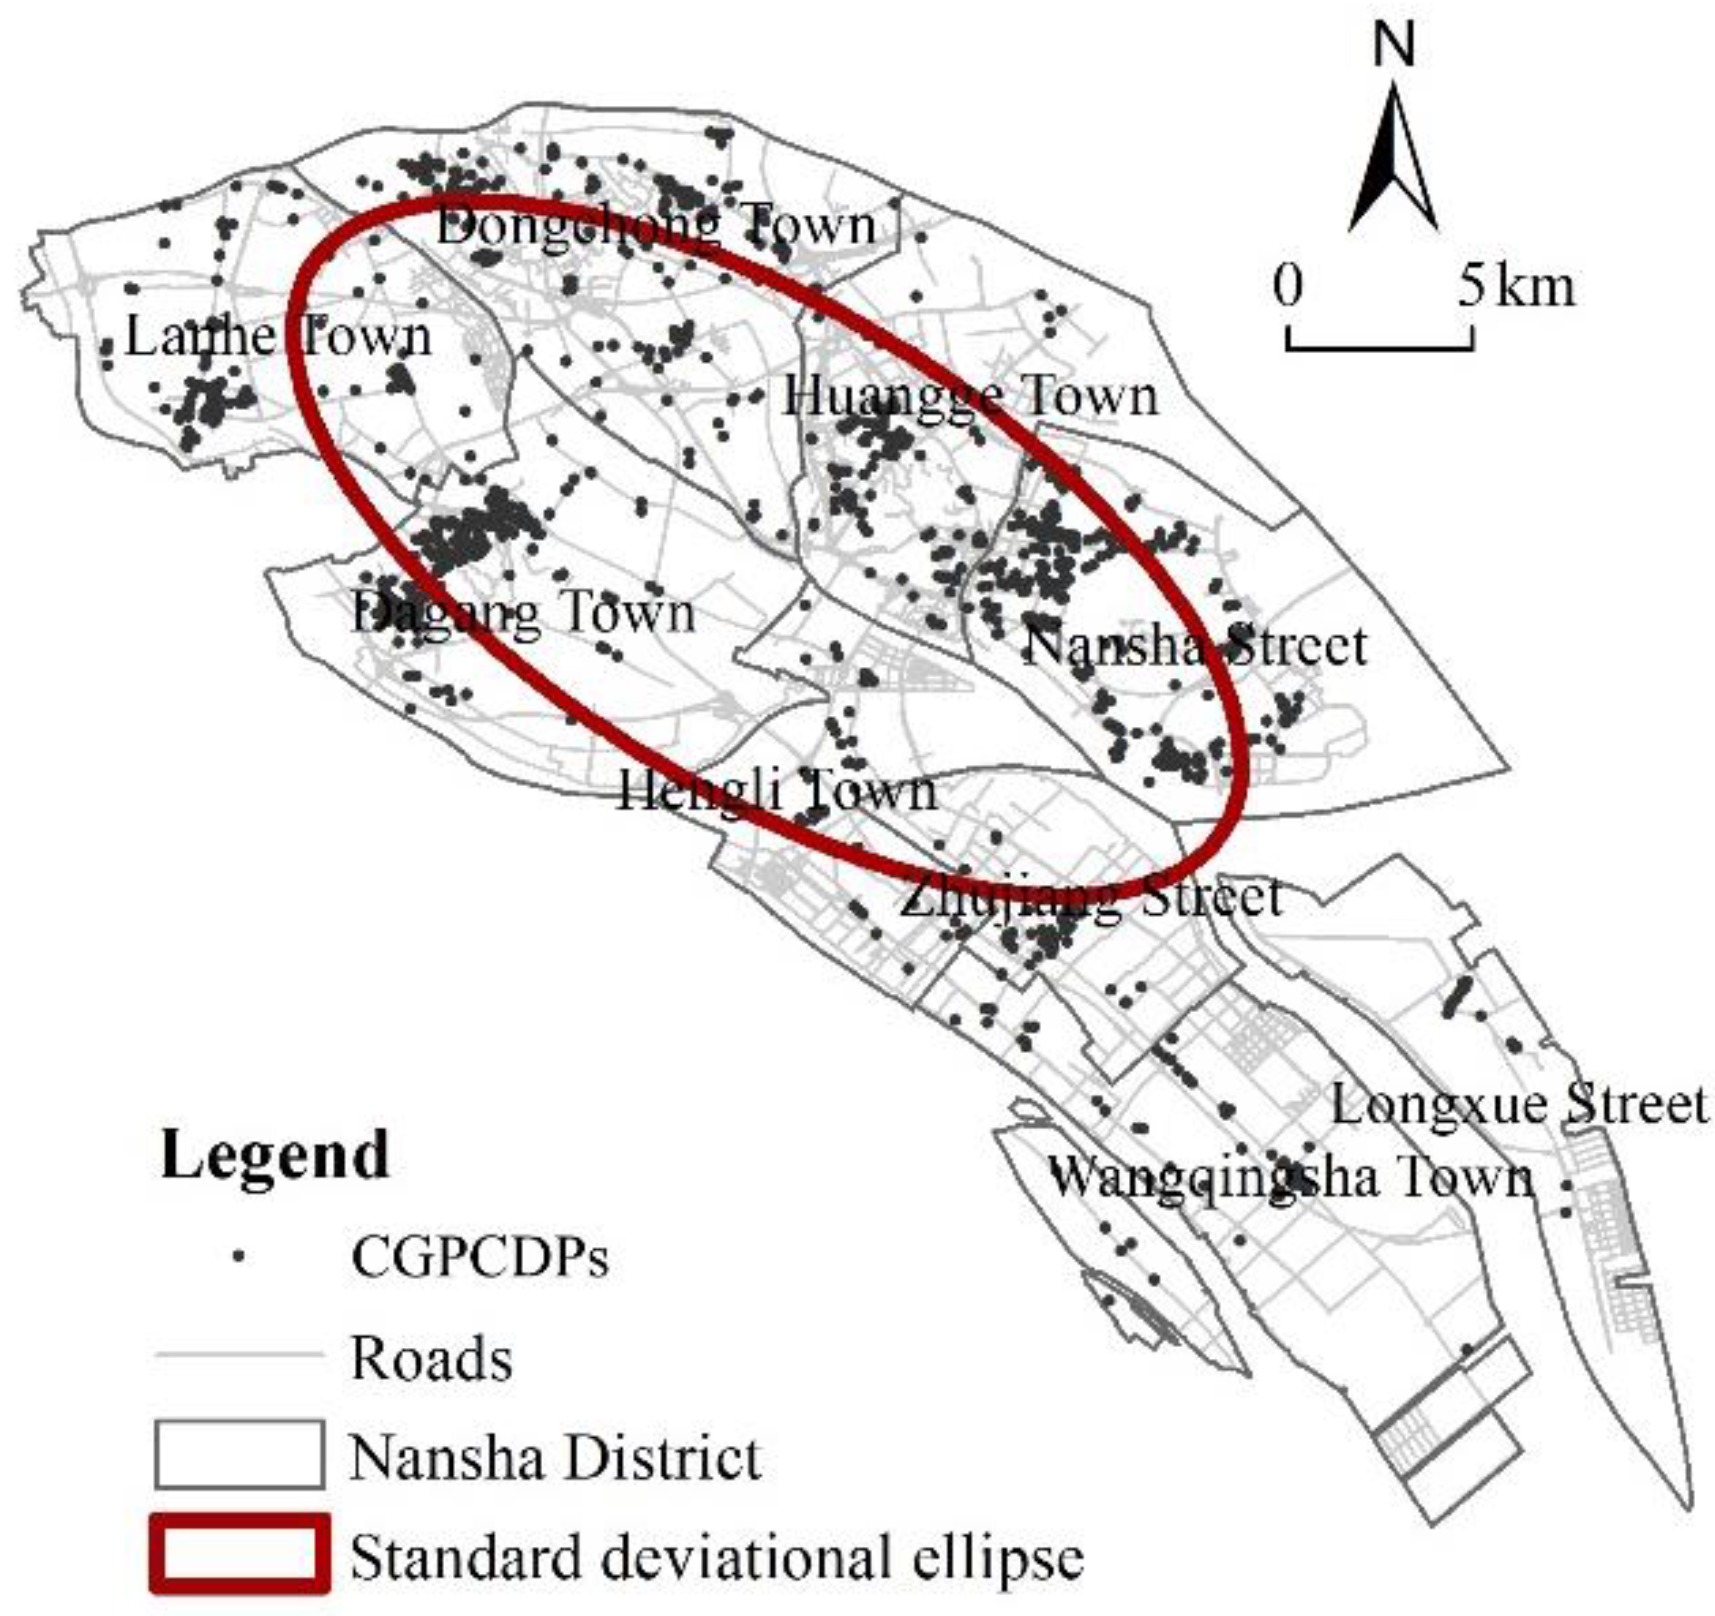
Figure 7.
Kernel density analysis of CGPCDPs.
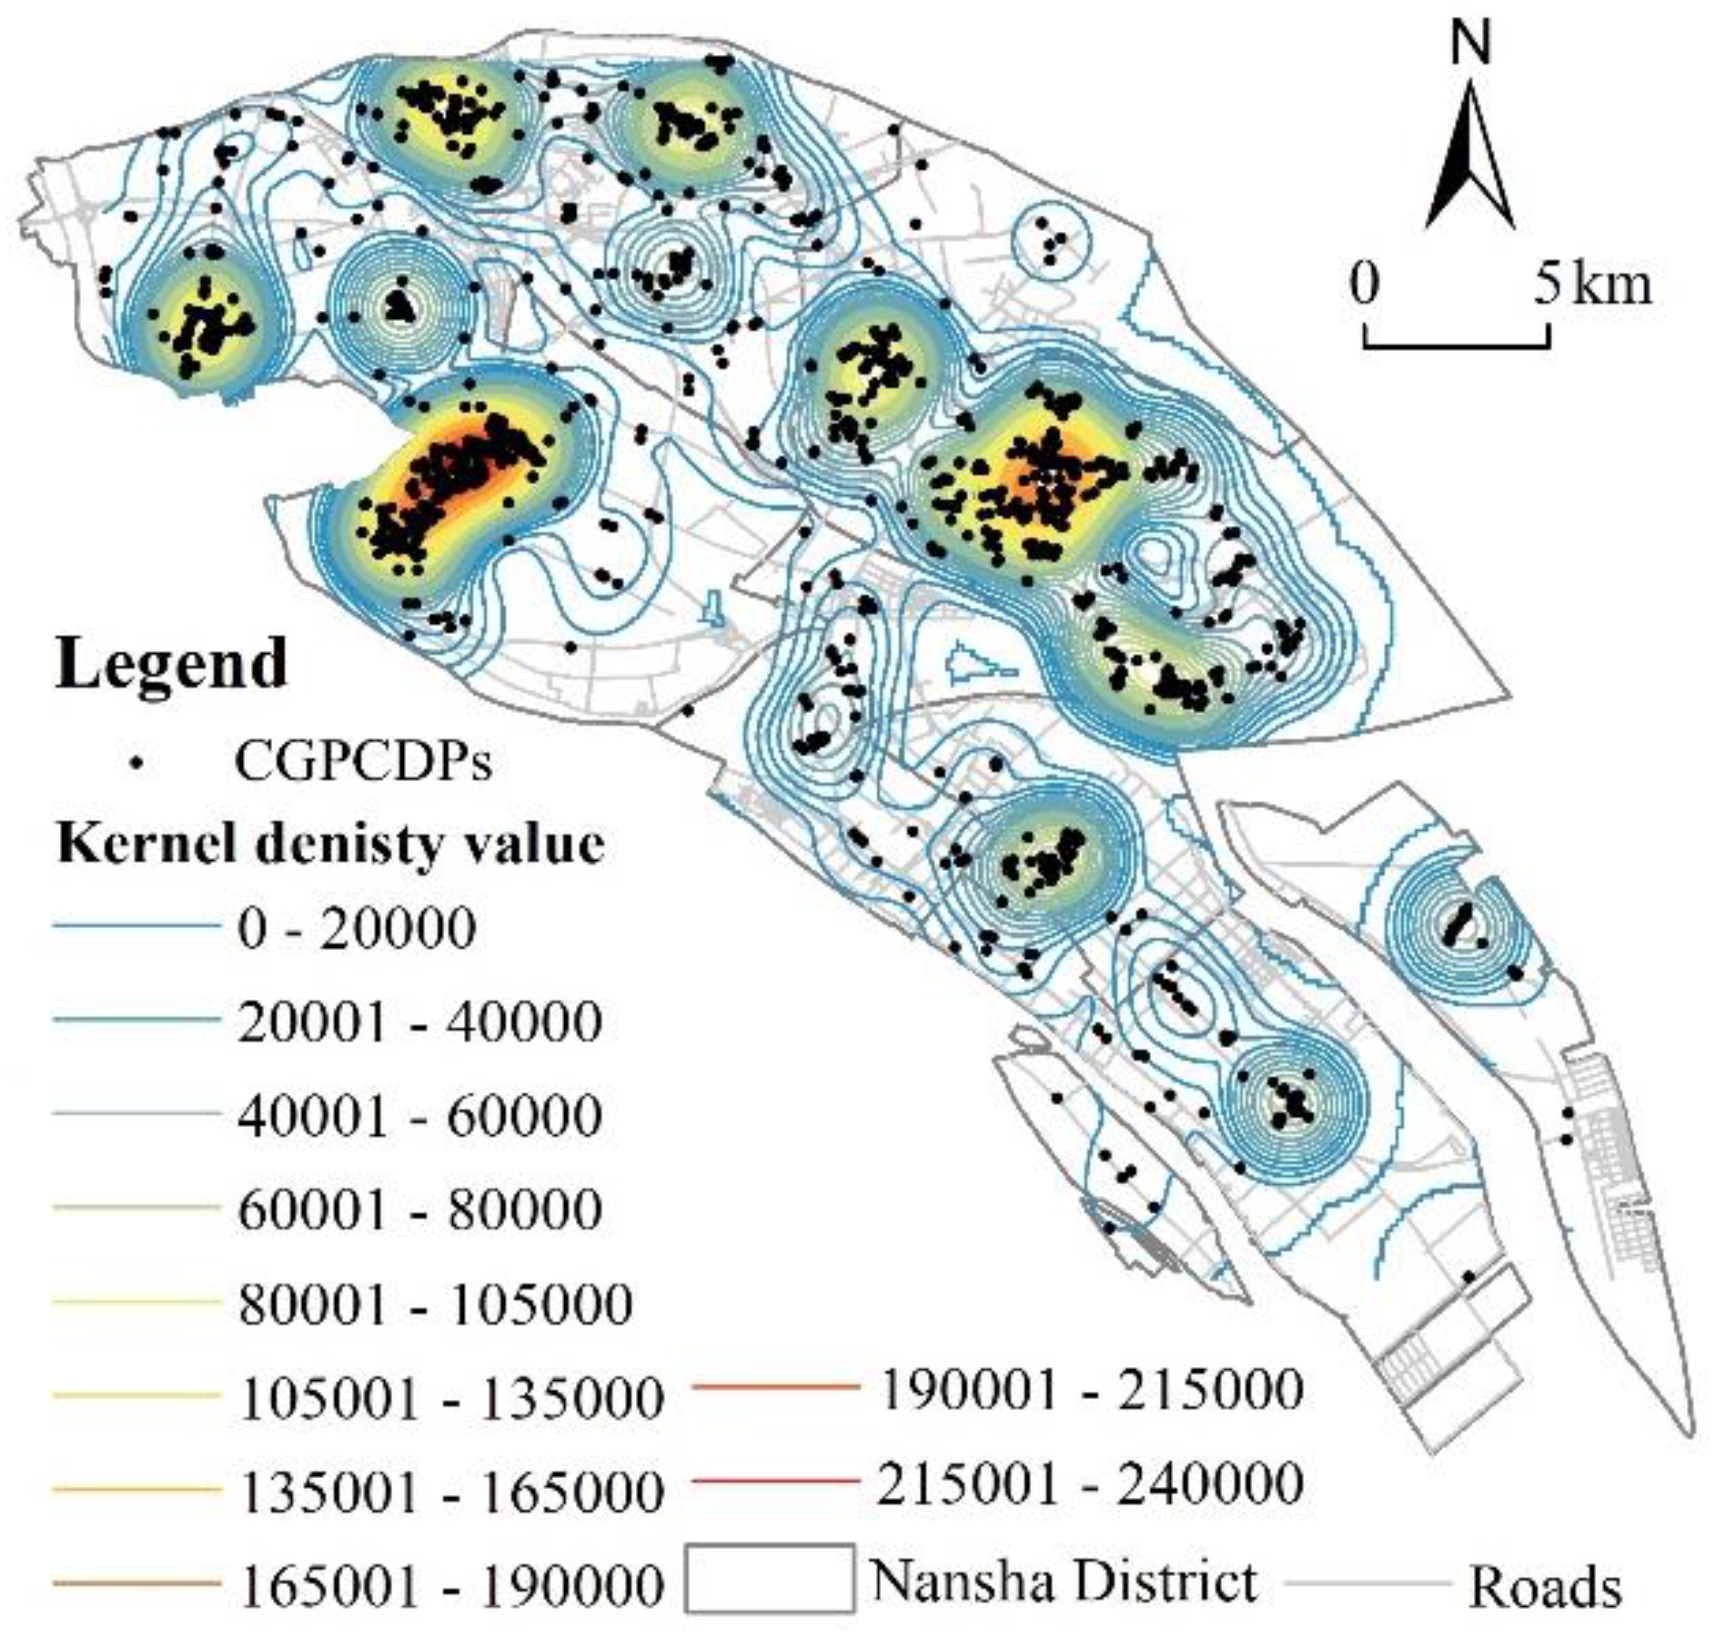
Figure 8.
Meso-micro distribution of CGPCDPs.
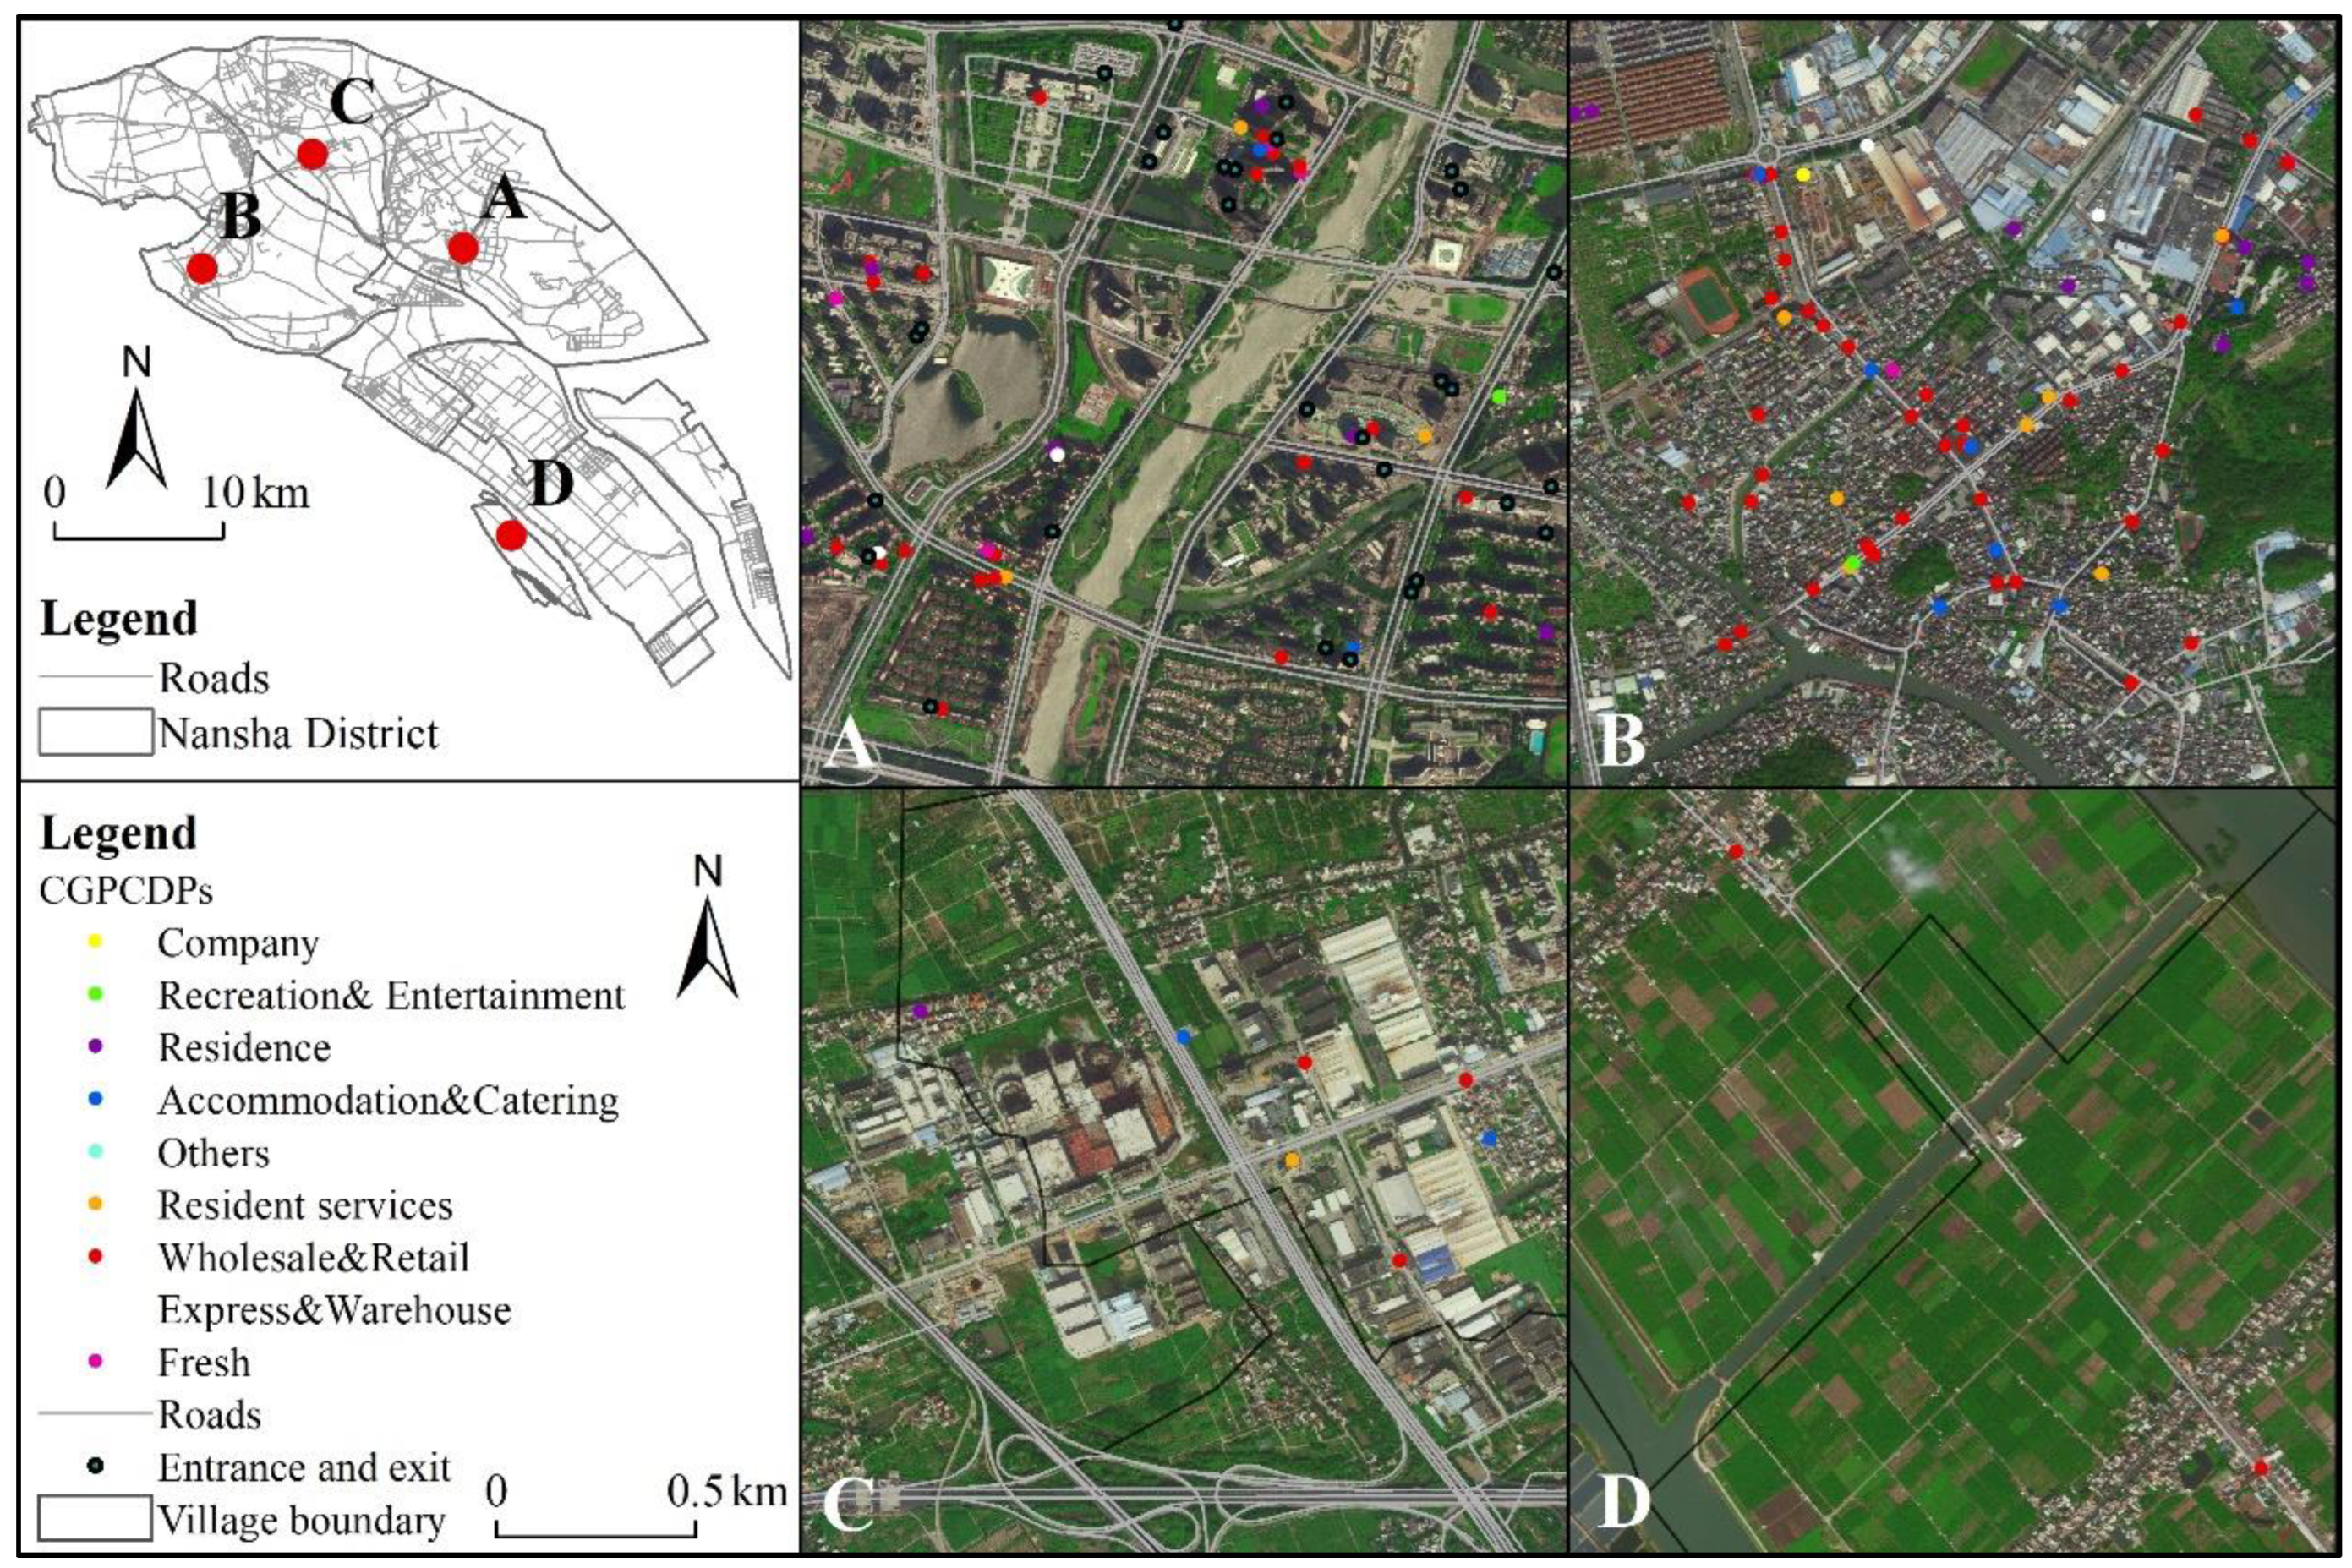
Figure 9.
Spatial distribution of regression coefficients of influencing factors of CGPCDPs based on MGWR model.
Figure 9.
Spatial distribution of regression coefficients of influencing factors of CGPCDPs based on MGWR model.
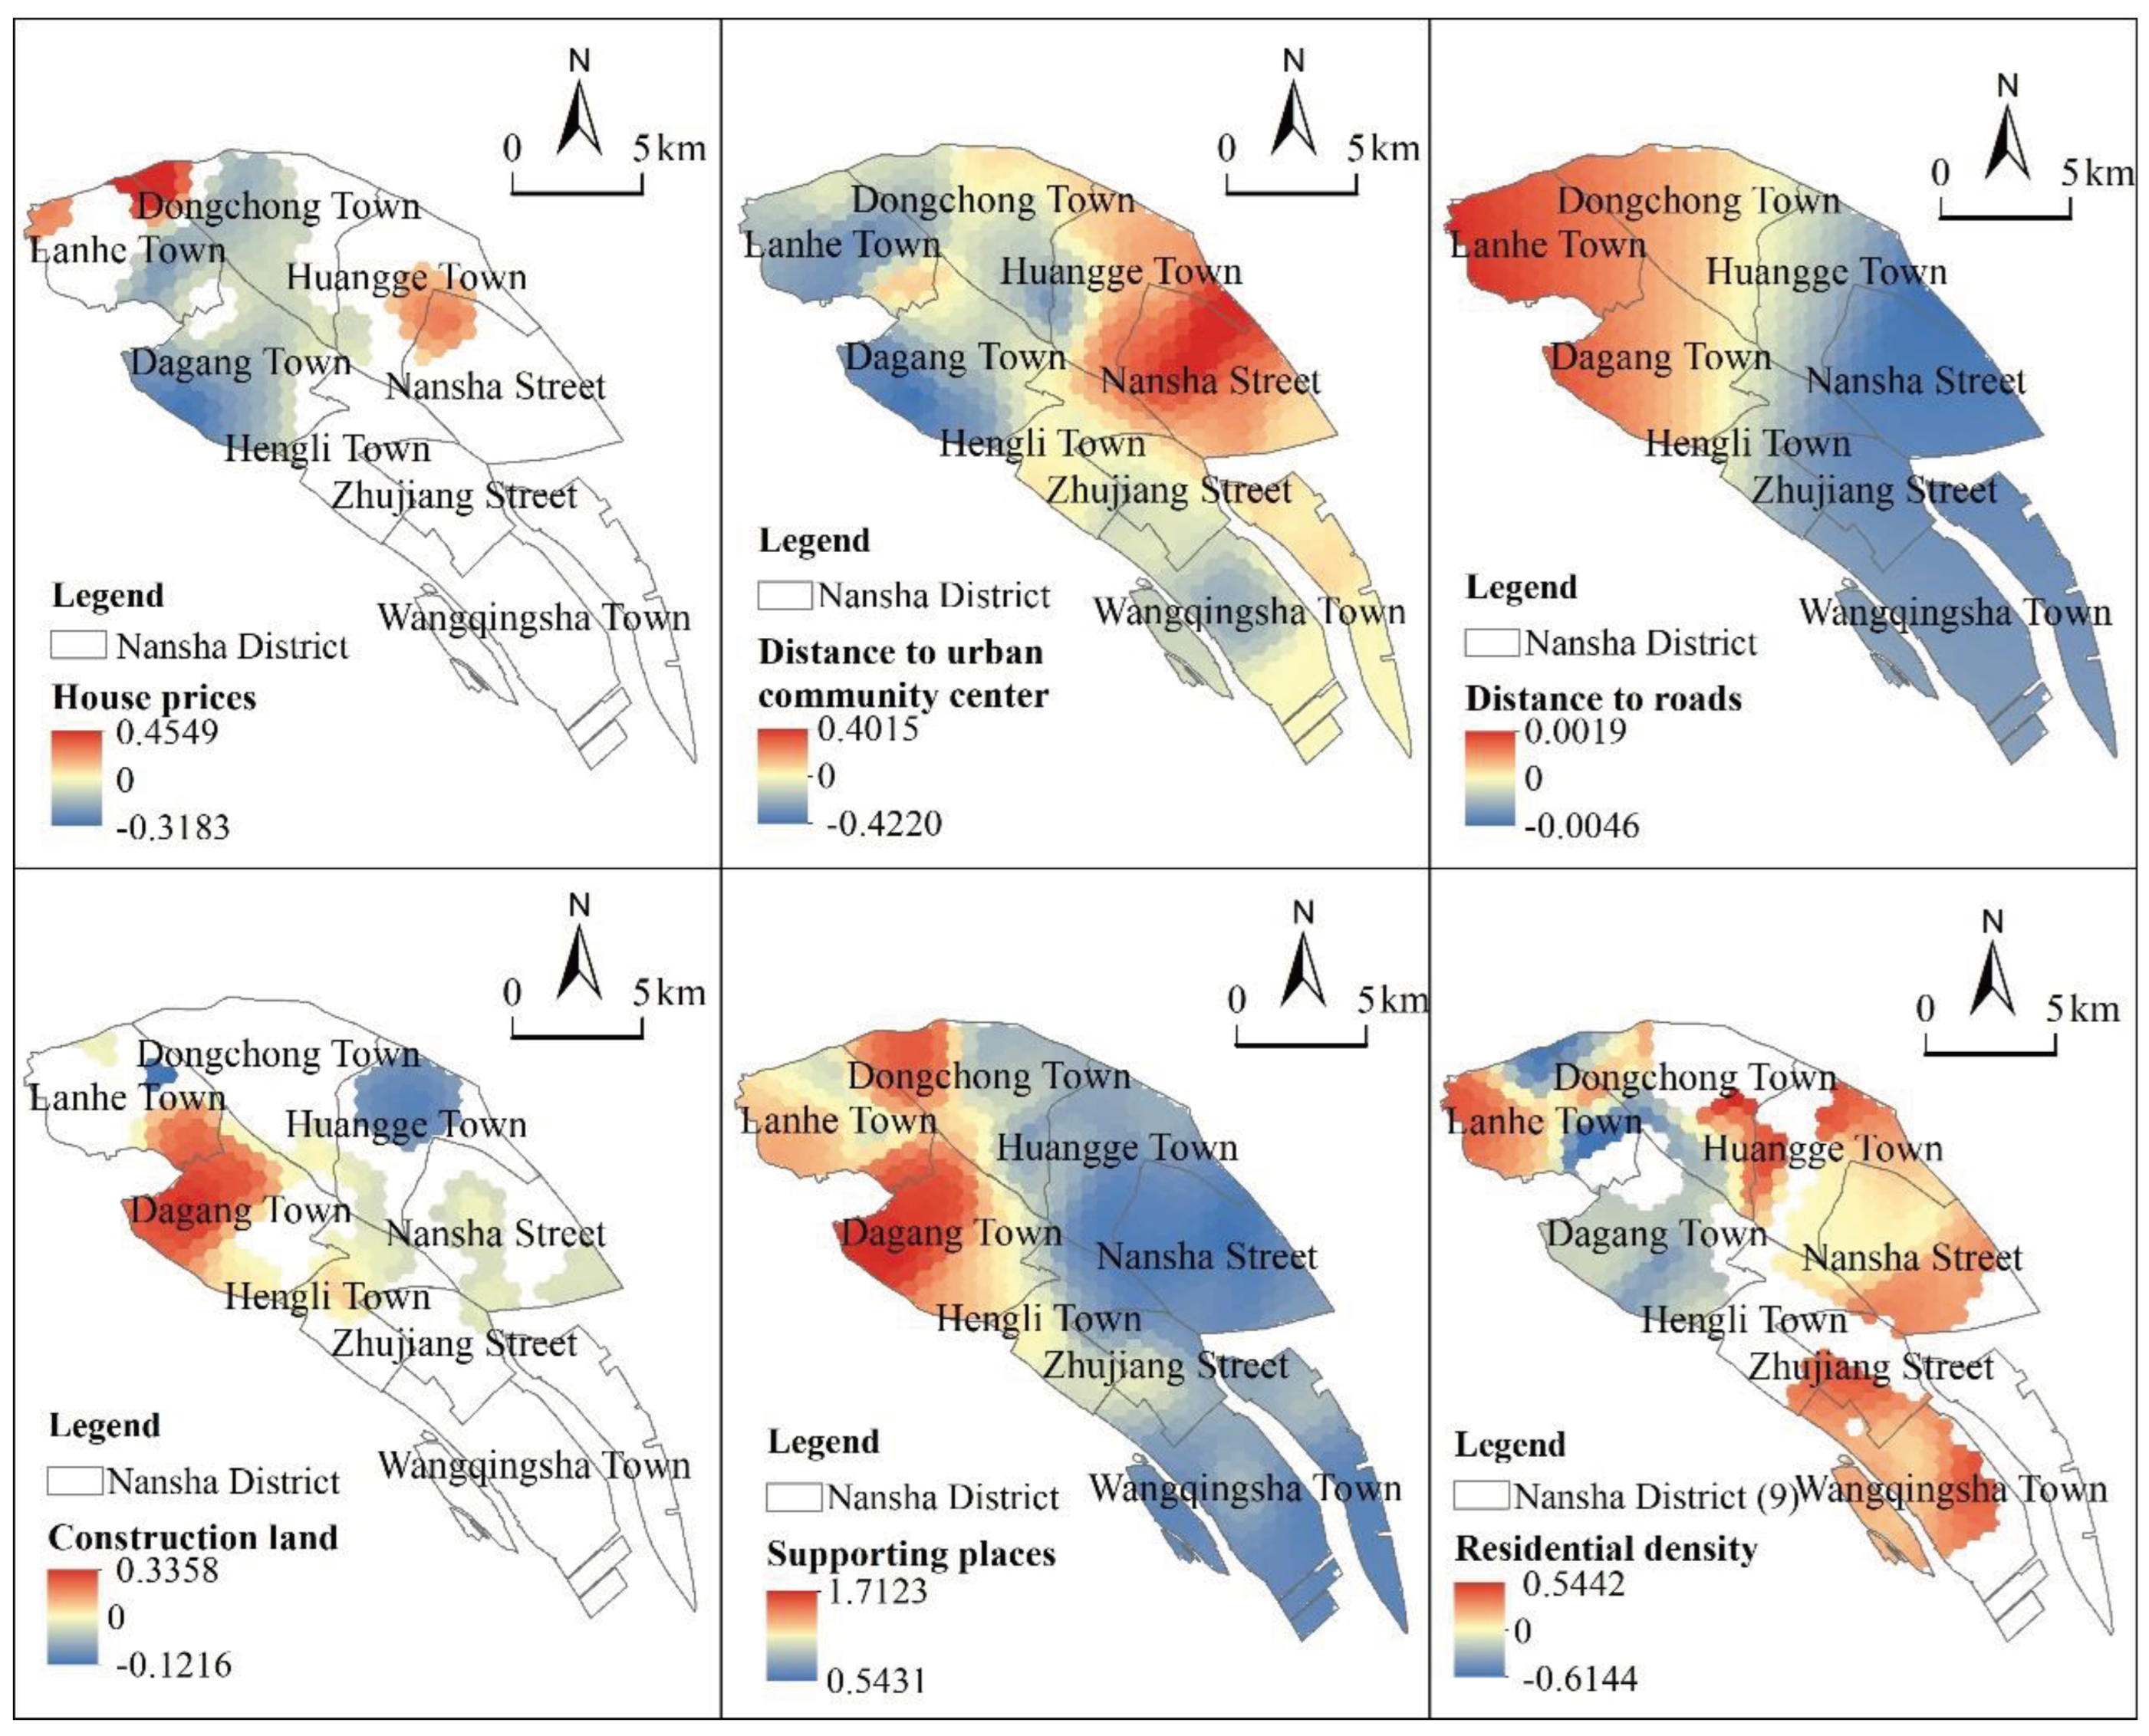

Table 1.
Comparison between PP and CGBPP.
| PPs | CGPCDPs | |
|---|---|---|
| Package type | Various types of packages: envelopes, fresh products, groceries, Electrical appliances | Fresh products: fruits, vegetables, meat |
| Storage time | Three to seven days | One day |
| Operating pattern | Cooperation and self-operation | Cooperation |
| Refrigeration demand | Yes/No | Yes |
| Quantity | One pickup point for multiple communities | Multiple pick-up points for one community |
| Service object | Community, school, commercial district | Community |
Table 2.
Categories of Community Group Purchasing Initiators in Nansha District.
| Category | Shopkeeper | Resident | Express Stationmaster |
Company Owner | Residential Property Workers | Others | ||||||
|---|---|---|---|---|---|---|---|---|---|---|---|---|
| Sex | Male | Female | Male | Female | Male | Female | Male | Female | Male | Female | Male | Female |
| Number | 433 | 586 | 77 | 156 | 21 | 27 | 16 | 11 | 5 | 7 | 6 | 8 |
| Total | 1019 | 233 | 48 | 27 | 12 | 14 | ||||||
| Ratio | 75.31% | 17.22% | 3.55% | 2.00% | 0.89% | 1.03% | ||||||
Table 3.
Support types of CGPCDPs in Nansha District.
| Category | Support Types | Quantity | Ratio |
|---|---|---|---|
| Wholesale& Retail | Convenience store, Clothing store, Store, Stationery shop, et al. | 751 | 55.51% |
| Resident Services | Printing shop, Photo studio, Nursery, Laundry, et al. | 67 | 4.95% |
| Accommodation& Catering | Snack bar, Milk tea shop, Bakery, Hotel, et al. | 119 | 8.80% |
| Express& Warehouse | Cainiao Station, SF Express, Storehouse, et al. | 65 | 4.80% |
| Fresh stores | Vegetable shop, Fruit shop, et al. | 69 | 5.10% |
| Recreation& Entertainment | Internet café, Beauty shop, Lottery station, et al. | 22 | 1.63% |
| Residence | Commodity Housing, Self-built house | 244 | 18.03% |
| Company | Company | 10 | 0.74% |
| Others | Door post, Parking lot, Driving school, et al. | 6 | 0.44% |
Table 4.
Types of the targeted service objects CGPCDPs in Nansha District.
| Category | Community | Industry Area | School | Enterprise | Government | Scenic Spot |
|---|---|---|---|---|---|---|
| Number | 1189 | 126 | 8 | 25 | 4 | 1 |
| Ratio | 87.88% | 9.31% | 0.59% | 1.85% | 0.30% | 0.07% |
Table 5.
Model variable description statistics.
| Category | Characteristic Variables | Variables | Variable Description |
|---|---|---|---|
| Dependent variable | CGPCDPs density | Y | The CGPCDP density value of each grid |
| Socioeconomic | Population density | X1 | The population density value of each grid |
| House prices | X2 | House prices of each grid | |
| Traffic &Location | Road network density | X3 | The road network density value of each grid |
| Distance to urban community center | X4 | Distance from each grid to the nearest urban community center | |
| Distance to roads | X5 | Distance from each grid to the nearest main road | |
| Traffic station density | X6 | Bus and subway station density value of each grid | |
|
Space &Environment |
Construction land | X7 | The construction land density value of each grid |
| Supporting places | X8 | Main supporting places of CGPCDPs density value of each grid | |
| Residential density | X9 | Communities and villages density value of each grid |
Table 6.
Comparison of fitting results of OLS, GWR and MGWR models.
| Model | R2 | Adjusted R2 | RSS | AICc |
|---|---|---|---|---|
| OLS | 0.818 | 126 | 133.949 | 855.270 |
| GWR | 0.981 | 0.973 | 14.370 | -253.349 |
| MGWR | 0.985 | 0.982 | 10.892 | -648.808 |
Table 7.
Local variable coefficients of MGWR model.
| Variable | Bandwidth | Mean | STD | Min | Median | Max | p-Value |
|---|---|---|---|---|---|---|---|
| X1 | 737.000 | 0.062 | 0.001 | 0.060 | 0.061 | 0.064 | 0.000** |
| X2 | 43.000 | -0.024 | 0.097 | -0.318 | -0.013 | 0.455 | 0.000** |
| X3 | 737.000 | 0.000 | 0.001 | -0.001 | -0.000 | 0.001 | 0.397 |
| X4 | 43.000 | -0.048 | 0.165 | -0.422 | -0.045 | 0.401 | 0.027* |
| X5 | 737.000 | -0.002 | 0.002 | -0.005 | -0.003 | 0.002 | 0.014* |
| X6 | 44.000 | 0.107 | 0.164 | -0.182 | 0.083 | 0.855 | 0.397 |
| X7 | 45.000 | 0.045 | 0.083 | -0.122 | 0.025 | 0.336 | 0.000** |
| X8 | 43.000 | 0.931 | 0.322 | 0.543 | 0.805 | 1.712 | 0.000** |
| X9 | 43.000 | 0.202 | 0.233 | -0.614 | 0.255 | 0.650 | 0.012* |
| Notice:** and * are significant at the level of 1% and 5% respectively | |||||||
Disclaimer/Publisher’s Note: The statements, opinions and data contained in all publications are solely those of the individual author(s) and contributor(s) and not of MDPI and/or the editor(s). MDPI and/or the editor(s) disclaim responsibility for any injury to people or property resulting from any ideas, methods, instructions or products referred to in the content. |
© 2024 by the authors. Licensee MDPI, Basel, Switzerland. This article is an open access article distributed under the terms and conditions of the Creative Commons Attribution (CC BY) license (http://creativecommons.org/licenses/by/4.0/).
Copyright: This open access article is published under a Creative Commons CC BY 4.0 license, which permit the free download, distribution, and reuse, provided that the author and preprint are cited in any reuse.


