
Submitted:
27 March 2024
Posted:
28 March 2024
You are already at the latest version
Abstract
Background and objectives: sickle cell disease is the most common hemoglobinopathy in the world. It is considered to be a real public health problem. Sickle cell patients are subjected to several factors causing inflammation such as iron metabolism. The study aimed to look for inflammation in children with sickle cell disease in Cameroon, identify the factors associated with inflammation, and raise the consequences for the patient including the iron profile and the profile of the hemogram. Materials and methods: We conducted an analytical cross-sectional study for 03 months. The sickle cell disease patients coming and/or followed at the Hematology Department of the Regional Hospital of Bafoussam and the Central Hospital of Yaoundé have been recruited. The exploration of inflammation was made by determining CRP, IL6, and ferritin concentrations. The hematological parameters and iron profile were evaluated using standard methods. Statistical analysis of the data was performed; Univariate and multivariate logistic regression analyses allowed to identification of factors associated with inflammation in patients, using the statistical tool R version 4.1.1.. The proportions were compared with the chi-square test when the expected numbers were greater than 5 and the Fisher test when not. Results: The frequency of inflammation in the population was 42.3%. Hyperferritinemia was significantly greater (p<0.001) in patients with inflammation compared to the non-inflammatory patients (96.8% and 76.7% respectively). Patients with inflammation showed a significant elevation of iron parameters (p<0.05). In addition, ferritin and IL6 elevation were associated with inflammation during sickle cell disease respectively (Or = 4.96; 95% CI [1.15-36.42]; p=0.056) and (Or =6.23; 95% CI [1.43-45.96]; p=0.030). Conclusions: The elevated iron in plasma is an effect of inflammation in sickle cell patients. Hence the need of controlling inflammation and iron in the latter is necessary.
Keywords:
sickle cell anemia
; iron profile
; inflammation
; associated factors
1. Introduction
Sickle cell disease is an inherited, autosomal recessive affection characterized by the presence of abnormal hemoglobin (Hb S) in the blood. It is associated with multiple acute and chronic complications such as vaso-occlusive crises, acute anemia, splenic sequestration, and erythroblastopenia… [1]. It is among the most common monogenic diseases worldwide [2] and an estimated 312,000 people carrying SS hemoglobin are born worldwide each year, with the majority of these 236,000 births in sub-Saharan Africa [3]. sickle cell disease is a real public health problem because of its consequences and is a highly inflammatory genetic disorder.
Several sources of inflammation are described in sickle cell patients, among other things the alteration of red blood cells containing hemoglobin S in the absence of oxygen, the high frequency of hemolysis in sickle cell patients who release their contents into the bloodstream which have a proactive action inflammatory, vaso-oclusive crises mainly favored in sickle cell patients by hypo-oxygenation of their tissues [4]. Other sources of inflammation have been described in sickle cell patients such as recurrent infections, particularly in children, and significant oxidative stress caused by an imbalance of free radicals-antioxidants in favor of free radicals. In sickle cell patients, during the inflammatory reaction, there is an overproduction of interleukin 6 which induces the synthesis of hepcidin, the central molecule of iron metabolism [4]. Hepcidin in serum shows a strong correlation with serum ferritin levels in patients with anemia associated with inflammatory conditions [5]. In sickle cell patients, the inflammation that causes elevation of serum iron is a risk factor for high oxidative stress [6]. Several studies report an elevation of the precursors of ferric metabolism in correlation with the dysregulation of its metabolism [6]. This is the case of Mangaonkar et al. in 2020 who reported significantly high hepcidin levels in sickle cell patients with iron overload unlike those without it [7]. They also reported positive and significant correlations between hepcidin and ferritin with elevated erythroferone levels in the ion-chelating group [7]. Moreover, Karafin et al. during a cohort in 2016 demonstrated iron overload in sickle cell patients positively correlated with inflammation (p=0.0002) [8]. In addition, Bandeira et al. (2014) and other authors reported a significant elevation of pro-inflammatory cytokines in sickle cell patients [9,10,11].
Children with sickle cell disease do have not strong enough immunity [12]; And coupled with its genetic condition, this is a fertile ground for inflammation to set in. The inflammation in the latter is an aggravating factor in the pathophysiology of the disease because it is involved in the dysregulation of iron metabolism; The iron produced is an important factor in aggravating the pathophysiology of the disease, including oxidative stress and cardiovascular disease [13,14]. This study, therefore, proposes to describe inflammation in children with sickle cell disease in Cameroon, identify the factors associated with inflammation, and raise the consequences for the patient including the iron profile and the profile of the hemogram.
2. Materials and Methods
2.1. Recruitment of Participants
The population of the study was recruited from the Bafoussam Regional Hospital and the Yaoundé Central Hospital. The sample population consisted of sickle cell patients in the stationary phase interned and/or followed in the Hematological Department of the above-mentioned hospitals. A total of 149 sickle cell patients were included in the study. They were all above 0.5 years. The sample size was calculated using the Formula of Lorentz which takes into consideration the prevalence of homozygous SS patients in Cameroon (2–3 %) and the frequency of inflammation in Congolese sickle cell children (49%) as reported by Tshilolo et al. (2009)[15]. Pieces of information on the study were given to the selected potential participants and/or their legal guardians (if need be) in their first official language. For participants under the age of 07, the child’s permission to participate has been obtained from the parents. On the other hand, informed consent for children over 7 years of age was obtained on their own. Patients read and signed the informed consent form. For each participant, socio-demographic and clinical data were obtained and noted on a pre-structured data collection sheet. The study was approved by the ethical committee of the Centre’s Regional under reference number No E210/CRERSHC2021. Homozygous sickle cell (SS), male and female, above 0.5 years old, accepted to participate in the study were included. They were divided into two groups according to levels of inflammatory markers (CRP and Ferritin). All sickle cell patients with other pathologies namely hemolytic pathologies including G6PD deficiency, thalassemia, infections, and any other pathology likely to cause inflammation were not included in the study. Moreover, any sickle cell patient on iron supplementation or having undergone a blood transfusion less than 3 months old was not included in this study.
2.2. Sampling and Analysis
A volume of 5mL of blood was collected from participants separately into EDTA (Ethylene Diamine Tetra Acetic) and dry tubes. Each tube of the collected blood sample was sent to the Hematology and Medical Biochemistry laboratories of the University Hospital of Yaoundé on time for analysis.
The hematological parameters of blood samples were performed on the HumaCount 30TS hematology automaton. The blood count was systematically accompanied by blood smears to assess the quality of blood cells and the vital staining to classify cases of anemia and determine their origin. The slides colored with May Grunwald Giemsa and blue de cresyl brilliant were read under the ‘Irmerco’ binocular microscope. The results obtained were interpreted according to WHO’s usual values. Subsequently, quantitative electrophoresis was performed on alkaline agarose of hemoglobin in each blood patient to determine the proportion of different hemoglobin fractions according to the ‘HELLABIO protocol’. Once the migrations had been carried out, the quantification of the different fractions of the hemoglobin was done using a densitometer after staining with red culvert.
The diagnosis of inflammation in the population was made by determining the concentration of C-Reactive Protein according to the method of the ‘Genrui’ Kits, using the semi-automatic protein analyzer PA54 calibrated by magnetic card whose operating principle is nephelometry. The C-reactive protein (CRP) parameter was used as an inflammatory index because it is the major human acute-phase reactant and the most sensitive acute-phase protein reflecting inflammatory activity. It has been implicated in the prediction of morbidity and outcomes in chronic disease states [5]. Subsequently, we determined the concentration of interleukin 6 in patients according to the ‘Elabscience R’ kits using the ELISA Sandwich (Enzyme-Linked Immunosorbent Assay) principle. The analysis was done on an Elisa chain (ELx50TM Automated Strip Washer brand BIOTEK). The ferritin described below was also used to assess inflammation in patients.
The determination of the iron profile was done by determination of serum-free iron using the spectrophotometric method with the kits ‘Biolabo’ kits. The determination of transferrin was carried out according to the Human kits by immunoturbidimetric method while the concentration of the ferritin was proceeded through the protocol of the ‘CALBIOTECH’ kits whose principle is ELISA sandwich on an Elisa ELx50TM Automated Strip Washer chain brand BIOTEK. The Total Iron Binding Capacity (CTF) was deduced from the determination of transferrinemia by the formula: CTFT (mg/L)=transferrin (g/L)x1,395 [15]; while the Transferrin or Siderophilin Saturation Coefficient (TSC) was determined according to the formula CST (%)= (serum iron/CTFT)x100 [15] using Biolabo kits.
2.3. Data Management and Statistical Analysis
Inflammation was determined from quantitative methods and defined for CRP cut-off values >6mg/l and IL6 > 5pg/mL as defined by the test kits. From this, groups were defined as ‘inflamed and non-inflamed’. Ferritin threshold values ranged from 10-200 ng/mL. The data collected were saved in Microsoft Excel 2016 software. Statistical data analysis was performed using the statistical tool R version 4.1.1. The qualitative variables studied were presented as frequency while quantitative variables were presented as medians and their interquartile range (IQR) P25–P75. The proportions were compared with the chi-square test when the expected numbers were greater than 5 and the Fisher test when not. The Wilcoxon test was used to compare the median between different groups in our study population. Univariate and multivariate logistic regression analyses were used to identify factors associated with inflammation in sickle cell patients. All these tests were done at a risk threshold of α=5%.
3. Result
3.1. Distribution of Socio-Demographic and Clinical Phenotypes of Patients
During our study, 149 sickle cell patients were recorded. The median age of the population was 13 [4.00-13.0] (Q1-Q3). The sex ratio was 1.01 in favor of men to 50.3% of men (75/149) and 19.7% of women (74/149). 98% of the population is single. 10.5% of the population was on hydroxyurea intake. Table 1 shows the Distribution of socio-demographic and clinical phenotypes of all patients:
From the previously mentioned Table 1, it appears that the average BMI was 17.2±3.07; 65.77% of the population was thin. The median age of our participants is 9 [4,5,6,7,8,9,10,11,12,13]. Patients had a history of infectious crises (32.2%), a history of anemic attacks (52.3%), a history of cardiovascular disease (2.01%), and a history of vasooclusive seizures (54.4%).
3.2. Frequency of Inflammation in the Population
The following Figure 1 shows inflammation in the population:
From the figure above, The prevalence of inflammation in the population was 42%.
3.3. Distribution of Socio-Demographic and Clinical Phenotypes of Patients Depending on Inflammation
Table 2 presents the socio-demographic and clinical phenotypes of patients registered during the study period depending on inflammation.
It appears that inflammation does not significantly influence the clinical phenotypes of participants (p>0.05).
3.4. Distribution of the Study Population According to Blood Count Profile
3.4.1. Frequency of Hemogram Disorders in the Population
Table 3 presents hemogram disorders of sickle cell patients during the study period.
From the Table 3, 96% of the population had moderate anemia, and 7.75% had severe anemia. Moreover, 38.3% of the population has had microcytic anemia. In addition, 61.1% of the total population has experienced thrombocytosis. 66.4% of anemias were normochromic, and 33.6% were hypochromic. 95.3% of anemias were regenerative.
3.4.2. Profile of the Complete Population Hemogram
Table 4 presents the complete blood count profile of sickle cell patients during the study period.
From Table 4, the median of the white blood cells in inflamed patients was significantly higher (17.7 G/L) compared to 15.6 G/L in non-inflamed patients (p=0.004). The white blood cells, Granulocytes, Neutrophils, Eosinophils, and Basophils were significantly higher in inflamed than non-inflamed patients (p<0.05). The median hemoglobin in the total population is 7.8g/dL. The median platelet in the population was 460 G/mL [323-575] with 408 G/mL in inflamed sickle cell patients and 468 G/mL in non-inflamed sickle cell patients (p=0.005).
3.5. Distribution of the Study Population by Serum Parameters
Table 5 describes the serum profile in inflamed and non-inflamed sickle cell patients during the study: It appears that the prevalence of inflammation in the population was 42.3%. The median of ferritin in the sickle cell in patients with inflammation (669 ng/mL) was significantly higher than that of non-inflammatory (426 ng/mL) patients (p<0.001). The same report was found with CRP and IL-6 concentrations. However, these results were contrary to those of transferrin and transferrin saturation coefficient concentrations. The median of the total iron binding capacity in the population is 3.56 mg/L. 85.2% of the population had hyperferritinemia with 96.8% in inflamed sickle cell patients and 76.7% in non-inflamed (p=0.001). In addition, 84.6% of the population had an increase in the transferrin saturation coefficient with 95.2% in inflamed sickle cell patients and 76.7% in non-inflammatory sickle cell patients (p=0.004). Moreover, the median IL6 was 5.01 pg/mL in patients with inflammation and 2.83 pg/mL in non-inflamed patients (p<0.001). In addition, after univariate analyses, decreased transferrin, elevated TSC, and decreased TIBC were strongly associated with a risk of developing inflammation in patients with respectively (OR = 9.06; 95% CI [1.88;43.6]; p=0.002), (OR= 6.06; 95% CI [1.71;21.4]; p=0.002), and (OR=3.47; 95% CI [1.46;8.2]; p=0.005).
3.6. Factors Associated with Inflammation in Sickle Cell Patients: Multivariate Analyses
Table 6 describes the factors associated with inflammation in sickle cell patients in multivariate analyses, the ferritin and IL6 elevation are associated with inflammation during major sickle cell syndromes respectively (Or = 4.96; 95% CI [1.15-36.42]; p=0.056) and (Or =6.23; 95% CI [1.43-45.96]; p=0.030).
4. Discussion
The objective of this study was to investigate the Inflammation and iron profile in children with sickle cell disease in Cameroon, identify the factors associated with inflammation, and raise the consequences for the patient including the profile of the hemogram and the iron profile. Indeed, SCD is a monogenic disease with exceptional phenotypic variability that is regulated by several known and unknown genetic factors. Understanding the vascular and inflammatory components of the disease can help in providing information that would allow a better understanding of the disease and improve the follow-up of the patient. The sex ratio was 1.01 in favor of men to 50.3% of men and 19.7% of women. There was therefore no significant link between the type of hemoglobin and sex, this has a genetic explanation because the transmission of tare is independent of sex. These same observations were made by Dahmani et al. (2016) and Doupa et al. (2017) [11,17]. The median age of our participants is 9 [4,5,6,7,8,9,10,11,12,13] corresponding to a relatively young age. This could be explained by the early mortality of sickle cell patients. Indeed, a study by Houwing et al. (2019) found that more than half of sickle cell patients die before the age of 5 in sub-Saharan Africa [18]. These sightings were also reported by Dahamani et al. [17]. The population was mostly meager according to BMI. This result reflects the significant state of malnutrition in the sickle cell population. This observation was also made by Sombodi et al. (2015) [19]. Patients had a history of infectious crisis, history of anemia, history of vasooclusive, and history of cardiovascular disease. These described signs and symptoms are characteristic and commonly encountered in sickle cell patients. The same observations were also described in the review by Houwing et al. (2019) which provides a summary of the pathophysiology and management of sickle cell disease and encompasses the characteristics and complications of the disease; as well as that of Wonkam et al. (2016) [18,20].
Inflammation was assessed and the frequency of inflammation in the population was 42.3%; which is relatively high. This can be explained by the large proportion of hemoglobin S in the population promoting polymerization and destruction of the sickle cell erythrocyte membrane. Added to this, the history of the patients of this study is characterized by a past of infectious crises, anemic crises, cardiovascular disease, and vasocooclusive crises associated with this the intrinsic factors in sickle cell disease are all factors promoting inflammation in the latter [21]. These results are similar to those of Tsihilolo et al. (2009) who reported one of two sickle cell patients in inflammation during their study in patients in the stationary phase[15]. Otherwise, the median CRP in the population was elevated and significantly differentiated between inflamed and non-inflamed patients (p<0.001) thus demonstrating a significant elevation of inflammation in the latter. These results are close to those of Cople-Rodrigues et al. (2019) and Karafin et al. (2015) which reported medians of 5.5mg/L and 5.6mg/L respectively [22,23]. However, they are different from those of Tete-Benissan et al. (2011) [24] and Al-Saqladi et al. (2012) [5] which reported medians of 8.3mg/L and 6.3mg/L respectively. These differences could be explained by the differences between the context of the realization of the studies. Several factors can initiate and promote inflammation in sickle patients such as infections and oxidative stress. In addition, the median IL6 was also elevated and significantly differentiated between inflamed and non-inflamed patients (p<0.001); with a larger and more significant proportion in inflamed compared to non-inflamed (96.8% vs. 84.5%; p<0.001); Indeed, it is known that inflammation is one of the factors capable of increasing the concentration of IL6. Studies have shown the elevation of pro-inflammatory cytokines (TNF-α, IL-6, and IL-17) during inflammatory processes in sickle cell patients, including vasooclusive crises, hemolytic processes, and activation of endothelial cells in sickle cell disease [21,25,26]. The results obtained in this study are similar to those obtained by Omena et al. in 2018 and those of Mangaonkar et al. in 2020 which reported the Interleukins 6 medians of 3.8 pg/mL and 4.5 pg/mL respectively [7,25]. In addition, after univariate analyses, the elevation of Interleukin 6 concentration was strongly and significantly associated with a risk of developing inflammation (OR = 5.43; 95% CI [1.18;25]; p=0.016).
Exploration of blood cells describes a high frequency (100%) of anemias with median hemoglobin as low in inflamed and non-inflamed sickle cell patients (p=0.008) reflecting that inflammation does not have a considerable influence on hemoglobin. This observation is similar to that made by Omena et al. (2018) who reported a median of 8g/dL and also did not find an influence of inflammation on hemoglobin [25]. Patients had moderate anemias mainly due to the high frequency of hemolysis which is directly linked to the polymerization of HbS which damages the sickle cell membrane [18]. Moreover, anemias were mainly normochromic, hypochromic, and regenerative. Indeed, at birth, people with sickle cell disease do not suffer from anemia, but with the synthesis of adult hemoglobin, they develop chronic hemolytic anemia present throughout life. This can be interspersed with acute episodes of hemoglobin reduction “anemic attacks”. Hyperhemolysis attacks are defined by a sudden drop in steady-state hemoglobin accompanied by increased reticulocytosis and exaggerated hyperbilirubinemia [27]. Several other studies reported cases of reticulocytosis and regenerative anemia in sickle cell patients [19,28]. In addition, after univariate analyses, the decrease in hemoglobin levels was associated with a risk of developing inflammation (OR = 1.27; 95% CI [1.59;2.02]; p=0.036). Furthermore, the median of white blood cells was 15.8 G/L with 17.7 G/L in inflamed patients and 15.6 G/L in non-inflamed patients (p=0.004); this shows the influence of inflammation on the elevation of white blood cells. Several studies also reported hyperleukocytosis in sickle cell patients [29,30]. Sickle cell disease is indeed an inflammatory disease in which one of the markers is leukocytosis. The increase in the level and the activation of leukocytes are important mediators of inflammation in sickle cell disease. Leukocytes can adhere to sickle and non-sickle erythrocytes, platelets, and the vascular endothelium. In addition, in acute hemolysis, strong bone marrow regeneration is responsible for erythroblastosis causing false hyperleukocytosis. Indeed, this uncorrected leukocytosis is more important in sickle cell patients [27]. The median platelet in the population was also elevated but did not differ significantly by inflammation (p=0.005). However, thrombocytosis in sickle cell patients is a factor promoting vasoocclusive crises because activated platelets secrete thrombospondin (TSP) involved in GR-endothelium bypass and participate in the hypercoagulability state of sickle cell disease. It can also be the result of the occurrence of functional or organic asplenia or would be the consequence of hyposplenism [18]. This observation has been reported in several studies in sickle cell patients [11].
Exploration of the martial balance in sickle cell patients shows an elevation of ferritin with a greater elevation in inflamed patients compared to non-inflamed ones (96.8% vs 76.7%, p<0.001). In addition, the median serum iron in patients is elevated but does not show a significant difference by inflammation (p=0.616). Also, a higher proportion (87.9%) of sickle cell patients present an elevation of serum iron thus reflecting a significant martial overload in the latter. Indeed, hepcidin levels, a key modulator of iron metabolism, are influenced by erythropoiesis, iron, and inflammation which can be increased in sickle cell patients [8,31]. In addition, elevated ferritin is a reflection of chronic inflammation [5]. Several authors also reported high concentrations of serum iron and iron-containing compounds including heme and hemoglobin in the plasma of patients by hemolysis and blood transfusions [32]. However, inflammation did not affect the levels of iron plasma in our study. Furthermore, after univariate analyses, hyperferritinemia was strongly associated with a risk of developing inflammation in the sickle cell population (OR = 9.24; 95% CI [2.07;41.2]; p<0.001). Moreover, iron overload in patients with inflammation and those not inflamed was also evaluated from a decrease in transferrin (46% vs 27.9%, p=0.007), a decrease in Total Iron Binding Capacity (34.9% vs 24.4%, p=0.001), and an increase in Transferrin Saturation Coefficient (TSC) (95.2% vs. 76.7%, p=0.004). Indeed, during sickle cell disease, the high frequency of hemolysis is accompanied by a decrease in serum transferrin whose their capacities are exceeded. This has a direct consequence of an increase in the Transferrin Saturation Coefficient and a decrease in the Total Iron Binding Capacity. These observations have also been reported in several studies of sickle cell disease during inflammation [31,33]. However, we can mention that ferritin (evaluated in this study) and transferrin prevent iron from reacting with its immediate environment. Indeed, in healthy cells, iron ions are chelated by transport proteins (transferrin) or storage proteins (ferritin) [34]. In addition, after univariate analyses, decreased transferrin, elevated TSC, and decreased TIBC were strongly associated with a risk of developing inflammation in patients with respectively (OR = 9.06; 95% CI [1.88;43.6]; p=0.002), (OR= 6.06; 95% CI [1.71;21.4]; p=0.002), and (OR=3.47; 95% CI [1.46;8.2]; p=0.005). According to the multivariate model, ferritin and IL6 elevation are associated with inflammation during sickle cell disease respectively (OR = 4.96; 95% CI [1.15-36.42]; p=0.056) and (OR =6.23; 95% CI [1.43-45.96]; p=0.030); thus, reflecting the important role of interleukin 6 and ferritin in inflammation. It is conceivable that our indirect index does not reflect actual hemolysis, but also that other mechanisms leading to anemia, such as iron deficiency and inflammation are involved in the pathophysiology of SCD-related vascular complications, in addition to, and independently from, hemolysis [35].
These data highlight the need to prevent inflammation in sickle cell patients, as they are a risk factor for a disorder of iron homeostasis, which constitutes an important pro-oxidant and causes high oxidative stress and cardiovascular disease.
5. Conclusions
The frequency of inflammation is high in children with sickle cell disease. During inflammation, patients are subject to a dysregulation of iron metabolism causing its martial overload which is a non-negligent factor. Hence the a need to control and regulate the inflammation and iron levels in sickle cell disease, which is a major factor in oxidative stress and cardiovascular disease.
Author Contributions
RDMT conducted item retention, data interpretation, and statistical analysis, and a major contribution to manuscript writing. JLS contributes to statistical analysis and data interpretation. BCC, PCBN, CAP, and CTT designed the study and contributed to the data interpretation, and the manuscript writing. All authors read and approved the final manuscript.
Funding
This research received no external funding.
Institutional Review Board Statement
This study was approved by the Centre’s Regional Research Ethics Committee (AUTHORISATION No E210/CRERSHC2021). Authorization to collect the data was obtained from the Regional Hospital of Bafoussam (No 005 / L/ MINSANTE / SG / DRSPO / HRB / D) and the Central Hospital of Yaoundé (No 276/21 / AR / MINSANTE / SG / DHCY / CM / SM). An authorization for analysis of the samples was obtained from the University Hospital of Yaoundé (No 74 / AR / CHUY / DG / DGA / CAPRC). All the procedures performed in this study followed the ethical standards of the Declaration of Helsinki and its later amendments. The confidentiality of the results was respected according to the Helsinki Declaration.
Informed Consent Statement
The purpose of this study was thoroughly explained to participants and only those who gave their written informed consent were recruited for the study.
Data Availability Statement
The data used to support the findings of this study are available from the corresponding author upon request.
Acknowledgments
We address our sincere thanks to the hematology laboratory staff of the ‘Centre Hospitalier Universitaire de Yaoundé’, the laboratory staff of the Faculty of Medicine and Biomedical Sciences of ‘Université de Yaoundé I’, and ‘Université des Montagnes’ for their help in carrying out this work.
Conflicts of Interest
The authors declare that they have no conflicts of interest.
References
- Meher S: Mohanty PK, Patel S, Das K, Sahoo S, Dehury S, et al. Haptoglobin Genotypes Associated with Vaso-Occlusive Crisis in Sickle Cell Anemia Patients of Eastern India. Hemoglobin. Taylor & Francis; 2020;0:1–7. [CrossRef]
- Nkashama GM, Wakamb GKA, Mulangu AM, Nkashama GM, Kupa BK, Numbi OL. De l’hémoglobine SS à SF: Intérêt de l’hydroxyurée dans la prise en charge de la drépanocytose chez 2 enfants congolais et revue de la literature. Pan Afr Med J. 2015;21:1317–22.
- Cabannes R, Bonhomme J. Les hémoglobinopathies. Vie Med. Can. Fr. 1972. p. 458–67.
- Id HAL. Marqueurs du métabolisme du fer et dérivés de la L-arginine dans la cardiopathie ischémique : mise en évidence, intérêt de leur évaluation et rôle du stress oxydant en phase aiguë d ’ infarctus du myocarde Aurélie Gudjoncik To cite this version : HAL Id. 2018;
- Al-Saqladi AWM, Bin-Gadeem HA, Brabin BJ. Utility of plasma transferrin receptor, ferritin, and inflammatory markers in children with sickle cell disease. Paediatr Int Child Health. 2012;32:27–34. [CrossRef]
- Inati A, Musallam KM, Cappellini MD, Duca L, Taher AT. Nontransferrin-bound iron in transfused patients with sickle cell disease. Int J Lab Hematol. 2011;33:133–7. [CrossRef]
- Mangaonkar AA, Thawer F, Son J, Ajebo G, Xu H, Barrett NJ, et al. Regulation of iron homeostasis through the erythroferrone-hepcidin axis in sickle cell disease. Br J Haematol. 2020;189:1204–9. [CrossRef]
- Muazzam Nasrullah 2018. 乳鼠心肌提取 HHS Public Access. Physiol Behav. 2016;176:139–48.
- Bandeira ICJ, Rocha LBS, Barbosa MC, Elias DBD, Querioz JAN, Freitas MVC, et al. Chronic inflammatory state in sickle cell anemia patients is associated with HBB*S haplotype. Cytokine. Elsevier Ltd.; 2014;65:217–21. [CrossRef]
- Zahran AM, Nafady A, Saad K, Hetta HF, Abdallah AEM, Abdel-Aziz SM, et al. Effect of Hydroxyurea Treatment on the Inflammatory Markers Among Children With Sickle Cell Disease. Clin Appl Thromb. 2020;26. [CrossRef]
- Doupa D, Djite M, Gueye PM, Seck M, Faye BF, Seck SM, et al. Profil biochimique et hématologique des patients drépanocytaires homozygotes en phase stationnaire au centre National de Transfusion Sanguine de Dakar. Int J Biol Chem Sci. 2017;11:1706. [CrossRef]
- Teixeira J, Azevedo C De, Cristina K, Malmegrim R. Immune mechanisms involved in sickle cell disease pathogenesis : current knowledge and perspectives. Immunol Lett [Internet]. Elsevier; 2020;224:1–11. [CrossRef]
- Sundd P, Gladwin MT, Novelli EM. Pathophysiology of Sickle Cell Disease. 2019; [CrossRef]
- Nader E, Romana M, Connes P. The Red Blood Cell — Inflammation Vicious Circle in Sickle Cell Disease. 2020;11:1–11. [CrossRef]
- Tshilolo L. abc. 2009;67:607–12.
- World Medical Association. Declaration of Helsinki, ethical principles for scientific requirements and research protocols. Bull World Health Organ [Internet]. 2013;1–4. Available from: https://www.wma.net/policies-post/wma-declaration-of-helsinki-ethical-principles-for-medical-research-involving-human-subjects/.
- Access O. Case series. 2016;8688:1–5.
- Houwing ME, de Pagter PJ, van Beers EJ, Biemond BJ, Rettenbacher E, Rijneveld AW, et al. Sickle cell disease: Clinical presentation and management of a global health challenge. Blood Rev [Internet]. Elsevier; 2019;37:100580. [CrossRef]
- Sombodi U, Wembonyama SO, Luboya O. Profil hématologique et nutritionnel du drépanocytaire homozygote SS âgé de 6 à 59 mois à Lubumbashi, République Démocratique du Congo. 2015;8688:1–6.
- Wonkam A, Josiane V, Bitoungui N, Ngogang J. Africa : beyond the preliminary data from Cameroon. 2016;18:237–41.
- Rees DC, Gibson JS. Biomarkers in sickle cell disease. Br J Haematol. 2012;156:433–45. [CrossRef]
- Cople-rodrigues CS, Omena J, Fleury MK, Bacelo AC, Koury JC, Citelli M. Selenium status and hemolysis in SCD patients. Nutrients. 2019;11:1–11.
- Ofori DA, Anjarwalla P, Mwaura L, Jamnadass R, Stevenson PC, Smith P, et al. No 主観的健康感を中心とした在宅高齢者における 健康関連指標に関する共分散構造分析Title. Molecules. 2020;2:1–12.
- A TB, Agbetiafa K, M SYAG. Rev. CAMES-Série A, Sciences et Médecine Profil lipidoprotéinique, risque athérogène et état inflammatoire chez les porteurs du trait drépanocytaire au Togo LIPID, LIPOPROTEIN PROFILE, ATHEROGENIC RISK AND INFLAMMATORY STATUS IN SICKLE-CELL TRAIT CAR. 2011;12:209–15.
- Omena J, Cople-Rodrigues C dos S, Cardoso JD do A, Soares AR, Fleury MK, Brito F dos SB, et al. Serum hepcidin concentration in individuals with sickle cell anemia: Basis for the dietary recommendation of Iron. Nutrients. 2018;10.
- Sarray S, Saleh LR, Saldanha FL, Al-habboubi HH, Mahdi N, Almawi WY. Cytokine Serum IL-6, IL-10, and TNF levels in pediatric sickle cell disease patients during vasoocclusive crisis and steady-state condition. Cytokine [Internet]. Elsevier Ltd.; 2015;72:43–7. [CrossRef]
- Makani J, Ofori-Acquah SF, Nnodu O, Wonkam A, Ohene-Frempong K. Sickle cell disease: New opportunities and challenges in Africa. Sci World J. 2013;2013. [CrossRef]
- Yahouédéhou SCMA, da Guarda CC, Figueiredo CVB, Santiago RP, Carvalho SP, Fiuza LM, et al. Hydroxyurea alters hematological, biochemical and inflammatory biomarkers in Brazilian children with SCA: Investigating associations with βS haplotype and α-thalassemia. PLoS One. 2019;14:1–13.
- Makulo JR, Itokua KE, Lepira RK, Bundutidi GM, Aloni MN, Ngiyulu RM, et al. The magnitude of elevated iron stores and risk associated in steady state sickle cell anemia Congolese children: A cross-sectional study. BMC Hematol. BMC Hematology; 2019;19:1–6.
- Um SSN, Seungue J, Alima AY, Mbono R, Mbassi H, Chelo D, et al. A cross-sectional study of the growth of children with sickle cell disease, aged 2 to 5 years in Yaoundé, Cameroon. Pan Afr Med J. 2019;34:1–10.
- Lee N, Makani J, Tluway F, Makubi A, Armitage AE, Pasricha S, et al. EBioMedicine Decreased Hepcidin Levels Are Associated with Low Steady-state Hemoglobin in Children With Sickle Cell Disease in Tanzania. EBioMedicine [Internet]. The Authors; 2019;34:158–64. [CrossRef]
- Amer J, Ghoti H, Rachmilewitz E, Koren A, Levin C, Fibach E. Red blood cells, platelets and polymorphonuclear neutrophils of patients with sickle cell disease exhibit oxidative stress that can be ameliorated by antioxidants. Br J Haematol. 2006;132:108–13. [CrossRef]
- Tshilolo L, Ngole ZM, Ngiyulu R, D KN. Le statut martial chez soixante-douze drépanocytaires homozygotes congolais. 2016;83–7.
- Itokua KE, Makulo JR, Lepira FB, Aloni MN, Ekulu PM, Sumaili EK, et al. Albuminuria, serum antioxidant enzyme levels and markers of hemolysis and inflammation in steady state children with sickle cell anemia. BMC Nephrol [Internet]. BMC Nephrology; 2016;17:1–6. [CrossRef]
- Sanogo I, Belinga S, Guifo O, Wamba G. Degree of Anemia, Indirect Markers of Hemolysis, and Vascular Complications of Sickle Cell Disease in Africa. Short title: Anemia, Hemolysis Markers and sickle cell disease complications. 2017;1–24. [CrossRef]
Figure 1.
Frequency of inflammation in the population.
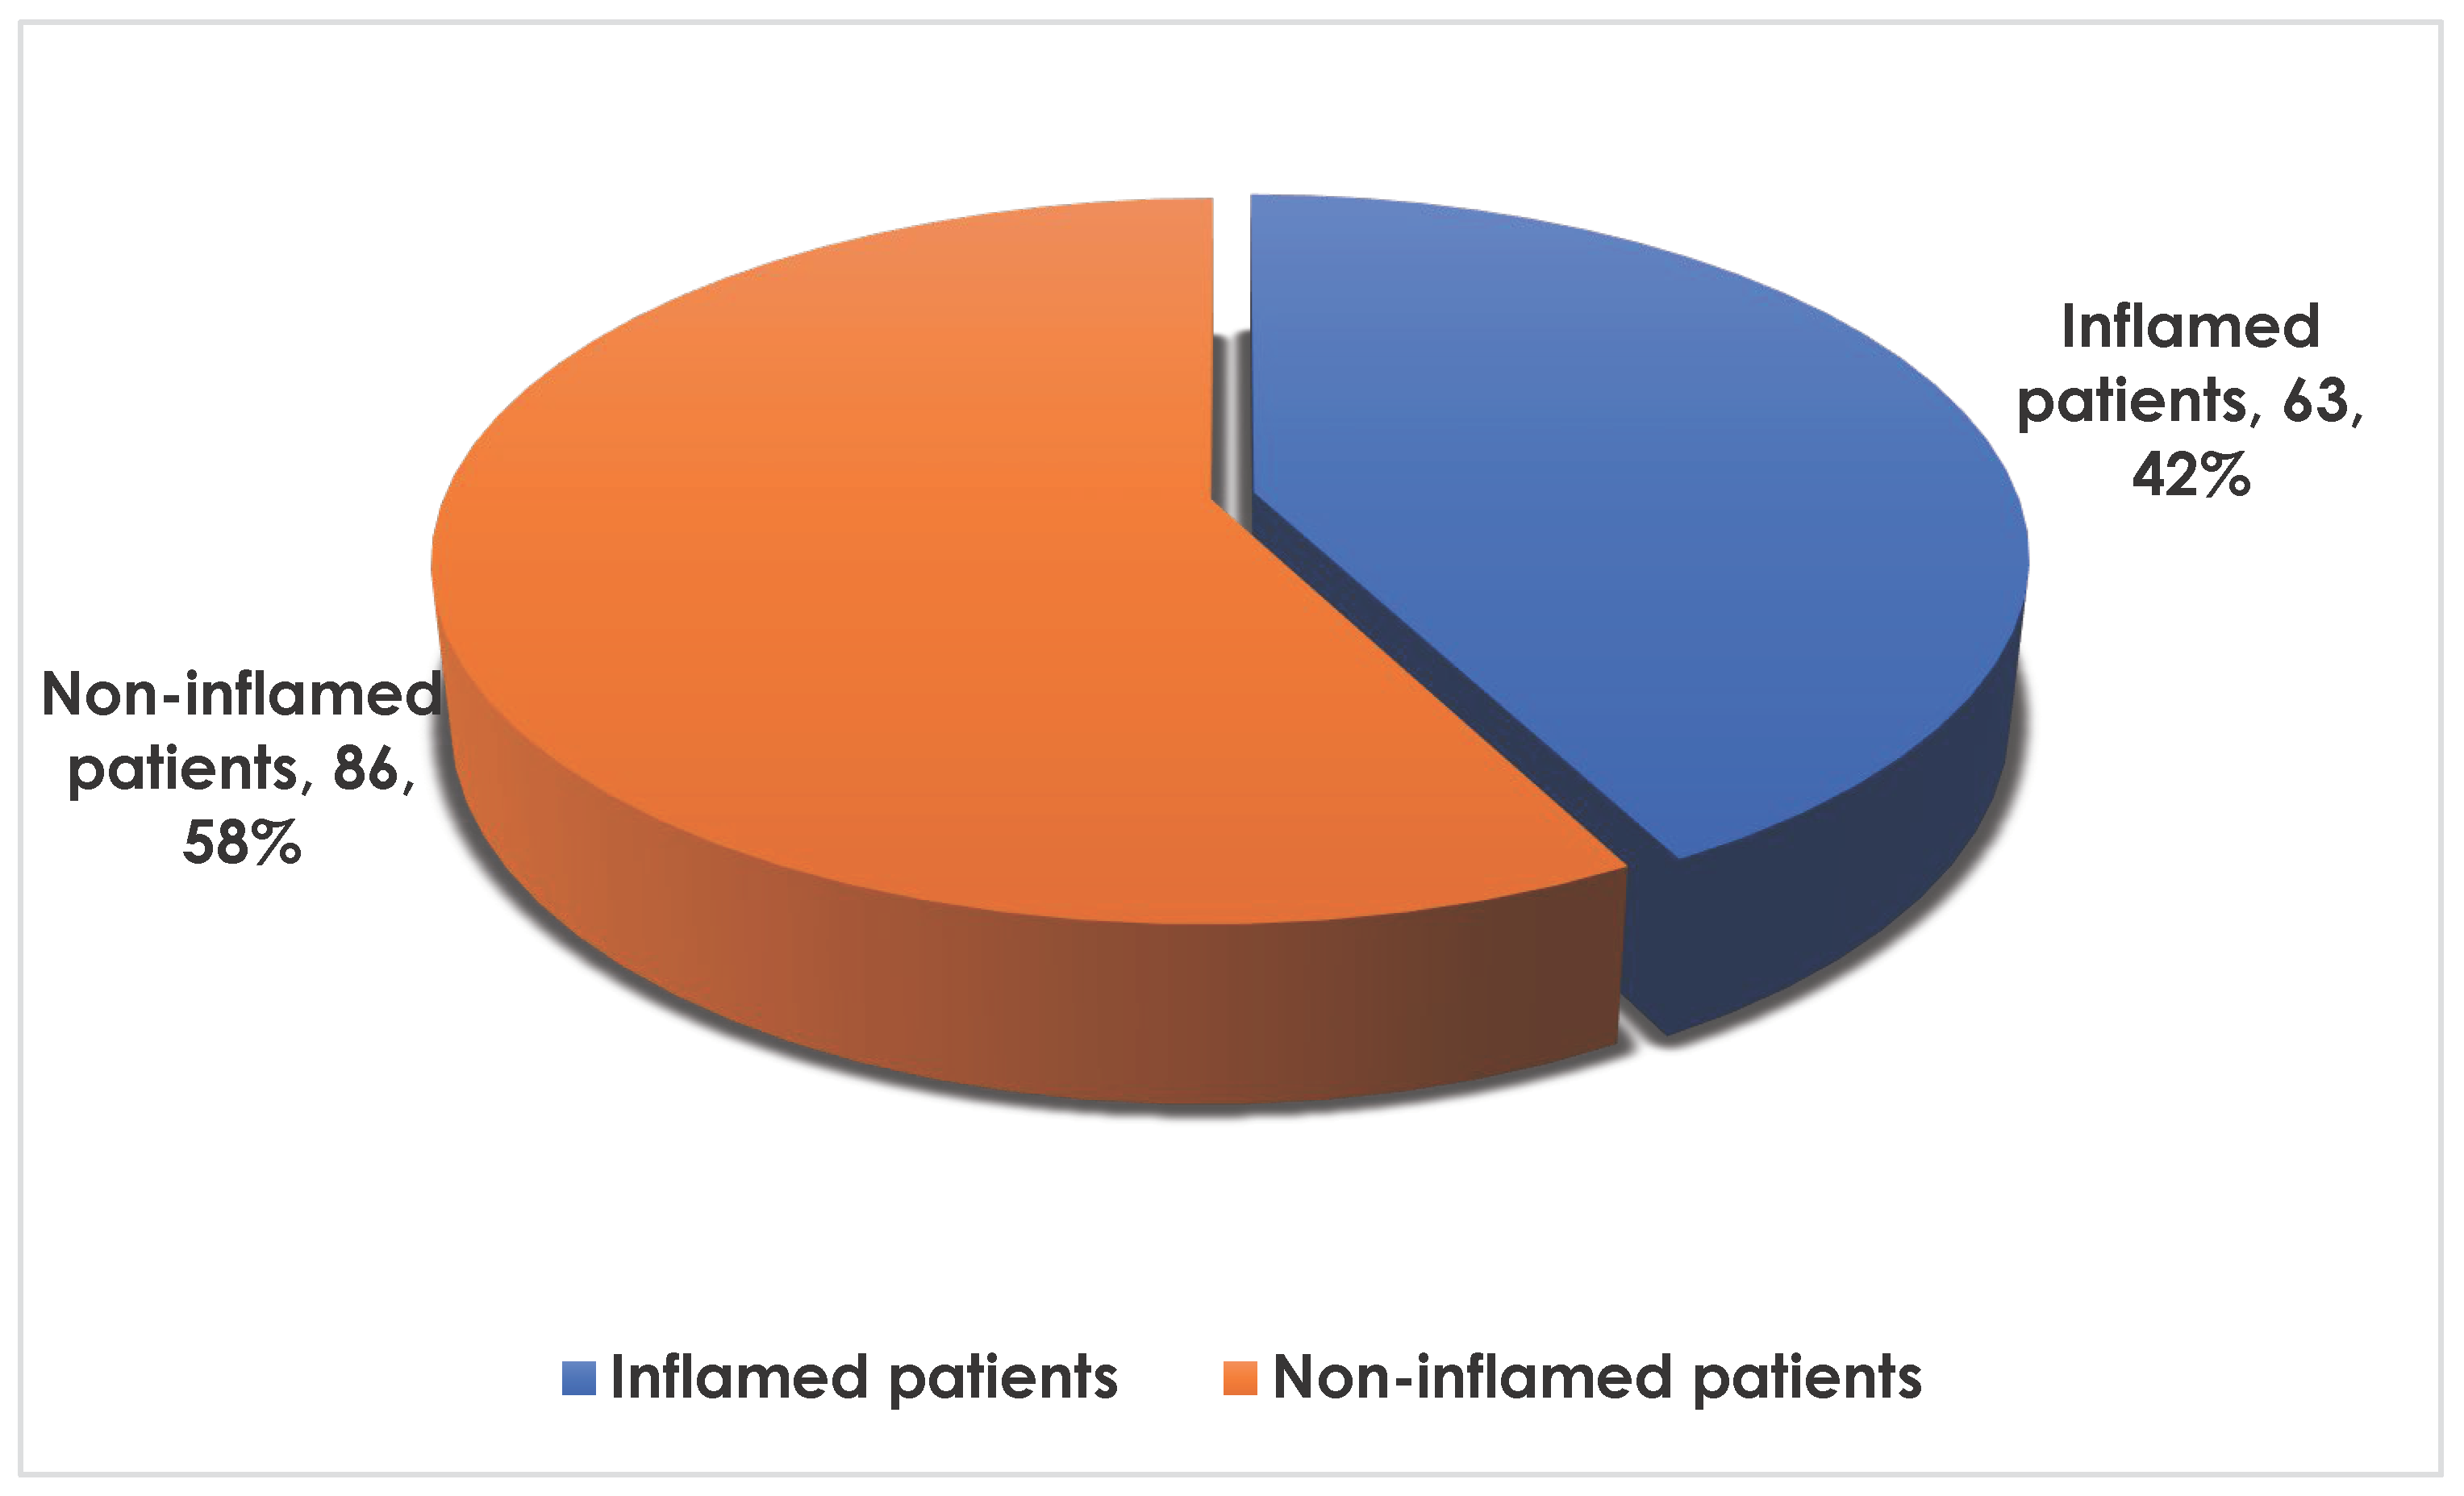

Table 1.
Description of socio-demographics and clinical phenotypes of all the patients.
| Variables | Effective | Frequency (%) | |
|---|---|---|---|
| Sex: | F | 74 | (49.7) |
| M | 75 | (50.3) | |
| BMI | Thin | 98 | (65.77) |
| Normal | 51 | (34.23) | |
| History of infectious crises: | No | 101 | (67.8) |
| Yes | 48 | (32.2) | |
| History of anemic crises: | No | 71 | (47.7) |
| Yes | 78 | (52.3) | |
| History of VOS: | No | 68 | (45.6) |
| Yes | 81 | (54.4) | |
| History of CVD and stroke | No | 146 | (98.0) |
| Yes | 3 | (2.01) | |
| Mean VOS/month, Med (IQR) | 1.00 [0.00-2.00] | ||
| Age, Med[q1-q3] | 9.00 [4.00-13.0] | ||
| BMI, Mean±sd | 17.2±3.07 | ||
CHY: Central Hospital of Yaounde ; RHB: Regional Hospital of Bafoussam ; BMI: Body Mass Index; CVD: Cardiovascular Diseases; VOS: Vaso-occlusive seizures;.
Table 2.
Distribution of sickle cell patients from RHB and CHY by sociodemographic characteristics and clinical history of inflammation.
Table 2.
Distribution of sickle cell patients from RHB and CHY by sociodemographic characteristics and clinical history of inflammation.
| Variables |
No N=86 n(%) |
Yes N=63 n(%) |
p-value | |
|---|---|---|---|---|
| Sex: | F | 35 (40.7) | 39 (61.9) | 0.017* |
| M | 51 (59.3) | 24 (38.1) | ||
| Age, Med[q1-q3] | 8.00 [5.00-12.0] | 10.0 [4.00-14.0] | 0.461 | |
| BMI, Mean±sd | 17.0±3.15 | 17.4±2.96 | 0.482 | |
| BMI | Thin | 58(67.44) | 40(63.49) | 0.864 |
| Normal | 28(32.56) | 23(36.51) | ||
| History of infectious crises: | No | 59 (68.6) | 42 (66.7) | 0.942 |
| Yes | 27 (31.4) | 21 (33.3) | ||
| History of anemic crises: | No | 43 (50.0) | 28 (44.4) | 0.614 |
| Yes | 43 (50.0) | 35 (55.6) | ||
| History of VOS: | No | 43 (50.0) | 25 (39.7) | 0.279 |
| Yes | 43 (50.0) | 38 (60.3) | ||
| History of CVD and stroke | No | 86 (100) | 60 (95.2) | 0.074 |
| Yes | 0 (0.00) | 3 (4.76) | ||
| Mean VOS/month, Med (IQR) | 1.00 [0.00-1.00] | 1.00 [1.00-2.00] | 0.072 | |
CHY: Central Hospital of Yaounde ; RHB: Regional Hospital of Bafoussam ; BMI: Body Mass Index; CVD: Cardiovascular Diseases; VOS: Vaso-occlusive seizures; * significant difference at p < 0.05.
Table 3.
Distribution of RHB and CHY sickle cell patients by hemogram disorders versus inflammation.
Table 3.
Distribution of RHB and CHY sickle cell patients by hemogram disorders versus inflammation.
| Variables | Non -inflamed N=86n(%) | Inflamed N=63n(%) |
Total N=149 n(%) |
p-value | OR [IC 95%] | p-value OR | |
|---|---|---|---|---|---|---|---|
| RBC | Low | 83 (96.5) | 52 (82.5) | 135 (90.6) | 0.009 | - | 0.154 |
| High | 0 (0.00) | 2 (3.17) | 2 (1.34) | Ref. | Ref. | ||
| Normal | 3 (3.49) | 9 (14.3) | 12 (8.05) | - | 0.604 | ||
| Reticulocyte | High | 84 (97.7) | 58 (92.1) | 142 (95.3) | 0.134 | 0.28 [0.05;1.47] | 0.137 |
| Normal | 2 (2.33) | 5 (7.94) | 7 (4.70) | Ref. | Ref. | ||
| HB | Low | 84 (97.7) | 58 (92.1) | 142 (95.3) | 0.134 | 0.28 [0.05;1.47] | 0.137 |
| Normal | 2 (2.33) | 5 (7.94) | 7 (4.70) | Ref. | Ref. | ||
| anemia | Slight | 22(55.6) | 24(38.1) | 46(32.39) | 0.046 * | 1.78 [0.87;3.65] | 0.118 |
| Moderate | 57(67.28) | 28(44.44) | 85(59.86) | Ref. | Ref. | ||
| Severe | 5(5.81) | 6(9.52) | 11 (7.75) | 2.31 [0.65;8.27] | 0.215 | ||
| Hematocrit | Low | 84 (97.7) | 58 (92.1) | 142 (95.3) | 0.249 | - | 0.172 |
| High | 0 (0.00) | 2 (3.17) | 2 (1.34) | Ref. | Ref. | ||
| Normal | 2 (2.33) | 3 (4.76) | 5 (3.36) | - | 0.476 | ||
| MCV | Microcytosis | 33 (38.4) | 24 (38.1) | 57 (38.3) | 1.000 | 0.99 [0.51;1.93] | 0.975 |
| Normocytosis | 53 (61.6) | 39 (61.9) | 92 (61.7) | Ref. | Ref. | ||
| MCH | Low | 29 (33.7) | 21 (33.3) | 50 (33.6) | 1.000 | 0.98 [0.49;1.96] | 0.963 |
| Normal | 57 (66.3) | 42 (66.7) | 99 (66.4) | Ref. | Ref. | ||
| MCHC | Hypochromia | 5 (5.81) | 3 (4.76) | 8 (5.37) | 1.000 | 0.81 [0.19;3.52] | 0.804 |
| Normal | 81 (94.2) | 60 (95.2) | 141 (94.6) | Ref. | Ref. | ||
| WBC | Leucocytosis | 73 (84.9) | 58 (92.1) | 131 (87.9) | 0.283 | 2.07 [0.70;6.13] | 0.195 |
| Normal | 13 (15.1) | 5 (7.94) | 18 (12.1) | Ref. | Ref. | ||
| Granulocytes | Low | 1 (1.16) | 0 (0.00) | 1 (0.67) | <0.001 * | - | 0.393 |
| High | 23 (26.7) | 37 (58.7) | 60 (40.3) | Ref. | Ref. | ||
| Normal | 62 (72.1) | 26 (41.3) | 88 (59.1) | 0.26 [0.13;0.52] | <0.001 | ||
| Lymphocyte | Lymphocytosis | 66 (76.7) | 53 (84.1) | 119 (79.9) | 0.366 | 1.61 [0.69;3.72] | 0.276 |
| Normal | 20 (23.3) | 10 (15.9) | 30 (20.1) | Ref. | Ref. | ||
| Monocyte | Monocytosis | 84 (97.7) | 60 (95.2) | 144 (96.6) | 0.651 | 0.48 [0.08;2.94] | 0.458 |
| Normal | 2 (2.33) | 3 (4.76) | 5 (3.36) | Ref. | Ref. | ||
| Neutrophil | Neutropenia | 2 (2.33) | 0 (0.00) | 2 (1.34) | <0.001 * | - | 0.164 |
| Neutrophilia | 25 (29.1) | 39 (61.9) | 64 (43.0) | Ref. | Ref. | ||
| Normal | 59 (68.6) | 24 (38.1) | 83 (55.7) | 0.26 [0.13;0.52] | <0.001 | ||
| Eosinophil | Eosinophilia | 34 (39.5) | 39 (61.9) | 73 (49.0) | 0.011 * | 2.49 [1.28;4.84] | 0.008 |
| Normal | 52 (60.5) | 24 (38.1) | 76 (51.0) | Ref. | Ref. | ||
| Basophil | Basophilia | 0 (0.00) | 11 (17.5) | 11 (7.38) | <0.001 * | - | <0.001 |
| Normal | 86 (100) | 52 (82.5) | 138 (92.6) | Ref. | Ref. | ||
| Thrombocyte | Thrombocytopenia | 2 (2.33) | 3 (4.76) | 5 (3.36) | 0.079 | 1.34[0.21;8.6] | 0.789 |
| Thrombocytosis | 59 (68.6) | 32 (50.8) | 91 (61.1) | 0.48 [0.24;0.97] | 0.041 | ||
| Normal | 25 (29.1) | 28 (44.4) | 53 (35.6) | Ref. | Ref. | ||
WBC: whyte blood cells, RBC= Red blood cell; MCV= Mean Corpuscular Volume; MCH = Mean Corpuscular Haemoglobin Content; MCHC = Mean Corpuscular Hemoglobin Concentration; ref.= 0.00 [0.00;.]; * significant difference at p < 0.05.
Table 4.
Complete blood count profile.
| Variables | Non-inflamed N=86 axxx | Inflamed N=63, axxx |
Total N=149 axxx |
P-value | Or IC 95% | P-Or |
|---|---|---|---|---|---|---|
| RBC (T/L) | 2.72 [2.34-3.03] | 2.70 [2.51-3.09] | 2.72 [2.39-3.09] | 0.400 | 1.28 [1.80;0.91] | 0.149 |
| Reticulocytes (G/L) | 355 [286-368] | 345 [250-378] | 350[275-375] | 0.242 | 1.00 [1.00;1.00] | 0.060 |
| HB (g/dL) | 7.50 [7.00-8.17] | 8.10 [7.55-9.30] | 7.80 [7.10-8.40] | 0.008 | 1.27 [1.59;1.02] | 0.036* |
| HTE (%) | 21.6 [19.5-23.0] | 22.6 [21.0-24.9] | 21.9 [20.1-24.4] | 0.031* | 1.05 [1.11;0.99] | 0.080 |
| MCV (fL) | 80.5 [74.2-85.0] | 82.0 [75.0-90.5] | 81.0 [74.0-87.0] | 0.127 | 1.02 [1.06;0.98] | 0.257 |
| MCHC (pg/c) | 28.9 [25.7-31.2] | 30.0 [25.4-32.5] | 29.2 [25.5-31.6] | 0.208 | 1.03 [1.11;0.95] | 0.495 |
| MCH (g/L) | 35.7 [34.5-37.0] | 35.8 [34.3-37.4] | 35.7 [34.3-37.1] | 0.963 | 0.98 [1.11;0.87] | 0.751 |
| WBC (G/L) | 15,6 [12.5-18.2] | 17.7 [13.4-23.5] | 15.8 [13-20.4] | 0.004* | 1.00 [1.00;1.00] | 0.001* |
| Granulocytes (G/L) | 6.1 [4.7-8.4] | 8.5 [5.9-10.3] | 6.6 [4.9-8.9] | <0.001* | 1.00 [1.00;1.00] | <0.001* |
| Lymphocytes (G/L) | 6.3 [4.2-8.8] | 6.1 [5.4-8.7] | 6230 [4.5-8.8] | 0.417 | 1.00 [1.00;1.00] | 0.140 |
| Monocytes (G/L) | 2140 [1.5-2.8] | 2.4 [1.6-3.3] | 2.1 [1.5-3] | 0.237 | 1.00 [1.00;1.00] | 0.080 |
| Neutrophils (G/L) | 5.7 [4.4-7.9] | 7.8 [5.5-9.6] | 6.2 [4.6-8.3] | <0.001* | 1.00 [1.00;1.00] | <0.001* |
| Eosinophils (/mL) | 356 [275-491] | 498 [346-599] | 388 [288-518] | <0.001* | 1.00 [1.01;1.00] | <0.001* |
| Basophils (/mL) | 98.1 [75.8-135] | 137 [95.5-165] | 107 [79.4-143] | <0.001* | 1.02 [1.02;1.01] | <0.001* |
| Thrombocytes (G/mL) | 468 [386-598] | 408 [268-542] | 460 [323-573] | 0.005* | 1.00 [1.00;1.00] | 0.016* |
WBC: white blood cells, RDB= Red blood cell; MCV= Mean Corpuscular Volume; MCH = Mean Corpuscular Hemoglobin Content; MCHC = Mean Corpuscular Hemoglobin Concentration; axxx = Median (IQR); * significant difference at p < 0.05.
Table 5.
Distribution of sickle cell patients from RHB and CHY by serum parameters versus inflammation.
Table 5.
Distribution of sickle cell patients from RHB and CHY by serum parameters versus inflammation.
| Variables |
Inflamed N=63n(%) |
Non inflamed N=86n(%) | Total N=149 n(%) | P value | OR[IC 95%] | P value Or | |
|---|---|---|---|---|---|---|---|
| Iron, axxx | 1.91 [1.52-2.48] | 1.84 [1.50-2.31] | 1.86 [1.51-2.46] | 0.616 | 1.06 [1.44;0.78] | 0.694 | |
| Iron | Low | 0 (0.00) | 1 (1.16) | 1 (0.67) | 0.774 | - | 0.568 |
| High | 57 (90.5) | 74 (86.0) | 131 (87.9) | Ref. | Ref. | ||
| Normal | 6 (9.52) | 11 (12.8) | 17 (11.4) | 0.71 [0.25;2.03] | 0.538 | ||
| Ferritin, axxx | 669 [429-835] | 426 [234-660] | 555 [317-749] | <0.001* | 1.00 [1.00;1.00] | <0.001* | |
| Ferri | High | 61 (96.8) | 66 (76.7) | 127 (85.2) | 0.001* | 9.24 [2.07;41.2] | <0.001* |
| Normal | 2 (3.17) | 20 (23.3) | 22 (14.8) | Ref. | Ref. | ||
| Tranferrin, axxx | 2.08 [1.59-2.74] | 2.89 [1.91-3.51] | 2.55 [1.72-3.27] | 0.003* | 0.70 [0.92;0.53] | 0.011* | |
| TF: | Low | 29 (46.0) | 24 (27.9) | 53 (35.6) | 0.007 | 9.06 [1.88;43.6] | 0.002* |
| High | 2 (3.17) | 15 (17.4) | 17 (11.4) | Ref. | Ref. | ||
| Normal | 32 (50.8) | 47 (54.7) | 79 (53.0) | 5.11 [1.09;23.9] | 0.023 | ||
| CTF, axxx | 51.9 [39.8-68.5] | 72.2 [47.7-87.8] | 63.8 [43.0-81.7] | 0.003* | 0.99 [1.00;0.97] | 0.011* | |
| CST, axxx | 65.6 [45.9-96.0] | 54.7 [34.5-94.0] | 63.6 [36.0-95.1] | 0.092 | 1.00 [1.00;1.00] | 0.614 | |
| CST | High | 60 (95.2) | 66 (76.7) | 126 (84.6) | 0.004* | 6.06 [1.71;21.4] | 0.002 |
| Normal | 3 (4.76) | 20 (23.3) | 23 (15.4) | Ref. | Ref. | ||
| CTF | Low | 22 (34.9) | 21 (24.4) | 43 (28.9) | 3.47 [1.46;8.20] | 0.005 * | |
| High | 13 (20.6) | 43 (50.0) | 56 (37.6) | 0.001* | Ref. | Ref. | |
| Normal | 28 (44.4) | 22 (25.6) | 50 (33.6) | 4.21 [1.83;9.70] | 0.001* | ||
| CRP, axxx | 11.7 [8.72-22.5] | 3.00 [2.00-4.50] | 5.00 [3.00-10.0] | 0.001* | - | 0.940 | |
| CRP | High | 63 (100) | 0 (0.00) | 63 (42.3) | 0.001* | - | - |
| Normal | 0 (0.00) | 86 (100) | 86 (57.7) | Ref. | Ref. | ||
| IL6, axxx | 5.01 [2.87-8.59] | 2.83 [1.19-4.53] | 3.97 [1.41-6.54] | <0.001* | 1.01 [1.02;1.01] | 0.002* | |
| IL6 | High | 61 (96.8) | 73 (84.9) | 134 (89.9) | 0.034* | 5.43 [1.18;25.0] | 0.016* |
| Normal | 2 (3.17) | 13 (15.1) | 15 (10.1) | Ref. | Ref. | ||
Iron (mg/L); Ferritin (ng/ml); Transferrin (g/l); IL6=Interleukine 6 (pg/ml); axxx = Med (IQR); CRP (mg/L); TSC= transferrin saturation coefficient (%); TIBC = Total Iron Binding Capacity of Siderophilin (µmol/l); ref.= 0.00 [0.00;.]; * significant difference at p < 0.05.
Table 6.
Factors associated with inflammation in patients, multivariate analyses.
| Dependent: inflammation | No | Yes | OR (multivariable), IC 95%, p value |
|
|---|---|---|---|---|
| Ferritin | Normal | 20 (90.9) | 2 (9.1) | - |
| High | 66 (52.0) | 61 (48.0) | 4.96 (1.15-36.42, p=0.056) | |
| Transferrin | Normal | 47 (59.5) | 32 (40.5) | - |
| High | 15 (88.2) | 2 (11.8) | 0.67 (0.08-4.28, p=0.685) | |
| Low | 24 (45.3) | 29 (54.7) | 1.73 (0.41-9.02, p=0.476) | |
| TIBC | Normal | 22 (44.0) | 28 (56.0) | - |
| High | 43 (76.8) | 13 (23.2) | 0.49 (0.17-1.38, p=0.181) | |
| Low | 21 (48.8) | 22 (51.2) | 0.49 (0.09-2.08, p=0.350) | |
| TSC | Normal | 20 (87.0) | 3 (13.0) | - |
| High | 66 (52.4) | 60 (47.6) | 2.30 (0.50-13.36, p=0.308) | |
| IL6 | Normal | 13 (86.7) | 2 (13.3) | - |
| High | 73 (54.5) | 61 (45.5) | 6.23 (1.43-45.96, p=0.030*) | |
| Hemoglobin | Normal | 2 (28.6) | 5 (71.4) | - |
| Low | 84 (59.2) | 58 (40.8) | 0.08 (0.00-0.84, p=0.081) | |
IL6=Interleukine 6 (pg/ml); TSC= transferrin saturation coefficient (%); TIBC = Total Iron Binding Capacity of Siderophilin (µmol/l); * significant difference at p < 0.05.
Disclaimer/Publisher’s Note: The statements, opinions and data contained in all publications are solely those of the individual author(s) and contributor(s) and not of MDPI and/or the editor(s). MDPI and/or the editor(s) disclaim responsibility for any injury to people or property resulting from any ideas, methods, instructions or products referred to in the content. |
© 2024 by the authors. Licensee MDPI, Basel, Switzerland. This article is an open access article distributed under the terms and conditions of the Creative Commons Attribution (CC BY) license (http://creativecommons.org/licenses/by/4.0/).
Copyright: This open access article is published under a Creative Commons CC BY 4.0 license, which permit the free download, distribution, and reuse, provided that the author and preprint are cited in any reuse.


