Submitted:
11 December 2024
Posted:
12 December 2024
You are already at the latest version
Abstract
This research paper focuses on the synthesis and characterization of Cu-doped Mg-Co ferrites with varying compositions (Mg0.6-xCo0.4CuxFe2O4, where x = 0.0, 0.1, 0.2, and 0.3) using a solid-state reaction method. This paper also investigates the structural, morphological, magnetic, and electrical characteristics of synthesized Mg0.6-xCo0.4CuxFe2O4, where x = 0.0, 0.1, 0.2, and 0.3. The X-ray diffraction (XRD) technique confirms the ferrites spinel structure in the Fd-3m space group, with average crystallite sizes ranging from 57.29 to 48.57 nm. Fourier Transform Infrared (FTIR) spectroscopy verifies chemical and structural changes, while scanning electron microscopy (SEM) reveals cubic crystal growth with an average grain size of 1 to 1.5 μm. DC electrical resistivity decreases with increasing temperature and Cu2+ substitution, ranging from 1.4 x 10⁶ Ω-cm to 6.7 x 10⁵ Ω-cm. The study suggests a correlation between resistivity and Cu2+ concentration. Magnetic behaviour, studied using a Vibrating Sample Magnetometer (VSM), shows dependence on dopant concentration, with coercivity ranging from 157 Oe to 256 Oe. The results indicate potential applications in magnetic storage devices, antennas, transformers, and high-frequency electronics.
Keywords:
Cu-doped Mg-Co ferrites
; Solid-state reaction method
; Structural characterization
; Morphologi-cal characterization
; Magnetic properties
; DC-Electrical resistivity
; Magnetic storage devices
; High-frequence
Introduction
Ferrites are the class of materials having a general formula, MFe2O4 (M = divalent metal ions; examples include Mg, Zn, Ni, Co, etc.). Depending on their structure, composition, and morphology, ferrites exhibit interesting optical, magnetic, and electrical properties which make them an appropriate candidate for applications in various fields [1]. Among various ferrite materials, magnesium ferrite (MgFe2O4) is one such important ferrite material having a spinel structure with inversion mode. In normal spinel ferrite, divalent & trivalent metal ions occupy octahedral and tetrahedral sites correspondingly [2]. The highest number of trivalent ions in inverse spinel ferrites occupy tetrahedral sites, while the remainder of trivalent and divalent ions occupy octahedral sites [3]. Ferrites can be doped with additional metal ions, and each additional metal ion affects the chemical formula and chemical and physical properties of the material [4].
Magnesium ferrite because of its high curie temperature, high saturation magnetization, and low coercivity is called soft ferrite and is commonly utilized in high-frequency electronic devices and microwave applications, etc. [5]. Cobalt ferrite (CoFe2O4) has an inverse spinel structure and due to its higher coercivity than Mg ferrite, it is also known as a hard ferrite [6]. Cobalt doping improves the coercivity of magnesium ferrite. Additionally, a unit cell of magnesium ferrite shrinks because of cobalt's lower ionic radius [7]. In comparison to other ferrites, with moderate saturation magnetization, and strong chemical stability, Mg-Co ferrite has a high coercivity, high mechanical hardness, and inexpensive production costs. It's considered a promising photocatalyst and nuclear magnetic resonance candidate. Different magnetic materials can be synthesized with unique structures, and physical and chemical properties by doping additional metal ions into Mg-Co ferrite. Metal-doped magnesium cobalt ferrites have gained attention owing to their exceptional magnetic as well as electrical properties, making them ideal for high-frequency uses [8], such as in the fabrication of transformers where they are integral in reducing signal noise and enhancing signal quality. These materials can also be used in the development of highly sensitive magnetic sensors for applications like automotive and industrial sensing.
Ferrite cores are crucial in Sound Detection and Ranging (SODAR) pre-amplifiers for significantly reducing signal noise and enhancing the accuracy and reliability of environmental monitoring. These cores, made from magnesium and cobalt ferrites, are selected for their high saturation magnetization and custom-tailored coercivity. By doping these ferrites with specific metals like cobalt to boost coercivity or copper to modify electrical properties, their effectiveness in suppressing electromagnetic interference is maximized [9]. This reduction of noise signals is essential for improving the fidelity of sound wave detection and analysis in SODAR systems, demonstrating the unique application of ferrite materials in high-frequency and noise-sensitive technologies, where signal clarity and noise reduction are critical.
The effectiveness of ferrite cores in suppressing electromagnetic interference (EMI) in cables and wires, which is analogous to their role in SODAR systems, has been thoroughly investigated [10,11]. Additionally, Technological advances in sense-amplifier circuit performance, such as pre-amplification strobing as well as noise-matched clipping, emphasize the significance of reducing noise for improved signal clarity [12]. Insight into the wider uses of ferrites in EMI suppression is also provided by the forecast and analysis of the “noise reduction impact of ferrite beads on electromagnetic emission from digital PCBs [13].
The present study reports the synthesis of Cu2+ ions substituted Mg-Co ferrites (Mg0.6-xCuxCo0.4Fe2O4 with x = 0.0,0.1,0.2, and 0.3) by a solid-state reaction method and evaluate the effect of Cu2+ substituting on the dc electrical, structural and magnetic properties of magnesium-cobalt ferrite” and to find a correlation between them. The solid-state method, widely used in materials science, involves directly reacting powdered reactants at high temperatures. It offers simplicity, cost-effectiveness, and the production of phase-pure products. This method enables thorough mixing at the atomic level, resulting in homogeneous and finely divided products. Different synthesis processes have specific advantages and considerations, emphasizing the importance of selecting the appropriate method based on desired characteristics, scalability, and application requirements. Solid-state synthesis offers precise control over crystallinity and phase purity, making it suitable for applications needing accurate stoichiometry and well-defined crystal structures.
The morphological and structural properties of the produced Mg0.6-xCuxCo0.4Fe2O4 were investigated by using standard characterization methods. DC electric resistivity of synthesized ferrite material has been evaluated by a two-probe method and the magnetic measurement has been done using a VSM. The findings of this comprehensive analysis recommend that the frequency magnetic and electronic device applications, including those in Sound Detection and Ranging (SODAR), offer advancements in signal quality and noise reduction in such sophisticated technologies.
It's pertinent to note that while this investigation seeks to improve ferrite noise reduction capabilities in SODAR applications, it specifically concentrates on the effects of Cu2+ ion substitution within a defined range. The findings of this research are primarily applicable to the development and application of ferrite cores in SODAR amplifier systems. Future studies could extend this scope to include other doping elements and investigate their impact on ferrite properties, potentially paving the way for new applications of ferrite materials in high-frequency and noise-sensitive technologies.
2. Materials & Methods
2.1. Chemicals
High-purity analytical grade (A.R) chemicals of transition metal oxides were used for standard ceramic synthesis. Magnesium Oxide (MgO ≥99.99%), Ferric oxide (Fe2O3 ≥99.99%), Copper oxide (CuO ≥99.99%), and Cobalt (II) oxide (CoO ≥99.99%), were purchased from Himedia. Acetone (C3H6O), Potassium Bromide (KBr), Silver (Ag), and Poly Vinyl Alcohol (C2H4O)x were purchased from Merck. No additional purification was required for all chemicals.
2.2. Synthesis of Cu2+ Substituted Mg-Co Ferrites
Cu2+ substituted Mg0.6-xCuxCo0.4Fe2O4(x=0.0,0.1,0.2, and 0.3) were prepared using a solid-state reaction technique. Analytical grade oxides Fe2O3, MgO, CoO, and CuO, were considered in stoichiometric proportions and grounded for 6 hours in an agate motor and pestle to obtain in powder form. Subsequently, the powder is calcined for four hours at 900 °C. The calcined samples are combined with a few drops of PVA binder, compacted into a disk-shaped pellet, and sintered at 1200 °C for four hours at a rate of 5°C per min while in the air. To prepare the pellets for use as electrodes, their surfaces are carefully polished, cleaned in acetone, and then covered in silver paste. Figure 1 depicts the schematic of the synthesis method of Cu-doped magnesium-cobalt ferrites. Additional characterization was done using the produced samples.
2.2.1. Structural Characterizations
The identification of phase formation of synthesized magnesium ferrite powder samples was done on a PANalytical XPERT-PRO diffractometer fitted along with Cu Kα radiation (λ=1.54060Å) at the scan rate of 2° per min in the 2θ range of 10°-80°. The observations were noted at 40 mA and 45 kV. The created samples' XRD patterns were evaluated with standard reference data cards from the “International Center of Diffraction Data” (ICDD) or the “Joint Committee on Powder Diffraction Standards” (JCPDS).
The structural and chemical variations are confirmed by the FTIR spectrometer (IR Prestige21 Shimadzu). The synthesized ferrite powdered samples were mixed with solid KBr (Potassium Bromide), grounded, and then pressed in a standard hydraulic press to form a spherical shape pellet for measurements. The spectrum of every synthesized sample was collected in the range between 200-4000cm-1 at room temperature.
2.2.2. Morphological and Elemental Characterization
FE-SEM: “Field Emission Scanning Electron Microscope (Carl Zeiss, EVO MA 15, Oxford Instruments, Inca Penta FETx3.JPG equipment”) operating at 30 kV was applied to assess the microstructure and morphology of the produced magnesium ferrite samples. The National Institutes of Health, USA, developed the public domain Java-based image processing application ImageJ version 1.53e, which was used to quantify the grain size from the electron micrographs [14].
2.2.3. Magnetic Measurements
The VSM (Lakeshore 735) was applied to measure the magnetization behaviour of the synthesized ferrite samples. Finely powdered samples of synthesized ferrites (approximately 125 mg each) were carefully mounted on the Vibrating Sample Magnetometer (Lakeshore 735) holder. To ensure correct alignment within the magnetic field of the VSM, the samples were isolated from other metallic components to prevent any interference. An external magnetic field at a magnetic field strength of 1Tesla was used, and the magnetization of the vibrating samples was recorded, producing a hysteresis loop. Every measurement was conducted at room temperature to maintain stability, as temperature fluctuations could alter magnetization behaviour. Following measurements, data analysis was performed to identify key magnetic properties: coercivity, remanence, and saturation magnetization. Rigorous calibration of the VSM was maintained throughout, with thorough cleaning post-use to prevent contamination.
2.2.4. DC Electrical Resistivity
The DC electrical resistivities of the synthesized magnetic ferrite samples were determined for conductivity investigation by using a two-probe method and determined between the temperatures of 303K and 873 K. Two electrodes were used to hold the pellet-shaped sample. Good ohmic contact was ensured by applying the silver paste to both surfaces of the pellet. The current and voltage measurements were carried out during rising temperatures. A chrome-aluminum thermocouple was applied to test the temperature of sample.
3. Results and Discussion
3.1. Identification and Interpretation of Crystal Structure by XRD Analysis
The phase purity, crystal structure, and structural parameters of the synthesized samples were verified by examining their XRD patterns. Figure 2 indicates the XRD patterns of the synthesized samples. XRD patterns with the corresponding (hkl) planes; (111), (220), (311), (400), (422), (511), and (440) were observed for all the samples. The XRD patterns were well matched with the standard diffraction patterns of cubic spinel structure with the space group Fd3m for every sample (JCPDS card no. 73-1720 and 22-1086) [15]. All of the reflections are more comprehensive than ceramic samples. The presence of broader peaks suggests that the size of the synthesized ferrite particles is small. No impurity peaks were observed. The XRD result confirms the synthesis of Cu2+ions substituted magnesium ferrites with phase purity and small crystallite size [16].
The lattice constants of the samples were computed with the equation below (eq. (1)) and the lattice constant (a) values for “the synthesized ferrite samples are reported in Table 1 below.
where d indicates inter-planar spacing and (h k l) signifies the Miller indices of a cubic crystal plane.
The value of lattice constant values in the samples show irregular changes with different levels of substitution x, in the compound. Specifically, the lattice constant grows when x, changes from 0.0 to 0.1, suggesting that the unit cell might be expanding. However, it decreases at x=0.2 hinting at a decrease in the space between atoms. Then, it grows again at x=0.3. These changes at different substitution levels indicate a modification in the distance and interactions between atoms in the crystal, which can significantly affect the material’s properties.
The introduction of Cu2+ ions has a greater ionic radius (0.72Å) as compared to Mg2+ ions (0.65 Å) [17], which could be causing these changes in the lattice constant. This might also be related to the incidence of Fe2+ ions having a greater radius (0.78 Å) than Fe3+ ions (0.64 Å). The differences in ionic sizes, along with changes in the shape and internal stress in the lattice, are likely causing the lattice constant to increase.
The average crystallite sizes (D(311)) of the synthesized Cu-doped Magnesium-Cobalt ferrite samples were determined with the Debye-Scherer formula (eq. 2):
Here D indicates average crystallite size, β presents the Full width at half maximum of the most substantial reflection in radians, θ signifies the angle that represents the position of the peak, λ denotes the wavelength of x-ray radiation which is equivalent to λ=1.5406 Å, and K denotes the shape factor of average crystallite, and its value is ~ 0.9.
The values of crystallite sizes for the synthesized ferrite samples are revealed in Table 1, which are in good agreement with earlier research [18]. The average crystallite sizes have been determined in the ranges between 57.29 to 48.57 nm, and the trend of this change is consistent with variations in the lattice constant as shown in Table 1. The “plot of lattice constant (a) along with crystallite size with Co content (x) is revealed in Figure 3. The crystallite size has a random value due to the randomness in the sintering condition and cation distribution” [19].
Average crystallite size is found in the ranges between 57.29 to 48.57 nm calculated using the Debye-Scherrer equation.
3.2. Fourier Transformed Infrared (FTIR) Spectroscopy
The infrared spectrum of Cu2+ substituted Mg0.6-xCuxCo0.4Fe2O4 with x=0.0,0.1,0.2, & 0.3 samples are revealed in Figure 4. Two absorption bands, ν1 & ν2, were observed which lie between 600cm-1 and 400 cm-1. These bands correspond to the lower and higher frequencies of the octahedral and tetrahedral metal-oxygen vibration respectively [20]. These bands were found in the wave number range as listed in Table 2. With increasing Cu2+ ion concentration, the value of ν1 is found within the range between 572.88 cm-1 to 582.52 cm-1 and values of ν2 in the range from 401.56- 407.96 cm-1. The cation distribution is the cause of the variation in the band positions. These band positions are consistent with earlier spinel ferrite studies [21].

Table 2.
Wave number value of Cu doped Mg0.6-xCuxCo0.4Fe2O4 (x = 0, 0.1, 0.2, and 0.3).
| Composition (x) | x = 0.0 | x = 0.1 | x = 0.2 | x = 0.3 |
|---|---|---|---|---|
| Tetrahedral ʋ1 (cm-1) | 572.88 | 574.81 | 579.63 | 582.52 |
| Octahedral ʋ2 (cm-1) | 410.24 | 407.96 | 406.03 | 401.56 |
3.3. Assessment of Morphology Using SEM (Scanning Electron Microscopy)
SEM micrographs of the Cu2+ substituted Mg0.6-xCuxCo0.4Fe2O4 with x = 0.0,0.1,0.2, and 0.3 are shown in Figure 5. The micrograph indicates the growth of regular cubic crystals with the mean grain size determined by using Image J software, ranging from 1 to 1.5 µm, depending on the substitution of Cu2+. Copper has a major effect on the microstructure of produced ferrite samples due to facilitated liquid phase sintering. Furthermore, the force driving grain boundary movement and the force resisting it due to pores can be considered competing factors throughout the grain growth process [22]. Grain boundaries cover pores as a result of the force created by the thermal energy during sintering, which decreases the volume of the pores and raises the material's density. If each grain is subjected to a homogeneous driving force, the grain sizes will distribute uniformly. The current investigation's non-homogeneous driving force on the grains is what results in the non-uniformity of grain size [23]. The observed microstructures of synthesized materials give them suitable electromagnetic properties such as magnetization and permeability.
Synthesized ferrites show the growth of regular cubic crystals with average grain size ranges from 1-1.5 µm, depending on the substitution of Cu2+
3.4. Magnetic Measurements
The magnetic measurements were done with VSM, to determine the values of saturation magnetization (Ms) and coercivity (Hc) of the Cu2+ substituted Mg0.6-xCuxCo0.4Fe2O4 (x = 0.0, 0.1, 0.2, and 0.3) at a magnetic field strength of 1T at room temperature. Figure 6 displays a plot of saturation magnetization plotted against the applied magnetic field for” various contents of produced ferrite samples. The figure demonstrates that magnetization rises as the applied magnetic field increases.
The Ms and Hc of synthesized ferrite samples were attained from the hysteresis loops as revealed in Figure 6 and their values are presented in Table 3 below. It was found that the value of Ms first increased and then reduced with the increasing dopant (Cu2+) concentration. The coercivity was found to depend on Cu2+ concentration and ranges from 157 Oe to 256 Oe. This result is comparable with prior studies indicating that magnetic characteristics are improved as a result of cation substitution. In the present research, Hoyos-Sifuentes et al. noted the synthesis of magnesium ferrite material (MgFe2O4) and a MS value of 17 emu/g [24]. Balavijayalakshmiet al in their work synthesized the cobalt-substituted magnesium ferrites and reported an increase in Ms, Mr (Remanent Magnetization), and Hc as the content of cobalt substitution rises, attributed to the modification in the content of cation distribution [25]. Thus, the excellent “magnetic behavior of the synthesized Cu-doped Mg-Co ferrites can be utilized for high-frequency magnetic storage device applications.
Table 3.
Magnetization and coercivity values for Mg0.6-xCuxCo0.4Fe2O4.
| Parameters | x = 0.0 | x = 0.1 | x = 0.2 | x = 0.3” |
|---|---|---|---|---|
| Magnetization Ms [emu/g] | 19.95 | 23.68 | 20.30 | 25.64 |
| Coercivity Hc | 157 | 266 | 256 | 193 |
The magnetic behavior of the Cu-substituted Mg-Co ferrites samples can be described by Neel's model. A ferrite's coercivity and saturation magnetization are determined by its density, microstructure, composition, and cation occupancy. As per “Neel's two-sublattice model, the variation between the magnetic moments of every sublattice determines the magnetic moment per formula unit. The total magnetization value can be obtained by their differences:
here MA and MB indicate the A and B sublattice’s magnetic moments per formula unit respectively” in μB (Bohr magneton).
M= |MB-MA|
From Table 3, the observed alteration in saturation magnetization, i.e.; first increase and then decrease with the rising dopant (Cu2+) content, indicates the change in the “cationic distribution in 2 interstitial sites; tetrahedral (A) and octahedral (B) [26]. With the substitution of Cu2+ on the B site, the drop in B-site magnetization produces a reduction in the ferrite's magnetization value (Ms), and this substitution of Cu2+ ions into the B-sites will promote the migration of Fe3+ ions into the A-site, which then increase magnetization of A-site.
The different exchange interactions, like A-B, A-A, & B-B based on the distribution of magnetic as well as non-magnetic ions at the A and B sites, can also be applied to describe the variations in Ms value. The A-A & B-B interactions are” known to be subordinate to the A-B interaction, which is the strongest. As the Cu level increased, the iron ions moved to the A site, exhibiting less A-B interaction with iron on the B site and thus the ferromagnetic behavior decreased with increasing Cu2+ concentration. Moreover, the coercivity first increased and then decreased due to the greater anisotropic constant of the Cu2+ substituted Mg-Co ferrites, which is completely connected to the samples’ bulk density. This result indicates that samples with high coercivity can be utilized for applications in microwave absorption systems, DC-DC converters, MLCIs, and switch-mode power supplies.
3.5. DC Electrical Resistivity Studies
The prepared pellets of the synthesized samples have been examined by two probe methods to determine the resistivity of Cu2+ substituted Mg0.6-xCuxCo0.4Fe2O4 with x = 0.0, 0.1,0.2, and 0.3 samples in the range 300K - 873K. The sample temperature was determined with a chrome-alumni thermocouple. The resistivity of the sample is obtained by using equation (3) below:
ρ = RbA/L
Rb signifies the “resistance of the sample, A indicates the sample’s surface area and is given by πr2, r represents the sample pellet radius, and L denotes the sample’s thickness.
The plot of log ρ against 1/T is revealed in Figure 8. The” plot obeys the “Arrhenius relation (equation (4)), presenting the semiconducting behavior of synthesized samples [27].
Where k indicates the Boltzmann constant, T presents the absolute temperature, denotes the activation energy for conduction, presents the resistivity at 0K, and shows the resistivity of the material at TK.
It is clear from the variation of electrical resistivity (logρ) with temperature (1/T) curves (at different Cu2+ concentrations) that each plot adheres to the Arrhenius relation. The resistivity of ferrite samples (at different Cu2+ concentrations) decreases as the temperature rises, showing that the samples are” semiconducting. The DC electrical resistivity was maximum with a value of ~ 2.4×10⁶ without copper substitution in magnesium-cobalt ferrite samples. With the copper substitution, the electrical resistivity was calculated and found to decline from 1.4 x 10⁶ Ω-cm (for x = 0.1) to 6.7 x 10⁵ Ω-cm (for x = 0.3). It shows that with the increase in Cu cation concentrations synthesized ferrite samples show a decrease in resistivity. The increased resistivity value is caused by the smaller particle size. Large numbers of grain boundaries present in smaller grains act as locations where electrons can be scattered, thus increasing the resistivity. Bharathi et al. in a study, reported the temperature-dependent DC electrical resistivity and the semiconducting behavior of synthesized Cu2+ substituted Mg-Co ferrite [28]. This result is in line with our study, which showed the decrease in electrical resistivity dependent on temperature and cation substitution and the semiconducting nature of synthesized copper-doped Mg-Co ferrites.
Figure 9 displays the activation energy plot of the samples against the content of Cu2+. The activation energy and sample resistivity decrease as the concentration content rises because of the hopping mechanism [29]. The activation energy values for Mg0.6-xCuxCo0.4Fe2O4 (x = 0, 0.1, 0.2, and 0.3) are shown in Table 4.
On the adjacent octahedral sites (B-sites) of the ferrite structure, electrons jump (or hop) from Fe2+ to Fe3+, which causes electrical conduction in ferrites containing Cu2+ ions. To preserve the neutrality of the spinel lattice, oxygen vacancies are created during the high-temperature sintering of samples owing to the conversion of Fe3+ into Fe2+ ions. The result of this study is consistent with a previous report, where Parajuli et al. synthesized magnesium-substituted copper-cobalt ferrites and reported their electrical properties and activation energy based on the hopping mechanism [30].
4. Conclusions
This study successfully synthesized Cu2+ substituted Mg-Co ferrites (Mg0.6-xCuxCo0.4Fe2O4 with x values of 0.0, 0.1, 0.2 & 0.3) with solid-state reaction approach, showcasing the effective incorporation of copper into the ferrite structure. The resulting materials displayed a single-phase cubic spinel structure across every sample, as validated using XRD analysis. This structural integrity is crucial for applications requiring precise magnetic and electrical properties. Incorporating larger Cu2+ ions increased the lattice constant, highlighting the impact t of ionic substitution on the ferrite's crystal structure. SEM showed uniformly sized cubic crystals, with grain sizes ranging between 1-1.5µm, indicating a homogeneous synthesis process. Further structural confirmation came from FTIR, where the observed absorption bands aligned with the characteristic metal-oxygen vibrations in octahedral and tetrahedral sites, consistent with spinel ferrites. These Cu-doped ferrites' electrical resistivity and magnetic properties showed significant variation with the level of Cu2+ substitution. A decrease in electrical resistivity with increasing Cu2+ content suggests enhanced electrical conductivity, making these materials suitable for applications with desirable lower resistivity and semiconducting behavior. Specifically, the drop in activation energy for electrical conductivity with higher Cu2+ concentration improves the efficiency of high-frequency electronic devices. Magnetic measurements revealed increased saturation magnetization and coercivity with Cu2+ concentration, indicating the potential for tailored magnetic properties in device applications.
The relevance of these findings extends to the application of ferrites in SODAR systems. The synthesized materials, with their high DC electrical resistivity and adjustable coercivity, offer promising prospects for enhancing signal quality and noise reduction in such sophisticated technologies. In SODAR pre-amplifiers, where signal clarity and noise suppression are paramount, Cu-doped Mg-Co ferrites' tailored magnetic and electrical properties could significantly improve environmental monitoring accuracy and reliability. This study not only underscores the versatility of ferrites in high-frequency and noise-sensitive applications but also paves the way for future research into other doping elements to further expand the application scope of ferrite materials in advanced technological systems.
Authors Contribution
All authors contributed significantly to the research. Mr. Kuswanthkumar S. led the synthesis and characterization of the materials, Ms. Kavyasri D. and Mr. Mahesh P. conducted the experimental analyses, while Prof. M P Rao and Prof. K Samatha supervised the project and contributed to the manuscript's critical review and editing.
Data Availability
The data supporting this study's findings are available from the corresponding author, Mr. Kuswanthkumar S.; upon reasonable request. The data are not publicly available due to privacy or ethical restrictions.
Conflicts of Interest
The authors declare no conflict of interest related to the study presented in this manuscript. All financial and personal relationships that could influence the work have been disclosed.
References
- Reddy, D.H.K.; Yun, Y.S. Spinel ferrite magnetic adsorbents: Alternative future materials for water purification? Coordination Chemistry Reviews 2016, 315, 90. [Google Scholar] [CrossRef]
- Chandramouli, K.; Rao, P.A.; Suryanarayana, B.; Raghavendra, V.; Mercy, S.J.; Parajuli, D.; Taddesse, P.; Mulushoa, S.Y.; Mammo, T.W.; Murali, N. Effect of Cu substitution on magnetic and DC electrical resistivity properties of Ni–Zn nano ferrites. Journal of Materials Science: Materials in Electronics 2021, 32, 15754–15762. [Google Scholar] [CrossRef]
- Mahmoud, W.E.; Shams, M.; and Ali, M.F. ; Magnetic properties of spinel ferrites synthesized by sol-gel method. Journal of Magnetism and Magnetic Materials 2016, 400, 38–46. [Google Scholar] [CrossRef]
- Eltabey, M.M.; Massoud, A.M.; and Radu, C. Microstructure and superparamagnetic properties of Mg-Ni-Cd ferrites nanoparticles. Advances in Materials Science and Engineering 2014, 492832. [Google Scholar] [CrossRef]
- Rahman, M.A.; Islam, M.T.; Singh, M.S.J.; Samsuzzaman, Md.; and Chowdhury, M.E.H. ; Synthesis and characterization of Mg–Zn ferrite based fexible microwave composites and its application as SNG metamaterial. Scientific Reports 2021, 11, 7654. [Google Scholar] [CrossRef] [PubMed]
- Ramanjaneyulu, K.; Suryanarayana, B.; Raghavendra, V.; Murali, N.; Parajuli, D.; Chandramouli, K. Synthesis, microstructural and magnetic properties of Cu doped Mg0.5Zn0.5Fe2O4 ferrites. Solid State Technology 2021, 64, 7192–7200. [Google Scholar]
- Varma, P.P.; Suryanarayana, B.; Raghavendra, V.; Parajuli, D.; Murali, N.; Chandramouli, K. Effect of Cr Substitution on Magnetic Properties of Co-Cu Nano Ferrites. Solid State Technology 2020, 63, 8820–8827. [Google Scholar]
- Balavijayalakshmi, J.; Sudha, T.; &, *!!! REPLACE !!!*; Karthika, K. (2015). Investigation on structural and magnetic properties of cobalt doped magnesium ferrite nanoparticles.
- Ma, D.; Lu, J.; Fang, X.; Yang, K.; Wang, K.; Zhang, N.; Han, B.; Ding, M. Parameter Modeling Analysis of a Cylindrical Ferrite Magnetic Shield to Reduce Magnetic Noise. IEEE Transactions on Industrial Electronics 2021, 69, 991–998. [Google Scholar] [CrossRef]
- Samir, A.; Wang, J.; & Fujiwara, O.; Fujiwara, O. A Practical Approach for Estimation of Load Effect Produced by Ferrite Core Attached to Wire above a Ground Plane. Ieej Transactions on Electronics. Information and Systems 2000, 120, 8–13. [Google Scholar] [CrossRef] [PubMed]
- Tsui, F. Improving the Performance of the Sense-Amplifier Circuit Through Pre-Amplification Strobing and Noise-Matched Clipping. IRE Transactions on Electron. Comput. 1962, 11, 677–683. [Google Scholar] [CrossRef]
- Miyashita, T.; Nitta, S.; Mutoh, A. Prediction of noise reduction effect of ferrite beads on electromagnetic emission from a digital PCB. 1998 IEEE EMC Symposium. International Symposium on Electromagnetic Compatibility. Symposium Record (Cat. No.98CH36253) 1998, 2, 866–871. [Google Scholar] [CrossRef]
- Samir, A.; Fujiwara, O. Calculation of load effect produced by ferrite core attached to wire above a ground plane. 1999 Asia Pacific Microwave Conference. APMC'99. Microwaves Enter the 21st Century. Conference Proceedings (Cat. No.99TH8473) 1999, 1, 182–185. [Google Scholar] [CrossRef]
- Schneider, C.A.; Rasband, W.S.; Eliceiri, K.W. NIH Image to ImageJ: 25 years of image analysis. Nature Methods 2012, 9, 671–675. [Google Scholar] [CrossRef]
- Abraham, A.G.; Manikandan, A.; Manikandan, E.; Vadivel, S.; Jaganathan, S.K.; Baykal, A.; Renganathan, P.S. Enhanced magneto-optical and photo-catalytic properties of transition metal cobalt (Co2+ ions) doped spinel MgFe2O4 ferrite nanocomposites. Journal of Magnetism and Magnetic Materials 2018, 452, 380–388. [Google Scholar] [CrossRef]
- Kumar, S.R.; Priya, G.V.; Aruna, B.; Raju, M.K.; Parajuli, D.; Murali, N.; Verma, R.; Batoo, K.M.; Kumar, R.; Narayana, P.L. Influence of Nd3+ substituted Co0.5Ni0.5Fe2O4 ferrite on structural, morphological, dc electrical resistivity and magnetic properties. Inorganic Chemistry Communications 2022, 136, 109132. [Google Scholar] [CrossRef]
- Shao, L.; Sun, A.; Zhang, Y.; Yu, L.; Suo, N.; Zuo, Z. Comparative study on the structure and magnetic properties of Ni-Mg-Co ferrite doped with Al and rare earth elements. Journal of Materials Science: Materials in Electronics 2021, 32, 5339–5352. [Google Scholar] [CrossRef]
- Shafiee, S.; Arab, A.; Riahi-Nouri, N. Enhanced magnetic permeability in Ni1−x(Zn0.6Mg0.2Cu0.2)xFe2O4 synthesized by auto combustion method. Bulletin of Materials Science 2021, 44, 1–9. [Google Scholar] [CrossRef]
- Garg, A.; Pal, D. Inferring metal binding sites in flexible regions of proteins, Proteins: Structure. Function, and Bioinformatics 2021, 89, 1125–1133. [Google Scholar] [CrossRef] [PubMed]
- Monisha, P.; Priyadharshini, P.; Gomathi, S.S.; Pushpanathan, K. Ferro to superparamagnetic transition: Outcome of Ni doping in polyethylene glycol capped CoFe2O4 nanoparticles. Journal of Alloys and Compounds 2021, 856, 157447. [Google Scholar] [CrossRef]
- Komali, C.; Murali, N.; Parajuli, D.; Ramakrishna, A.; Ramakrishna, Y.; Chandramouli, K. Effect of Cu2+ substitution on structure, morphology, and magnetic properties of Mg-Zn spinel ferrite. Indian Journal of Science and Technology 2021, 14, 2309–2316. [Google Scholar] [CrossRef]
- Hankare, P.P.; Patil, R.P.; Jadhav, A.V.; Pandav, R.S.; Garadkar, K.M.; Sasikala, R.; Tripathi, A.K. Synthesis and characterization of nanocrystalline Ti-substituted Zn ferrite. Journal of Alloys and Compounds 2011, 509, 2160–2163. [Google Scholar] [CrossRef]
- Thorat, L.M.; Patil, J.Y.; Nadargi, D.Y.; Ghodake, U.R.; Kambale, R.C.; Suryavanshi, S.S. Co2+ substituted Mg–Cu–Zn ferrite: Evaluation of structural, magnetic, and electromagnetic properties. Journal of Advanced Ceramics 2018, 7, 207–217. [Google Scholar] [CrossRef]
- Hoyos-Sifuentes, D.H.; Resendiz-Hernandez, P. J.; Diaz-Guillen, J.A.; Ochoa-Palacios, R.M. and, Altamirano-Guerrero, G.; Synthesis and characterization of MgFe2O4 nanoparticles and PEG-coated MgFe2O4 nanocomposite. Journal of Materials Research and Technology 2022, 18, 3130–3142. [Google Scholar] [CrossRef]
- Balavijayalakshmi, J.; and Sudha, T. ; Effect of Cobalt Substitution on Structural and Magnetic Properties of Magnesium Ferrite Nanoparticles. In: Ebenezar, J. (eds) Recent Trends in Materials Science and Applications, Springer Proceedings in Physics 2017, 189, 289–297. [Google Scholar] [CrossRef]
- Xavier, S.; Thankachan, S.; Jacob, B.P.; Mohammed, E.M. Effect of sintering temperature on the structural and magnetic properties of cobalt ferrite nanoparticles, Nanosystems: Physics; Chemistry; Mathematics. 2013; 4, 430–437. Available online: https://cyberleninka.ru/article/n/effect-of-sintering-temperature-on-the-structural-and-magnetic-properties-of-cobalt-ferrite-nanoparticles.
- Vergis, B.R.; Kottam, N.; Krishna, R.H.; and Kumar, G.A. ; Comparison of magnetic and dielectric properties of transition metal nanospinel ferrites, MFe2O4, (M = Co, Cu, Ni, Zn) synthesized by one-pot combustion route, Materials Today: Proceedings. 2021; 49, 870–877. [Google Scholar] [CrossRef]
- Bharathi, R.V.; Raju, M.K.; Uppugalla, S.; Raghavendra, V.; Parajuli, D.; Suryanarayana, B.; Mulushoa, S.Y.; Murali, N.; Samatha, K. Cu2+ substituted Mg-Co ferrite has improved dc electrical resistivity and magnetic properties. Inorganic Chemistry Communications 2023, 149, 110452. [Google Scholar] [CrossRef]
- Kaiser, M.; Hashhash, A.; Hassan, H.E. Dielectric behavior and complex impedance analysis of Ti-doped Mg0.5Cu0.5Mn0.4Fe1.6O4 ferrites. Applied Physics A 2021, 127, 1–13. [Google Scholar] [CrossRef]
- Parajuli, D.; Murali, N.; Rao, A.V.; Ramakrishna, A.; Mulushoa, S., Y.; Samatha, K. ; Structural, dc electrical resistivity and magnetic investigation of Mg, Ni, and Zn substituted Co-Cu nano spinel ferrites. South African Journal of Chemical Engineering 2022, 42, 106–114. [Google Scholar] [CrossRef]
Figure 1.
Schematic representation of the synthesis Cu-doped Magnesium-Cobalt Ferrites process Characterizations.
Figure 1.
Schematic representation of the synthesis Cu-doped Magnesium-Cobalt Ferrites process Characterizations.
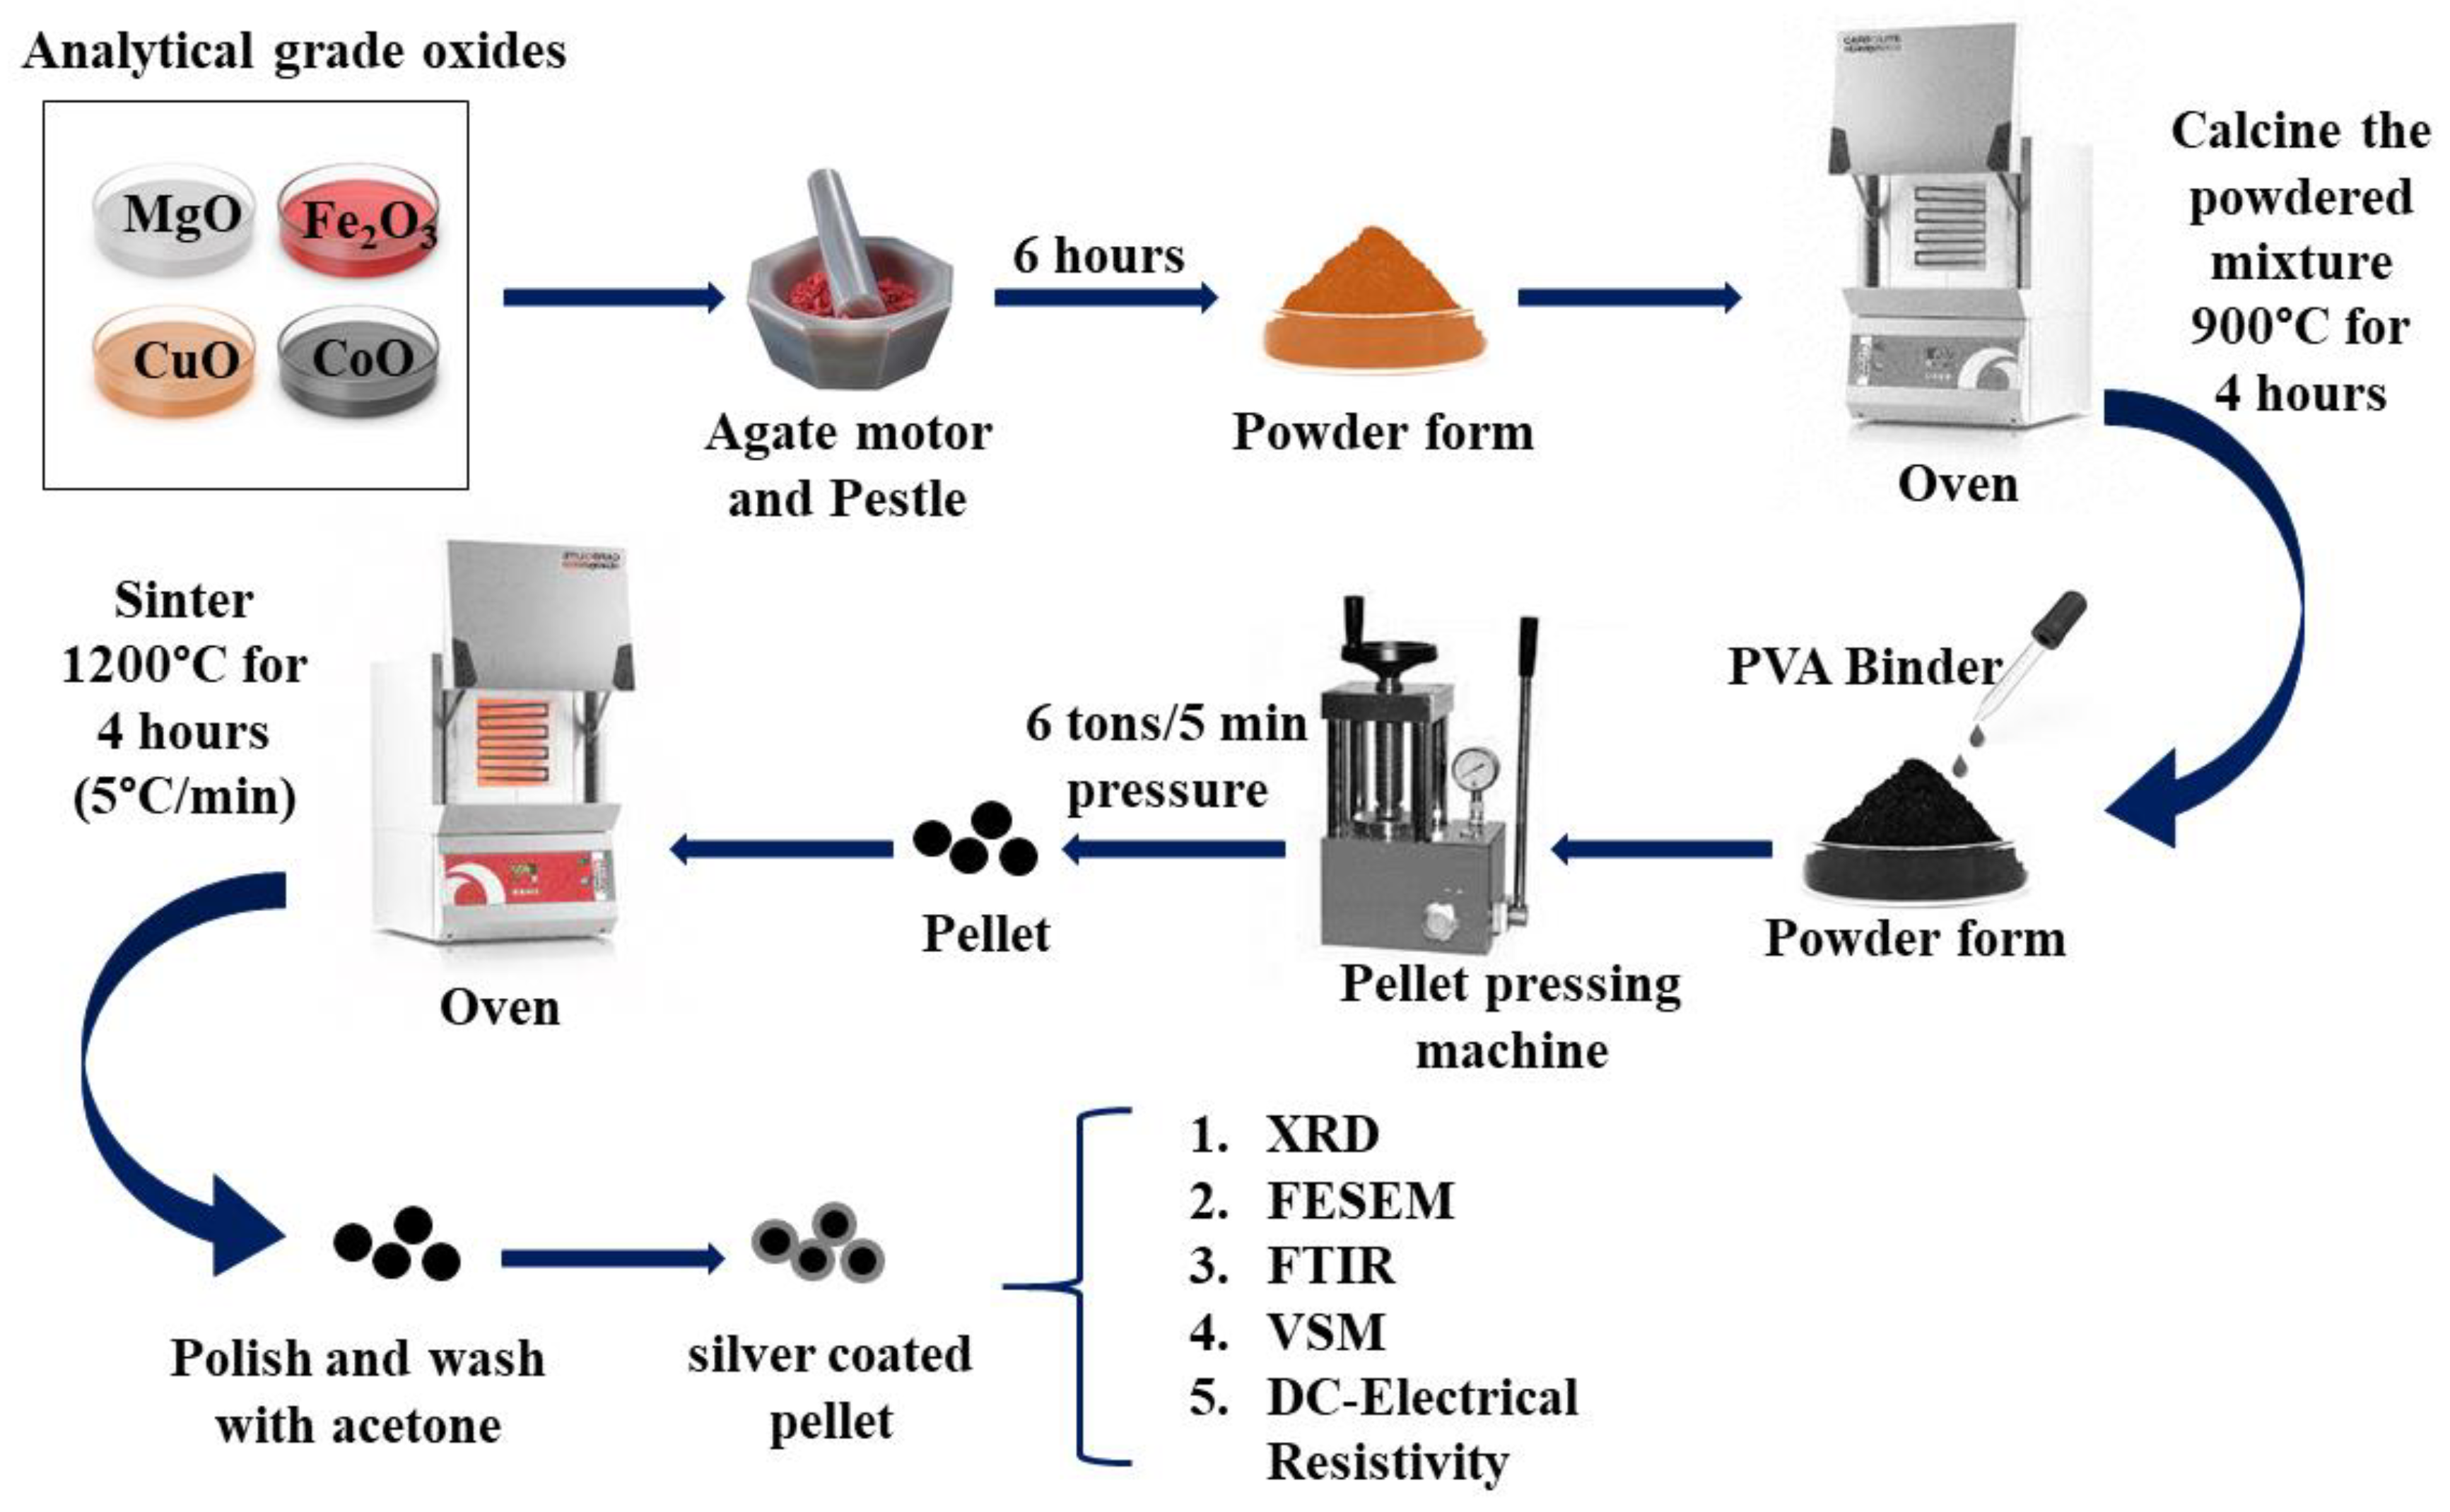
Figure 2.
XRD patterns of Mg0.6-xCuxCo0.4Fe2O4 (x = 0, 0.1, 0.2, and 0.3).
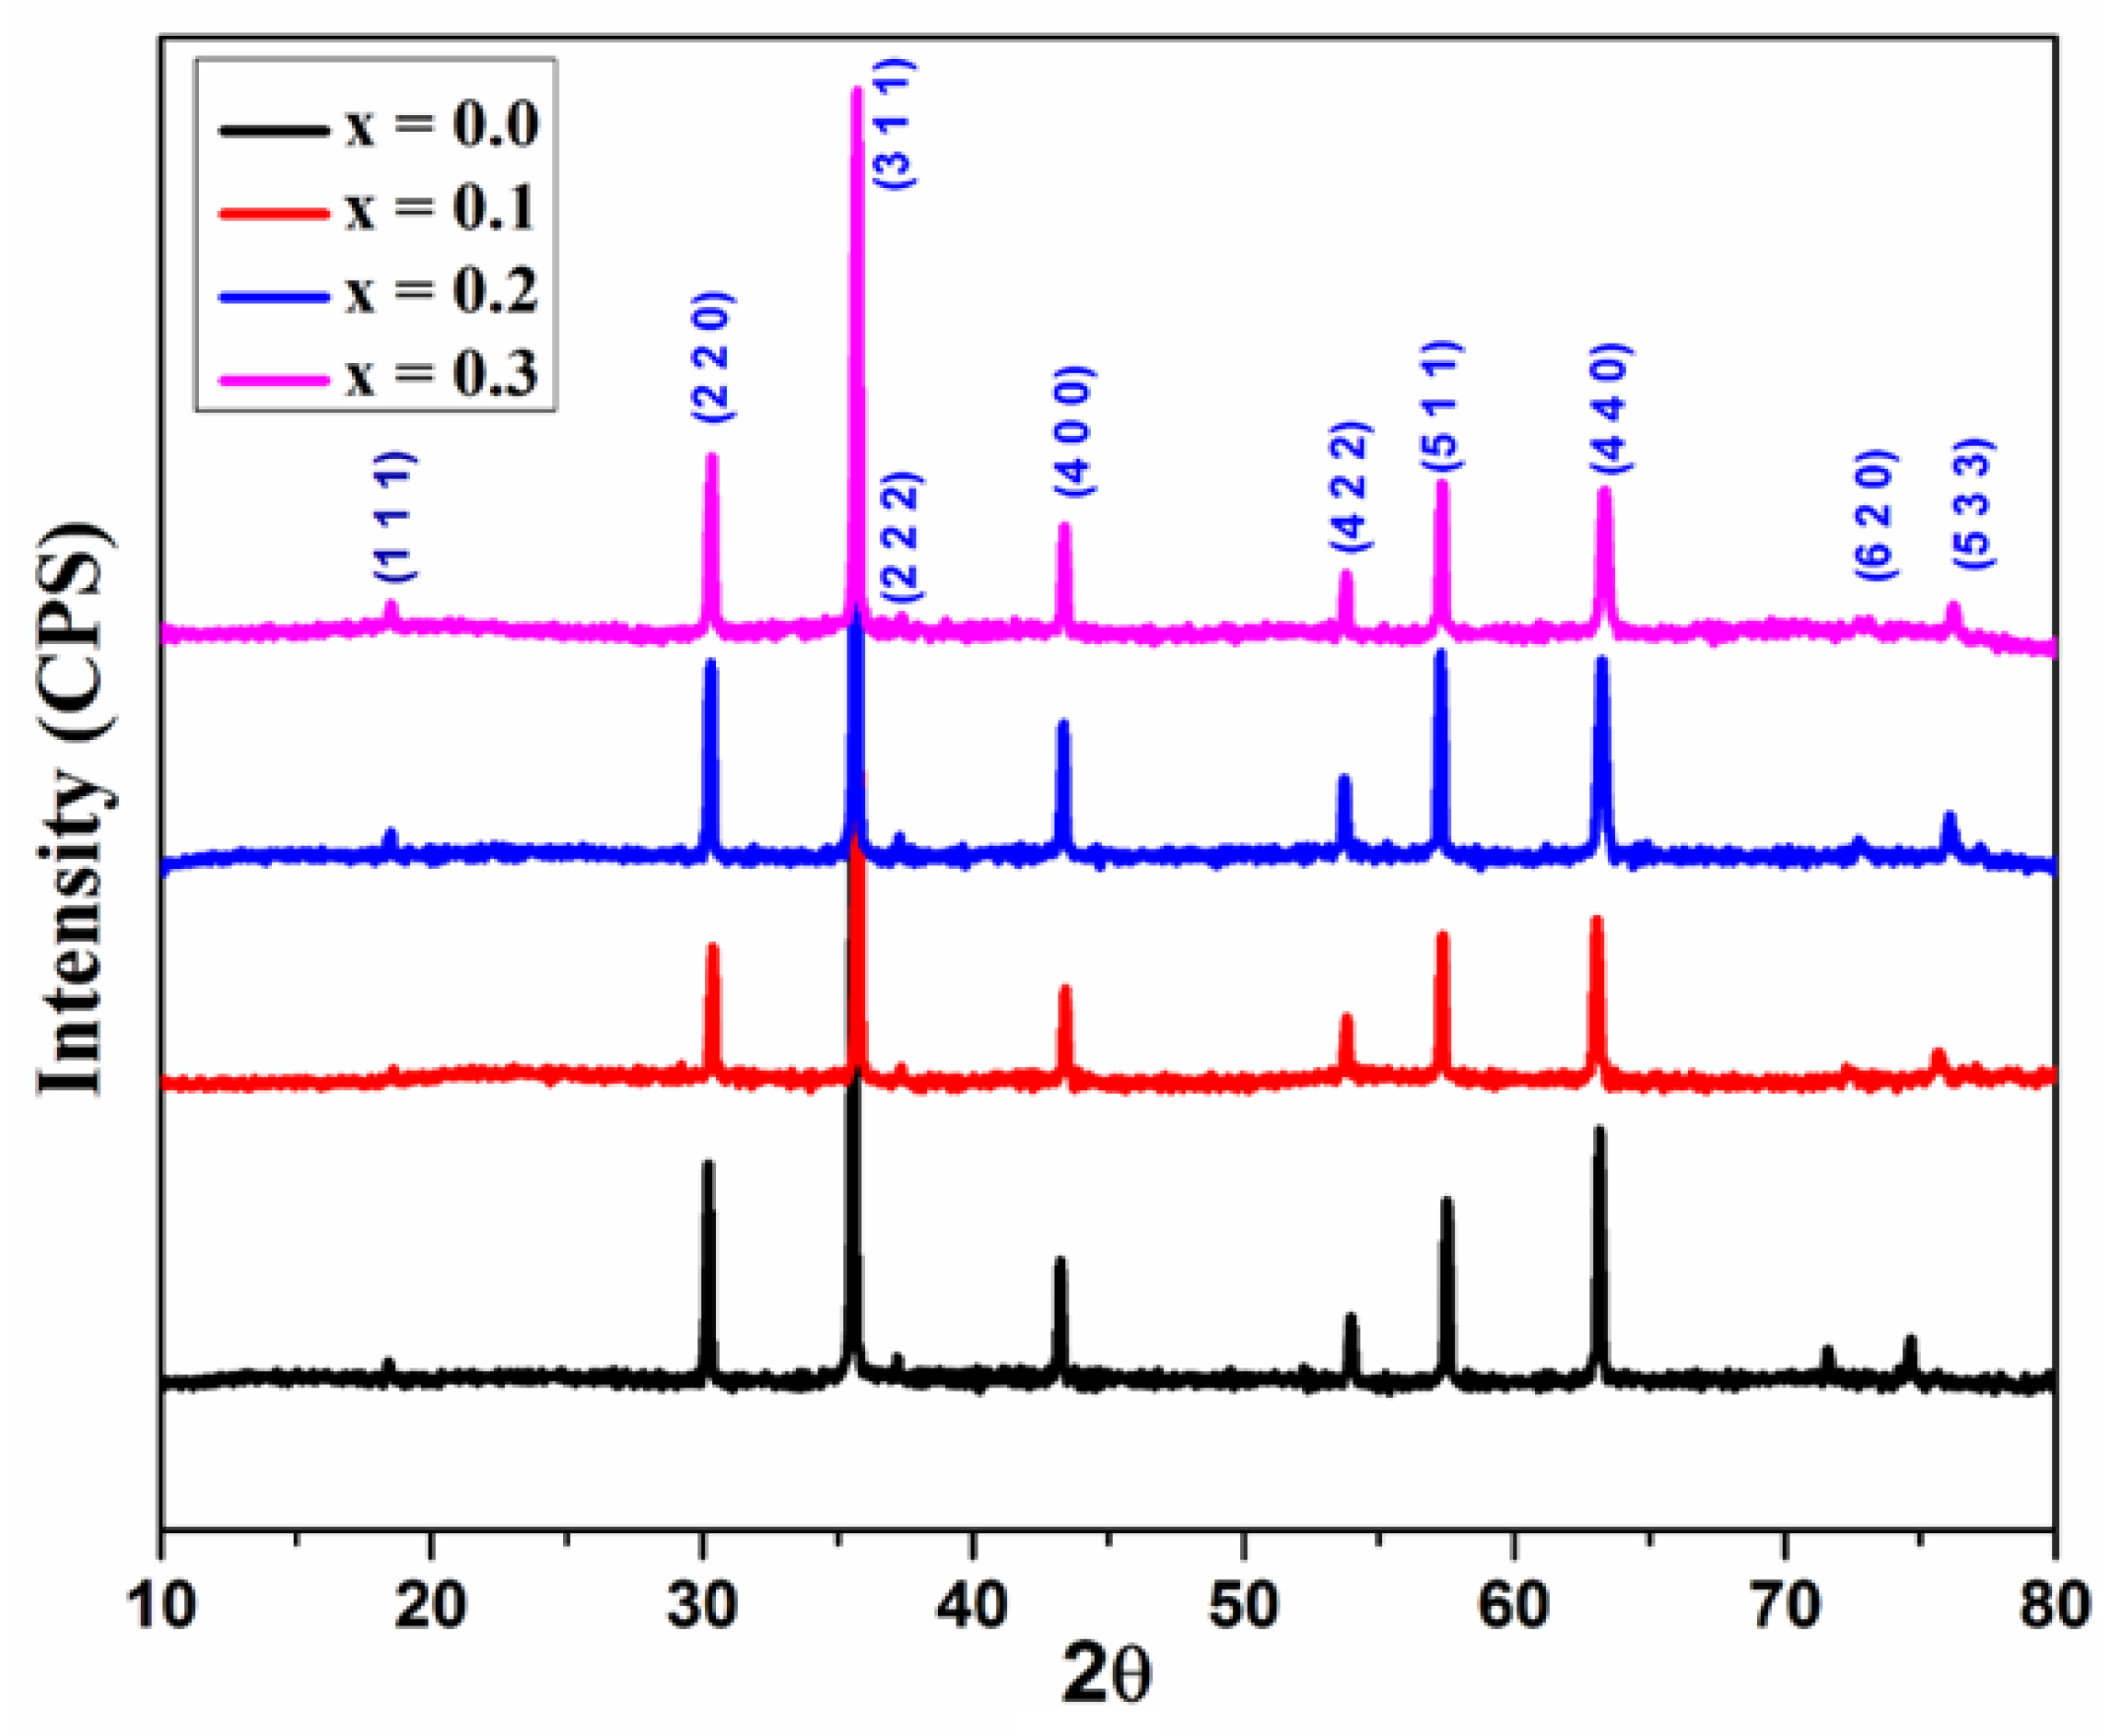
Figure 3.
The plot of crystallite size of Mg0.6-xCuxCo0.4Fe2O4 (x = 0.0, 0.1, 0.2, and 0.3) and lattice constant.
Figure 3.
The plot of crystallite size of Mg0.6-xCuxCo0.4Fe2O4 (x = 0.0, 0.1, 0.2, and 0.3) and lattice constant.
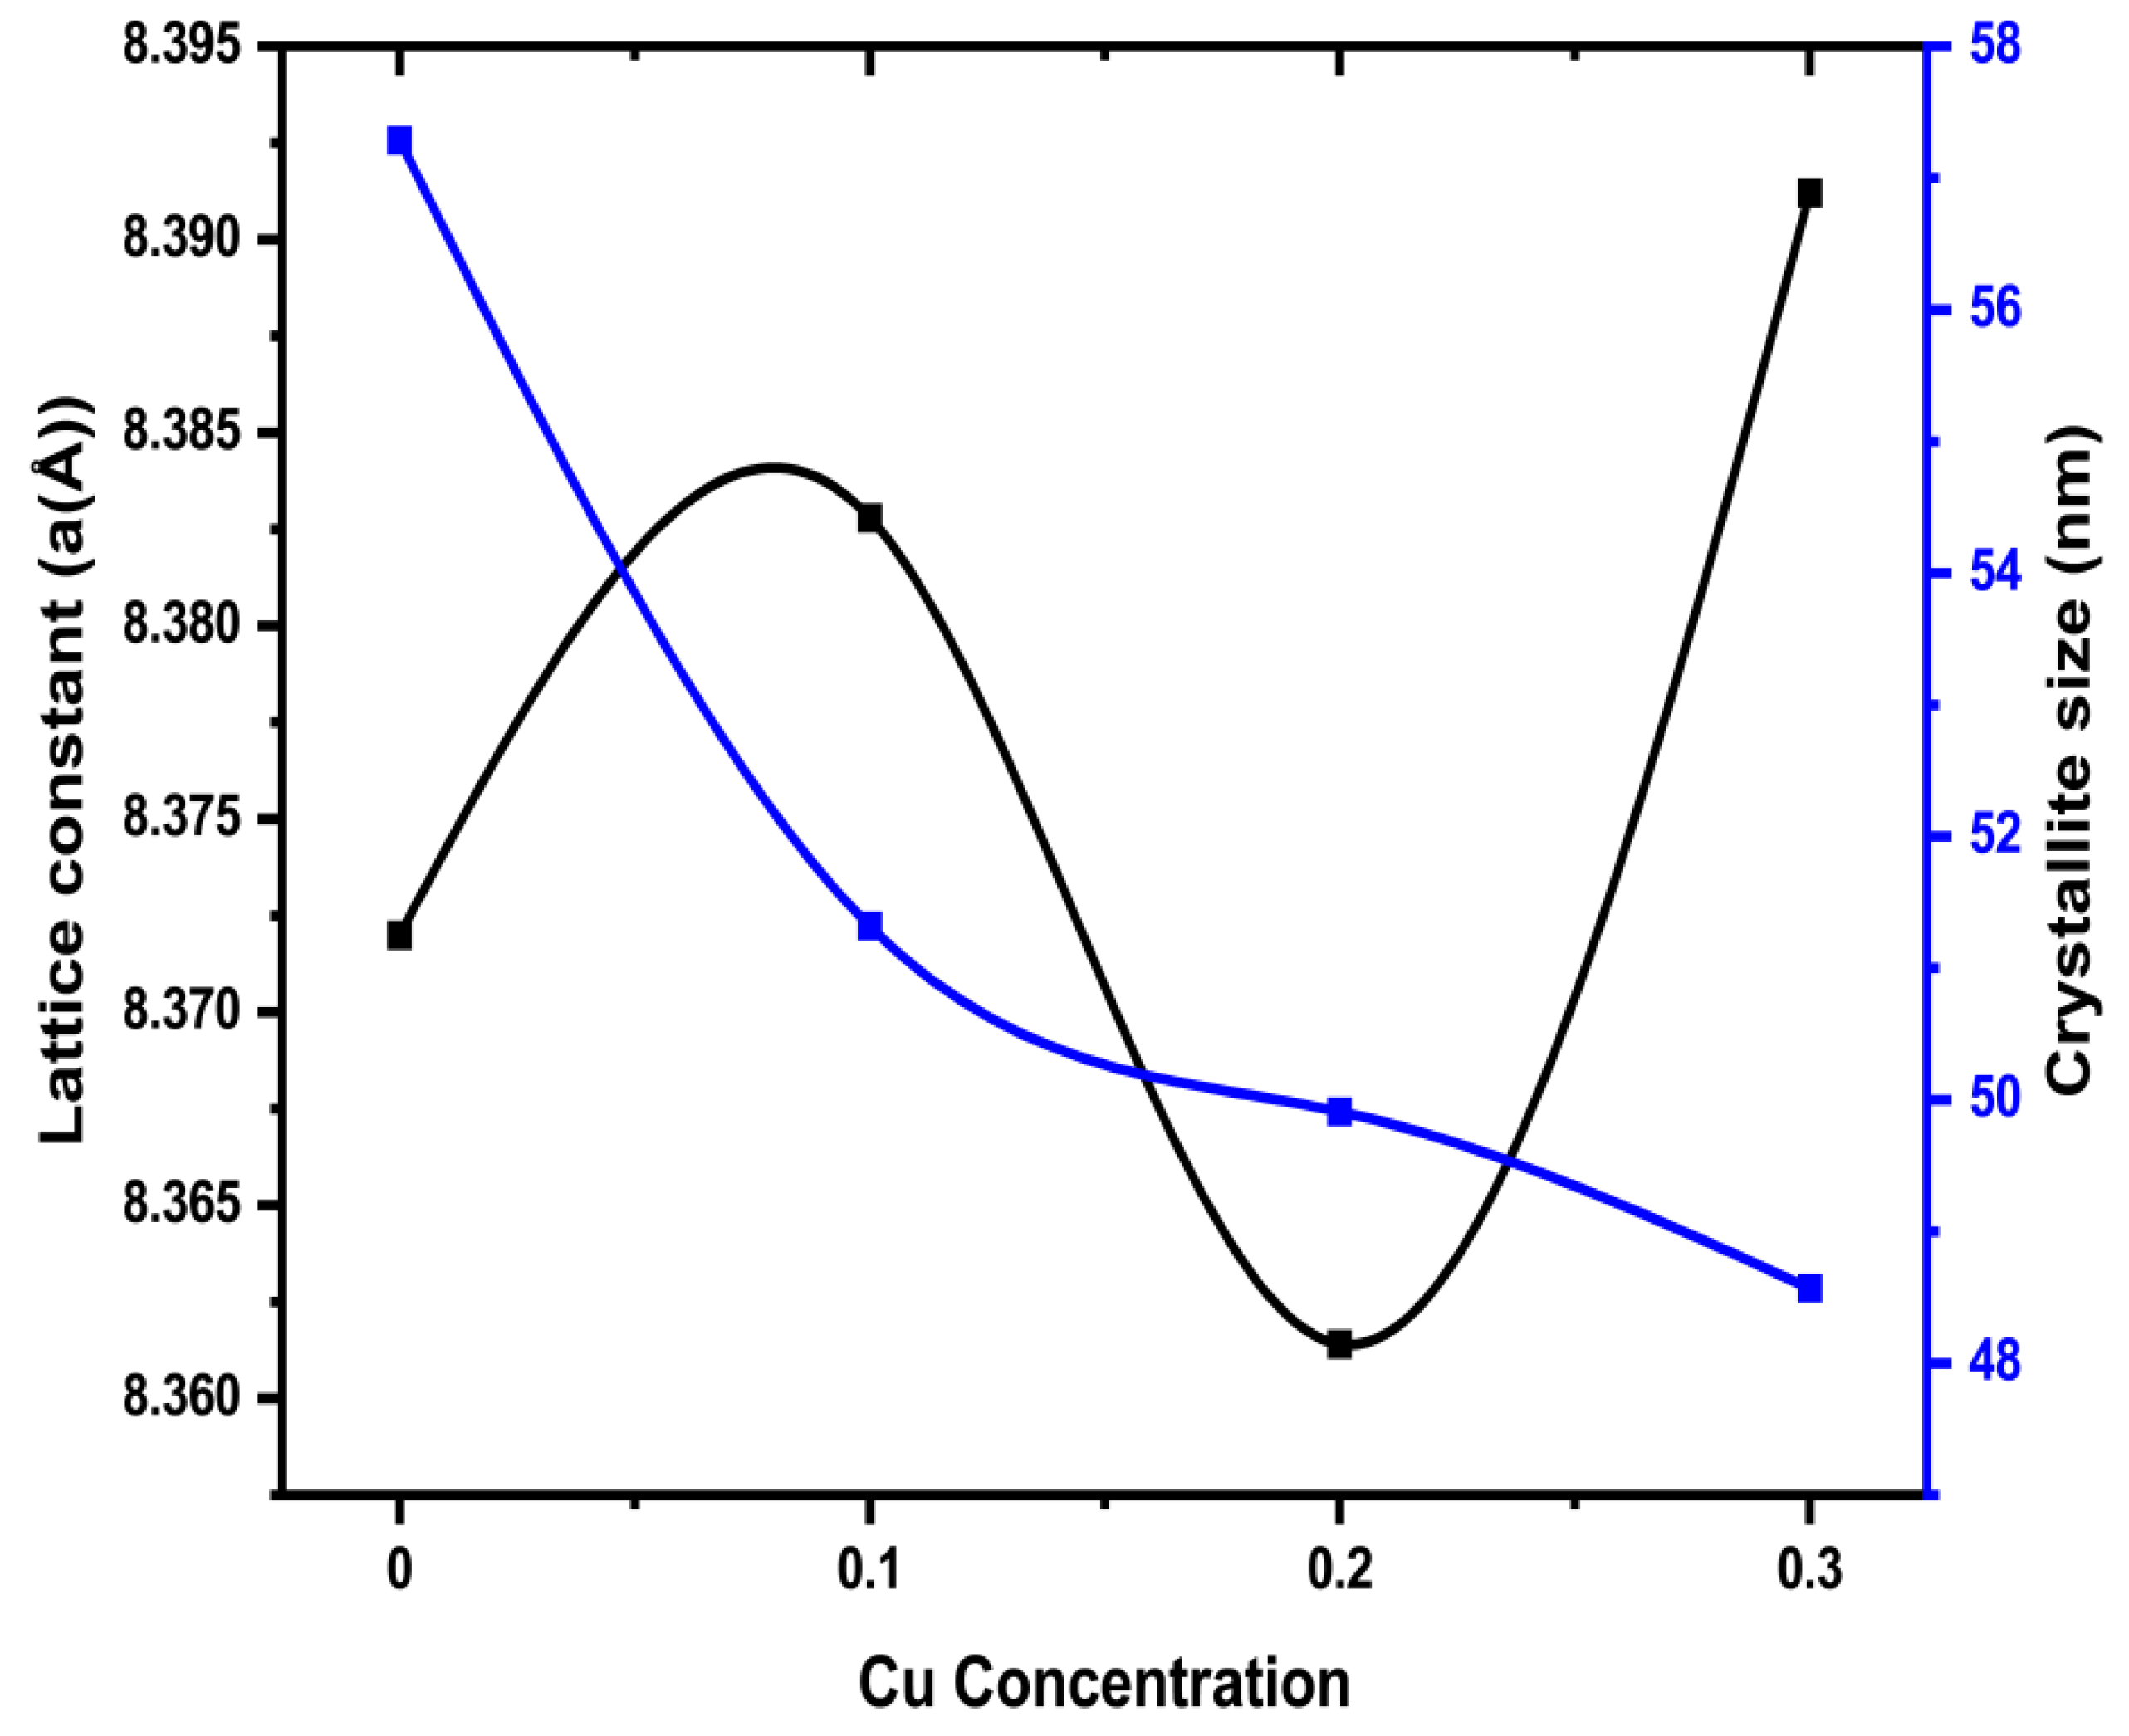
Figure 4.
Fourier transform infrared spectra of Mg0.6-xCuxCo0.4Fe2O4 (x = 0, 0.1, 0.2, and 0.3).
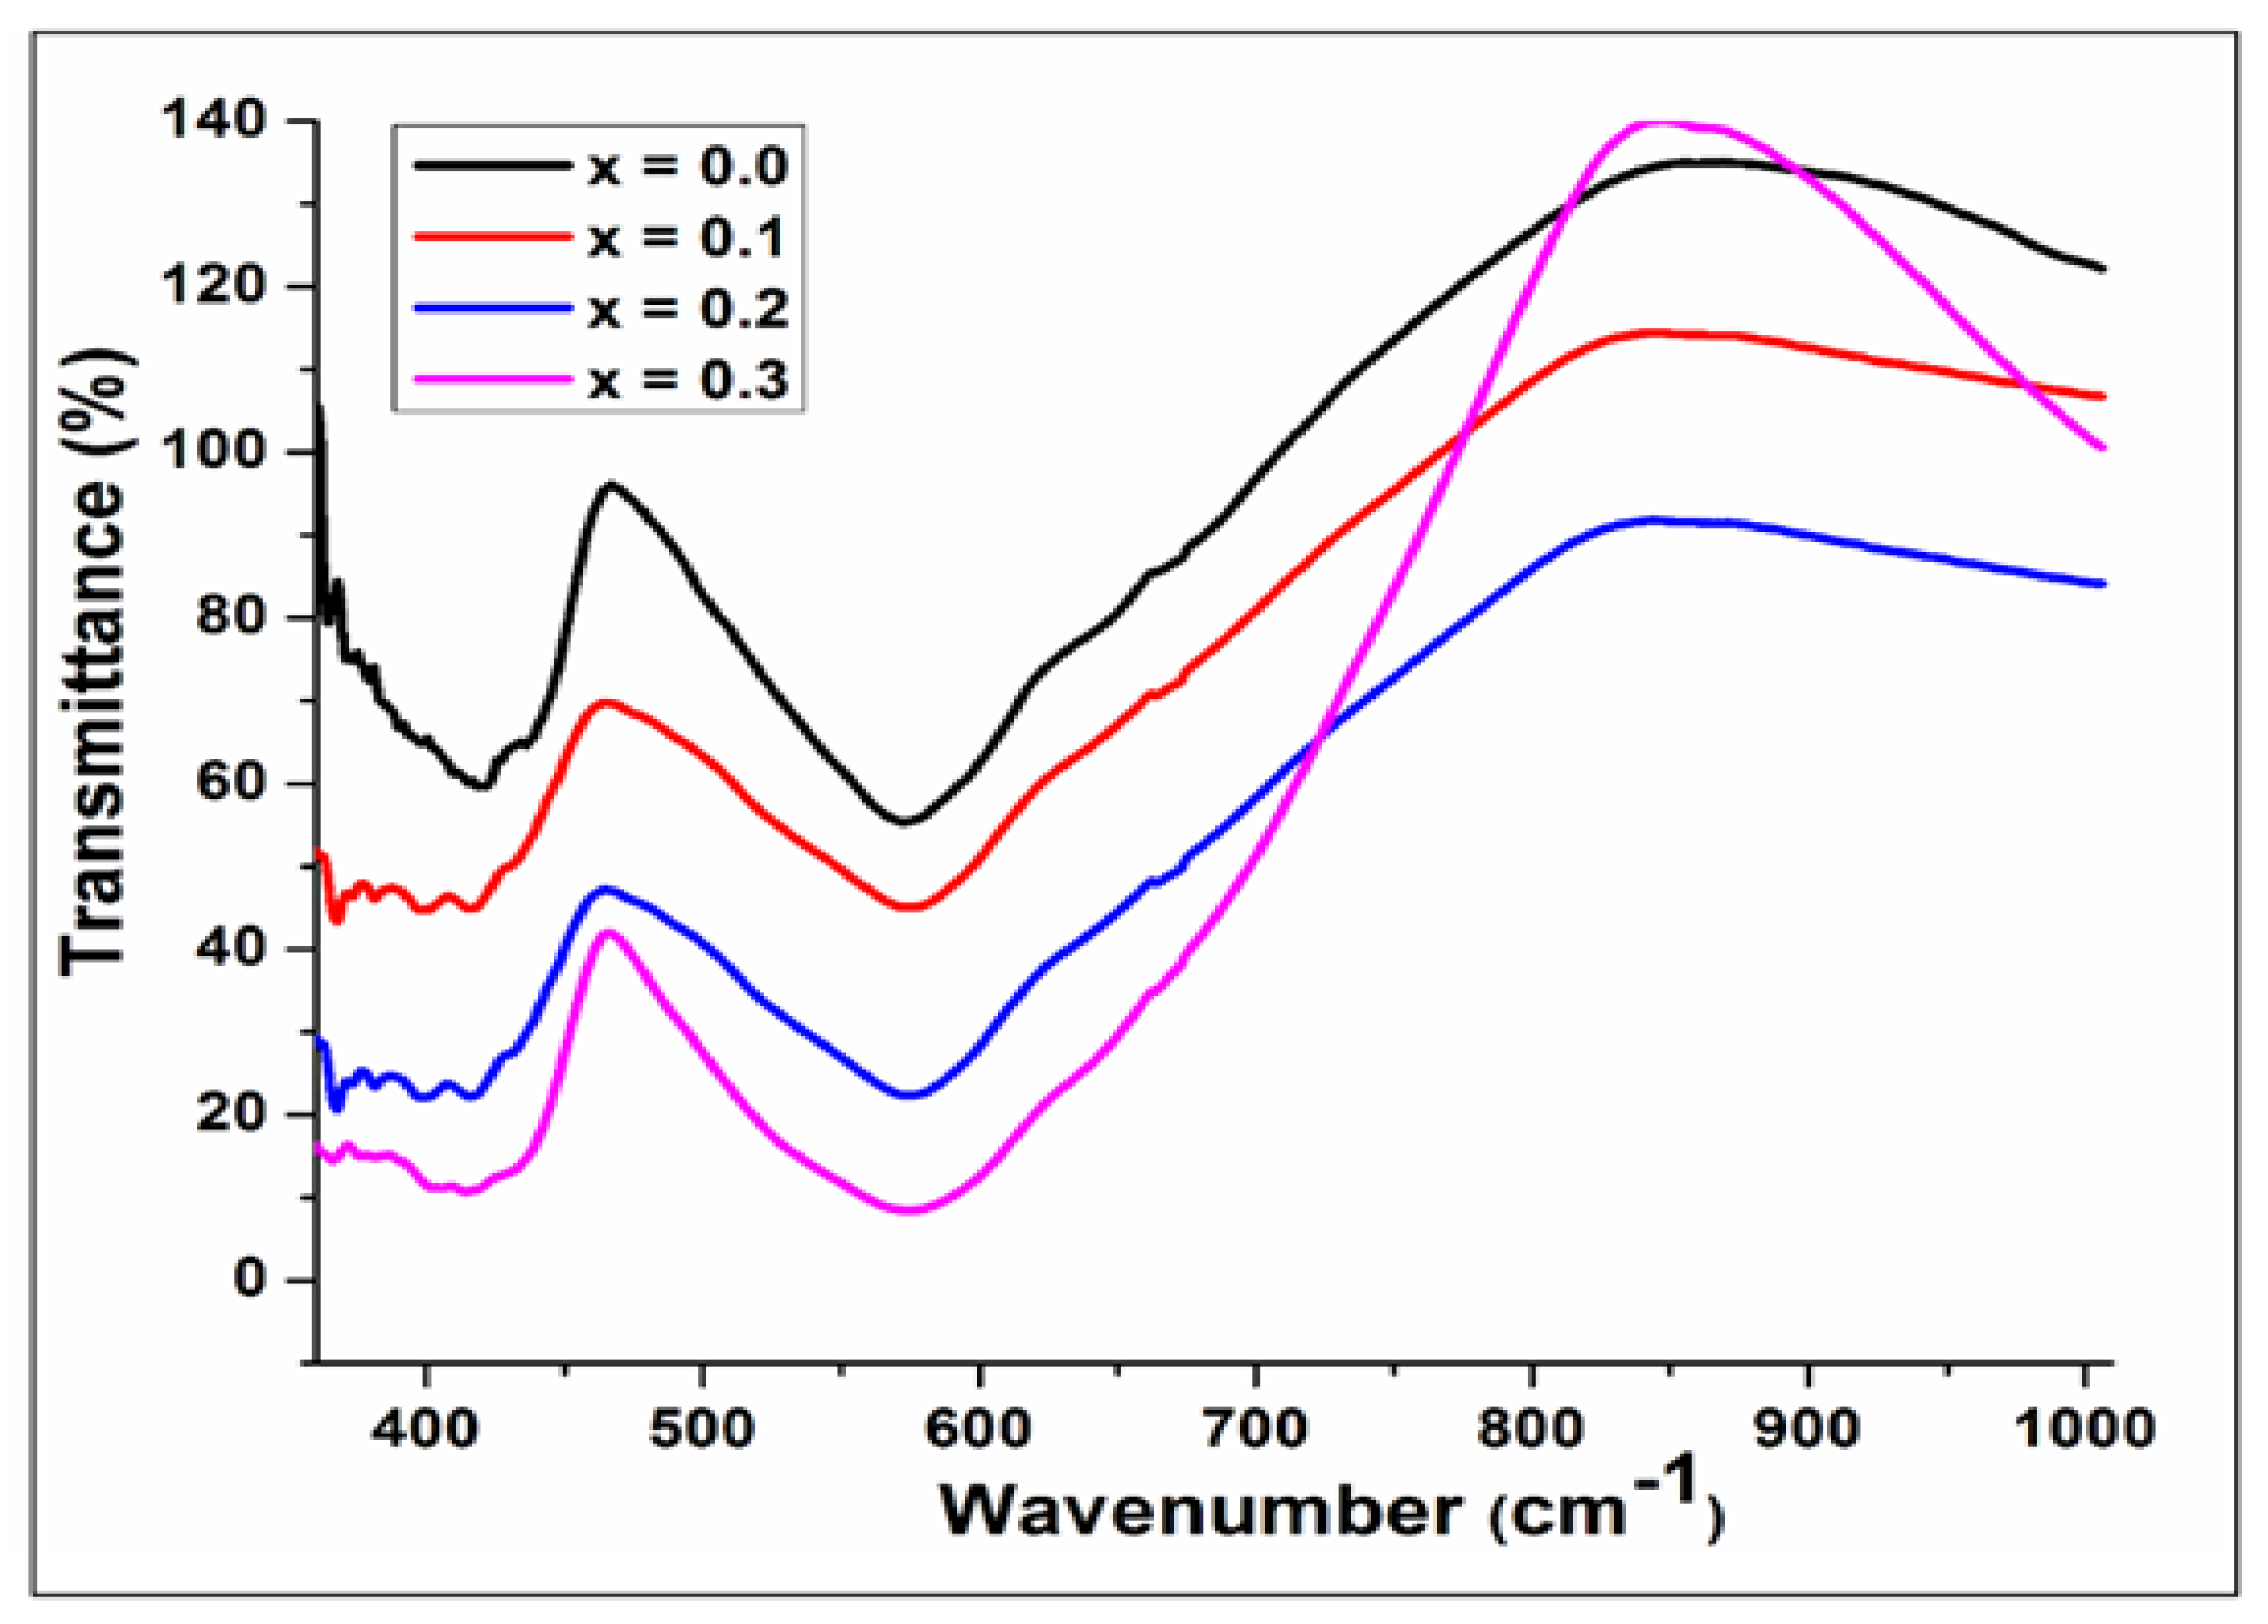
Figure 5.
SEM micrographs of Mg0.6-xCuxCo0.4Fe2O4 with(a) “x=0, (b) x=0.1, (c) x=0.2, and (d) x=0.3.
Figure 5.
SEM micrographs of Mg0.6-xCuxCo0.4Fe2O4 with(a) “x=0, (b) x=0.1, (c) x=0.2, and (d) x=0.3.
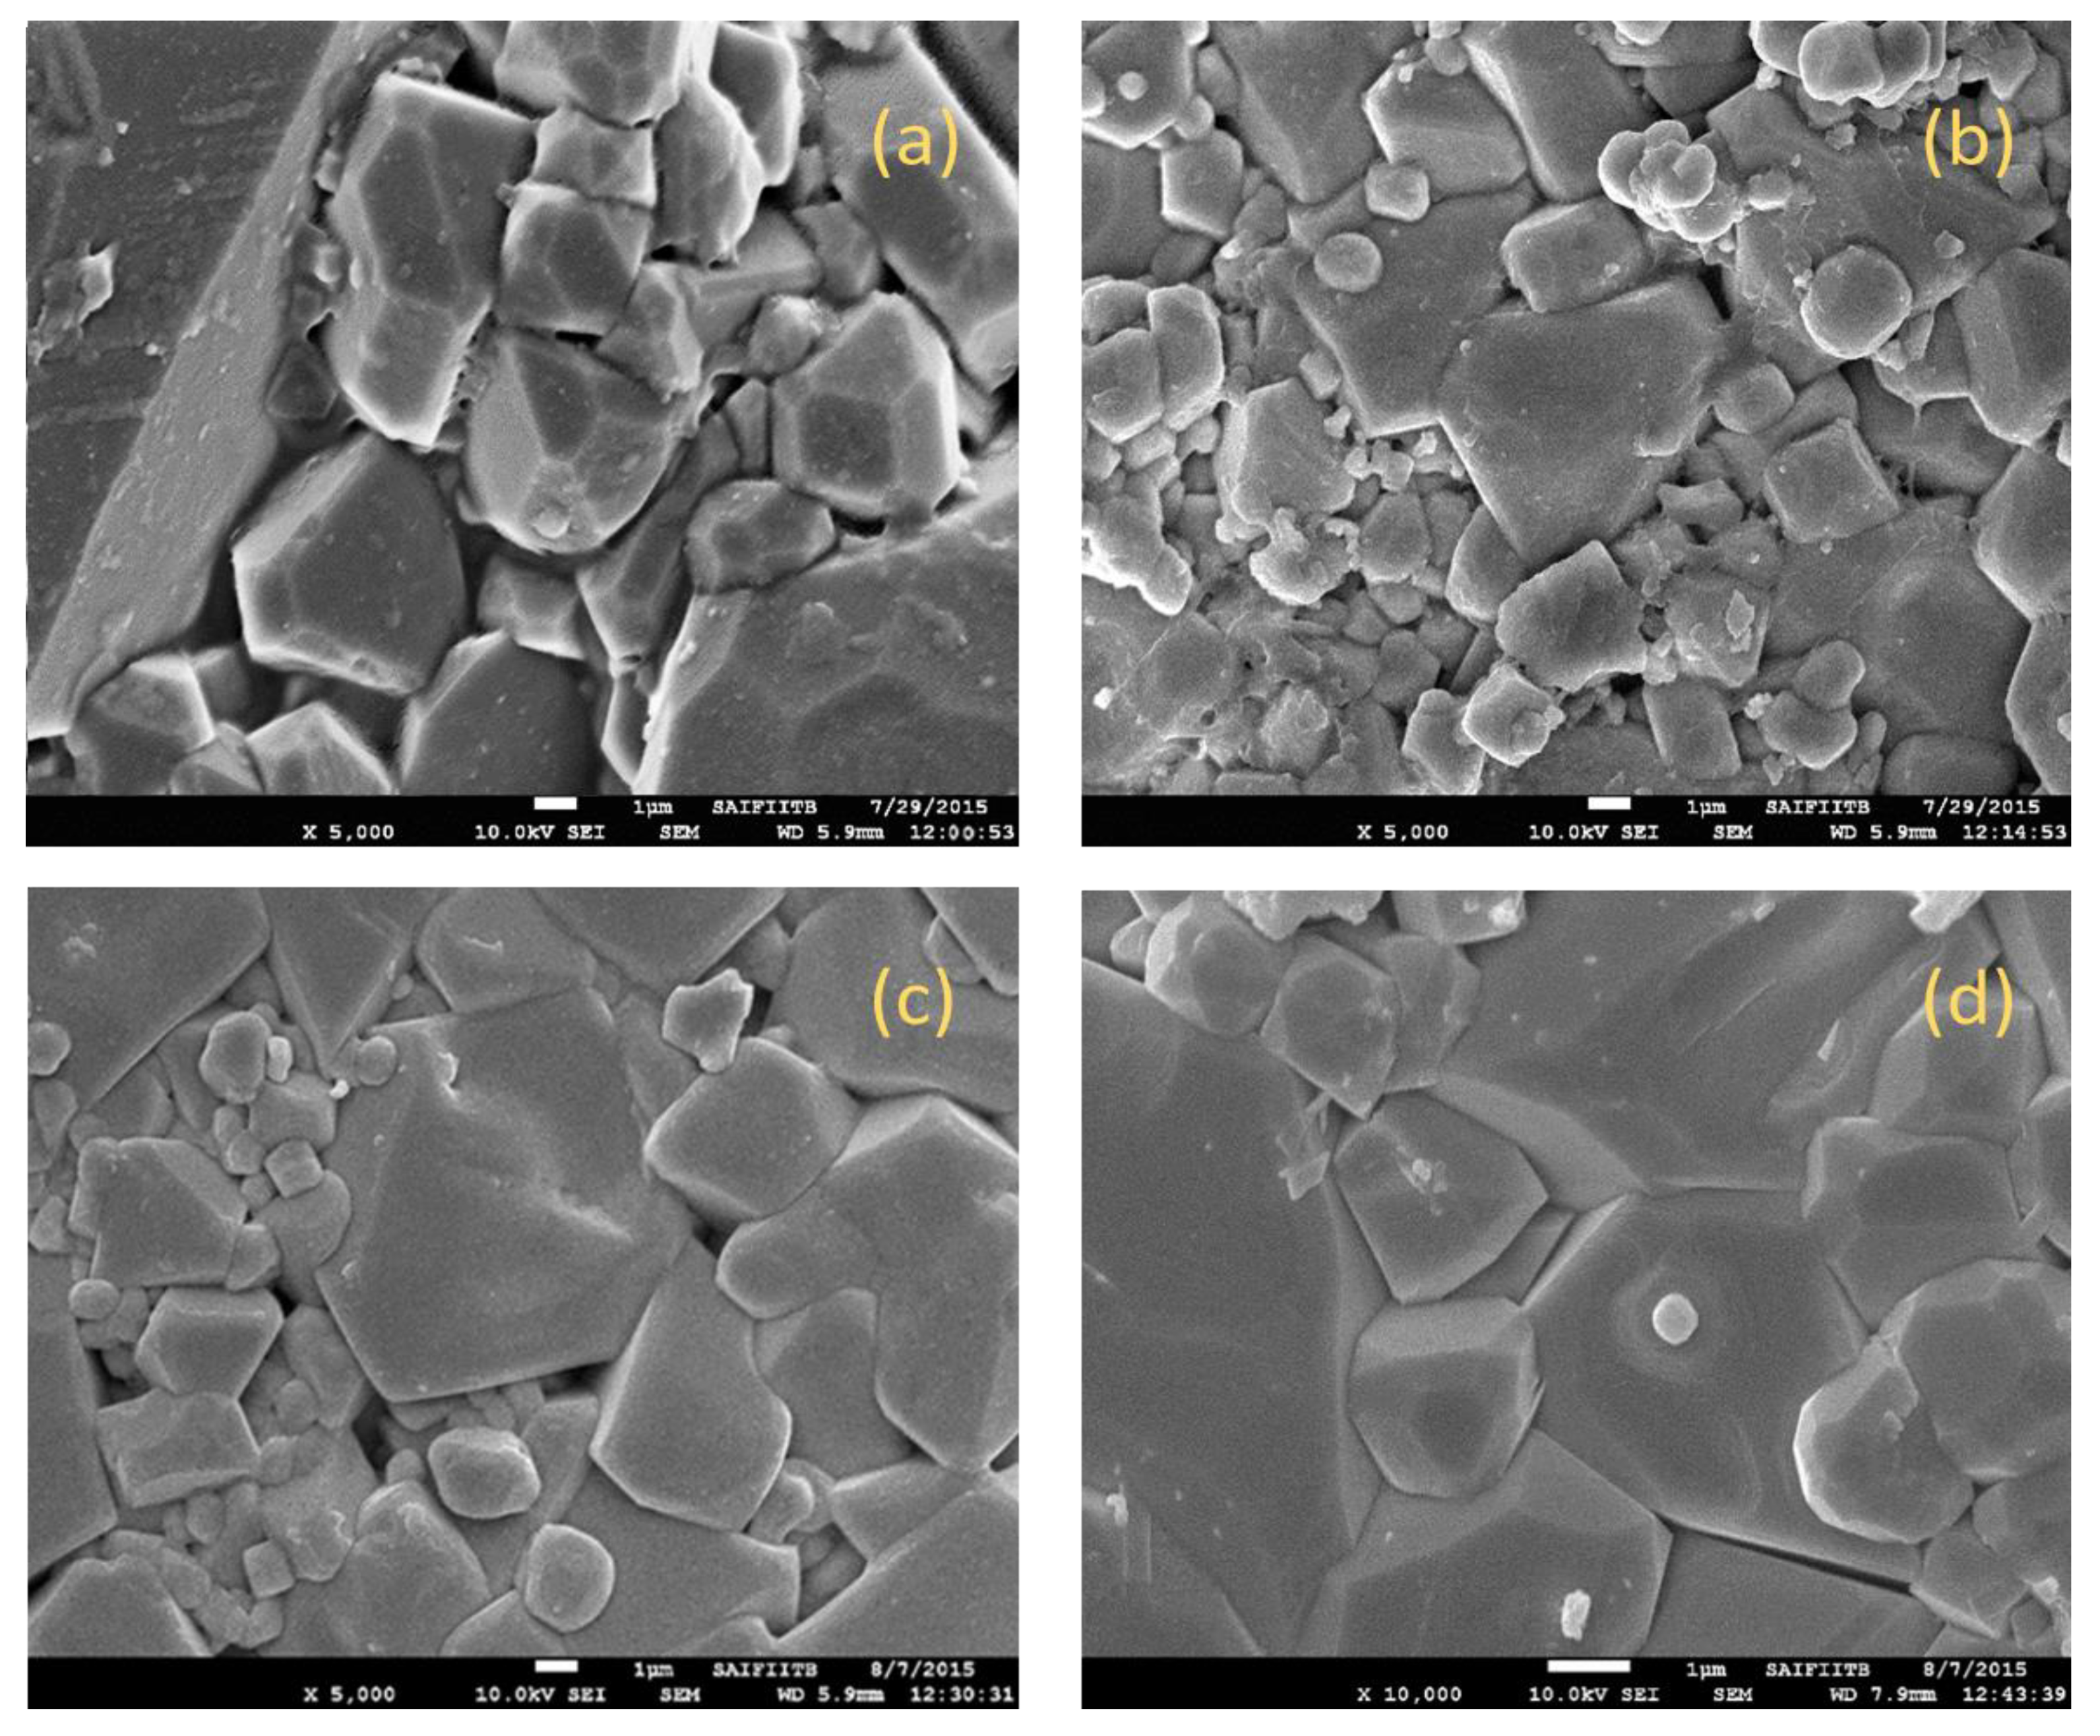
Figure 4a.
Magnetic Hysteresis loops of Mg0.6-xCuxCo0.4Fe2O4 (x = 0, 0.1, 0.2, & 0.3).
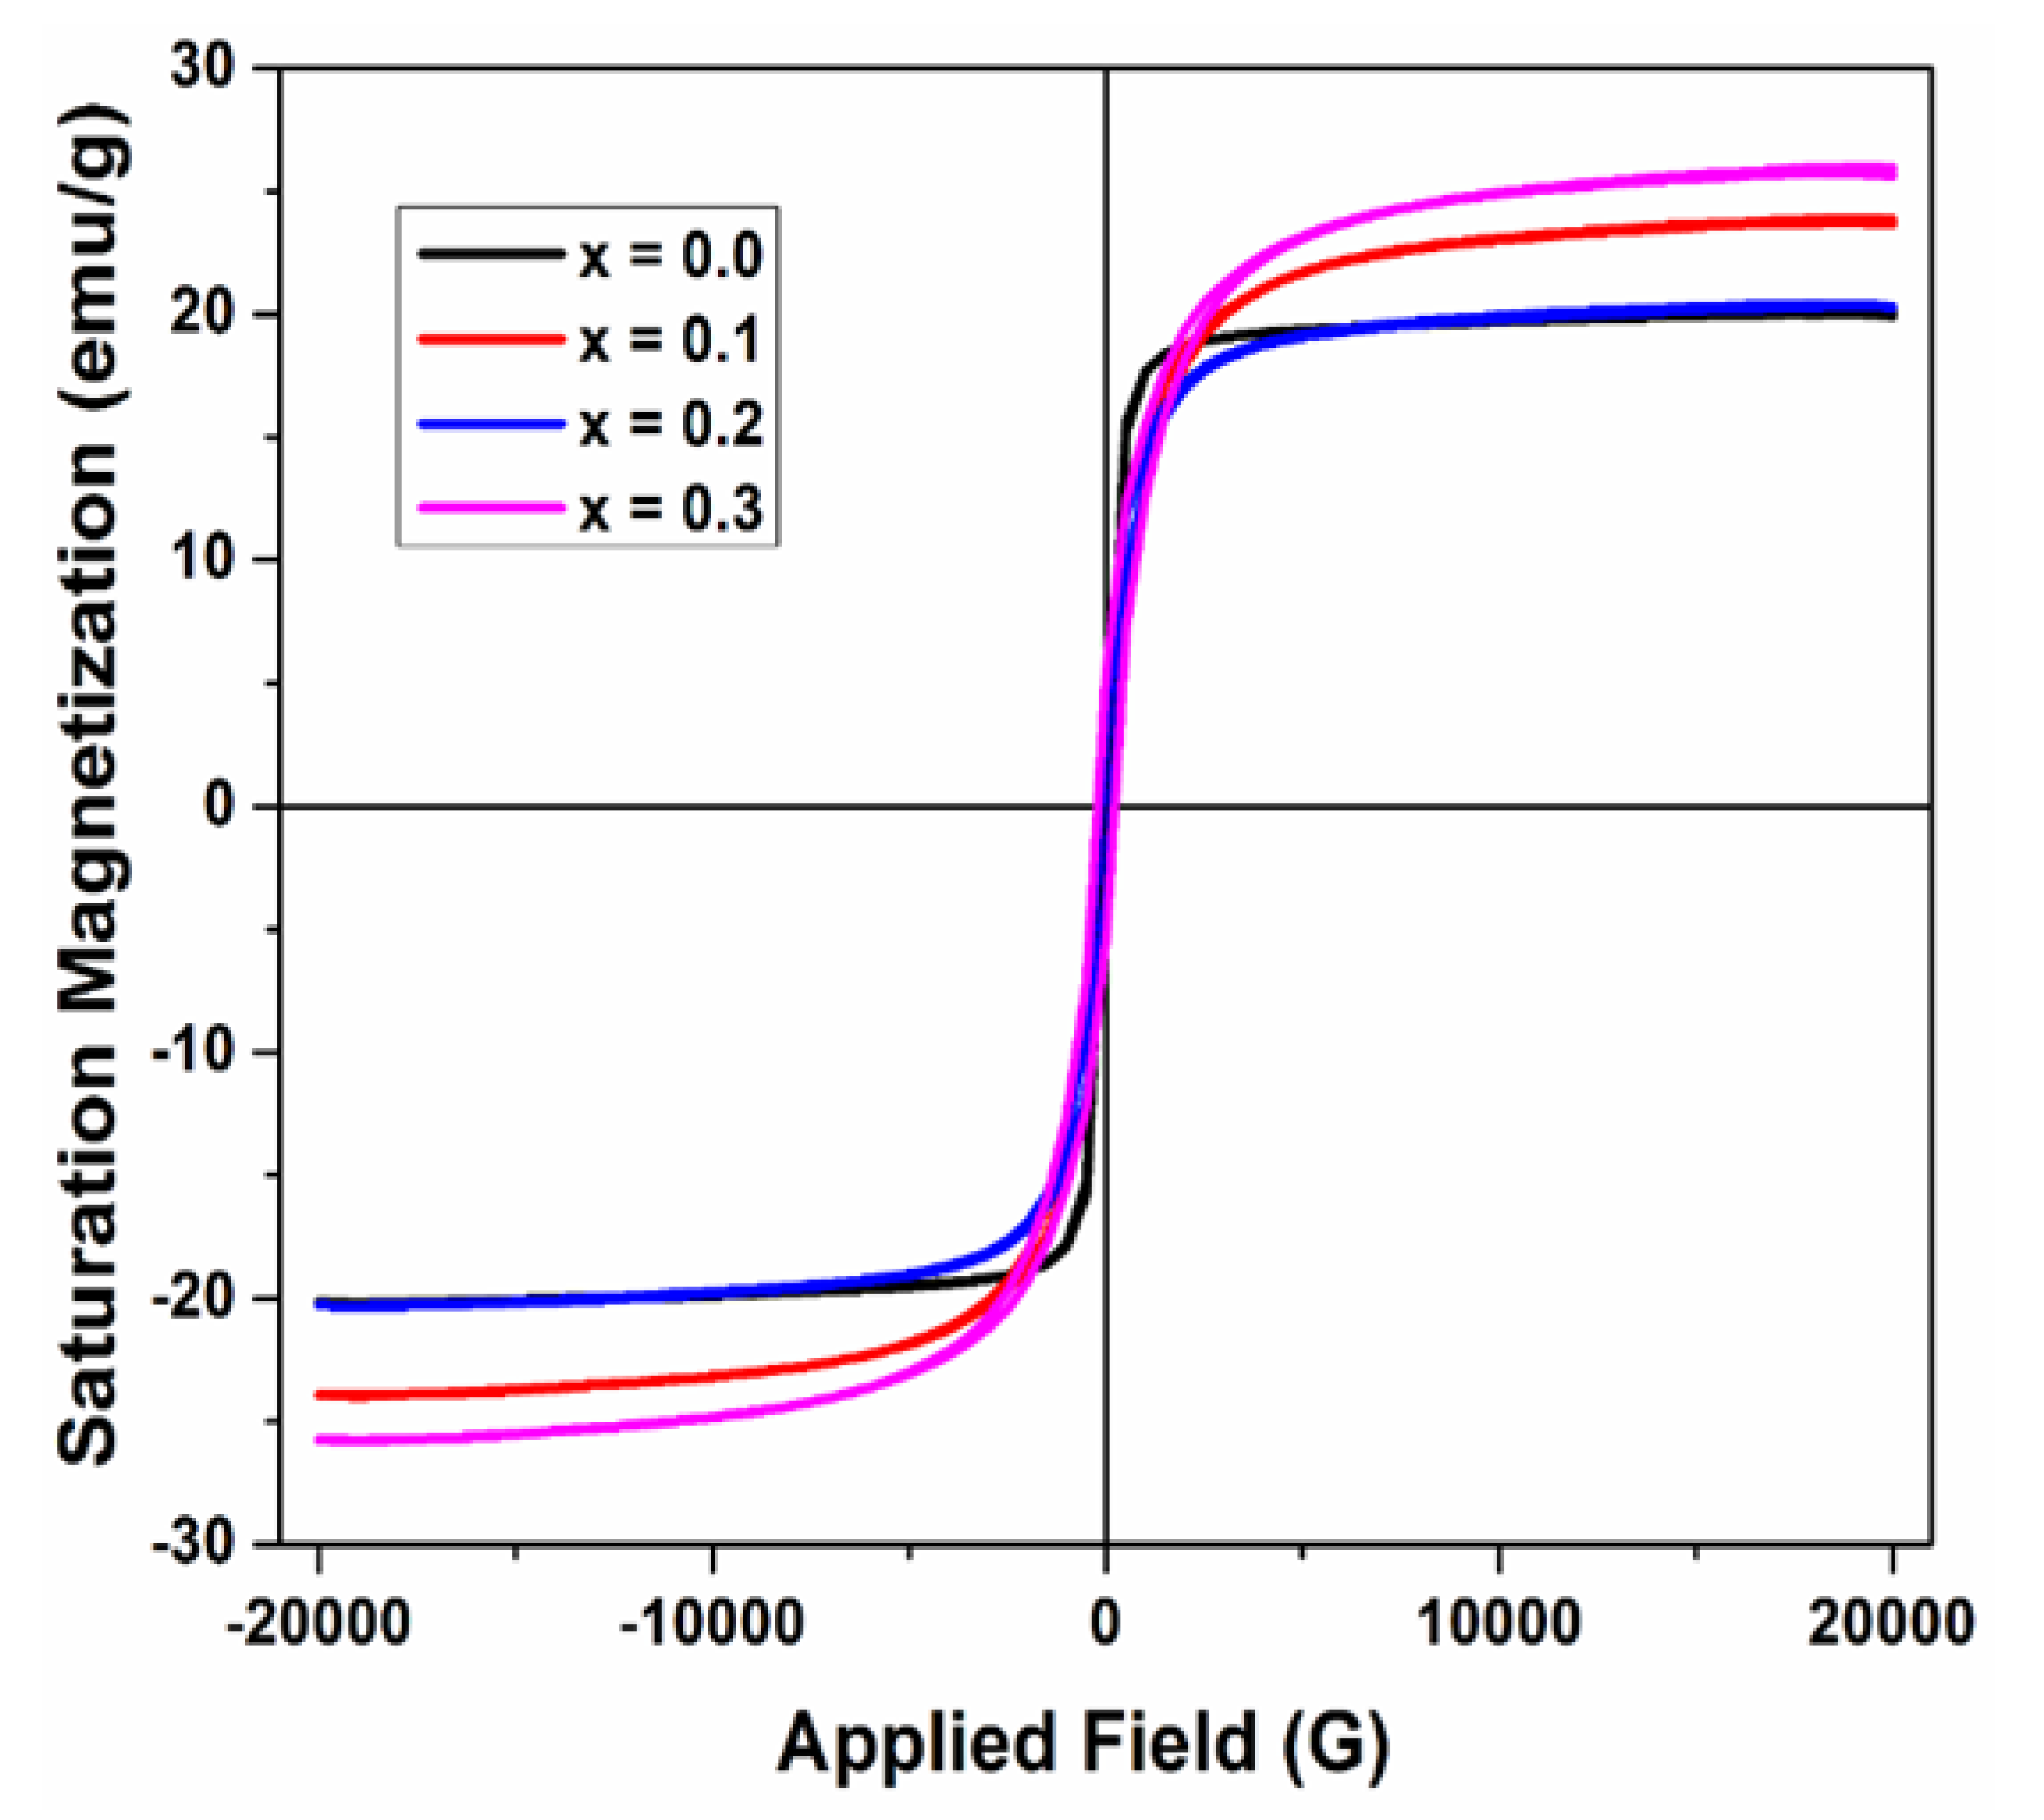
Figure 4b.
Variation of coercivity (Hc) and saturation magnetization (Ms) with Cu content for Mg0.6-xCuxCo0.4Fe2O4.
Figure 4b.
Variation of coercivity (Hc) and saturation magnetization (Ms) with Cu content for Mg0.6-xCuxCo0.4Fe2O4.
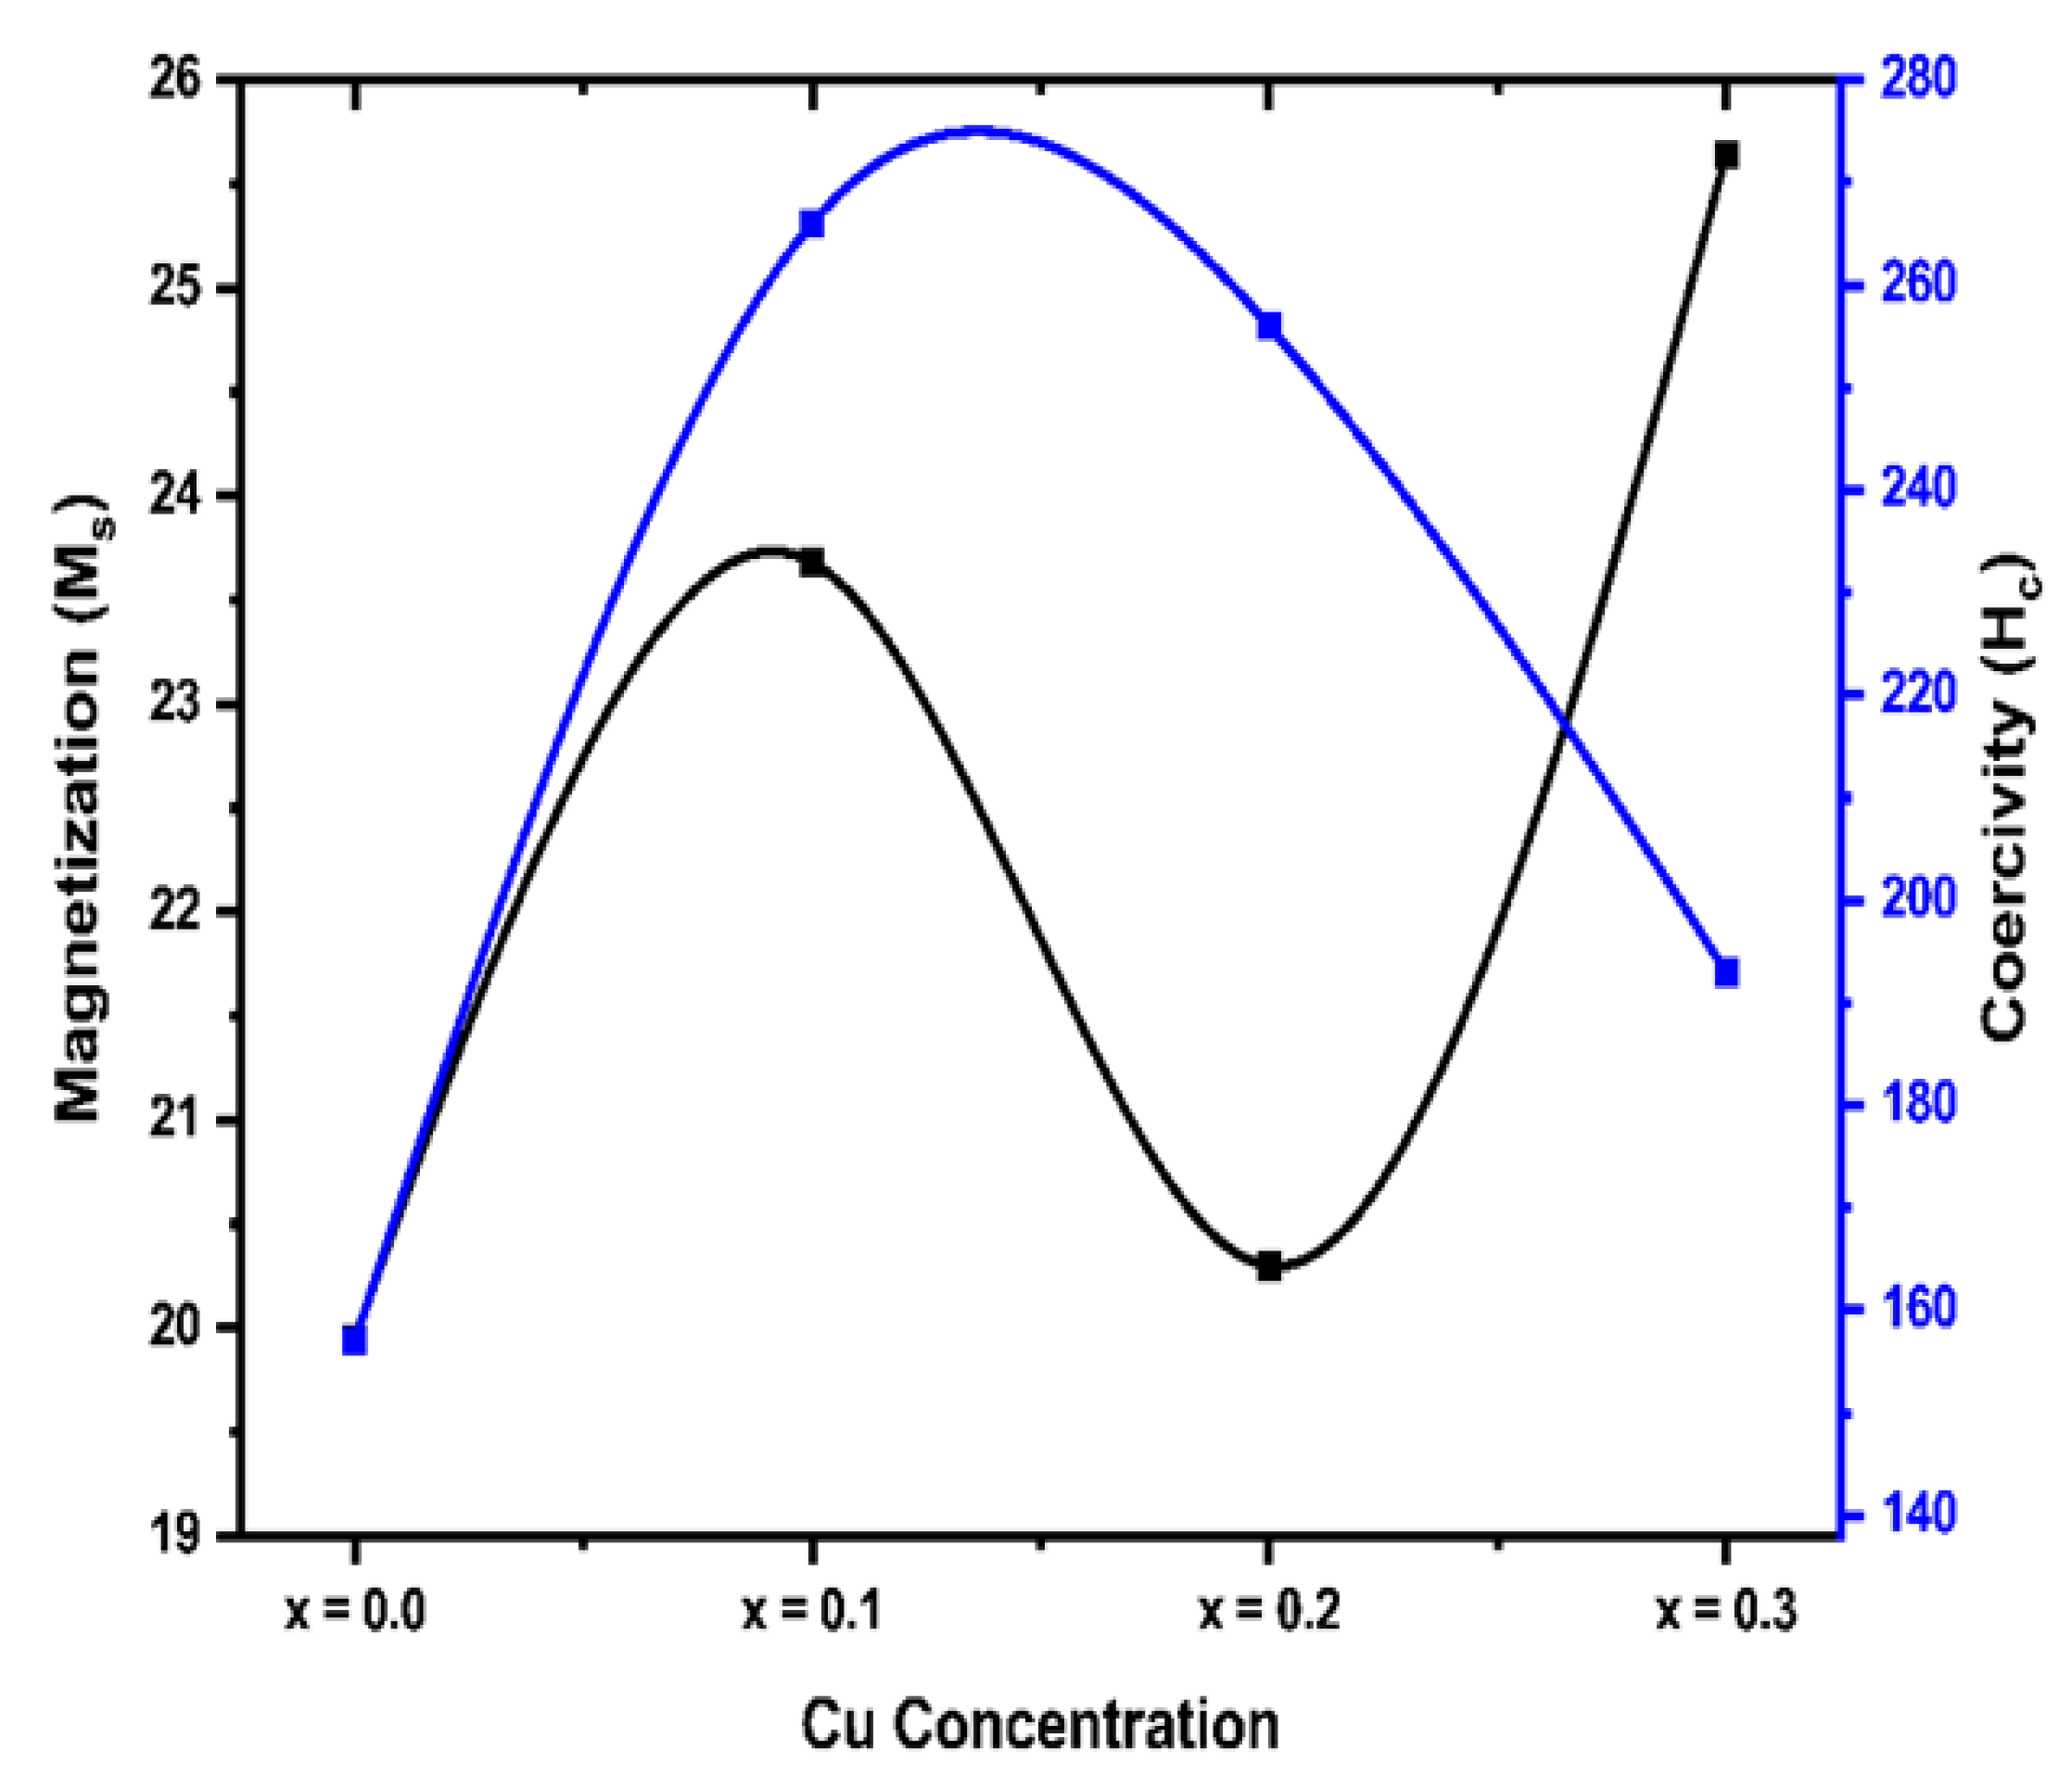
Figure 8.
Plots of DC electrical resistivity of various Mg0.6-xCuxCo0.4Fe2O4.
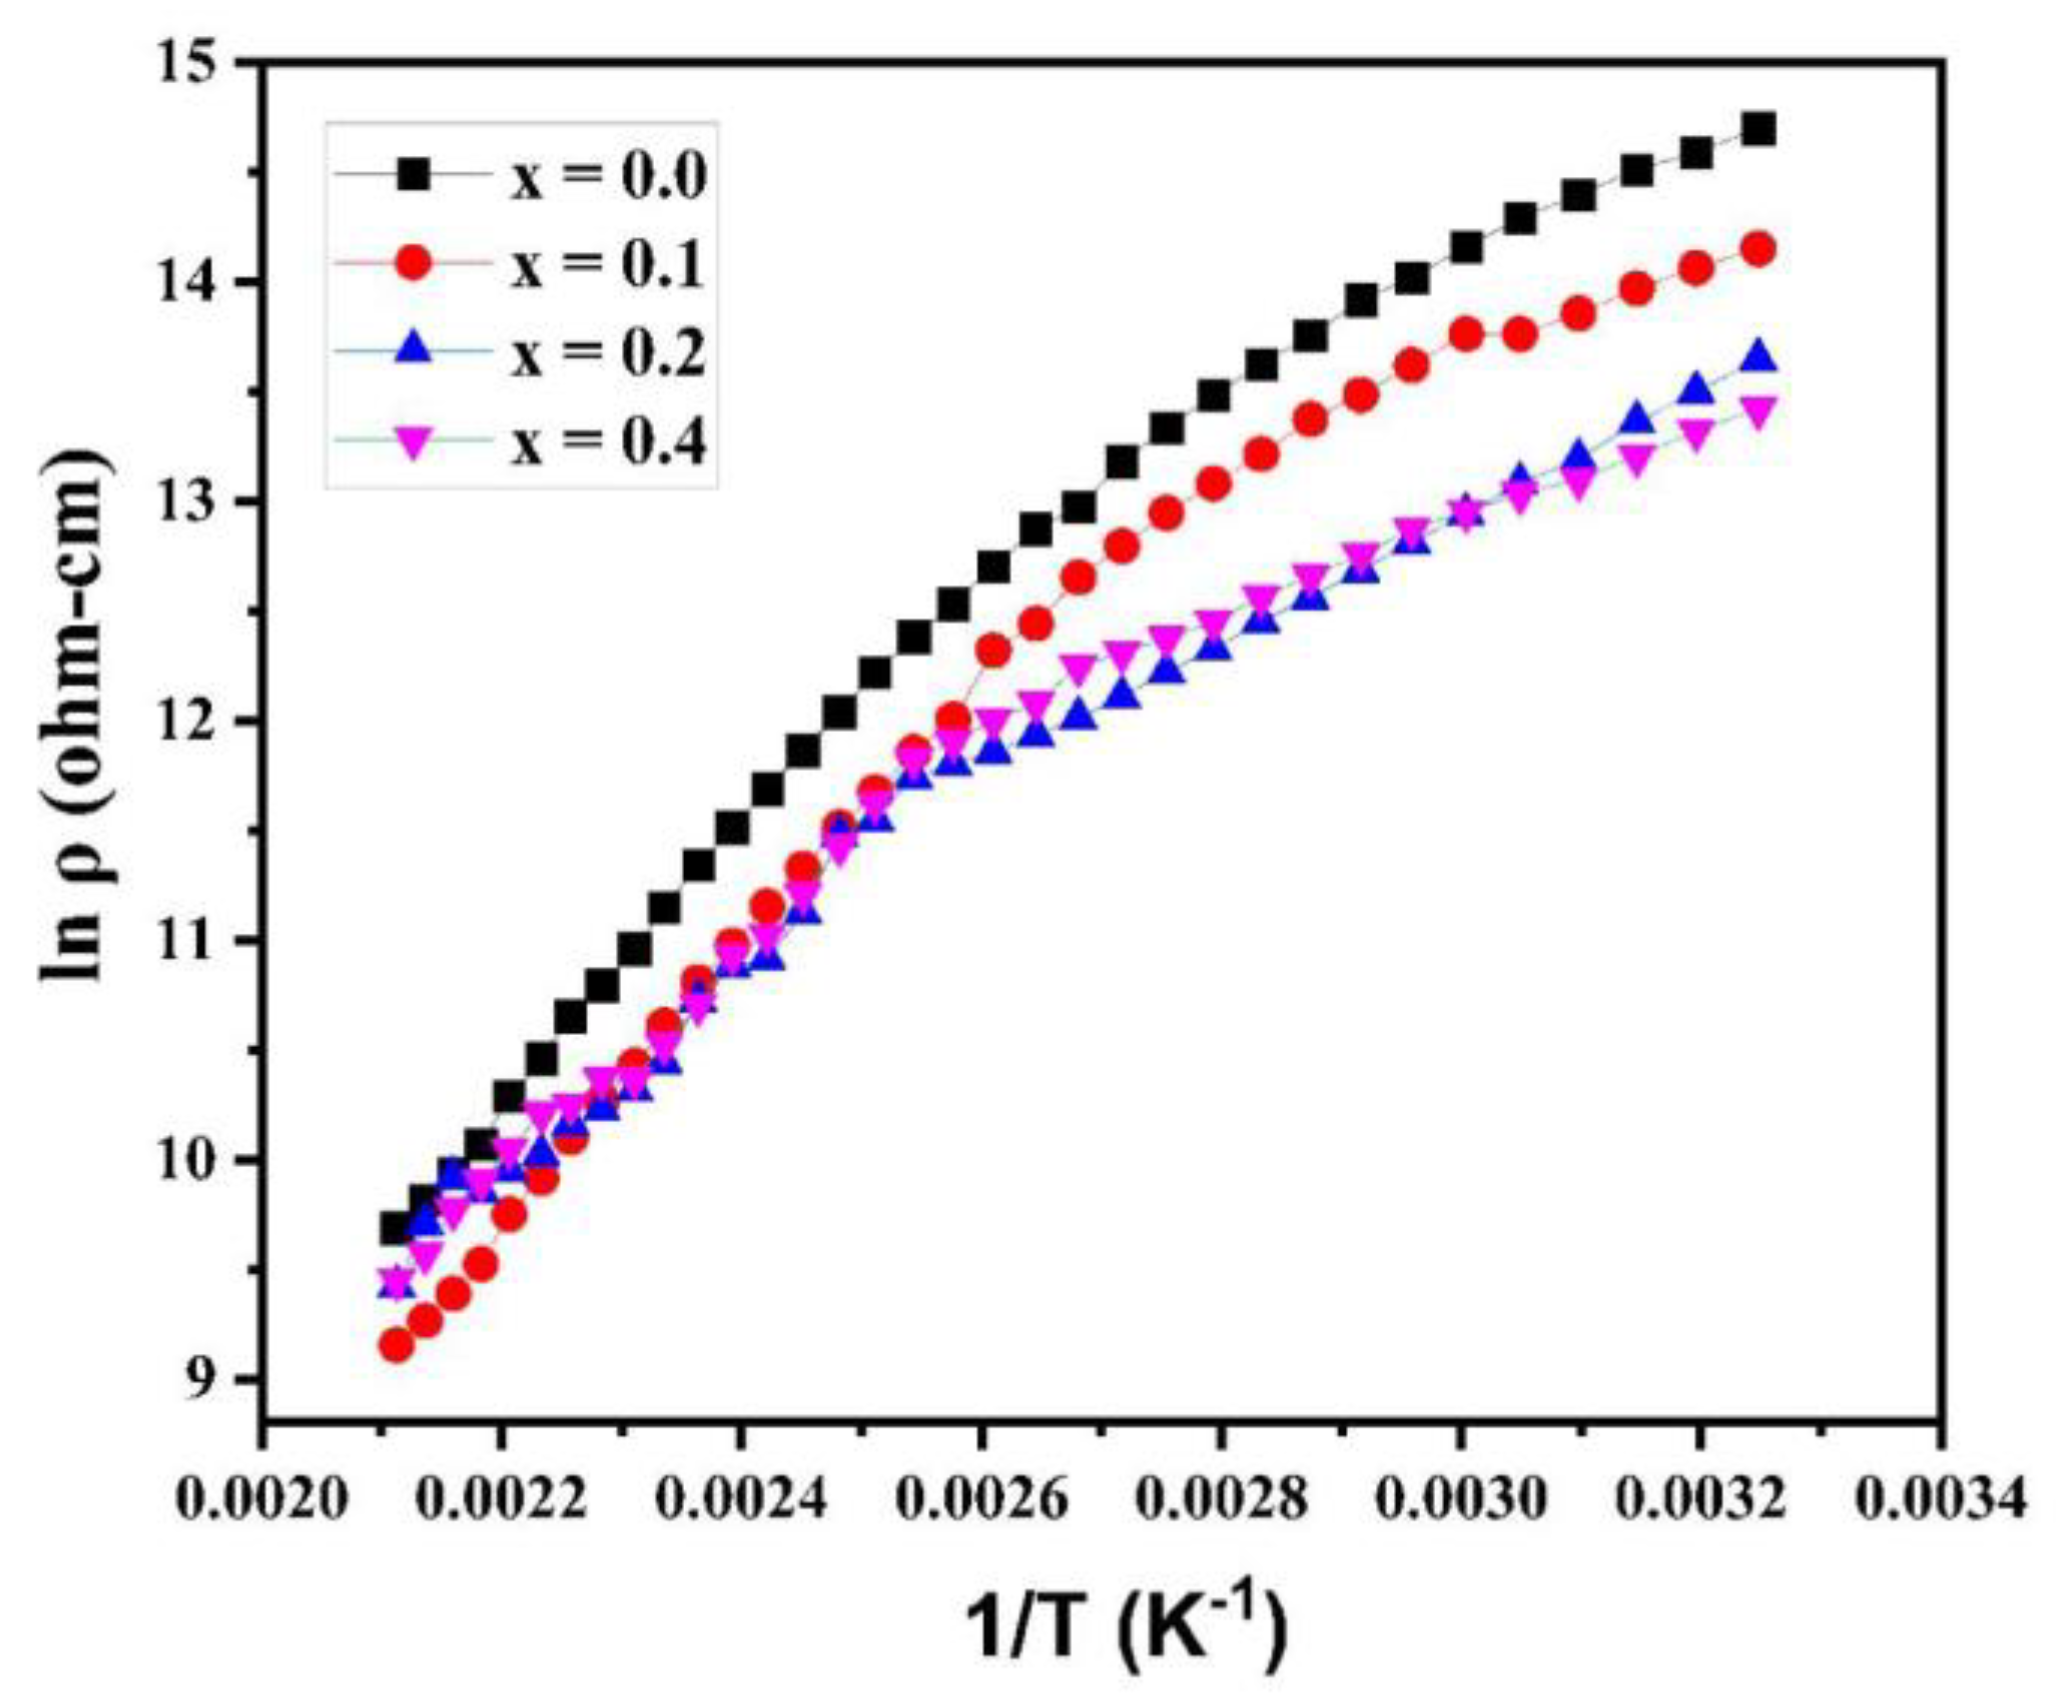
Figure 9.
Activation energy change with Cu content for Mg0.6-xCuxCo0.4Fe2O4.
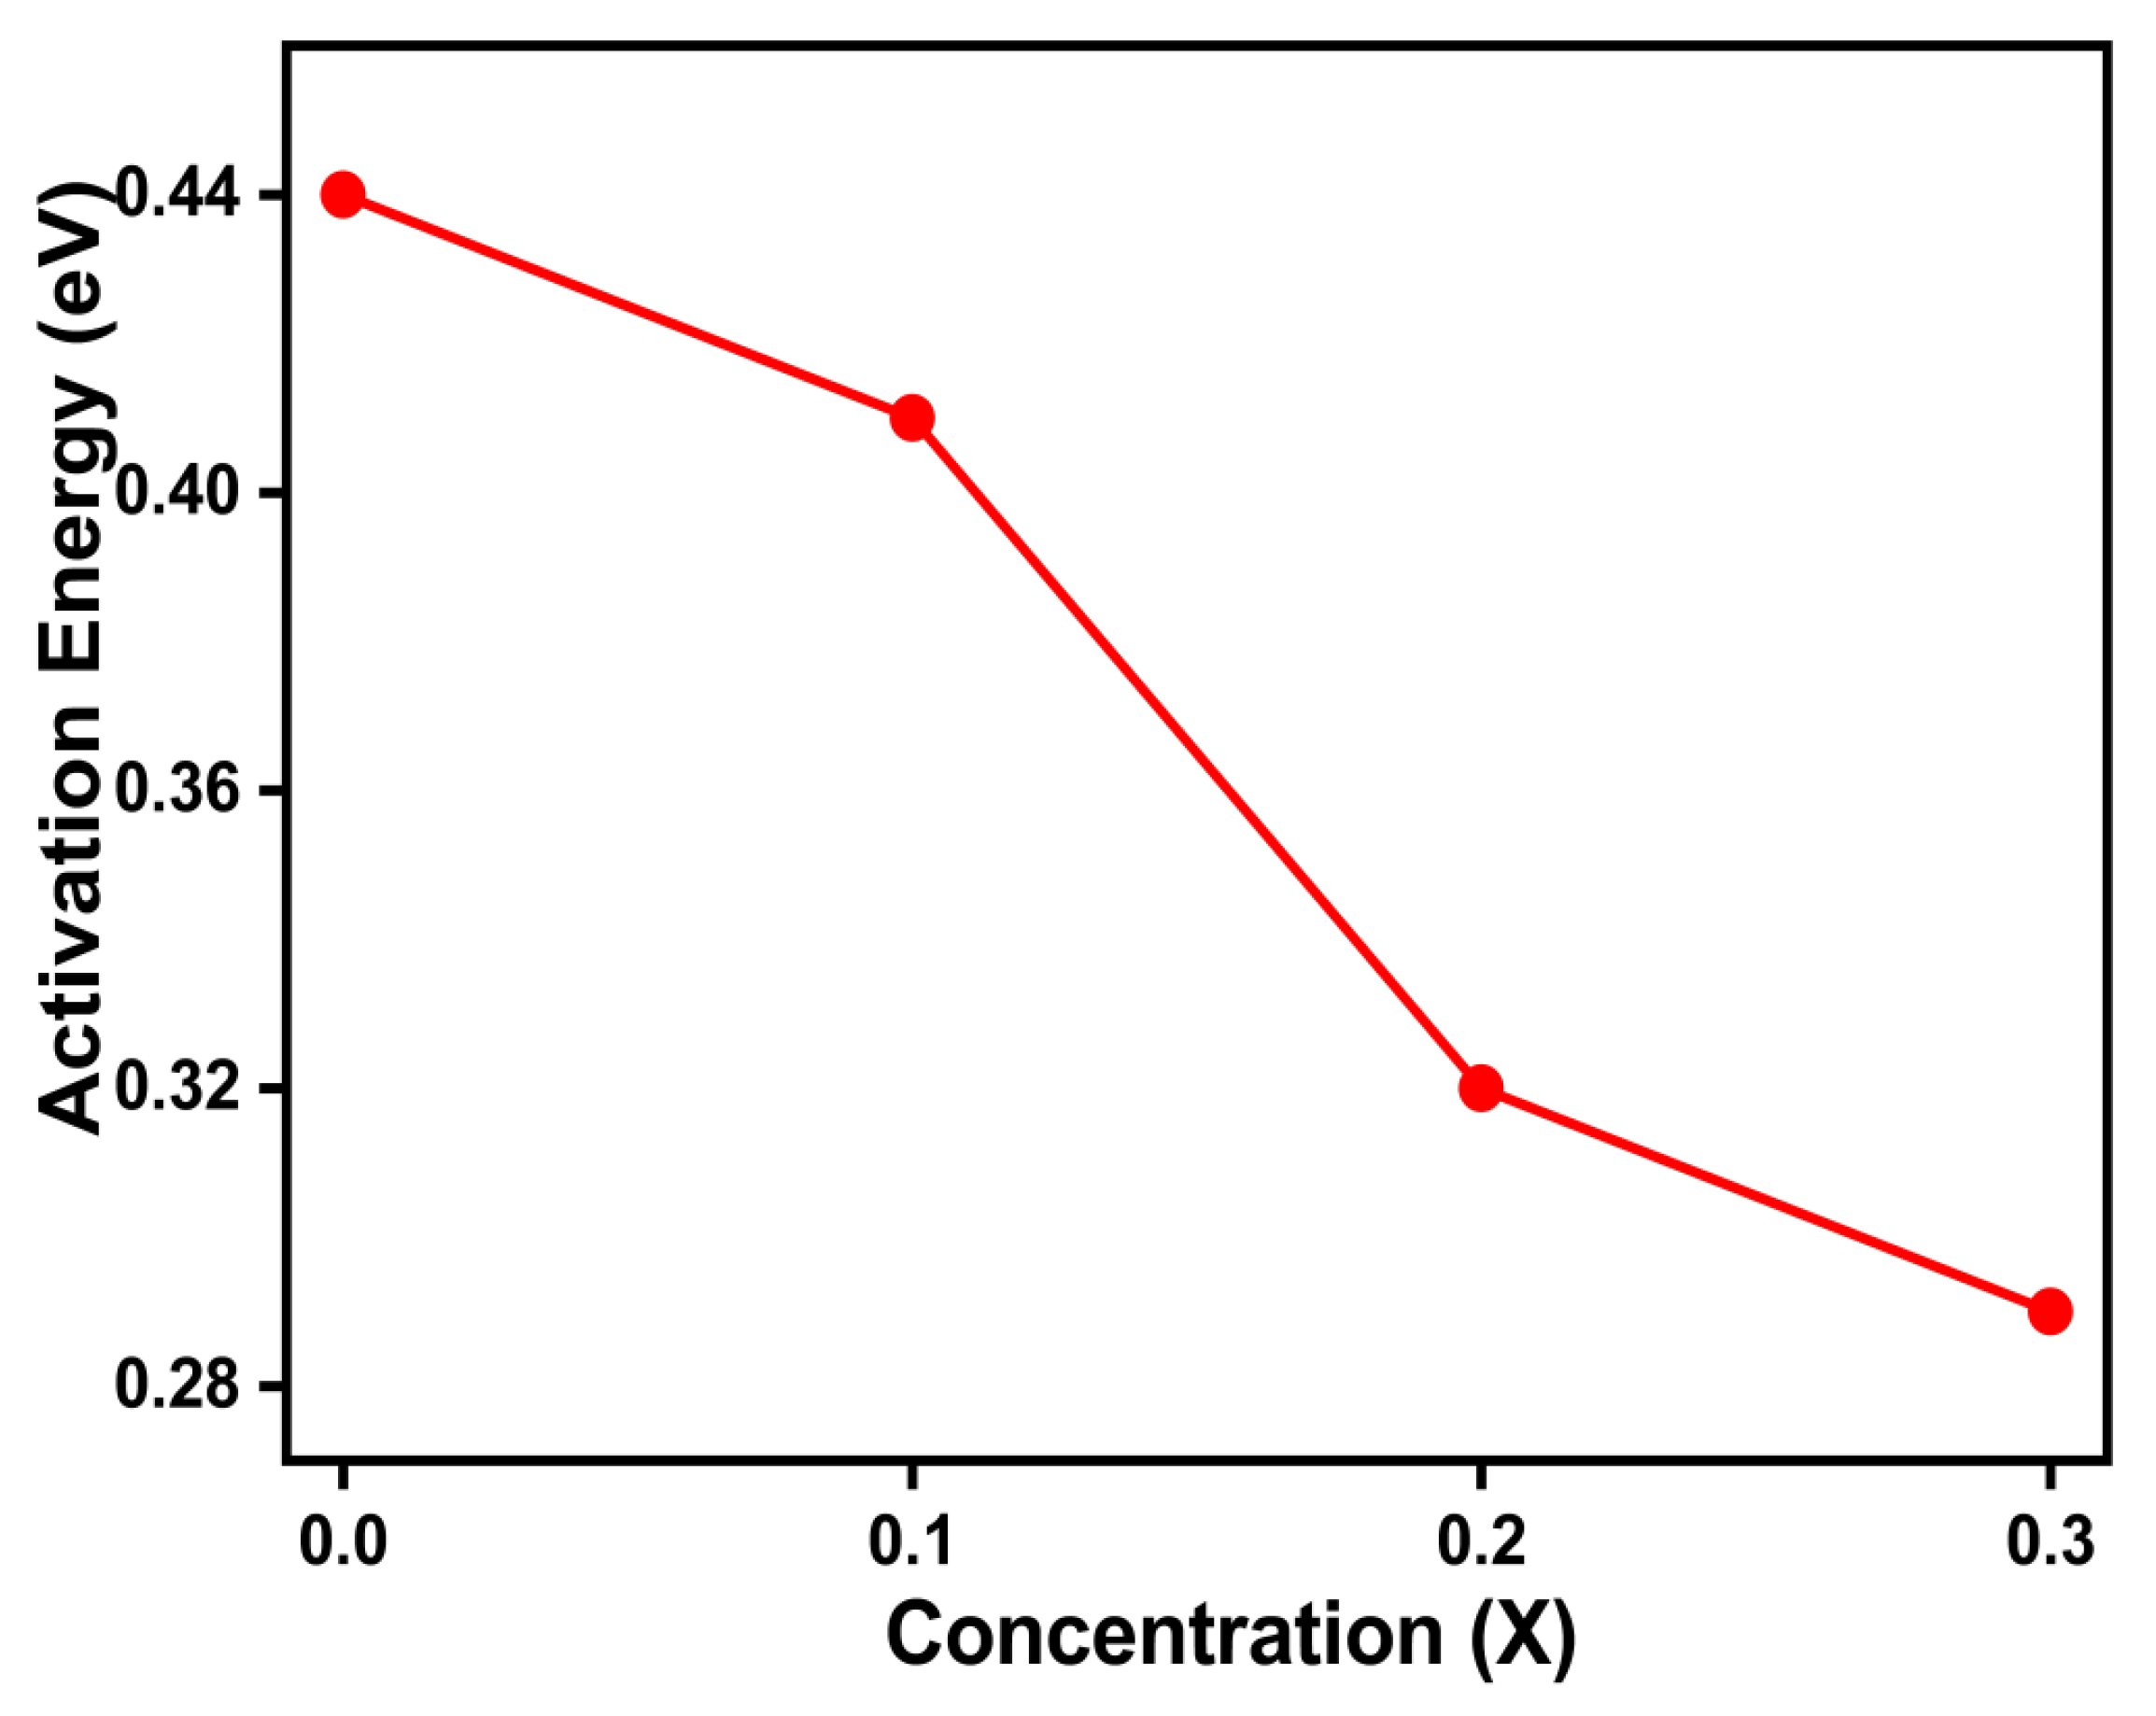
Table 1.
Crystallite size of Mg0.6-xCuxCo0.4Fe2O4 (x = 0, 0.1, 0.2, and 0.3) and Lattice constant.
| Parameters | x = 0.0 | x = 0.1 | x = 0.2 | x = 0.3” |
|---|---|---|---|---|
|
Lattice parameters a (Å) |
8.3720 | 8.3828 | 8.3614 | 8.3912 |
| Vcell (Å3) | 586.79 | 589.07 | 584.57 | 590.84 |
| Crystallite size (nm) | 57.29 | 51.32 | 49.91 | 48.57 |
Table 4.
Activation energy values for Mg0.6-xCuxCo0.4Fe2O4 (x = 0, 0.1, 0.2, and 0.3).
| Parameters | x = 0.0 | x = 0.1 | x = 0.2 | x = 0.3 |
|---|---|---|---|---|
| Activation Energy (eV) |
0.430 |
0.408 |
0.386 |
0.362 |
Disclaimer/Publisher’s Note: The statements, opinions and data contained in all publications are solely those of the individual author(s) and contributor(s) and not of MDPI and/or the editor(s). MDPI and/or the editor(s) disclaim responsibility for any injury to people or property resulting from any ideas, methods, instructions or products referred to in the content. |
© 2024 by the authors. Licensee MDPI, Basel, Switzerland. This article is an open access article distributed under the terms and conditions of the Creative Commons Attribution (CC BY) license (http://creativecommons.org/licenses/by/4.0/).
Copyright: This open access article is published under a Creative Commons CC BY 4.0 license, which permit the free download, distribution, and reuse, provided that the author and preprint are cited in any reuse.


