
Submitted:
24 March 2025
Posted:
25 March 2025
You are already at the latest version
Abstract
Polycrystalline Nickel-Zinc (NiZn) ferrites are widely utilized in high-frequency applications due to their excellent magnetic properties, including high resistivity, low power losses, and high permeability. However, data on their power loss behavior at 10 MHz, particularly at elevated temperatures, remain limited in the literature. This study investigates the magnetic performance of NiZn ferrites at 10 MHz, under varying induction fields (3–10 mT) and temperatures (20–120°C), with a focus on reducing high-temperature losses. Ferrite samples were synthesized using the conventional mixed oxide method and systematically varied in composition (Fe, Co content and Ni/Zn molar ratio). Key findings reveal that the incorporation of cobalt significantly enhances high-temperature performance by shifting resonance frequencies, attributed to increased domain wall pinning. Samples with optimized compositions and processing demonstrated power losses at 10 MHz, 10 mT and 25°C, 100°C and 120°C as low as 310 mW cm-3, 1233 mW cm-3 and 1400 mW cm-3, respectively, with relative initial permeabilities exceeding 80 at these temperatures. These results provide insights into the design of high-frequency magnetic components and highlight strategies to minimize high-temperature losses.
Keywords:
NiZn ferrites
; low power losses
; high frequencies
1. Introduction
Polycrystalline Nickel-Zinc (NiZn) ferrites are an important family of soft magnetic materials in modern electromagnetic technology, widely used in high-frequency applications such as transformers, inductors, antennas, and noise suppressors [1]. Their exceptional magnetic properties, including high electrical resistivity and low power losses combined with sufficiently high magnetic permeability and saturation induction, make them ideal materials for devices operating in the megahertz range [2,3]. The growing demand for more compact, efficient, and high-performing electronic devices is driven by the increasing switching frequencies of wide-band semiconductors [4,5]. One major limitation to device miniaturization arises from the high power losses of the ferrite materials, which, combined with their high thermal resistance, may lead to excessive heating and consequently reduced component efficiency.
Research on the development of improved monolithic polycrystalline NiZn ferrite magnetic components for inductors and transformers spans several key directions, focusing on enhancing their properties, expanding their applications, and addressing challenges in high-frequency performance. Regarding property enhancement, primary areas of exploration include: i) Investigating the effects of additions of various substitutional or grain boundary metals ions (such as i.e. Cu [6,7], Co [2,8,9], Sn [10], V [11], Mn [12] or rare earth elements [13]) to optimize magnetic permeability, coercivity and loss behavior. ii) Microstructural engineering, which involves studying the impact of grain size on magnetic losses, permeability and saturation magnetization to enhance high-frequency performance [14,15]; understanding and controlling lattice defects such as dislocations and vacancies [16]; and exploring advanced sintering methods like microwave [17], spark-plasma [18] or hot-pressing [19] to achieve dense, homogeneous materials with superior properties. Additionally, significant research efforts focused on analyzing and mitigating losses caused by eddy currents, hysteresis, and domain wall dynamics, particularly in the megahertz range [20,21].
However, most previous investigations into power losses have not extended the frequency range beyond 5 MHz. To the authors’ knowledge, data on NiZn ferrite power losses (expressed as mW cm-3) at 10 MHz is scarcely available in the scientific literature. In this article, the magnetic performance of NiZn ferrites at 10 MHz is investigated under fields ranging from 3 to 10 mT and at temperatures from 20 to 120°C. The dependence on compositional and operational parameters is discussed. Emphasis is placed on high-temperature (>80°C) losses, and certain strategies for mitigating these losses are proposed.
2. Materials and Methods
Polycrystalline NiZn ferrites were synthesized using the conventional mixed oxide method. Oxide precursors of the cations (NiO, ZnO, Co3O4, Fe2O3, all Merck analytical grade) were proportioned for a synthesis batch of approximately 500 g and subsequently wet-mixed for 3 hours in a ball mill containing 500 ml double distilled water and approximately 3.6 kg of steel milling balls with a nominal diameter of 12 mm. The mixed product was dried and pre-fired at 750°C for 3 hours in air. The pre-fired powder was then ball-milled under the same conditions as the wet-mixing step. The milled powder was roll-granulated with the addition of 10 wt.% of a binder solution, consisting of 2 wt.% aqueous Tylose solution (Tylose MH 300 P2 Shin Etsu, Venlo, the Netherlands). The granulated powder was subsequently uniaxially compacted at a pressure of 100 MPa, to form ring-shaped specimens with an outer diameter of 23 mm and an inner diameter of 15 mm. These specimens were finally sintered in air at temperature ranging between 1125 and 1225°C. The sintered specimens had a nominal outer diameter of 20 mm, an inner diameter of 12.5 mm and a height of 8 mm. The synthesized ferrite compositions, divided into three groups (A, B and C) are listed in Table 1.
A base A-sublattice composition “Ni0.49Zn0.49Co0.02”was used as the starting point. The Ni/Zn molar ratio was maintained at 1 to achieve high saturation induction and magnetic permeability [2]. Additionally, a cobalt content of 0.02 atoms per formula unit was introduced because, as reported, this content significantly increases the specific resistivity of NiZn ferrites [12] and delays domain wall or ferromagnetic resonance [20,22]. In the synthesis experiments of group A, the effect of the iron content was studied while keeping the cobalt content and Ni/Zn molar ratio constant. In group B experiments, the cobalt content was varied at a constant iron content and Ni/Zn ratio. Finally, in group C, the effect of the Ni/Zn molar ratio was investigated while maintaining constant iron and cobalt contents. Syntheses A195/B020 and B040/C100 have a double code name since they can be encountered as members of two experimental series.
The microstructure of the sintered polycrystalline specimens was examined using scanning electron microscope (SEM, JEOL JSM-IT500, Japan) on thermally etched and gold-sputtered cross sections. Particle size analyses and specific surface area measurements of pre-fired and milled powders were performed using laser scattering (Mastersizer S, Malvern, United Kingdom) and nitrogen adsorption-desorption (Autosorb 1, Quantachrome, Boynton Beach, Florida-USA), respectively. X-ray diffraction (XRD) was conducted for structural determination using CuKa radiation (Bruker D8 Advance, Munich, Germany). The final densities of the sintered specimens were measured geometrically. Based on repeated measurements, the absolute error was estimated to be ± 0.05 g cm-3.
The magnetic properties of the specimens were measured using an automated programmable unit consisting of: an impedance-gain analyser (E4991A, Agilent Technologies Inc. Kobe, Japan), an oscilloscope (MDO4034C, Tektronix Inc. Beaverton, Oregon-USA), a power amplifier (2200L, Electronics and Innovation, New York-USA), a frequency generator (33500B, Keysight) and a programmable oven. The measurements were performed on toroidal specimens wound with copper wires to form inductors. For each sintering trial, four identical specimens were stacked and sintered simultaneously. The two specimens in the middle were used for magnetic performance characterization. The results were very reproducible, with a relative error of less than 5%, even under the heaviest conditions of 10 MHz and 10 mT.
3. Results
All prefired and milled powders of group A syntheses were characterized to ensure identical morphology, providing a common starting point for the sintering and microstructure development steps without the influence of factors other than chemical composition. Indicative particle size analysis results for prefired and milled powders A192, A195 and A198 are presented in Figure 1. In all cases, a bimodal particle size distribution was observed, with an average particle size d50 ranging between 0.4 and 0.5 μm. The differences between the powders are considered negligible and within the experimental uncertainties. The BET specific surface areas of all group A syntheses range from 3.0 to 3.5 m2 g-1.
XRD analysis revealed that all prefired and milled powders consisted of a single spinel phase. Representative results for powder samples A192 and A198 are shown in Figure 2.
The prefiring temperature of 750°C appears sufficient to drive the ferrite formation reaction almost to completion. Minor, barely detectable traces of Fe2O3 (marked with black cycles in Figure 2) are not considered significant and are unlikely to influence the subsequent microstructure development or magnetic performance. It is therefore concluded that all prefired powders in group A are morphologically nearly identical.
In Figure 3 the final densities of all group A syntheses sintered at different temperatures (from 1125 to 1225°C) are presented. As expected, the final density increases with higher sintering temperatures. Furthermore, at a constant sintering temperature, the final density decreases with increasing iron content. Iron deficiency introduces oxygen vacancies in the structure which, in turn, facilitate the diffusion of oxygen anions. In ionic solids, the diffusion of the slowest-moving oxygen ions is generally regarded as the rate-controlling step for densification [23,24]. Most commercially available NiZn ferrites are iron-deficient to enhance densification.
For optimal high-frequency magnetic performance, both density and grain size are critical factors. In polycrystalline materials, grain size significantly affects both domain wall and spin rotational resonance [25,26]. During sintering, densification and grain growth occur simultaneously [27] and the microstructure for optimal high-frequency magnetic performance should exhibit sufficiently high density and sufficiently low grain size. Figure 4 shows typical SEM images. Figure 4(a),(b),(c) and (d) correspond to a constant composition (A195) at different sintering temperatures, while Figure 4(e),(f),(g) and (h) correspond to a constant sintering temperature (1175°C) with varying compositions.
Although the effect of sintering temperature on the microstructure is evident in the SEM images (Figure 4(a),(b),(c),(d)), the influence of iron content on the density and microstructure is not clearly visible. At sintering temperatures below 1200°C the average grain size is estimated to be below 3 μm, which lies within the monodomain region [14,28].
The power losses at 10 MHz and 100°C for relatively high (10 mT) and low (3 mT) fields are shown in Figure 5.
As shown, the lowest power losses are achieved with iron contents lower than 1.95 and sintering temperatures between 1150 and 1175°C. Lower sintering temperatures result in higher losses due to insufficient densification, while at higher sintering temperatures, the 10 MHz losses increase due to larger grain sizes. Power losses also increase with iron contents higher than 1.95. This could be explained either by the fact that high iron contents are associated with lower densities (Figure 3) or by the fact that higher iron contents lead to higher magnetic permeabilities, which in turn lower the resonance frequency, as described by the law of Snoek [29]. In particular, synthesis A195 ((Ni0.49Zn0.49Co0.02)Fe1.95O4) sintered at 1175°C exhibited power losses of 40 mW cm-3 (10 MHz, 3 mT, 100°C) and 2100 mW cm-3 (10 MHz, 10mT, 100°C). Based on this superior high-frequency high-temperature performance, and its relatively high iron content, further optimization was conducted based on this composition at sintering temperatures of 1150°C and 1175°C.
In Figure 6, the 10 MHz power losses of synthesis A195 (sintered at 1175°C) are shown as a function of temperature, for different induction levels. At low temperatures the power losses are initially independent of temperature. Beyond a certain temperature, however, a sharp increase in losses with temperature is observed. It is believed that in the temperature-independent region, hysteresis losses dominate. The sharp increase in losses at higher temperatures is most likely dominated due to resonance phenomena, as it is unlikely that eddy currents play a significant role in NiZn ferrites. Additionally, the temperature at which power losses begin to increase depends on the applied field. At 3 mT, the losses remain constant up to 100°C, whereas at 10 mT, the losses start to increase at approximately 60°C.
The previous considerations suggest that any further reduction in high-temperature losses should focus on increasing the resonance frequency. Cobalt is a well-known ion with a relatively high positive contribution to the magnetocrystalline anisotropy of the host lattice [2]. Additionally, cobalt has been reported to enhance domain wall pinning, thereby hindering their movement [8,20].
In Figure 7, the final densities of group B samples are shown for the two sintering temperatures tested in the laboratory, 1150 and 1175°C. The observed pattern is identical for both sintering temperatures. At cobalt contents up to 0.034 ions per formula unit, the densification appears to be slightly retarded, whereas at higher cobalt contents, enhanced densification is observed. Representative SEM images for the two sintering temperatures are included as insets in Figure 7. No microstructural differences were visually detected either between the samples with varying cobalt content or between chemically identical specimens sintered at the two different temperatures. The high-frequency power losses of the samples sintered at 1150°C were superior to those sintered at 1175°C. This enhanced densification is likely associated with grain growth, which is not visually detectable but is sufficient to negatively affect the 10 MHz power losses. Consequently, the results reported in the following paragraphs for group B samples refer exclusively to a sintering temperature of 1150°C.
Figure 8 shows the 10 MHz power losses as a function of temperature for group B specimens with gradually increasing cobalt content.
In general, cobalt stabilizes the temperature dependence of the power losses. This is likely due to shift in resonance to higher frequencies, as will be described in a subsequent paragraph. At an induction field of 10 mT (Figure 8(a)), the low- temperature losses, attributed to hysteresis, increase with increasing cobalt content, while the losses at temperatures above 80°C decrease significantly. For instance, at 10 MHz, 10 mT and 100°C, specimen A195/B020 exhibited power losses of 2100 mW cm-3 while specimen B040 1233 mW cm-3 – an approximate decrease of 41%. A similar reduction is observed at 120°C, where losses decrease by 57% between specimens A195/B020 (4072 mW cm-3) and B046 (1751 mW cm-3). As shown in Figure 8(b) the beneficial effect of cobalt on reducing high-frequency, high-temperatures losses weakens at lower fields. This is because at lower fields, the temperature range over which hysteresis losses dominate is broader (Figure 6), and these losses increase with higher cobalt content.
The initial magnetic permeabilities and the saturation magnetic flux densities are shown in Figure 9.
The permeabilities, in all cases, increased with increasing temperature. Furthermore, it appears that permeability decreases with increasing cobalt content. However, it is challenging to attribute this effect solely to the presence of cobalt since the counteracting effect of density is also included in these results. On the other hand the saturation flux density seems to increase with cobalt content up to a level of 0.46 cobalt ions per formula unit, beyond which it decreases.
Another approach to increasing the resonance frequency involves varying the Ni/Zn molar ratio, which was maintained equal to 1 in all group A and B syntheses. It is known that increasing the Ni/Zn ratio raises the magnetocrystalline anisotropy constant while reducing the saturation flux density and initial magnetic permeability [2]. Consequently, the resonance frequency is expected to shift to higher frequencies, leading to reduced high-frequency losses. The decision to vary the Ni/Zn ratio from 1 to higher values was made for synthesis B040/C100. This synthesis was selected because it exhibited the lowest losses at 100°C, sufficiently low losses at 120°C, and acceptable magnetic permeabilities and saturation flux densities. Based on this rationale, group C syntheses were developed.
The final sintered densities of group C specimens are shown in Figure 10. The initial increase in the Ni/Zn ratio to 1.18 results in higher densities, while a further increase shows a tendency toward lower densities. SEM investigations did not reveal any clearly distinguishable differences in the microstructures.
The 10 MHz power losses as a function of temperature are shown in Figure 11. The advantage of a higher Ni/Zn ratio becomes evident only at the relatively high field of 10 mT. Achieved power losses at 120°C with specimen C118 were 1400 mW cm-3, which are lower than the corresponding values of all group B specimens reported earlier (Figure 8). Under low fields of 3 mT (Figure 11(b)), synthesis B040 remains superior in terms of power losses.
The initial magnetic permeabilities and saturation flux densities of group C specimens are shown in Figure 12.
The magnetic permeabilities clearly decrease with increasing Ni/Zn ratio, as predicted by the theory of antiferromagnetism [2]. However, this trend is not entirely followed by the saturation flux density, which increases significantly when the Ni/Zn ratio varies from 1 to 1.18, beyond which it decreases, as expected. The saturation flux density that physically represents the resultant magnetic moment per unit volume, appears to be influenced by the density more than the initial permeability. Despite the higher Ni/Zn ratio, the permeability of specimen C118 is higher than that of specimen B040 due to its higher density (Figure 10). At comparable densities, however, the permeability decreases, as the Ni/Zn ratio becomes the determining factor.
4. Discussion
Power losses in ferrites are generally categorized into hysteresis losses (Ph), eddy current losses (Pe), and residual losses (Pr). The identification of loss sources relies on their distinct frequency dependencies: Per cycle, hysteresis losses remain independent of frequency, eddy current losses increase linearly with frequency, and residual losses exhibit an even stronger frequency-dependent growth [30]. Figure 13 illustrates the power losses per cycle as a function of frequency for synthesis A195/B020 across three temperatures, highlighting these trends.
The power losses per cycle remain independent of frequency up to approximately 6 MHz, beyond which they increase significantly. This frequency independent portion corresponds to hysteresis losses. At higher frequencies, losses exceeding the hysteresis level are attributed to eddy current and residual losses, collectively referred to as Pe+Pr. Differentiating the linear and exponential components graphically is challenging, but it is believed that most of these losses result from resonance effects. Additionally, the threshold frequency at which losses begin to rise decreases with temperature, shifting from approximately 8 MHz at 25°C to about 6 MHz at 120°C. Spin rotational resonance is proportional to saturation magnetization, which diminishes as temperature increases [29]. Furthermore, higher temperatures reduce domain wall stiffness and pinning effects [30], leading to a decrease in domain wall resonance. At 10 MHz and 120°C, resonance accounts for over 70% of the observed losses.
Consequently, the sharp increase in 10 MHz losses with temperature, as shown in Figure 6, is attributed to the same mechanism: resonance effects. The temperature at which losses rise significantly is strongly influenced by the applied field. It is unlikely that the rotational resonance frequency decreases with increasing field strength [29,31]. Instead, the primary explanation is that domain wall resonance, the dominant loss-generating mechanism, becomes more pronounced as the applied field reduces the effectiveness of domain wall pinning. Similar effects have been observed in [8] at 1.5 MHz, where losses were linked to the inefficiency of pinning induced by cobalt.
The introduction of cobalt to NiZn ferrites significantly impacts their magnetic performance, with effects similar to those observed in MnZn ferrites [8,20,32,33]. At lower frequencies, cobalt compensates for the negative anisotropy of the host lattice, inducing secondary permeability maxima or power loss minima. However, as shown in Figure 8, these phenomena are absent at 10 MHz. While increasing cobalt content leads to higher hysteresis losses, it also enhances the temperature stability of these losses, likely due to stronger domain wall pinning. This is further evidenced by the decrease in initial permeability with increased cobalt content (Figure 9(a)), indicating that magnetization at low frequencies and induction levels relies heavily on domain wall movements. At higher frequencies, such as 10 MHz, the effects of magnetocrystalline anisotropy compensation are overshadowed by resonance losses. The saturation flux density, depicted in Figure 9(b)), increases with cobalt content due to the higher moment of Co2+ ions compared to Ni2+ and Zn2+ on octahedral sites. However, at the highest cobalt content (synthesis B052), both saturation flux density and permeability decrease significantly, likely because cobalt begins substituting Fe3+ ions at these concentrations.
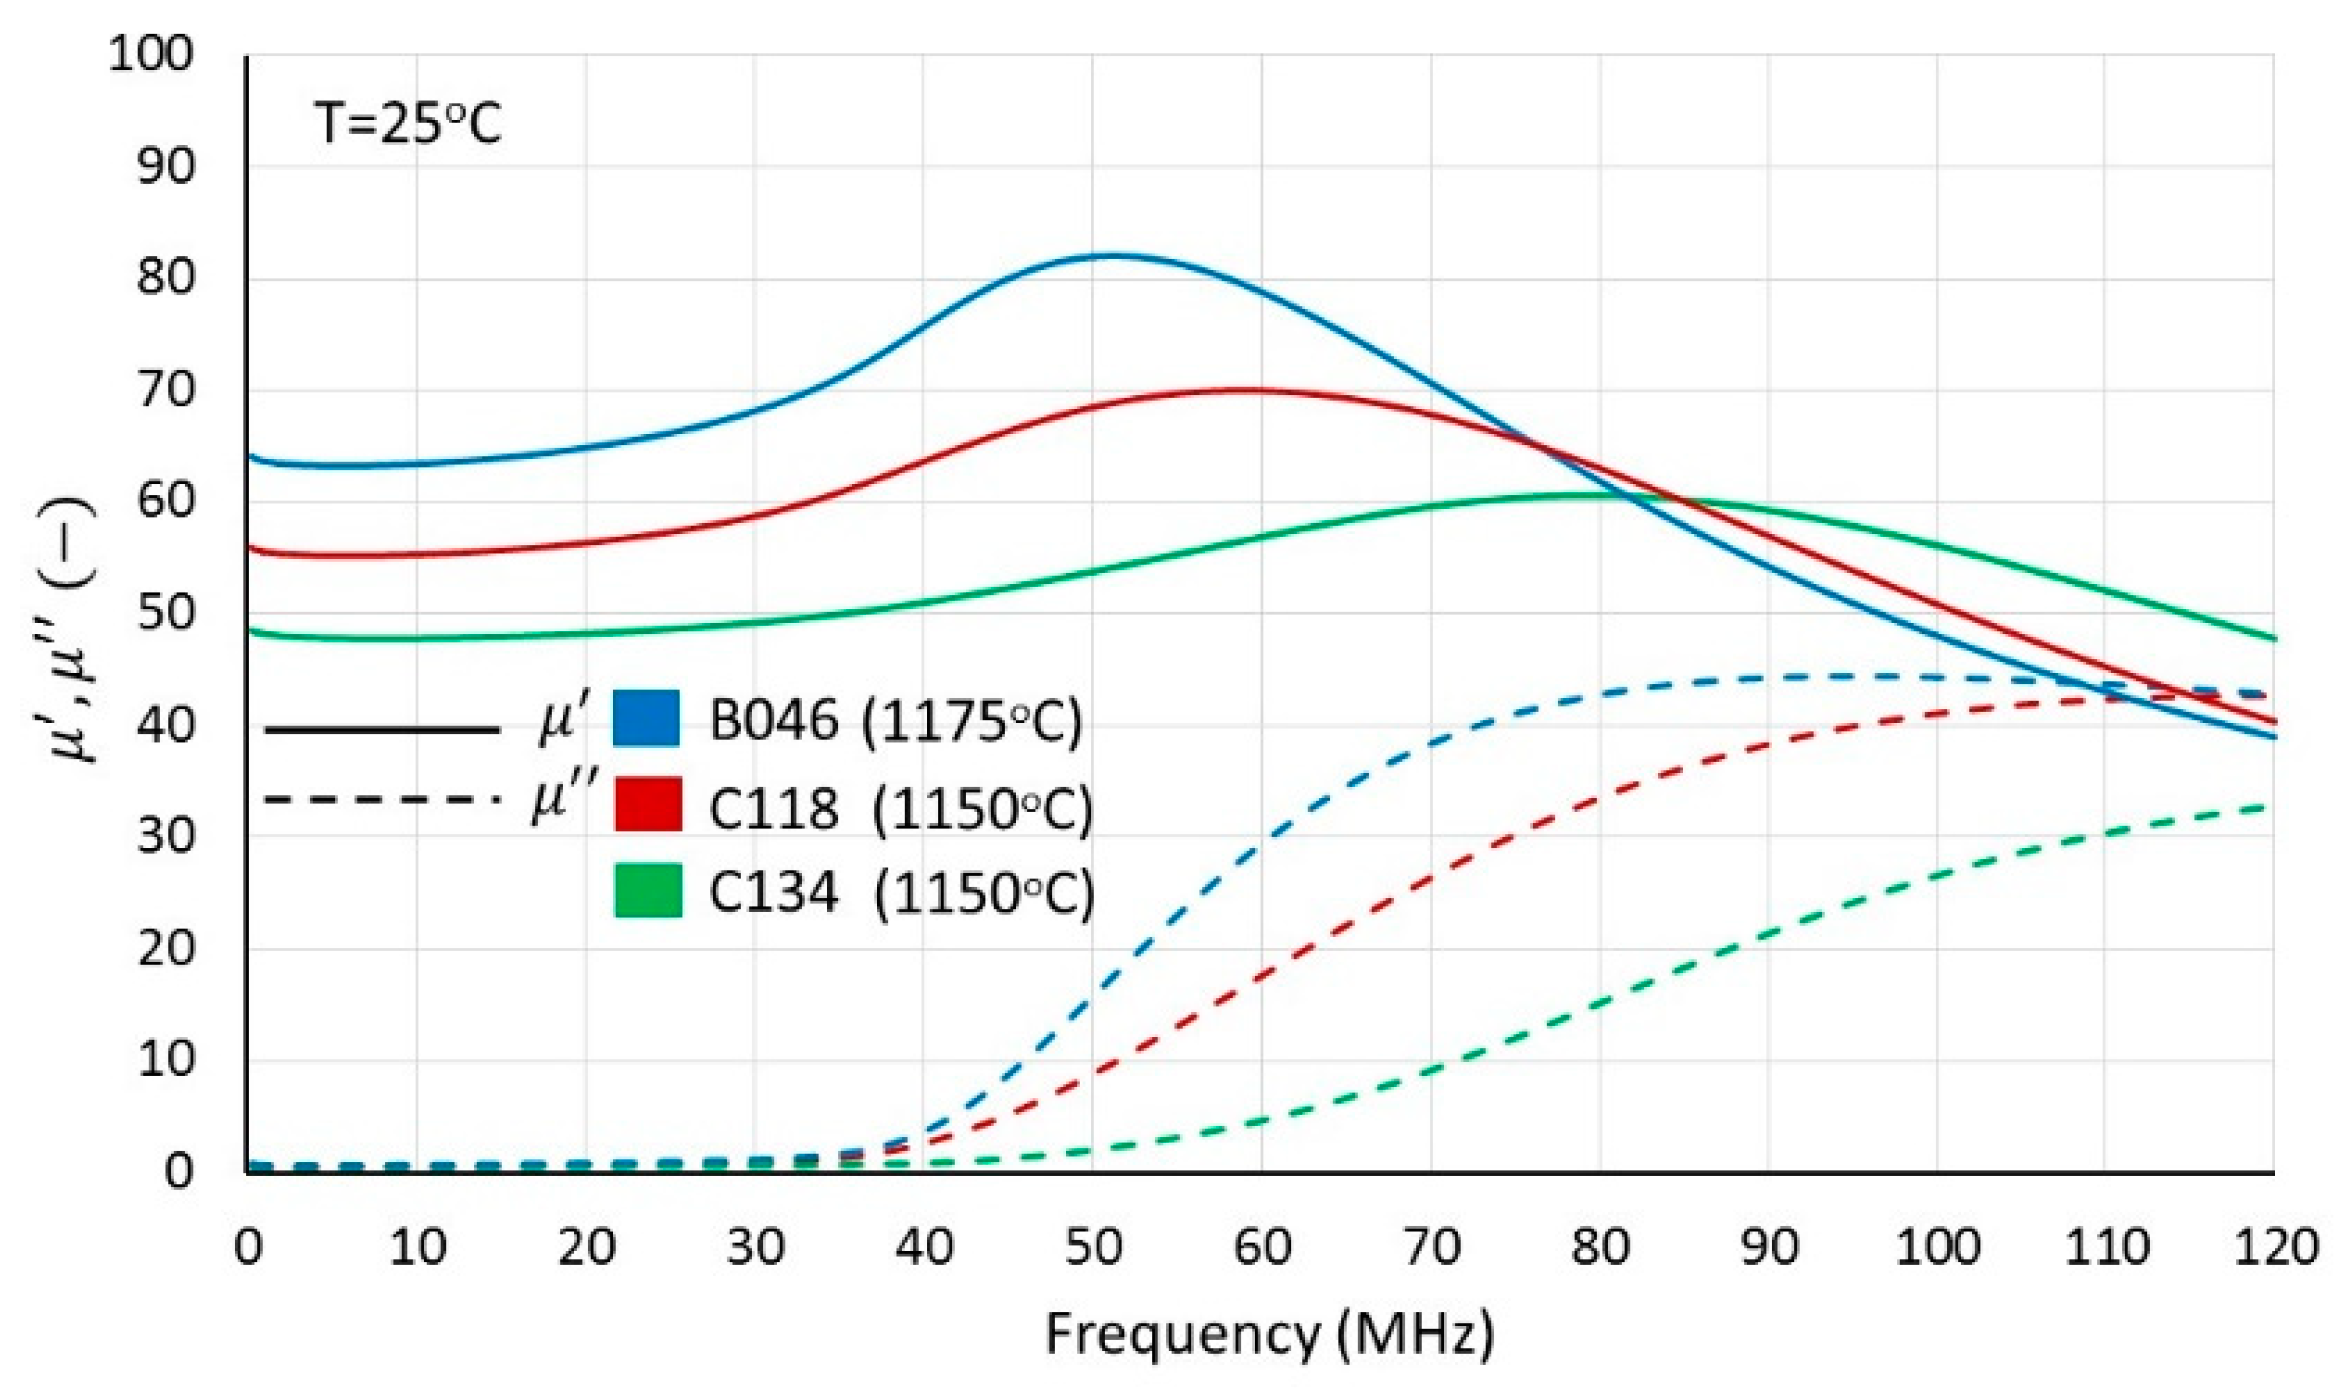
Ιn Figure 14, the frequency dependence of the real (μ′) and imaginary (μ′′) components of the complex permeability (μ=μ′+iμ′′) is presented for samples with varying cobalt content. The initial increase of the real part around 30 MHz, coinciding with the rise in the imaginary part, is typically attributed to domain wall resonance [16]. This peak shifts to higher frequencies with increasing cobalt content, indicating enhanced domain wall pinning.
Although cobalt enhances domain wall pinning and facilitates low losses at high temperatures, it also increases the system’s sensitivity to minor variations in operational parameters. Figure 15 shows the 10 MHz power loss as a function of temperature for synthesis B046, sintered at 1150°C and 1175°C. While low- temperature losses (up to 60°C) remain relatively unchanged, and do not seem to be significantly affected, a sharp rise is observed at higher temperatures. As previously noted, no significant differences in the microstructure were detected via SEM analysis. Additionally, the slightly varying densities (shown in Figure 7) do not account for the substantial differences in power losses.
In the inset of Figure 15, the real and imaginary components of the magnetic permeability are shown as functions of frequency. The domain wall resonance is clearly shifted to lower frequencies, leading to a sharp increase in power loss at higher temperatures. The efficiency of cobalt-induced pinning points appears to depend strongly on the sintering temperature, although the underlying mechanism remains unclear. Possible factors include diffusion, segregation and oxidation-reduction reactions during sintering, which may influence the cobalt distribution within the microstructure or its valence. It is worth noting that a 25°C temperature difference is comparable to the temperature gradients typically observed in industrial production furnaces.
Increasing the Ni/Zn ratio further increases further the hysteresis losses and reduces the permeability, as shown in Figure 11(a) and Figure 12(a). The increase in hysteresis losses is primarily attributed to the rise in the magnetocrystalline anisotropy constant [2], whose contribution to losses becomes more pronounced. At low temperatures, hysteresis losses are no longer independent of temperature but instead exhibit a decreasing trend (Figure 9(a)), reflecting the temperature-dependent reduction of the magnetocrystalline anisotropy constant. Magnetic permeability decreases even further (Figure 12(a)), and as shown in Figure 15, resonance frequencies shift to higher values as a direct consequence of Snoek’s law, which applies to both magnetization mechanisms. Despite the reduced permeability, power losses of 1.4 W cm-3 were achieved at 10 MHz, 10 mT and 120°C.
Power loss data at 10 MHz, especially at high temperatures, are scarce or nearly absent in the scientific literature, which hinders comparative discussions. In [15], power losses of approximately 250 mW cm-3 were measured at 3 MHz, 10 mT, and 25°C for NiCuZn ferrites. Although this frequency range lies beyond the scope of our study, the power losses of the materials presented in this article (samples A195), under identical conditions, ranged between 100 and 150 mW cm-3. These values are comparable to those reported in [34] for NiZn-ferrites. However, at 7 MHz, 10 mT, and 25°C, the power losses of about 1000 mW cm-3 reported in [15] were significantly higher than the 200-250 mW cm-3 measured for sample A195/Β020. Additionally, power losses at 10 MHz, 10 mT and 25°C, reported in [35], exceed 4 W cm-3-considerably higher than the corresponding losses presented in Figure 6.
Figure 16.
The real and imaginary components of the complex permeability as a function of frequency for group C samples with different Ni/Zn molar ratios.
Figure 16.
The real and imaginary components of the complex permeability as a function of frequency for group C samples with different Ni/Zn molar ratios.
5. Conclusions
Polycrystalline NiZn ferrites with excellent magnetic performance at high frequencies, particularly at 10 MHz, were synthesized using the conventional mixed oxide method. Optimized conditions were found to require slight iron deficiency and sintering temperatures between 1150°C and 1175°C to achieve a balance between densification and microstructural refinement.
The incorporation of cobalt significantly reduced high-temperature power losses by enhancing domain wall pinning and stabilizing the temperature dependency of these losses. However, this improvement was accompanied by an increase in hysteresis losses and a decrease in permeability. A moderate cobalt content (e.g. 0.04 atoms per formula unit) provided the best trade-off, yielding materials with power losses of 1233 mW cm-3 at 10 MHz, 10 mT and 100°C. The corresponding initial permeability and saturation flux density at 100°C were 90 (-) and 230 mT, respectively.
Stabilization of high-temperature, high-frequency power losses through domain wall pinning induced greater sensitivity to process operational parameters, such as the sintering temperature.
Increasing the Ni/Zn molar ratio above 1 enhanced the magnetocrystalline anisotropy constant and shifted resonance frequencies to higher values. However, this also resulted in increased hysteresis losses and reduced permeability. At a Ni/Zn molar ratio of 1.18 the measured power losses were 1400 mW cm-3 at 10 MHz, 10 mT and 120°C. The corresponding initial permeability and saturation flux density at 120°C were 97 (-) and 270 mT, respectively.
Author Contributions
Formal analysis, Data curation, Writing-editing original draft, S.Z. and G.K.; Writing-review and editing V.Z. and E.K.; Supervision E.R.; Conceptualization, validation C.V. and K.O. All authors have read and agreed to the published version of the manuscript.
Funding
This research received no external funding.
Data Availability Statement
The original contributions presented in the study are included in the article, further inquiries can be directed to the corresponding authors.
Conflicts of Interest
The authors declare no conflict of interest.
References
- Goldman, A. (Ed.), Handbook of Modern Ferromagnetic Materials, Springer US, Boston, MA, 2006.
- Smit, J.; Wijn, H.P.J. Ferrite, Philips Technical Library, Eindhoven, 1959.
- Leary, A.M.; Ohodnicki, P.R.; McHenry, M.E. Soft Magnetic Materials in High-Frequency, High-Power Conversion Applications. JOM 2012, 64. [Google Scholar] [CrossRef]
- Chen, J.; Du, X.; Luo, Q.; Zhang, X.; Sun, P.; Zhou, L. A Review of Switching Oscillations of Wide Bang Gap Semiconductor Devices. IEEE Trans. on Power Electronics 2020, 35, 13182–13199. [Google Scholar] [CrossRef]
- Morel, H.; Alam, M.; Bevilacqua, P.; Tournier, D.; Planson, D. Impact of Wide Band-Gap Semiconductors on the Design in Power Electronics, Symposium on Advanced Technologies in Electrical Systems (SATES 2023), Mar 2023, Arras, France, hal-04224402.
- Su, H.; Zhang, H.; Tang, X.; Xiang, X. ; High-permeability and high-Curie temperature NiCuZn ferrite. J. Magn. Magn. Mater. 2004, 283, 157–163. [Google Scholar] [CrossRef]
- Zaspalis, S.; Kogias, G.; Zaspalis, V. The effect of Sintering Temperature on the Densification and Magnetic Performance of NiCuZn-ferrites (CuO 0-6 wt.%). Materials 2024, 17, 2293. [Google Scholar] [CrossRef]
- Lucas, A.; Lebourgeois, R.; Mazaleyrat, F.; Laboure, E. Temperature dependence of core loss in cobalt substituted Ni-Zn-Cu ferrites. J. Magn. Magn. Mater. 2011, 323, 735–739. [Google Scholar] [CrossRef]
- Byun, T.Y.; Byeon, S.C.; Hong, K.S. Factors affecting initial permeability of Co- substituted Ni–Zn–Cu ferrites. IEEE 1999, 35 Pt 2, 3445–3447. [Google Scholar] [CrossRef]
- Sun, K.; Lan, Z.; Yu, Z.; Li, L.; Huang, J.; Zhao, X. Effects of SnO2 addition on the microstructure and magnetic properties of NiZn-ferrites. J. Magn. Magn. Mater. 2008, 320, 3352–3355. [Google Scholar] [CrossRef]
- Hu, J.; Shi, G.; Ni, Z.; Zheng, L.; Chen, A. ; Effects of V2O5 addition on NiZn ferrites synthesized using two-step sintering process. Physica B 2012, 407, 2205–2210. [Google Scholar] [CrossRef]
- Van Uitert, L.G. High-Resistivity Nickel Ferrites – the Effect of Minor Additions of Manganese or Cobalt. J. Chem. Phys. 1956, 24, 306–310. [Google Scholar] [CrossRef]
- Jacobo, S.E.; Duhalde, S.; Bertorello, H.R. Rare earth influence on the structural and magnetic properties of NiZn ferrites. J. Magn. Magn. Mater. 2004, 272–276, 2253–2254. [Google Scholar] [CrossRef]
- Priese, C.; Töpfer, J. The effect of microstructure on the initial permeability of Ni-Zn ferrite. J. Magn.Magn. Mater. 2022, 560, 169581. [Google Scholar] [CrossRef]
- Su, H.; Zhang, H.; Tang, X.; Jing, Y. Influence of microstructure on permeability dispersion and power loss of NiZn ferrite. J. Appl. Phys. 2008, 103, 093903. [Google Scholar] [CrossRef]
- Andalib, P.; Harris, V.G. Grain boundary engineering of power inductor cores for MHz applications. J. of Alloys and Compounds 2020, 832, 153131. [Google Scholar] [CrossRef]
- Clausell-Terol, C.; Barba, A.; Mormeneo-Segarra, J.A.; Putyra, P.; Jarowska, L. Enhancing NiZn ferrite properties through microwave sintering: A comparative study. Boletín de la Sociedad Española de Ceramíca y Vidryo 2024, 63, 161–171. [Google Scholar] [CrossRef]
- Gao, S.; Song, S.; Song, Q. Effect of High-Energy Ball Milling on the Magnetic Properties of NiZn Ferrite Ceramics Synthesized by Spark Plasma Sintering. J. Mater. Sci. Chem. Eng 2015, 3, 50–55. [Google Scholar] [CrossRef]
- Brissette, L.S.; Grossi, E.A.; Titlar, J.M.; Cherven, K.; Spriggs, R.M. Hote pressed ceramic ferrites: Magnetic-mechanical-microstructural interactions. AIP Conf. Proc. 1976, 29, 561. [Google Scholar] [CrossRef]
- Frajer, G.; Isnard, O.; Chaza, H.; Delette, G. ; Effect of cobalt addition on the magneto-crystalline anisotropy parameter of sintered NiZn ferrites evaluated from magnetization curves. J. Magn. Magn. Mater. 2019, 473, 92–98. [Google Scholar] [CrossRef]
- Fiorillo, F.; Coisson, M.; Beatrice, C.; Pasquale, M. Permeability and losses in ferrites from dc to the microwave regime. J. Appl. Phys. 2009, 105, 07A517. [Google Scholar] [CrossRef]
- De Lau, J.G.M.; Broese van Groenou, A. High-frequency properties of Ni-Zn-Co ferrites in relation to Iron content and microstructure. Journal de Physique Colloques 1977, 38, C1–17. [Google Scholar] [CrossRef]
- Stuijts, A.L. Control of microstructures in ferrites, Proceedings of the International Conference on Ferrites, Japan, 1970, pp. 108–113.
- Reijnen, P.J.L. Sintering behavior and microstructures of aluminates and ferrites with spinel structure with regard to deviation from stoichiometry. Science of Ceramics 1968, 4, 169–188. [Google Scholar]
- Globus, A. Some physical considerations about the domain wall size theorie of magnetization mechanisms. J. Phys. Colloques 1977, 38, C1.1–C1.15. [Google Scholar] [CrossRef]
- Visser, E.G.; Johnson, M.T. A novel interpretation of the complex permeability in polycrystalline ferrites. J. Magn. Magn. Mater. 1991, 101, 143–147. [Google Scholar] [CrossRef]
- Kingery, W.D.; Bowen, H.K.; Uhlmann, D.R. Introduction to ceramics, Chapter 10, Grain growth, sintering and vitrification, John Wiley & Sons, 1976, ISBN 0-471-47860-1.
- van der Zaag, P.J.; van der Valk, P.J.; Rekveldt, M.T. A domain size effect in the magnetic hysteresis of NiZn ferrites. Appl. Phys. Lett. 1996, 69, 2927–2929. [Google Scholar] [CrossRef]
- Snoek, J.L. Dispersion and absorption in magnetic ferrites at frequencies above one Mc/s. Physica 1948, 14, 207–217. [Google Scholar] [CrossRef]
- Wu, P.; Wu, W.; Tu, C.; Wang, W.; Sheng, Y.; Li, F.; Qiao, L. Temperature dependence of complex permeability and power losses for Mn-Zn ferrites. J. Appl. Phys. 2023, 134, 223903. [Google Scholar] [CrossRef]
- Lakshmanan, M. The fascinating world of the Landau-Lifshitz-Gilbert equation: An overview. Phil. Trans. R. Soc. A 2011, 369, 1280–1300. [Google Scholar] [CrossRef]
- Beatrice, C.; Dobák, S.; Tsakaloudi, V.; Ragusa, C.; Fiorillo, F.; Martino, L.; Zaspalis, V. Magnetic loss, permeability, and anisotropy compensation in CoO-doped Mn-Zn ferrites. AIP Advances 2018, 8, 047803. [Google Scholar] [CrossRef]
- Tsakaloudi, V.; Beatrice, C.; Dobák, S.; Fiorillo, F.; Zaspalis, V. Measuring and modeling broadband magnetic losses versus temperature and aging effects in CoO-doped Mn-Zn ferrites, 2020 IEEE 29th International Symposium on Industrial Electronics (ISIE), Delft, Netherlands, 2020, pp. 1454–1458. [CrossRef]
- Kawano, K.; Hachiya, M.; Iijima, Y. Study of Low-Loss NiZn-ferrite. J. Jpn. Soc. Powder Powder Metallurgy 2012, 60, 103–107. [Google Scholar] [CrossRef]
- Su, H.; Zhang, H.; Tang, X.; Shi, Y. Effects of microstructure on permeability and power loss charactersitcis of the NiZn ferrites. J. Magn. Magn. Mater. 2008, 320, 483–485. [Google Scholar] [CrossRef]
Figure 1.
Representative particle size distributions of prefired and milled powders A192, A195 and A198, determined by laser scattering.
Figure 1.
Representative particle size distributions of prefired and milled powders A192, A195 and A198, determined by laser scattering.
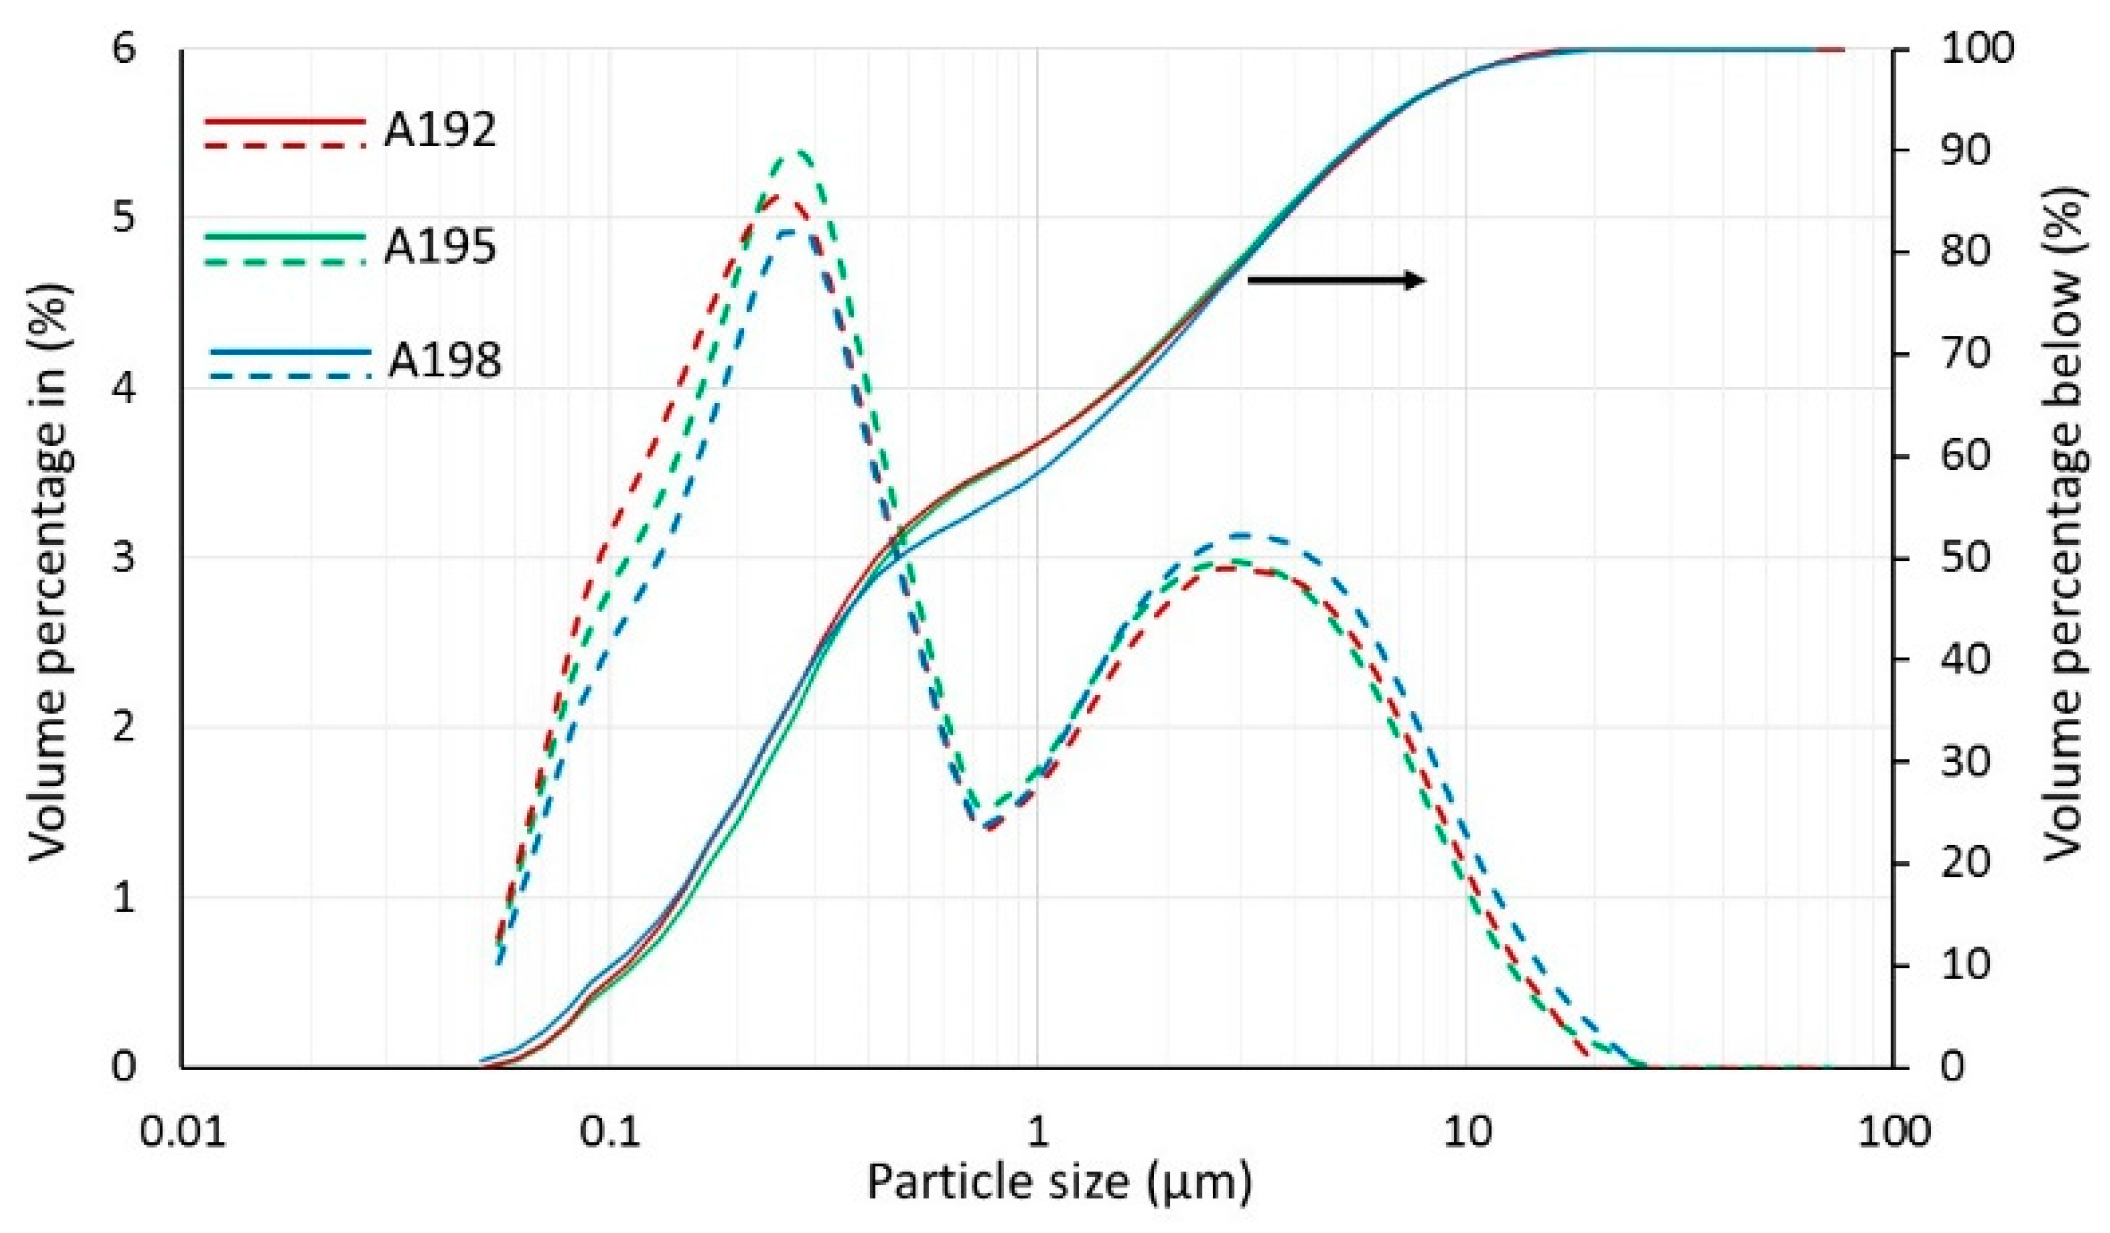
Figure 2.
Representative XRD patterns of prefired and milled powders A192 and A198.
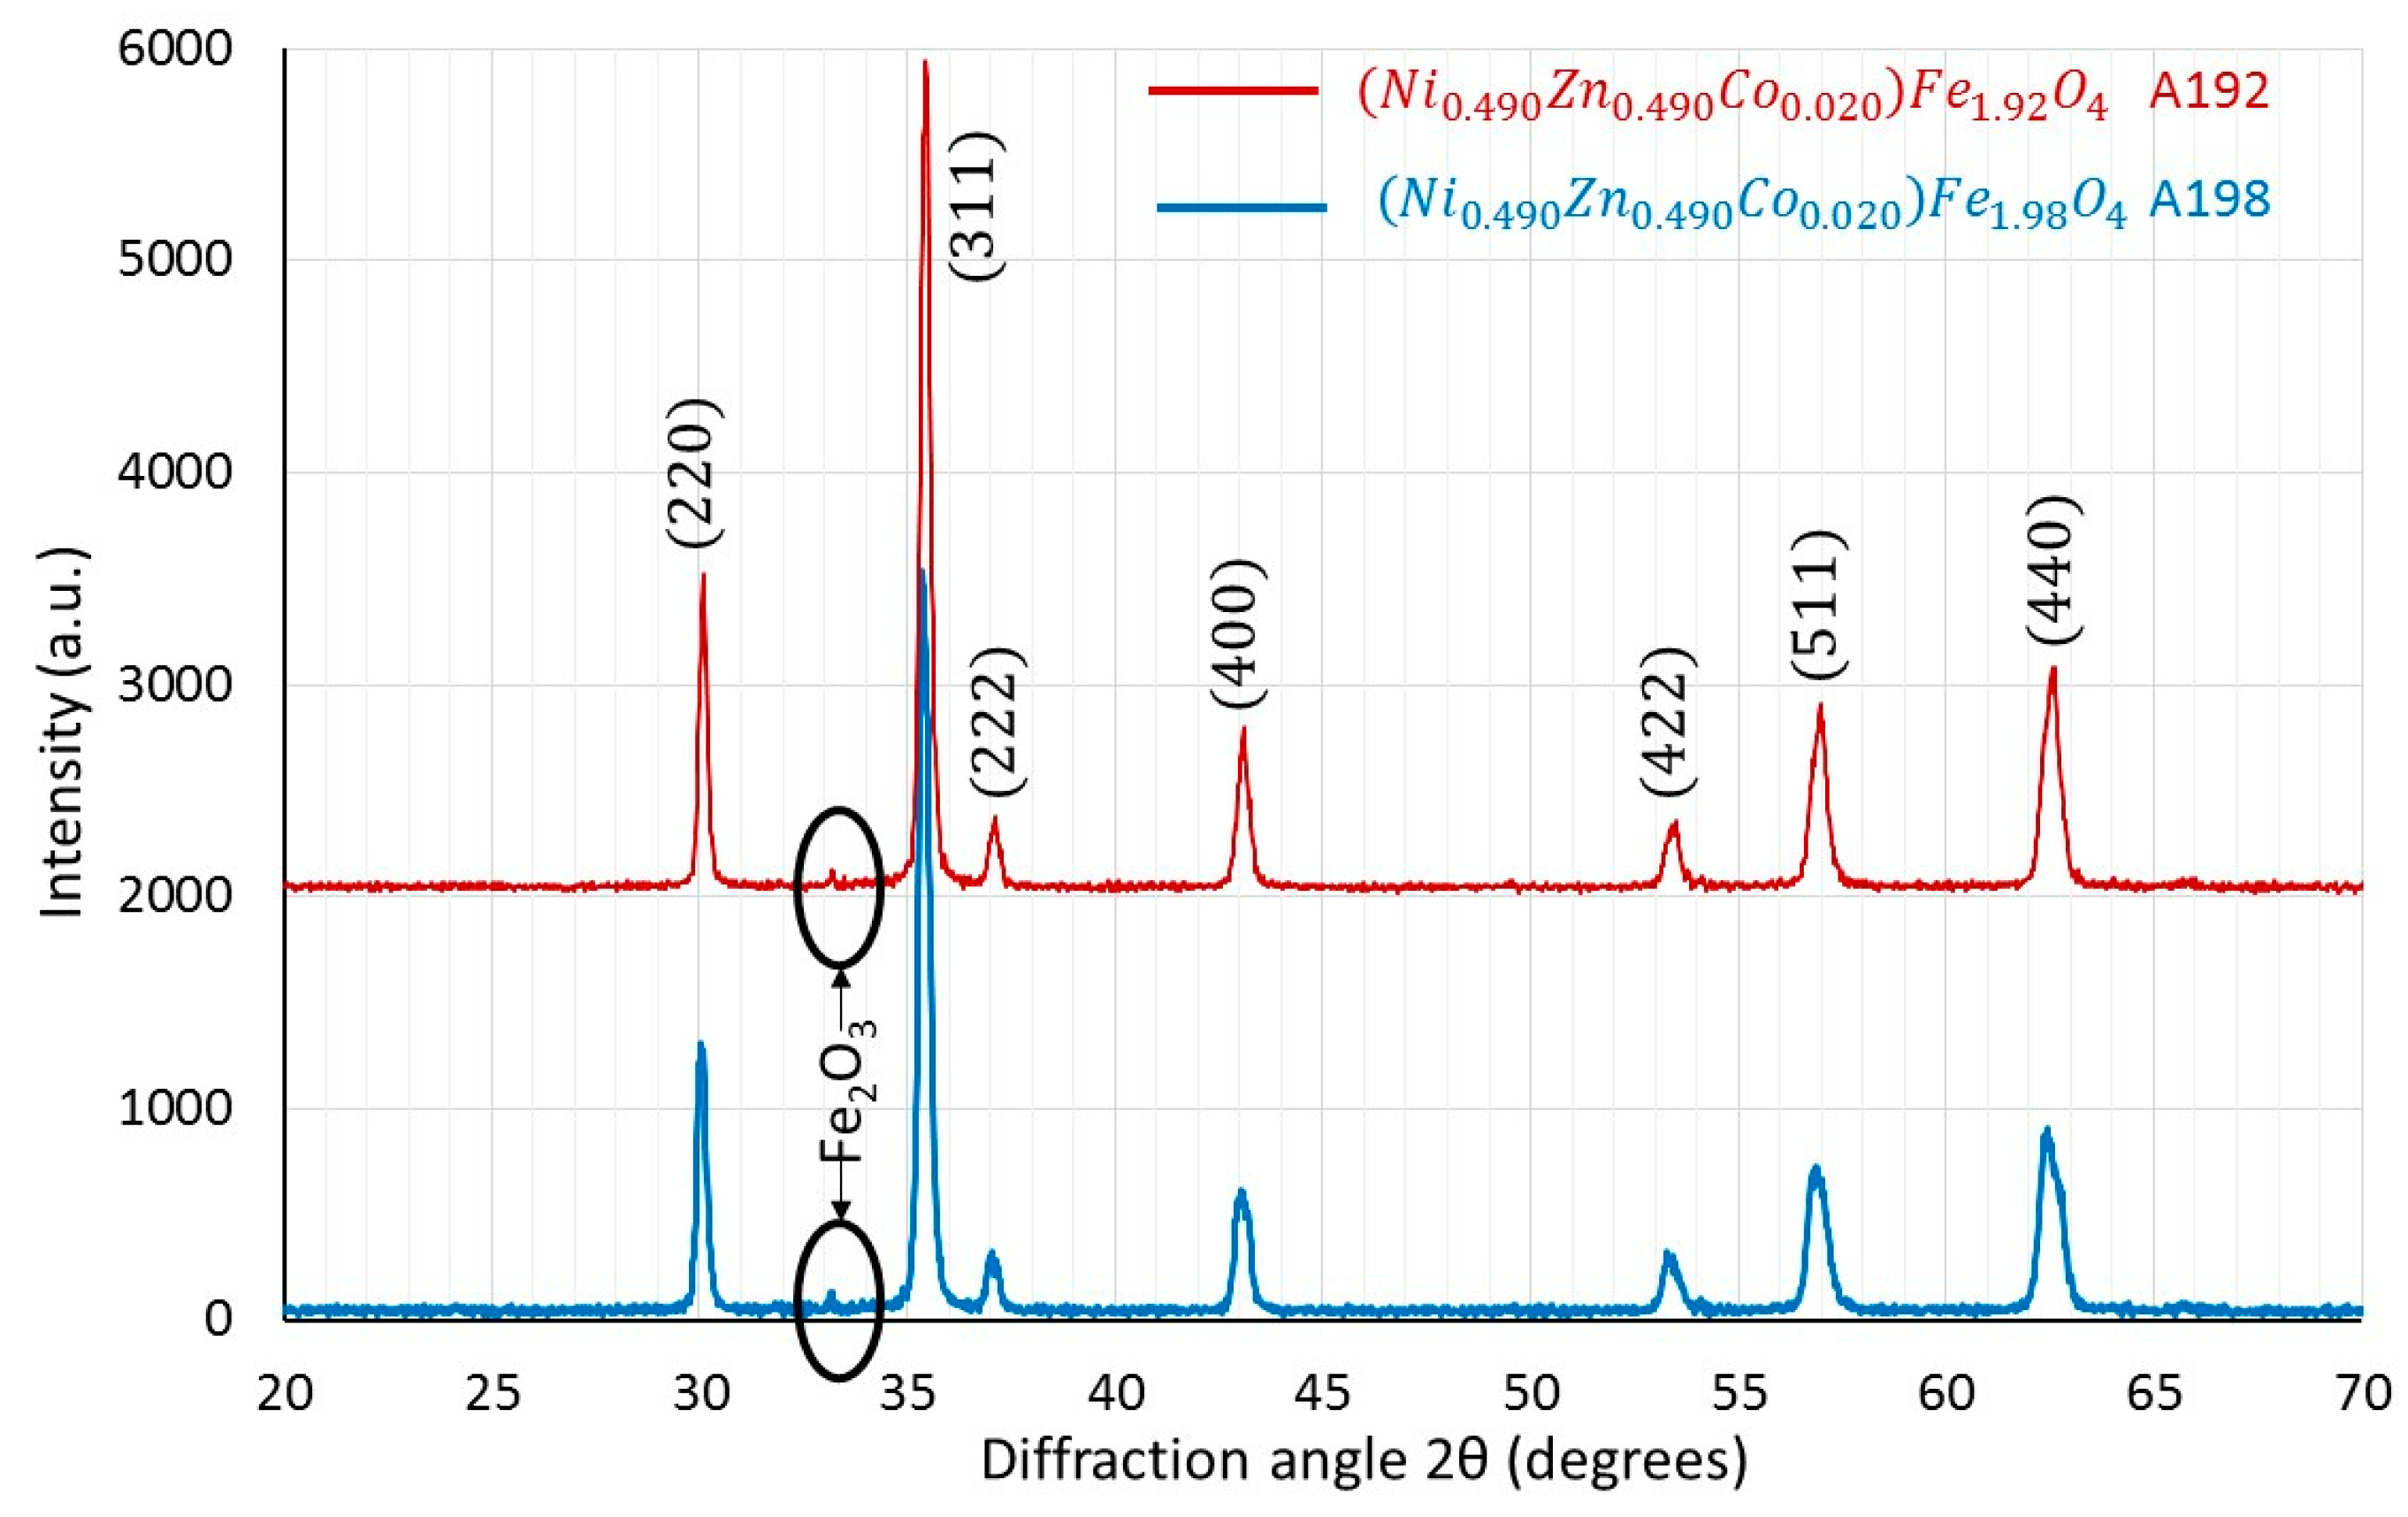
Figure 3.
Final sintered densities as a function of iron content, at different sintering temperatures.
Figure 3.
Final sintered densities as a function of iron content, at different sintering temperatures.
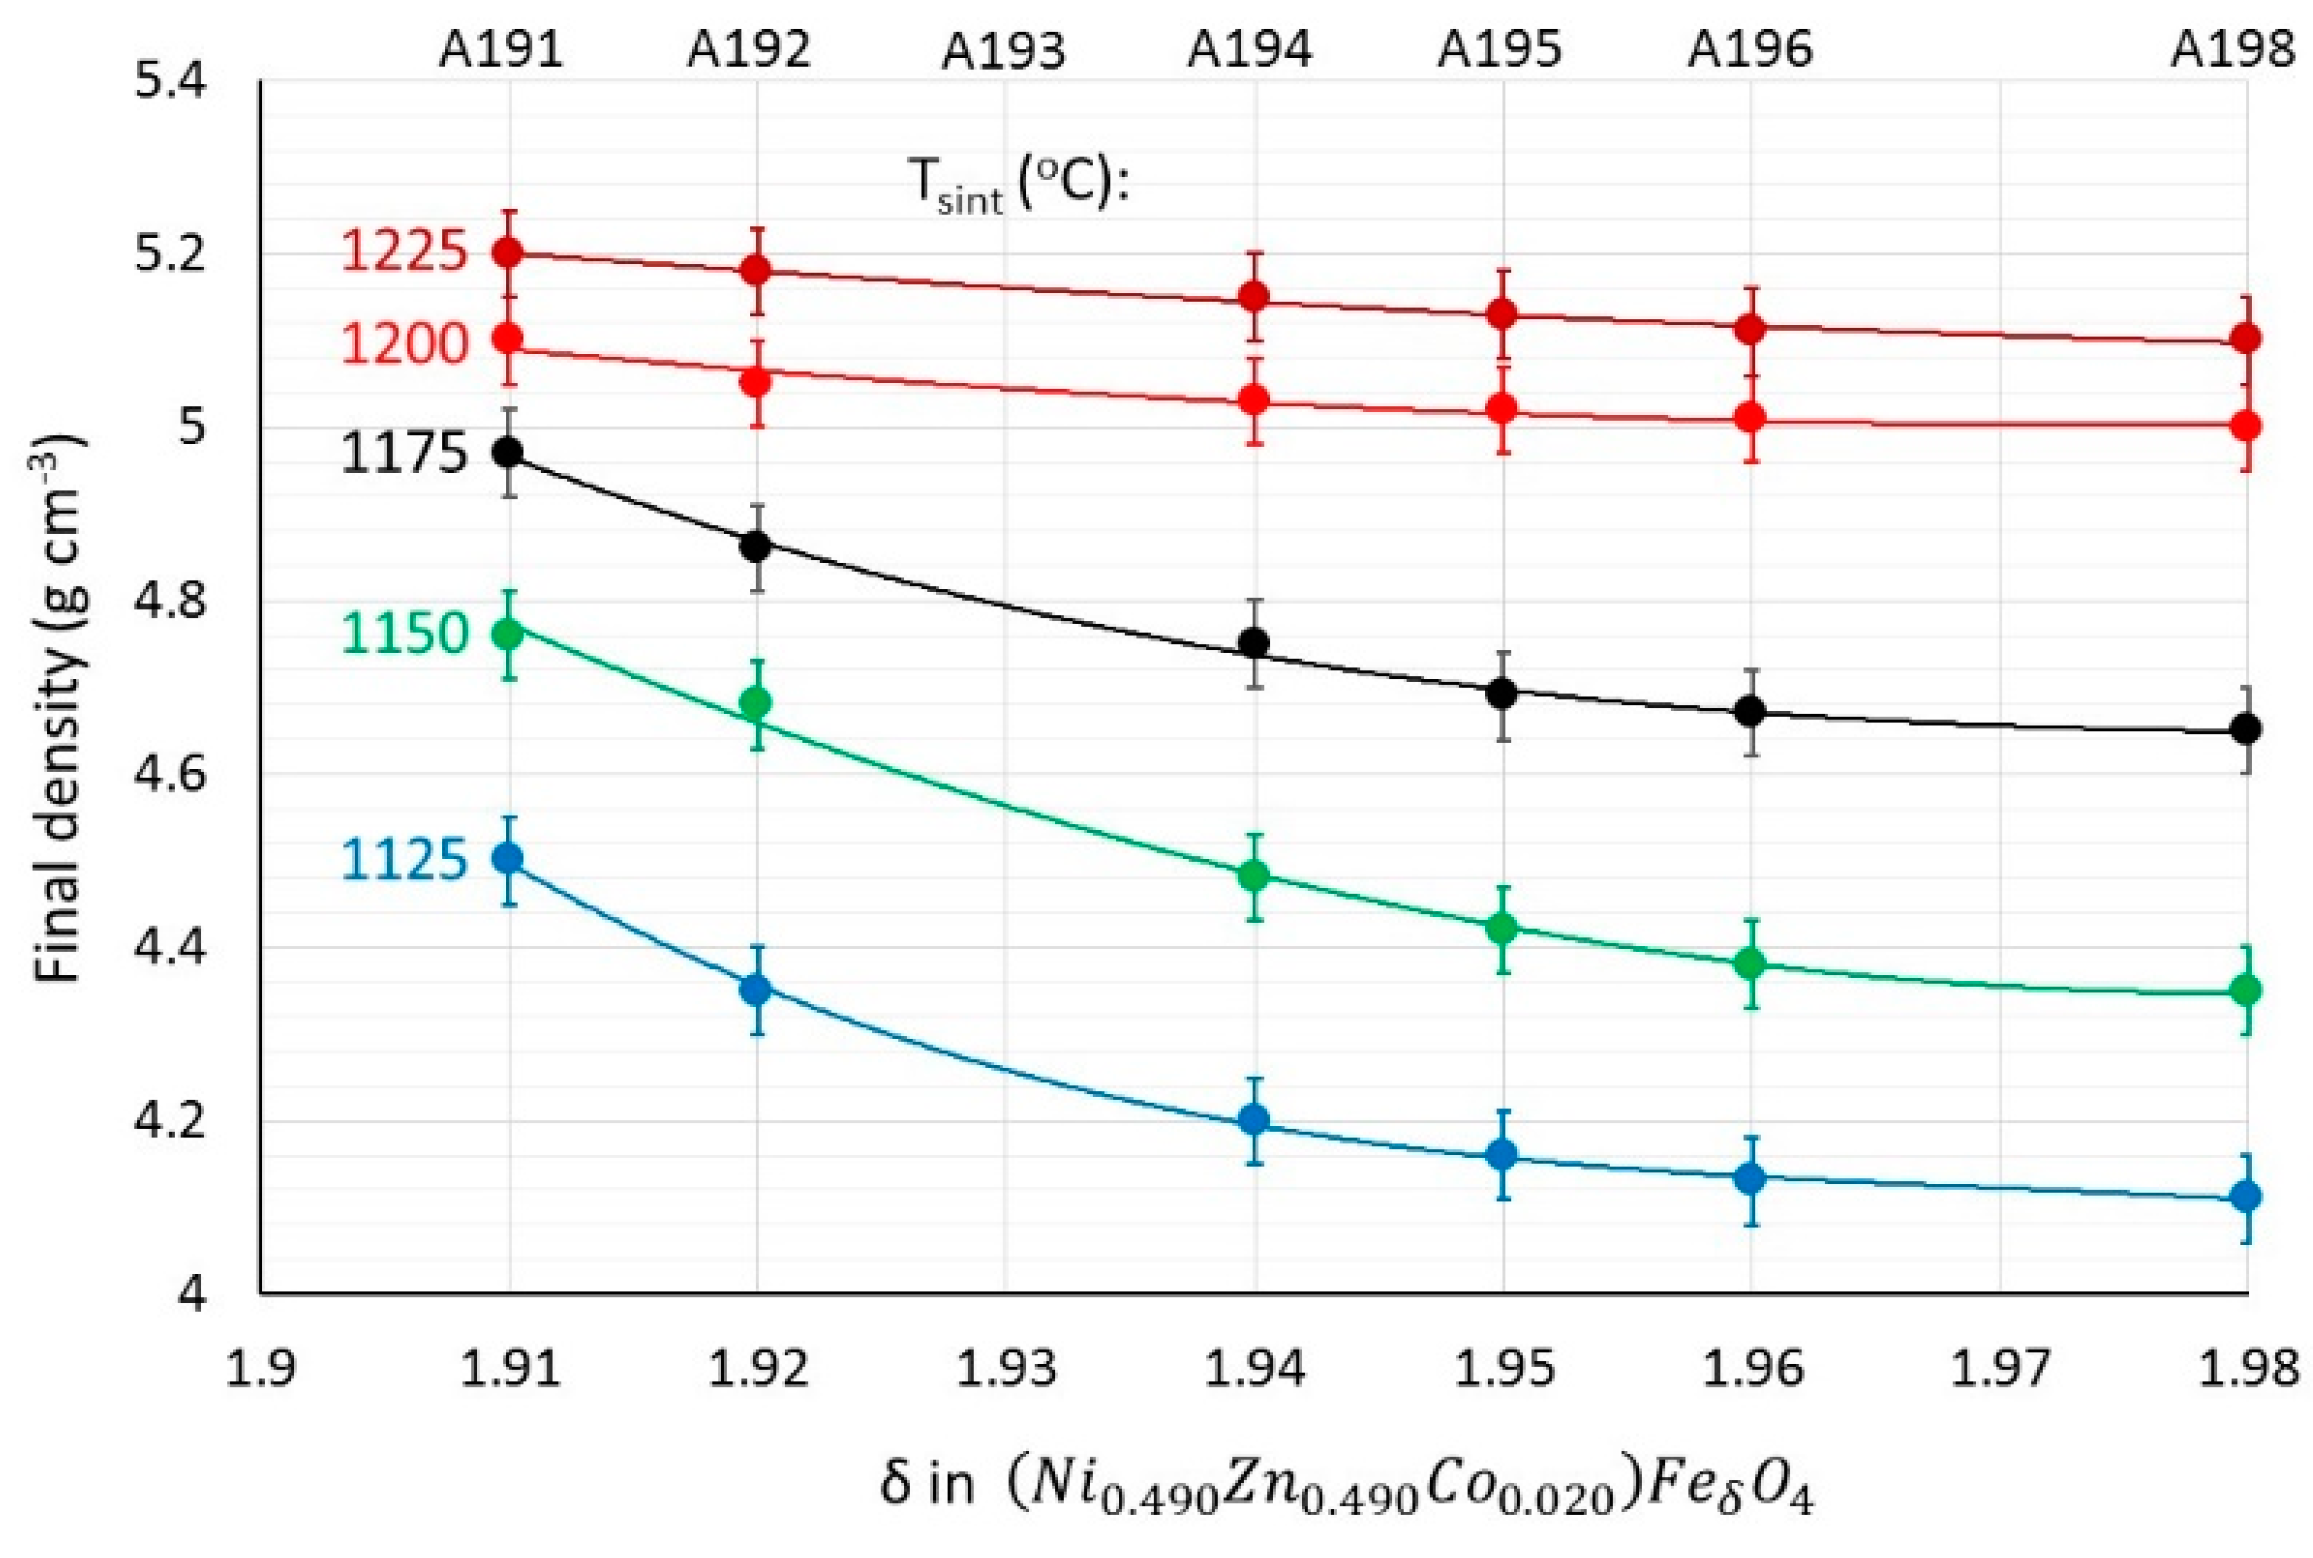
Figure 4.
Typical SEM images of specimens from group A syntheses. Panels (a),(b),(c),(d) show constant iron content with varying sintering temperature, while panels (e),(f),(g),(h) show constant sintering temperature with varying iron content.
Figure 4.
Typical SEM images of specimens from group A syntheses. Panels (a),(b),(c),(d) show constant iron content with varying sintering temperature, while panels (e),(f),(g),(h) show constant sintering temperature with varying iron content.
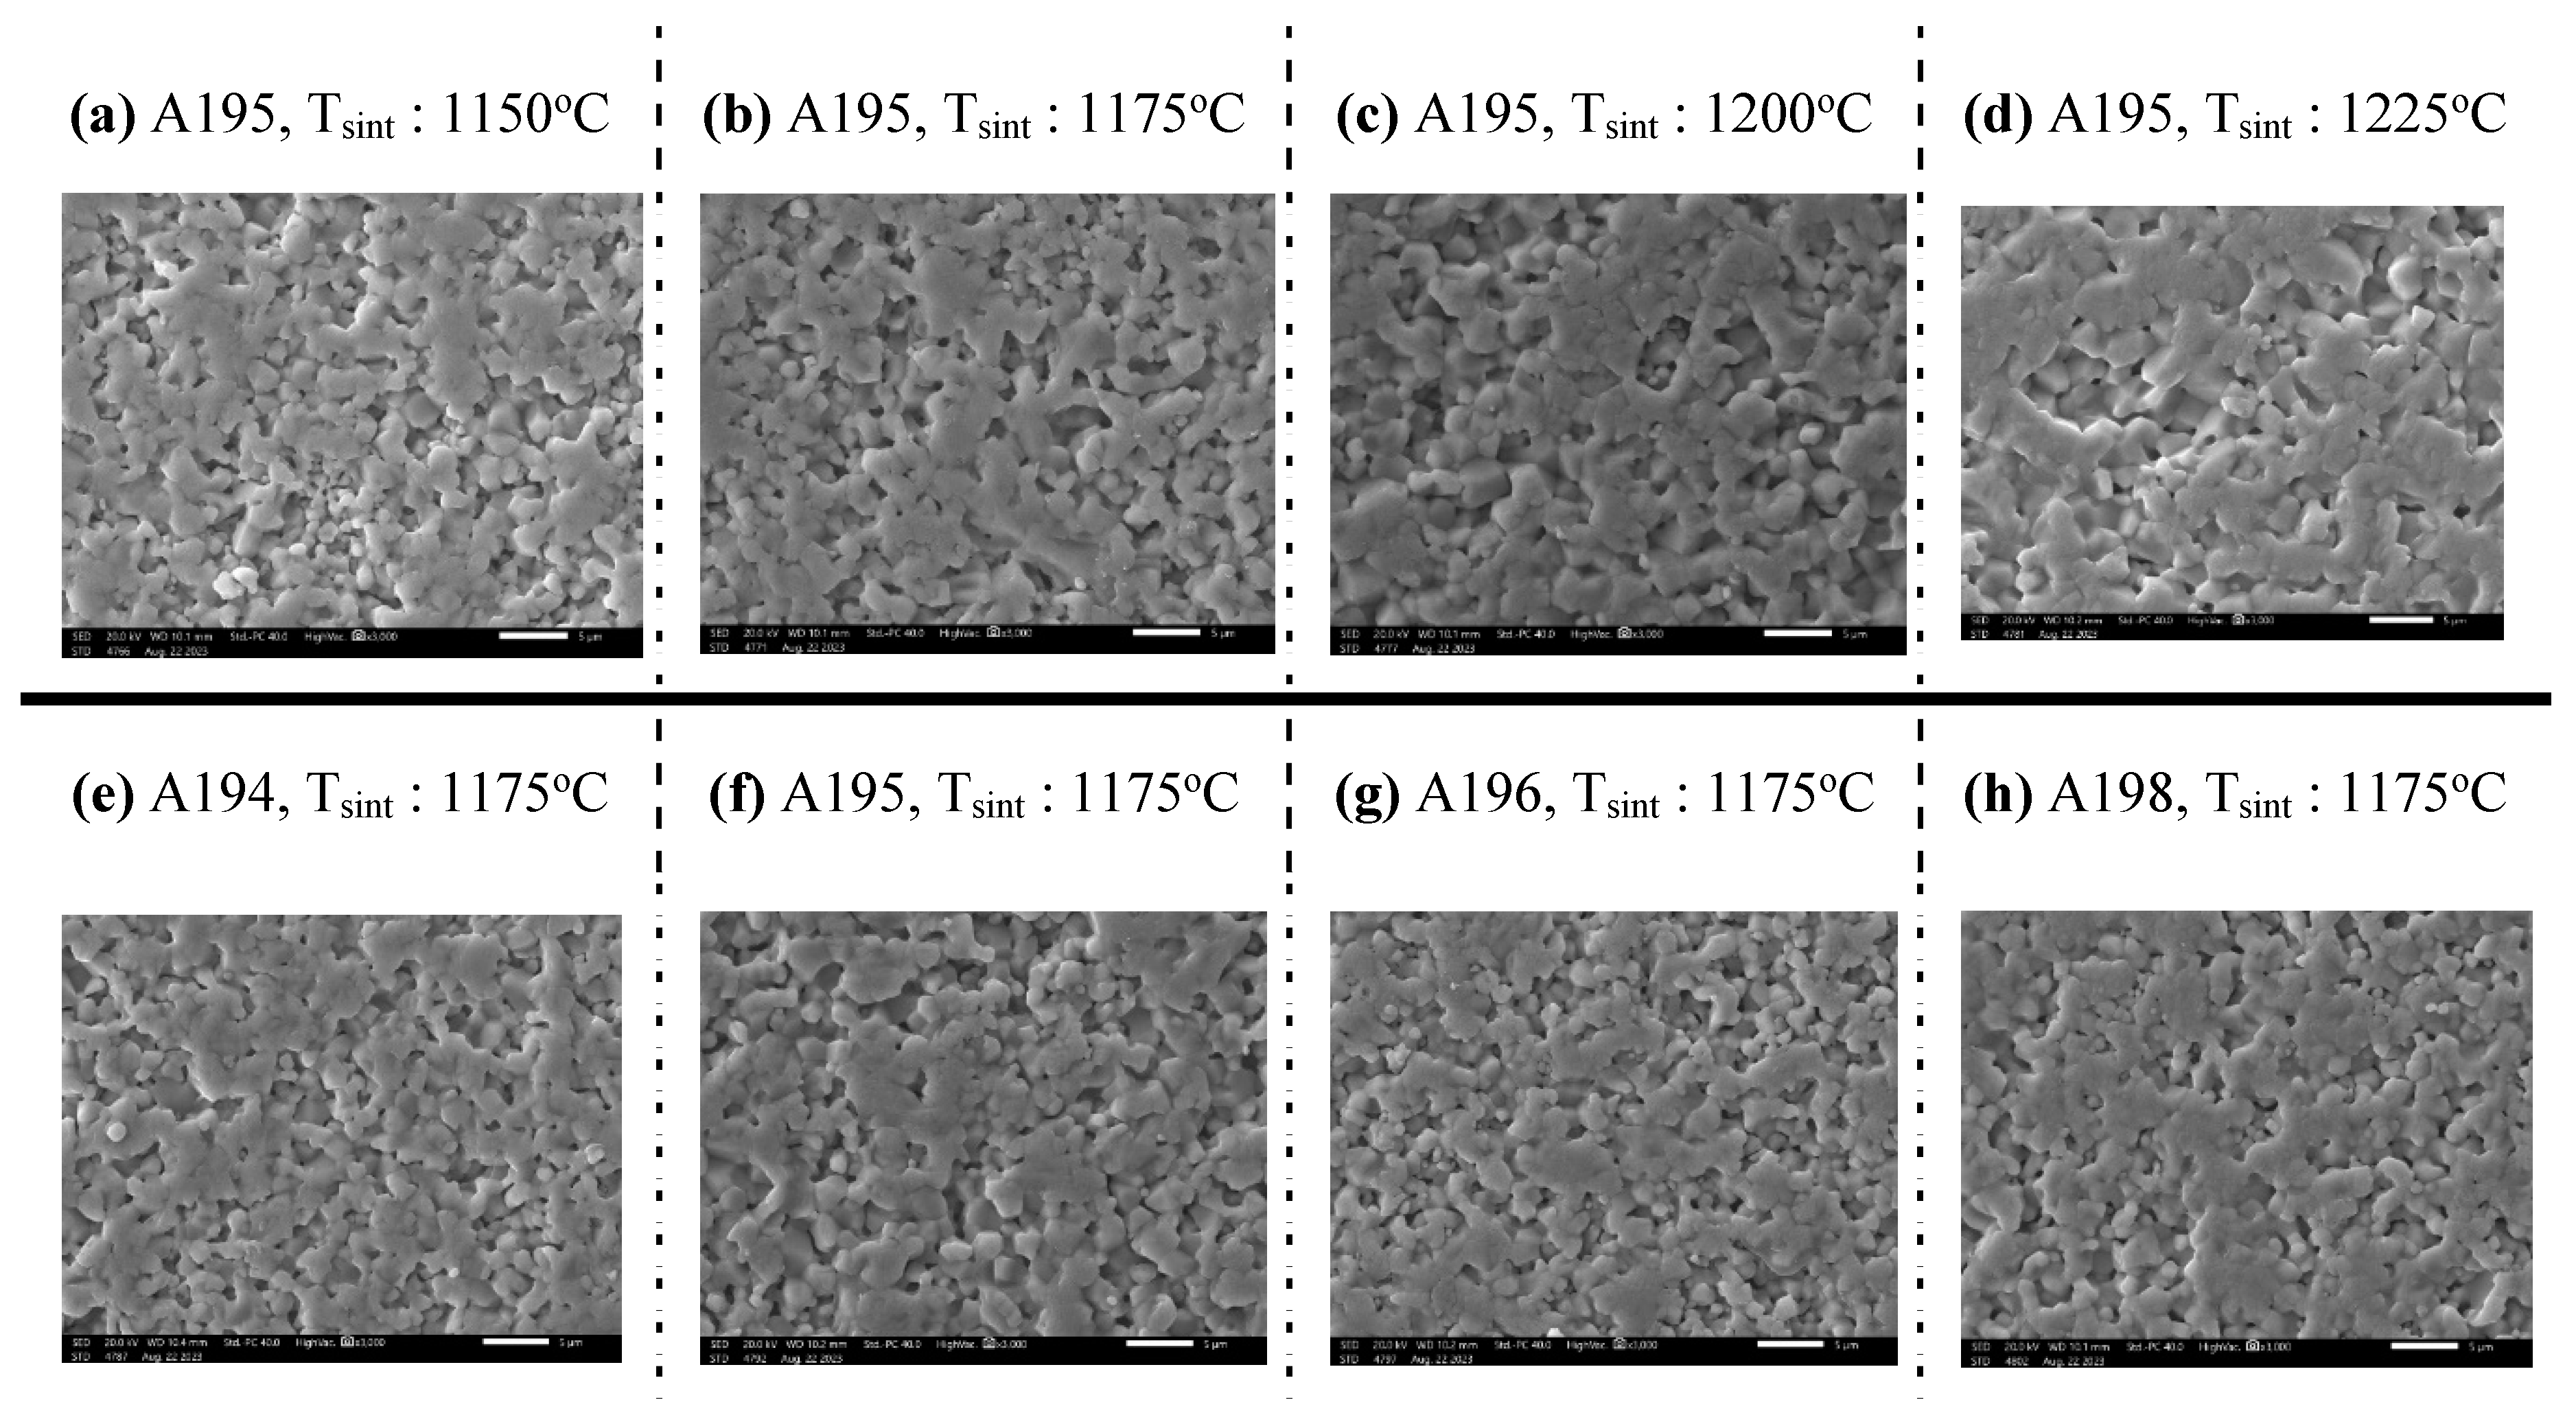
Figure 5.
Power losses at 10 MHz, 100°C and (a) 10 mT, (b) 3 mT as a function of the iron content at different sintering temperatures.
Figure 5.
Power losses at 10 MHz, 100°C and (a) 10 mT, (b) 3 mT as a function of the iron content at different sintering temperatures.
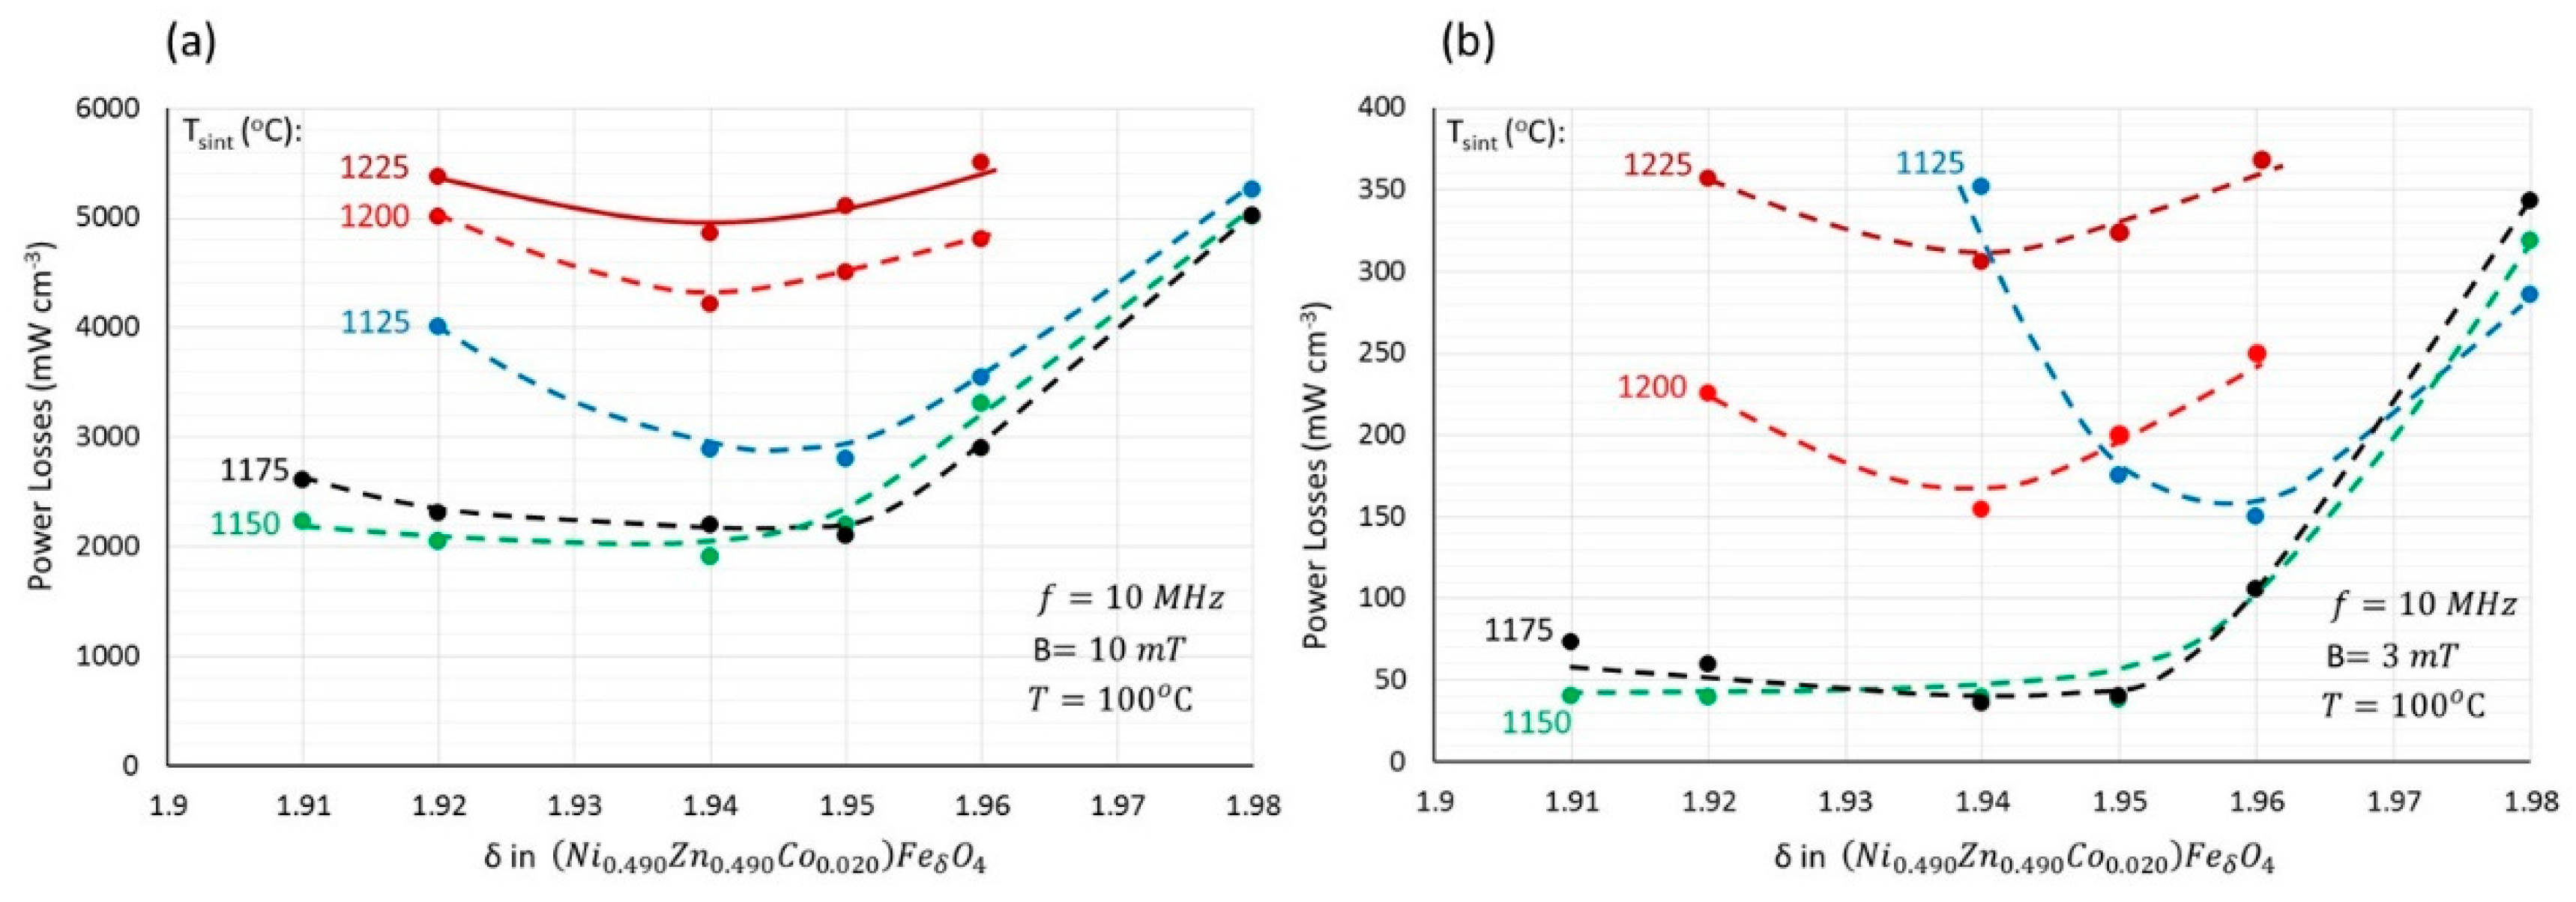
Figure 6.
Power losses measured at 10 MHz as a function of temperature for varying induction fields in specimen A195 sintered at 1175°C.
Figure 6.
Power losses measured at 10 MHz as a function of temperature for varying induction fields in specimen A195 sintered at 1175°C.
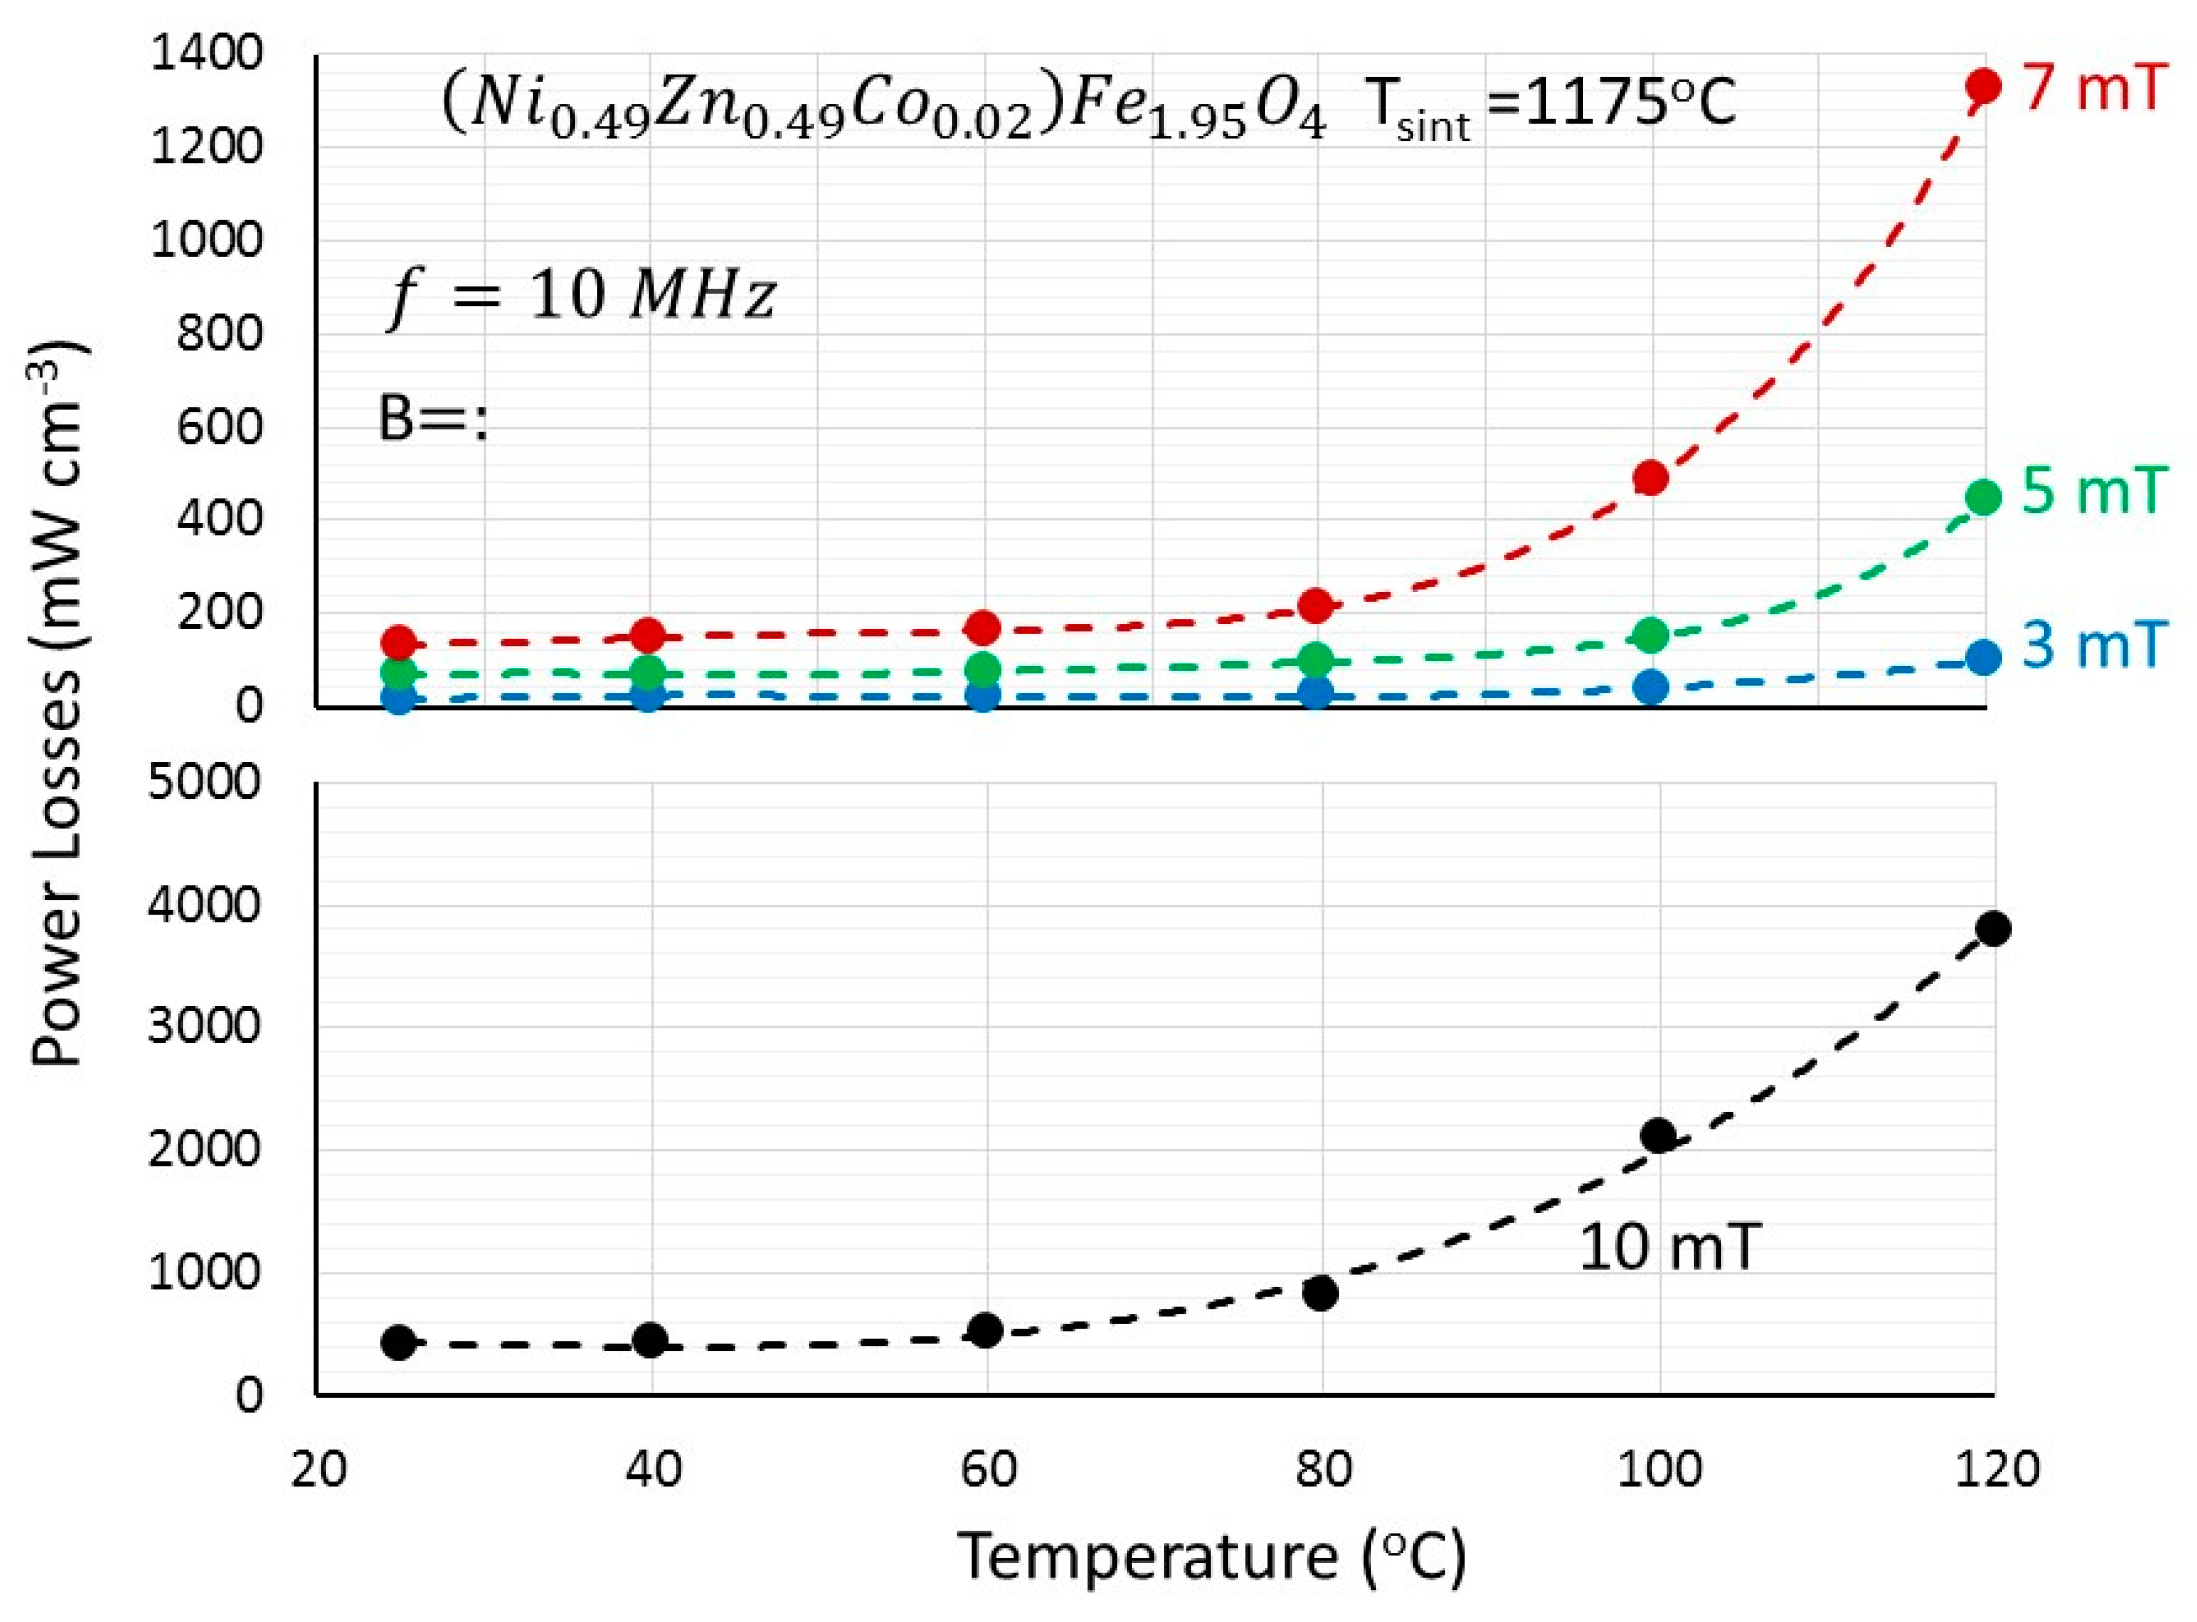
Figure 7.
Final sintered densities as a function of cobalt content for group B specimens sintered at 1150 and 1175°C.
Figure 7.
Final sintered densities as a function of cobalt content for group B specimens sintered at 1150 and 1175°C.
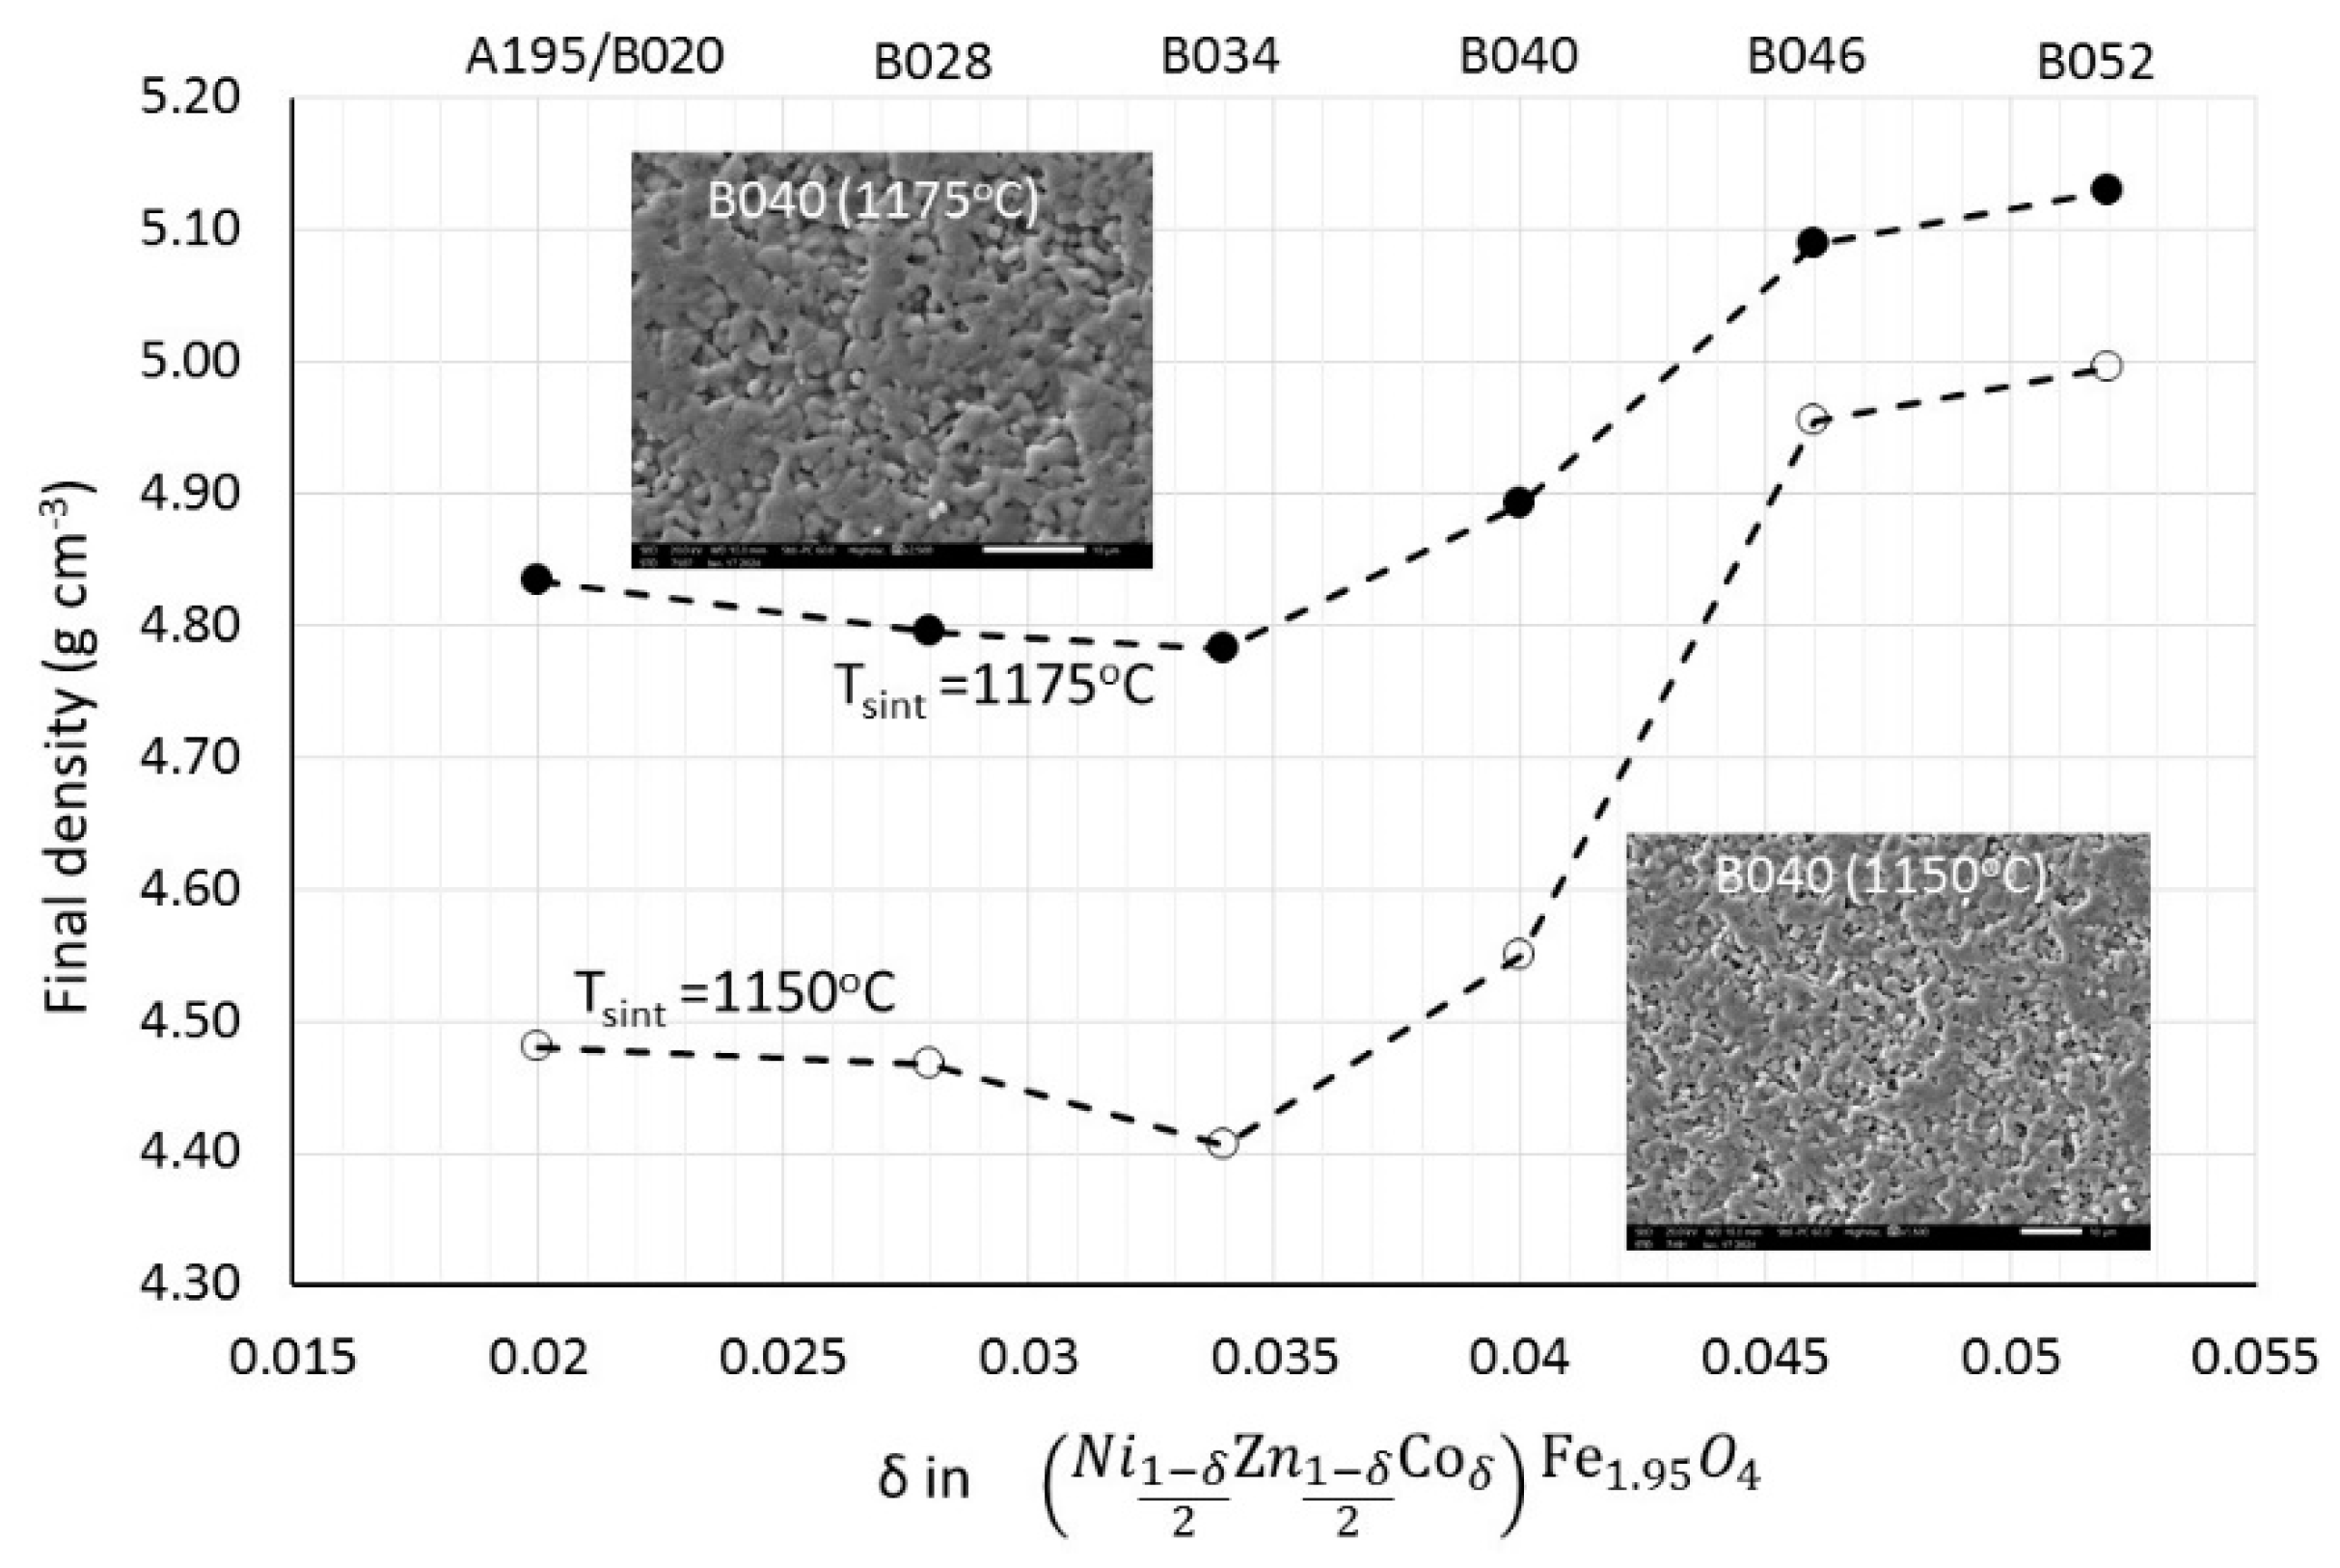
Figure 8.
Power losses measured at 10 MHz as a function of temperature for specimens with varying cobalt content: (a) at 10 mT, (b) at 3 mT.
Figure 8.
Power losses measured at 10 MHz as a function of temperature for specimens with varying cobalt content: (a) at 10 mT, (b) at 3 mT.
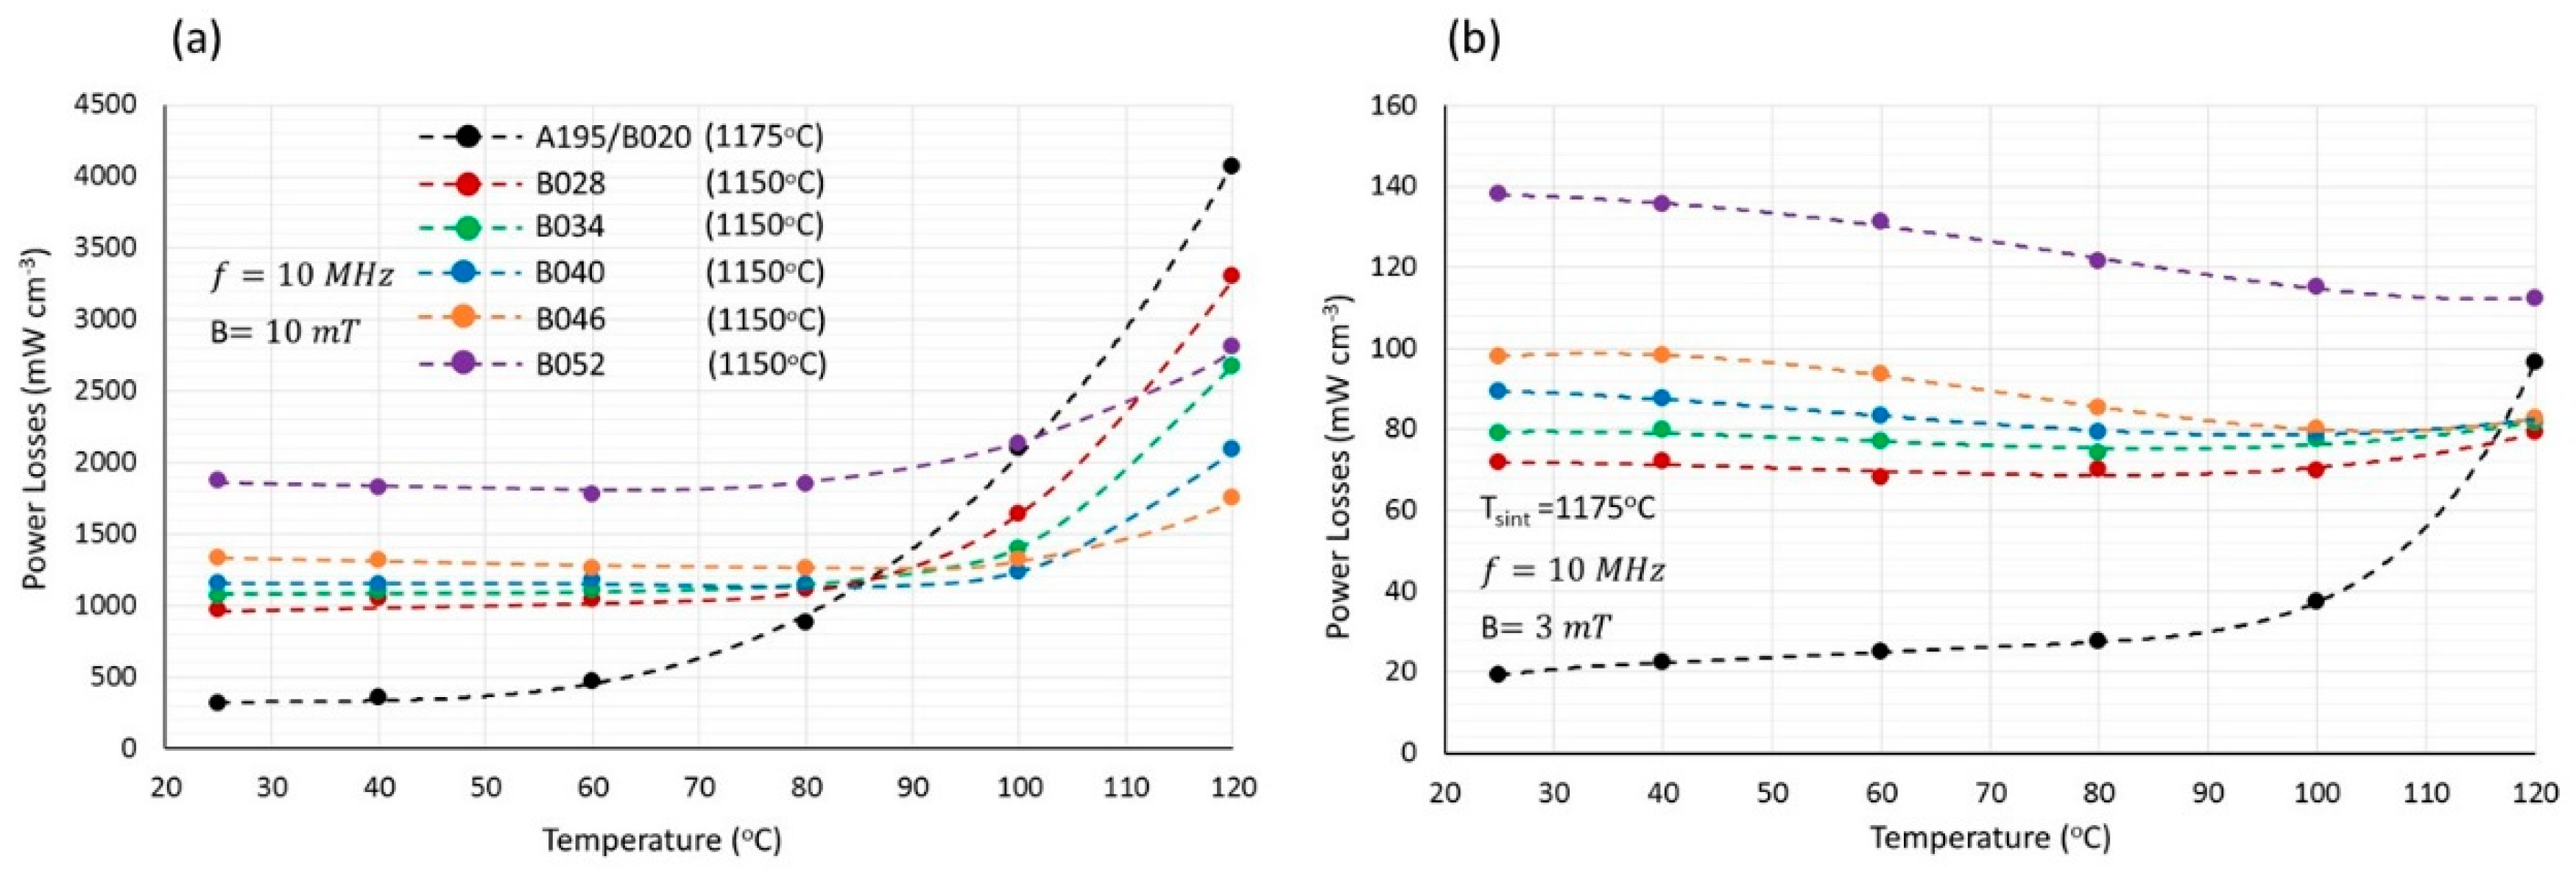
Figure 9.
(a) Initial permeabilities and (b) saturation flux densities as a function of temperature for varying cobalt contents.
Figure 9.
(a) Initial permeabilities and (b) saturation flux densities as a function of temperature for varying cobalt contents.
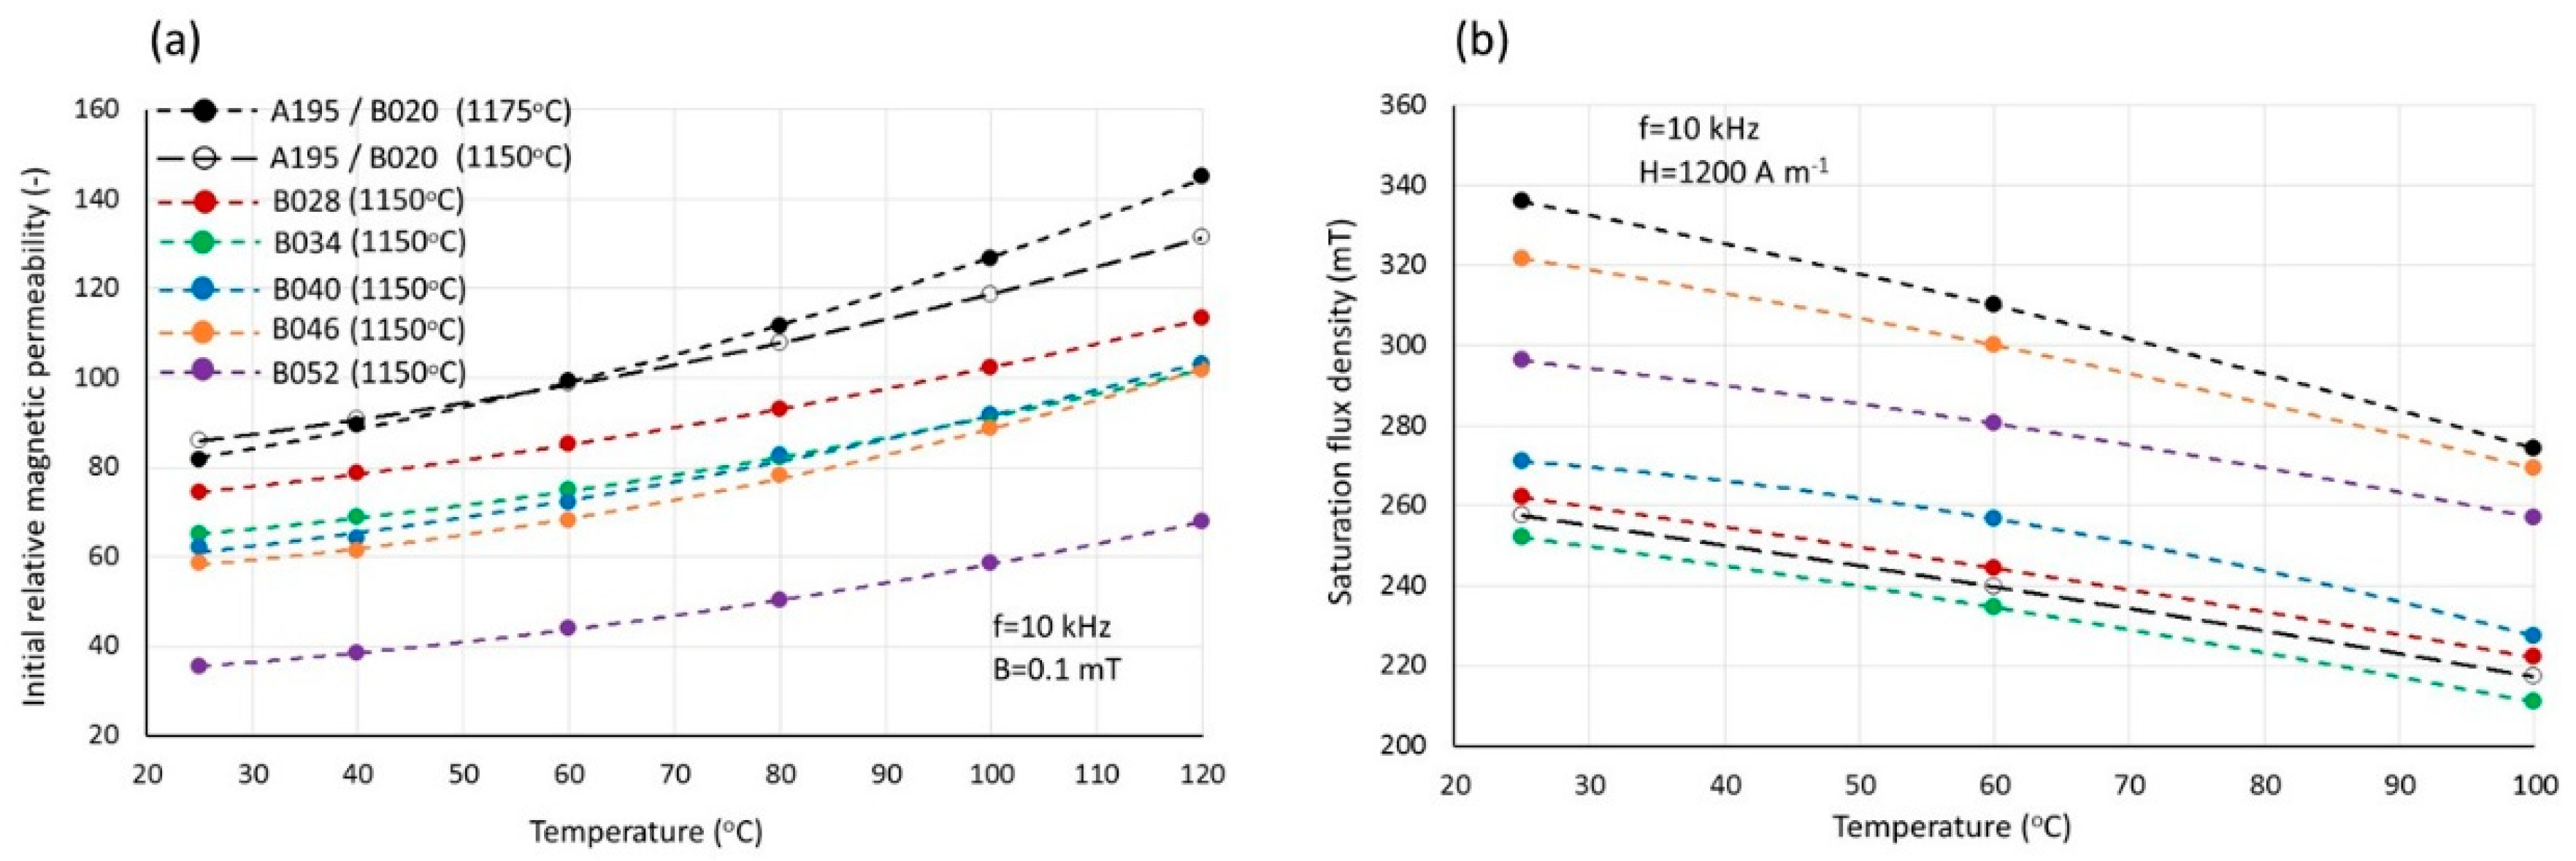
Figure 10.
Final sintered densities as a function of the Ni/Zn molar ratio for group C specimens sintered at 1150°C and 1175°C.
Figure 10.
Final sintered densities as a function of the Ni/Zn molar ratio for group C specimens sintered at 1150°C and 1175°C.
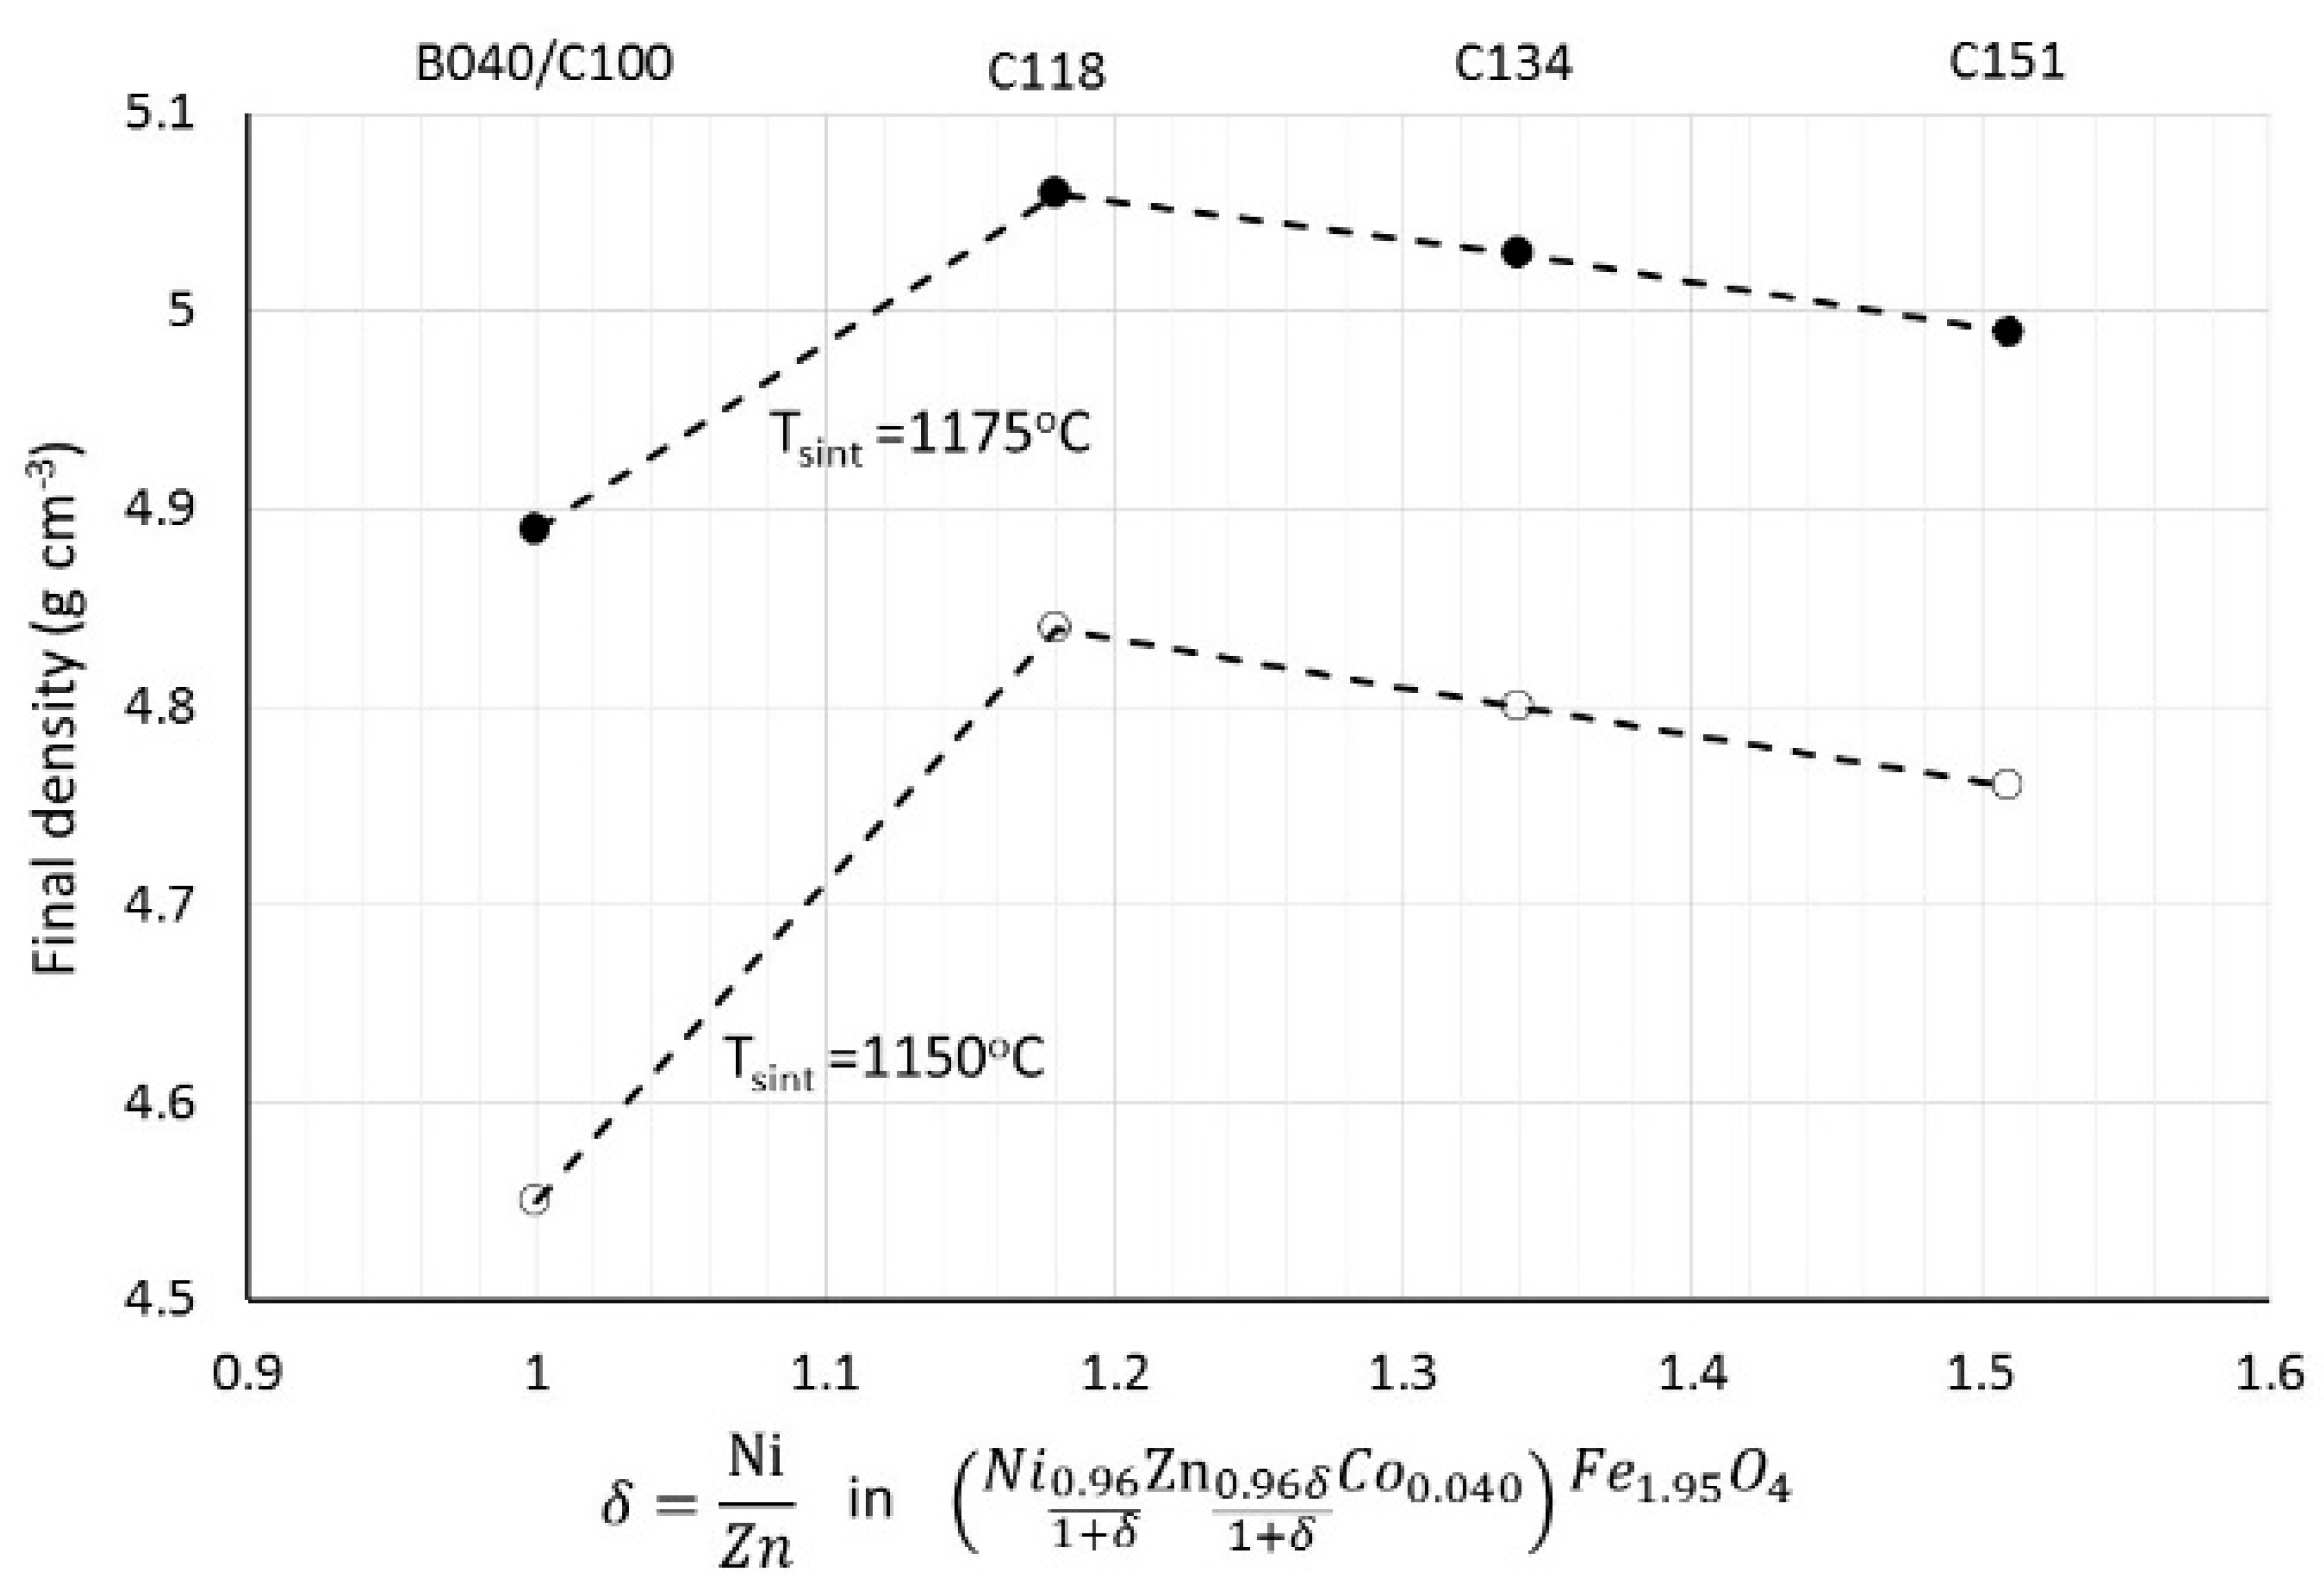
Figure 11.
Power losses measured at 10 MHz as a function of temperature for specimens with varying Ni/Zn molar ratios: (a) at 10 mT, (b) at 3 mT.
Figure 11.
Power losses measured at 10 MHz as a function of temperature for specimens with varying Ni/Zn molar ratios: (a) at 10 mT, (b) at 3 mT.
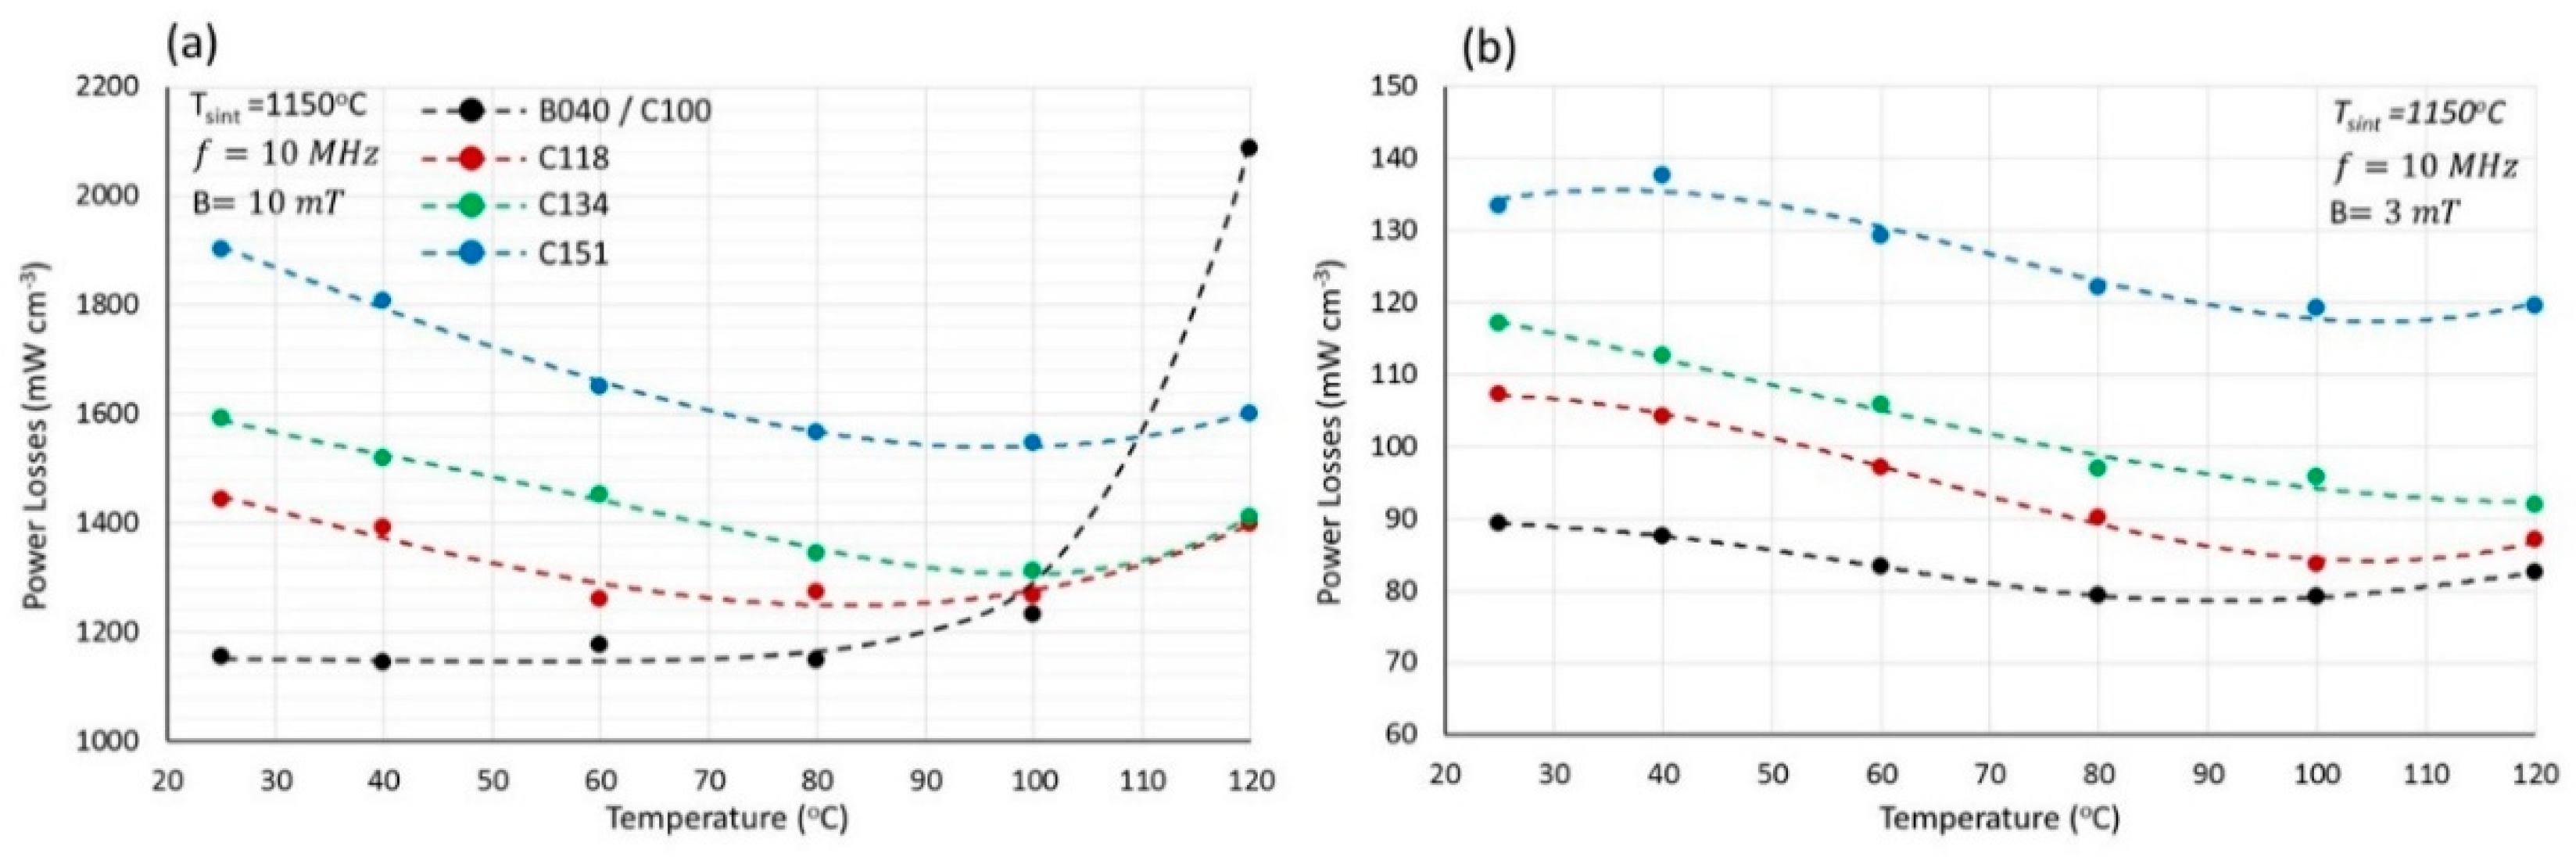
Figure 12.
(a) Initial magnetic permeabilities and (b) saturation flux densities as a function of temperature for varying Ni/Zn molar ratios.
Figure 12.
(a) Initial magnetic permeabilities and (b) saturation flux densities as a function of temperature for varying Ni/Zn molar ratios.
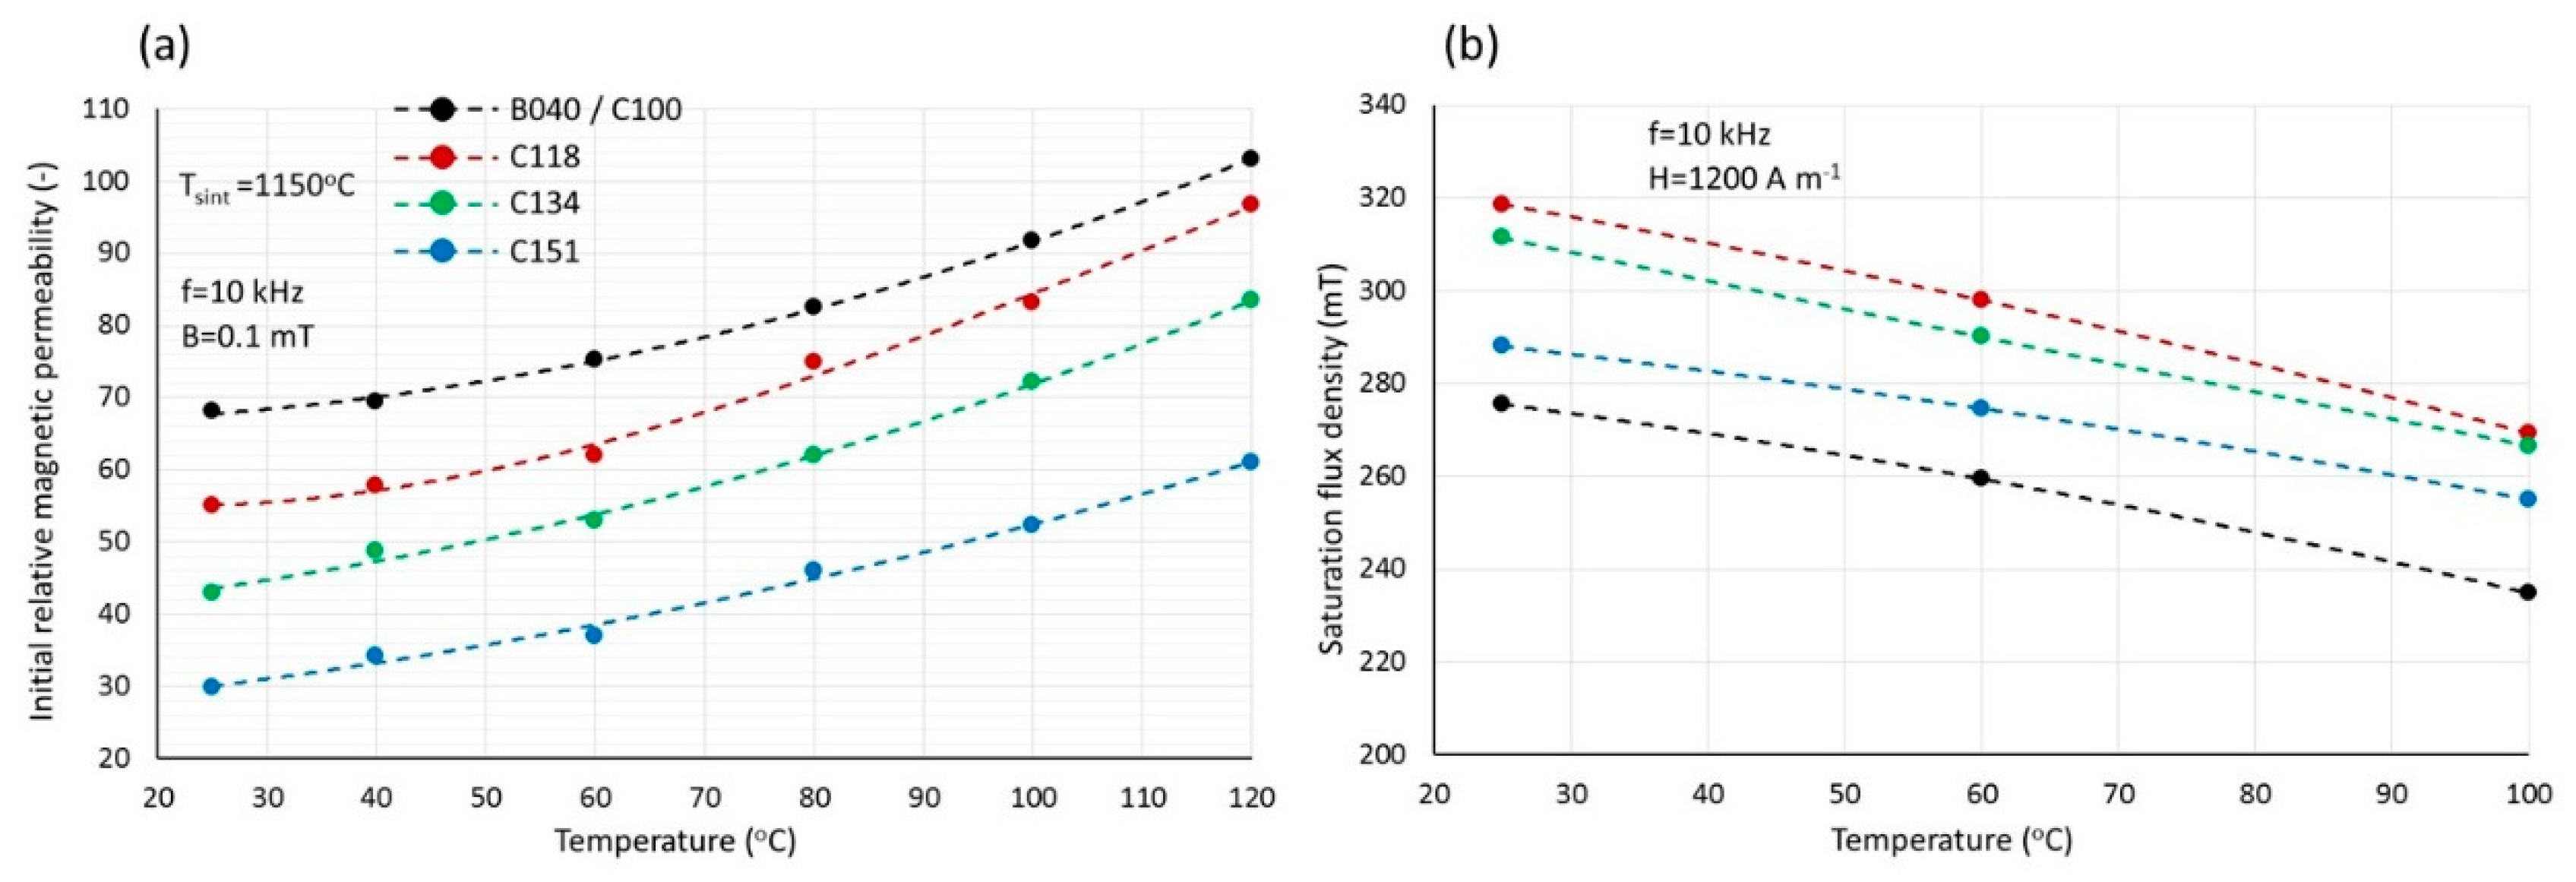
Figure 13.
Power losses per cycle as a function of frequency for samples A915, measured at three temperatures specified in the Figure.
Figure 13.
Power losses per cycle as a function of frequency for samples A915, measured at three temperatures specified in the Figure.
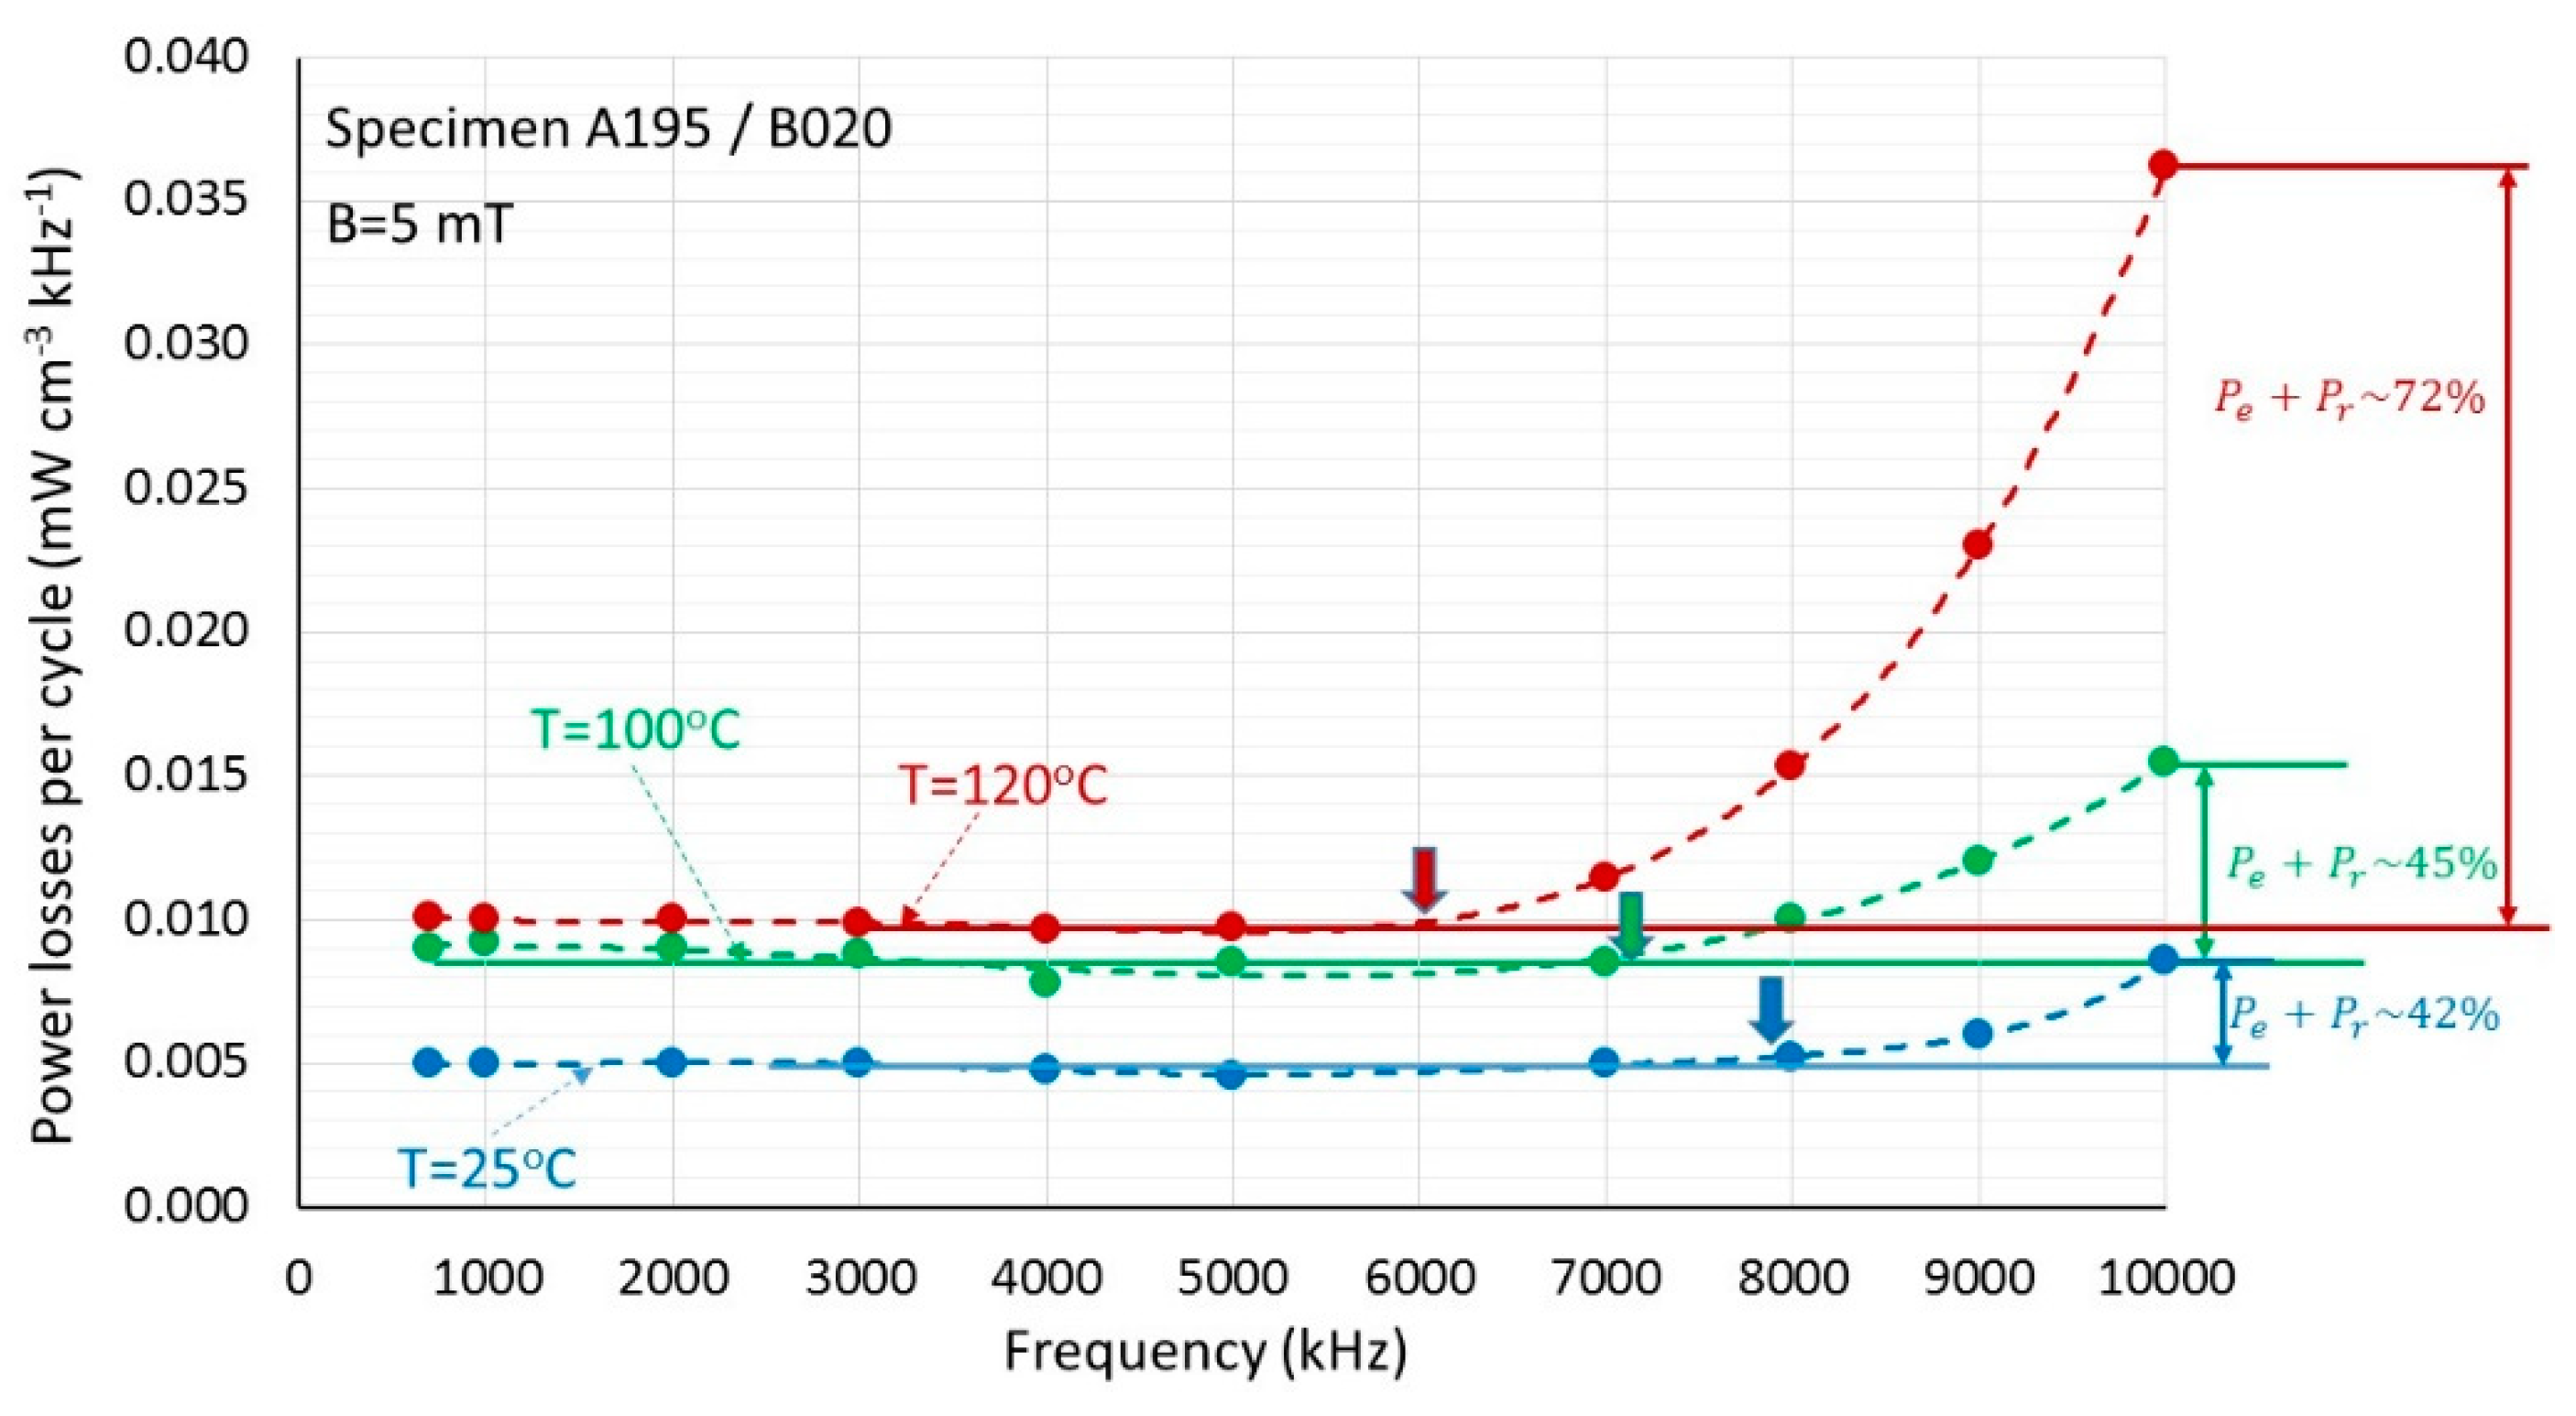
Figure 14.
Real and imaginary components of the complex permeability for group B samples with varying cobalt content, plotted against frequency.
Figure 14.
Real and imaginary components of the complex permeability for group B samples with varying cobalt content, plotted against frequency.
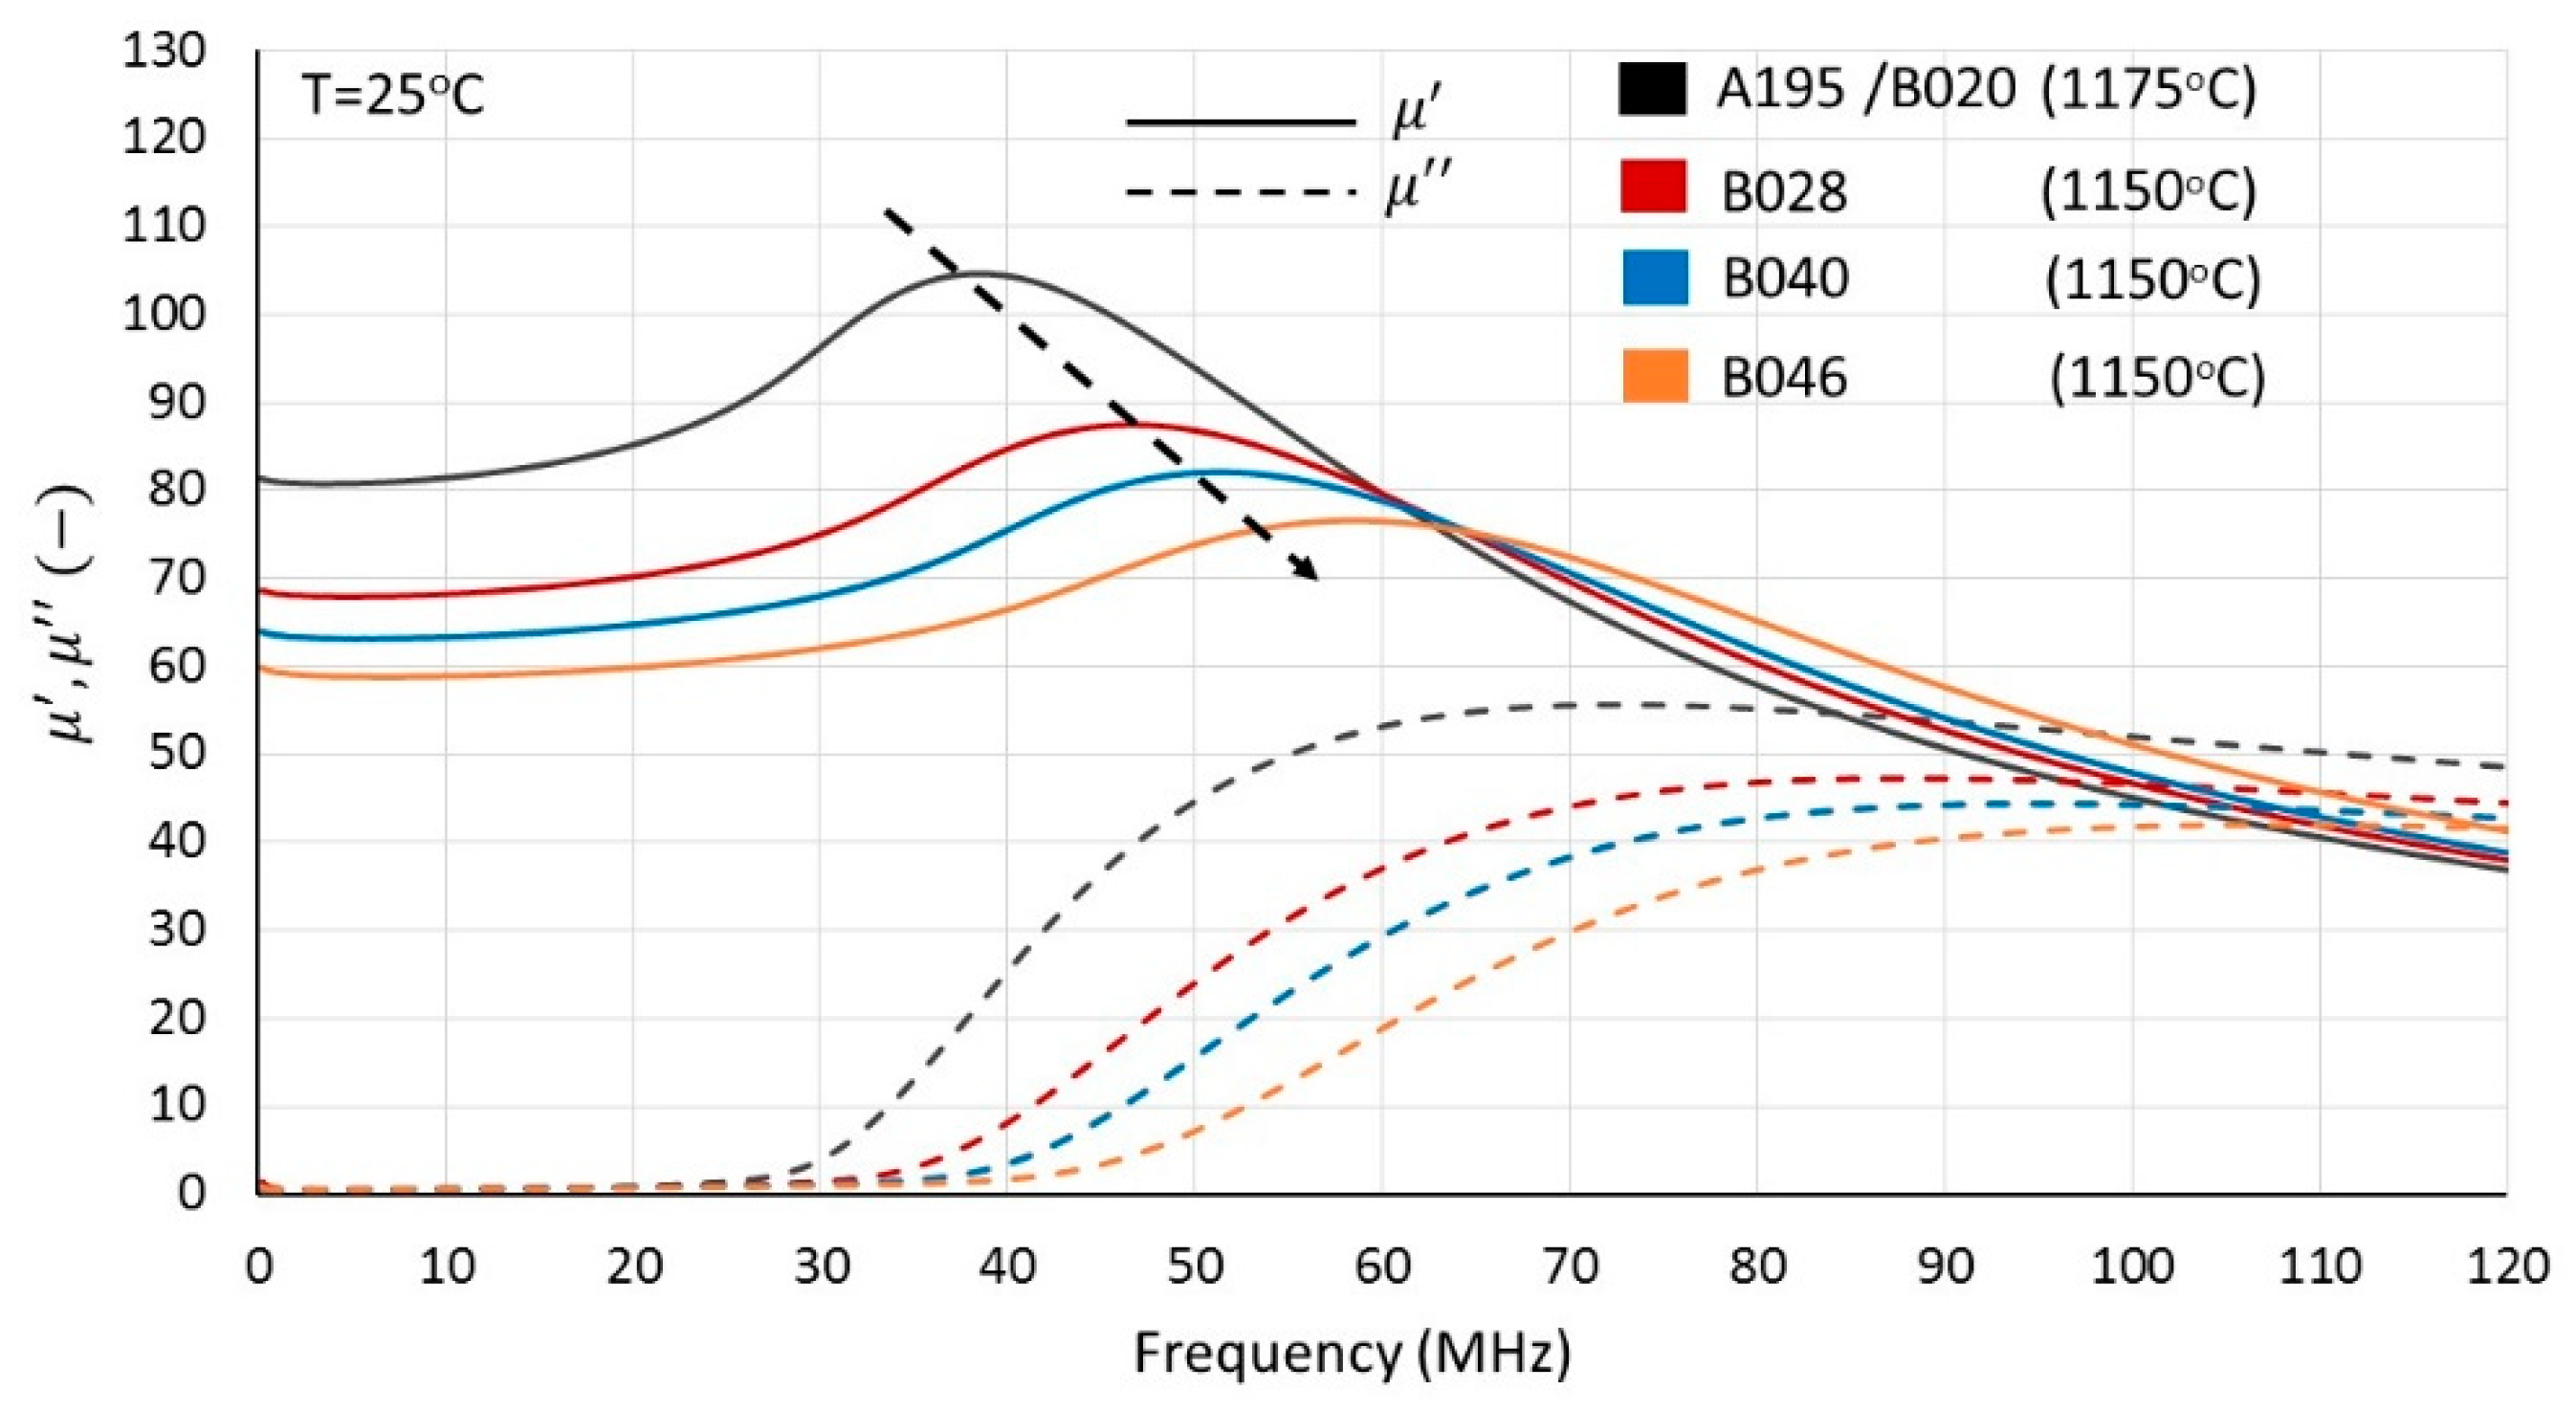
Figure 15.
Measured power losses of synthesis B046 samples at 10 MHz and 10 mT as a function of temperature, sintered at two distinct temperatures. Inset: Corresponding magnetic permeabilities as a function of frequency.
Figure 15.
Measured power losses of synthesis B046 samples at 10 MHz and 10 mT as a function of temperature, sintered at two distinct temperatures. Inset: Corresponding magnetic permeabilities as a function of frequency.
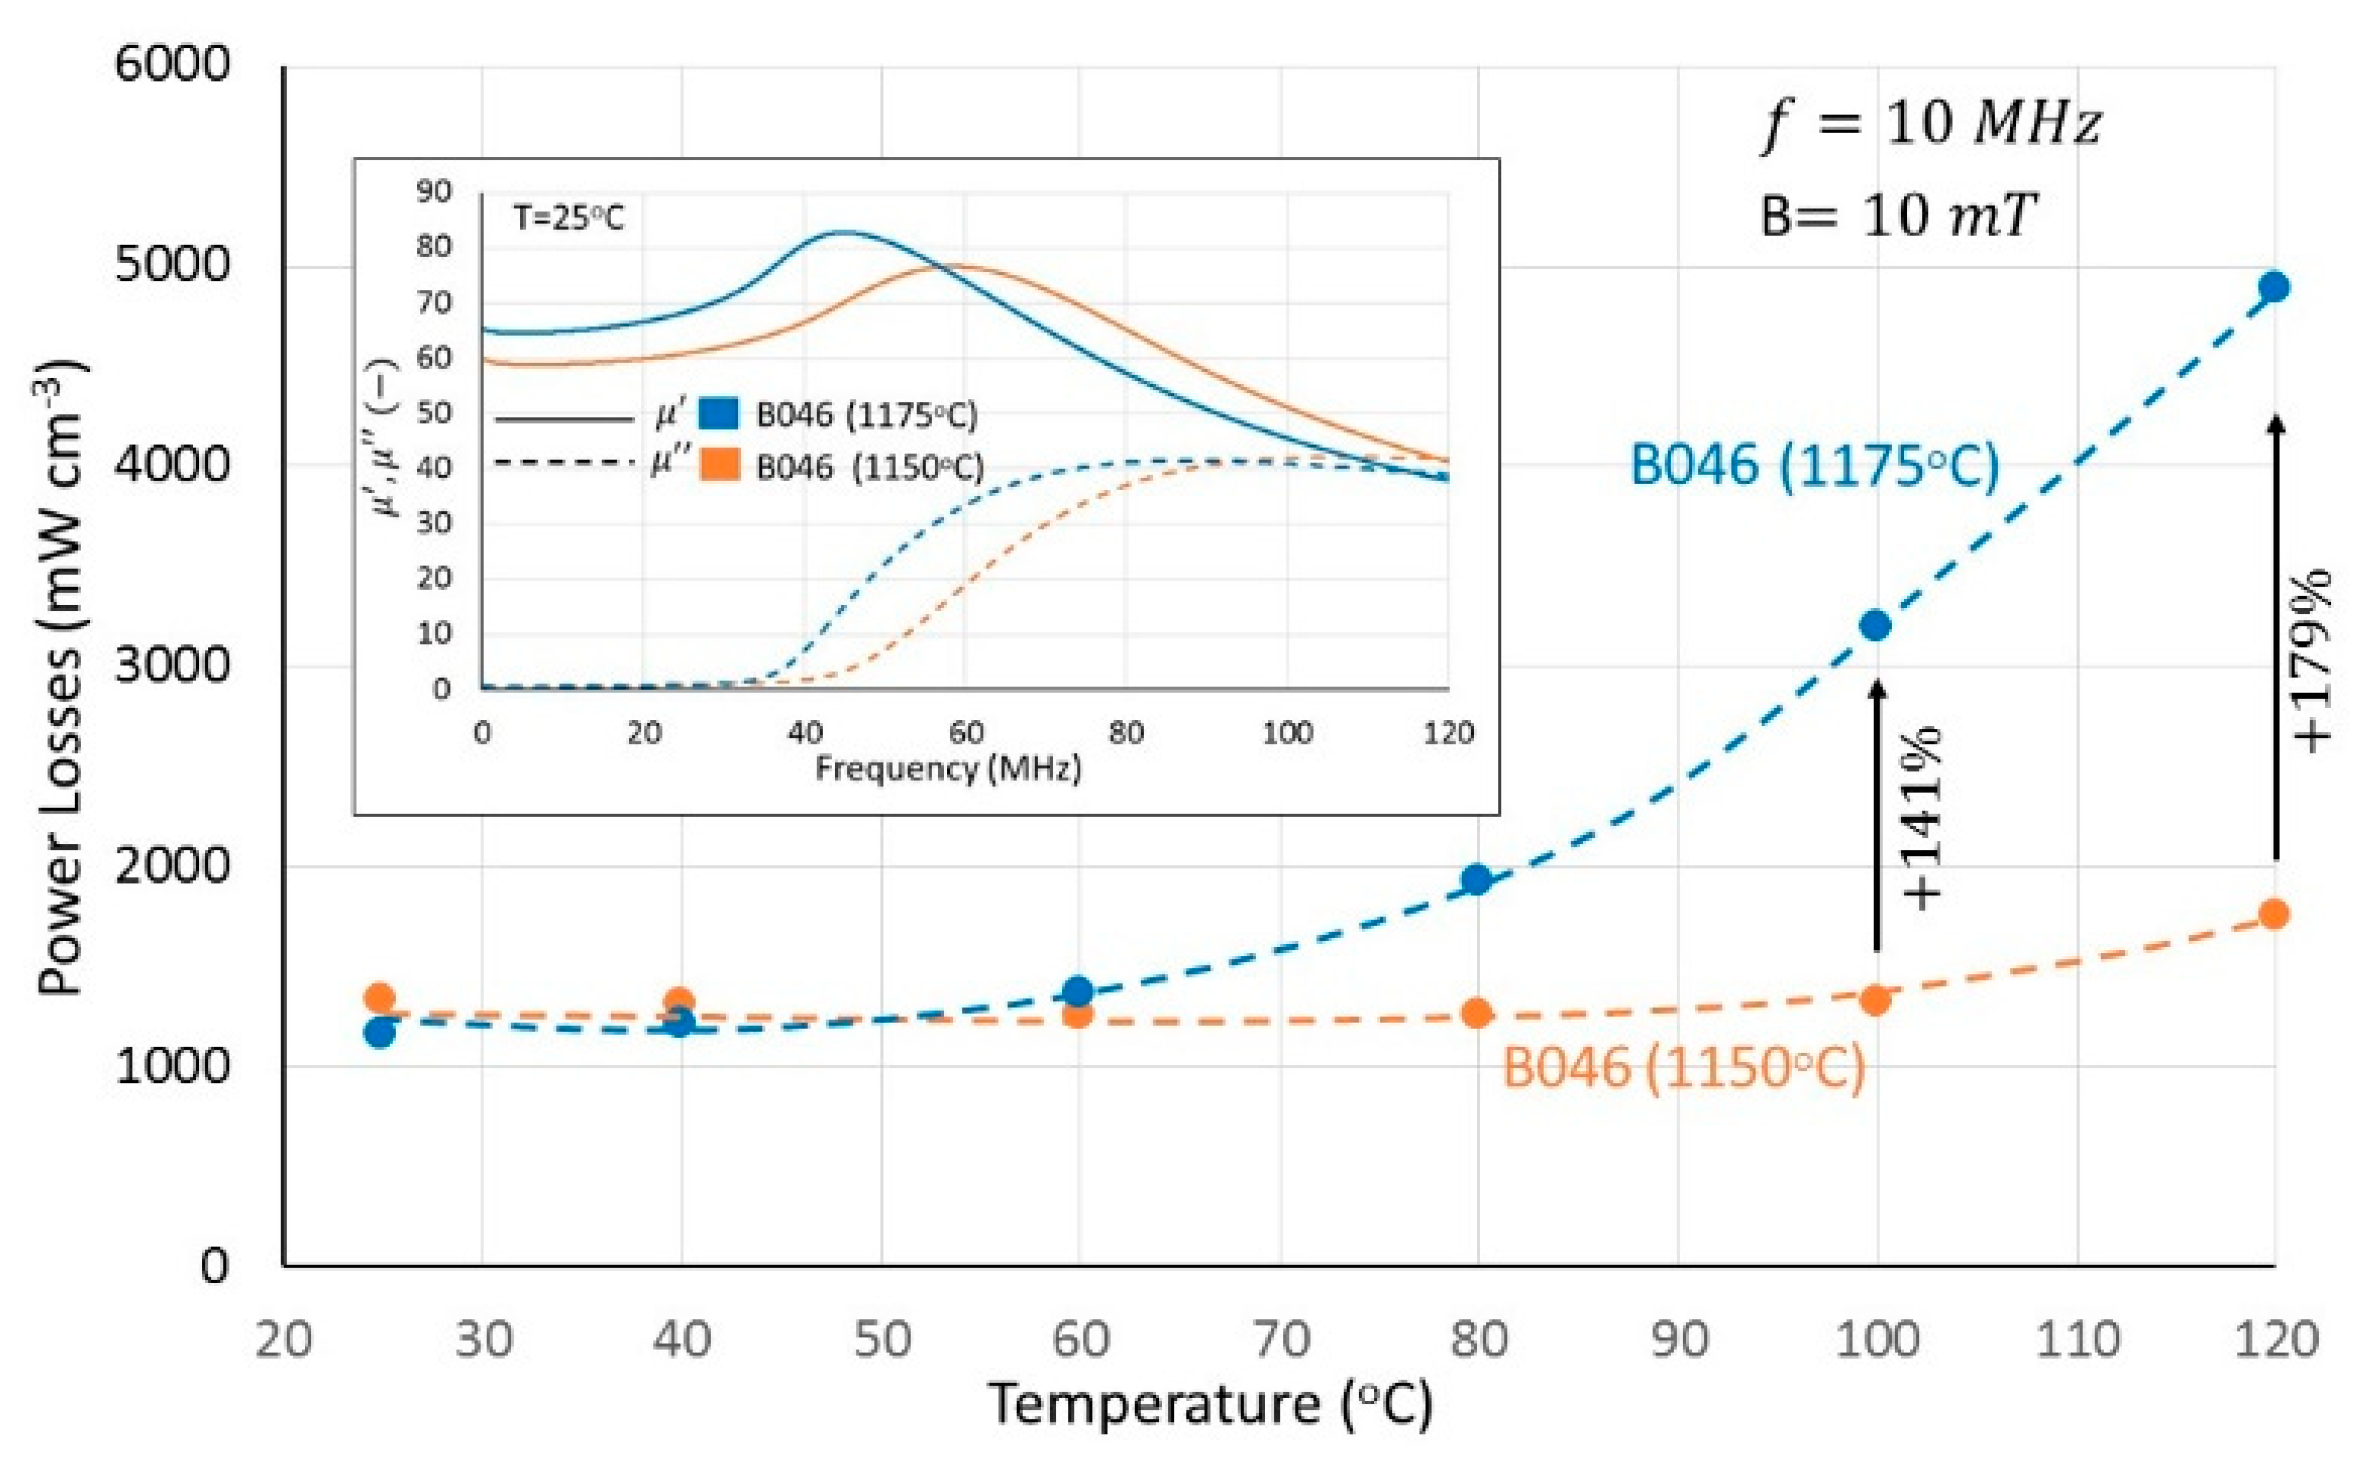

Table 1.
Code names and chemical compositions of prepared NiZn ferrites.
| Atoms per unit cell | ||||
| Code name | Ni/Zn molar ratio | Co | Fe | Chemical formula |
| A191 | 1 | 0.02 | 1.91 | |
| A192 | 1 | 0.02 | 1.92 | |
| A194 | 1 | 0.02 | 1.94 | |
| A195/B020 | 1 | 0.02 | 1.95 | |
| A196 | 1 | 0.02 | 1.96 | |
| A198 | 1 | 0.02 | 1.98 | |
| B028 | 1 | 0.028 | 1.95 | |
| B034 | 1 | 0.034 | 1.95 | |
| B040/C100 | 1 | 0.040 | 1.95 | |
| B046 | 1 | 0.046 | 1.95 | |
| B052 | 1 | 0.052 | 1.95 | |
| C118 | 1.18 | 0.040 | 1.95 | |
| C134 | 1.34 | 0.040 | 1.95 | |
| C151 | 1.51 | 0.040 | 1.95 | |
Disclaimer/Publisher’s Note: The statements, opinions and data contained in all publications are solely those of the individual author(s) and contributor(s) and not of MDPI and/or the editor(s). MDPI and/or the editor(s) disclaim responsibility for any injury to people or property resulting from any ideas, methods, instructions or products referred to in the content. |
© 2025 by the authors. Licensee MDPI, Basel, Switzerland. This article is an open access article distributed under the terms and conditions of the Creative Commons Attribution (CC BY) license (http://creativecommons.org/licenses/by/4.0/).
Copyright: This open access article is published under a Creative Commons CC BY 4.0 license, which permit the free download, distribution, and reuse, provided that the author and preprint are cited in any reuse.


