
Submitted:
20 March 2024
Posted:
21 March 2024
You are already at the latest version
Abstract
Balsam fir trees are a specialty agricultural species that are largely used as Christmas trees. Soil or tissue sampling is seldom performed to assess balsam fir nutrition needs, which can contribute to over or under fertilization and subsequent environmental challenges. Remote sensing to determine the normalized difference vegetation index (NDVI) has had strong relationships with nutrition in other plants. This research aimed to determine whether there is a relationship between NDVI and nutrition in balsam fir. A random sample of 45 trees was selected in autumn of 2021 and then another 70 trees selected in spring of 2022. Soil and needle tissue samples were analyzed for N, P, K, Ca, Mg, S, Fe, Zn, Mn, B, and Cu. An uncrewed aerial vehicle equipped with a multispectral camera was flown over the orchard to determine the NDVI for each tree. Nutrition and NDVI were analyzed for correlations through all sampled trees. Separate correlation analyses were repeated for mature trees (greater than 5 years old) and young trees (less than 5 years old). Soil nutrients N, P, K had a significant relationship with NDVI in autumn sampling. Only N was correlated consistently in both autumn and spring, with R2 of 37% and 33% respectively. Relationships were much stronger when only mature trees were considered, increasing to 60% and 51% respectively. NDVI was found to offer predictive power for tissue N that can be useful to producers to help optimize fertilizer input. However, further work is needed to refine these relationships.
Keywords:
Agriculture
; conifer
; forestry
; NDVI
; normalized difference
; nitrogen
; precision agriculture
; remote sensing
; site specific
; UAV
1. Introduction
Balsam fir (Abies balsamea) is a mid- to -late successional species that is adapted to cooler climates [1,2]. Balsam fir trees tend to experience optimum growth in regions with an average temperature of 2 – 4°C, though they can tolerate temperatures lower than 40°C [2,3]. As such, balsam fir trees are easily found in most of Canada and northeastern Unites States [3]. Balsam fir may be harvested for lumber or fuel, but they also occupy a horticultural niche as Christmas trees.
The Christmas tree industry has been growing steadily in Canada over the past decade [4]. Christmas tree farm receipts were $52 million CAD in 2012 but had increased by 244% by 2022 [4]. Balsam fir is the most popular Christmas tree produced in Canada, with some spruce, pine, and other fir species produced in minor quantities [5]. Originally, Christmas trees were harvested from natural forest stands with little to no management strategy from producers [6]. However, now over 95% of Christmas trees are grown on plantations and must be managed more heavily to produce a tree with desirable characteristics [6]. Key commercial attributes for balsam fir Christmas trees include shape, foliage density, needle retention, foliage color, and scent [5].
Christmas tree fertilization is necessary to maintain many commercially desirable characteristics. Nitrogen is the nutrient most likely to be lacking for Christmas tree growth and color development [7,8]. Needle nitrogen concentrations of between 1.4% and 1.6% are adequate for growth, though higher concentrations are beneficial for color and needle retention [7,9,10]. Christmas tree fertilization regimes vary considerably between producers. Fertilization may happen once every other year, once per year, twice per year, or not at all [11,12,13]. The most common time of year to apply fertilizer is in spring, typically between March and May, dependent on species and climate [12] . If a second application of fertilizer is incorporated, then it would typically be applied closer to harvest to ensure better foliage color [12,13]. Traditionally, fertilizers are applied to soils under the tree drip line by hand, though motorized and aerial application may also be used depending on the size of the field [7].
There are many challenges facing the environmental sustainability of Christmas tree fertilization. First, Christmas trees only utilize 21% of applied nitrogen with another 30% remaining in the soil. The remaining 49% is lost primarily through leaching and denitrification, with each posing significant environmental risks [7]. Second, fertilizer is applied at rates much higher than other agricultural products. For comparison, Christmas trees may receive 200 kg N ha-1 yr-1 mid-rotation [14] versus an average of 145 kg N ha-1 yr-1 for corn [15]. Christmas trees may have almost 600 kg N ha-1 yr-1 during a harvest year [14]. Third, soil nutrient analysis is of limited value because the relationship between soil nutrition and desirable Christmas tree characteristics has not been well developed for balsam fir [16]. Foliar nutrition provides a more direct indication of tree nutritional status where soil nutrition provides information on its capacity to supply nutrition [16,17]. Needle tissue should be sampled to ensure nutrient concentrations remain within an acceptable range because some changes due to fertilization may not be observed until the following season [7]. Finally, nutrient concentration in both soil and plant tissue are highly variable by sampling location and season [9]. An improved method of identifying balsam fir nutrient requirements is needed.
Remote sensing is the process of obtaining information about objects using specific wavelengths of electromagnetic radiation and has exhibited considerable potential in the quantitative determination of plant nutrition [18]. Several different indices have been developed to estimate nutrition, often using a combination of visible and near infra-red wavelengths [19]. A variety of passive sensors are available, such as multispectral, hyperspectral, or thermal which can be used to detect energy emitted or reflected from vegetation [20,21]. Remote sensing to evaluate plant nutrition offers several advantages over other methods, such as ease of use, decreased time for analysis, non-destructive sampling, the ability to analyze large areas, and working in tandem with other precision agriculture technologies (e.g. variable rate application) [22,23].
Predictions of tree level nutrient deficiencies are most accurate using an uncrewed aerial vehicle (UAV) [20]. The use of other remote sensing techniques such as light detection and ranging (LiDAR) or photogrammetric point clouds show considerable promise over large areas [24], but UAVs provide superior resolution to make inference for individual trees [25]. Hyperspectral UAV data has been a moderate to strong predictor for tissue N in many tree species. The coefficient of determination (R2) for regression relationships in broad leafed trees was 0.8 – 0.9 [26,27,28]. The R2 was weaker in mixed forests, with values often between 0.6 – 0.8 [29,30]. One study reported an even weaker relationship in mixed forests where R2 = 0.53 [31]. Overall, there is evidence that remote sensing has some predictive power when conifers are included, though remote sensing is more effective on deciduous trees. Intensively managed, single species forests are likely the best candidates for using remote sensing to detect nutrient deficiencies [20], providing further support for its use in Christmas tree plantations.
There are over one hundred different indices that can be created from multispectral data [32]. Perhaps the most popular is the normalized difference vegetation index (NDVI) because of its ability to quickly identify vegetative stress [33]. NDVI was proposed decades ago using near-infrared and red radiation [34], which has since been used to remotely assess plant characteristics such as chlorophyll concentration [35], productivity [36], or stress [37]. NDVI has been useful to identify nutrient deficiency in other species [38,39,40]. It’s also been noted that the effectiveness of NDVI can be dependent on the developmental stage of a plant [38]. The use of NDVI as a predictor for nutrition has not been reported in balsam fir but could be a useful tool for producers to effectively ascertain individual tree fertilizer needs, thus decreasing cost and environmental impact.
The purpose of this study was to evaluate whether NDVI could accurately detect differences in balsam fir nutrient status. It was hypothesized that NDVI would be related to foliar nutritional status. Based on observation by Burns et al. [38], it was also hypothesized that the relationship between NDVI and nutrition would be stronger in mature trees as opposed to younger trees. If the hypothesis is correct, then a predictive model for foliar nitrogen could be developed from multispectral data.
2. Results
2.1. Soil and Tissue Nutrition
The two sites surveyed in autumn 2021 had significantly different soil nutrient profiles. Site 1 had significantly higher soil concentrations of N, K, and Zn while Site 2 had significantly higher concentrations of P, Cu, and Mn (Table 1). There were no significant differences between the other six measured minerals (i.e. Ca, Mg, Na, S, Al, and Fe). Soil nutrition profiles had similar trends in Spring 2022 with respect to Site 1 and Site 2. Site 2 generally had comparable nutrient concentrations to Site 3 with the exception that Site 2 had significantly more K and less Cu than Site 1 (Table 2). Differences in soil nutrition between sites were expected, since the site in Site 1 is an actively managed commercial lot while Sites 2 and 3 are research sites with limited soil management.
Site 1 and 2 had significant differences in needle tissue profiles in autumn 2021. Site 1 had significantly higher needle tissue concentrations of N, while Site 2 had significantly higher concentrations of Ca and Mn (Table 3). There were no significant differences between all other measured minerals (i.e. P, K, Mg, Na, B, Fe, and Zn). Site 1 had significantly higher needle concentration of N in Spring 2022, but lower K, Ca, and Mn. Site 1 had lower Fe than Site 2 but higher Fe than Site 3. As above, it was expected that Site 1 would have higher N due to repeated fertilizer application at that site compared to Site 2 and 3. It was expected that P would also be significantly higher at Site 1, but the soil concentration of P was only 2 times as high as Site 2 and 3 while the concentration of N was 10 times higher.
The concentration of soil nutrients and needle tissue nutrients were not significantly related in most cases, except for N and Mn. Both N and Mn had significant (P < 0.01) positive relationships between soil and needle tissues (Figure 1). Soil N accounted for 23% of variation in tissue N and soil Mn accounted for 61% of variation in tissue N. It must be noted that the R2 value for Mn was inflated slightly due to the presence of 2 influential points at approximately 100 ppm and 150 ppm in soil. However, the relationship remains statistically significant even without these two points.
2.2. NDVI and Nutrition
The average NDVI for balsam trees was about 0.65 and ranged from approximately 0.50 to 0.80. However, the 95% confidence interval was 0.692 ± 0.011 in autumn and 0.684 ± 0.010 in spring. There was very low variability in balsam fir NDVI in general.
There were only weak correlations between soil nutrition and overall NDVI (Table 5). However, there were some significant correlations after younger trees were separated from older trees in the analysis. In both autumn and spring, NDVI of trees < 5 years old was positively correlated with Na and Mn (Table 5). NDVI was also negatively correlated with autumn S and spring K in trees > 5 years old (Table 5).
There were several significant correlations between foliar nutrition and overall NDVI (Table 6). N, P, K were all positively correlated with NDVI in autumn (Table 6). However, these correlations were all stronger in trees > 5 years old. Of those three nutrients, only N and P were correlated with NDVI in both autumn and spring. N was of particular interest because the coefficient of determination (R2) was relatively high in younger trees, with NDVI explaining approximately 60% and 50% of variability in tissue N of trees in autumn and spring, respectively.
There are many studies detailing remote sensing metrics in annual crops, including NDVI. However, it has been notably more difficult to determine relationships between spectral and growth characteristics in tree species [41]. Among other issues, trees crops are in production for many years such that tree age could be an important factor. Age has a significant effect on vegetation indices due to the changes in canopy coverage, soil effects, physiology, and other factors [42,43]. Age appears to be a major factor in NDVI is balsam fir as well, where NDVI is a better indicator of foliar nutrition in trees older than 5 years.
Figure 2.
Relationships between NDVI and tissue nutrition in autumn for (a) Balsam fir of any age (N = 45); (b) Balsam fir < 5 years old (N = 20); (c) Balsam fir > 5 years old (N = 25).
Figure 2.
Relationships between NDVI and tissue nutrition in autumn for (a) Balsam fir of any age (N = 45); (b) Balsam fir < 5 years old (N = 20); (c) Balsam fir > 5 years old (N = 25).
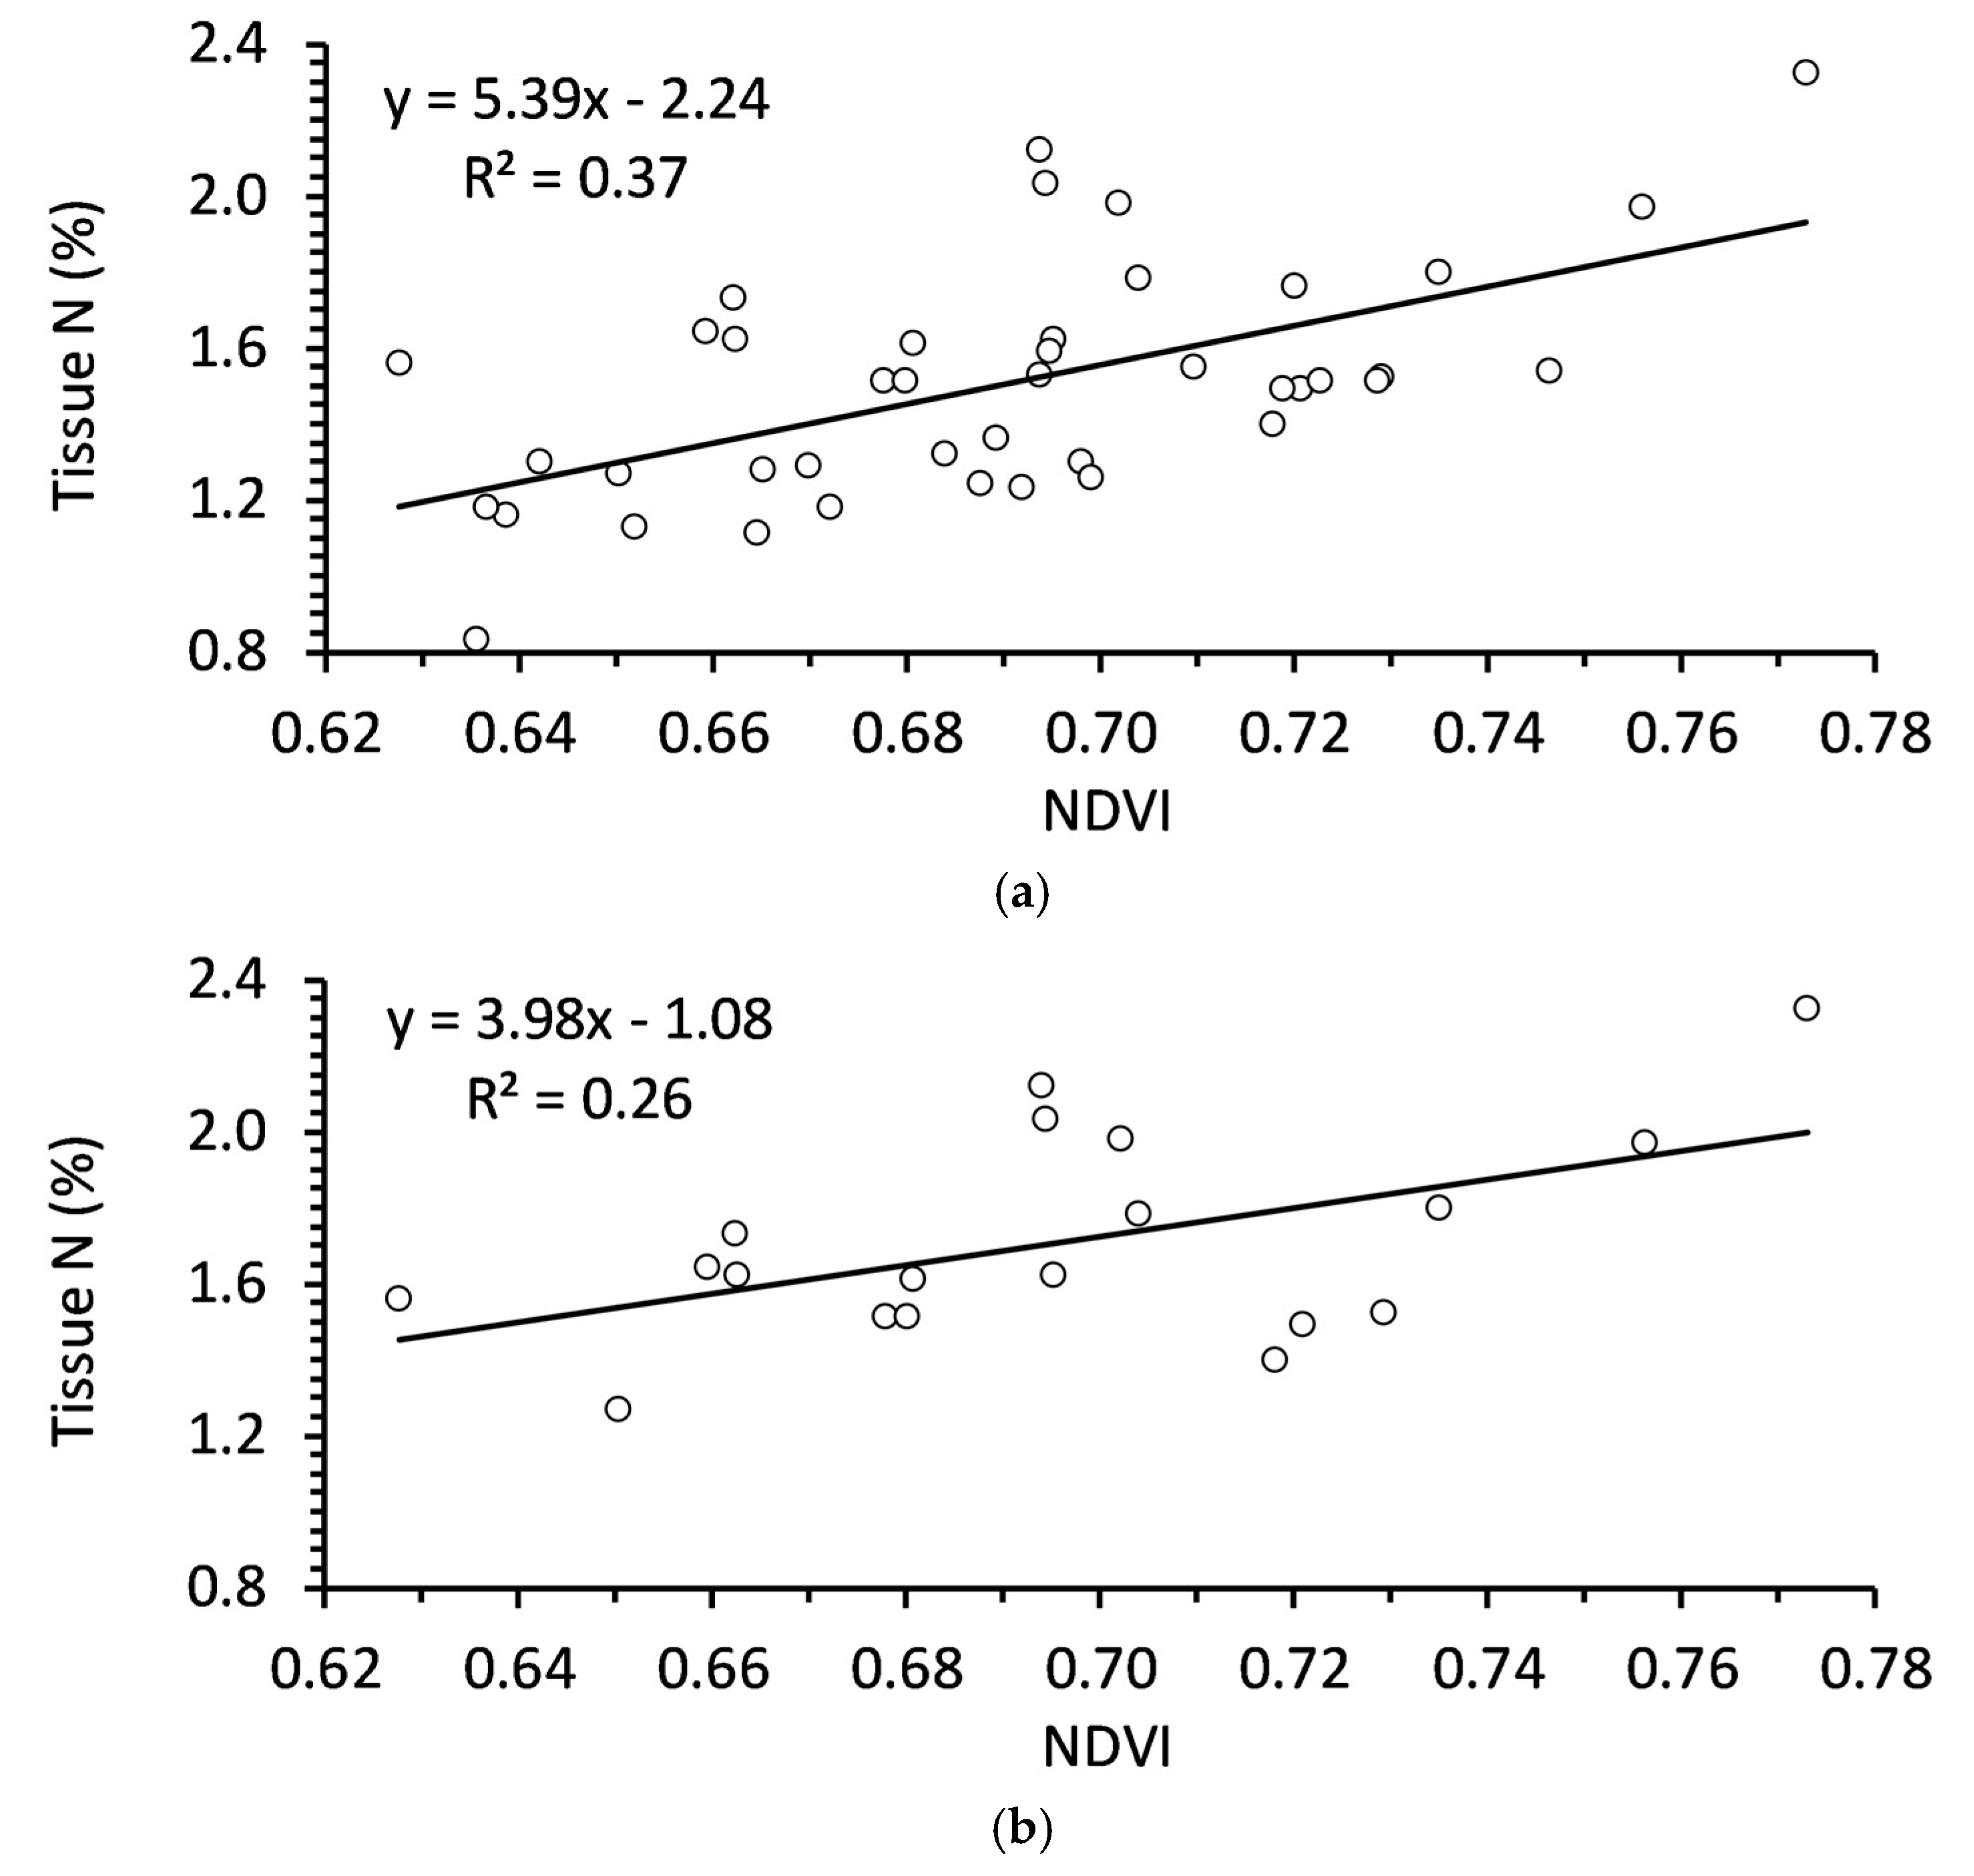
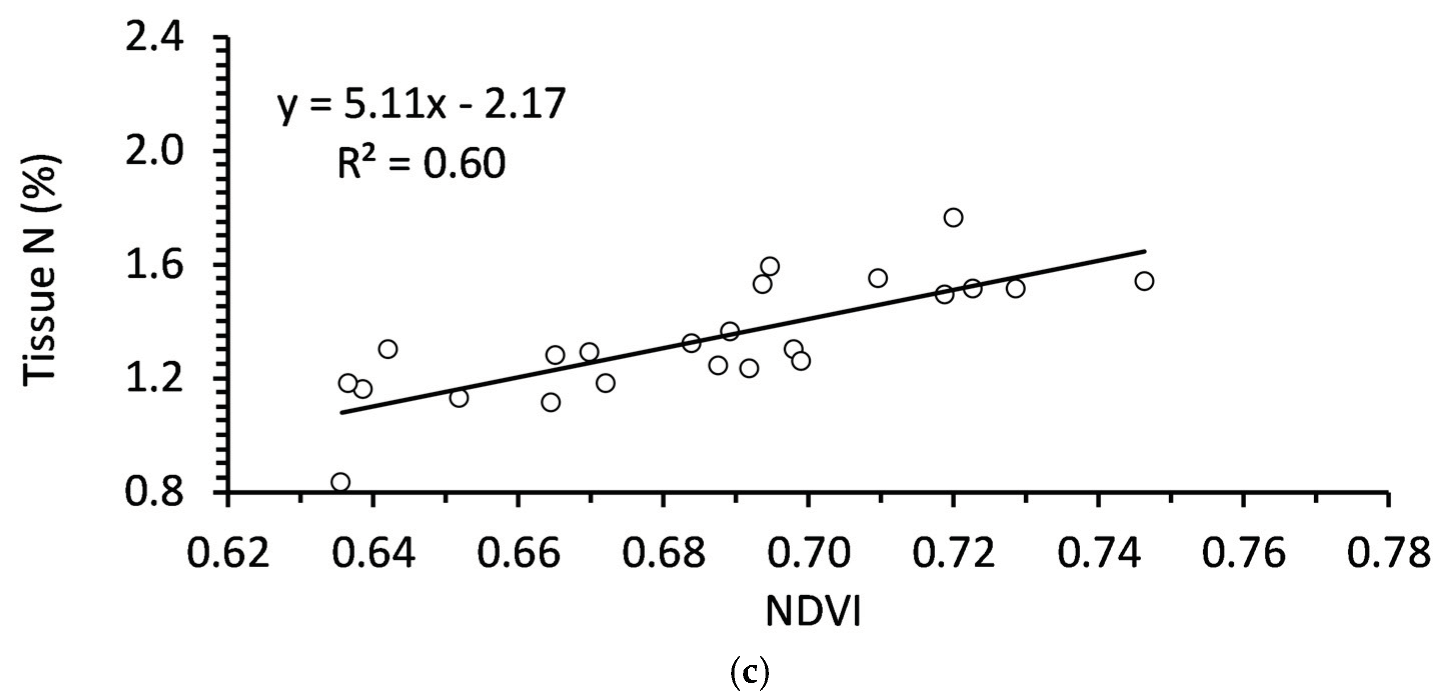
Figure 3.
Relationships between NDVI and tissue nutrition in spring for (a) Balsam fir of any age (N = 70); (b) Balsam fir < 5 years old (N = 25); (c) Balsam fir > 5 years old (N = 45).
Figure 3.
Relationships between NDVI and tissue nutrition in spring for (a) Balsam fir of any age (N = 70); (b) Balsam fir < 5 years old (N = 25); (c) Balsam fir > 5 years old (N = 45).
3. Discussion
The major objective of this research was to determine whether there was a relationship between NDVI and nutrition in balsam fir. Such was rarely the case with respect to soil nutrition. There were no consistent relationships between NDVI and soil N, P, or K, though there were some relationships with other nutrients. For example, both sodium and manganese in soils were significantly correlated with NDVI in younger balsam fir, though the R2 was 25% in even the strongest relationship. Weak (or no) relationships between soil nutrition and NDVI were not unexpected. Although there are some examples of strong relationships between soil nutrition and NDVI, other studies have shown a relationship only over specific nutrient concentration [44,45]. Further, soil analysis only informs us about the nutrient supply, but provides little information about nutrient demand and /or uptake by a tree [20]. Although soil nutrition is one important factor affecting tree nutrition, soil characteristics, plant physiology, environment, and biotic stressors all can influence nutrient uptake [20,46]. This was evident in our study as the soil nutrition was not strongly correlated with tissue nutrition. A similar weak relationship between soil and tissue nutrition in balsam fir was observed in a previous study [9].
There were considerably stronger relationships between tissue nutrition and NDVI in balsam fir. Tissue N, P, and K in autumn had significant relationships with NDVI (R2 = 20-30%), though only N also had a significant relationship in the spring. Most other tissue nutrients had no relationship with NDVI except for Zn, which was stronger in spring. These results align with several previous studies that found the strong relationships between tissue N and NDVI, with R2 ranging from 0.53 – 0.88 using a UAV [26,27,28,29,30,31]. These studies notably focused more on hardwood or mixed forests, as opposed to directly studying balsam fir. A study did link tissue N to NDVI in balsam fir using a handheld sensor [47], but their R2 = 0.66 was considerably higher the value from UAV in our current study. Further, previous studies often described strong relationships with tissue P, though relationships with other nutrients were weaker [26,27,28,29,30,31]. Our study didn’t find consistently strong relationships with any other nutrients in balsam fir when all sampled trees were included.
The relationship between tissue N and NDVI was notably stronger in trees greater than 5 years old, which supports one of the hypotheses in this study. Burns et al. [38] noted that NDVI became a stronger predictor throughout the life cycle of a plant. Balsam fir orchards are typically managed on a 10-year rotation, so this study identified those less than 5 years old as younger trees and older than 5 years old as mature trees. The exact reason for a weak relationship between tissue N and NDVI in younger balsam fir is not known. It could simply be due to younger trees having a lower nutritional demand. Most studies have indicated that nutrient deficiency is more of a concern after canopy closer in more mature trees [48,49,50]. Such nutrient demand is supported by the fact that N fertilization rates in Christmas trees increase 3-fold within the first 5 years and 10-fold in the final year as compared to second year fertilization [14]. In many cases Christmas trees are not fertilized at all in the first year [11,14]. Another possibility is that auxin concentrations are typically higher in younger tissues and help those tissues resist senescence [51,52]. Perhaps younger trees resist symptoms of nutrient deficiency and differences could not be easily identified by NDVI.
Tissue N was lower in this study than would typically be expected in commercial production, apart from autumn concentrations on Site 1. Typical tissue concentrations of N for normal growth and function are between 1.4% and 1.6%, though it can be higher to maintain desired color [7]. The average tissue N was 1.1 - 1.3%, though Site 1 had a concentration of 1.75%. Therefore, many trees were below optimum N concentrations. Tissue N in balsam fir is partially dependent on time of the year [9]. Nova Scotian balsam fir had 1.1% tissue N in spring versus 1.7% in early autumn [9]. Our study follows this same trend of high tissue N in autumn. Low tissue N in our study is probably due to Sites 2 and 3 not being used for commercial production. Those orchards are research and breeding orchards. Site 1 was a commercial orchard and had higher N concentrations, but the trees were earlier in their rotation and not ready for harvest. Producers typically fertilize at very high rates later in rotation to ensure a deep green color of their product but fertilize at considerably lower rates early in rotation [14].
The biggest challenge interpreting NDVI maps was found in shadows cast by the trees. Our method cut away trees from shadows on the map to isolate NDVI values, which was more time intensive and could limit applicability of this procedure to commercial operation. Timing drone flights when sun is directly overhead and/or on days expected to have high cloud cover would greatly reduce complications caused by shadows.
In conclusion, research hypotheses from this study were not rejected. There was a significant relationship between select foliar nutrition and NDVI, which differed based on tree age. The strongest relationship was found with tissue N. Mapping NDVI has potential to be a useful predictive tool to estimate tissue N in more mature balsam fir trees (> 5 years old), but any predictive power will be decreased for younger orchards or mixed age stands. Future research should also consider the exploration of carotenoid reflectance indices (CRI), such as the photochemical reflectance index (PRI) and chlorophyll/carotenoid index (CCI), which have been effective in monitoring photosynthetic phenology in both evergreen and mixed deciduous forests [53]. Research conducted by [54] indicated that CCI closely aligns with the seasonal patterns of daily gross primary productivity in evergreen conifer stands. This suggests that evaluating the NDVI against the CCI may reveal whether the latter provides superior predictive capabilities with reduced seasonal variability. It is recommended that this study be extended to include a higher number of balsam fir stands to further explore the predictive power of NDVI for balsam, including stands outside of NS, and to potentially incorporate Carotenoid-based indices into future research. Further exploration into this relationship may contribute to improved fertilization practices in the industry.
4. Materials and Methods
4.1. Site Description
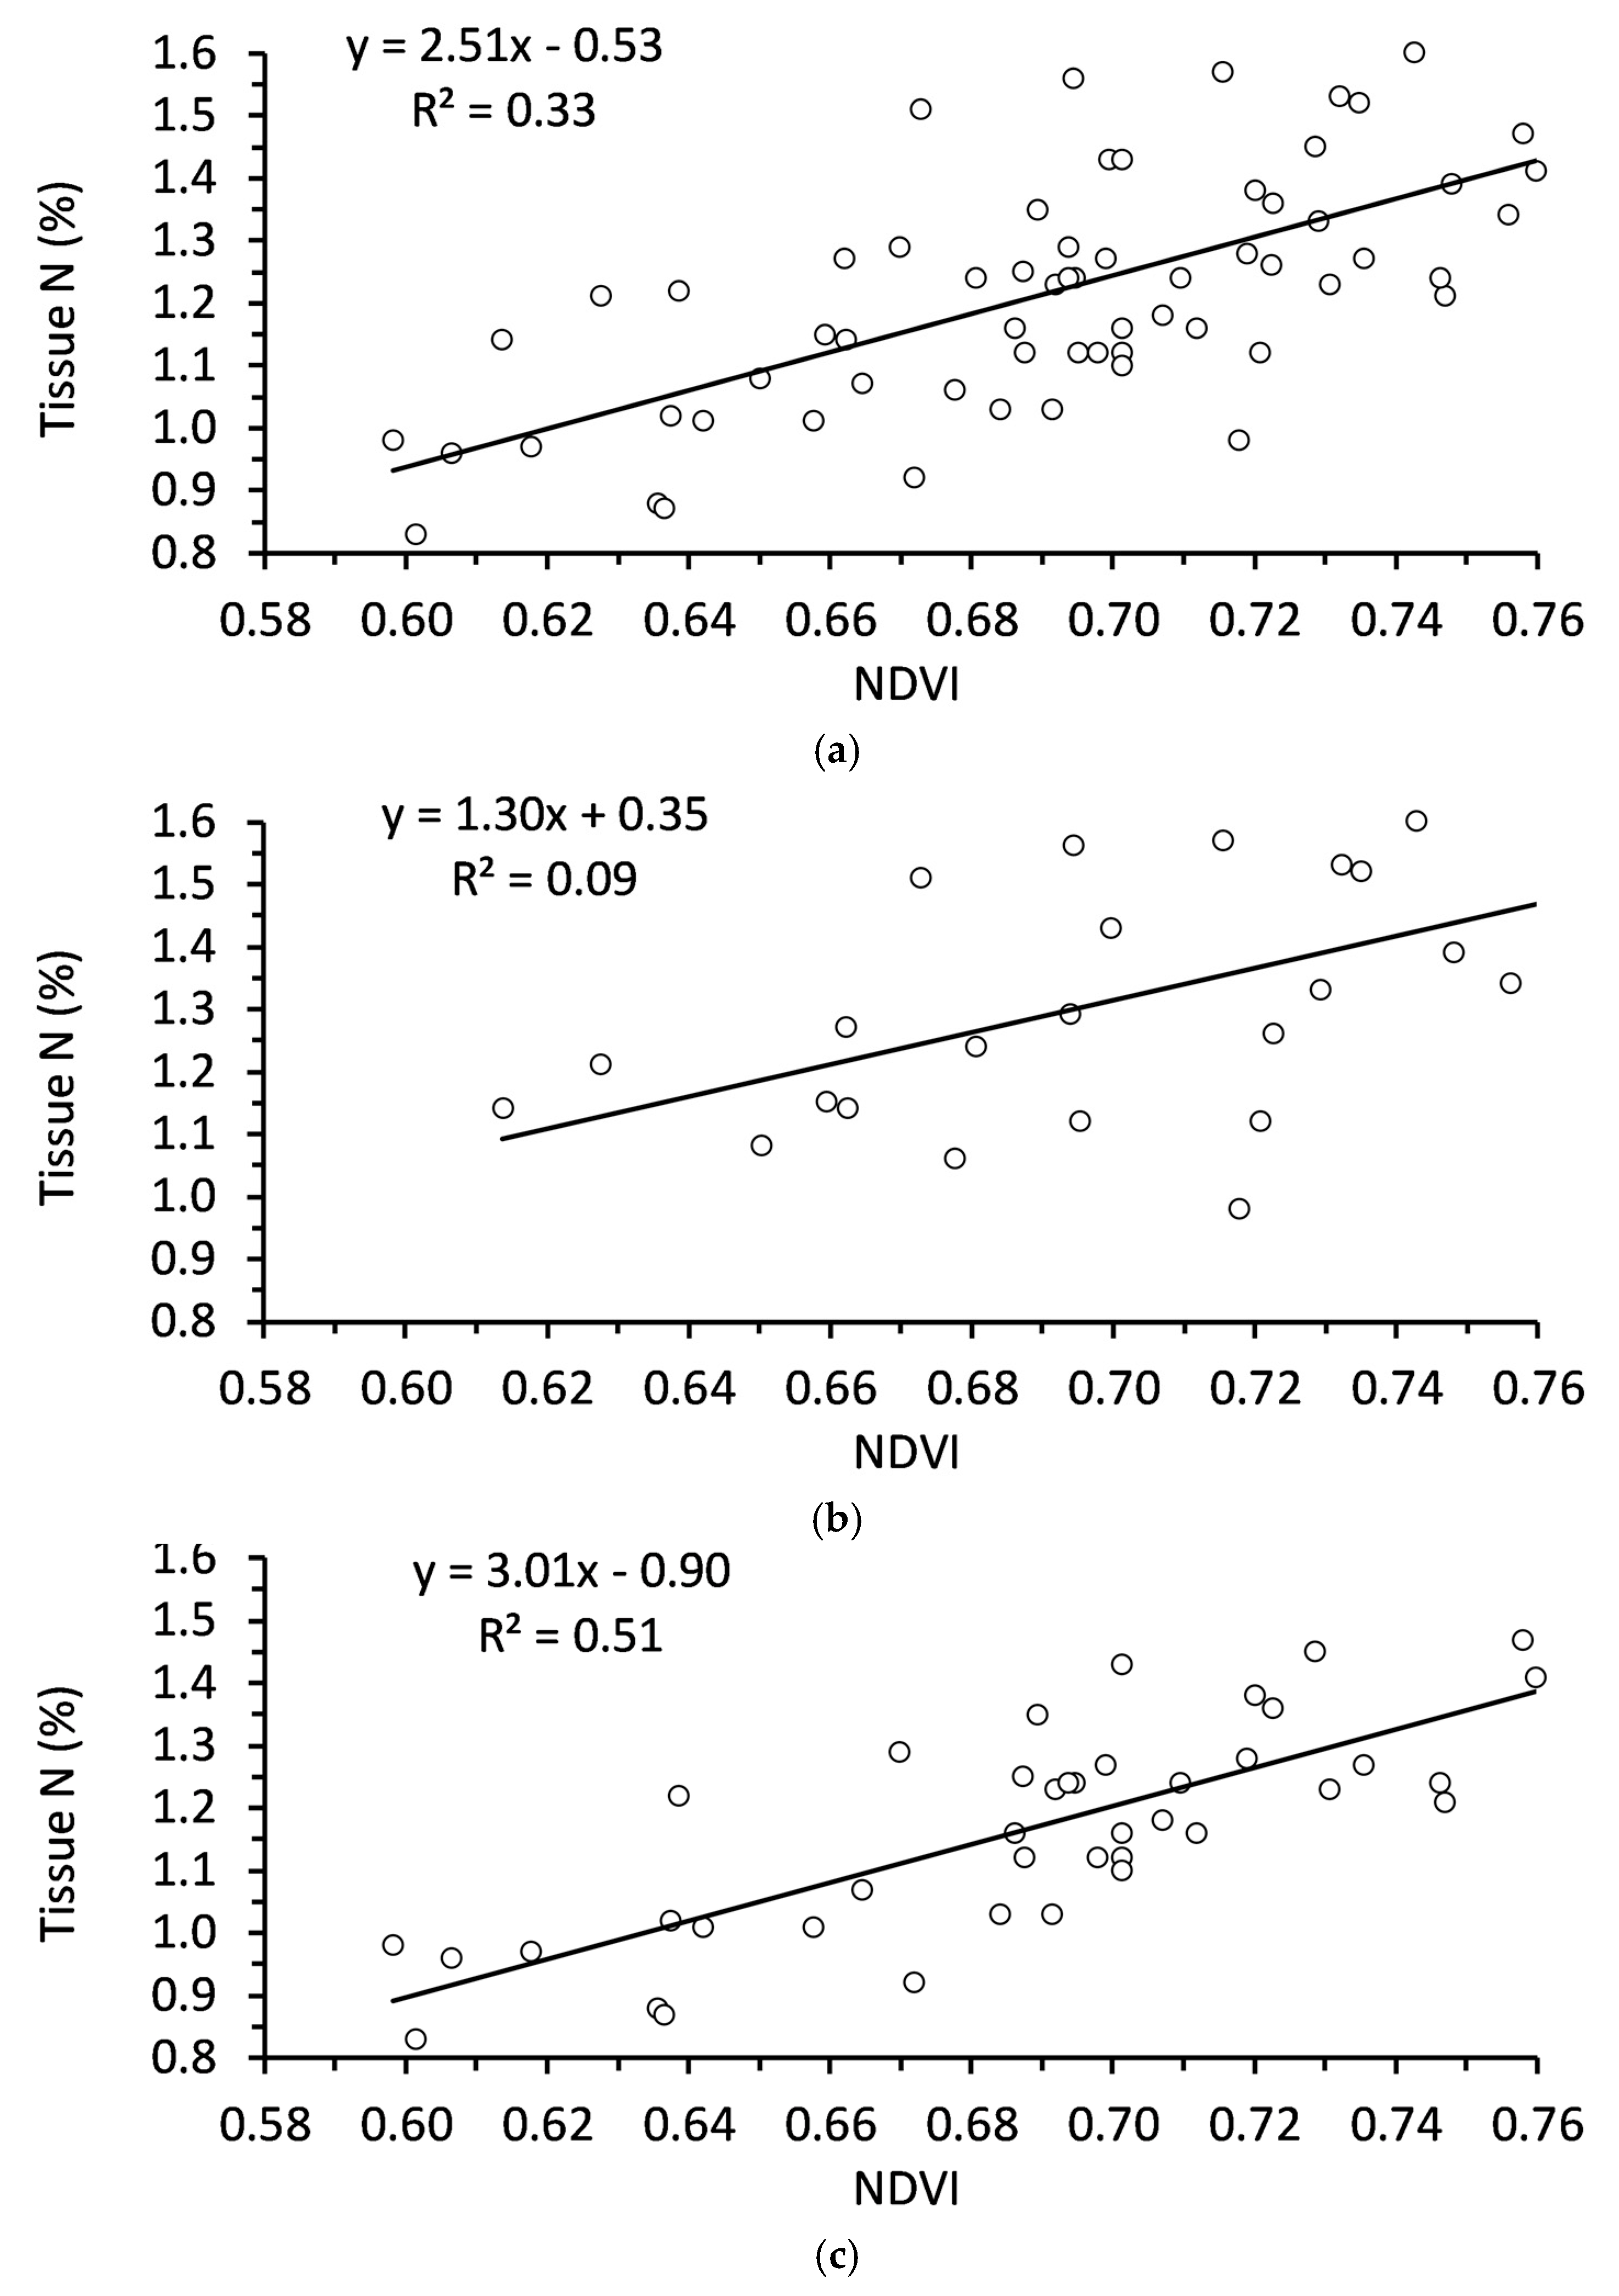
Two balsam fir orchards were chosen to collect samples in autumn. Site 1 was located on Belmont Road, Belmont, NS (45.434°N, 63.383°W) and Site 2 was located on College Road, Bible Hill, NS (45.374°N, 63.239°W) (Figure 4). A total of 45 trees were randomly selected from the two sites, with 20 trees younger than 5 years old and 25 trees older than 5 years old. Trees were selected from an orchard population identified in Figure 4b,c, excluding those with excessive defoliation from biotic stress. Sampled trees were tagged physically and with global navigation satellite system (GNSS) coordinates.
A second round of sampling was conducted in spring prior to any fertilization. The second round of sampling used Sites 1 and 2 again but included a third orchard (Site 3). Inclusion of Site 3 allowed for more total samples that were still adequately spaced apart. Site 3 was also located on College Road (45.373°N, 63.238°W). A total of 70 trees were randomly sampled in spring, with 25 younger than 5 years old and 45 older than 5 years old. Sampled trees were tagged physically and with GNSS coordinates, as was done previously in autumn.
4.2. Nutrient Analysis
Sampling was conducted on December 6, 2021, and again June 1, 2022. Six soil samples were collected from around the dripline of each tree and homogenized into a single representative sample. Soil was oven dried, ground with mortar and pestle, and sieved through a 2 mm stainless steel sieve. The Mehlich 3 soil extractant was used to obtain the plant available nutrients in the soil. Approximately 10 g of moist soil was placed in a plastic container with 100 mL of Mehlich 3 and shaken for 15 minutes at 200 oscillations per minute. The supernatant was filtered through Whitman No. 5 paper and analyzed using a Jarell-Ash Inductively Coupled Argon Plasma Emissions Spectrometer (ICAP).
Two branches were cut from each tree at the most recent 2 years growth. Needles were removed from the branches, dried, and then ground through a 1 mm steel screen. One gram needle tissue was placed in a 250 mL digestion tube with 15 mL of nitric acid. Samples were placed on a digestion block at 90°C for 45 minutes and then the temperature was increased to 140°C until it was clear and approximately 1 mL was remaining. Nitric acid (1%) was added, the samples were filtered, then put into a volumetric flask. Total N was measured using a LECO model FP 528 analyzer. Analysis of P, K, Ca, Mg, S, Fe, Zn, Mn, B, and Cu was conducted with inductively coupled plasma atomic emission spectroscopy (ICP-OES).
Figure 4.
(a) Satellite image of sample site locations on Belmont Road (Site 1) and College Road (Sites 2 and 3) in Nova Scotia., Canada; (b) orthomosaic image of site 1 taken by UAV; (c) orthomosaic image of sites 2 and 3 taken by UAV. Figure 4b,c were taken December 7, 2021. The white polygons indicate specific balsam fir orchards that were used for random sampling in Figure 4b,c.
4.3. Aerial Image Acquisition and Equipment
Aerial images were captured over each Christmas tree field using a DJI M300 RTK drone (SZ DJI Technology Co., Ltd., Shenzhen, China). Flights were taken shortly after soil and tissue samples were obtained. The drone was equipped with a Micasense Altum multispectral camera (MicaSense, Inc., Seattle, WA, USA) capable of recording imagery across five distinct spectral ranges. The spectral bands encompassed blue (Band 1-459-491 nm), green (Band 2 - 546-573 nm), red (Band 3-661–675 nm), red-edge (Band 4-710–723 nm), and near-infrared (Band 5-813–870 nm) [55].
Utilizing the DJI Pilot app (SZ DJI Technology Co., Ltd., Shenzhen, China), the surveys were systematically planned and executed at an altitude of 90 meters above ground level (AGL). The flight parameters were established to ensure a 75% overlap in both forward and lateral directions. The camera was set at nadir (90°) orientation, and the flight path was configured as a single grid.
A D-RTK2 base station (SZ DJI Technology Co., Ltd., Shenzhen, China) was deployed during the surveys to minimize the positional inaccuracies in the acquired images. Ground control points (GCPs) were also placed evenly across the survey areas to enhance post-processing accuracy. Nine and six GCPs were implemented across Sites 1 and 2, respectively. The coordinates of these GCPs were precisely recorded with an Emlid Reach RS2 multi-frequency GNSS receiver (Emlid Inc., Hong Kong, China) set in survey mode and connected to a networked transport of RTCM via internet protocol (NTRIP) correction service.
4.4. Image Processing
The collected multispectral images underwent a processing sequence in Agisoft PhotoScan 2.0.2 (Agisoft LLC Inc., St. Petersburg, Russia) to yield an orthomosaic representation of the study areas. The Altum camera was calibrated using a calibrated reflectance panel (CPR) to compensate for incident light conditions. The CPR calibration is vital for maintaining the precision of the subsequent image analysis and comparing values between two surveys as it assigns a definitive reflectance value during the corrections process. The surface values of the CPR were predetermined with a spectrometer at several wavelengths and provided by MicaSense [55]. Images of the CPR were taken before and after each flight, and the reflectance was calibrated in the processing stages in Agisoft [56].
The percent clip stretch type was selected during image interpretation to help visualize the orthomosaic and distinguish ground features from Christmas trees. This stretch function enhanced the orthomosaic by applying a linear stretch between the highest and lowest pixel values, translating into a more precise Christmas tree representation. The orthomosaic was then purged of elements beyond the study areas to augment the classification accuracy and minimize extraneous noise. This process is considered necessary as features such as houses, roads, and cars often constitute unwanted pixel values and pose challenges during the optimization parameters of the image classification [57].
Subsequently, a supervised image classification was performed using the support vector machine (SVM) classifier. This technique facilitated the classification of pixels with similar values within the multispectral orthomosaic. The SVM classifier was selected due to its low sample requirement and robustness against noise and correlated bands [57,58]. Training samples were collected and managed using the Training Samples Manager in ArcGIS Pro, classifying images into four categories: Christmas Tree, Shadows, Bare ground, and Grass. Fifty samples per class were collected to train the classifier, resulting in 200 training samples for each study site.
4.5. Normalized Difference Vegetation Index
The NDVI is a standardized index utilized to generate an image quantifying vegetation greenness. The NDVI index leverages the contrast between the characteristics and chlorophyll pigment absorption of the red and near-infrared bands [32]. The following formula was used to compute the NDVI, utilizing the Band 3 and Band 4 of the Altum multispectral camera:
Areas with low NDVI values corresponded to areas with sparse or no vegetation, such as rock or bare soil. Moderate values indicate shrubs and grassland, while high values denote forested areas and lush vegetation [59,60].
Following the creation of the NDVI maps, all features classified as Christmas trees from the classified raster were extracted and overlayed on the NDVI maps, which allowed the extraction of NDVI pixel values for each Christmas tree. Using the zonal statistics tool in ArcGIS Pro, the mean pixel values within each Christmas Tree polygon were calculated. This allowed the computation of the mean pixel value for each Christmas Tree, which was then used to compare NDVI values from one tree to another.
4.6. Statistical Analysis
All statistical analysis was completed using Minitab 21.4 software (Minitab, LLC, Penn State University, PA, USA). Soil and tissue nutrition were compared between sites using an analysis of variance. Site was the explanatory variable and nutrients were the response variables. Correlation analysis was used to identify relationships between soil and tissue nutrition and balsam fir NDVI. Balsam trees were classified as younger than 5 years and older than 5 years and then correlation analysis was repeated. The strongest relationships, tissue N and NDVI, were submitted to a linear regression analysis for overall sample population, trees > 5 years old, and trees < 5 years old. Statistical assumptions of normal distribution, homogeneity, and independence were verified for each analysis.
Author Contributions
Conceptualization, M.M, T.E. and M.B.; methodology, M.M and T.E.; software, M.M. and M.B.; validation, M.M., T.E. and M.B.; formal analysis, M.M.; investigation, M.M.; resources, M.M and T.E..; data curation, M.M.; writing—original draft preparation, M.M.; writing—review and editing, M.M., T.E., and M.B.; visualization, M.M. and M.B.; supervision, M.M. and T.E.; project administration, M.M.; funding acquisition, M.M. All authors have read and agreed to the published version of the manuscript.
Funding
This research was funded by the Christmas Tree Promotion Board, grant number 21-02-DU.
Data Availability Statement
The original contributions presented in the study are included in the article/supplementary material, further inquiries can be directed to the corresponding author/s.
Acknowledgments
The authors thank Matt Priest of Northern Lights Christmas Tree Farms for access to balsam fir orchards.
Conflicts of Interest
The authors declare no conflicts of interest.
References
- Collier, J.; MacLean, D.A.; D’Orangeville, L.; Taylor, A.R. A Review of Climate Change Effects on the Regeneration Dynamics of Balsam Fir. The Forestry Chronicle 2022, 98, 54–65. [Google Scholar] [CrossRef]
- MacDonald, M.T.; Lada, R.R.; MacDonald, G.E.; Caldwell, C.D.; Udenigwe, C.C. Changes in Polar Lipid Composition in Balsam Fir during Seasonal Cold Acclimation and Relationship to Needle Abscission. IJMS 2023, 24, 15702. [Google Scholar] [CrossRef]
- Burns, R.M.; Honkala, B.H. Silvics of North America: Conifers; U.S. Department of Agriculture, Forest Service: Washington DC, USA, 1990. [Google Scholar]
- Shahbandeh, M. Farm Cash Receipts Christmas Trees Canada 2022. Available online: https://www.statista.com/statistics/449337/farm-cash-receipts-of-christmas-trees-canada/ (accessed on 5 March 2024).
- Thiagarajan, A.; MacDonald, M.T.; Lada, R. Environmental and Hormonal Physiology of Postharvest Needle Abscission in Christmas Trees. Critical Reviews in Plant Sciences 2016, 35, 1–17. [Google Scholar] [CrossRef]
- Chastagner, G.A.; Benson, D.M. The Christmas Tree: Traditions, Production, and Diseases. Plant Health Progress 2000, 1, 15. [Google Scholar] [CrossRef]
- Hart, J.; Landgren, C.; Fletcher, R.; Bondi, M.; Withrow-Robinson, B.; Chastagner, G. Christmas Tree Nutrient Management Guide; Oregon State University: Oregon, USA, 2009. [Google Scholar]
- Lamontagne, M.; Adegbidi, H.G.; Assamoi, A.J. Organic Fertilization of Christmas Tree (Abies Balsamea (L.) Mill.) Plantations with Poultry Manure in Northwestern New Brunswick, Canada. The Forestry Chronicle 2019, 95, 39–49. [Google Scholar] [CrossRef]
- MacDonald, M.T.; Lada, R.R. Seasonal Changes in Soil and Tissue Nutrition in Balsam Fir and Influences on Postharvest Needle Abscission. Scandinavian Journal of Forest Research 2018, 33, 426–436. [Google Scholar] [CrossRef]
- MacDonald, M.T.; Lada, R.R.; Veitch, R.S. Seasonal Changes in Balsam Fir Needle Abscission Patterns and Links to Environmental Factors. Scandinavian Journal of Forest Research 2017, 32, 438–445. [Google Scholar] [CrossRef]
- Seifert, J.R. Growing Christmas Trees.
- Rideout, J.W.; Overstreet, L.F. A Survey of Fertility Practices, Soil Fertility Status, and Tree Nutrient Status on Eastern North Carolina Christmas Tree Farms. Communications in Soil Science and Plant Analysis 2004, 35, 631–647. [Google Scholar] [CrossRef]
- Chapman, A. Christmas Trees for Pleasure; Rutgers University Press: Piskataway, NJ, USA, 2005; ISBN 978-0-8135-3650-7. [Google Scholar]
- Koelling, M.R. Fertilization Recommendations for Fraser Fir: Part II - Established Plantings. Mich Christmas Tree J 2002, 49, 5–8. [Google Scholar]
- Fixen, P.E.; West, F.B. Nitrogen Fertilizers: Meeting Contemporary Challenges. AMBIO: A Journal of the Human Environment 2002, 31, 169–176. [Google Scholar] [CrossRef] [PubMed]
- Slesak, R.A.; Briggs, R.D. Christmas Tree Response to N Fertilization and the Development of Critical Foliar N Levels in New York. Northern Journal of Applied Forestry 2007, 24, 209–217. [Google Scholar] [CrossRef]
- Allen, H.L. Forest Fertilizers. J Forest 1987, 85, 37–46. [Google Scholar] [CrossRef]
- Liu, H.; Zhu, H.; Wang, P. Quantitative modelling for leaf nitrogen content of winter wheat using UAV-based hyperspectral data. International Journal of Remote Sensing 2017, 38, 2117–2134. [Google Scholar] [CrossRef]
- Wojtowicz, M.; Wojtowics, A.; Piekarczyk, J. Application of Remote Sensing Methods in Agriculture. Communications in Biometry and Crop Science 2016, 11, 31–50. [Google Scholar]
- Watt, M.S.; Pearse, G.D.; Dash, J.P.; Melia, N.; Leonardo, E.M.C. Application of Remote Sensing Technologies to Identify Impacts of Nutritional Deficiencies on Forests. ISPRS Journal of Photogrammetry and Remote Sensing 2019, 149, 226–241. [Google Scholar] [CrossRef]
- Lillesand, T.; Kiefer, R.W.; Chipman, J. Remote Sensing and Image Interpretation, 7th ed.; Joh Wiley and Sons: Hoboken, NJ, USA, 2015. [Google Scholar]
- Tang, L.; Shao, G. Drone Remote Sensing for Forestry Research and Practices. J. For. Res. 2015, 26, 791–797. [Google Scholar] [CrossRef]
- Hunt, E.R.; Daughtry, C.S.T. What Good Are Unmanned Aircraft Systems for Agricultural Remote Sensing and Precision Agriculture? International Journal of Remote Sensing 2018, 39, 5345–5376. [Google Scholar] [CrossRef]
- Puliti, S.; Ene, L.T.; Gobakken, T.; Naesset, E. Use of Partial-Coverage UAV Data in Sampling for Large Scale Forest Inventories. Remote Sensing Environ 2017, 194, 115–126. [Google Scholar] [CrossRef]
- Puliti, S.; Ørka, H.; Gobakken, T.; Næsset, E. Inventory of Small Forest Areas Using an Unmanned Aerial System. Remote Sensing 2015, 7, 9632–9654. [Google Scholar] [CrossRef]
- Huang, Z.; Turner, B.J.; Dury, Stephen J. ; Wallis, I.R.; Foley, W.J. Estimating Foliage Nitrogen Concentration from HYMAP Data Using Continuum Removal Analysis. Remote Sensing Environ. 2004, 93, 18–29. [Google Scholar] [CrossRef]
- Martin, M.E.; Aber, J.D. High Spectral Resolution Remote Sensing of Forest Canopy Lignin, Nitrogen, and Ecosystem Processes. Ecological Applications 1997, 7, 431–443. [Google Scholar] [CrossRef]
- Townsend, P.A.; Foster, J.R.; Chastain, R.A.; Currie, W.S. Application of Imaging Spectroscopy to Mapping Canopy Nitrogen in the Forests of the Central Appalachian Mountains Using Hyperion and Aviris. IEEE Trans. Geosci. Remote Sensing 2003, 41, 1347–1354. [Google Scholar] [CrossRef]
- Zagolski, F.; Pinel, V.; Romier, J.; Alcayde, D.; Fontanari, J.; Gastellu-Etchegorry, J.P.; Giordano, G.; Marty, G.; Mougin, E.; Joffre, R. Forest Canopy Chemistry with High Spectral Resolution Remote Sensing. Int. J. Remote Sens. 1996, 17, 1107–1128. [Google Scholar] [CrossRef]
- Smith, M.-L.; Martin, M.E.; Plourde, L.; Ollinger, S.V. Analysis of Hyperspectral Data for Estimation of Temperate Forest Canopy Nitrogen Concentration: Comparison between an Airborne (Aviris) and a Spaceborne (Hyperion) Sensor. IEEE Trans. Geosci. Remote Sensing 2003, 41, 1332–1337. [Google Scholar] [CrossRef]
- Huber, S.; Kneubühler, M.; Psomas, A.; Itten, K.; Zimmermann, N.E. Estimating Foliar Biochemistry from Hyperspectral Data in Mixed Forest Canopy. Forest Ecology and Management 2008, 256, 491–501. [Google Scholar] [CrossRef]
- Xue, J.; Su, B. Significant Remote Sensing Vegetation Indices: A Review of Developments and Applications [Research Article. Journal of Sensors 2017. [Google Scholar] [CrossRef]
- Huang, S.; Tang, L.; Hupy, J.P.; Wang, Y.; Shao, G. A Commentary Review on the Use of Normalized Difference Vegetation Index (NDVI) in the Era of Popular Remote Sensing. J. For. Res. 2021, 32, 1–6. [Google Scholar] [CrossRef]
- Kriegler, F.J. Preprocessing Transformations and Their Effects on Multispectral Recognition.; 1969.
- Pastor-Guzman, J.; Atkinson, P.; Dash, J.; Rioja-Nieto, R. Spatiotemporal Variation in Mangrove Chlorophyll Concentration Using Landsat 8. Remote Sensing 2015, 7, 14530–14558. [Google Scholar] [CrossRef]
- Vicente-Serrano, S.M.; Camarero, J.J.; Olano, J.M.; Martín-Hernández, N.; Peña-Gallardo, M.; Tomás-Burguera, M.; Gazol, A.; Azorin-Molina, C.; Bhuyan, U.; El Kenawy, A. Diverse Relationships between Forest Growth and the Normalized Difference Vegetation Index at a Global Scale. Remote Sensing of Environment 2016, 187, 14–29. [Google Scholar] [CrossRef]
- Chávez, R.O.; Clevers, J.G.P.W.; Decuyper, M.; De Bruin, S.; Herold, M. 50 Years of Water Extraction in the Pampa Del Tamarugal Basin: Can Prosopis Tamarugo Trees Survive in the Hyper-Arid Atacama Desert (Northern Chile)? Journal of Arid Environments 2016, 124, 292–303. [Google Scholar] [CrossRef]
- Burns, B.W.; Green, V.S.; Hashem, A.A.; Massey, J.H.; Shew, A.M.; Adviento-Borbe, M.A.A.; Milad, M. Determining Nitrogen Deficiencies for Maize Using Various Remote Sensing Indices. Precision Agric 2022, 23, 791–811. [Google Scholar] [CrossRef]
- Debnath, S.; Paul, M.; Rahaman, D.M.M.; Debnath, T.; Zheng, L.; Baby, T.; Schmidtke, L.M.; Rogiers, S.Y. Identifying Individual Nutrient Deficiencies of Grapevine Leaves Using Hyperspectral Imaging. Remote Sensing 2021, 13, 3317. [Google Scholar] [CrossRef]
- Walshe, D.; McInerney, D.; De Kerchove, R.V.; Goyens, C.; Balaji, P.; Byrne, K.A. Detecting Nutrient Deficiency in Spruce Forests Using Multispectral Satellite Imagery. International Journal of Applied Earth Observation and Geoinformation 2020, 86, 101975. [Google Scholar] [CrossRef]
- Atzberger, C. Advances in Remote Sensing of Agriculture: Context Description: Existing Operational Monitoring Systems and Major Information Needs. Remote Sensing 2013, 5, 949–981. [Google Scholar] [CrossRef]
- McMorrow, J. Linear Regression Modeling for the Estimation of Oil Palm Age from Landsat T<. Internation Journal of Remote Sensing 2001, 22, 2243–2264. [Google Scholar]
- Chemura, A.; Mutanga, O.; Dube, T. Integrating Age in the Detection and Mapping of Incongruous Patches in Coffee (Coffea Arabica) Plantations Using Multi-Temporal Landsat 8 NDVI Anomalies. Internation Journal of Applied Earth Observation and Geoinformation 2017, 57, 1–13. [Google Scholar] [CrossRef]
- Banday, M.; Bhardwaj, D.R.; Pala, N.A. Influence of Forest Type, Altitude and NDVI on Soil Properties in Forests of North Western Himalaya, India. Acta Ecologica Sinica 2019, 39, 50–55. [Google Scholar] [CrossRef]
- Verhulst, N.; Govaerts, B.; Sayre, K.D.; Deckers, J.; François, I.M.; Dendooven, L. Using NDVI and Soil Quality Analysis to Assess Influence of Agronomic Management on Within-Plot Spatial Variability and Factors Limiting Production. Plant Soil 2009, 317, 41–59. [Google Scholar] [CrossRef]
- Baligar, V.C.; Fageria, N.K.; He, Z.L. Nutrient Use Efficiency in Plants. Communications in Soil Science and Plant Analysis 2001, 32, 921–950. [Google Scholar] [CrossRef]
- Luther, J.E.; Carroll, A.L. Development of an Index of Balsam Fir Vigor by Foliar Spectral Reflectance. Remote Sensing Environ 1999, 69, 241–252. [Google Scholar] [CrossRef]
- Albaugh, T.J.; Lee Allen, H.; Zutter, B.R.; Quicke, H.E. Vegetation Control and Fertilization in Midrotation Pinus Taeda Stands in the Southeastern United States. Ann. For. Sci. 2003, 60, 619–624. [Google Scholar] [CrossRef]
- Lee Allen, H.; Fox, T.R.; Campbell, R.G. What Is Ahead for Intensive Pine Plantation Silviculture in the South? Southern Journal of Applied Forestry 2005, 29, 62–69. [Google Scholar] [CrossRef]
- Liechty, H.O.; Fristoe, C. Response of Midrotation Pine Stands to Fertilizer and Herbicide Application in the Western Gulf Coastal Plain. Southern Journal of Applied Forestry 2013, 37, 69–74. [Google Scholar] [CrossRef]
- Fischer, A.M. The Complex Regulation of Senescence. Crit. Rev. Plant Sci. 2012, 31, 124–147. [Google Scholar] [CrossRef]
- Cohen, J.D.; Slovin, J.P.; Hendrickson, A.M. Two Genetically Discrete Pathways Convert Tryptophan to Auxin: More Redundancy in Auxin Biosynthesis. Trends Plant Sci 2003, 8, 197–199. [Google Scholar] [CrossRef] [PubMed]
- Wong, C.Y.S.; D’Odorico, P.; Arain, M.A.; Ensminger, I. Tracking the Phenology of Photosynthesis Using Carotenoid-Sensitive and near Infrared Reflectance Nvegetation Indices in a Temperatre Evergreen and Mixed Deciduous Forest. New Phytologist 2020, 226, 1682–1695. [Google Scholar] [CrossRef] [PubMed]
- Gamon, J.A.; Huemmrich, K.F.; Wong, C.Y.S.; Ensminger, I.; Garrity, S.; Hollinger, D.Y.; Noormets, A.; Peñuelas, J. A Remotely Sensed Pigment Index Reveals Photosynthetic Phenology in Evergreen Conifers. Proc. Natl. Acad. Sci. U.S.A. 2016, 113, 13087–13092. [Google Scholar] [CrossRef]
- MicaSense User Guide for MicaSense Sensors. MicaSense Knowledge Base 2023.
- Agisoft, L.L.C. MicaSense Altum processing workflow (including Reflectance Calibration) in Agisoft Metashape Professional. Helpdesk Portal 2023. [Google Scholar]
- Pal, M.; Mather, P.M. Support Vector Machines for Classification in Remote Sensing. International Journal of Remote Sensing 2005, 26, 1007–1011. [Google Scholar] [CrossRef]
- E.S.R.I. Train Support Vector Machine Classifier (Spatial Analyst. In ArcGIS Pro documentation; 2023.
- Antognelli, S. NDVI and NDMI Vegetation Indices: Instructions for Use. Agricolus 2018.
- E.S.R.I. NDVI function. In ArcGIS Pro documentation; 2023.
Figure 1.
(a) Significant relationship between soil and tissue nitrogen in balsam fir; (b) Significant relationship between soil and tissue manganese in balsam. N = 45 in each graph.
Figure 1.
(a) Significant relationship between soil and tissue nitrogen in balsam fir; (b) Significant relationship between soil and tissue manganese in balsam. N = 45 in each graph.
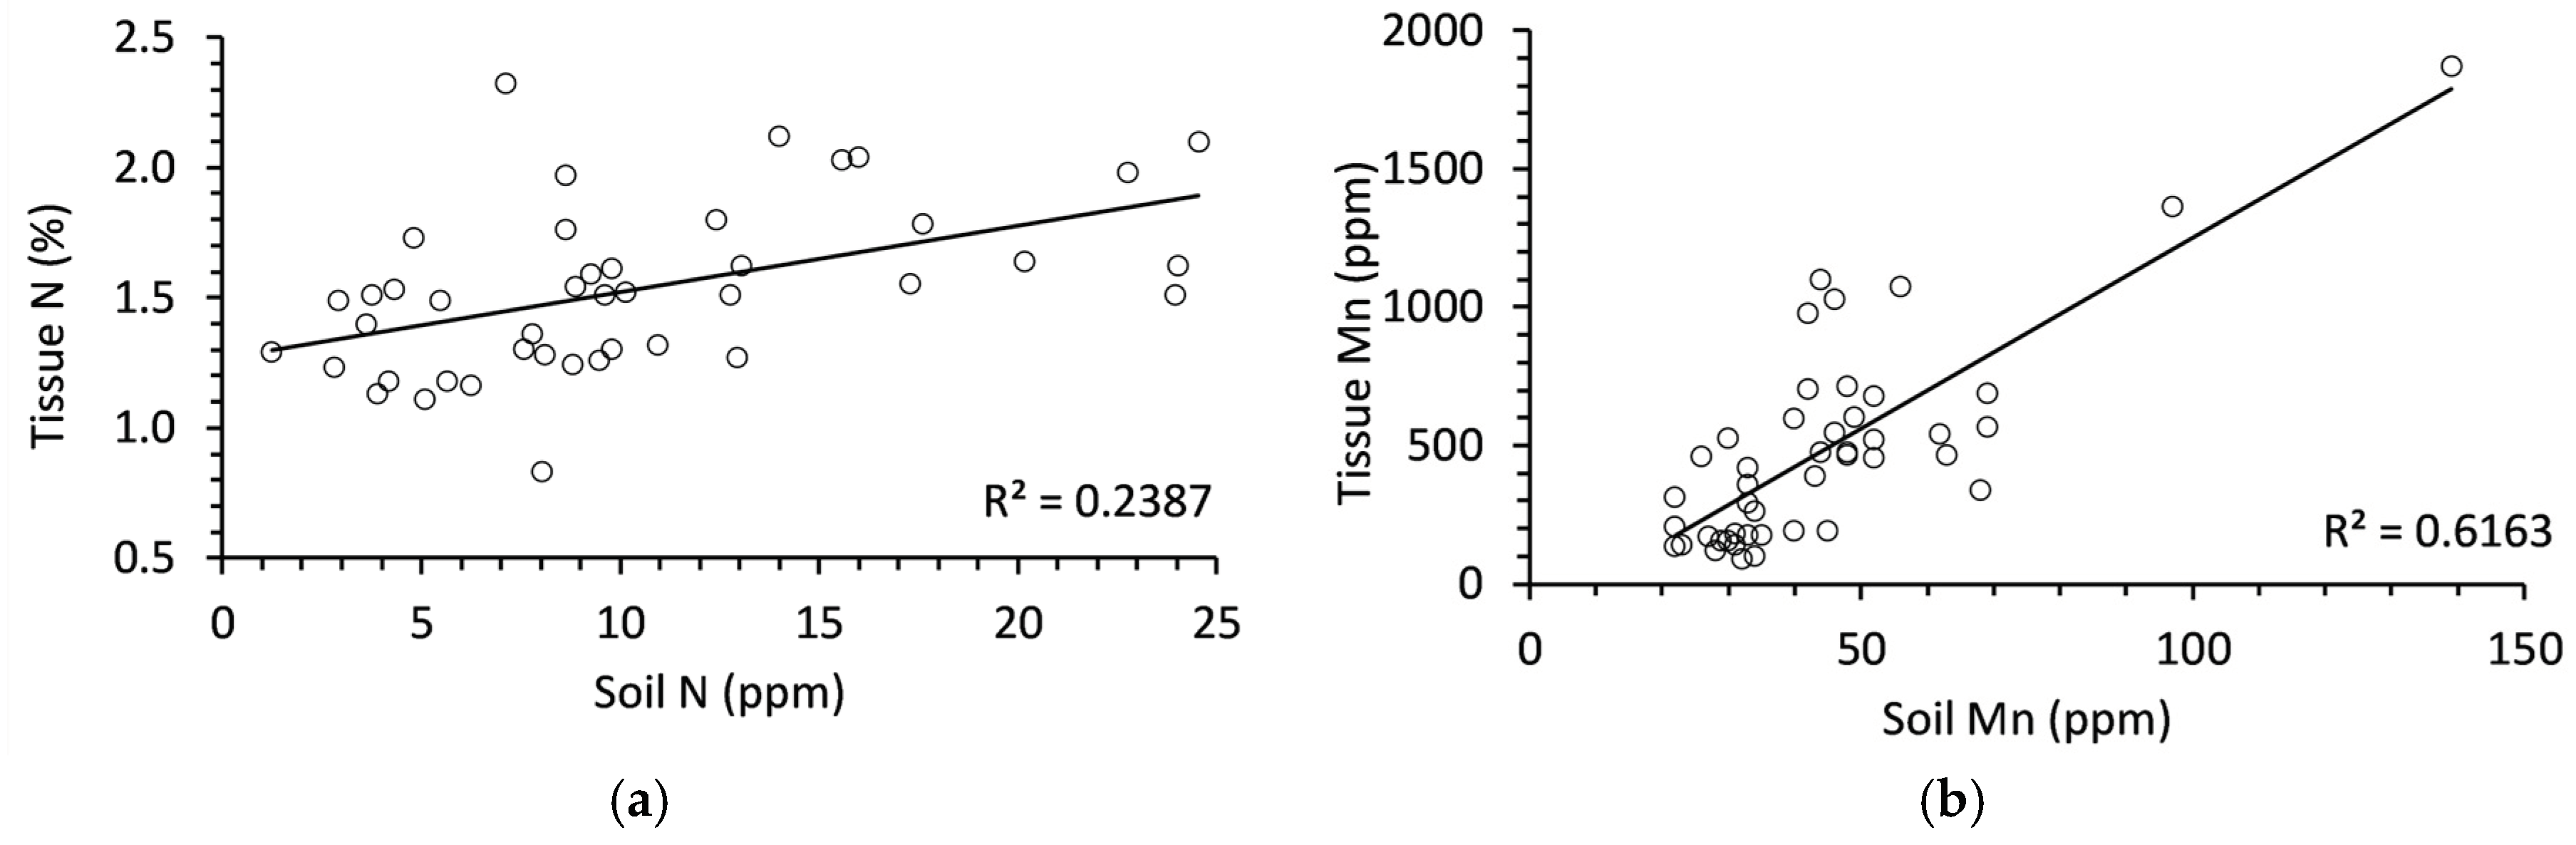

Table 1.
Soil nutrition of two Nova Scotian balsam fir orchards. Site 1 was located on Belmont Road, Belmont, NS and Site 2 was located on College Road, Bible Hill, NS in Autumn 2021. Data expressed as mean ± standard error as calculated from 25 replicates in each site. Boron was below the detectable limit so not shown on the table.
| Nutrient | Site 1 | Site 2 | ||||
|---|---|---|---|---|---|---|
| N (ppm) | 13.81 | ± | 1.38 | 7.24 | ± | 0.71 |
| P (kg/ha) | 360.86 | ± | 33.37 | 576.88 | ± | 28.28 |
| K (kg/ha) | 248.19 | ± | 19.58 | 130.52 | ± | 7.25 |
| Ca (kg/ha) | 1960.95 | ± | 88.80 | 2070.92 | ± | 71.66 |
| Mg (kg/ha) | 363.57 | ± | 25.57 | 330.04 | ± | 13.26 |
| Na (kg/ha) | 54.62 | ± | 22.09 | 29.44 | ± | 1.32 |
| S (kg/ha) | 24.86 | ± | 0.54 | 23.60 | ± | 0.59 |
| Al (ppm) | 1421.14 | ± | 20.24 | 1399.52 | ± | 24.20 |
| Cu (ppm) | 1.18 | ± | 0.04 | 2.00 | ± | 0.15 |
| Fe (ppm) | 142.10 | ± | 6.77 | 137.72 | ± | 6.67 |
| Mn (ppm) | 31.67 | ± | 1.54 | 54.88 | ± | 4.52 |
| Zn (ppm) | 3.09 | ± | 0.19 | 1.05 | ± | 0.06 |
Table 2.
Soil nutrition of three Nova Scotian balsam fir orchards. Site 1 was located on Belmont Road, Belmont, NS and Sites 2 and 3 were located on College Road, Bible Hill, NS in Spring 2022. Data expressed as mean ± standard error as calculated from 25 replicates in each site. Boron was below the detectable limit so not shown on the table.
| Nutrient | Site 1 | Site 2 | Site 3 | ||||||
|---|---|---|---|---|---|---|---|---|---|
| N (ppm) | 31.10 | ± | 3.66 | 1.99 | ± | 0.22 | 2.11 | ± | 0.14 |
| P (kg/ha) | 397.92 | ± | 34.15 | 611.68 | ± | 24.82 | 626.76 | ± | 23.20 |
| K (kg/ha) | 359.96 | ± | 34.86 | 166.04 | ± | 10.97 | 334.36 | ± | 17.70 |
| Ca (kg/ha) | 2190.64 | ± | 93.81 | 2264.68 | ± | 73.78 | 1959.68 | ± | 56.03 |
| Mg (kg/ha) | 381.00 | ± | 26.61 | 355.88 | ± | 16.77 | 349.08 | ± | 14.50 |
| Na (kg/ha) | 71.16 | ± | 24.00 | 34.44 | ± | 1.29 | 32.92 | ± | 1.60 |
| S (kg/ha) | 34.60 | ± | 1.21 | 29.36 | ± | 0.55 | 28.16 | ± | 0.50 |
| Al (ppm) | 1538.08 | ± | 20.13 | 1429.24 | ± | 28.66 | 1537.00 | ± | 21.77 |
| Cu (ppm) | 1.26 | ± | 0.04 | 2.09 | ± | 0.14 | 1.30 | ± | 0.16 |
| Fe (ppm) | 136.92 | ± | 6.15 | 147.52 | ± | 7.51 | 143.48 | ± | 5.07 |
| Mn (ppm) | 32.72 | ± | 1.61 | 68.32 | ± | 5.74 | 61.36 | ± | 2.15 |
| Zn (ppm) | 3.63 | ± | 0.19 | 1.99 | ± | 0.22 | 2.11 | ± | 0.14 |
Table 3.
Needle tissue nutrition of two Nova Scotian balsam fir orchards. Site 1 was located on Belmont Road, Belmont, NS and Site 2 was located on College Road, Bible Hill, NS in Autumn 2021. Data expressed as mean ± standard error as calculated from 25 replicates in each site. Copper was below the detectable limit so not shown on the table.
| Nutrient | Site 1 | Site 2 | ||||
|---|---|---|---|---|---|---|
| N (%) | 1.75 | ± | 0.06 | 1.32 | ± | 0.05 |
| P (%) | 0.20 | ± | 0.01 | 0.17 | ± | 0.01 |
| K (%) | 0.53 | ± | 0.02 | 0.47 | ± | 0.02 |
| Ca (%) | 0.68 | ± | 0.05 | 1.13 | ± | 0.06 |
| Mg (%) | 0.09 | ± | 0.00 | 0.10 | ± | 0.00 |
| Na (%) | 0.02 | ± | 0.00 | 0.02 | ± | 0.00 |
| B (ppm) | 18.62 | ± | 1.23 | 15.75 | ± | 1.19 |
| Fe (ppm) | 43.67 | ± | 2.72 | 44.95 | ± | 2.85 |
| Mn (ppm) | 238.05 | ± | 30.33 | 694.79 | ± | 82.24 |
| Zn (ppm) | 45.87 | ± | 3.49 | 54.48 | ± | 3.57 |
Table 4.
Needle tissue nutrition of three Nova Scotian balsam fir orchards. Site 1 was located on Belmont Road, Belmont, NS and Sites 2 and 3 were located on College Road, Bible Hill, NS in Spring 2022. Data expressed as mean ± standard error as calculated from 25 replicates in each site. Copper and sodium were below the detectable limit so not shown on the table.
| Nutrient | Site 1 | Site 2 | Site 3 | ||||||
|---|---|---|---|---|---|---|---|---|---|
| N (%) | 1.31 | ± | 0.04 | 1.17 | ± | 0.03 | 1.11 | ± | 0.03 |
| P (%) | 0.12 | ± | 0.01 | 0.13 | ± | 0.01 | 0.13 | ± | 0.01 |
| K (%) | 0.31 | ± | 0.01 | 0.44 | ± | 0.02 | 0.44 | ± | 0.01 |
| Ca (%) | 0.74 | ± | 0.05 | 1.00 | ± | 0.05 | 1.08 | ± | 0.03 |
| Mg (%) | 0.07 | ± | 0.01 | 0.08 | ± | 0.01 | 0.10 | ± | 0.01 |
| B (ppm) | 14.62 | ± | 0.85 | 15.76 | ± | 1.07 | 14.37 | ± | 0.68 |
| Fe (ppm) | 58.96 | ± | 3.70 | 127.50 | ± | 26.8 | 37.48 | ± | 7.10 |
| Mn (ppm) | 283.2 | ± | 31.64 | 666.91 | ± | 70.03 | 602.00 | ± | 45.50 |
| Zn (ppm) | 44.89 | ± | 3.37 | 48.40 | ± | 3.08 | 41.36 | ± | 2.84 |
Table 5.
Correlation coefficients of autumn and spring soil nutrition with NDVI. Correlations are shown for all trees and then separated into trees less than and greater than 5 years old. In autumn, N overall = 45, N less than 5 years = 20, and N over 5 years = 25. In spring, N overall = 70, N less than 5 years = 25, and N over 5 years = 45.
| Nutrient | Autumn 2021 | Spring 2022 | ||||||
|---|---|---|---|---|---|---|---|---|
| Overall | < 5 year | >5 year | Overall | < 5 year | > 5 year | |||
| N | -0.13 | -0.28 | 0.23 | 0.02 | -0.08 | 0.02 | ||
| P | 0.00 | 0.06 | 0.11 | -0.10 | -0.09 | -0.14 | ||
| K | 0.18 | 0.15 | 0.20 | -0.26 | -0.13 | -0.35 | ||
| Ca | 0.01 | -0.21 | 0.26 | 0.12 | -0.12 | 0.26 | ||
| Mg | 0.00 | -0.15 | 0.21 | 0.06 | -0.11 | 0.19 | ||
| Na | 0.33 | 0.43 | 0.04 | 0.28 | 0.50 | 0.19 | ||
| S | -0.16 | 0.20 | -0.49 | 0.04 | 0.07 | 0.01 | ||
| Al | -0.14 | 0.02 | -0.28 | -0.11 | -0.04 | -0.15 | ||
| Cu | -0.13 | 0.24 | -0.20 | 0.04 | 0.21 | 0.03 | ||
| Fe | 0.17 | 0.15 | 0.19 | 0.07 | 0.22 | 0.01 | ||
| Mn | 0.05 | 0.53 | 0.05 | 0.03 | 0.36 | 0.02 | ||
| Zn | 0.04 | -0.20 | 0.14 | -0.07 | -0.03 | -0.26 | ||
Table 6.
Correlation coefficients of autumn and spring foliar nutrition with NDVI. Correlations are shown for all trees and then separated into trees less than and greater than 5 years old. In autumn, N overall = 45, N less than 5 years = 20, and N over 5 years = 25. In spring, N overall = 70, N less than 5 years = 25, and N over 5 years = 45.
| Nutrient | Autumn 2021 | Spring 2022 | ||||||
|---|---|---|---|---|---|---|---|---|
| Overall | < 5 year | > 5 year | Overall | < 5 year | > 5 year | |||
| N | 0.55 | 0.48 | 0.78 | 0.55 | 0.30 | 0.67 | ||
| P | 0.45 | 0.35 | 0.47 | 0.30 | 0.10 | 0.36 | ||
| K | 0.52 | 0.36 | 0.60 | 0.07 | 0.02 | 0.13 | ||
| Ca | -0.04 | -0.09 | 0.11 | 0.16 | 0.19 | 0.24 | ||
| Mg | -0.04 | -0.31 | 0.29 | -0.11 | 0.00 | -0.15 | ||
| Na | 0.30 | 0.32 | 0.32 | n/a | n/a | n/a | ||
| B | 0.08 | -0.03 | 0.17 | -0.08 | -0.47 | 0.03 | ||
| Fe | -0.07 | -0.03 | -0.10 | 0.13 | 0.15 | 0.15 | ||
| Mn | -0.05 | 0.06 | 0.00 | 0.19 | 0.34 | 0.23 | ||
| Zn | 0.30 | 0.37 | 0.23 | 0.48 | 0.49 | 0.49 | ||
Disclaimer/Publisher’s Note: The statements, opinions and data contained in all publications are solely those of the individual author(s) and contributor(s) and not of MDPI and/or the editor(s). MDPI and/or the editor(s) disclaim responsibility for any injury to people or property resulting from any ideas, methods, instructions or products referred to in the content. |
© 2024 by the authors. Licensee MDPI, Basel, Switzerland. This article is an open access article distributed under the terms and conditions of the Creative Commons Attribution (CC BY) license (http://creativecommons.org/licenses/by/4.0/).
Copyright: This open access article is published under a Creative Commons CC BY 4.0 license, which permit the free download, distribution, and reuse, provided that the author and preprint are cited in any reuse.


