
Submitted:
01 May 2025
Posted:
07 May 2025
You are already at the latest version
Abstract
Crop growth monitoring during its growth stages is essential for optimizing agricultural resource inputs and enhancing crop productivity. Nitrogen plays a critical role during plant growth but its improper application not only reduces the crop productivity but also in the long turn cause soil degradation. This study addresses an advanced and integrated approach to develop a non-invasive mechanism for nitrogen estimation through proxies (Nitrogen Flavanol Index) in Mentha arvensis. This study integrates UAV-based multispectral imagery vegetation indices, field observed non-invasive data, and machine learning (ML) models to predict NFI during growth stages of Mentha arvensis. Machine learning models (Support Vector Regression, Random Forest, and Gradient Boosting) were evaluated, with Random Forest achieving highest accuracy (R² = 0.86, RMSE = 0.32), followed by Gradient Boosting (R² = 0.75, RMSE = 0.43) at 75 Days After Planting (DAP). Model performances were observed to be lowest at early growth stages (15–30 DAP), however, it improved significantly from mid to late growth stages (45–90 DAP). The findings highlight the significance of UAV-acquired data coupled with machine learning approaches for non-destructive nitrogen flavanol estimation, which can immensely contribute to improved real-time crop growth monitoring.
Keywords:
UAV
; multispectral remote sensing
; nitrogen
; Mentha arvenis
; machine learning
; precision agriculture
1. Introduction
Crop growth monitoring is essential for maintaining agricultural productivity and food security. Crop monitoring using the traditional methods rely heavily upon in-field measurements and laboratory analyses to assess crop health and nutrient uptake during its growth phases for prediction of crop yield and productivity [1]. Nitrogen plays a crucial role during the plant growth as it is a key driver responsible for the photosynthetic and nutrient uptake process in the plants [2]On one-hand, the availability of nitrogen in small quantities weakens the photosynthetic efficiency of the plant, which reduces the biomass and effects the overall plant health, whereas on the other side, excessive nitrogen application often leads to degradation of the soil health, contamination of water resources, and also contribute to greenhouse gas emissions over long time [3].
Traditionally nitrogen estimation in crops is done using the destructive methods like Kjeldahl method and Dumas combustion method [4]. These methods are labour-intensive and hence unsuitable for deployment at a large scale to provide hyperlocal advisories on nitrogen status during the crop growth stages, and often leading to application of either low or excess dosage of fertilizer application by the farmer in his fields leading to adoption of unsustainable practises[5]. Nowadays, advancements in sensor technologies have led to the development of various non-destructive devices like MPM-100 and Dualex for crop nitrogen flavanol assessment during its growth[6,7]. These devices derive the Nitrogen Flavanol Index (NFI), which has also referred as (NBI) and is mathematically represented as the ratio of chlorophyll content to flavonol content in the plant leaf[8].
As, NFI is directly proportional to chlorophyll content and inversely proportional to flavanol content in the plant leaf, hence it serves as a robust indicator of plant nitrogen status. As compared to chlorophyll or flavonol-based measurements alone, NFI offers greater accuracy and reduced sensitivity to phenological variations, making it a more reliable metric for nitrogen assessment [9]. Additionally, [10]validated the efficacy of NBI as an estimator of leaf nitrogen content (LNC), demonstrating its strong agreement with standard chemical methods such as Dumas and Kjeldahl, with a root mean square error (RMSE) of less than 2 mg N g⁻¹ dry weight. Further, [11] reported a significant correlation between NBI and critical agronomic parameters, including LNC, shoot nitrogen accumulation, and crop yield, reinforcing its potential for real-time nitrogen monitoring and precision nutrient management.
However, despite its advantages, the application of NFI remains constrained by its reliance on localized, point-based measurements, limiting its capacity for field-scale nitrogen variability assessment. Hence, to overcome these spatial limitations, MPM-100, which provides point-based leaf NFI can be coupled with the data acquired using the multispectral sensors mounted on Unmanned Aerial Vehicles (UAVs) are being used along with machine learning models for large-scale, non-destructive crop monitoring[12]. This system can help in the capture of high-resolution spatial data that can enable the assessment of plant health, growth dynamics, and nutrient status across extensive agricultural landscapes.
Multispectral sensing techniques leverage vegetation reflectance characteristics across multiple spectral bands to compute vegetation indices (VIs) such as the Normalized Difference Vegetation Index (NDVI), Normalized Difference Red Edge Index (NDRE), Soil-Adjusted Vegetation Index (SAVI), and Difference Vegetation Index (DVI). These indices have been widely employed by researchers across the world to estimate nitrogen content, chlorophyll levels, and biomass accumulation [12,13,14,15]. Machine learning (ML) has demonstrated remarkable efficacy in handling complex, non-linear relationships within multivariate datasets, making it a powerful tool for agricultural data analysis and predictive modeling [16] By leveraging spectral data and advanced computational techniques, ML-driven models can facilitate precise, spatially continuous predictions of nitrogen status, ultimately improving real-time crop monitoring and site-specific nitrogen management [17]
Numerous studies have explored the potential of multispectral and hyperspectral sensors for predicting NFI, underscoring its strong association with vegetation indices that characterize crop growth status. A significant correlation was identified between the Transformed Chlorophyll Absorption in Reflectance Index (TCARI) and the Optimized Soil-Adjusted Vegetation Index (OSAVI) in hyperspectral NBI estimation using field observation and airborne imagery in maize [18]. Dark Green Color Index (DGCI) could explain 77.1% of NBI variability, highlighting its predictive potential [19]. Machine learning techniques with hyperspectral data can enhance NBI prediction accuracy [20].
This study aims to develop machine learning models for predicting NFI across different growth stages of menthol mint based on its multispectral reflectance characteristics. As, NFI estimation have not yet been investigated in aromatic crops such as menthol mint, necessitating studies to refine the selection of optimal spectral bands and vegetation indices for improved prediction accuracy of NFI in menthol mint[21]. Thus, this study aims to evaluate and compare the performance of different machine learning algorithms in predicting NFI across various growth stages of menthol mint, enabling a more precise assessment of nitrogen dynamics during crop development stages. This approach will not only contribute to optimizing nitrogen management strategies during the crop growth stages but also enhance the productivity and sustainability in menthol mint.
2. Materials and Methods
2.1. Study Area
Figure 1: Experimental Field of CSIR, Central Institute of Medicinal and Aromatic Plant
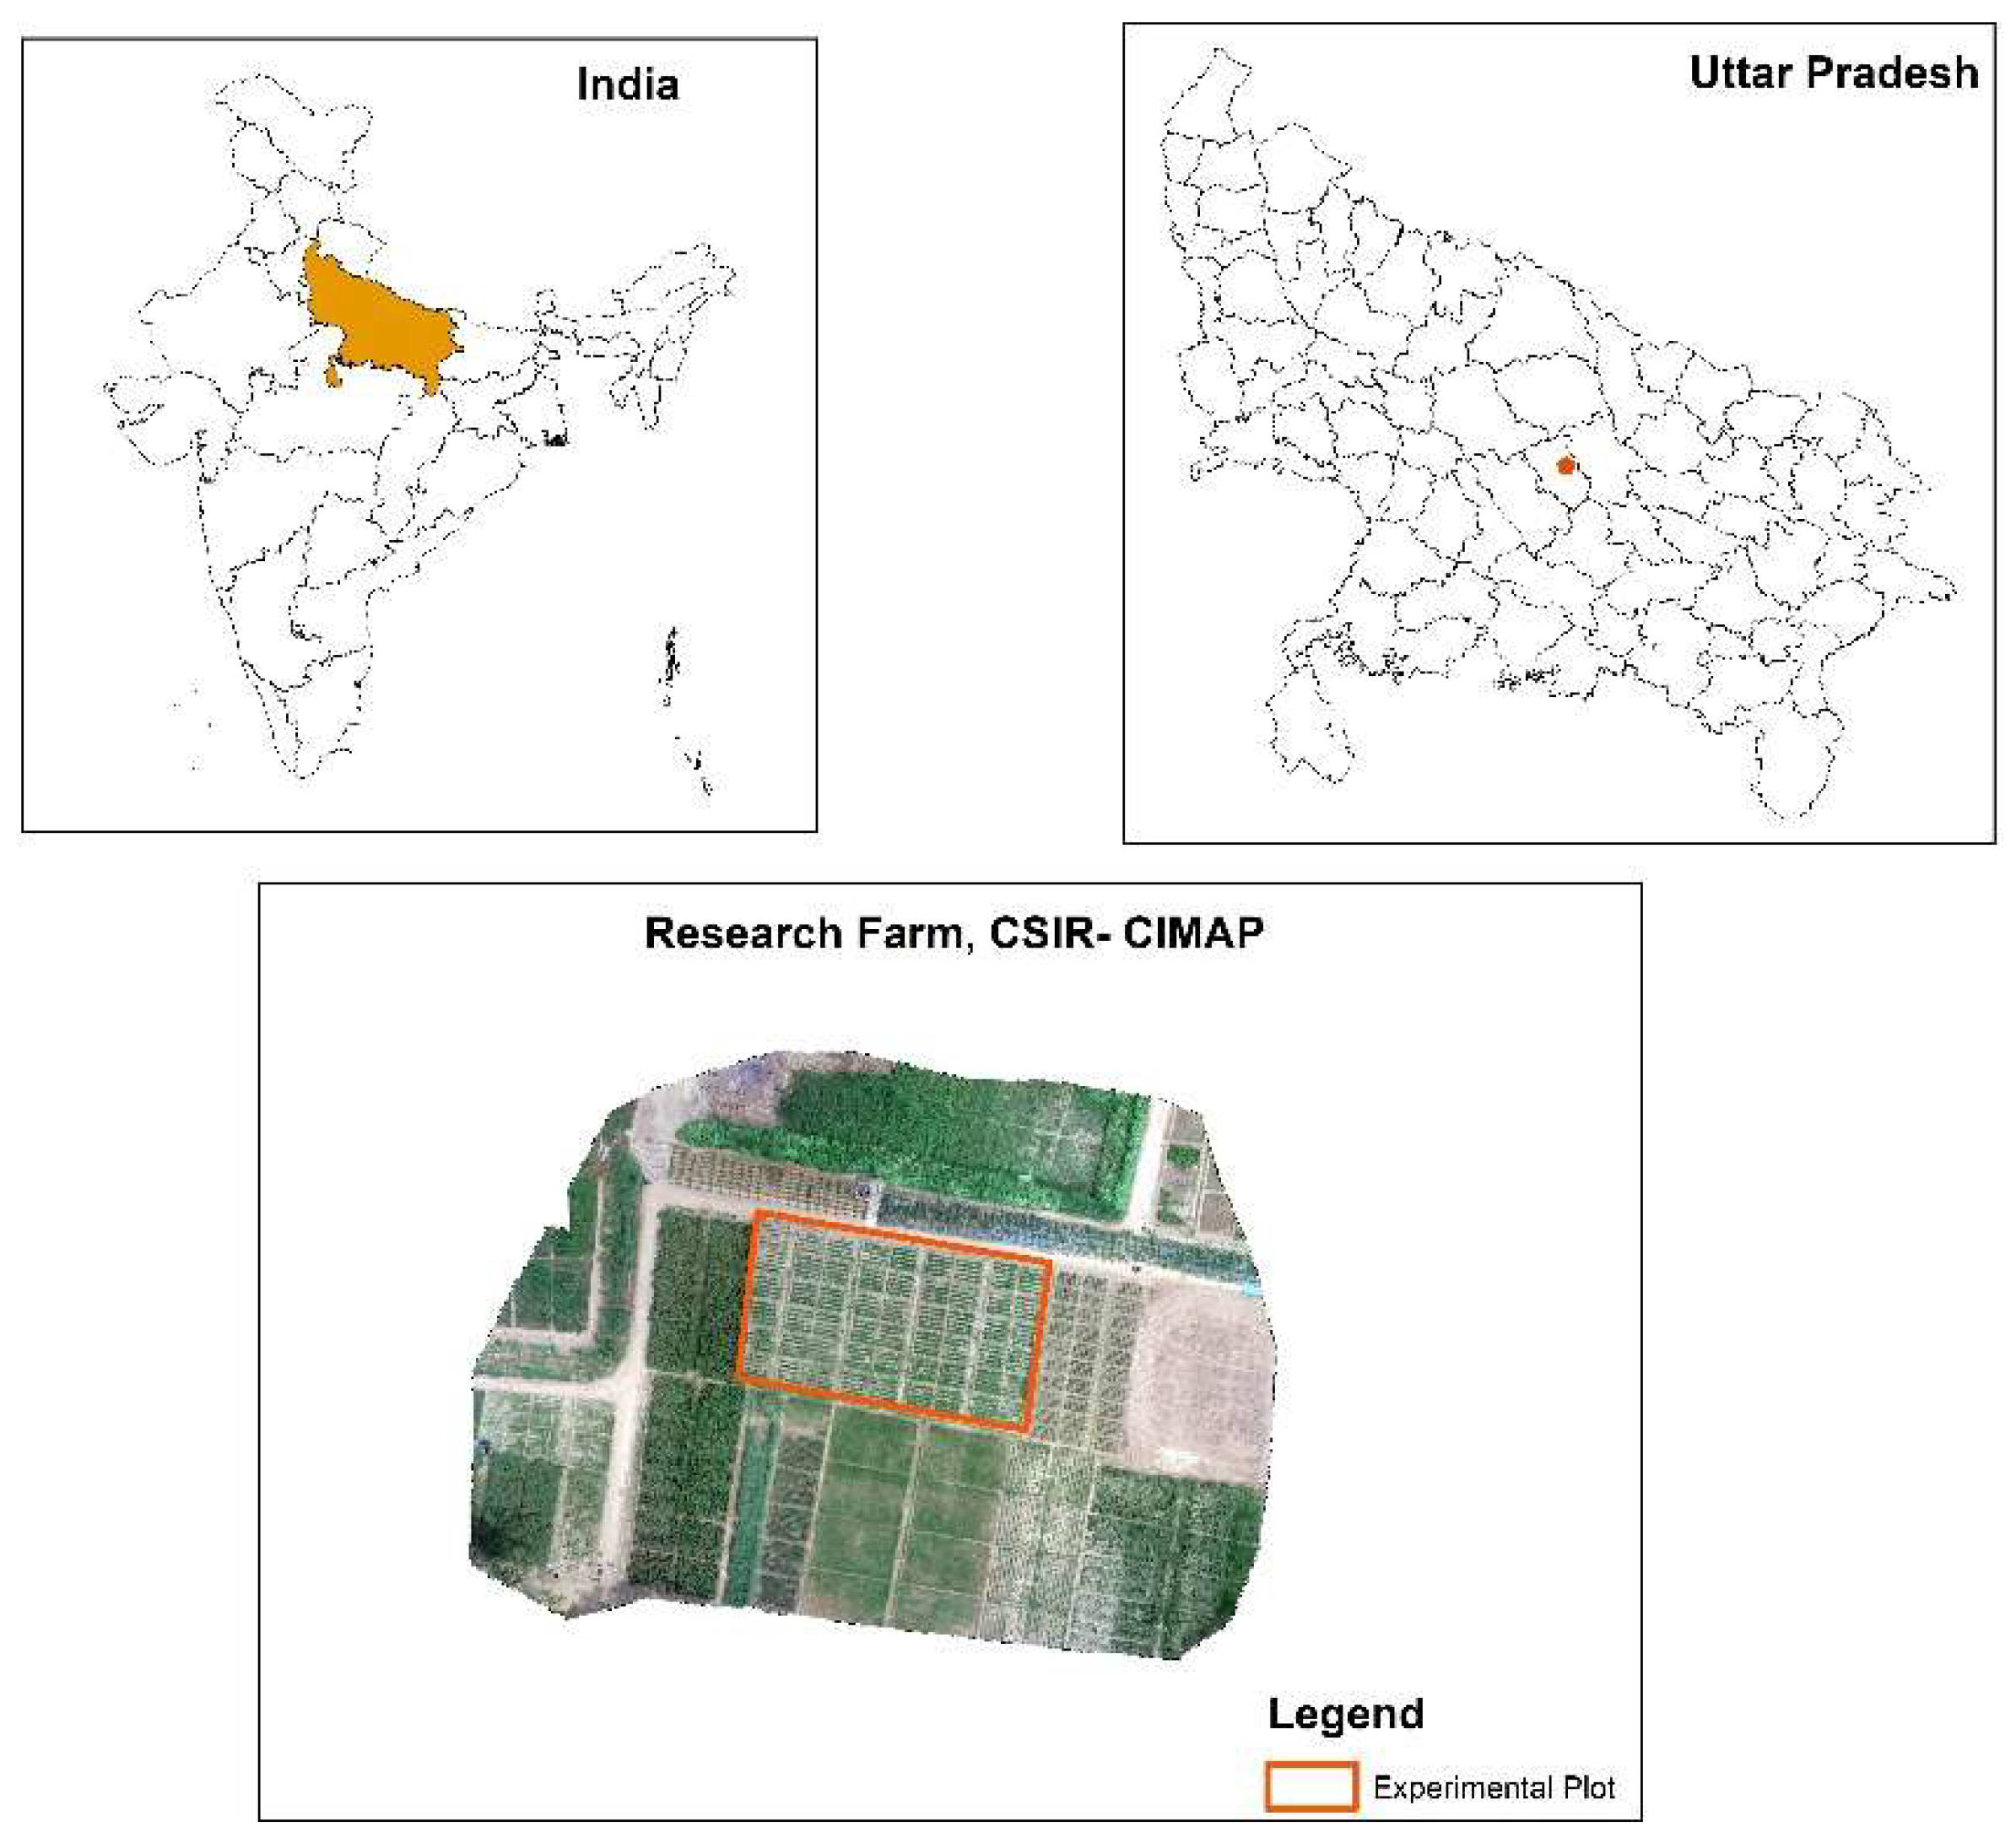
The field experiment was conducted between March and June 2022 at the CSIR-Central Institute of Medicinal and Aromatic Plants experimental farm in Lucknow, situated at 26.5º N latitude and 80.5º E longitude, with an elevation of approximately 120 meters above sea level (figure 1). The area is characterized by a semi-arid subtropical climate, with hot summers and cold winters.
2.2. UAV Data Acquisition
Aerial data acquisition was performed using a DJI Matrice 200 UAV equipped with a MicaSense Altum multispectral sensor and a downwelling Light Sensor (DLS). The Altum sensor captures imagery across five discrete spectral bands: blue (475 nm), green (560 nm), red (668 nm), red edge (717 nm), and near-infrared (842 nm). All flights were conducted between 10:00 AM and 12:00 PM local time to ensure stable solar illumination and minimize shadow effects. Flights were conducted at a constant altitude of 30 metres above ground level. A single-grid flight plan was created using Pix4Dcapture, maintaining 80% forward and lateral overlap to ensure complete coverage and facilitate accurate image stitching and 3D reconstruction. Radiometric calibration was performed using MicaSense reflectance calibration panels, imaged immediately before and after each flight.Figure 2 shows the methodology flow of the data acquisition, processing and modeling of NFI prediction.
Figure 2.
Methodology for NFI estimation.
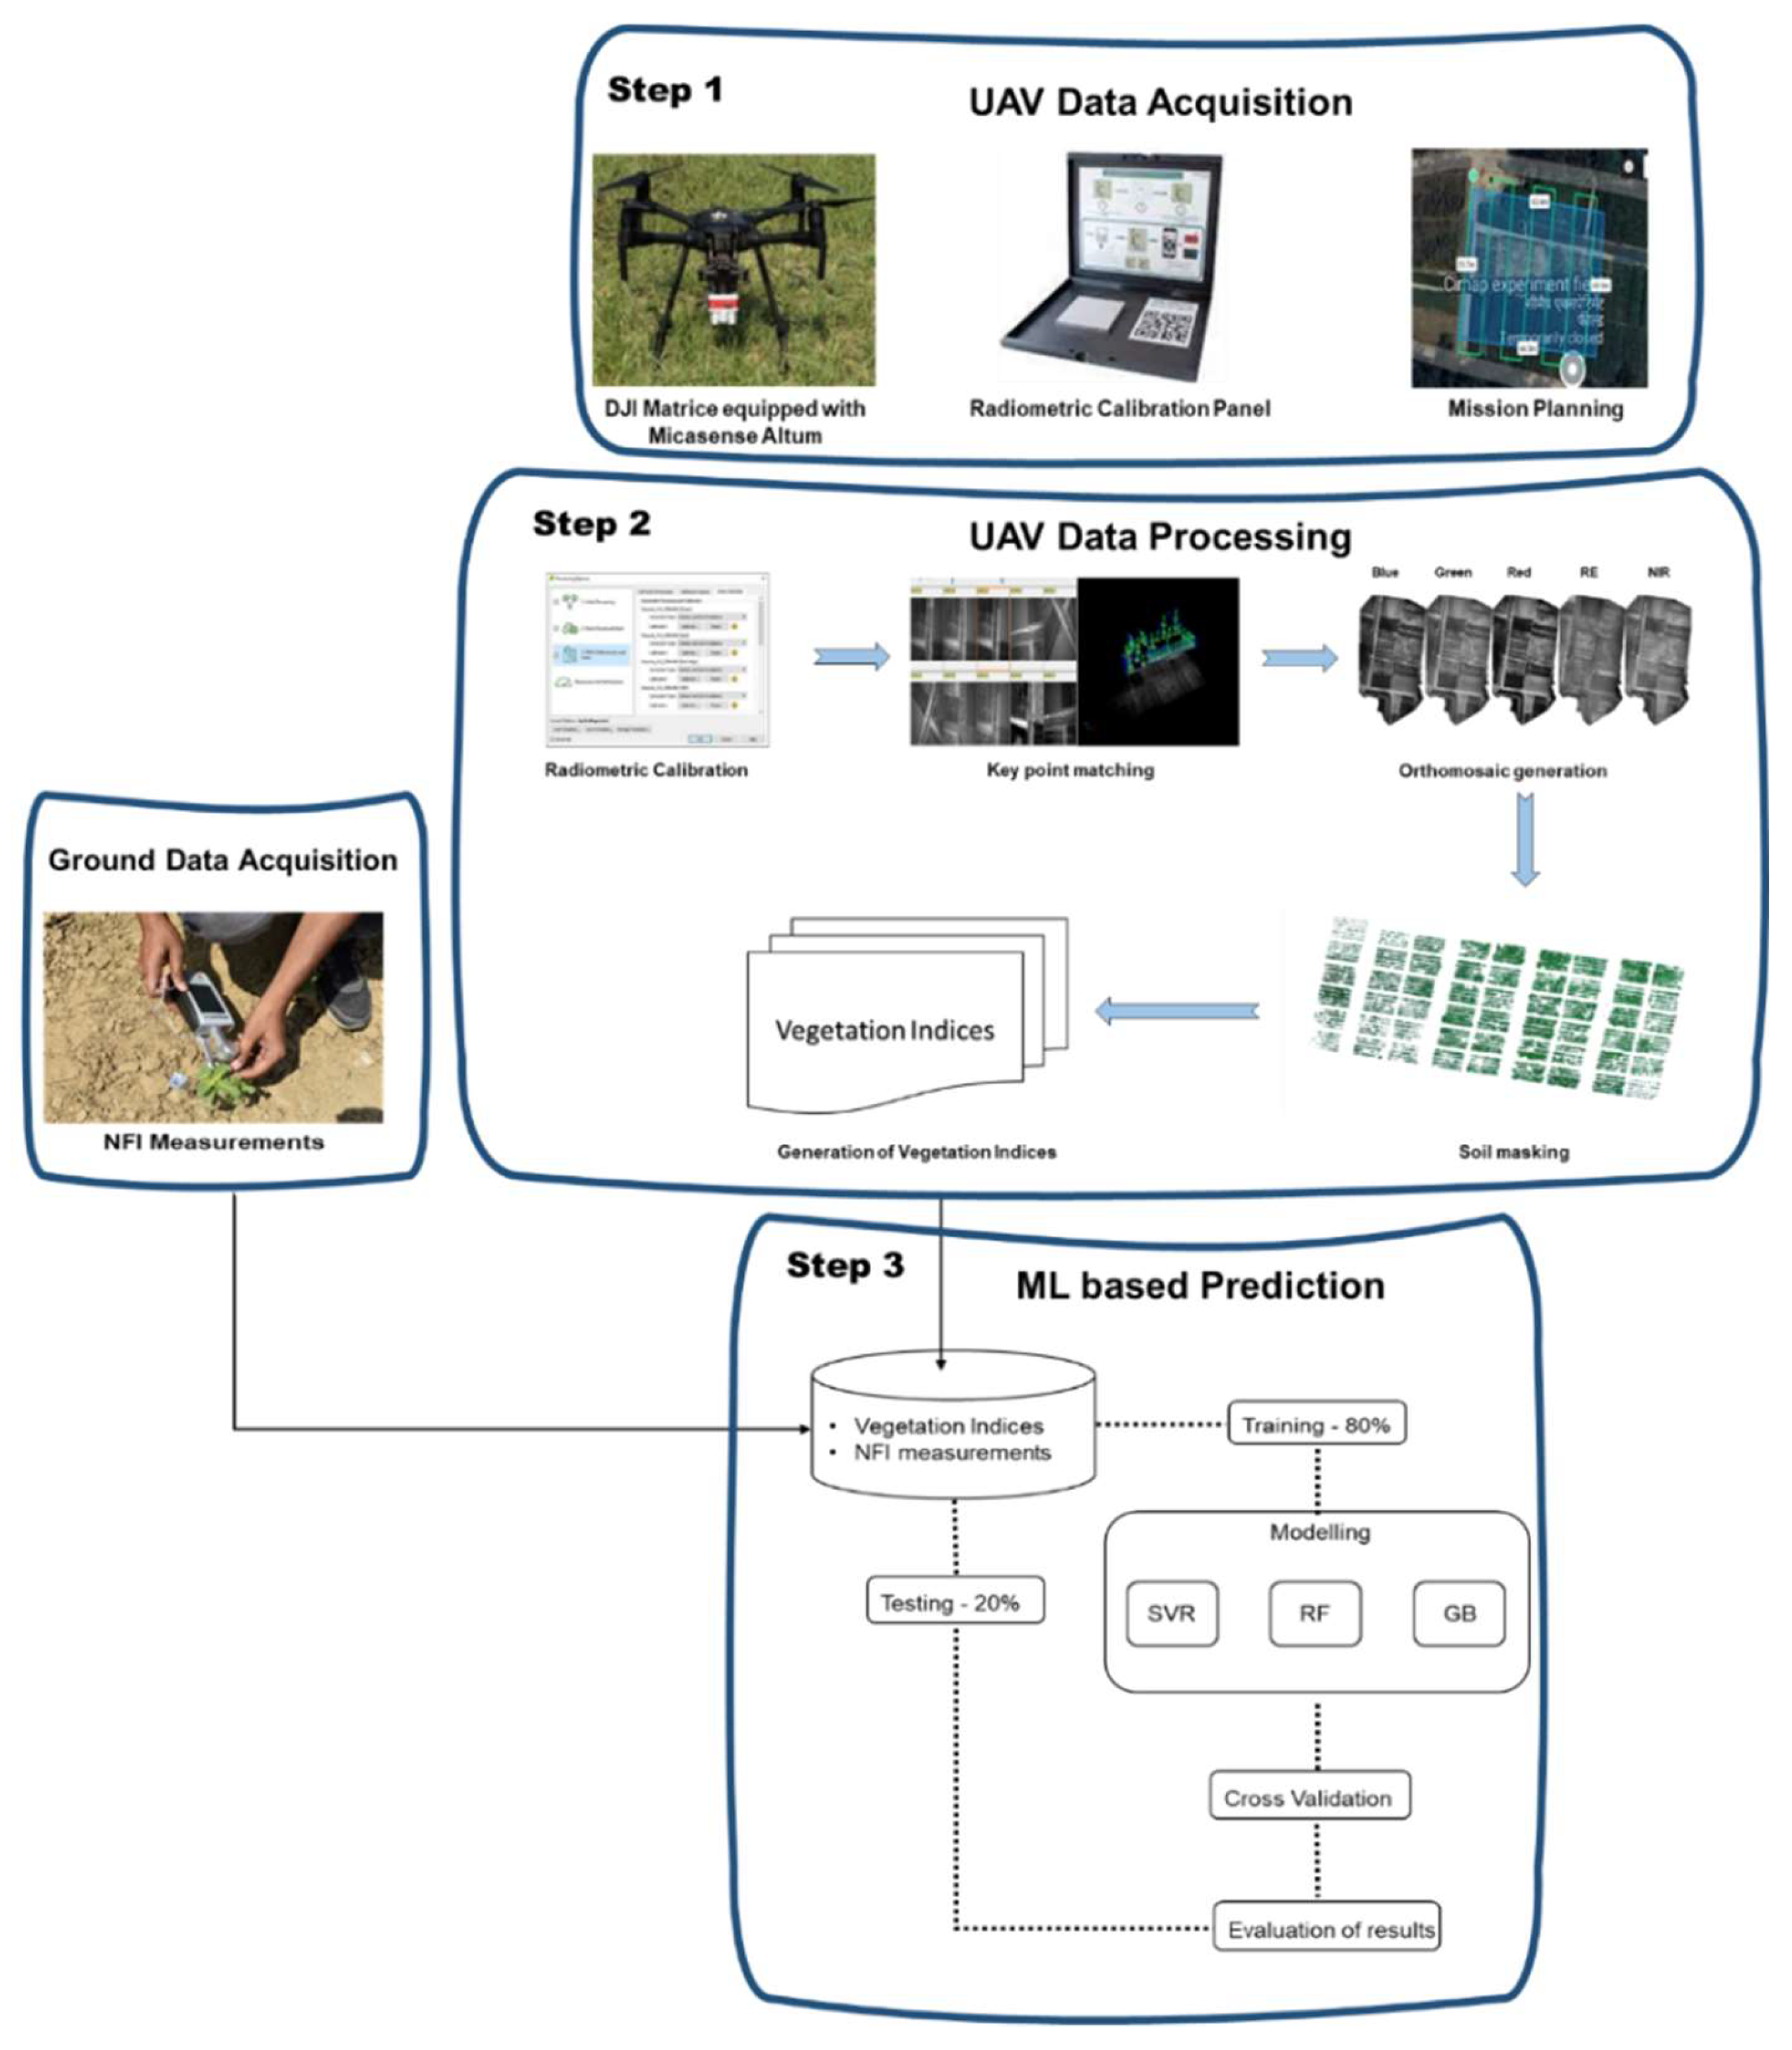
To capture the temporal dynamics of the Nitrogen Flavonol Index (NFI) across the growth cycle of Mentha arvensis, six UAV flights were conducted at regular 15-day intervals. (Table 2) provides the dates of each UAV mission along with the corresponding days after planting (DAP), spanning from 15 to 90 DAP. This temporal resolution enabled the assessment of nitrogen variability at critical crop growth stages.
2.3. UAV Data Processing
Post-flight image processing was carried out using Pix4D Mapper (Pix4D S.A., Switzerland). The raw multispectral imagery was first radiometrically calibrated using the reflectance calibration panel images and DLS metadata. This step corrected for variations in ambient lighting and sensor-specific response. Subsequently, structure-from-motion (SfM) algorithms were applied to align the images and generate a dense point cloud. High-resolution orthomosaics for each band were then generated for each spectral band by mosaicking the aligned images.
The resulting orthomosaics were used to compute the Excess Green Index (ExG), A threshold value of 0.1 was applied to the ExG index to discriminate between canopy and non-vegetative background. A binary mask was created which used to mask the orthomosiac to only keep canopy pixels for further analysis.
2.4. Calculation of Vegetation Indices
A total of 25 vegetation indices (VIs) associated with chlorophyll content and nitrogen status were computed from UAV-based multispectral imagery (table 3). These indices were selected based on their relevance to vegetation monitoring and validation in previous studies. All VIs were calculated using canopy-masked orthomosaics to exclude non-vegetative areas, ensuring index values represented only crop pixels. The indices were computed in ArcGIS Pro, and mean VI values for each experimental plot were extracted using the "Zonal Statistics as Table" tool for subsequent analysis.
2.5. Ground Truth Data Collection
Ground truth data for Nitrogen Flavonol Index (NFI) was collected immediately after UAV image acquisition across all 56 experimental plots. In each plot, ten plants were randomly selected to ensure spatial representativeness. For consistency, the third fully expanded leaf from the apical meristem was chosen from each plant, minimizing physiological variation within and between plants. NFI measurements were obtained using a handheld portable sensor (MPM-100,ADC Bioscientific Ltd., UK). The ten measurements per plot were averaged to produce a single representative NFI value, which was later used for validating UAV-derived vegetation indices and for model calibration.
2.6. Machine Learning Model Development
To predict the Nitrogen Flavonol Index (NFI), three supervised machine learning algorithms were implemented: Support Vector Regression, Random Forest Regression, and Gradient Boosting Regression (GBR). These algorithms were selected based on their proven effectiveness in modeling complex, nonlinear relationships, particularly in remote sensing and agricultural research. The model development workflow included feature selection, model training, hyper-parameter tuning, and performance evaluation to ensure high predictive accuracy and reliability.
2.6.1. Support Vector Regression
SVR is a machine learning technique based on Support Vector Machines principles, designed for regression tasks. Unlike traditional regression models that minimize the sum of squared errors, SVR seeks to find an optimal function that predicts target values within a specified ε-tolerance margin. The core objective is to identify a hyperplane that best fits the data while maintaining robustness against noise and outliers. SVR utilizes kernel functions, such as the Radial Basis Function (RBF), to map input features into higher-dimensional spaces, thereby capturing complex nonlinear relationships between spectral indices and NFI values. Key hyper-parameters, including the regularization parameter (C), the ε-insensitive loss function, and the kernel type, were optimized using grid search and cross-validation techniques to maximize model accuracy.
2.6.2. Random Forest Regression
Random Forest is an ensemble learning method that constructs multiple decision trees and aggregates their outputs to improve prediction accuracy and mitigate overfitting. Each decision tree is trained on a random subset of the data using bootstrap aggregation (bagging). Final predictions are obtained by averaging the outputs of all trees, resulting in a robust and stable regression model. RF is particularly effective for high-dimensional datasets involving multiple vegetation indices and spectral features. Furthermore, RF provides an inherent measure of feature importance, allowing the identification of the most influential predictors for NFI estimation. Hyperparameters, including the number of trees (n_estimators), maximum tree depth (max_depth), and minimum samples per split (min_samples_split), were fine-tuned using grid search and k-fold cross-validation to achieve optimal model performance.
2.6.3. Gradient Boosting Regression
Gradient Boosting Regression is another ensemble learning approach that builds models sequentially, where each subsequent tree focuses on correcting the residual errors of previous trees. Unlike RF, which builds independent trees, GBR applies gradient descent optimization to minimize the prediction error iteratively. GBR assigns higher weights to misclassified samples in each iteration, making it particularly effective for datasets with subtle variations in nitrogen content. However, GBR is prone to overfitting if not properly regularized. To prevent overfitting, key hyper-parameters such as the learning rate (shrinkage), number of estimators, and maximum depth were optimized using cross-validation. A learning rate between 0.01 and 0.1 provided the best trade-off between bias and variance.
2.6.4. Selection of Predictor Variables
Strong Pearson correlations were observed between NFI and various vegetation indices. Since these indices are derived from common spectral bands, multi-collinearity was detected among predictors. High multi-collinearity can introduce redundancy, increase model complexity, and degrade regression performance.
To address this, Recursive Feature Elimination (RFE) was employed to select an optimal subset of predictors. RFE iteratively builds models, ranks predictors based on their importance (using the Gini criterion within a random forest framework), and systematically removes the least important variables. Repeated tenfold cross-validation was used during RFE to ensure robustness. The final subset of predictors was determined based on the iteration that minimized cross-validation error, balancing predictive accuracy and model efficiency.
2.6.5. Model Performance and Evaluation
The performance of SVR, RF, and GBR models in estimating NFI was evaluated using three statistical metrics: the coefficient of determination (R²) and root mean square error (RMSE), Models achieving higher R² values and lower RMSE were considered more accurate and reliable. The best-performing model was selected based on achieving the lowest RMSE and a high R², indicating strong predictive capacity for NFI estimation in Mentha arvensis.
3. Results
3.1. Variation in NFI Content During Different Growth Stage
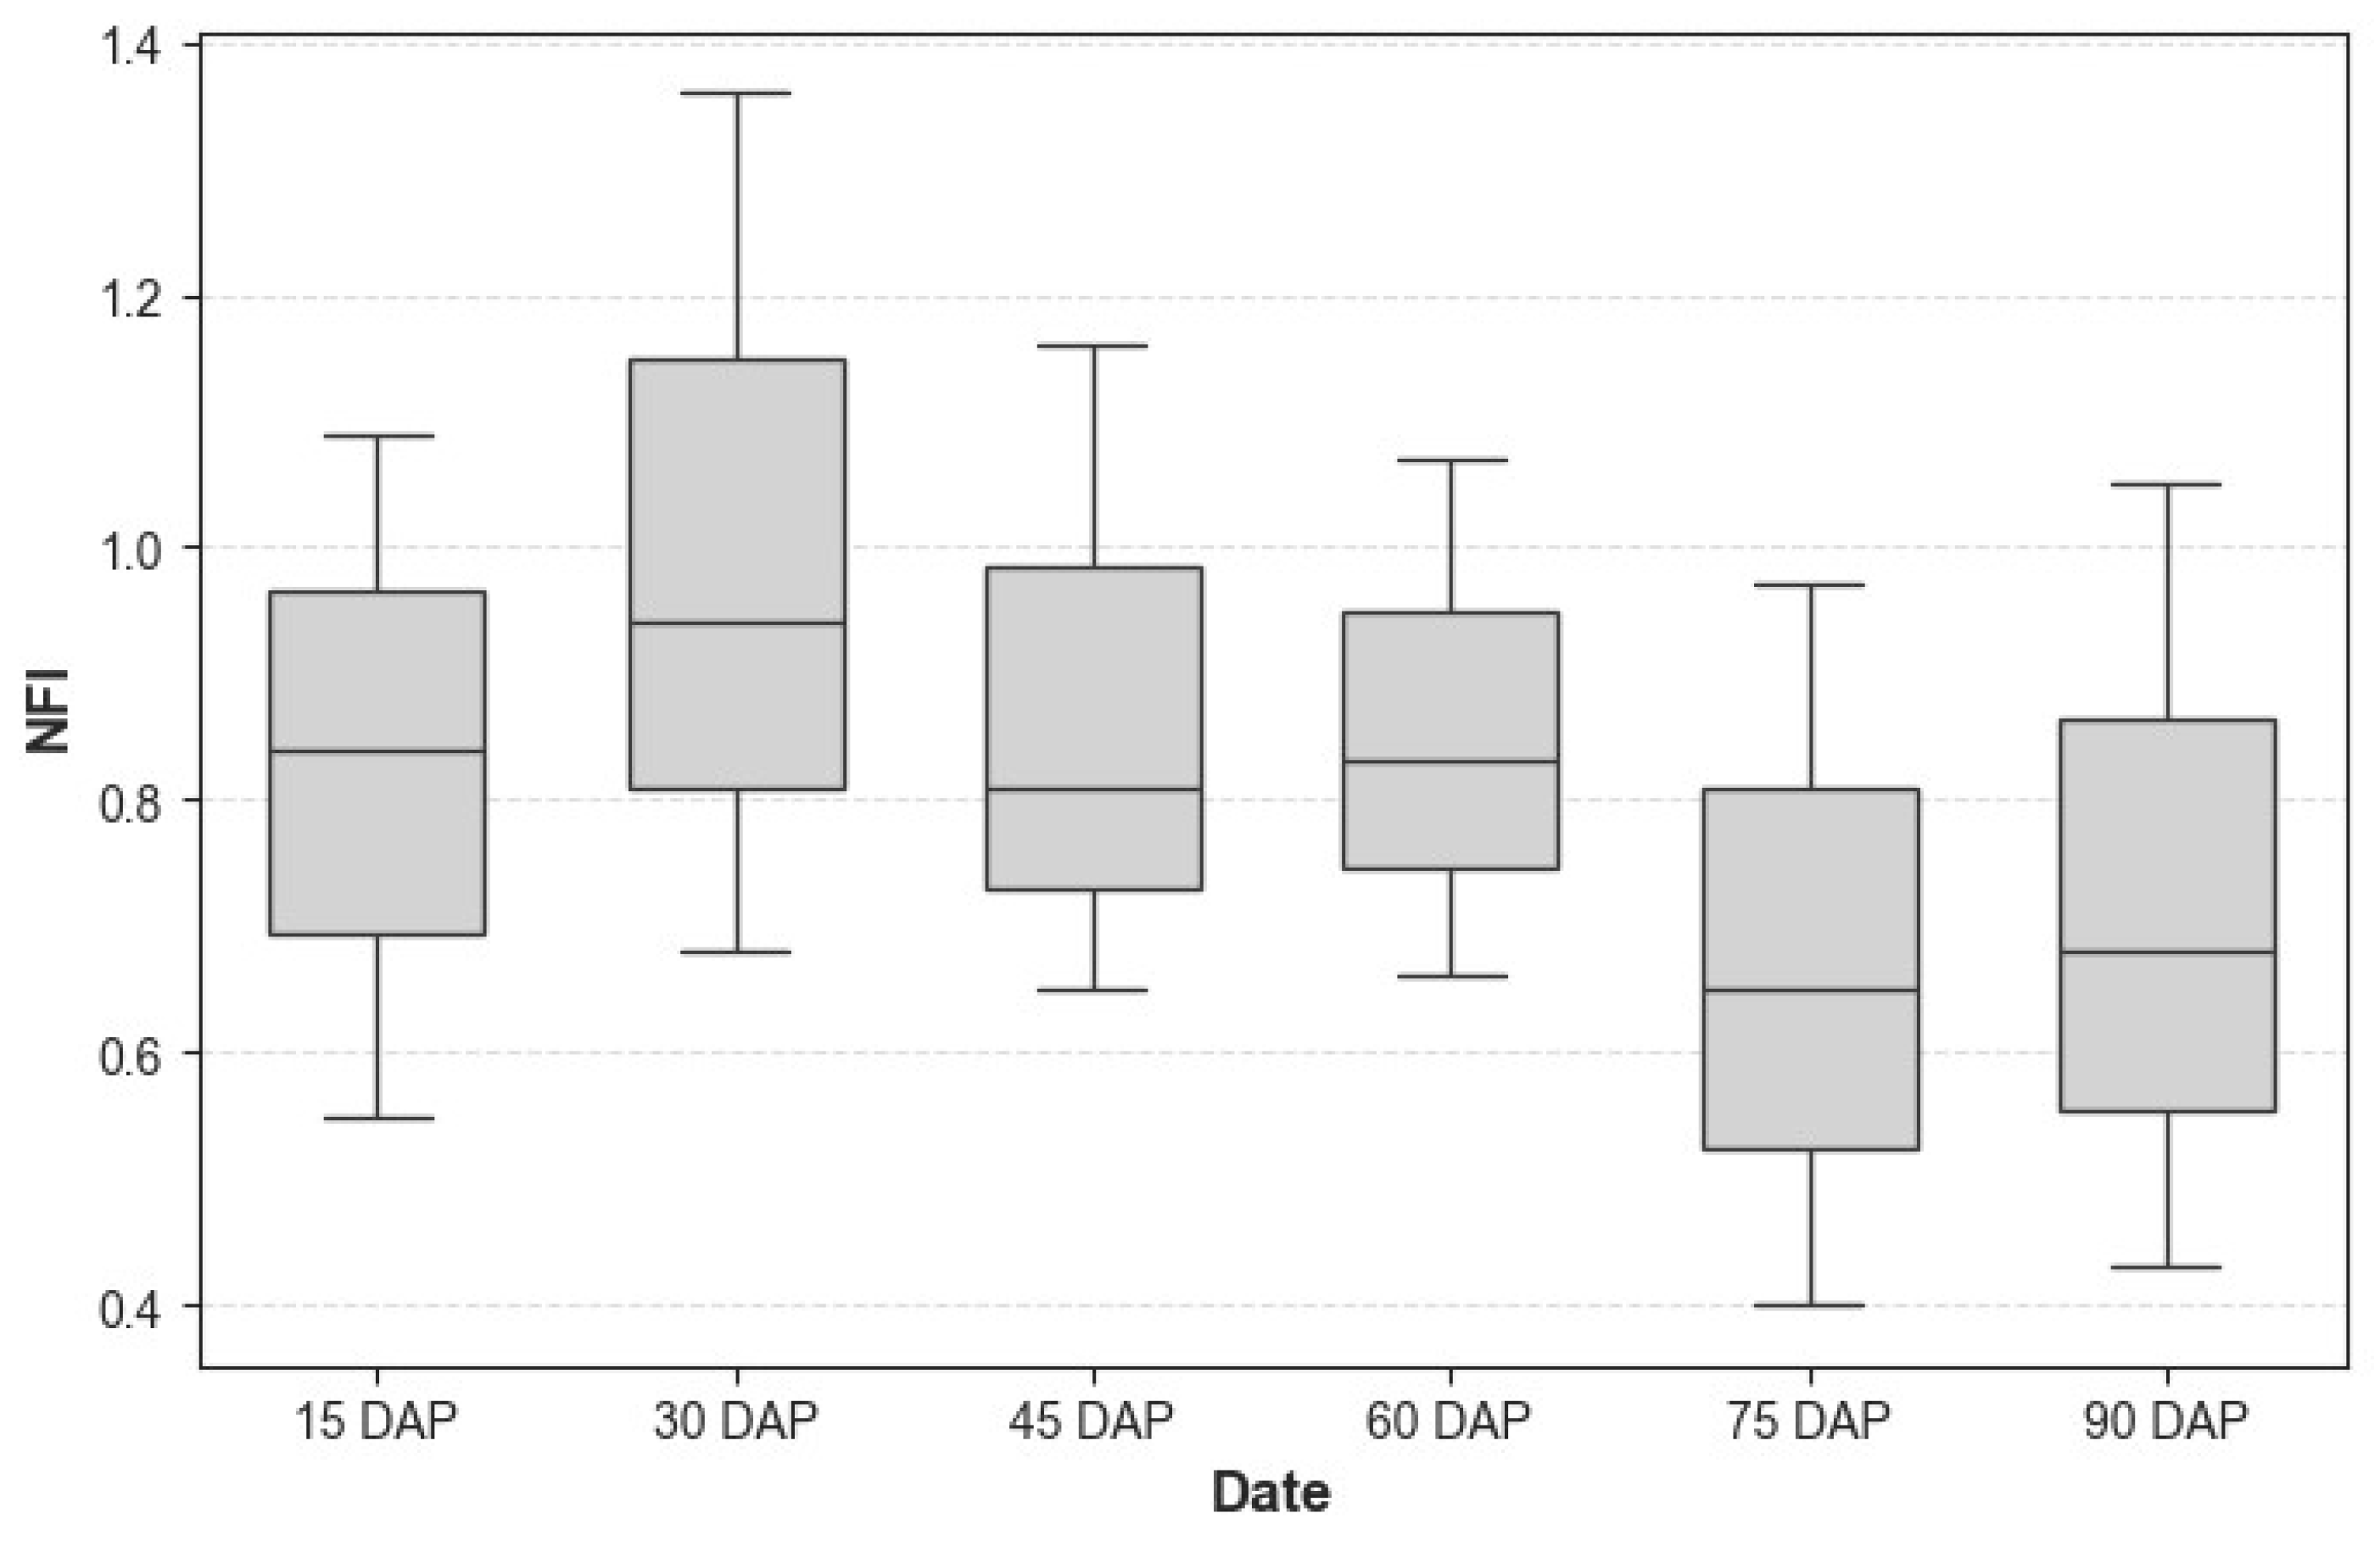
The Nitrogen Flavonol Index (NFI) varied significantly across the growth stages of Mentha arvensis. Figure 2 shows the variation at different growth stage, at 15 DAP, NFI values were moderate, reflecting limited nitrogen uptake during early plant establishment. By 30 DAP, NFI reached its peak, indicating vigorous vegetative growth and high nitrogen demand. After 45 DAP, NFI values began to decline as the plant transitioned from vegetative to reproductive stages, shifting nitrogen allocation toward biomass and reproductive structures. Between 60 and 75 DAP, NFI stabilized, suggesting reduced nitrogen uptake. At 90 DAP, NFI reached its lowest level, consistent with the onset of senescence.
Figure 2.
Box plot showing NFI variation across different Days After Plantation (DAP).
3.2. Feature Selection
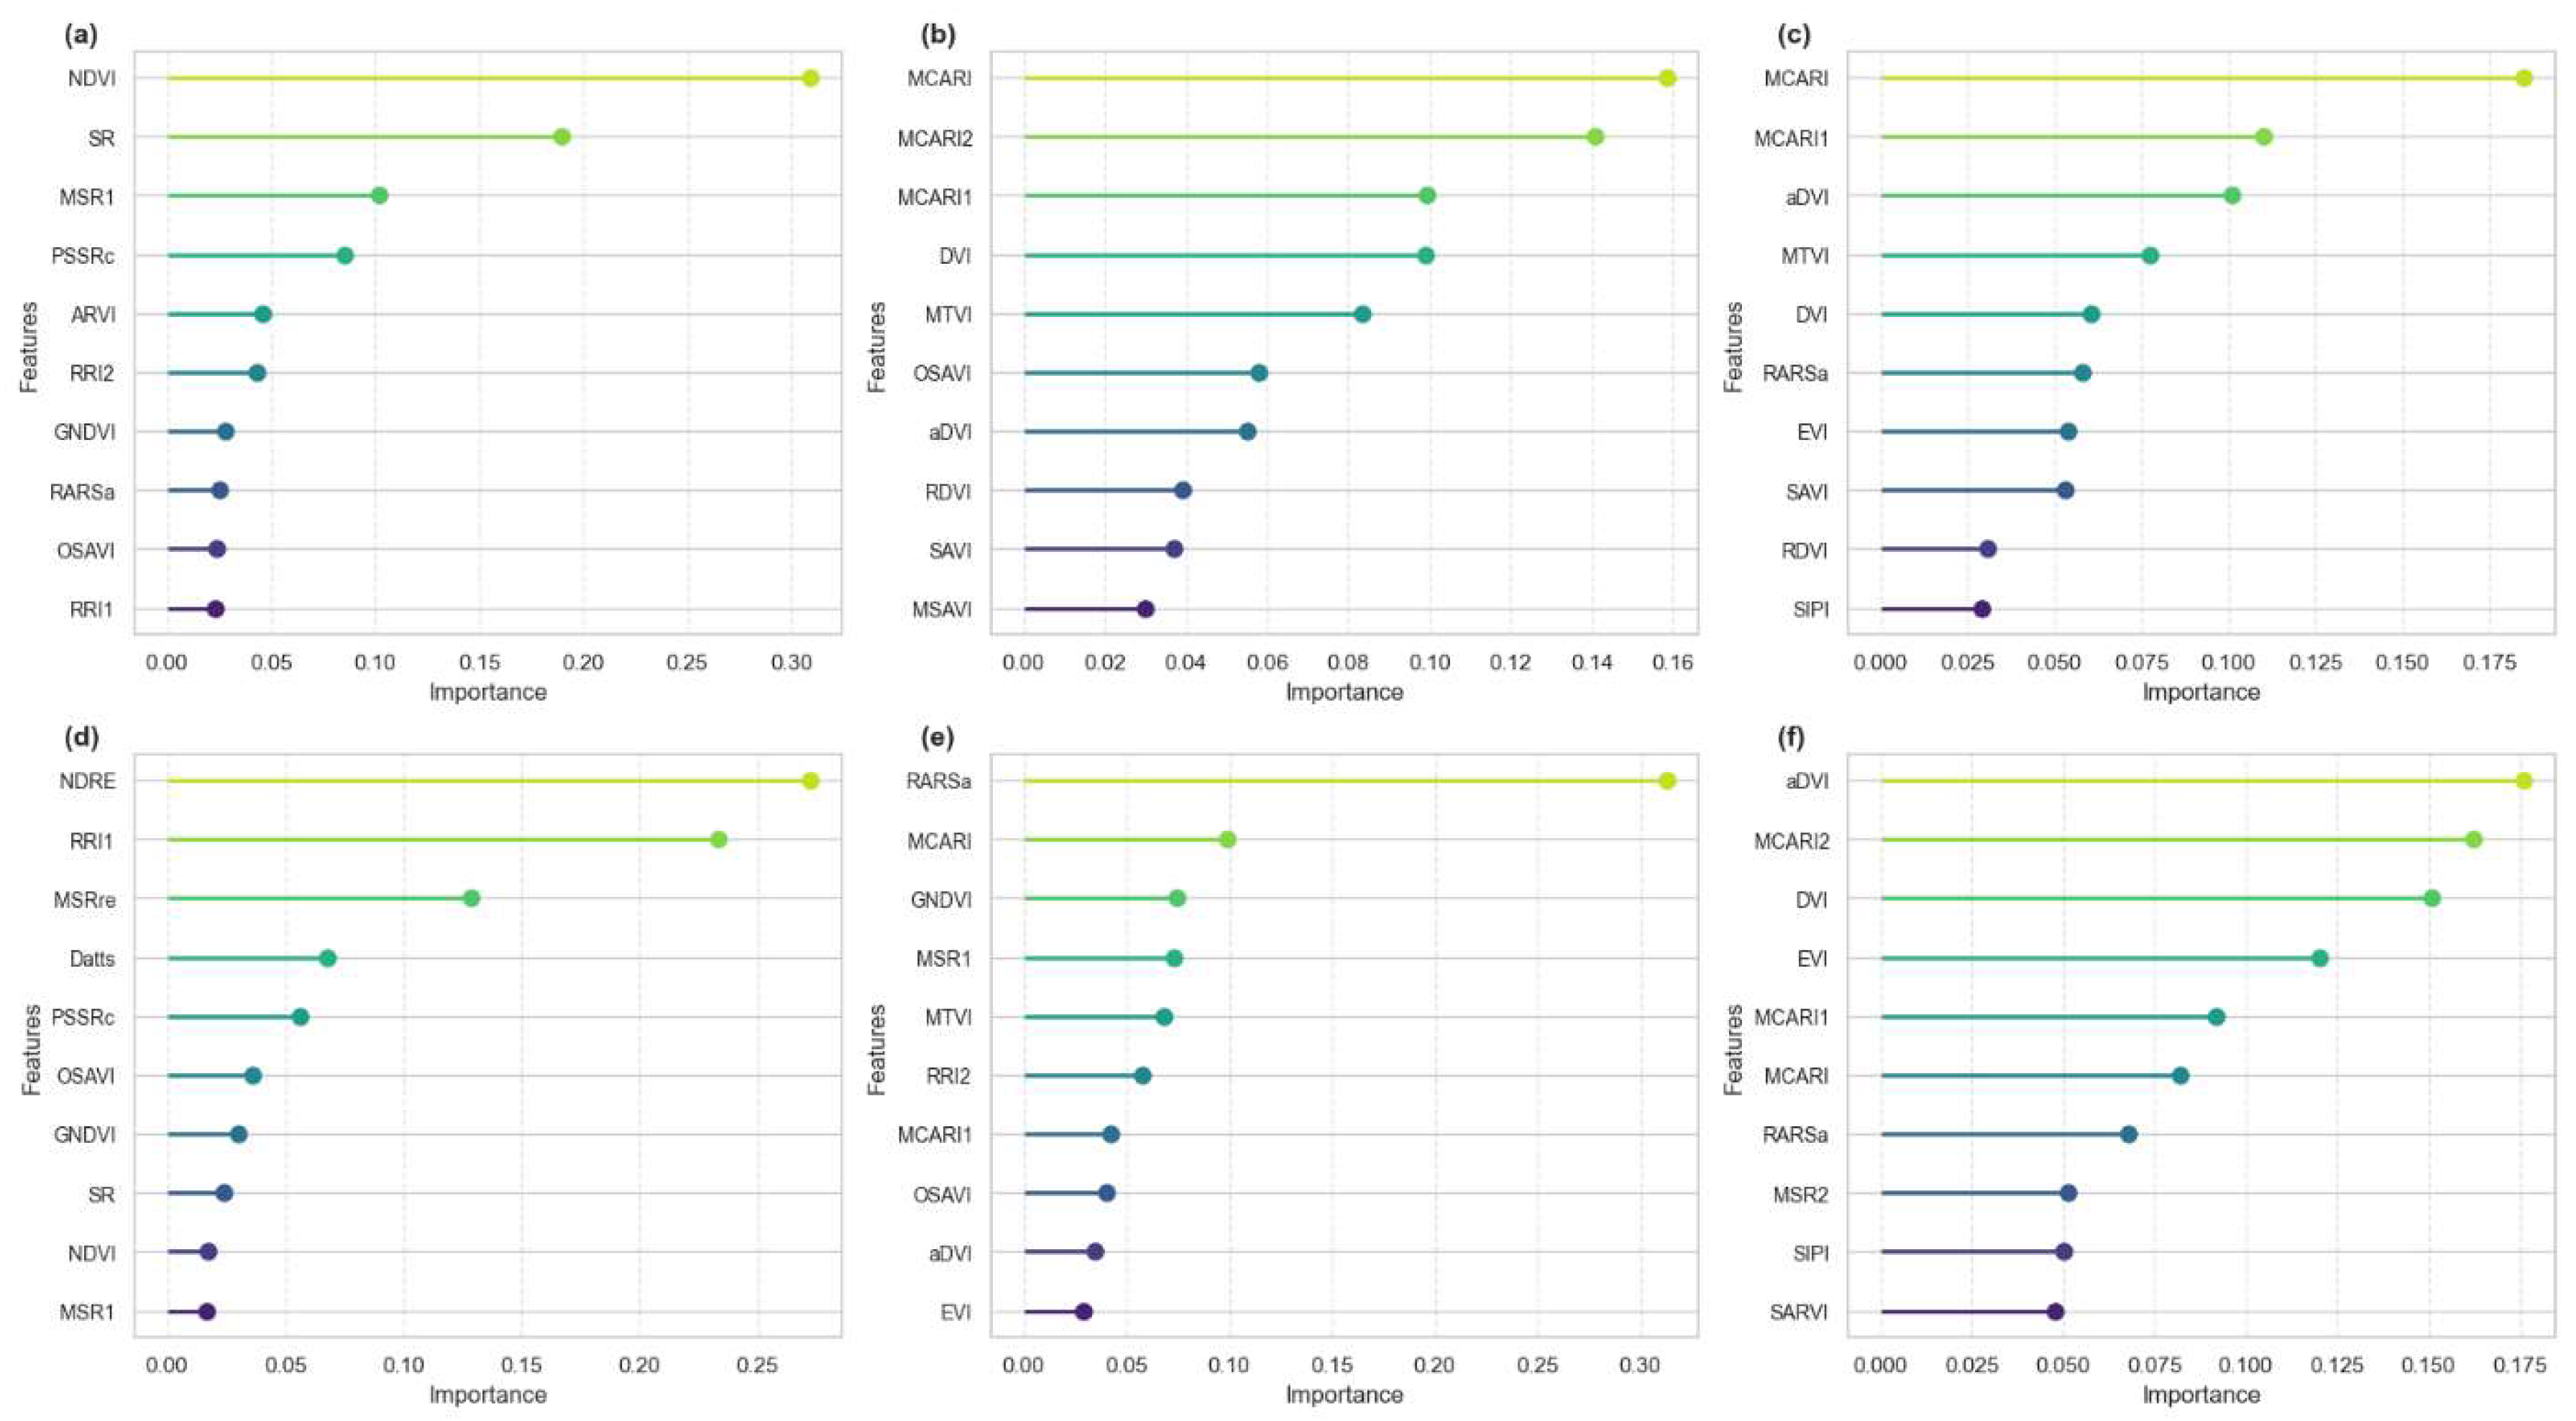
Recursive Feature Elimination (RFE) was conducted at individual growth stages 15, 30, 45, 60, 75, and 90 DAP as well as on a combined dataset encompassing all time points to identify the most influential vegetation indices for estimating Nitrogen Flavonol Index (NFI). At 15 DAP, NDVI exhibited the highest importance, followed by SR and MSR1. By 30 DAP, MCARI, M CARI2, and MCARI1 emerged as the most significant indices. At 45 DAP, MCARI indices continued to be the most influential, with increasing contributions from RARS. By 60 DAP, NDRE surpassed MCARI and NDVI. At 75 DAP, RARS3 exhibited the highest feature importance, followed by MCARI and GNDVI indices. By 90 DAP, aDVI and MCARI contributed most, while EVI, MCARI3, and MTVI gained prominence.
Figure 3.
Feature importance based on RFE in different growth stage a) 15 DAP, b) 30 DAP, c) 45 DAP, d) 60 DAP, e) 75 DAP, f) 90 DAP.
Figure 3.
Feature importance based on RFE in different growth stage a) 15 DAP, b) 30 DAP, c) 45 DAP, d) 60 DAP, e) 75 DAP, f) 90 DAP.
3.3. Model Performance and Evaluation
The performance of Support Vector Regression, Random Forest, and Gradient Boosting models varied across different crop growth stages based on R² and RMSE values. At 15 DAP, Random Forest and Gradient Boosting achieved high training R² values of 0.90 and 0.91, respectively, but their test R² dropped to 0.70, with an RMSE of 0.51, indicating overfitting. Support Vector Regression performed more consistently with a training R² of 0.74, a test R² of 0.73, and RMSE values of 0.51 for training and 0.48 for testing. At 30 DAP, Random Forest exhibited the best generalization ability with a test R² of 0.69 and RMSE of 0.51, followed by Gradient Boosting with a test R² of 0.63 and RMSE of 0.56. Support Vector Regression showed a lower test R² of 0.62 and RMSE of 0.57. At 45 DAP, Random Forest achieved the highest test R² of 0.81 with the lowest RMSE of 0.39, making it the most accurate model, while Gradient Boosting had a test R² of 0.63 and RMSE of 0.54. Support Vector Regression had the lowest test R² of 0.53 and the highest RMSE of 0.60, indicating lower predictive accuracy. At 60 DAP, Random Forest maintained strong performance with a test R² of 0.70 and RMSE of 0.66, while Gradient Boosting and Support Vector Regression had lower test R² values of 0.63 and 0.66, respectively, with RMSE values above 0.70. At 75 DAP, Random Forest remained the best-performing model with a test R² of 0.86 and the lowest RMSE of 0.32, followed by Gradient Boosting with a test R² of 0.75 and RMSE of 0.43. Support Vector Regression showed moderate accuracy with a test R² of 0.68 and RMSE of 0.50. At 90 DAP, Random Forest retained the highest test R² of 0.77 and RMSE of 0.46, whereas Gradient Boosting and Support Vector Regression exhibited lower test R² values of 0.64 and 0.53, with RMSE values of 0.57 and 0.65, respectively. These results indicate that Random Forest consistently outperformed the other models, particularly from mid to late growth stages, achieving the highest R² values and the lowest RMSE, making it the most reliable model for nitrogen estimation in crops. The performance of the models across all growth stages is summarized in Table 4, while Figure 4 presents scatter plots illustrating the relationship between predicted and actual NFI values.

Table 4.
ML models performance evaluation.
| Growth Stage | Model | Train R² | Test R² | Train RMSE | Test RMSE |
|---|---|---|---|---|---|
| 15 DAP | SVR | 0.74 | 0.73 | 0.51 | 0.48 |
| RF | 0.90 | 0.70 | 0.32 | 0.51 | |
| GB | 0.91 | 0.70 | 0.30 | 0.51 | |
| 30 DAP | SVR | 0.56 | 0.62 | 0.68 | 0.57 |
| RF | 0.77 | 0.69 | 0.48 | 0.51 | |
| GB | 0.80 | 0.63 | 0.45 | 0.56 | |
| 45 DAP | SVR | 0.54 | 0.53 | 0.70 | 0.60 |
| RF | 0.85 | 0.81 | 0.39 | 0.39 | |
| GB | 0.72 | 0.63 | 0.55 | 0.54 | |
| 60 DAP | SVR | 0.72 | 0.66 | 0.50 | 0.70 |
| RF | 0.87 | 0.70 | 0.34 | 0.66 | |
| GB | 0.91 | 0.63 | 0.28 | 0.73 | |
| 75 DAP | SVR | 0.71 | 0.68 | 0.55 | 0.50 |
| RF | 0.87 | 0.86 | 0.36 | 0.32 | |
| GB | 0.90 | 0.75 | 0.33 | 0.43 | |
| 90 DAP | SVR | 0.66 | 0.53 | 0.59 | 0.65 |
| RF | 0.83 | 0.77 | 0.42 | 0.46 | |
| GB | 0.86 | 0.64 | 0.38 | 0.57 | |
| Combined | SVR | 0.71 | 0.61 | 0.08 | 0.11 |
| RF | 0.91 | 0.70 | 0.04 | 0.09 | |
| GB | 0.89 | 0.67 | 0.05 | 0.10 |
Figure 4.
Scatter plot between predicted and actual NFI value in a) 15 DAP, b)30 DAP c) 45 DAP, d) 60 DAP, e) 75 DAP, f) 90 DAP.
Figure 4.
Scatter plot between predicted and actual NFI value in a) 15 DAP, b)30 DAP c) 45 DAP, d) 60 DAP, e) 75 DAP, f) 90 DAP.
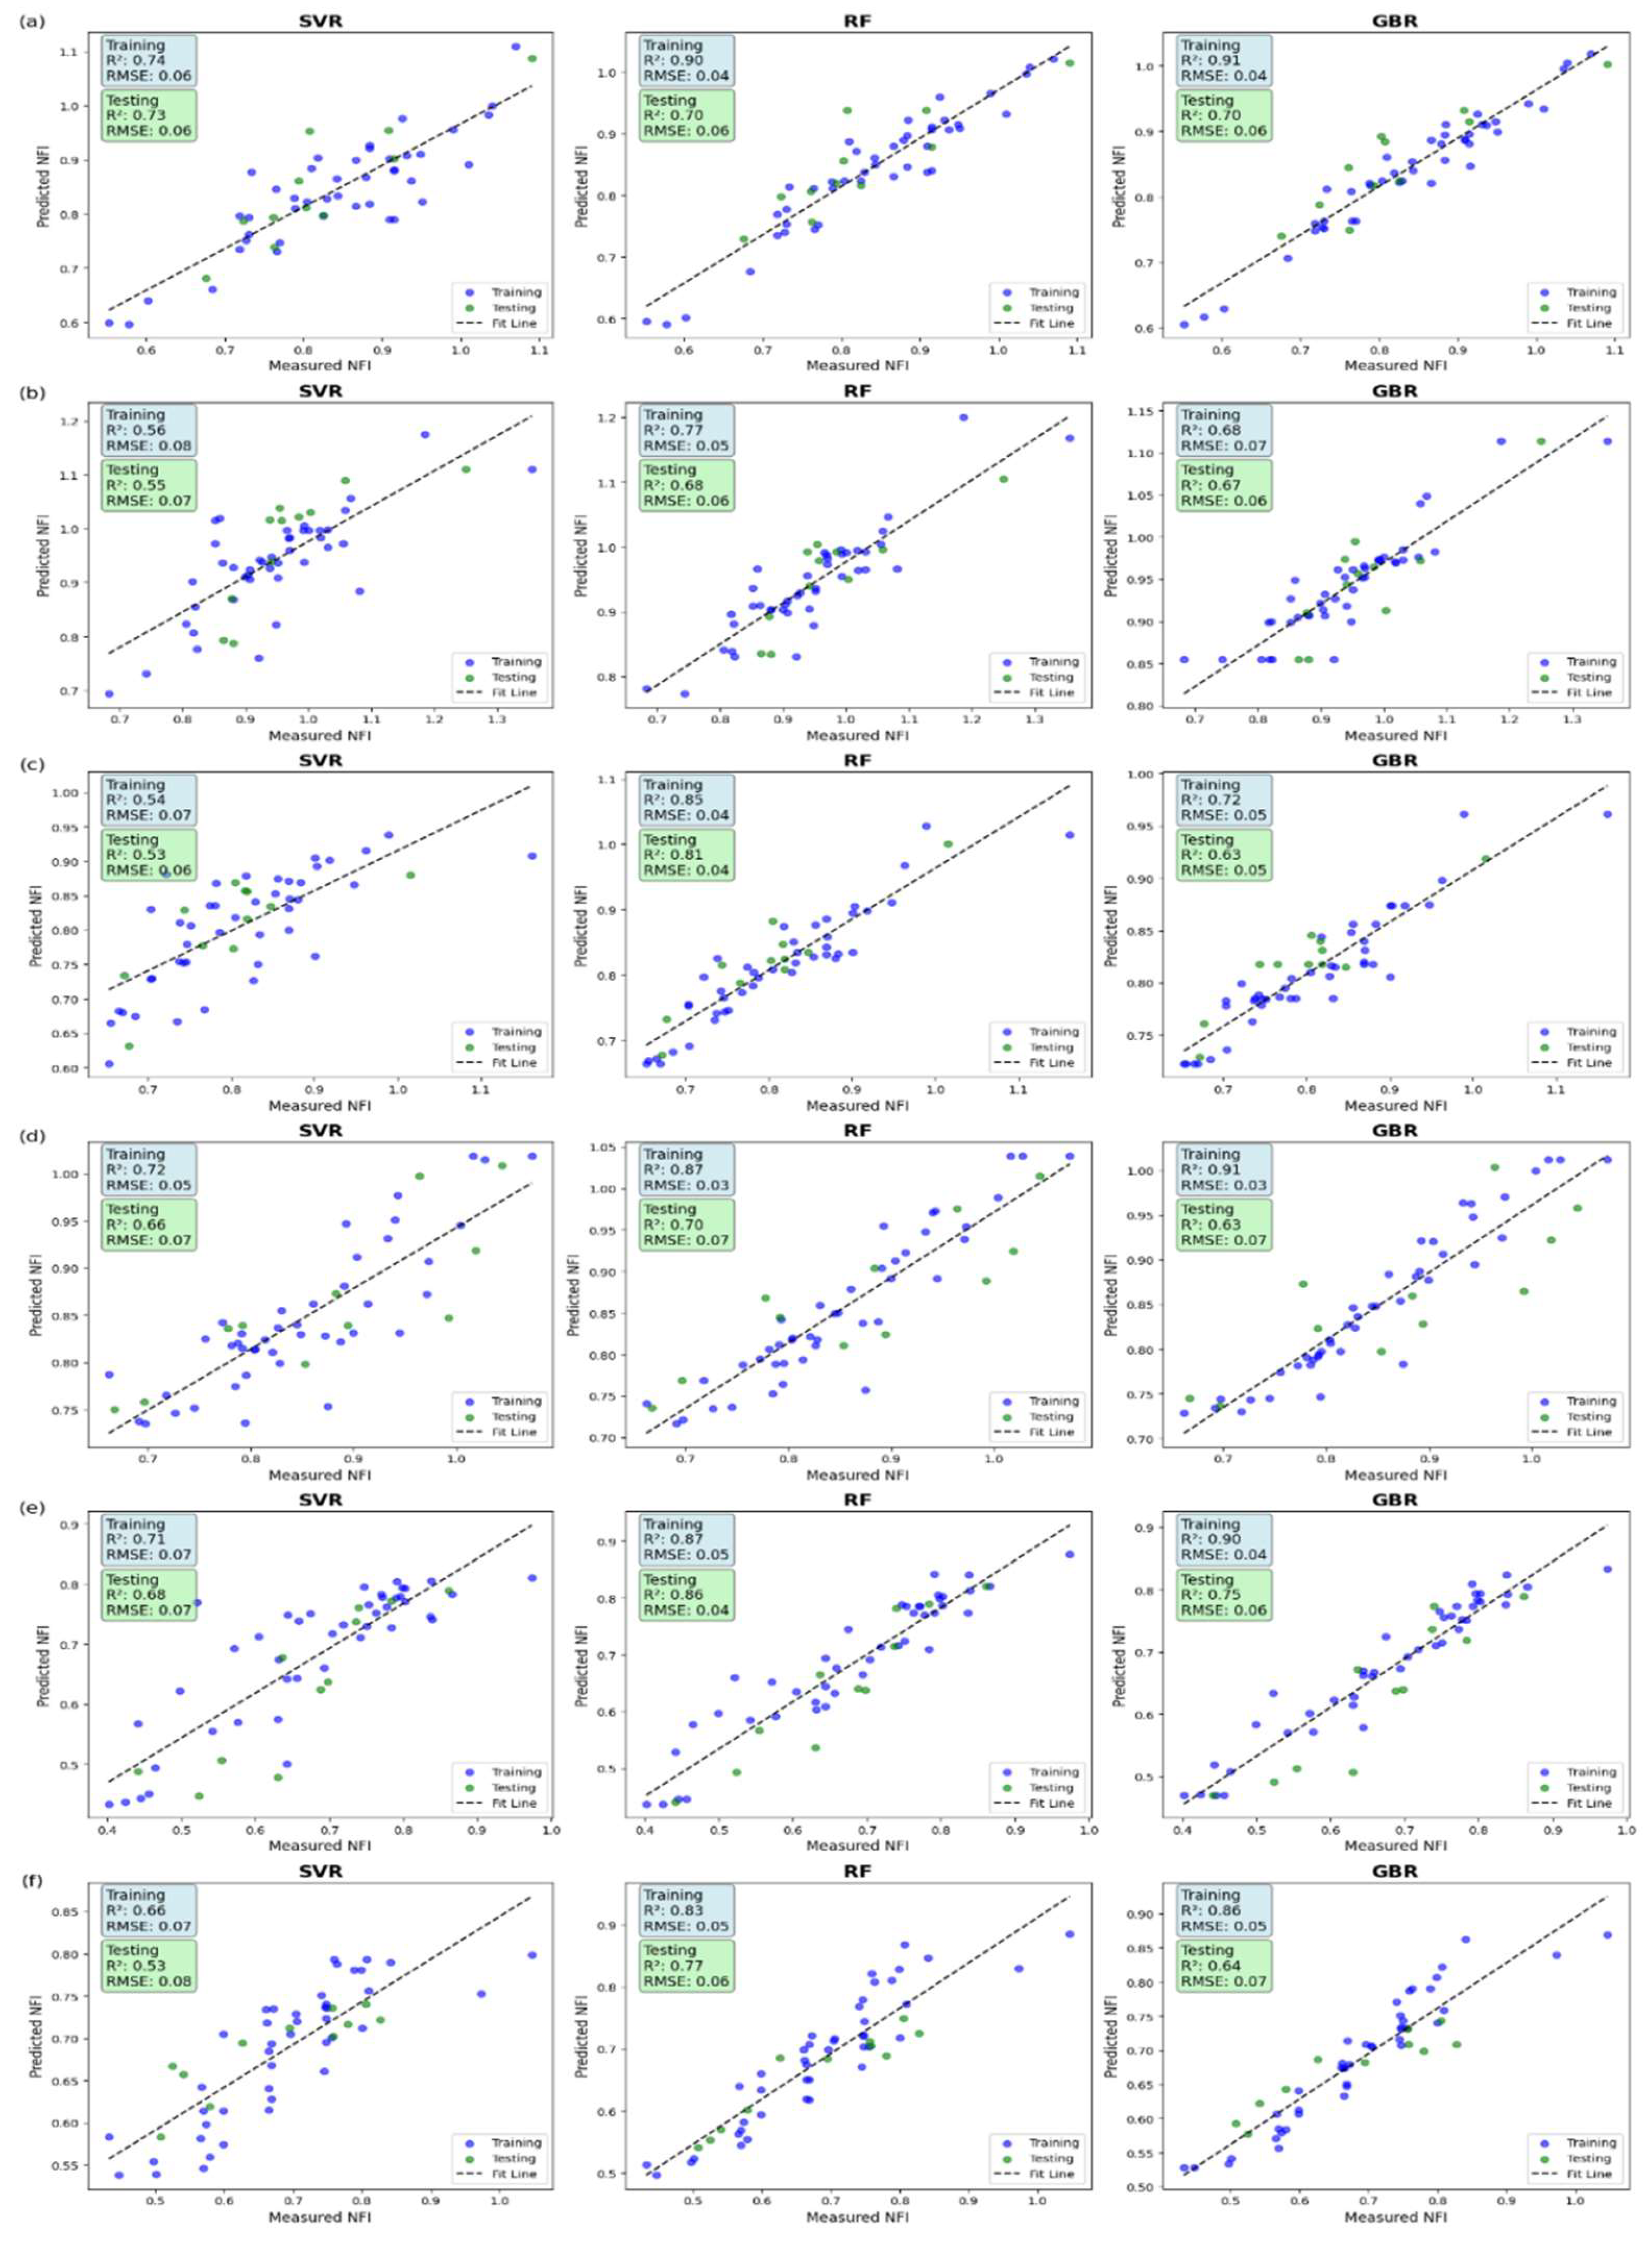
Figure 5.
Scatter plot illustrating the relationship between predicted and actual NFI values across all crop stages.
Figure 5.
Scatter plot illustrating the relationship between predicted and actual NFI values across all crop stages.
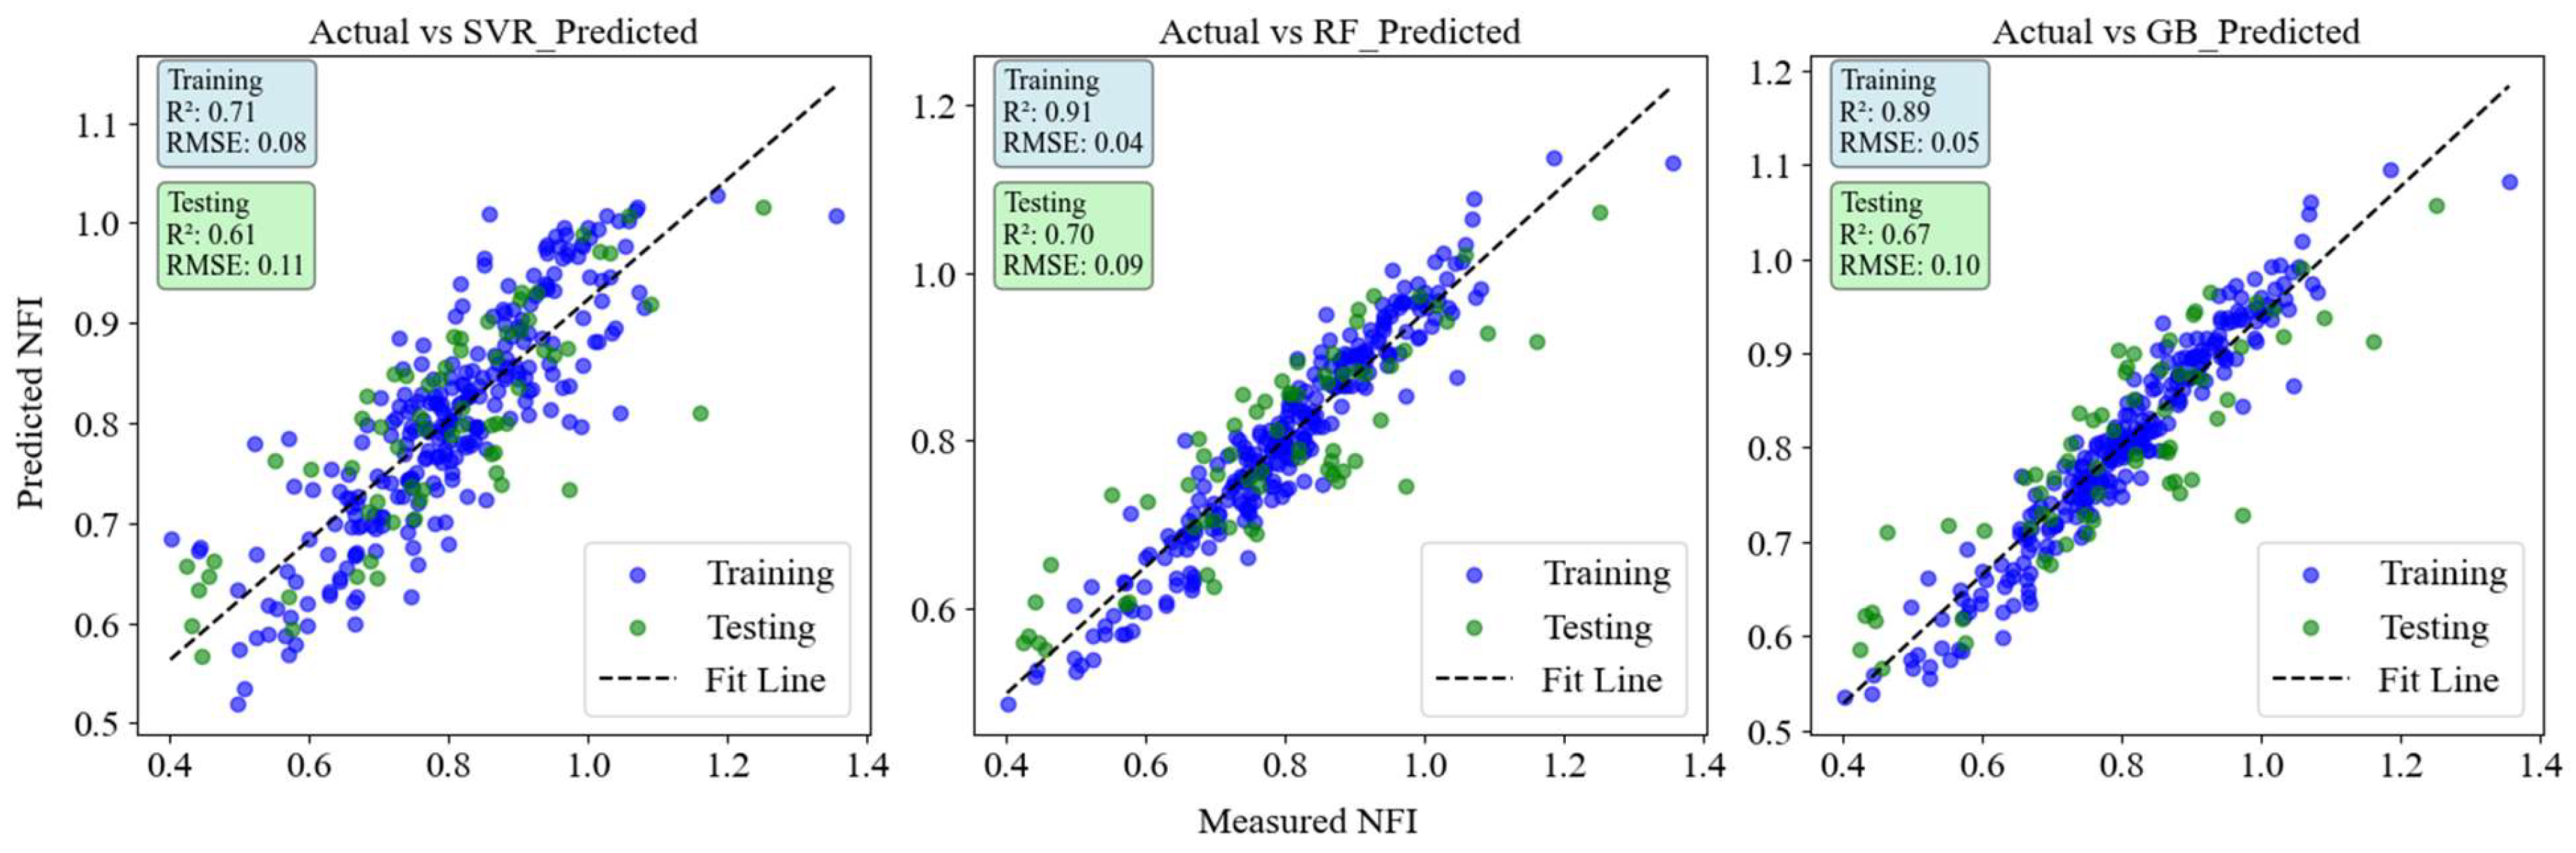
The model was assessed for all crop growth stages combined figure 5. RF achieved the highest test performance with an R² of 0.70 and an RMSE of 0.09, followed by GBR with an R² of 0.67 and an RMSE of 0.10. Support Vector Regression (SVR) had the lowest test accuracy, with an R² of 0.61 and the highest RMSE of 0.11, indicating higher prediction errors compared to RF and GB.
4. Discussion
4.1. Feature Selection and Vegetation Indices Contribution Across Growth Stages
RFE analysis highlighted distinct VIs contributing to NFI estimation across different growth stages. In the early stages (15–30 DAP), NDVI, SR, and MCARI showed the highest feature importance, which aligns with previous studies emphasizing the role of simple ratio-based indices in detecting early nitrogen stress when canopy cover is still developing However, these indices exhibited declining importance in later growth stages, suggesting that they may be more effective for initial nitrogen status assessment rather than long-term monitoring.[42,43]
As the crop matured (45–90 DAP), MCARI variants and RARSa indices emerged as dominant predictors. MCARI, which accounts for chlorophyll content and leaf structure variations, has been previously validated as a reliable nitrogen-sensitive index ([40,44]). Our study further confirms its robustness, particularly at 45 and 75 DAP, when plant nitrogen uptake reaches its peak. The increased importance of RARsa at 75 DAP suggests that red-edge-based indices become more effective as canopy complexity increases, a finding consistent with [45], who demonstrated that red-edge reflectance is highly correlated with chlorophyll content in later growth stages. In 90 DAP, the contribution of aDVI and MCARI3 further increased, indicating that advanced indices incorporating both chlorophyll and structural features provide enhanced predictive capability at maturity. These results suggest that growth-stage-specific feature selection is crucial for optimizing nitrogen estimation models, rather than relying on a single index across all stages.
4.2. Model Performance and Variability Across Growth Stages
Machine learning models demonstrated variable performance across crop growth stages, with RF consistently outperforming SVR and GB. The observed trends suggest that model generalization ability is highly dependent on plant phenological development and spectral response stability.
At early growth stages (15–30 DAP), all models exhibited relatively lower test R² values, with RF achieving the highest (0.70 at 15 DAP and 0.69 at 30 DAP). The reduced accuracy can be attributed to the limited spectral distinction between nitrogen-deficient and nitrogen-sufficient plants at early canopy development stages. This aligns with the previous study, which reported that nitrogen estimation in young crops is less reliable due to minimal structural differences and weaker chlorophyll signals.[46]
At mid-growth stages (45–60 DAP), RF’s performance improved significantly, with a peak test R² of 0.81 at 45 DAP. This stage coincides with the period of active nitrogen uptake, where spectral differences between treatments become more pronounced. GB, while achieving moderate accuracy (R² = 0.63 at 45 DAP), showed greater sensitivity to overfitting, as indicated by its higher training R² compared to test R². This supports the findings of [47], who noted that ensemble boosting methods often overfit complex spectral datasets when feature selection is not optimized.
At late growth stages (75–90 DAP), RF demonstrated superior predictive performance, reaching its highest test R² (0.86) at 75 DAP with the lowest RMSE (0.32). This result is consistent with previous studies showing that RF performs exceptionally well in nitrogen prediction when biomass accumulation and leaf senescence create distinct spectral differences [48].
A combined growth stage analysis confirmed the reliability of the Random Forest (RF) model, achieving a test R² of 0.70 and an RMSE of 0.09. Similar findings were reported by) [49], who demonstrated that RF maintains high predictive accuracy across variable nitrogen conditions and canopy structures, making it the most reliable model for large-scale nitrogen estimation.
This study demonstrates a reliable approach for NFI prediction using UAV-based multispectral vegetation indices, offering a significant improvement in crop growth monitoring compared to traditional methods. By identifying growth-stage-specific vegetation indices, we provide a more accurate and non-destructive technique for nitrogen assessment, which is crucial for optimizing fertilizer use, enhancing yield, and maintaining soil health. This advancement makes nitrogen monitoring more efficient and accessible, reducing reliance on labor-intensive field sampling while ensuring timely nutrient management. The findings have direct implications for precision agriculture, particularly in aromatic crops like Mentha arvensis, where nitrogen levels influence essential oil production. Future research should focus on integrating hyperspectral imaging for enhanced spectral resolution, incorporating real-time field conditions such as soil moisture and temperature to refine nitrogen estimations, and developing automated decision-support systems to provide precise nitrogen application recommendations. By advancing these areas, nitrogen management strategies can be further optimized, leading to sustainable agricultural practices that improve productivity while minimizing environmental impacts.
5. Conclusion
This study demonstrates the potential of integrating UAV-derived multispectral vegetation indices with machine learning algorithms for growth-stage-specific prediction of Nitrogen Flavonol Index (NFI) in Mentha arvensis. A total of 25 vegetation indices related to chlorophyll and nitrogen status were evaluated, Among the machine learning models tested RF consistently delivered superior predictive performance across growth stages. The RFE revealed a temporal shift in vegetation index relevance: NDVI, SR, and MCARI were most informative during early growth (15–30 DAP), while structurally sensitive and red-edge-based indices such as MCARI variants, RARSa, and aDVI became dominant at later stages (45–90 DAP). This progression reflects changes in canopy development and nitrogen dynamics, emphasizing the need for stage-specific feature selection rather than reliance on static indices throughout the crop cycle. This study facilitates the development of scalable, non-destructive, and temporally adaptive monitoring systems for nitrogen management in crop production. Such systems are essential for optimizing fertilization practices, reducing environmental input loads, and advancing sustainable and site-specific agricultural management.
Author Contributions
Conceptualization, M.S. and N.P.; methodology, M.S, B.G.; software, M.S, B.G., Z.Z.; validation, N.P., A.S. and N.S.; formal analysis, M.S. and B.G.; investigation, M.S., N.P, B.G. and Z.Z.; resources, M.S.; data curation, N.P., A.S. and N.S.; writing—original draft preparation, B.G. and M.S.; writing—review and editing, M.S and N.P..; visualization, Z.Z. and B.G.; supervision, M.S.; project administration, M.S.; funding acquisition, M.S.
Funding
This research was funded by Region-specific smart agro technologies for enhancing soil plant health (RSSA) (HCP-057)
Data Availability Statement
Data will be made available on request to Corresponding Author.
Acknowledgments
We are grateful to the Director, CSIR-CIMAP, for constant support and to CSIR New Delhi, India, for financial assistance from the mission project entitled, “Region specific smart agro technologies for enhancing soil plant health (RSSA) - HCP-057”. The Institutional communication number of this article is CIMAP/Pub/2025/62.
Conflicts of Interest
The authors declare that they have no conflicts of interest that could influence the work reported in this paper.
Abbreviations
The following abbreviations are used in this manuscript:
| UAV | Unmanned Aerial Vehicle |
| NFI | Nitrogen Flavonol Index |
| DAP | Days After Planting |
| VI | Vegetation Index |
| VIs | Vegetation Indices |
| RGB | Red-Green-Blue |
| DLS | Downwelling Light Sensor |
| SfM | Structure-from-Motion |
| GIS | Geographic Information System |
| RFE | Recursive Feature Elimination |
| SVR | Support Vector Regression |
| RF | Random Forest |
| GBR | Gradient Boosting Regression |
| SR | Simple Ratio |
| NDVI | Normalized Difference Vegetation Index |
| RDVI | Renormalized Difference Vegetation Index |
| ARVI | Atmospherically Resistant Vegetation Index |
| MSR1 | Modified Simple Ratio 1 |
| MSR2 | Modified Simple Ratio 2 |
| DVI | Difference Vegetation Index |
| SAVI | Soil Adjusted Vegetation Index |
| OSAVI | Optimized Soil Adjusted Vegetation Index |
| MSAVI | Modified Soil Adjusted Vegetation Index |
| SARVI | Soil and Atmosphere Resistant Vegetation Index |
| EVI | Enhanced Vegetation Index |
| NDRE | Normalized Difference Red Edge Index |
| RRI1 | Red Edge Ratio Index 1 |
| RRI2 | Red Edge Ratio Index 2 |
| MCARI | Modified Chlorophyll Absorption Ratio Index |
| MCARI1 | Modified Chlorophyll Absorption Ratio Index 1 |
| MCARI2 | Modified Chlorophyll Absorption Ratio Index 2 |
| MTVI | Modified Triangular Vegetation Index |
| Datt Index | Datt Index |
| aDVI | Adjusted Difference Vegetation Index |
| GNDVI | Green Normalized Difference Vegetation Index |
| PSSRc | Pigment-Specific Simple Ratio for Carotenoids |
| RARSa | Ratio Analysis of Reflectance Spectra for Chlorophyll a |
| SIPI | Structure-Insensitive Pigment Index |
References
- Pinter Jr, P.J.; Hatfield, J.L.; Schepers, J.S.; Barnes, E.M.; Moran, M.S.; Daughtry, C.S.T.; Upchurch, D.R. Remote Sensing for Crop Management. Photogramm Eng Remote Sensing 2003, 69, 647–664.
- Novoa, R.; Loomis, R.S. Nitrogen and Plant Production. Plant Soil 1981, 58, 177–204.
- Evans, J.R. Photosynthesis and Nitrogen Relationships in Leaves of C3 Plants. Oecologia 1989, 78, 9–19.
- Watson, M.E.; Galliher, T.L. Comparison of Dumas and Kjeldahl Methods with Automatic Analyzers on Agricultural Samples under Routine Rapid Analysis Conditions. Commun Soil Sci Plant Anal 2001, 32, 2007–2019.
- Ali, M.M.; Al-Ani, A.; Eamus, D.; Tan, D.K.Y. Leaf Nitrogen Determination Using Non-Destructive Techniques–A Review. J Plant Nutr 2017, 40, 928–953.
- Bista, M.K.; Adhikari, B.; Sankarapillai, L. V; Pieralisi, B.; Reddy, K.R.; Jenkins, J.; Bheemanahalli, R. Drought and Heat Stress Induce Differential Physiological and Agronomic Trait Responses in Cotton. Ind Crops Prod 2024, 222, 119540.
- Goulas, Y.; Cerovic, Z.G.; Cartelat, A.; Moya, I. Dualex: A New Instrument for Field Measurements of Epidermal Ultraviolet Absorbance by Chlorophyll Fluorescence. Appl Opt 2004, 43, 4488–4496. [CrossRef]
- Cartelat, A.; Cerovic, Z.G.; Goulas, Y.; Meyer, S.; Lelarge, C.; Prioul, J.-L.; Barbottin, A.; Jeuffroy, M.-H.; Gate, P.; Agati, G. Optically Assessed Contents of Leaf Polyphenolics and Chlorophyll as Indicators of Nitrogen Deficiency in Wheat (Triticum Aestivum L.). Field Crops Res 2005, 91, 35–49.
- Cerovic, Z.G.; Masdoumier, G.; Ghozlen, N. Ben; Latouche, G. A New Optical Leaf-clip Meter for Simultaneous Non-destructive Assessment of Leaf Chlorophyll and Epidermal Flavonoids. Physiol Plant 2012, 146, 251–260.
- Cerovic, Z.G.; Ghozlen, N. Ben; Milhade, C.; Obert, M.; Debuisson, S.; Moigne, M. Le Nondestructive Diagnostic Test for Nitrogen Nutrition of Grapevine (Vitis Vinifera L.) Based on Dualex Leaf-Clip Measurements in the Field. J Agric Food Chem 2015, 63, 3669–3680.
- Fan, K.; Li, F.; Chen, X.; Li, Z.; Mulla, D.J. Nitrogen Balance Index Prediction of Winter Wheat by Canopy Hyperspectral Transformation and Machine Learning. Remote Sens (Basel) 2022, 14, 3504.
- Khan, M.S.; Yadav, P.; Semwal, M.; Prasad, N.; Verma, R.K.; Kumar, D. Predicting Canopy Chlorophyll Concentration in Citronella Crop Using Machine Learning Algorithms and Spectral Vegetation Indices Derived from UAV Multispectral Imagery. Ind Crops Prod 2024, 219, 119147.
- Qiao, L.; Tang, W.; Gao, D.; Zhao, R.; An, L.; Li, M.; Sun, H.; Song, D. UAV-Based Chlorophyll Content Estimation by Evaluating Vegetation Index Responses under Different Crop Coverages. Comput Electron Agric 2022, 196, 106775.
- Hansen, P.M.; Schjoerring, J.K. Reflectance Measurement of Canopy Biomass and Nitrogen Status in Wheat Crops Using Normalized Difference Vegetation Indices and Partial Least Squares Regression. Remote Sens Environ 2003, 86, 542–553.
- Wiegand, C.L.; Richardson, A.J.; Escobar, D.E.; Gerbermann, A.H. Vegetation Indices in Crop Assessments. Remote Sens Environ 1991, 35, 105–119.
- Chlingaryan, A.; Sukkarieh, S.; Whelan, B. Machine Learning Approaches for Crop Yield Prediction and Nitrogen Status Estimation in Precision Agriculture: A Review. Comput Electron Agric 2018, 151, 61–69.
- Wang, X.; Miao, Y.; Dong, R.; Zha, H.; Xia, T.; Chen, Z.; Kusnierek, K.; Mi, G.; Sun, H.; Li, M. Machine Learning-Based in-Season Nitrogen Status Diagnosis and Side-Dress Nitrogen Recommendation for Corn. European Journal of Agronomy 2021, 123, 126193.
- Quemada, M.; Gabriel, J.L.; Zarco-Tejada, P. Airborne Hyperspectral Images and Ground-Level Optical Sensors as Assessment Tools for Maize Nitrogen Fertilization. Remote Sens (Basel) 2014, 6, 2940–2962. [CrossRef]
- Li, J.; Zhang, F.; Qian, X.; Zhu, Y.; Shen, G. Quantification of Rice Canopy Nitrogen Balance Index with Digital Imagery from Unmanned Aerial Vehicle. Remote Sensing Letters 2015, 6, 183–189.
- Fan, K.; Li, F.; Chen, X.; Li, Z.; Mulla, D.J. Nitrogen Balance Index Prediction of Winter Wheat by Canopy Hyperspectral Transformation and Machine Learning. Remote Sens (Basel) 2022, 14, 3504.
- Pandey, P.; Singh, S.; Khan, M.S.; Semwal, M. Non-Invasive Estimation of Foliar Nitrogen Concentration Using Spectral Characteristics of Menthol Mint (Mentha arvensis L.). Front Plant Sci 2022, 13, 680282.
- Jordan, C.F. Derivation of Leaf-Area Index from Quality of Light on the Forest Floor. Ecology 1969, 50, 663–666. [CrossRef]
- Pearson, R.L.; Miller, L.D. Remote Mapping of Standing Crop Biomass for Estimation of the Productivity of the Shortgrass Prairie, Pawnee National Grasslands, Colorado.; 1972.
- Rouse, J.W.; Haas, R.H.; Schell, J.A.; Deering, D.W. Type II Report for the Period; 1973;
- Roujean, J.-L.; Breon, F.-M. Estimating PAR Absorbed by Vegetation from Bidirectional Reflectance Measurements. Remote Sens Environ 1995, 51, 375–384. [CrossRef]
- Kaufman, Y.J.; Tanre, D. Atmospherically Resistant Vegetation Index (ARVI) for EOS-MODIS. IEEE Transactions on Geoscience and Remote Sensing 1992, 30, 261–270. [CrossRef]
- Chen, J.M. Evaluation of Vegetation Indices and a Modified Simple Ratio for Boreal Applications. Canadian Journal of Remote Sensing 1996, 22, 229–242. [CrossRef]
- Sims, D.A.; Gamon, J.A. Relationships between Leaf Pigment Content and Spectral Reflectance across a Wide Range of Species, Leaf Structures and Developmental Stages. Remote Sens Environ 2002, 81, 337–354. [CrossRef]
- Huete, A.; Didan, K.; Miura, T.; Rodriguez, E.P.; Gao, X.; Ferreira, L.G. Overview of the Radiometric and Biophysical Performance of the MODIS Vegetation Indices. Remote Sens Environ 2002, 83, 195–213. [CrossRef]
- Rondeaux, G.; Steven, M.; Baret, F. Optimization of Soil-Adjusted Vegetation Indices. Remote Sens Environ 1996, 55, 95–107. [CrossRef]
- Qi, J.; Chehbouni, A.; Huete, A.R.; Kerr, Y.H.; Sorooshian, S. A Modified Soil Adjusted Vegetation Index. Remote Sens Environ 1994, 48, 119–126. [CrossRef]
- Gitelson, A.; Merzlyak, M.N. Spectral Reflectance Changes Associated with Autumn Senescence of Aesculus Hippocastanum L. and Acer Platanoides L. Leaves. Spectral Features and Relation to Chlorophyll Estimation. J Plant Physiol 1994, 143, 286–292. [CrossRef]
- Ehammer, A.; Fritsch, S.; Conrad, C.; Lamers, J.; Dech, S. Statistical Derivation of FPAR and LAI for Irrigated Cotton and Rice in Arid Uzbekistan by Combining Multi-Temporal RapidEye Data and Ground Measurements. In Proceedings of the Proc.SPIE; October 22 2010; Vol. 7824, p. 782409.
- Daughtry, C.S.T.; Walthall, C.L.; Kim, M.S.; de Colstoun, E.B.; McMurtrey, J.E. Estimating Corn Leaf Chlorophyll Concentration from Leaf and Canopy Reflectance. Remote Sens Environ 2000, 74, 229–239. [CrossRef]
- Haboudane, D.; Miller, J.R.; Pattey, E.; Zarco-Tejada, P.J.; Strachan, I.B. Hyperspectral Vegetation Indices and Novel Algorithms for Predicting Green LAI of Crop Canopies: Modeling and Validation in the Context of Precision Agriculture. Remote Sens Environ 2004, 90, 337–352. [CrossRef]
- Datt, B. Visible/near Infrared Reflectance and Chlorophyll Content in Eucalyptus Leaves. Int J Remote Sens 1999, 20, 2741–2759. [CrossRef]
- Broge, N.H.; Leblanc, E. Comparing Prediction Power and Stability of Broadband and Hyperspectral Vegetation Indices for Estimation of Green Leaf Area Index and Canopy Chlorophyll Density. Remote Sens Environ 2001, 76, 156–172. [CrossRef]
- Gitelson, A.A.; and Merzlyak, M.N. Remote Estimation of Chlorophyll Content in Higher Plant Leaves. Int J Remote Sens 1997, 18, 2691–2697. [CrossRef]
- Blackburn, G.A. Quantifying Chlorophylls and Caroteniods at Leaf and Canopy Scales: An Evaluation of Some Hyperspectral Approaches. Remote Sens Environ 1998, 66, 273–285. [CrossRef]
- Chappelle, E.W.; Kim, M.S.; McMurtrey, J.E. Ratio Analysis of Reflectance Spectra (RARS): An Algorithm for the Remote Estimation of the Concentrations of Chlorophyll A, Chlorophyll B, and Carotenoids in Soybean Leaves. Remote Sens Environ 1992, 39, 239–247. [CrossRef]
- Penuelas, J.; Frederic, B.; Filella, I. Semi-Empirical Indices to Assess Carotenoids/Chlorophyll-a Ratio from Leaf Spectral Reflectance. Photosynthetica 1995, 31, 221–230.
- Rehman, T.H.; Borja Reis, A.F.; Akbar, N.; Linquist, B.A. Use of Normalized Difference Vegetation Index to Assess N Status and Predict Grain Yield in Rice. Agron J 2019, 111, 2889–2898.
- Boiarskii, B.; Hasegawa, H. Comparison of NDVI and NDRE Indices to Detect Differences in Vegetation and Chlorophyll Content. J. Mech. Contin. Math. Sci 2019, 4, 20–29.
- Daughtry, C.S.T.; Walthall, C.L.; Kim, M.S.; de Colstoun, E.B.; McMurtrey, J.E. Estimating Corn Leaf Chlorophyll Concentration from Leaf and Canopy Reflectance. Remote Sens Environ 2000, 74, 229–239. [CrossRef]
- Clevers, J.G.P.W.; Gitelson, A.A. Remote Estimation of Crop and Grass Chlorophyll and Nitrogen Content Using Red-Edge Bands on Sentinel-2 and-3. International Journal of Applied Earth Observation and Geoinformation 2013, 23, 344–351.
- Gianquinto, G.; Goffart, J.P.; Olivier, M.; Guarda, G.; Colauzzi, M.; Dalla Costa, L.; Delle Vedove, G.; Vos, J.; Mackerron, D.K.L. The Use of Hand-Held Chlorophyll Meters as a Tool to Assess the Nitrogen Status and to Guide Nitrogen Fertilization of Potato Crop. Potato Res 2004, 47, 35–80.
- Tsymbal, A.; Puuronen, S.; Patterson, D.W. Ensemble Feature Selection with the Simple Bayesian Classification. Information fusion 2003, 4, 87–100.
- Chiu, M.S.; Wang, J. Evaluation of Machine Learning Regression Techniques for Estimating Winter Wheat Biomass Using Biophysical, Biochemical, and UAV Multispectral Data. Drones 2024, 8, 287.
- Lu, J.; Dai, E.; Miao, Y.; Kusnierek, K. Developing a New Active Canopy Sensor- and Machine Learning-Based in-Season Rice Nitrogen Status Diagnosis and Recommendation Strategy. Field Crops Res 2024, 317, 109540. [CrossRef]
Table 2.
UAV data acquisition campaign
| Date | Day after Plantation |
|---|---|
| 02 April 2022 | 15 |
| 17 April 2022 | 30 |
| 02 May 2022 | 45 |
| 17 May 2022 | 60 |
| 01 June 2022 | 75 |
| 16 June 2022 | 90 |
Table 3.
Vegetation Indices used in the study.
| Index Name | Formula | Reference |
|---|---|---|
| SR | NIR / RED | [22,23] |
| NDVI | (NIR − RED) / (NIR + RED) | [24] |
| RDVI | (NIR − RED) / √(NIR + RED) | [25] |
| ARVI | (NIR − [RED − γ (BLUE − RED)]) / (NIR + [RED − γ (BLUE − RED)]), γ = 1 | [26] |
| MSR1 | ((NIR / RED) − 1) / √((NIR / RED) + 1) | [27] |
| MSR2 | (NIR − BLUE) / (RED − BLUE) | [28] |
| DVI | NIR − RED | [22] |
| SAVI | ((1 + L)(NIR − RED)) / (NIR + RED + L), L = 0.5 | [29] |
| OSAVI | (1 + 0.16)(NIR − RED) / (NIR + RED + 0.16) | [30] |
| MSAVI | 0.5 × [2 × NIR + 1 − √((2 × NIR + 1)² − 8 × (NIR − RED))] | [31] |
| SARVI | (1 + L) × (NIR − (RED − (BLUE − RED))) / (NIR + (RED − (BLUE − RED)) + L), L = 0.5 | [26] |
| EVI | 2.5 × (NIR − RED) / (NIR + 6 × RED − 7.5 × BLUE + 1) | [29] |
| NDRE | (NIR − RE) / (NIR + RE) | [32] |
| RRI1 | NIR / RE | [33] |
| RRI2 | RE / RED | [33] |
| MCARI | [(RE − RED) − 0.2 × (RE − GREEN)] × (RE / RED) | [34] |
| MCARI1 | 1.2 × [2.5 × (NIR − RED) − 1.3 × (NIR − GREEN)] | [35] |
| MCARI2 | [1.5 × (2.5 × (NIR − RED) − 1.3 × (NIR − GREEN))] / √((2 × NIR + 1)² − (6 × NIR − 5 × √RED) − 0.5) | [35] |
| MTVI | 1.2 × [1.2 × (NIR − GREEN) − 2.5 × (RED − GREEN)] | [35] |
| Datt Index | (NIR − RE) / (NIR − RED) | [36] |
| aDVI | NIR − ((GREEN + RED) / 2) | [37] |
| GNDVI | (NIR − GREEN) / (NIR + GREEN) | [38] |
| PSSRc | NIR / BLUE | [39] |
| RARSa | RED / RE | [39,40] |
| SIPI | (NIR − BLUE) / (NIR − RED) | [41] |
Disclaimer/Publisher’s Note: The statements, opinions and data contained in all publications are solely those of the individual author(s) and contributor(s) and not of MDPI and/or the editor(s). MDPI and/or the editor(s) disclaim responsibility for any injury to people or property resulting from any ideas, methods, instructions or products referred to in the content. |
© 2025 by the authors. Licensee MDPI, Basel, Switzerland. This article is an open access article distributed under the terms and conditions of the Creative Commons Attribution (CC BY) license (http://creativecommons.org/licenses/by/4.0/).
Copyright: This open access article is published under a Creative Commons CC BY 4.0 license, which permit the free download, distribution, and reuse, provided that the author and preprint are cited in any reuse.


