
Submitted:
19 March 2024
Posted:
19 March 2024
You are already at the latest version
Abstract
In this paper, low circumferential reciprocating load foot-scale tests were performed on two truncated PHC B 600 130 tubular piles with bearing nodes to characterize the damage process and morphology of the specimens and to investigate the load-carrying performance of the members. The test results reveal that under the action of tensile-bending-shear loading, the bearing concrete in the node area buckles and is damaged, the anchored reinforcement in the node area yields, the constraint is weakened, an articulation point is formed, and the node rotational capacity increases. When the embedment depth increases from 200 mm to 300 mm, the ultimate bearing capacities of the positive and negative nodes increase by 57.60% and 54.60%, respectively. A numerical simulation is used to verify the test results. Considering the three types of piles with truncated nodes, the numerical simulation is used to analyze the node-bearing capacity at different embedment depths. Finally, two preferred node types are proposed as follows: pipe pile core-filled longitudinal reinforcement anchored into the bearing node and pipe pile body longitudinal reinforcement anchored into the bearing node + pipe pile core-filled longitudinal reinforcement anchored into the bearing node, with preferred embedment depths of 350 mm and 200 mm, respectively.
Keywords:
Pile cutting-off
; Pipe-pile cap connection
; Reciprocating load test
; Bearing capacity
; Numerical simulation
; Embedded depth
1. Introduction
Prestressed concrete piles have achieved a wide range of applications in the construction field. In PHC pipe pile foundations, due to the unevenness of the ground layer, when the pile sinks and a pipe pile encounters a harder ground layer, it is often difficult for the pile to sink, and the phenomenon of pile cutting inevitably occurs. For the connection of the PHC pipe pile and bearing platform after pile cutting, three types of nodes are studied in this paper: a pipe pile filling a longitudinal bar anchored into the bearing platform node, a pipe pile body longitudinal bar anchored into the bearing platform node, and a pipe pile body longitudinal bar anchored into the bearing platform + a pipe pile filling a longitudinal bar anchored into the bearing platform node. At present, the main purpose of an actual project is to fill the core of a pile, and longitudinal bars are anchored into the bearing platform. Since the node connecting the pile and the bearing platform is the centralized part of the force, many scholars have studied its bearing performance.
Madasamy Arockiasamy et al.[1] reviewed published experimental and analytical studies on the connection between prestressed concrete piles and caps.
The following authors have studied the load bearing performance of joints between columns/piles and caps through experiments. Zhao Cheng et al.[2] studied prefabricated reinforced concrete columns without prestressing. Guangda Zhang et al.[3] and Lenci Kappes et al.[4] studied concrete-filled steel tube columns/piles. M. Steunenberg et al.[5] and Young-Ho Kim et al.[6] studied steel pipe piles. Pedram Sadeghian et al.[7,8] studied concrete-filled fiber-reinforced polymer tube. Carlos A. Blandon et al.[9], Charles W. Roeder et al.[10], Dawn E. Lehman et al.[11] and Raymond R. Foltz et al.[12] studied octagonal prestressed piles and HP steel piles. Ni Guoquan et al.[13] and Sun Chuanzhi et al.[14,15] studied prestressed concrete square piles.
Zhaosheng Guo et al.[16,17], Wubin He et al.[18,19], Zhijian Yang et al.[20,21] and Tiecheng Wang et al.[22] analyzed the bearing performance of PHC pipe piles and cap joints by using full-scale tests and numerical simulation methods. Reference [16] proposed a formula for calculating the bearing capacity of PHC pipe piles and cap joints under horizontal earthquake action.
In transmission line tower foundations where PHC piles are widely used, due to the self-weight of the transmission line, the tension, bending moment and shear force on the PHC piles and bearing nodes increase under the action of external forces such as earthquakes or wind loads. Thus far, scholars have studied more the combination of bending-shear and compression-bending-shear forces and less the combination of tension-bending-shear forces. Therefore, this paper investigates the bearing performance of the connection node of a PHC pile and bearing platform after pile cutting by means of an in-feed measurement test and numerical simulation.
2. Experimental Design
2.1. Test Survey
Two full-size specimens were designed for the test, and the connection forms of the pipe pile and bearing platform are shown in Figure 1 and Figure 2. The force performance of the connection node of the PHC B600-130 (pile diameter of 600 mm, wall thickness of 130 mm) type pipe piles [23] and bearing platform under low circumferential reciprocating loads after the cutoff pile was investigated. The main parameters of the specimens are shown in Table 1.
For the pile concrete used in the test, six cubic compressive strength tests with a side length of 100 mm were conducted, and the average compressive strength of the converted standard specimen was 93.20 MPa. For the JCT-I-200 and JCT-I-300 bearing platform (core-filled) concrete, six cubic compressive strength tests with a side length of 150 mm each were conducted, and the average compressive strengths of the specimens were 41.52 MPa and 40.30 MPa, respectively.
The material properties of the specimens are listed in Table 2.
2.2. Production of the Test
The prestressed concrete pipe pile was constructed by Jianhua Building Materials (Shanxi) Co., Ltd., and the cap and core were constructed in the laboratory of the Bridge and Tunnel Engineering Research Institute of Shanxi Traffic Science and Technology R & D Co., Ltd. The length of the pipe pile was 2.2 m (with an embedded cap of 200 mm) and 2.3 m (with an embedded cap of 300 mm). The cap is 2.0 m in length, 1.2 m in width, 0.9 m in height (embedded cap 200 mm) and 1.0 m in length (embedded cap 300 mm). The pipe pile is a 600 mm diameter B-type pile, the bearing platform is equipped with HRB335 grade φ14@150/160 mm double-layer bidirectional steel reinforcement, and the axial tension added to the top of the pile is 340 kN during the test.
2.3. Test Loading and Measuring Devices
The specimens were loaded in the inverse position. The installation and schematic diagrams of the loading device are shown in Figure 1 and Figure 2, respectively. To measure the horizontal displacement of the pile body during the loading process, three displacement gauges were arranged along the length of the pile body. These resistance strain gauges were pasted on the anchoring reinforcement and pile concrete for measurement, as shown in Figure 3.
The vertical axial tensile load was applied first during the test, and then the horizontal reciprocating load was applied after the vertical load increased to 340 kN and remained constant. The horizontal load was applied by the load‒displacement hybrid control loading method specified in the “Regulations on Seismic Testing Methods for Buildings”[24] document. Considering the unity of the loading force and displacement between these two specimens and the other PHC pile-bearing node specimens, it was determined that the maximum value of the load loading was 135.0 kN, and the load was loaded to 135.0 kN in the forward and reverse directions in eight levels. Additionally, each level of load was loaded reciprocally once. Displacement loading takes 3 mm as the control displacement and multiples of 3 mm as the loading level difference, and each level of displacement is loaded three times reciprocally. When the horizontal load exceeded the ultimate load and was reduced to 85% of the ultimate load, the specimen was considered damaged, and the loading was stopped at the same time.
3. Test Results and Analysis
3.1. Experimental Phenomena
3.1.1. JCT-200 Test Phenomenon and Damage Characteristics
Throughout testing, the reinforced concrete bearing platform exhibited clear cracking, while two smaller cracks formed on the PHC pipe pile, and the cracking of the specimen during the loading stage is shown in Figure 4. In the first step of loading, after the pipe pile was loaded by applying a vertical tension force of 340 kN, it exhibited a fine crack at its connection to the bearing platform (not penetrated). In the early stage of horizontal force loading, the specimen was in the elastic deformation stage, and there was no change between the bearing platform and the pipe pile.
During the loading process, cracks first appeared at the node of the pile and bearing platform. At a loading of 105 kN, at this time, the displacement of the pile top displacement gauge was 1.23 mm, and the first crack appears on the surface of the bearing platform; this radial crack was centered around the center of the pile. With increasing cycle and loading displacement, the cracks on the upper surface of the bearing platform and on the side of the bearing platform in the width direction gradually increased. These cracks gradually penetrated the material plane and developed vertically toward the inside of the bearing platform. The crack width and length gradually deepened and extended, respectively, along the surface and sides of the bearing platform.
At -27.0 mm (the second cycle), the displacement of the pile top displacement gauge was -27.61 mm, the actuator load was -186.5 kN, and the first vertical crack appears in the body of the tubular pile. With increasing cycle and loading displacement, the vertical crack in the pile body becomes longer. Throughout the loading stage, no cyclic cracks appeared in the pile body. The direction of the vertical cracks was approximately perpendicular to the loading direction.
At 33.0 mm (the second cycle), the displacement of the pile top displacement gauge was 28.03 mm, the actuator load was 219.1 kN. The widest cracks on the surface, south side, and north side of the bearing platform were 1.65 mm, 0.51 mm, and 0.81 mm, respectively.
At the end of the testing, the concrete on the countertop bulged substantially and produced a noticeable hollow drum sound when tapped.
3.1.2. JCT-300 Test Phenomenon and Damage Characteristics
Throughout the test, the PHC pipe pile body and reinforced concrete bearing platform exhibited clear cracking, and the cracking of the specimen during the loading stage is shown in Figure 5. In the first step of loading, after the pipe pile was loaded by applying a vertical tension force of 340 kN, the connection between the pipe pile and the bearing platform showed a fine crack (not penetrated). In the early stage of horizontal force loading, the specimen was in the elastic deformation stage, and there was no change between the bearing platform and the pipe pile.
As the loading proceeds, cracks first appear in the combination of the pile and the bearing platform. When the displacement was loaded to 6.0 mm (the first cycle) at this time, the displacement of the pile top displacement gauge was 4.80 mm, and the actuator load was 289.0 kN. The first crack appears on the surface of the bearing platform and was a radial crack centered around the center of the pipe pile. With increasing cycle and loading displacement, the cracks on the upper surface of the bearing platform and on the side of the bearing platform in the width direction gradually increased. These cracks gradually penetrate in the plane and develop vertically toward the inside of the bearing platform, gradually deepening the width and extending the length of the cracks on the surface and sides of the bearing platform.
At 12.0 mm (the first cycle), when the displacement of the pile top displacement gauge was 10.10 mm and the actuator load was 382.3 kN, the first circular crack appears in the pile body of the tubular pile. With increasing cycle and loading displacement, two vertical cracks were produced in the pile body.
At this time, the displacement of the pile top displacement gauge was -24.40 mm, the actuator load was -345.6 kN. the widest crack on the bearing surface was 0.82 mm, the maximum height of concrete buckling on the bearing surface was 12.0 mm, and the concrete buckling was damaged.
At the end of the testing, the concrete on the countertop bulged substantially and produced a noticeable hollow drum sound when tapped.
3.1.3. Summary of Test Phenomena
During the test, under a vertical load of 340 kN, a small crack was generated at the contact ring between the pipe pile and the bearing platform. As the loading proceeded, the crack at the contact ring between the pile and the bearing platform penetrated through; after that, the first radial crack visible to the naked eye was generated on the surface of the bearing platform, and cracks were generated on the body of the pile. When the depth of the pile embedded in the bearing platform is 200 mm/300 mm, the pile body rotates greatly during the loading process, and the concrete at the contact with the pipe pile is subjected to extrusion pressure when the pile body rotates, the concrete in the lower part of the contact between the bearing platform and the pipe pile is buckled and damaged, and the concrete at the top of the contact is crushed. Node damage occurs, the node area anchorage reinforcement constraint is weakened, articulated nodes form, the rotation capacity increases, the anchorage reinforcement yields, and the bearing platform surface causes concrete buckling damage and crushing.
The buckling height of the bearing platform concrete is less than the embedment depth because the contact area between the pipe pile and the bearing platform is subjected to the extrusion pressure of the pile body under the reciprocating load. When the squeezing force on the contact area is greater than the bearing capacity of the concrete in the contact area, buckling damage occurs.
3.2. Skeleton Curve
The load‒displacement skeleton curves of test specimens JCT-200 and JCT-300 are shown in Figure 6.
As shown in Figure 6, both specimens underwent the elastic stage, elastic‒plastic stage and plastic stage. In the initial loading stage, the specimens were in the elastic stage, and the nodal load‒displacement relationship curves were linear. Following the elastic phase, the specimens were in the elastic‒plastic phase until they reached the ultimate load capacity. After reaching the ultimate load capacity, the specimens are in the plastic stage.
In the elastic stage, the displacement of the specimen is small. After the specimen enters the elastic-plastic stage, during the loading process, the pipe pile and bearing platform in the specimen crack gradually, and the structural stiffness gradually decreases until the ultimate bearing capacity is reached. After reaching the ultimate load-carrying capacity, the rotational capacity of the nodes increases, the stiffness of the members decreases substantially with increasing load and displacement, and the members rapidly lose their load-bearing capacity.
4. Finite Element Analysis
4.1. Finite Element Model
To conduct an in-depth study on the mechanical performance of nodes between prestressed concrete pipe piles and caps, finite element simulations are performed at various nodes using the static general-purpose module in ABAQUS finite element software. In these simulations, the geometrical and physical model parameters are identical to those of the test specimens.
The numerical simulation process of this project involved four steps: applying a prestressing force via the cooling method, applying a vertical axial force, applying a horizontal load and applying horizontal displacement. The whole process is controlled using automatic incremental steps with all nonlinear switches turned on.
The concrete damage principle is modeled by the concrete plastic damage model in the ABAQUS material library, and the stress‒strain curve in the Code for the Design of Concrete Structures [25] is used. The expansion angle is set to 30°, the eccentricity is set to 0.1, the ratio of the biaxial compressive strength to the uniaxial compressive strength is set to 1.16, the ratio of the second stress invariant on the tensile meridian is set to 0.6667, and the coefficient of viscosity is set to 0.001.
To accurately simulate the testing conditions, the boundary conditions in the finite element analysis are close to those of the test. Fixed boundary conditions are used within 200 mm of the bottom and top ends of the bearing platform.
Assuming that the core-filled concrete is strongly bonded to the inner wall of the pile, the bond slip between the two components is neglected in the finite element calculation, and the relationship between the two components is considered to be a “binding constraint”. During the loading process, cracks appear between the sidewall of the pile body and the bearing platform, so the bond slip between the pile body and the bearing platform is neglected, and Coulomb contact is used. Coulomb contact is adopted between the bottom of the pipe pile cutoff and the bearing platform. The core-filling concrete and bearing concrete are modeled by merging. Reinforcement bars are directly embedded in the concrete, and the numerical simulation neglects the error generated by the slip between the steel bar and the concrete structure.
According to the geometrical characteristics of the concrete and reinforcement, the concrete and reinforcement in the model are modeled by 8-node 3D solid units (C3D8R) and 2-node 3D truss units (T3D2), respectively, in a separated manner and coupled by embedded technology.
In this model, pile concrete, prestressing steel rods, and pile hoops are used in the structured meshing technique. The meshing of the finite element model is shown in Figure 7.
The initial prestressing force is applied in ABAQUS software using the cooling method. The simulation is realized by using segmentation, where the prestressing tendons at the head part of the truncated pile are divided into 20 equal segments of prestressing loss segments, each segment is given a different coefficient of expansion, which is increased from 0 to 1.2e-5, and the transfer of prestressing tendons at the truncated pile part is realized through the change in the coefficient of expansion.
During the prestressing application, nonprestressed components such as bearing platforms and core filling were deactivated and reactivated after prestressing was applied. The stress cloud of the pipe pile after prestressing application is shown in Figure 8.
4.2. Finite Element Model Validation
During the model validation process, the same material property data as in the foot-scale tests were used for characterizing the concrete and reinforcing steel(refer to Section 1.1 for more details).
4.2.1. Skeleton Curve Comparison
In the finite element analysis, according to the results of the material property test, fivefold and threefold models are used for reinforcement with and without the yielding stage, respectively, as shown in Figure 9 and Figure 10. Specific test parameters are listed in Table 2.
The numerical simulation loading scheme is the same as the loading scheme of the indoor foot-scale test, and the load-top displacement skeleton curves of the finite element calculation and the test are shown in Figure 6. The data indicate that the calculated skeleton curve agrees well with the test skeleton curve.
4.2.2. Nodal Load Capacity Comparison
A comparison of the numerically simulated nodal load capacity with the test nodal load capacity is shown in Table 3.
As shown in Table 3, the specimens in the test have greater positive shear force and bending moment than negative shear force and bending moment. When the node embedment depth is increased from 200 mm to 300 mm, the ultimate shear force and ultimate bending moment of the specimens greatly increase; among these specimens, the positive and negative ultimate shear forces and bending moments increase by 57.60% and 54.60%, respectively, an average increase of 56.10%. The ultimate bending moment is the result of the ultimate shear multiplied by 1.8 m (the distance between the pile top loading point and the cap surface).
The nodal bearing capacity in the numerical simulation is 0.94 to 0.99 times the nodal bearing capacity in the test, which is in favorable agreement. The pile end displacement at the top of the pipe pile in the numerical simulation is 0.60 to 1.00 times the pile end displacement in the test, and there is a certain difference between the pile end displacement in the numerical simulation and the pile end displacement during the test. Overall, the numerical simulation is accurately predicts the bearing capacity.
The main factors causing differences between the simulation results and the test results are as follows: (1) There are certain differences between the ontological relationships among the concrete, reinforcement and other components and between the actual stress–strain relationships, and the test process of the concrete under repeated loading continues to crack and close, and its strength continues to decline with further simulation. (2) There is a difference between the contact relationships between the concrete, steel reinforcement and other components and the actual contact. Reinforced components are built into the concrete, and the bond-slip effect of the reinforcement is neglected in the simulation. (3) The axial force at the top of the pile is not completely constant during the loading process of the test, while the axial force can be maintained constant during the calculation process when performing finite element analysis. (4) During testing, the slide movement and the displacement of the top of the pile cannot be synchronized, which leads to a certain horizontal component force in the vertical tension. These factors lead to differences between the simulation results and the test results in terms of the force and displacement.
Despite the influence of the above unfavorable factors, the finite element analysis results agree with the test results, which demonstrates that the parameters and methods used in the finite element simulation are correct. This fact can be used as a basis for further analysis of the connection node of prestressed concrete pipe piles and bearing platforms.
4.2.3. Comparison of Node Destruction Patterns
The concrete damage clouds from the numerical simulation results of specimens with embedment depths of 200 mm and 300 mm are listed in Figure 11.
As shown in Figure 11, the tensile damage of the pile body and bearing platform is greater than the compression damage, and the pile body is not crushed during the loading process. Compared with that at an embedment depth of 200 mm, greater tensile damage to the pile body occurs at an embedment depth of 300 mm. These phenomena agree well with the phenomena of the footing test, which also proves that the numerical simulation results are more accurate.
4.3. Bearing Capacity of the Pipe Piles Filled with Core Longitudinal Reinforcement Anchored into Bearing Platform Nodes (Type I Nodes)
The Type Ⅰ node is the node of a tubular pile filled with core longitudinal bars anchored into the bearing platform and is commonly used in engineering. The specific structure is shown in Figure 3. The two node specimens used in this test were Type Ⅰ, and the numerical simulation of these specimens with embedded depths of 200 mm and 300 mm was performed by using the parameters of the test material properties.
To ensure that the simulation results are universally applicable, the material property parameters shown in Table 1 are used in the numerical analysis process of Type I, Type II and Type III nodes instead of using the material property parameters in the foot-measurement test, while the modeling method is the same as that in Section 3.1.
C30 concrete is used for core-filling and bearing platform concrete, and C80 concrete is used for pipe piles.
Pile hoops, pile prestressing steel rods, core-filling hoops, core-filling anchoring steel bars, and bearing platform reinforcements are used in the elastic reinforcement model, i.e., the bifold model, which includes elastic and reinforced segments, where the steel is perfectly elastic before yielding, the stress‒strain relationship after yielding is simplified as a very smooth sloping straight line, and the Young’s modulus of the steel bar after yielding is 0.01 times the Young’s modulus before yielding [26].
According to the “Prestressed Concrete Pile”[23], the specified nonproportional elongation strength of prestressed steel rods should not be less than 1280 MPa, and the standard tensile strength should not be less than 1420 MPa. According to Article 6.4 of the “Cold-Drawn Low-Carbon Steel Wire for Concrete Products”[27], the tensile strength of cold-drawn low-carbon steel wire should not be less than 550 MPa, and the elongation at break should not be less than 2.0%. The ABAQUS models of the physico-mechanical parameters of the steel rods and hoops are listed in Table 4.
Based on the correct model verification, a numerical simulation was performed for the specimens of tubular piles with core-filled longitudinal bars anchored into the bearing node for the specimens with embedment depths ranging from 50 to 500 mm. The results of this numerical simulation are listed in Table 5.
As shown in Table 5, for a Type I node, when the embedment depth is less than or equal to 300 mm (0.50 times the pipe pile outer diameter D), the node bending moment is mainly provided by the core-filling longitudinal reinforcement and the bearing concrete on the pile side. Under the repeated action of tensile and compressive loads, the bearing platform concrete was damaged by the extrusion of the pipe pile, and this damage to the bearing platform concrete in the loading direction was greater than that to the concrete on both sides of the loading direction. No compressive damage occurred in the concrete body of the tubular pile. When the bearing platform concrete near the node is damaged, the node becomes an articulation point.
For a Type I node, after the embedment depth is greater than or equal to 350 mm (0.58D), the node-bearing capacity essentially remains unchanged. Therefore, after the embedment depth exceeds 350 mm, the damage to the node is considered to be caused by damage to the pile body. According to the node-bearing capacity, the recommended embedment depth is 350 mm.
4.4. Bearing Capacity of the Tubular Pile Body Longitudinal Bars Anchored into the Bearing Platform Node (Type II Node)
When the project cut off the pile, the PHC pipe pile body concrete and spiral hoop tendons were truncated, and the prestressing longitudinal tendons were retained. A small wire lassoing machine was used to close the end of the prestressing longitudinal tendons, and a bolt anchor head was screwed into the end of the wire fastener to increase the anchorage performance of the prestressing steel rods. A detailed illustration of the node is shown in Figure 12.
The finite element simulation results of the bearing capacity of tubular pile body longitudinal bars anchored into the bearing node under the same loading conditions are listed in Table 5.
As shown in Table 5, when the embedment depth is less than or equal to 250 mm (0.42D), the ultimate bearing capacity of the Type II node is greater than that of the Type I node. When the embedment depth is greater than or equal to 300 mm (0.50D), the ultimate bearing capacity of the Type II node is smaller than that of the Type I node. When the embedment depth is greater than or equal to 200 mm (0.33D), the Type II node-bearing capacity basically remains constant. The maximum bearing capacity of Type II nodes is smaller than that of Type I nodes. Therefore, Type II nodes are not recommended.
4.5. Tubular Pile Body Longitudinal Reinforcement Anchored into the Bearing Platform + Tubular Pile Core-Filling Longitudinal Reinforcement Anchored into the bearing Platform Node (Type III Node)
When the project was cut off, the concrete and spiral hoop bars of the PHC pipe pile body were truncated, and the prestressing longitudinal bars were retained. A small wire lassoing machine was used to close the ends of the prestressing longitudinal bars, and a bolt anchor head was screwed into the end of the wire fastener to increase the anchorage performance of the prestressing steel bars. A detailed illustration of the node is shown in Figure 13.
A comparison of the ultimate bearing capacities of Type III nodes and Type I nodes under the same loading conditions is shown in Table 5.
As shown in Table 5, the ultimate bearing capacity of Type III nodes is not less than that of Type I and Type II nodes. When the embedment depth is greater than or equal to 200 mm (0.33D), with increasing embedment depth, the node-bearing capacity essentially remains constant. Therefore, the recommended embedment depth is 200 mm.
The maximum bearing capacities of Type I and Type III nodes are similar, and the average values are approximately 698.95 kN·m and -708.71 kN·m, respectively. The bearing capacities of the Type Ⅱ nodes are approximately 564.84 kN·m and -575.75 kN·m. The reinforced concrete filling has a great effect on the bearing capacity of the node, in which the positive growth rate is approximately 23.74%, and the negative growth rate is approximately 23.09%.
Considering that the numerical simulation does not consider the error caused by the slip between the steel bar and the concrete structure, the simulated pile top displacement is smaller than the actual pile top displacement, and the embedment depth can be appropriately increased in the project.
In terms of bearing capacity, in actual engineering, when the embedment depth is deep, Type I nodes are recommended, and the embedment depth is 350 mm. When a deep embedment depth is unavailable, Type III nodes with an embedment depth of 200 mm are recommended.
In Article 4.4.4 of “The Building Seismic Testing Procedures”[24] (JGJ/T 101-2015), the damage characterization test under the bearing capacity should be loaded to the descending section of the test curve, and the descending value should be controlled to 85% of the ultimate load. In the simulation, when the displacement is ±27 mm, the bearing capacity of the specimen basically decreases to 85% of the ultimate load; the skeleton curves of Type Ⅰ, Ⅱ and Ⅲ nodes less than or equal to the optimal embedment depth are plotted in Figure 14.
As shown in Figure 14, when the optimal embeddedness depth is less than or equal to the optimal embeddedness depth, the embeddedness depth of the node has a great influence on the ultimate bearing capacity of the node. The skeleton curve can be divided into an elastic stage, an elastoplastic stage and a plastic stage. The initial stiffness of Type Ⅰ nodes increases with increasing embedment depth. The embedment depth has little effect on the initial stiffness of Type II and Type III nodes.
4.6. Node-Bearing Capacity under different Vertical Tensile Forces
For the recommended node types and their optimal embedment depths, their node-bearing capacity is analyzed under different uplift force conditions. Since the core-filled longitudinal reinforcement is made of six 18 mm diameter HRB400 grade bars, the maximum tensile force that can be withstood by the bars before yielding is 610.42 kN. According to reference [23], the design value of the axial tensile bearing capacity of the PHC B600-130 pipe pile body is 1700 kN, so the vertical force in this paper adopts a loading interval of 170 kN, from 0 to 510 kN. The finite element calculation results of the bearing capacity of the pipe pile cap nodes under different vertical tensile forces are shown in Table 6.
The skeleton curves of Type I and Type III nodes with optimal embeddedness under different vertical pulling forces are drawn in Figure 15.
As shown in Table 6 and Figure 15, the node ultimate load capacity decreases after the increase in vertical tension, and the displacement corresponding to the ultimate load capacity remains basically unchanged.
After reaching the optimum embedment depth of Type Ⅰ and Type Ⅲ nodes, the bearing capacity of the nodes decreases with increasing vertical tension. When the vertical tension increases from 0 to 510 kN, the positive and negative bearing capacities decrease by 7% and 10%, respectively, for Type I nodes and both decrease by 10% for Type III nodes.
5. Conclusion
In this paper, two PHC piles and bearing platform connection nodes were tested with low weakly reciprocating loads, and the test phenomena and node-bearing capacity were analyzed. Finite element analysis software was used to validate the test model, and the bearing capacity of nodes with different node types and embedment depths was analyzed. Thus, optimal node type and optimal embedment depth were proposed; the main conclusions are as follows:
(1) According to the test results, under tension-bending-shear, buckling damage occurs in the node area bearing the platform concrete. When the anchorage bars in the node area yield, the constraint is weakened, the articulation point is formed, and the rotation capacity of the node is increased. Additionally, as the embedment depth increases from 200 mm to 300 mm, the forward and backward node ultimate bearing capacities increase by 57.60% and 54.60%, respectively.
(2) From the bearing capacity perspective, it is recommended to use a core-filled anchored steel node (Type I node) with a recommended embedding depth of 350 mm, which is 0.58 times the diameter of the tubular pile. And it is recommended to use a tubular pile body longitudinal reinforcement anchored into the bearing platform + tubular pile core-filled longitudinal reinforcement anchored into the bearing platform node (Type III node) with a recommended embedding depth of 200 mm, which is 0.33 times the diameter of the tubular pile. The Type II node is not recommended. Considering that the numerical simulation does not consider the error caused by the slip between the steel bar and the concrete structure, the simulated pile top displacement is generally smaller than the actual pile top displacement, and the embedment depth can be appropriately increased in the project.
(3) When the embedment depth is greater than or equal to the maximum bearing capacity embedment depth, the destruction of the pipe pile body plays a decisive role. Throughout the loading process, the concrete of the pile body on the side of the horizontal loading direction first undergoes tensile damage, and as the horizontal loading proceeds, the concrete of the pile body on the back of the loading direction begins to undergo compressive damage. After the concrete is under pressure, the specimen is damaged.
(4) When the vertical tension increases from 0 to 510 kN, the positive and negative bearing capacities decrease by 7% and 10%, respectively, for Type I nodes at the optimal embedment depth of 350 mm. And the positive and negative bearing capacities both decrease by 10% for Type III nodes at the optimal embedment depth of 200 mm.
Author Contributions
Conceptualization, Yasheng Liu and Zhaosheng Guo; methodology, Zhaosheng Guo, Wubin He and Yasheng Liu; software, Yasheng Liu, Jingyue Wang and JingZhao; validation, Yasheng Liu and Zhaosheng Guo; formal analysis, Yasheng Liu; investigation, Zhaosheng Guo and Wubin He; resources, Zhaosheng Guo and Wubin He; data curation, Yasheng Liu and Zhaosheng Guo; writing—original draft preparation, Yasheng Liu; writing—review and editing, Yasheng Liu, Zhaosheng Guo and Xinsheng Ge; visualization, Yasheng Liu; supervision, Zhaosheng Guo, Wubin He and Xinsheng Ge; project administration, Zhaosheng Guo and Wubin He; funding acquisition, Zhaosheng Guo and Wubin He. All authors have read and agreed to the published version of the manuscript.
Funding
This research was funded by the Technology Project of the State Grid Corporation of China, grant number 5200-201918118A-0-0-00.
Data Availability Statement
Restrictions apply to the availability of these data. Data were obtained from the Technology Project of the State Grid Corporation of China and are available from the authors with the permission of third party.
Acknowledgments
The authors would like to acknowledge (1) the Technology Project of the State Grid Corporation of China and (2) the Science and Technology Innovation Project of Colleges and Universities of Shanxi Province for their support of this study under grant nos. 5200-201918118A-0-0-00 and 2021L013.
Conflicts of Interest
The authors declare no conflicts of interest.
References
- Madasamy Arockiasamy, P.E., P. Eng., F., Prakash Ankitha Arvan, M. Behavior, Performance, and Evaluation of Prestressed Concrete/Steel Pipe/Steel H-Pile to Pile Cap Connections. Pract. Period. Struct. Des. Constr. 2022, 27, 03122001–1. [Google Scholar] [CrossRef]
- Zhao Cheng, Sri Sritharan. Outdoor Test of a Prefabricated Column-Pile Cap-Pile System under Combined Vertical and Lateral Loads. J. Bridge Eng. 2020, 25, 04020052–1. [Google Scholar] [CrossRef]
- Guangda Zhang, Qiang Han, Kun Xu, Xiuli Du, Weili He. Quasi-static tests of CFST embedded RC column-to-precast cap beam with socket connection. Eng. Struct. 2021, 241, 1–18. [Google Scholar] [CrossRef]
- Lenci Kappes, Michael Berry, M. ASCE, Flynn Murray, Jerry Stephens, Kent Barnes. Seismic Performance of Concrete-Filled Steel Tube to Concrete Pile-Cap Connections. J. Bridge Eng. 2016, 21, 1–17. [Google Scholar]
- M. Steunenberg, R. G. Sexsmith, S. F. Stiemer. Seismic Behavior of Steel Pile to Precast Concrete Cap Beam Connections. J. Bridge Eng. 1998, 3, 177–185. [Google Scholar] [CrossRef]
- Young-Ho Kim, Jae-Yoon Kang, Sang-Ho Kim, Dae-Jin Kim. Structural Performance of Steel Pile Caps Strengthened with Perfobond Shear Connectors under Lateral Loading. Appl. Sci. 2016, 6, 1–11. [Google Scholar]
- Pedram Sadeghian, Yu Ching Lai, Amir Fam. Testing and Modeling of a New Moment Connection of Concrete-Filled FRP Tubes to Footings under Monotonic and Cyclic Loadings. J. Compos. Constr. 2011, 15, 653–662. [Google Scholar] [CrossRef]
- Pedram Sadeghian, Amir Fam. Closed-Form Model and Parametric Study on Connection of Concrete-Filled FRP Tubes to Concrete Footings by Direct Embedment. J. Eng. Mech. 2011, 137, 346–354. [Google Scholar]
- Carlos, A. Blandon, Jared K. Bell, José I. Restrepo, Max Weismair, Omar Jaradat, Peter Yin. Assessment of Seismic Performance of Two Pile-Deck Wharf Connections. J. Perform. Constr. Facil. 2011, 25, 98–104. [Google Scholar] [CrossRef]
- Charles, W. Roeder, Robert Graff, Jennifer Soderstrom, Jung Han Yoo. Seismic Performance of Pile-Wharf Connections. J. Struct. Eng. 2005, 131, 428–437. [Google Scholar] [CrossRef]
- Dawn, E. Lehman, Charles Roeder, Stuart J. Stringer, Amanda Jellin. Seismic performance of improved pile-to-wharf deck connections. PCI J. 2013, 58, 62–80. [Google Scholar]
- Raymond, R. Foltz, James M. LaFave, Deuckhang Lee. Seismic performance of a structural concrete pile-wharf connection before and after retrofit. Structures 2022, 38, 874–894. [Google Scholar] [CrossRef]
- NiGuo-quan, Yangjun, Panpeng, Songer-xiang. Quasi-static Tests of Pile-cap Connections for the Prestressed Spun Concrete Square Piles. China Earthq. Eng. J. 2013, 35, 246–251. [Google Scholar]
- Chuanzhi Sun, Changqing Miao, Aiqun Li, Cheng Xian, Fangzhi Zhu. Experimental study on seismic performance of prestressed concrete solid pile using mechanical connection. World Earthq. Eng. (in Chinese). 2019, 35, 39–49. [Google Scholar] [CrossRef]
- Chuanzhi Sun, MeiLing Zhuang, Li Gao, Jun Yan, Teng Yu, Tao Liu. Experimental study on seismic performance improvement of pile-cap joints in a prestressed concrete solid square pile using a snap-in mechanical connection. J. Earthq. Eng. 2023, 27, 1–22. [Google Scholar] [CrossRef]
- Zhaosheng Guo. Study on seismic behavior and design method of phc pile-cap connections subjected to strong earthquake[D].Taiyuan University of Technology, 2018.(in Chinese).
- Guo, He, Bai, Chen. Seismic Performance of Pile-Cap Connections of Prestressed High-Strength Concrete Pile with Different Details. Struct. Eng. Int. 2017, 27, 546–557. [Google Scholar] [CrossRef]
- Wubin He, Xiangdong Cui, Zhaosheng Guo, Xiaohong bai. Experimental study of flexural capacity of joint between prestressed enhanced pipe pile and pile cap. Ind. Constr. (in Chinese). 2014, 44, 71–74+164. [Google Scholar] [CrossRef]
- Wubin He, Xiangdong Cui, Zhaosheng Guo, Xiaohong Bai. Analysis of the flexural properties on the connection of reinforced pile and pile cap under the horizontal load. Struct. Eng. (in Chinese). 2014, 30, 174–180. [Google Scholar] [CrossRef]
- YANG Zhi-jian, HAN Jia-ming, LEI Yue-qiang, Zhao Hai-Long, Hu Jia-Fei. Research On Seismic Performance Of Prestressed High Strength Concrete Pile-Cap Connections. Eng. Mech. 2019, 36, 248–254.
- Zhijian Yang, Guochang Li, and Bo Nan. Study on Seismic Performance of Improved High-Strength Concrete Pipe-Pile Cap Connection. Adv. Mater. Sci. Eng. 2020, 1–22.
- Wang Tiecheng, Yang Zhijian, Zhao Hailong, Wang Wenjin. Experimental Investigation and Finite Element Analysis of Prestressed High Strength Concrete Pile-Pile Cap Connections. J. Tianjin Univ. (Sci. Technol.) 2015, 48, 527–534. [Google Scholar]
- Ministry of Housing and Urban‒Rural Development of the People’s Republic of China. Prestressed concrete pipe pile: 10G409[S]. Beijing: China Planning Press, 2010. (in Chinese).
- Ministry of Housing and Urban‒Rural Development of the People’s Republic of China. Specification for seismic test of buildings: JGJ/T 101-2015[S]. Beijing: China Architecture & Building Press, 2015.(in Chinese).
- Ministry of Housing and Urban‒Rural Development of the People’s Republic of China. Code for design of concrete structures: GB 50010-2010[S]. Beijing: China Architecture & Building Press, 2011.(in Chinese).
- YANG Zhi-jian, LEI Yue-qiang. Finite Element Analysis Of The Shear Behavior Of Prestressed High-Strength Concrente Piles. Eng. Mech. 2020, 37, 200–207. (in Chinese). [Google Scholar]
- National Development and Reform Commission. Cold-drawn low-carbon wire for concrete products: JC/T 540-2006[S]. Beijing: China Architecture & Building Press, 2006.(in Chinese).
Figure 1.
Test loading device installation.
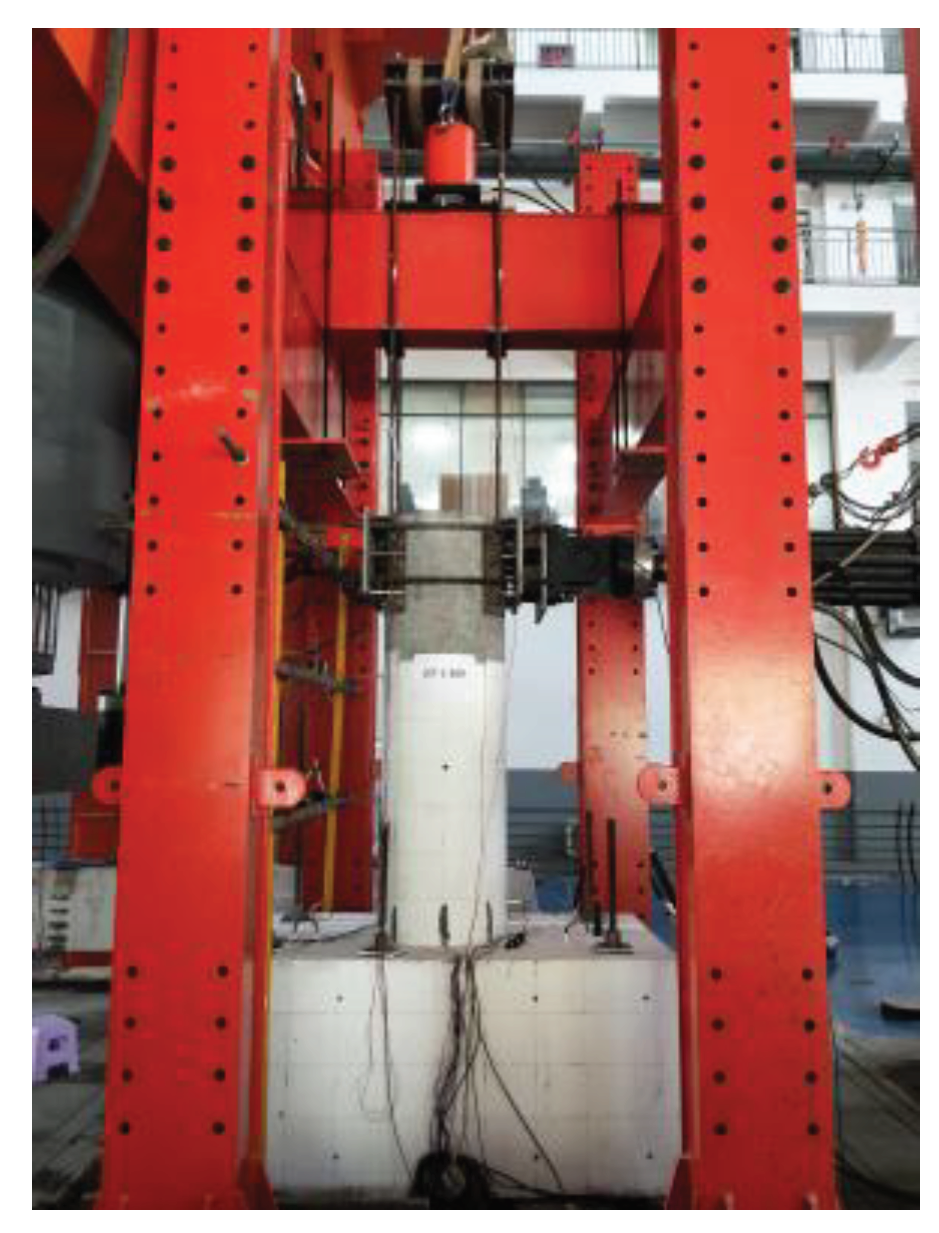
Figure 2.
Schematic of the test loading device.
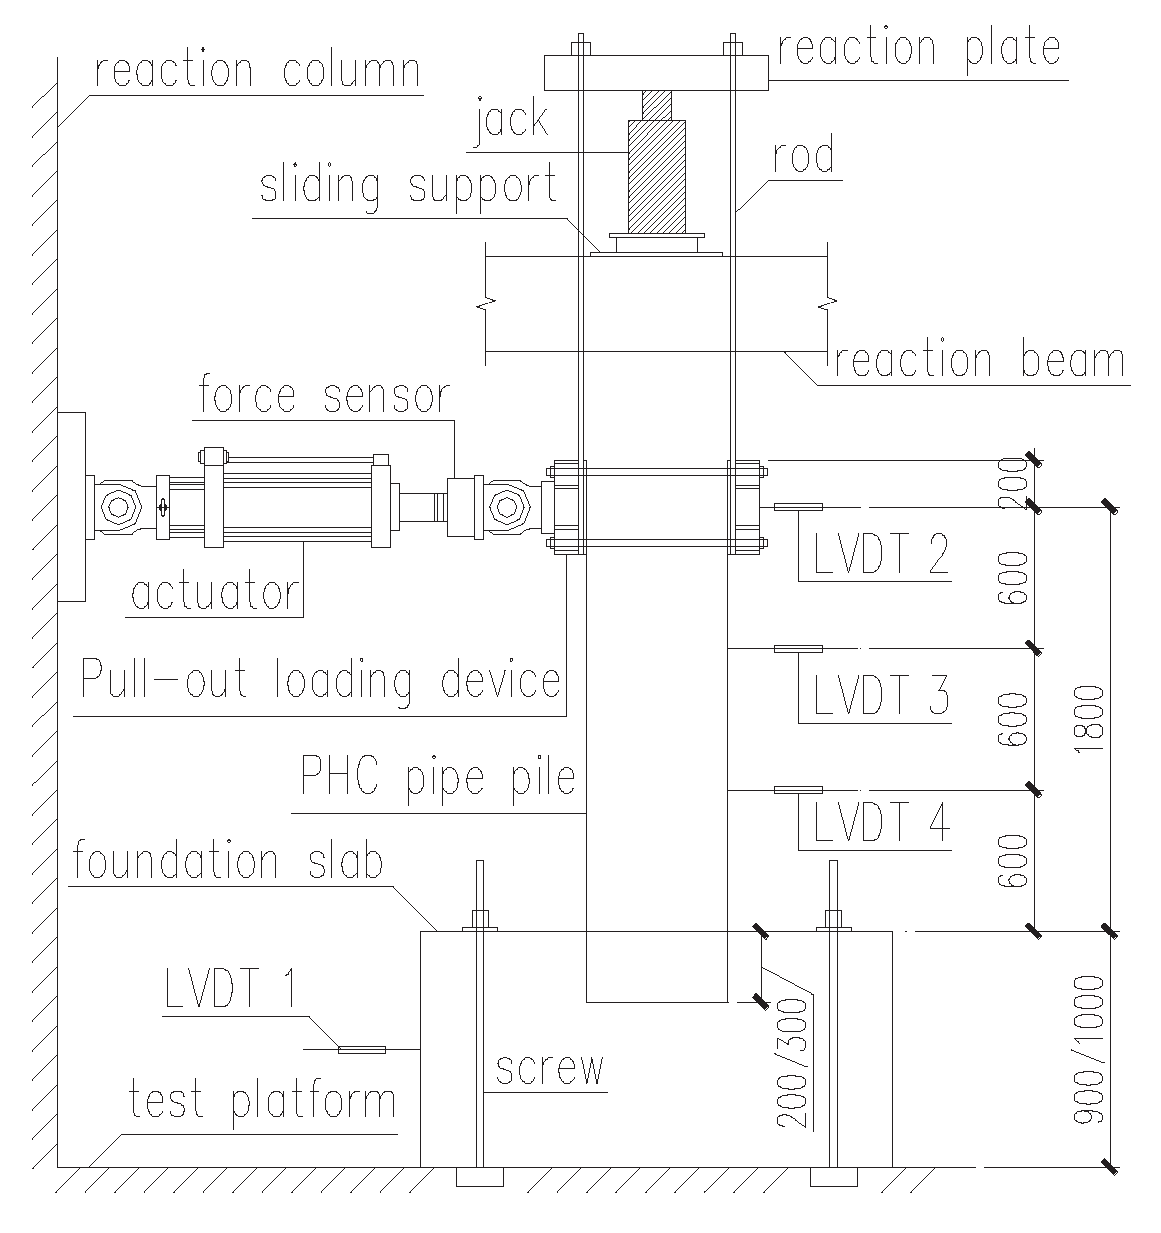
Figure 3.
Test construction details.
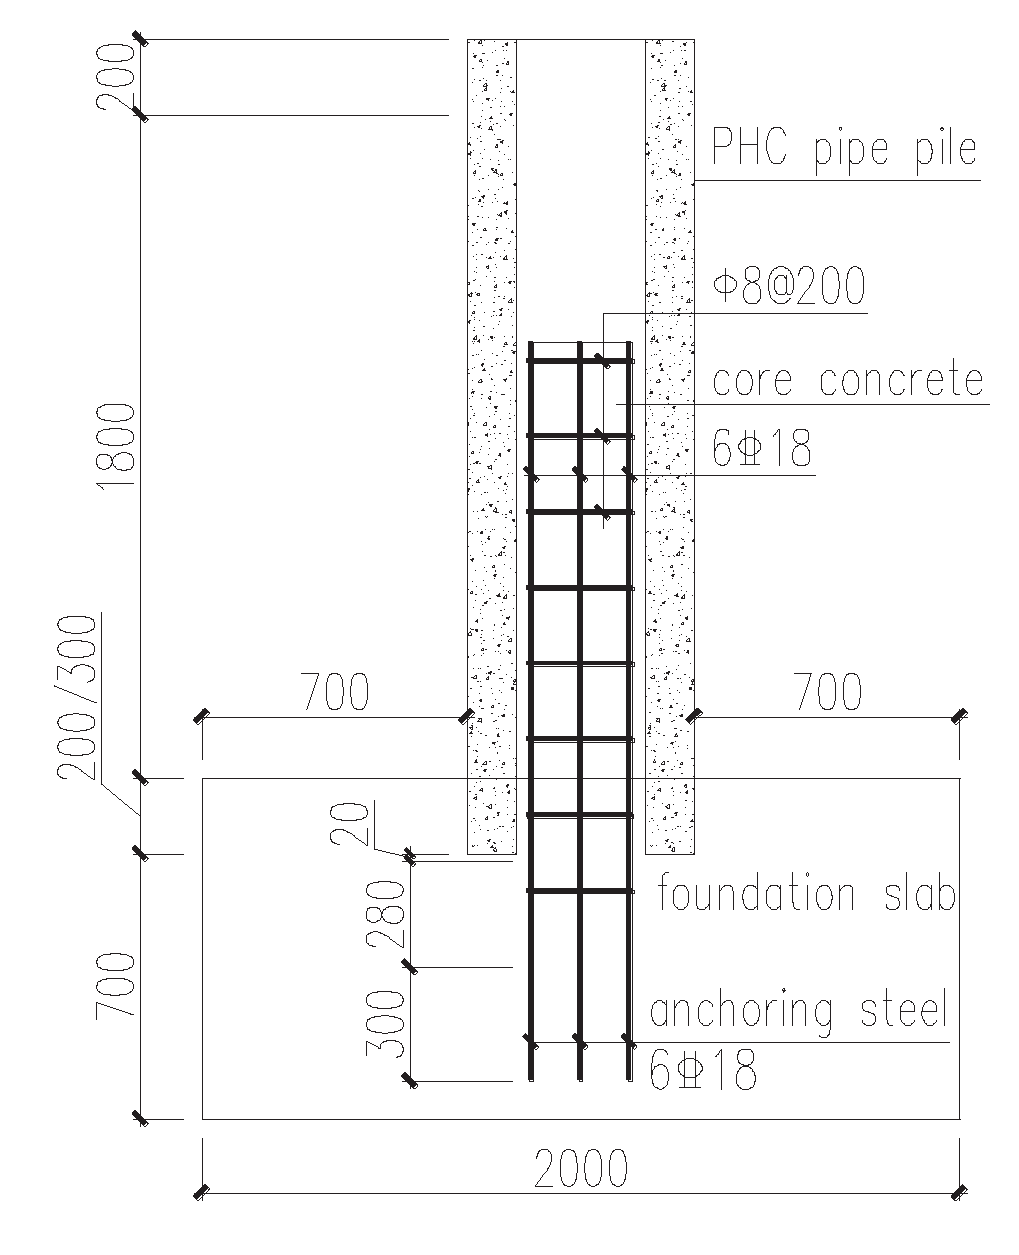
Figure 4.
Cracking diagram of specimen JCT-200.
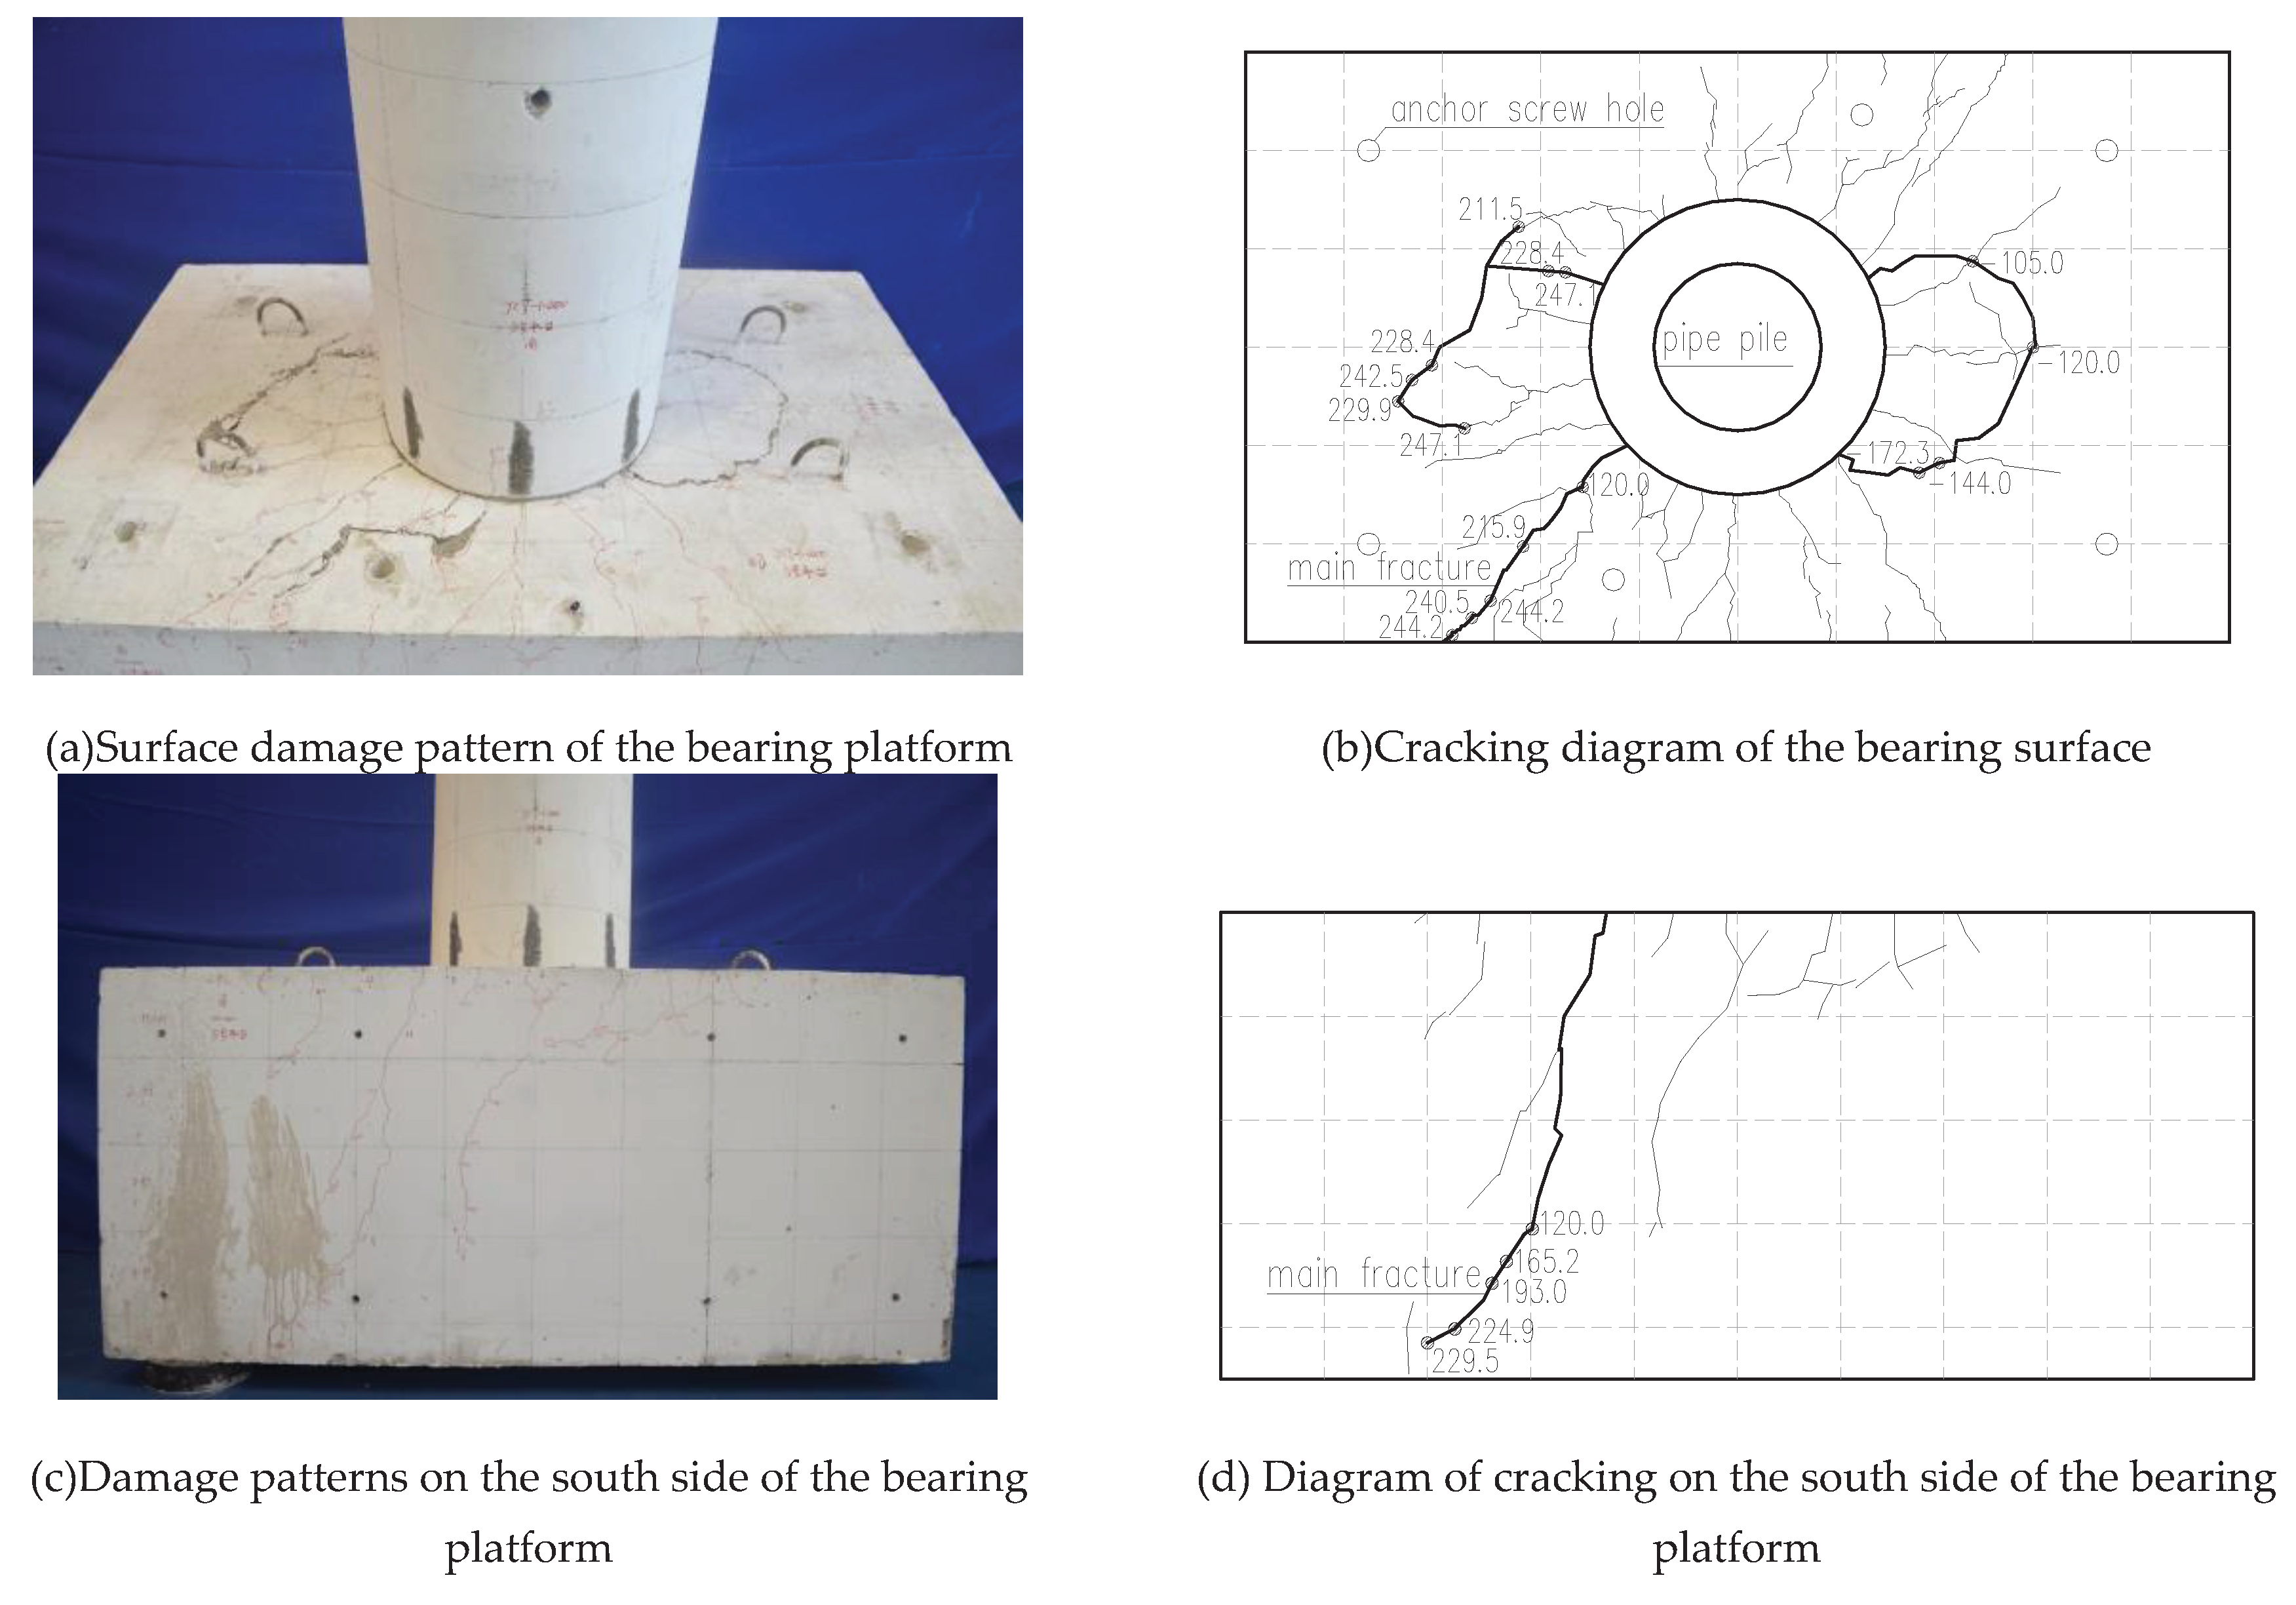
Figure 5.
Cracking diagram of specimen JCT-300.
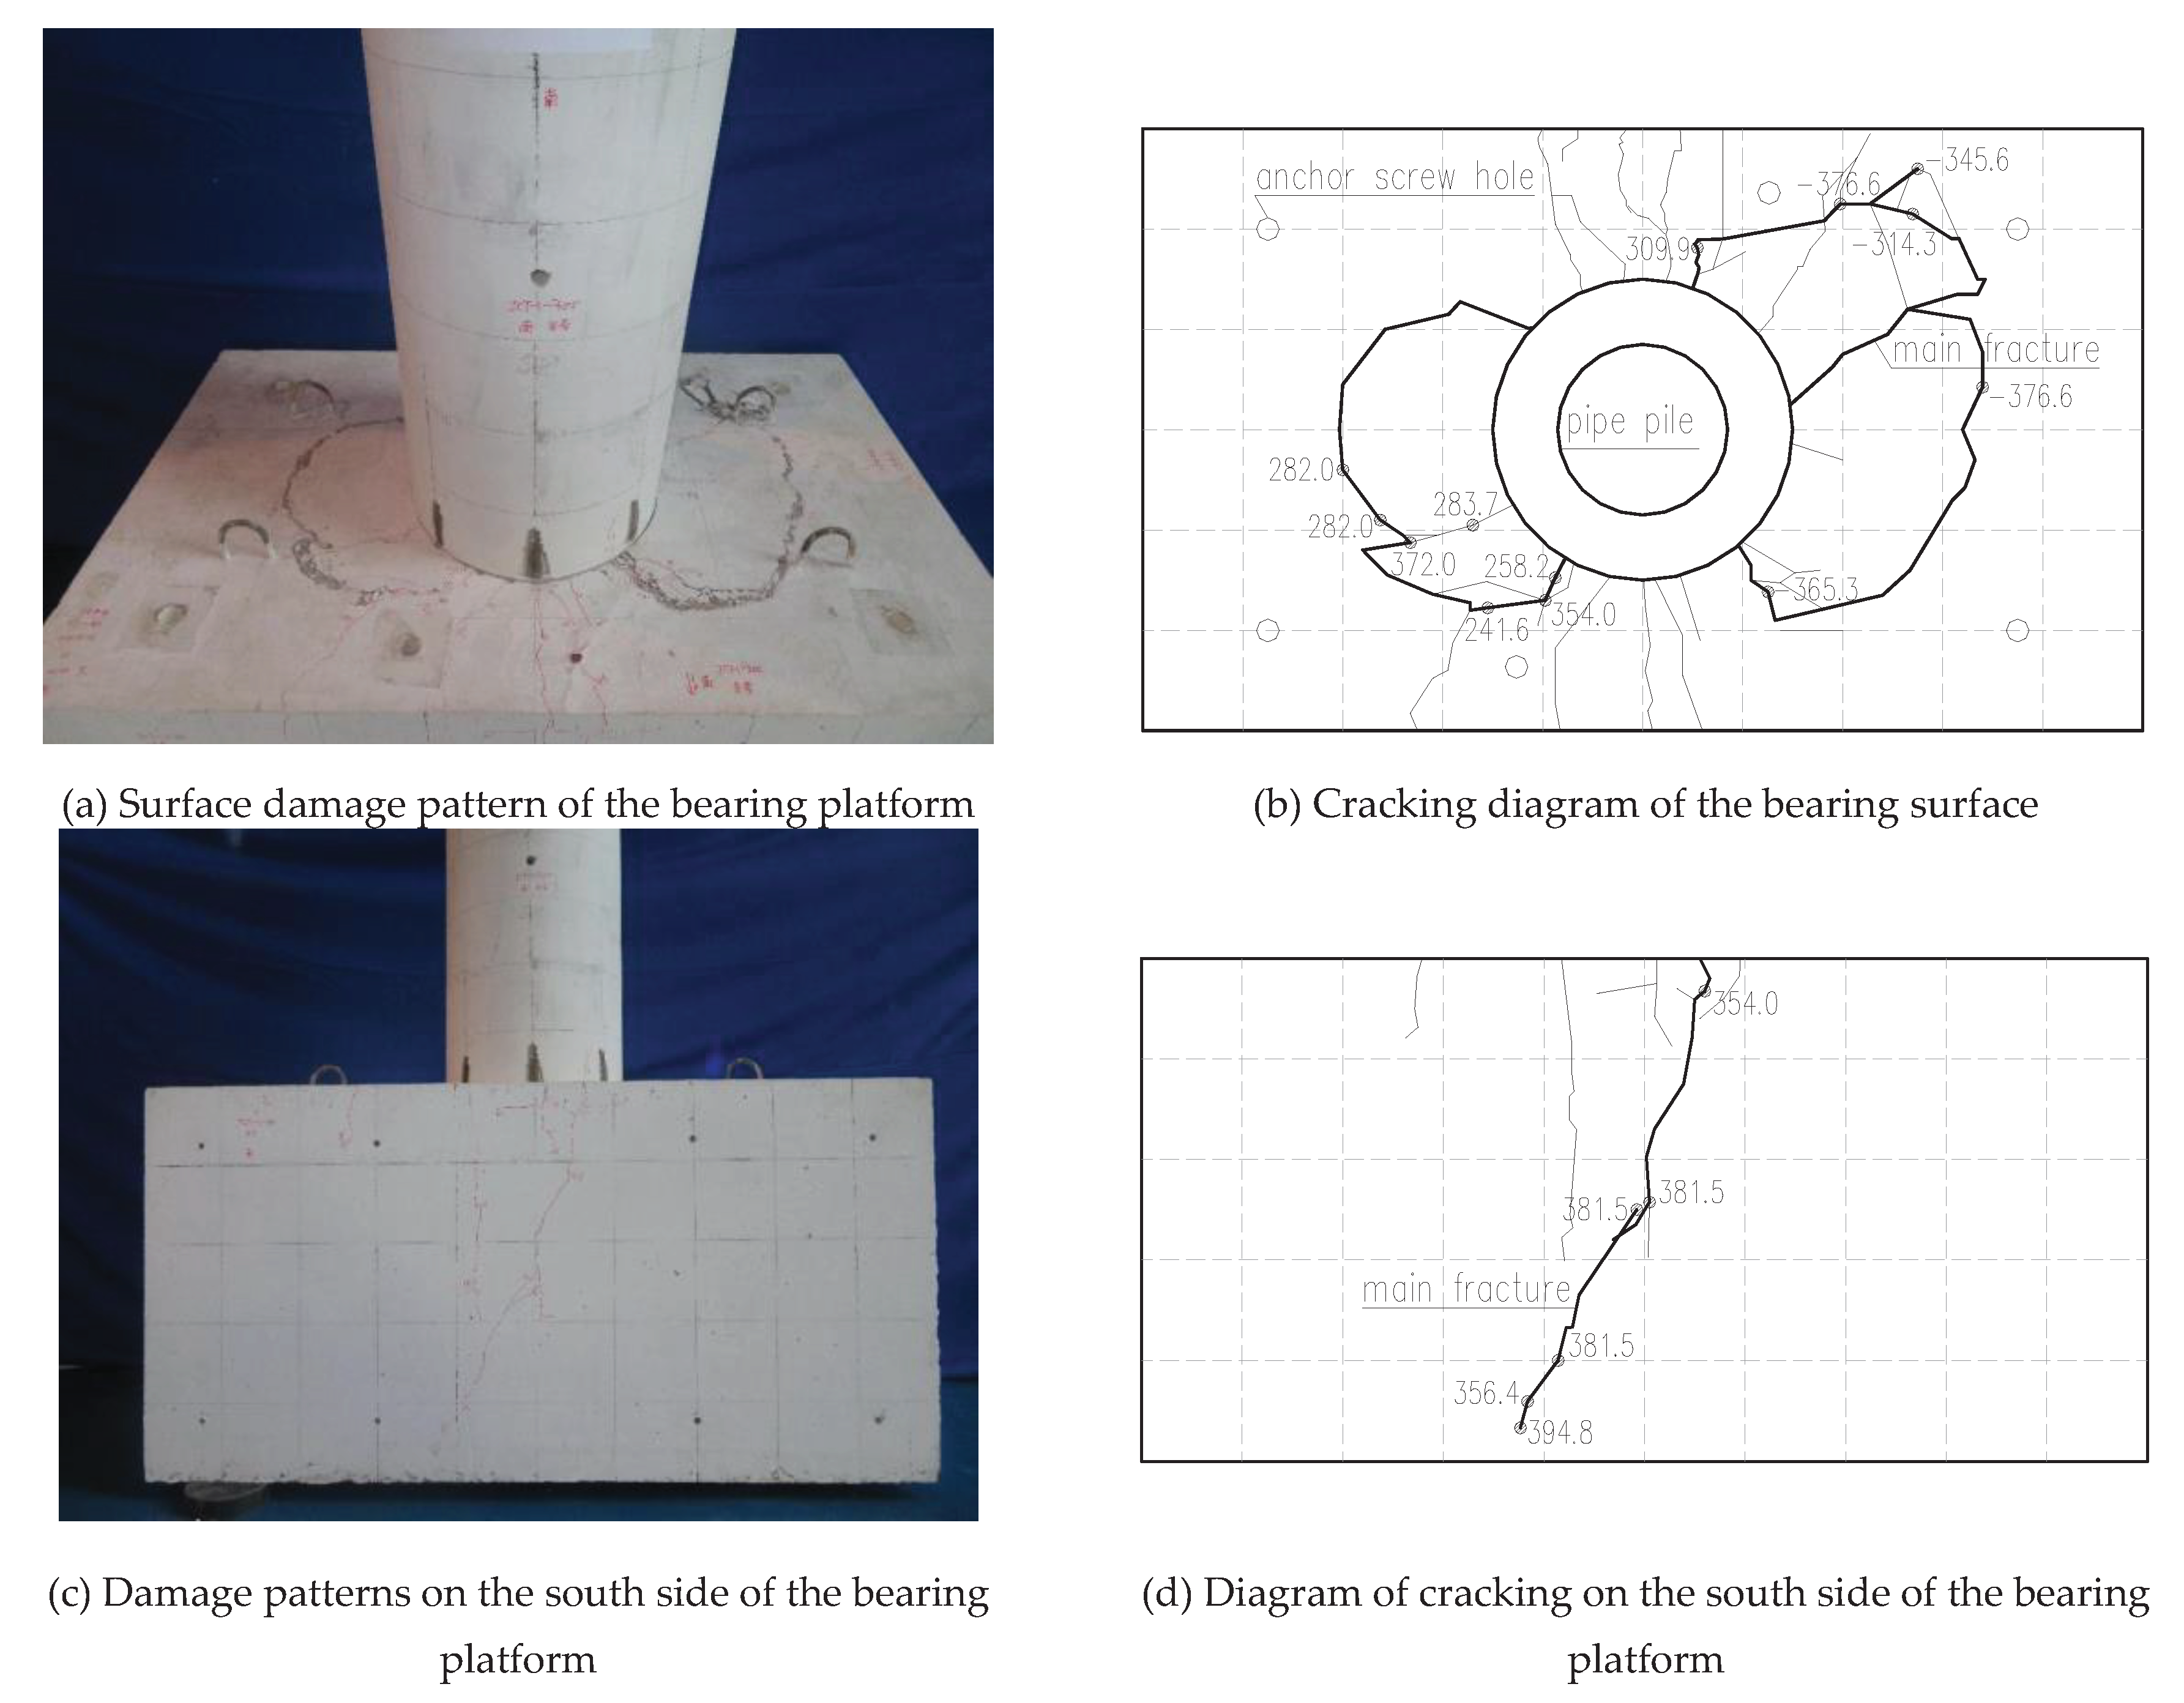
Figure 6.
Load–displacement skeleton curves.
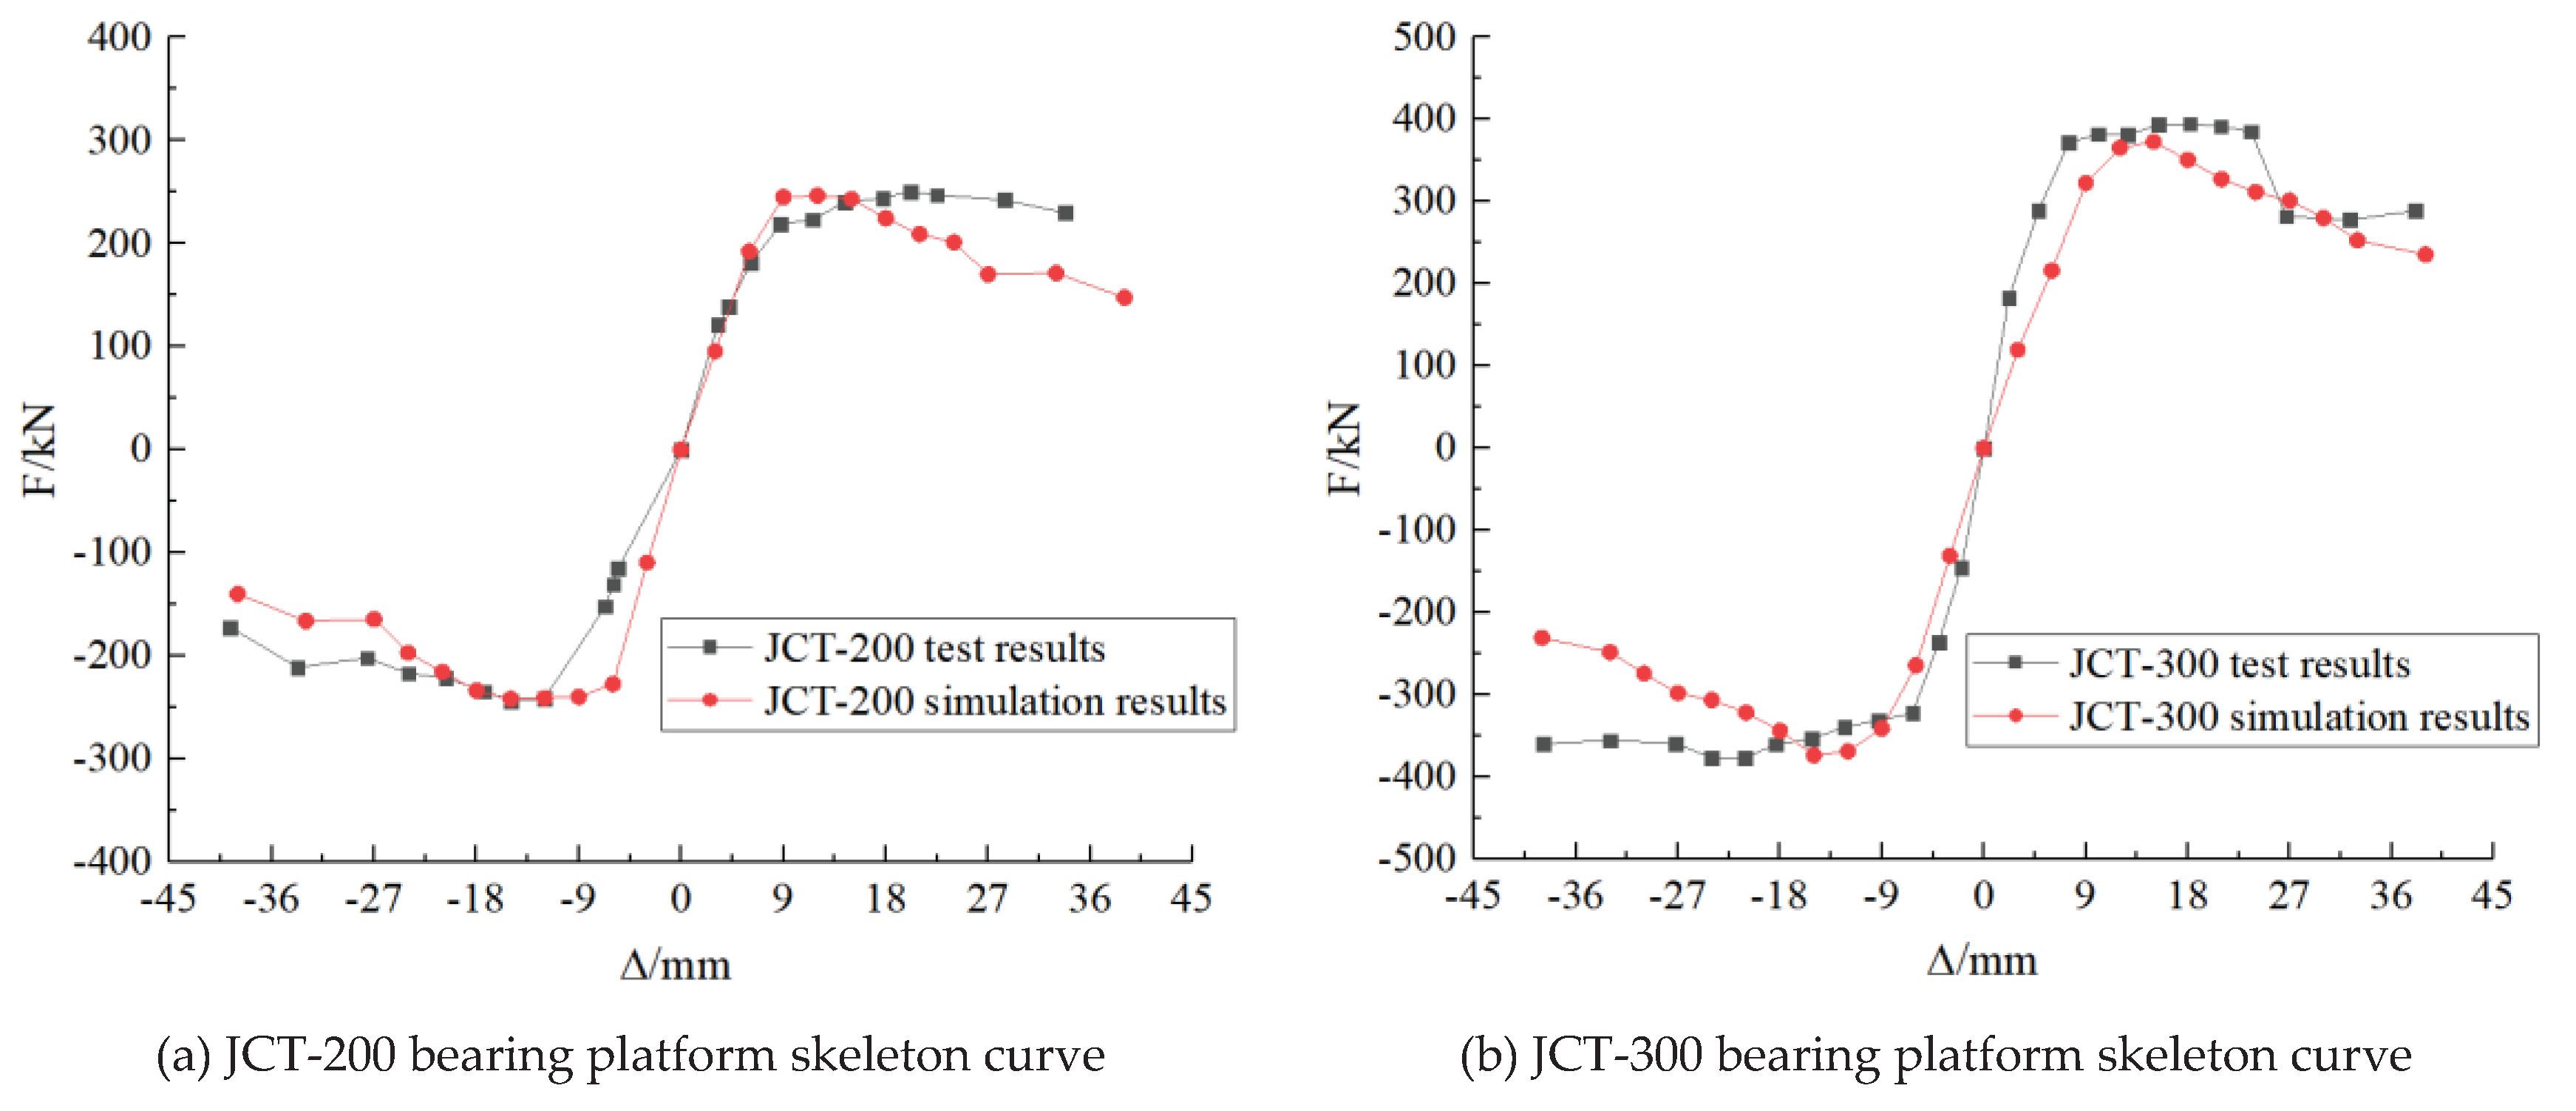
Figure 7.
Finite element model.
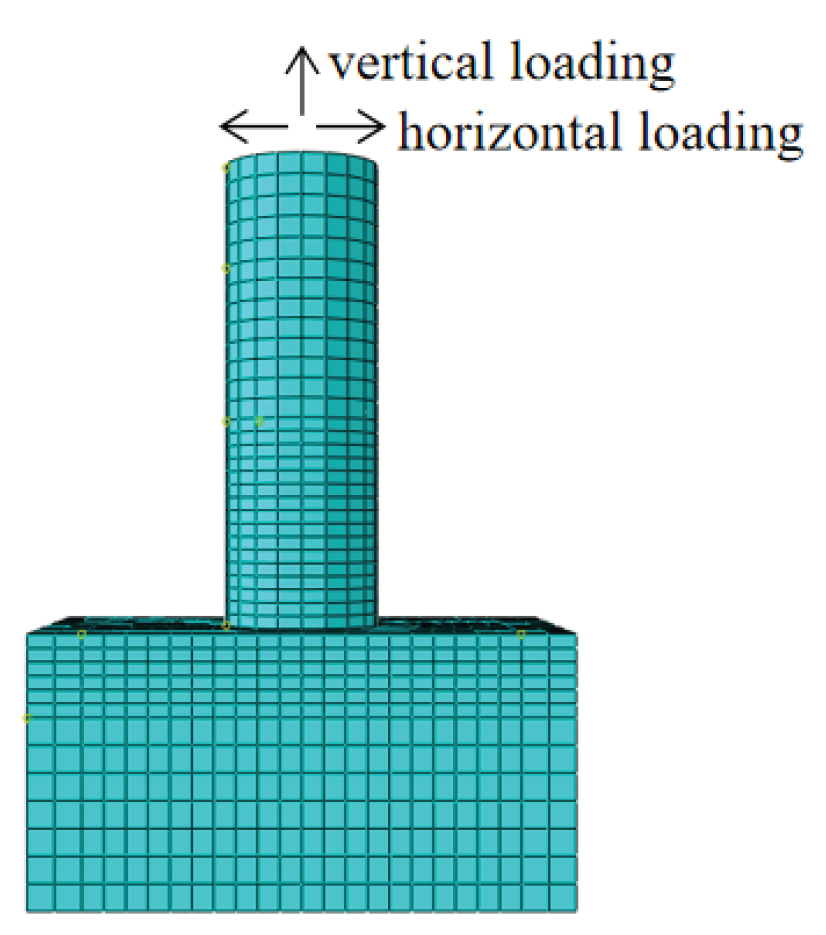
Figure 8.
Cloud diagram of pipe pile prestress after pile cutting.
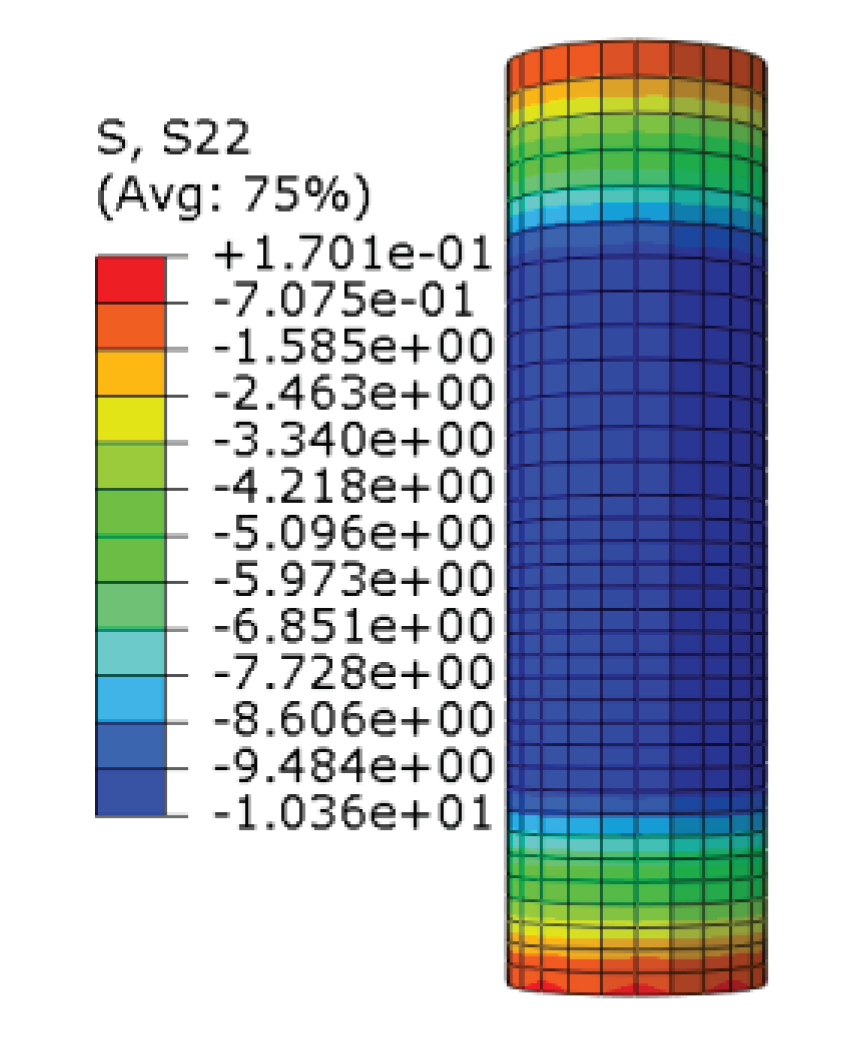
Figure 9.
Fivefold model of the steel bar.
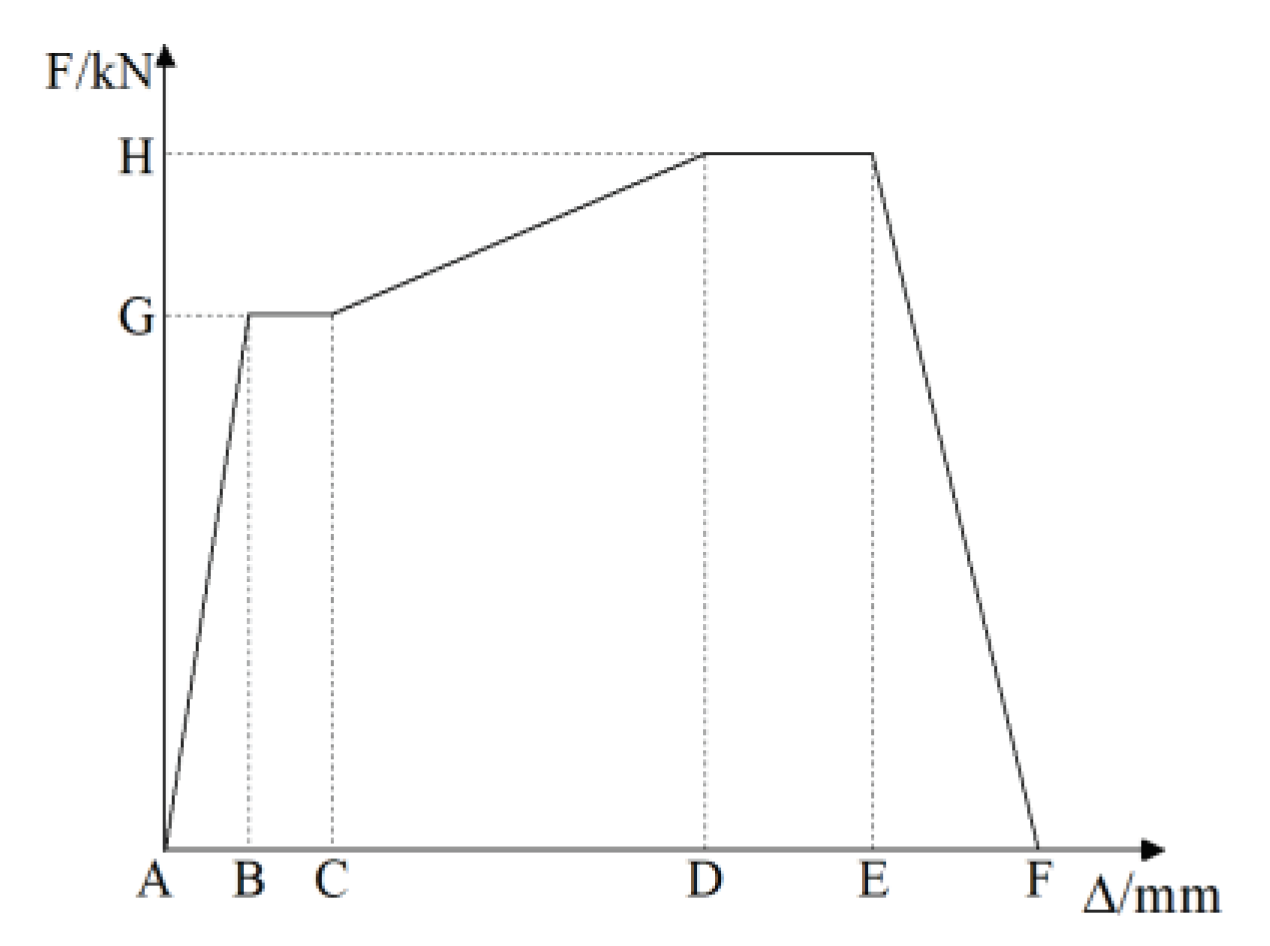
Figure 10.
Threefold model of the steel bar.
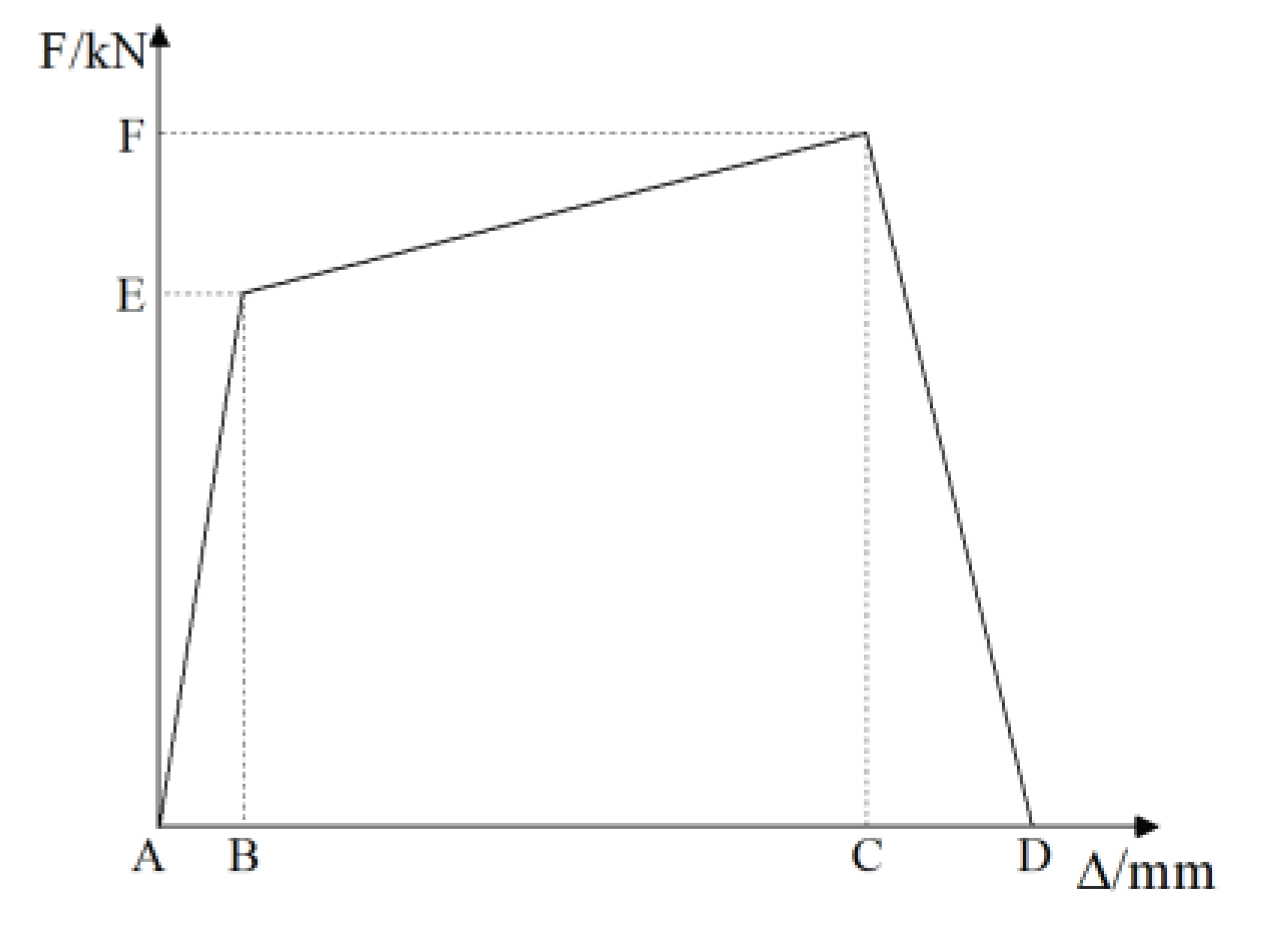
Figure 11.
Concrete damage cloud map of the pipe pile cap node.
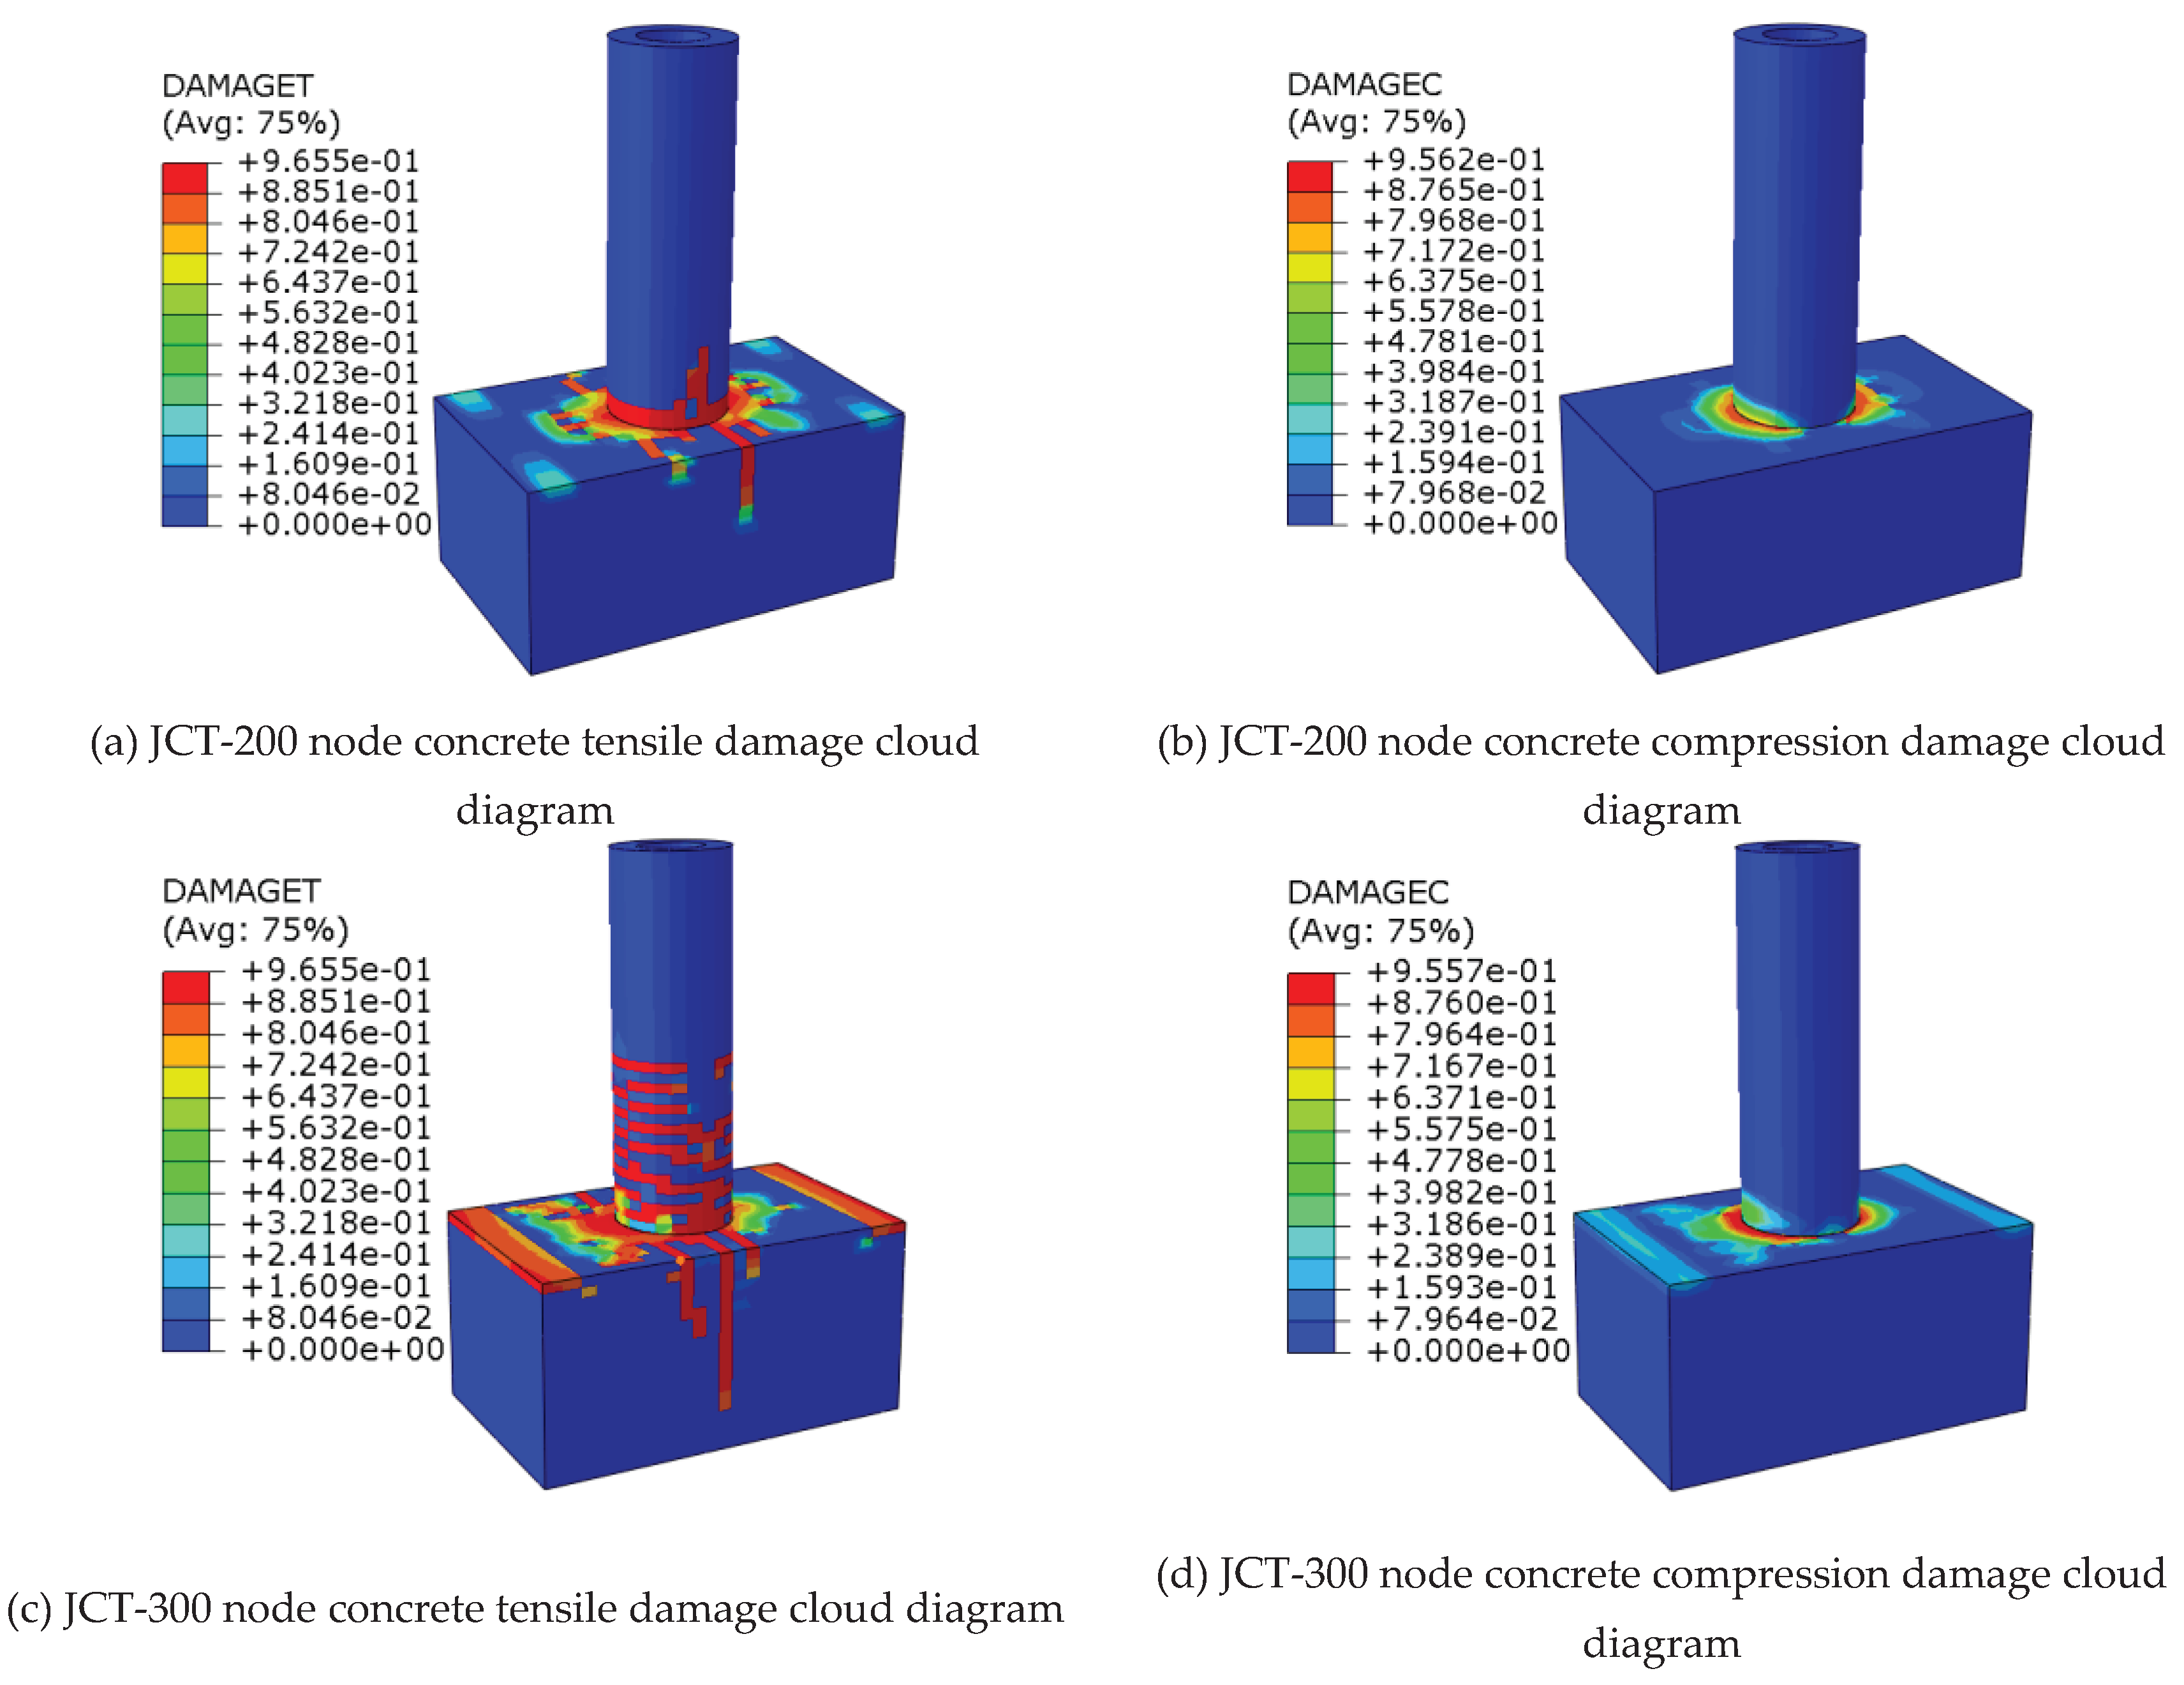
Figure 12.
Longitudinal bar of the pipe pile is anchored into the cap node.
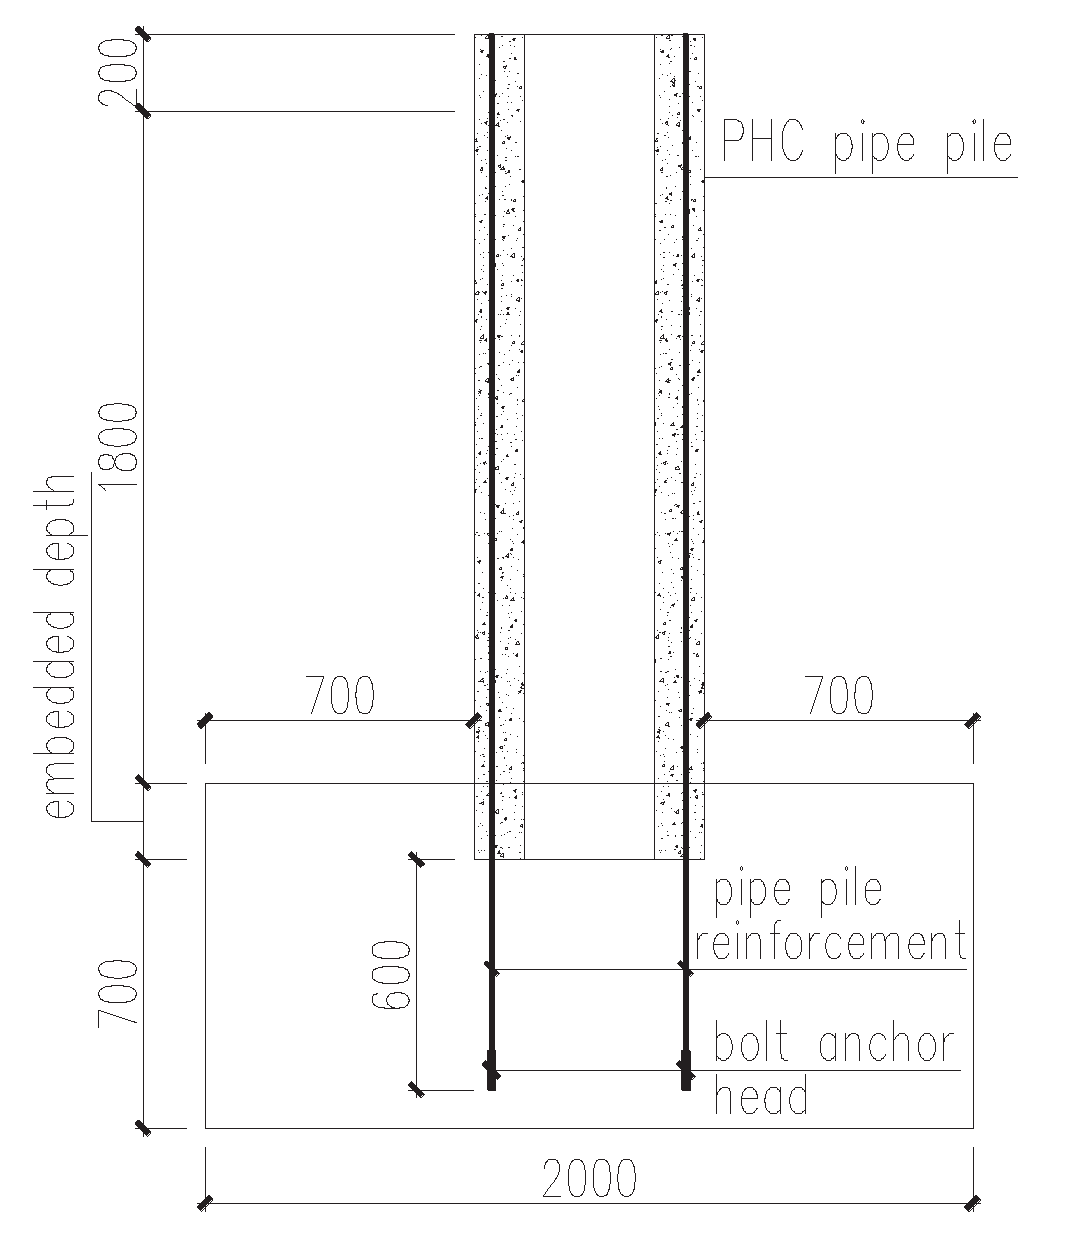
Figure 13.
Pipe pile body longitudinal reinforcement anchor into the cap + pipe pile core-filling longitudinal reinforcement anchor into the cap node.
Figure 13.
Pipe pile body longitudinal reinforcement anchor into the cap + pipe pile core-filling longitudinal reinforcement anchor into the cap node.
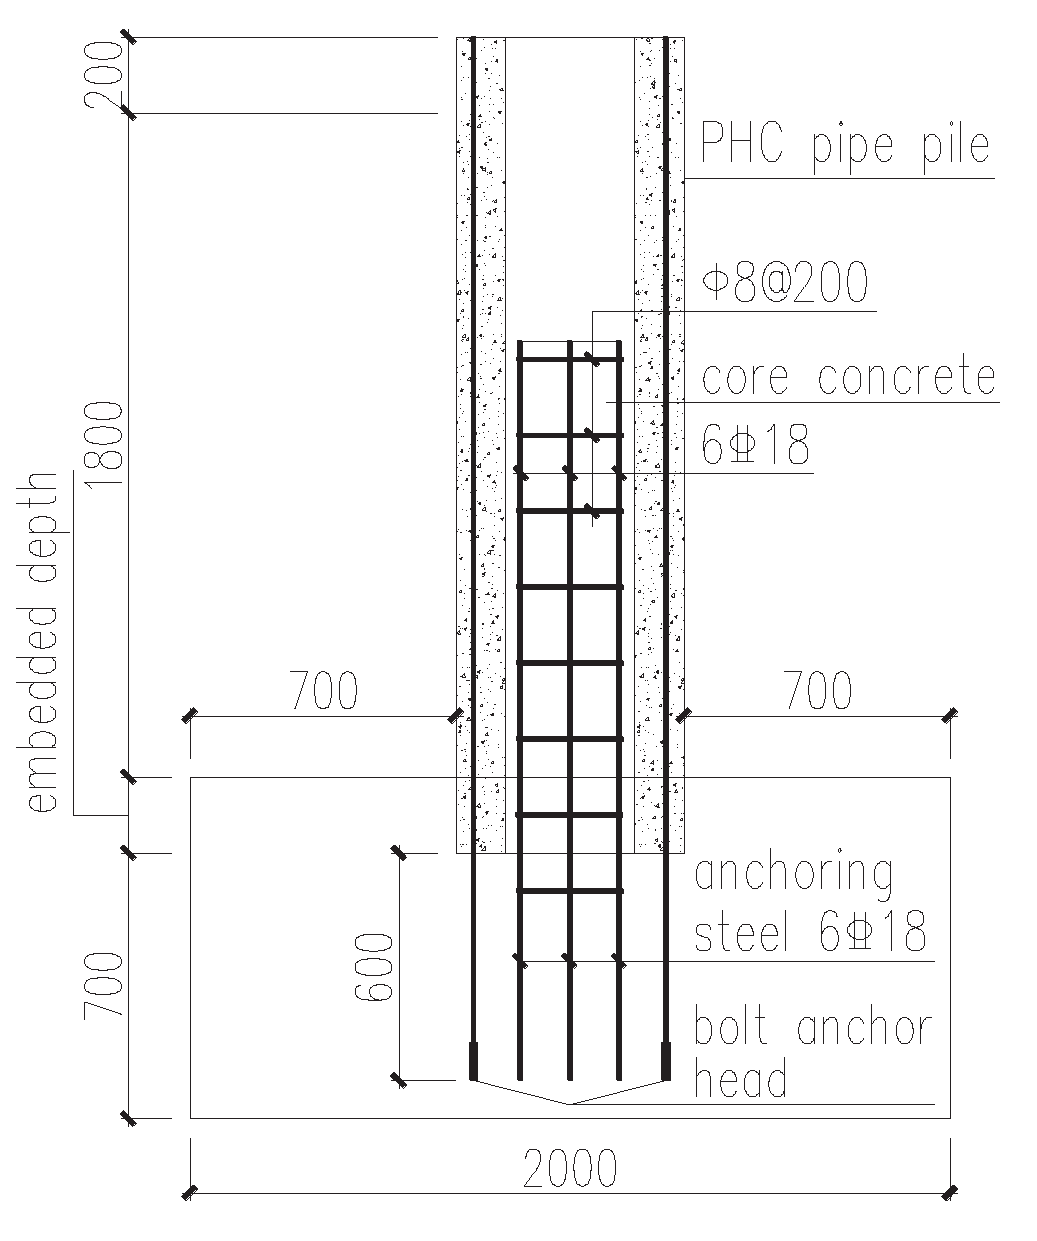
Figure 14.
Skeleton curves of Type I, Type II and Type III nodes with less than or equal to the optimal embeddedness.
Figure 14.
Skeleton curves of Type I, Type II and Type III nodes with less than or equal to the optimal embeddedness.
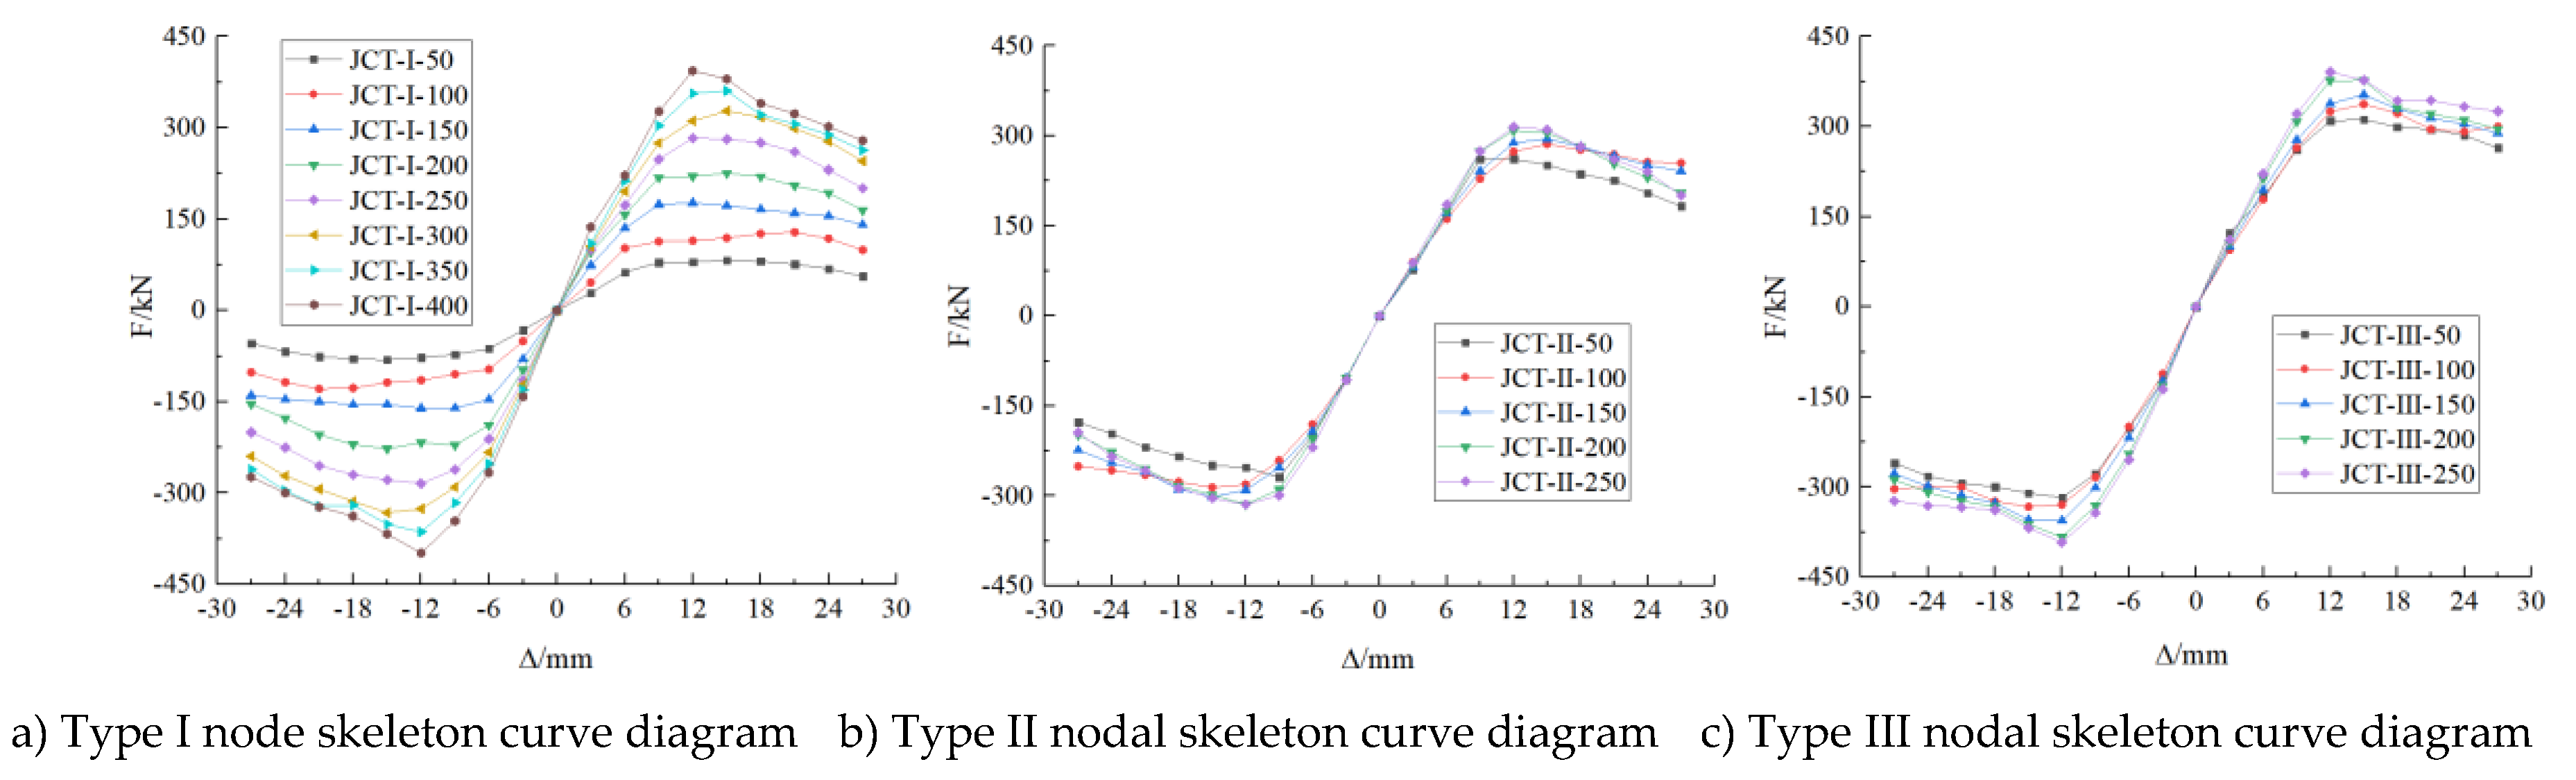
Figure 15.
Skeleton curves of Type I and Type III nodes with optimal embedment depth under different vertical forces.
Figure 15.
Skeleton curves of Type I and Type III nodes with optimal embedment depth under different vertical forces.
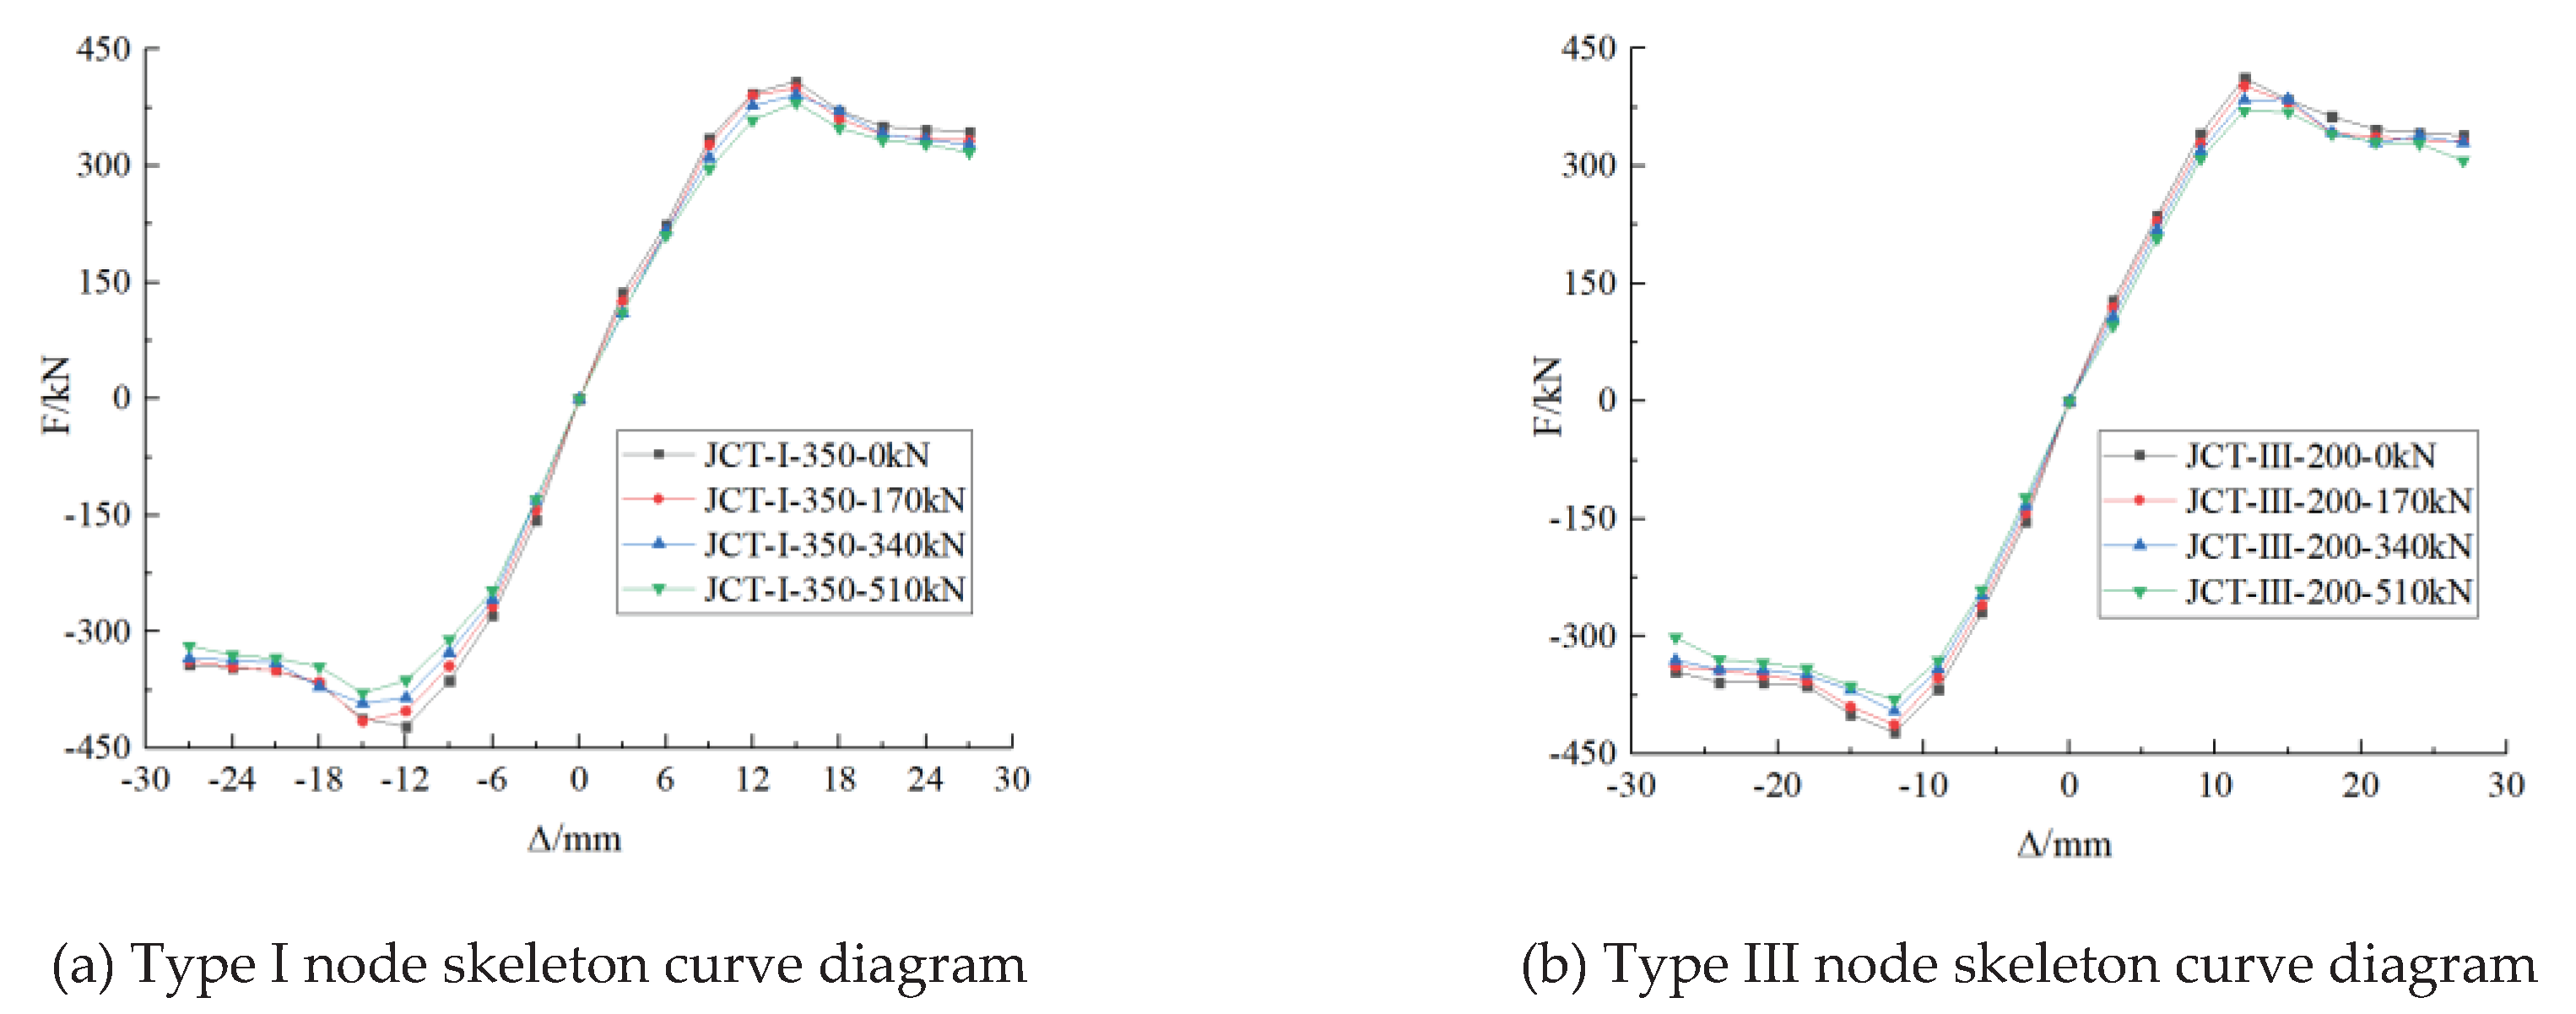

Table 1.
Parameters of the specimens.
| Specimen number | Embedding depth/mm | Prestressing longitudinal tendons | Pipe pile hoop | Prestressing of tubular piles before pile cutting/MPa | Anchoring bar (HRB400) |
Anchoring bar length /mm |
Anchor reinforcement distribution circle diameter(mm) | Concrete strength/MPa | |
|---|---|---|---|---|---|---|---|---|---|
| Pile | Pile cap | ||||||||
| JCT-200 | 200 | 16φ12.6 | Φb5 | 8.40 | 6@18 | 600 | 260 | 80.0 | 30.0 |
| JCT-300 | 300 | ||||||||
Table 2.
Material parameters of the specimens.
| Name | Model | Diameter/mm | Yield strength/MPa | Elastic modulus/GPa | Yield point elongation/% | Tensile strength/MPa | Maximum force plastic elongation/% | Maximal load stretching/% | Maximum force elongation/% | Percentage elongation after fracture/% |
|---|---|---|---|---|---|---|---|---|---|---|
| Pile stirrups | — | 5.0 | 523.48 | 200.13 | — | 595.33 | 2.56 | 4.29 | — | 5.30 |
| Prestressed steel rod of pile body | — | 12.6 | 1370.61 | 227.65 | — | 1471.94 | 4.05 | 5.40 | — | 7.88 |
| Filling core stirrups | HPB300 | 8.0 | 356.42 | 210.22 | 2.95 | 540.34 | 20.80 | 22.74 | 4.31 | 25.85 |
| Pile cap reinforcement | HRB335 | 14.0 | 547.88 | 209.60 | 2.49 | 618.68 | 6.60 | 7.75 | 1.47 | 15.33 |
| Filling core anchorage steel bar | HRB400 | 18.0 | 456.25 | 206.82 | 3.83 | 619.85 | 15.67 | 16.92 | 6.03 | 24.24 |
Table 3.
Comparison of the finite element calculation results and test results of the bearing capacity of the specimens under cyclic loading.
Table 3.
Comparison of the finite element calculation results and test results of the bearing capacity of the specimens under cyclic loading.
| Specimen number | Load Direction | Test Limit Load/kN | Test ultimate bending moment/kN·m | Displacement of the loaded end corresponding to the ultimate load/mm | Simulated ultimate loads/kN | Simulation of ultimate bending moment/kN·m | Simulation of limit displacements/mm | Calculated value of ultimate load/experimental value | Calculated value of ultimate displacement/experimental value |
|---|---|---|---|---|---|---|---|---|---|
| JCT-200 | Positive | 250.5 | 450.9 | 20.15 | 246.47 | 443.65 | 12.0 | 0.98 | 0.60 |
| Negative | -243.6 | -438.5 | -15.00 | -241.64 | -434.95 | -15.0 | 0.99 | 1.00 | |
| JCT-300 | Positive | 394.8 | 710.6 | 18.20 | 372.98 | 671.36 | 15.0 | 0.94 | 0.82 |
| Negative | -376.6 | -677.9 | -21.10 | -373.44 | -672.19 | -15.0 | 0.99 | 0.71 |
Note: “Positive” in the table represents the direction in which the actuator pushes the top of the pile out for the first time, and “Negative” represents the direction in which the actuator pulls the top of the pile back.
Table 4.
Physical and mechanical parameters of the steel bars and stirrups.
| Name | Model number | Caliber /mm |
Yield strength /MPa |
Tensile strength /MPa |
Plastic strain |
|---|---|---|---|---|---|
| Pile hoop | — | 5.0 | 515 | 550 | 0.020 |
| Pile prestressing steel rods | — | 12.6 | 1280 | 1420 | 0.076 |
| Core-filling hoop | HPB300 | 8.0 | 300 | 420 | 0.057 |
| bearing reinforcement | HRB335 | 14.0 | 335 | 455 | 0.060 |
| Core-filled anchoring reinforcement | HRB400 | 18.0 | 400 | 540 | 0.070 |
Table 5.
Finite element analysis results of the bearing capacity and displacement of the pipe pile cap nodes.
Table 5.
Finite element analysis results of the bearing capacity and displacement of the pipe pile cap nodes.
| Specimen number | Ultimate shear/kN | Limit moment/kN·m | Limit displacement/mm | Ratio to the ultimate shear force of Type I nodes | ||||
|---|---|---|---|---|---|---|---|---|
| Forward | Reverse | Forward | Reverse | Forward | Reverse | Forward | Reverse | |
| JCT-Ⅰ-50 | 82.31 | -81.31 | 148.16 | -146.36 | 15 | -15 | 1.00 | 1.00 |
| JCT-Ⅱ-50 | 261.64 | -268.74 | 470.95 | -483.73 | 12 | -9 | 3.18 | 3.31 |
| JCT-Ⅲ-50 | 311.64 | -317.23 | 560.95 | -571.01 | 15 | -12 | 3.79 | 3.90 |
| JCT-Ⅰ-100 | 128.30 | -128.74 | 230.94 | -231.73 | 21 | -21 | 1.00 | 1.00 |
| JCT-Ⅱ-100 | 286.31 | -285.99 | 515.36 | -514.78 | 15 | -15 | 2.23 | 2.22 |
| JCT-Ⅲ-100 | 336.92 | -332.79 | 606.46 | -599.02 | 15 | -15 | 2.63 | 2.58 |
| JCT-Ⅰ-150 | 176.84 | -154.79 | 318.31 | -278.62 | 12 | -18 | 1.00 | 1.00 |
| JCT-Ⅱ-150 | 294.81 | -301.50 | 530.66 | -542.70 | 15 | -15 | 1.67 | 1.95 |
| JCT-Ⅲ-150 | 359.72 | -375.42 | 647.50 | -675.76 | 15 | -15 | 2.03 | 2.43 |
| JCT-Ⅰ-200 | 225.72 | -227.14 | 406.30 | -408.85 | -15 | -15 | 1.00 | 1.00 |
| JCT-Ⅱ-200 | 313.80 | -319.86 | 564.84 | -575.75 | 15 | -12 | 1.39 | 1.41 |
| JCT-Ⅲ-200 | 385.29 | -395.49 | 693.52 | -711.88 | 15 | -12 | 1.71 | 1.74 |
| JCT-Ⅰ-250 | 283.20 | -284.21 | 509.76 | -511.58 | 12 | -12 | 1.00 | 1.00 |
| JCT-Ⅱ-250 | 315.08 | -314.57 | 567.14 | -566.23 | 12 | -12 | 1.11 | 1.11 |
| JCT-Ⅲ-250 | 390.61 | -392.10 | 703.10 | -705.78 | 12 | -12 | 1.38 | 1.38 |
| JCT-Ⅰ-300 | 337.71 | -342.46 | 607.88 | -616.43 | 15 | -15 | 1.00 | 1.00 |
| JCT-Ⅱ-300 | 317.28 | -323.20 | 571.10 | -581.76 | 12 | -12 | 0.94 | 0.94 |
| JCT-Ⅲ-300 | 395.94 | -396.41 | 712.69 | -713.54 | 12 | -12 | 1.17 | 1.16 |
| JCT-Ⅰ-350 | 391.32 | -391.97 | 704.38 | -705.55 | 15 | -15 | 1.00 | 1.00 |
| JCT-Ⅱ-350 | 317.10 | -316.94 | 570.78 | -570.49 | 12 | -12 | 0.81 | 0.81 |
| JCT-Ⅲ-350 | 394.93 | -399.19 | 710.87 | -718.54 | 12 | -12 | 1.01 | 1.02 |
| JCT-Ⅰ-400 | 393.65 | -398.67 | 708.57 | -717.61 | 12 | -12 | 1.00 | 1.00 |
| JCT-Ⅱ-400 | 316.65 | -322.50 | 569.97 | -580.50 | 12 | -12 | 0.80 | 0.81 |
| JCT-Ⅲ-400 | 398.23 | -396.52 | 716.81 | -713.74 | 12 | -12 | 1.01 | 0.99 |
| JCT-Ⅰ-500 | 393.46 | -395.18 | 708.23 | -711.32 | 12 | -12 | 1.00 | 1.00 |
| JCT-Ⅱ-500 | 315.75 | -311.90 | 568.35 | -561.42 | 12 | -12 | 0.80 | 0.79 |
| JCT-Ⅲ-500 | 397.87 | -391.97 | 716.17 | -705.55 | 12 | -12 | 1.01 | 0.99 |
Table 6.
Finite element calculation results of the bearing capacity of cap nodes under different vertical tensions.
Table 6.
Finite element calculation results of the bearing capacity of cap nodes under different vertical tensions.
| Specimen number and vertical tension | Ultimate shear/kN | Limit moment/kN·m | Limit displacement/mm | Ratio to the ultimate shear force | |||||
|---|---|---|---|---|---|---|---|---|---|
| Forward | Reverse | Forward | Reverse | Forward | Reverse | Forward | Reverse | ||
| JCT-Ⅰ-350 | 0 | 408.91 | -421.86 | 736.04 | -759.35 | 15 | -12 | 1.00 | 1.00 |
| 170 | 400.09 | -415.37 | 720.16 | -747.67 | 15 | -15 | 0.98 | 0.98 | |
| 340 | 391.32 | -391.97 | 704.38 | -705.55 | 15 | -15 | 0.96 | 0.93 | |
| 510 | 381.36 | -378.67 | 686.45 | -681.61 | 15 | -15 | 0.93 | 0.90 | |
| JCT-Ⅲ-200 | 0 | 412.55 | -422.31 | 742.59 | -760.16 | 12 | -12 | 1.00 | 1.00 |
| 170 | 402.11 | -412.57 | 723.80 | -742.63 | 12 | -12 | 0.97 | 0.98 | |
| 340 | 385.29 | -395.49 | 693.52 | -711.88 | 15 | -12 | 0.93 | 0.94 | |
| 510 | 370.67 | -380.45 | 667.21 | -684.81 | 12 | -12 | 0.90 | 0.90 | |
Disclaimer/Publisher’s Note: The statements, opinions and data contained in all publications are solely those of the individual author(s) and contributor(s) and not of MDPI and/or the editor(s). MDPI and/or the editor(s) disclaim responsibility for any injury to people or property resulting from any ideas, methods, instructions or products referred to in the content. |
© 2024 by the authors. Licensee MDPI, Basel, Switzerland. This article is an open access article distributed under the terms and conditions of the Creative Commons Attribution (CC BY) license (http://creativecommons.org/licenses/by/4.0/).
Copyright: This open access article is published under a Creative Commons CC BY 4.0 license, which permit the free download, distribution, and reuse, provided that the author and preprint are cited in any reuse.


