
Submitted:
19 March 2024
Posted:
20 March 2024
You are already at the latest version
Abstract
Genetic variability in rice breeding program plays the very crucial role. It provides outstanding pool of superior alleles governing better agronomic and quality characters through association mapping. For the understanding of population structure and genetic relationship among the different rice lines is indispensable prior to setting of correlation among dynamic alleles and traits. In the present investigation, genetic diversity and population structure of 116 rice accessions by using 64 polymorphic SSR markers was targeted for the evaluation of the genetic relatedness and diversity. Genotyping assessment based on SSR markers revealed a total of 225 alleles, with an average PIC value of 0.755. The germplasm lines were classified into three distinct subgroups through population structure analysis, utilizing both model and distance-based approaches. AMOVA analysis showed that 11% of the total variation could be attributed to differences between groups, while the remaining 89% of the variation was likely due to differences within groups. The study suggests that the population structure and genetic relatedness should be considered when working with the core collection of 116 rice germplasm lines for association mapping, aiming to establish marker-trait associations.
Keywords:
Rice
; Population structure
; Genetic diversity
; PIC
; Association mapping
; Variability
1. Introduction
Rice (Oryza sativa L.) is a crucial staple crop grown in around 100 countries and consumed by more than half of the global population, which fulfil the calorific needs and is primarily farmed in Asian countries[1,2]. The consumption of riceis expected to be approximately 800-900 mt (million tons) by 2025, which is way to higher than the current production of 516 mt on the basis of milled rice[3]. Due to the accessibility and use of the rich genetic diversity present in the Indian rice germplasm, production and productivity have reached record levels and genetic gain has been stagnated. Based on genetics, the target attributes need to be thoroughly explored in order to accurately manipulate the complex quantitative traits such as, yield and yield related traits, resistance to biotic/abiotic challenges, cooking quality parameters, etc. Quantitative Trait Loci (QTL) mapping is a widely used method for identifying the genetic basis of important agronomic traits in natural populations. This approach involves either linkage mapping, which utilizes bi-parental mapping populations, or LD mapping. In order to secure global food security, improved rice cultivars with better tolerance against diseases and abiotic stresses like drought, flooding, salt, etc., and specific traits need to be mapped and to be utilized in breeding programmes[4].
The effects of climate change on the Earth's surface and atmosphere include increased temperatures and uneven precipitation [5] as well as an increase in the frequency and unpredictable nature of extreme weather events resulting in floods and submergence. Several studies have identified quantitative trait loci (QTLs) for submergence tolerance that were derived from various populations[6,7,8,9,10,11]. In order to boost rice yield with excellent quality, there must be a careful process to follow given the constantly growing population and negatively changing climate with the abiotic factors like drought, salt, temperature, pollution, and others reducing rice crop productivity. Breeders that are interested in genetically enhancing rice with desirable nutritional quality attributes have long been concerned about its high yield and productivity[12]. The availability of genetic variety and awareness of it play a crucial role in every genetic improvement programme for ensuring responsible use as well as for selecting effective breeding tactics[13]. The impact of genetic variability and the heritability of the advantageous makeup determine the breeding program's overall effectiveness. The diverse gene pool of rice accessions gives breeders the chance to pick out desired features and combine them in novel ways.
There are numerous methods available to examine genetic diversity at both the genotypic and phenotypic levels. One of the greatest ways to examine genotypic variety in rice is through the use of molecular markers. These markers can identify significant changes between accessions at the DNA level, making them a more effective and well-thought-out tool for characterization and genetic make-up of accessions. Such techniques abound, including RAPD, SSR, AFLP, and ISSR, among others. One of the most popular, effective, and reasonably priced techniques for genetic characterization of germplasm is the SSR. SSR markers are known for their co-dominant and specific nature, as well as their high level of allelic diversity, relative polymorphism abundance, and wide distribution across the genome. Consequently, SSR markers have proven to be effective in establishing genetic links[14,15]. Due to their multiallelic and highly polymorphic nature, SSR markers can provide a better genetic diversity spectrum even when used in smaller numbers by this SSR markers play a crucial role in identifying genetic polymorphisms and showcasing high allelic diversity. These markers are commonly used to investigate the nuances of genetic variation among closely related rice accessions[16].
To ensure accurate association mapping in a population, it is crucial to ascertain the population structure. This step reduces type I and II errors resulting from uneven allele frequency distribution between subgroups, which may lead to false associations between molecular markers and the trait of interest[17]. Recent efforts have been made to define the population structure in rice using diverse germplasm lines, including the development of core collections from national and international collections[18,19,20,21,22,23]. Previous studies utilized SSR markers alone [19,24,25,26,27] or in conjunction with SNP markers [28,29]for similar investigations. The present study aimed to evaluate the genetic variation and examine the population structure of 116 rice germplasm accessions, including local landraces, improved varieties, and exotic lines from diverse origins. This study will help in getting the insight of relatedness of individuals based on genetic information, aid in classifying genotypes based on how similar and different and a preliminary study in utilizing current panel of rice genotypes for marker trait associations for mainly submergence tolerance and other agronomic traits.
2. Materials and Methods
2.1. Plant Material and DNA Extraction
In this study, a collection comprising 116 rice genotypes was utilized. The experimental work was conducted at the Crop Physiology Experimental Plot, while molecular analysis was performed at PG Lab, Department of Plant Molecular Biology and Genetic Engineering, Acharya Narendra Deva University of Agriculture and Technology, Ayodhya, Uttar Pradesh, India. For the molecular studies, one-month-old plant leaves were collected, and complete genomic DNA was isolated using the CTAB method[30]. Briefly, the leaf samples were ground with liquid nitrogen and mixed with pre-heated 2% extraction buffer (20 mM EDTA, 1.5 M NaCl, 100 mM Tris HCL, 2% CTAB, and 1% β-Mercaptoethanol). The mixture underwent treatment with Chloroform: Isoamyl alcohol (25:1), 100 mg/ml RNase, and 70% Ethanol. Subsequently, it was incubated in a water bath at 65 °C for 45 minutes with gentle shaking in between. The resulting pellet was dissolved in 1X TE buffer. The quality of the extracted genomic DNA was assessed using a 0.8% agarose gel and quantified using a Spectrophotometer Nanodrop (Thermo Scientific, Wilmington, DE, USA). The DNA was then diluted to 20 ng/μl in TE buffer for PCR amplification.
2.2. SSR Genotyping and Data Analysis
For investigating rice diversity, a set of 64 SSR primers was selected from the website https://archive.gramene.org/markers/microsat/50ssr.html. To assess the amplification and suitability of each primer for future genotyping of the remaining accessions, 4 genomic DNA samples were initially amplified using 30 SSR primers. PCR amplification was conducted in a 10 μl reaction volume, consisting of 20 ng DNA, 1X PCR master mix (GeNei Labs, India), and 5 pmol each of the forward and reverse primers. The amplification process was carried out using a C1000 thermal cycler (Bio-Rad Laboratories Inc., USA) with the following conditions: pre-denaturation at 95°C for 5 minutes, followed by 39 cycles of denaturation at 95°C for 30 seconds, annealing at 53–58°C (specific to each primer) for 45 seconds, extension at 72°C for 1 minute, and a final extension at 72°C for 10 minutes. Standard molecular weight size markers, such as the 100 bp DNA ladder (GeNei Labs, India) were used to determine the size of the most intensely amplified bands around each microsatellite marker, based on the estimated product size listed on the GRAMENE website.
Based on the existence of a certain size allele in each of the germplasm samples, an allele score was assigned. An allele's existence was indicated by 1 and its absence by 0, and it was manually checked again. Both allele size and a binary matrix were used to grade the SSR genotyping results (0–1). The allelic data were analyzed using Power Marker Software to calculate various genetic parameters, including the polymorphic information content (PIC) value, major allele frequency, number of alleles per locus, and gene heterozygosity[31]. Using DARwin Software (version 6.0.021), the binary data matrix was submitted to the calculation of the distance matrix based on the Jaccard similarity coefficient[32]. With 1000 bootstraps, the resulting distance matrix was utilized to build a neighbor joining dendrogram.
2.3. Genetic Variability
Genetic variability was analyzed by taking some agronomically important traits which includes seedling vigor (SV), days of 50% Flowering (DFF), plant height (PH), panicle length (PL), number of spikelets per panicles (SPP), biological yield per plant (BYP), harvest index % (HI%).
2.4. Structure Analysis
The software STRUCTURE v 2.3.3 was employed to conduct Bayesian clustering and determine the number of subpopulations within the accessions, following the method by Pritchard et al.[33]. An admixture model with independent allele frequencies was utilized for the STRUCTURE analysis. The number of supposed populations (K) was varied from 2 to 10, and for each K value, 3 independent runs were performed. Each run consisted of a 30,000 burn-in period and 100,000 iterations. The ideal value of K was determined using the Delta K statistic and L(K) as described by Evanno et al. [34]and analyzed using structure harvester[35]. GenAlex 6.5 was utilized to compute various genetic parameters, including the number of observable alleles (Na), number of effective alleles (Ne), Shannon's information index (I), and molecular variance (AMOVA)[36,37,38].
3. Results and Discussions
3.1. Allelic Diversity and Marker Informativeness
A total of 116 rice germplasm lines were genotyped using 64 SSR (microsatellite) markers, resulting in the identification of 225 alleles (Table 1). Among these alleles, 5% were classified as rare, with an allele frequency of less than 5%. The number of alleles per locus ranged from 2 to 8, with an average of 3.57 alleles per locus. The RM154 and RM7200 loci had the highest number of detected alleles (8), while a group of markers, including RM422, RM1807, RM510, RM121, RM427, RM7, RM118, RM408, RM284, RM433, RGNMS3189, RM415, RM277, HVSSR12-43, and HVSSR12-44, exhibited the lowest number.
The average Polymorphic Information Content (PIC) value, which represents the relative informativeness of each marker, was found to be 0.747 in this study. Landraces included in the research showed the highest genetic diversity, with a mean PIC value of 0.747. PIC values ranged from 0.495 for RM162 to 0.984 for RGNMS3228. The observed low heterozygosity may be attributed to the self-pollinating nature of rice.
The Expected heterozygosity or Gene diversity (He), calculated according to reference[39], ranged from 0.017 (RM408) to 0.868 (RM7200), with an average value of 0.421 (Table 1). Figure 1 below presents statistical features, with allelic diversity for each marker ranging from 2 to 8. Markers with a higher number of alleles indicate greater genetic variability within the rice accessions. Additional columns display various statistics. Mean, minimum, and maximum values are calculated only for numeric features. Mode indicates the most common value for numeric or categorical features of the analyzed parameters. Dispersion indicates the coefficient of variation for numeric features, and entropy for categorical features.
3.2. Chromosomal Distribution and Molecular Weight Analysis of SSR Markers
Figure 2 illustrates a scatter plot showcasing the relationship between chromosome numbers and the maximum and minimum molecular weights. Color-coded regions on the plot align with chromosome projections, as well as markers (Figure 2A,B) and SSR motifs (Figure 2C,D) for each chromosome, as detailed in the accompanying table. An inset in the figure presents a legend depicting the molecular weight distribution with a color scale.
Each marker is associated with specific information, including its name, chromosome location, SSR motif, and the minimum and maximum molecular weights. These SSR motifs exhibit diversity and consist of various repeats, such as (GA), (CTG), (GATA), (TCAC), (AG), (AT), and others. The color-coded regions on each chromosome demonstrate that these motifs vary in length and composition, contributing to the observed genetic diversity.
3.3. Genetic Variability
Genetic variability result indicates that a wide range of variability was observed among the traits. The magnitude of phenotypic coefficient of variation (PCV) was generally higher than genotypic coefficient of variation (GCV) for all the trait (Table 2). Biological yield per plant (28.05%) and seed vigor (26.98%) showed high magnitudes of PCV (>20%). Harvest index (19.82%), plant height (12.70%), and panicle length (10.36%) showed moderate magnitudes of PCV. Additionally, these traits also had similar magnitudes of GCV. Days to 50% flowering exhibited low magnitudes for both PCV and GCV (<10%), while other traits showed moderate PCV and GCV.
3.4. Distinct Subgroup Identification through Population Structure
The population structure of the 116 germplasm lines was assessed through a Bayesian-based approach. This analysis involved estimating membership fractions for a range of values of "k," spanning from 1 to 9, as depicted in Figure 1. The log likelihood obtained from the structure analysis pointed to the optimal value for "k" being 3 (K = 3). Similarly, an ad hoc measure known as ΔK exhibited its peak at K = 3, as shown in Figure 1. This peak indicated the presence of three distinct subgroups within the population, which were designated as SG1, SG2, and SG3.
Subsequently, based on the membership fractions, accessions with a probability of 80% or higher were allocated to their respective subgroups, while those with lower probabilities were classified as admixtures, as illustrated in Figure 3; Table 3. SG1 was composed of 23 accessions, primarily consisting of Indian landraces and varieties, while SG2 included 32 accessions of non-Indian origin. SG3 comprised 40 accessions, and 21 accessions were classified as admixture. In SG1, the majority belonged to the Indica subtype, while SG2 was predominantly represented by the japonica group. Upon increasing the number of subgroups from two to five, the accessions within both SG1 and SG2 were further subdivided into sub-subgroups (refer to Table 3). As SG1 mainly comprised 23 Indian-origin accessions, an independent STRUCTURE analysis was conducted for this subgroup, revealing that ΔK reached its peak at K = 3, indicating the presence of three sub-subgroups within SG1 (Figure 3). This clustering was attributed to the differentiation in the origin and seasonal patterns of rice varieties.
3.5. Genetic Relatedness and Diversity Assessment
Genetic relatedness and diversity estimates were conducted using average pairwise divergence (π) and segregating sites through the Unweighted Pair Group Method with Arithmetic Mean (UPGMA) in TASSEL 5.0 software. The analysis categorized the 116 accessions into three groups: Group I with 42 genotypes, Group II with 36 genotypes, and Group III with 38 genotypes. Group I in the UPGMA tree comprised a mix of indigenous and agronomically improved varieties, while Groups II and III primarily consisted of exotic accessions. Subgrouping within the UPGMA tree revealed that accessions in each group formed smaller subgroups based on their origin and types. Landraces and varieties were predominantly clustered in the upper branches of the tree, while exotic accessions clustered in the lower branches (Figure 4).
3.6. Principal Coordinate Analysis (PCoA)
Principal Coordinate Analysis (PCoA) was employed to further characterize the germplasm set's subgroups. The two-dimensional and three-dimensional scatter plots, including all 116 accessions, demonstrated that the first three PCA axes accounted for 5.81%, 5%, and 3.92% of the genetic variation among populations, respectively (Figure 5). Both classification methods showed a high level of similarity in clustering the genotypes.
3.7. Genetic Differentiation Analysis
The analysis of molecular variance (AMOVA) and pair-wise comparisons of subgroups identified from population structure demonstrated significant genetic differentiation among the subgroups. The results revealed that 10% of the total variation was attributed to differences among populations, while 79% was due to variation among individuals. Moreover, 11% of the total variation was found within individuals (Table 4 and Figure 6). Calculation of Wright's F-statistics for all SSR loci indicated an FIS value of 0.879 and an FIT value of 0.890. Additionally, the determination of FST for the polymorphic loci across all accessions yielded an FST value of 0.096, suggesting a high level of genetic variation ( Table 4).
Genetic diversity plays a pivotal role in crop improvement, serving as a crucial resource crop improvement and breeding programs. Population with higher genetic variation are particularly valuable for enhancing the genetic base in breeding endeavors[40,41]. In this study, 116 rice accessions, encompassing landraces, varieties, and breeding lines with diverse agronomic traits, including some derived from lines with therapeutic attributes, were investigated. This population holds significance for its representation of traditional landraces cultivated in the Uttar Pradesh region of India. Molecular markers, such as microsatellites or SNPs, are essential tools for descending the genetic diversity among different rice varieties, races, and exotic accessions, offering valuable insights for rice breeding programs[42].
Variability in traits is of great importance in plant breeding and genetic studies as it provides insight into the potential for selection and improvement. Traits with high PCV values indicate greater phenotypic diversity within a population, which can be attributed to both genetic and environmental factors. On the other hand, traits with moderate PCV values suggest moderate levels of phenotypic variation. Under study, the magnitude of phenotypic coefficient of variation (PCV) was generally higher than genotypic coefficient of variation (GCV) for all the traits, indicating significant phenotypic variation influenced by environmental factors. Other traits showed moderate PCV and GCV, suggesting a combination of genetic and environmental influences. Findings under study are in conformity with earlier researchers in the rice crops[43,44].
The genetic structure and diversity of diverse germplasm lines were accurately assessed by employing the STRUCTURE analysis with molecular markers like microsatellites or SNPs. This approach provides valuable insights into the genetic architecture of the population, shedding light on the relationships among various individuals or groups within the germplasm collection [14,45]. The genetic diversity of the studied accessions was evaluated using both model-based clustering and distance-based clustering approaches, utilizing SSR genotypic data. Out of 64 polymorphic markers, a total of 225 alleles were identified across the 116 rice accessions. The number of alleles per locus ranged from 2 to 8, with an average of 3.57 alleles per locus. These findings are in accordance with previous reports on alleles per locus, polymorphic information content, and gene diversity in rice[23,28,46]. The average number of alleles observed in this study (3.57 alleles/locus) align with other studies. For instance, Zhang et al. [21]reported 3.88 alleles/locus in 150 rice varieties from South Asia and Brazil, while Jin et al. [19]found an average of 3.9 alleles/locus in 416 rice accessions from China. Zhao et al. [28]also reported similar observations of amplified 747 alleles with an average of 3.57 alleles per locus. The mean Polymorphic Information Content (PIC) obtained from screening with 19 InDel markers was 0.440. Similarly, Chen et al. [47]reported an average gene diversity of 0.358 with polymorphic information content of 0.285 in 300 rice accessions growing worldwide, employing 372 SNP markers. When comparing the gene diversity in our study (0.421) to other investigations, it was found to be slightly lower than the overall gene diversity of a rice core collection (0.544) comprising samples from various countries[21]. However, it was comparable to gene diversity in a US accession panel (with an average gene diversity of 0.43) [48]and a Chinese rice accession panel (with an average gene diversity of 0.47) by Jin et al.[19]. Nonetheless, the gene diversity in our study was lower than the value (0.68) reported by Liakat Ali et al.[22] . At global scale, the most diversity panels exhibit gene diversity values within the range of 0.5 to 0.7[22,49]. These findings strongly suggest that the diversity panel composed of 116 germplasm lines in our study captures a significant portion of the genetic diversity found in major rice-growing regions across Asia. The average PIC value was calculated to be 0.747, with individual markers such as RM162 displaying a value of 0.495, while RGNMS3228 exhibited the highest PIC value of 0.984, enabling the amplification of 8 alleles.
The population was partitioned into two subgroups: SG1, predominantly composed of Indica accessions, and SG2, primarily consisting of japonica accessions. Both subgroups made substantial contribution to the overall population diversity. Given that the population encompasses landraces, varieties, and breeding lines, the primary source of molecular diversity stems from the landraces. The detection of a noteworthy quantity of rare alleles underscores their significant impact on the overall genetic diversity within the population. These findings align closely with earlier studies. Courtois et al. [29]documented a range of PIC values from 0.16 to 0.78, with an average of 0.49, in a European rice germplasm collection. Similarly, Jin et al. [19]reported a comparable PIC value of 0.421 in a Chinese rice collection comprising 416 accessions. Zhang et al. [21]also obtained a PIC value of 0.48, mirroring the value observed in this study. Furthermore, the identification of a substantial number of rare alleles in this investigation underscores their crucial role in bolstering the overall genetic diversity of the population.
The model-based approach using STRUCTURE has been extensively applied by researchers to investigate population structure in rice [19,22,23,25,29,48,50,51]. Courtois et al. [29]effectively delineated two subgroups within their study population, organizing rice varieties into two distinct groups, with a few showing admixture. Jin et al. [19]identified seven subpopulations among 416 rice accessions from China, while Das et al. [25]categorized a set of 91 rice landraces from eastern and northeastern India into four groups. The assignment of genotypes to subgroups based on ancestry thresholds varies among research groups. For instance, Zhao et al. [52]and Courtois et al. [29]employed an ancestry threshold of 80% to assign accessions to specific subpopulation. Conversely, Liakat Ali et al. [22]utilized a threshold of 60% and identified 33 accessions as admixture, as the 80% threshold categorized more genotypes as such. In our study, adopting a stringent threshold of 80% ancestry value resulted in only 21 genotypes being classified as admixtures. Population structure analysis across diverse rice panels have revealed the presence of two to eight subpopulations in rice [21,22,23,25,50].
In the current rice diversity panel, which comprises 116 accessions, 23 were assigned to SG1 based on maximum membership probabilities. SG1 is predominantly composed of Indian origin landraces and varieties. Conversely, SG2 and SG3 encompassed 32 and 40 accessions, respectively, primarily consisting of non-Indian exotic accessions. This population structure featuring two subgroups’ mirrors finding from prior research. Zhang et al. [53]observed a similar structure in a collection of 3024 rice landraces in China, a pattern also reported by Zhang et al. [21]and Nachimuthu et al. [23]in a rice core collection. Courtois et al. [29]successfully classified two subgroups as japonica and non-japonica accessions in a European core collection of rice. These results imply that the presence of three subgroups may be due to the different ecological environments. Indica and Japonica accessions seem to have undergone independent evolutionary trajectories. This study, enriched with a substantial number of traditional landraces from the Crop Research Centre, Masodha, ANDUA&T, Ayodhya, shed light on the relationship between Indian germplasm and exotic accessions. It underscores that germplasm lines exhibit variability based on their ecological niches, highlighting a heightened level of genetic diversity within this population.
The clustering analysis categorized the accessions into three groups, with 42 genotypes in group I, and 36 and 38 genotypes in groups II and III, respectively. Two classification methods used in the clustering analysis demonstrated a notable degree of similarity in grouping the genotypes. These findings corroborate earlier studies indicating that the Indica group possesses higher genetic diversity than japonica accessions [23,54,55], consistent with the fact that this subgroup primarily comprises Indica accessions. Liakat Ali et al. [22]supported this observation, affirming that the Indica subpopulation encompasses the largest rice growing region, characterized by diverse environments, ecological conditions, and soil types.
The outcome of the model-based analysis was in concordance with the clustering pattern observed in both the Neighbor-Joining tree and Principal Coordinate Analysis. The first three principal coordinates accounted for 5.8%, 5%, and 3.92% of the molecular variance, mirroring a similar trend observed in two population subgroups[21]. Calculating Wright's F Statistic at all loci revealed a deviation from Hardy-Weinberg equilibrium within the population, indicating notable molecular variation. The Fst results indicated a higher degree of divergence between subgroups within the population. Moreover, a higher FIT, measured at the subgroup level across the entire population, suggested an absence of equilibrium among the groups, likely attributed to the inbreeding nature of rice. This study illuminates numerous underexplored landraces from Uttar Pradesh, India, extensively cultivated by farmers across various regions of the state. The genetic diversity within this population is shaped by its ecological and evolutionary history, with varieties adapted to a wide array of ecosystems and diverse eco-geographical conditions. In establishing a core collection for association studies, a two-step approach was adopted[29,56]. This involved first determining the population structure and then sampling based on the relatedness of the accessions. Accessions exhibiting high genetic relatedness were considered for elimination in order to curate a core collection with diverse representation. All 116 accessions can be effectively utilized for genome-wide or candidate gene-specific association mapping, facilitating the linkage between genotypic and phenotypic variation.
4. Conclusions
This study emphasizes the crucial role of genetic diversity in crop improvement, exemplified by a comprehensive analysis of 116 rice accessions. The SSR markers facilitated accurate assessment of genetic diversity, revealing 225 alleles across 64 polymorphic markers. The average number of alleles per locus (3.57) and gene diversity (0.421) suggested the presence of a broad genetic base in this collection. This diversity panel effectively captures a significant portion of genetic diversity in major rice growing regions across Asia. Stratification into Indica and Japonica subgroups, with landraces as primary contributors to diversity, underscores their significance. The findings from structure analysis were consistent with the results obtained from the clustering method using neighbor-joining tree and principal coordinate analysis which distributed population into three distinct subgroups. Clustering and genetic metrics further confirm the complexity of genetic dynamics in the population. This research offers valuable insights into the genetic diversity of the rice accessions. The establishment of a core collection for association studies provides a vital resource for future research in rice improvement. These findings can be used to guide various approaches, such as association analysis, the development of classical mapping populations, selection of parental lines in breeding programs, and hybrid development, to harness the natural genetic variation present within this population. In summary, this study significantly contributes to advancing rice breeding and genetic research.
Author Contributions
Conceptualization, A.K.S. and D.K.D.; methodology.; software, A.K.S.; validation, N.A.K., Y.Y. and S.K.S.; formal analysis, D.K..; investigation, A.K.S.; resources, A.V.S.; data curation, A.K.S.; writing—original draft preparation, A.K.S. and D.K.; writing—review and editing, D.G, V.T., K.K., D.K.., A.V.S.; visualization, A.V.S.; supervision, A.S.; project administration, R.K.E.; funding acquisition, D.K.D. All authors have read and agreed to the published version of the manuscript.
Funding
This research received no external funding.
Data Availability Statement
Suggested Data Available on request.
Conflicts of Interest
The authors declare no conflict of interest.
References
- Rasheed, A.; Fahad, S.; Hassan, M.; Tahir, M.; Aamer, M.; Wu, Z. A REVIEW ON ALUMINUM TOXICITY AND QUANTITATIVE TRAIT LOCI MAPPING IN RICE (ORYZA SATIVA L). Applied Ecology & Environmental Research 2020, 18. [Google Scholar]
- Rasheed, A.; Fahad, S.; Aamer, M.; Hassan, M.; Tahir, M.; Wu, Z. Role of genetic factors in regulating cadmium uptake, transport and accumulation mechanisms and quantitative trait loci mapping in rice. a review. Applied Ecology & Environmental Research 2020, 18. [Google Scholar]
- FAO. WORLD FOOD AND AGRICULTURE STATISTICAL YEARBOOK 2022; FAO: 2022.
- Collard, B.C.; Gregorio, G.B.; Thomson, M.J.; Islam, R.; Vergara, G.V.; Laborte, A.G.; Nissila, E.; Kretzschmar, T.; Cobb, J.N. Transforming rice breeding: re-designing the irrigated breeding pipeline at the International Rice Research Institute (IRRI). Crop breeding, genetics and genomics 2019, 2019. [Google Scholar]
- Lamaoui, M.; Jemo, M.; Datla, R.; Bekkaoui, F. Heat and drought stresses in crops and approaches for their mitigation. Frontiers in chemistry 2018, 6, 26. [Google Scholar] [CrossRef]
- Xu, K.; Mackill, D.J. A major locus for submergence tolerance mapped on rice chromosome 9. Molecular Breeding 1996, 2, 219–224. [Google Scholar] [CrossRef]
- Nandi, S.; Subudhi, P.; Senadhira, D.; Manigbas, N.; Sen-Mandi, S.; Huang, N. Mapping QTLs for submergence tolerance in rice by AFLP analysis and selective genotyping. Molecular and General Genetics MGG 1997, 255, 1–8. [Google Scholar] [CrossRef] [PubMed]
- Siangliw, M.; Toojinda, T.; Tragoonrung, S.; Vanavichit, A. Thai jasmine rice carrying QTLch9 (Sub QTL) is submergence tolerant. Annals of Botany 2003, 91, 255–261. [Google Scholar] [CrossRef] [PubMed]
- Toojinda, T.; Siangliw, M.; Tragoonrung, S.; Vanavichit, A. Molecular genetics of submergence tolerance in rice: QTL analysis of key traits. Annals of Botany 2003, 91, 243–253. [Google Scholar] [CrossRef] [PubMed]
- Septiningsih, E.M.; Collard, B.C.; Heuer, S.; Bailey-Serres, J.; Ismail, A.M.; Mackill, D.J. Applying genomics tools for breeding submergence tolerance in rice. Translational genomics for crop breeding: abiotic stress, yield and quality 2013, 2, 9–30. [Google Scholar]
- Gonzaga, Z.J.C.; Carandang, J.; Sanchez, D.L.; Mackill, D.J.; Septiningsih, E.M. Mapping additional QTLs from FR13A to increase submergence tolerance in rice beyond SUB1. Euphytica 2016, 209, 627–636. [Google Scholar] [CrossRef]
- Sun, S.; Wang, L.; Mao, H.; Shao, L.; Li, X.; Xiao, J.; Ouyang, Y.; Zhang, Q. A G-protein pathway determines grain size in rice. Nature Communications 2018, 9, 851. [Google Scholar] [CrossRef] [PubMed]
- Chakravarthi, B.K.; Naravaneni, R. SSR marker based DNA fingerprinting and diversity study in rice (Oryza sativa. L). African Journal of Biotechnology 2006, 5. [Google Scholar]
- Powell, W.; Morgante, M.; Andre, C.; Hanafey, M.; Vogel, J.; Tingey, S.; Rafalski, A. The comparison of RFLP, RAPD, AFLP and SSR (microsatellite) markers for germplasm analysis. Molecular breeding 1996, 2, 225–238. [Google Scholar] [CrossRef]
- Mondini, L.; Noorani, A.; Pagnotta, M.A. Assessing plant genetic diversity by molecular tools. Diversity 2009, 1, 19–35. [Google Scholar] [CrossRef]
- McCouch, S.R.; Chen, X.; Panaud, O.; Temnykh, S.; Xu, Y.; Cho, Y.G.; Huang, N.; Ishii, T.; Blair, M. Microsatellite marker development, mapping and applications in rice genetics and breeding. Oryza: from molecule to plant 1997, 89–99. [Google Scholar]
- Pritchard, J.K.; Stephens, M.; Donnelly, P. Inference of population structure using multilocus genotype data. Genetics 2000, 155, 945–959. [Google Scholar] [CrossRef] [PubMed]
- Ebana, K.; Kojima, Y.; Fukuoka, S.; Nagamine, T.; Kawase, M. Development of mini core collection of Japanese rice landrace. Breeding Science 2008, 58, 281–291. [Google Scholar] [CrossRef]
- Jin, L.; Lu, Y.; Xiao, P.; Sun, M.; Corke, H.; Bao, J. Genetic diversity and population structure of a diverse set of rice germplasm for association mapping. Theoretical and Applied Genetics 2010, 121, 475–487. [Google Scholar] [CrossRef]
- Agrama, H.A.; Yan, W.; Jia, M.; Fjellstrom, R.; McClung, A.M. Genetic structure associated with diversity and geographic distribution in the USDA rice world collection. Natural Science 2010, 2, 247. [Google Scholar] [CrossRef]
- Zhang, P.; Li, J.; Li, X.; Liu, X.; Zhao, X.; Lu, Y. Population structure and genetic diversity in a rice core collection (Oryza sativa L.) investigated with SSR markers. PloS one 2011, 6, e27565. [Google Scholar] [CrossRef]
- Liakat Ali, M.; McClung, A.M.; Jia, M.H.; Kimball, J.A.; McCouch, S.R.; Eizenga, G.C. A rice diversity panel evaluated for genetic and agro-morphological diversity between subpopulations and its geographic distribution. Crop Science 2011, 51, 2021–2035. [Google Scholar] [CrossRef]
- Nachimuthu, V.V.; Muthurajan, R.; Duraialaguraja, S.; Sivakami, R.; Pandian, B.A.; Ponniah, G.; Gunasekaran, K.; Swaminathan, M.; KK, S.; Sabariappan, R. Analysis of population structure and genetic diversity in rice germplasm using SSR markers: an initiative towards association mapping of agronomic traits in Oryza sativa. Rice 2015, 8, 1–25. [Google Scholar] [CrossRef] [PubMed]
- Agrama, H.; Yan, W.; Fjellstrom, R.; Jia, M.; McClung, A. Genetic Diversity and Relationships Assessed by SSRs in the USDA World-Wide Rice Germplasm Collection. In Proceedings of 2008 Joint Annual Meeting (5-9 Oct. 2008). [Google Scholar]
- Das, B.; Sengupta, S.; Parida, S.K.; Roy, B.; Ghosh, M.; Prasad, M.; Ghose, T.K. Genetic diversity and population structure of rice landraces from Eastern and North Eastern States of India. BMC genetics 2013, 14, 1–14. [Google Scholar] [CrossRef] [PubMed]
- Choudhury, B.; Khan, M.L.; Dayanandan, S. Genetic structure and diversity of indigenous rice (Oryza sativa) varieties in the Eastern Himalayan region of Northeast India. SpringerPlus 2013, 2, 1–10. [Google Scholar] [CrossRef] [PubMed]
- Sow, M.; Ndjiondjop, M.-N.; Sido, A.; Mariac, C.; Laing, M.; Bezançon, G. Genetic diversity, population structure and differentiation of rice species from Niger and their potential for rice genetic resources conservation and enhancement. Genetic resources and crop evolution 2014, 61, 199–213. [Google Scholar] [CrossRef]
- Zhao, C.; Zhao, L.; Zhao, Q.; Chen, T.; Yao, S.; Zhu, Z.; Zhou, L.; Nadaf, A.B.; Liang, W.; Lu, K. Genetic dissection of eating and cooking qualities in different subpopulations of cultivated rice (Oryza sativa L.) through association mapping. BMC genetics 2020, 21, 1–13. [Google Scholar] [CrossRef]
- Courtois, B.; Frouin, J.; Greco, R.; Bruschi, G.; Droc, G.; Hamelin, C.; Ruiz, M.; Clément, G.; Evrard, J.C.; Van Coppenole, S. Genetic diversity and population structure in a European collection of rice. Crop science 2012, 52, 1663–1675. [Google Scholar] [CrossRef]
- Murray, M.G.; Thompson, W.F. Rapid isolation of high molecular weight plant DNA. Nucleic Acids Res 1980, 8, 4321–4325. [Google Scholar] [CrossRef]
- Liu, K.; Muse, S.V. PowerMarker: an integrated analysis environment for genetic marker analysis. Bioinformatics 2005, 21, 2128–2129. [Google Scholar] [CrossRef]
- Perrier, X.J.-C., J. DARwin software, 2006.
- Pritchard, J.K.; Stephens, M.; Donnelly, P. Inference of population structure using multilocus genotype data. Genetics 2000, 155, 945–959. [Google Scholar] [CrossRef]
- Evanno, G.; Regnaut, S.; Goudet, J. Detecting the number of clusters of individuals using the software STRUCTURE: a simulation study. Mol Ecol 2005, 14, 2611–2620. [Google Scholar] [CrossRef]
- Earl, D.A.; Vonholdt, B. Structure Harvester: a website and program for visualizing STRUCTURE output and implementing the Evanno method. Conservation Genetics Resources 2012, 4. [Google Scholar] [CrossRef]
- Excoffier, L.; Laval, G.; Schneider, S. Arlequin (version 3.0): an integrated software package for population genetics data analysis. Evol Bioinform Online 2007, 1, 47–50. [Google Scholar] [CrossRef]
- Singh, A.V.; Shelar, A.; Rai, M.; Laux, P.; Thakur, M.; Dosnkyi, I.; Santomauro, G.; Singh, A.K.; Luch, A.; Patil, R.; Bill, J. Harmonization Risks and Rewards: Nano-QSAR for Agricultural Nanomaterials. Journal of Agricultural and Food Chemistry 2024, 72, 2835–2852. [Google Scholar] [CrossRef] [PubMed]
- Singh, A.V.; Varma, M.; Rai, M.; Pratap Singh, S.; Bansod, G.; Laux, P.; Luch, A. Advancing Predictive Risk Assessment of Chemicals via Integrating Machine Learning, Computational Modeling, and Chemical/Nano-Quantitative Structure-Activity Relationship Approaches. Advanced Intelligent Systems n/a 2300366. [CrossRef]
- Nei, M. Analysis of gene diversity in subdivided populations. Proceedings of the national academy of sciences 1973, 70, 3321–3323. [Google Scholar] [CrossRef]
- Malik, N.; Kumar, D.; Babu, B.K. Analysis of genetic divergence and population structure through microsatellite markers in normal and quality protein maize genotypes from NW Himalayan region of India. Vegetos 2020, 33, 194–202. [Google Scholar] [CrossRef]
- Singh, A.K.; Dwivedi, D.K.; Kumar, D.; Singh, A.; Dixit, S.; Khan, N.A.; Kumar, A. Genetic variability, character association and path coefficient analysis in rice (Oryza sativa) genotypes of semi-arid region of India. The Indian Journal of Agricultural Sciences 2023, 93, 844–849. [Google Scholar] [CrossRef]
- Swarup, S.; Cargill, E.J.; Crosby, K.; Flagel, L.; Kniskern, J.; Glenn, K.C. Genetic diversity is indispensable for plant breeding to improve crops. Crop Science 2021, 61, 839–852. [Google Scholar] [CrossRef]
- Singh, S.K.; Singh, P.; Khaire, A.R.; Korada, M.; Singh, D.K.; Majhi, P.K.; Jayasudha, S. Genetic Variability, Character Association and Path Analysis for Yield and its Related Traits in Rice (Oryza sativa L.) Genotypes. International Journal of Plant & Soil Science 2021, 33, 437–446. [Google Scholar] [CrossRef]
- Biswajit, P.; Sritama, K.; Anindya, S.; Moushree, S.; Sabyasachi, K. Breeding for submergence tolerance in rice (Oryza sativa L.) and its management for flash flood in rainfed low land area: A review. Agricultural Reviews 2017, 38, 167–179. [Google Scholar] [CrossRef]
- Varshney, R.K.; Chabane, K.; Hendre, P.S.; Aggarwal, R.K.; Graner, A. Comparative assessment of EST-SSR, EST-SNP and AFLP markers for evaluation of genetic diversity and conservation of genetic resources using wild, cultivated and elite barleys. Plant Science 2007, 173, 638–649. [Google Scholar] [CrossRef]
- Ram, S.G.; Thiruvengadam, V.; Vinod, K.K. Genetic diversity among cultivars, landraces and wild relatives of rice as revealed by microsatellite markers. Journal of Applied Genetics 2007, 48, 337–345. [Google Scholar] [CrossRef] [PubMed]
- Chen, H.; He, H.; Zou, Y.; Chen, W.; Yu, R.; Liu, X.; Yang, Y.; Gao, Y.-M.; Xu, J.-L.; Fan, L.-M. , et al. Development and application of a set of breeder-friendly SNP markers for genetic analyses and molecular breeding of rice (Oryza sativa L.). Theoretical and Applied Genetics 2011, 123, 869–879. [Google Scholar] [CrossRef] [PubMed]
- Agrama, H.; Eizenga, G. Molecular diversity and genome-wide linkage disequilibrium patterns in a worldwide collection of Oryza sativa and its wild relatives. Euphytica 2008, 160. [Google Scholar] [CrossRef]
- Ni, J.; Colowit, P.; Mackill, D. Evaluation of Genetic Diversity in Rice Subspecies Using Microsatellite Markers. Crop Science 2002, 42. [Google Scholar] [CrossRef]
- Agrama, H.; Eizenga, G.; Yan, W. Association mapping of yield and its components in rice cultivars. Molecular Breeding 2007, 19. [Google Scholar] [CrossRef]
- Zhang, D.; Zhang, H.; Wei, X.; Qi, Y.; Wang, M.; Sun, J.; Ding, L.; Tang, S.; Qiu, Z.E.; Cao, Y. , et al. Genetic structure and diversity of Oryza sativa L. in Guizhou, China. Chinese Science Bulletin 2007, 52, 343–351. [Google Scholar] [CrossRef]
- Zhao, K.; Wright, M.; Kimball, J.; Eizenga, G.; McClung, A.; Kovach, M.; Tyagi, W.; Ali, M.L.; Tung, C.W.; Reynolds, A. , et al. Genomic diversity and introgression in O. sativa reveal the impact of domestication and breeding on the rice genome. PLoS One 2010, 5, e10780. [Google Scholar] [CrossRef]
- Zhang, D.; Zhang, H.; Wang, M.; Sun, J.; Qi, Y.; Wang, F.; Wei, X.; Han, L.; Wang, X.; Li, Z. Genetic structure and differentiation of Oryza sativa L. in China revealed by microsatellites. Theor Appl Genet 2009, 119, 1105–1117. [Google Scholar] [CrossRef]
- Caicedo, A.L.; Williamson, S.H.; Hernandez, R.D.; Boyko, A.; Fledel-Alon, A.; York, T.L.; Polato, N.R.; Olsen, K.M.; Nielsen, R.; McCouch, S.R. , et al. Genome-wide patterns of nucleotide polymorphism in domesticated rice. PLoS Genet 2007, 3, 1745–1756. [Google Scholar] [CrossRef] [PubMed]
- Qi, Y.; Zhang, H.; Zhang, D.; Wang, M.; Sun, J.; Ding, L.; Wang, F.; Li, Z. Assessing indica-japonica differentiation of improved rice varieties using microsatellite markers. J Genet Genomics 2009, 36, 305–312. [Google Scholar] [CrossRef] [PubMed]
- Breseghello, F.; Sorrells, M.E. Association mapping of kernel size and milling quality in wheat (Triticum aestivum L.) cultivars. Genetics 2006, 172, 1165–1177. [Google Scholar] [CrossRef] [PubMed]
Figure 1.
The statistics of the selected features of different parameters to inspect and find interesting features in gene diversity data set.
Figure 1.
The statistics of the selected features of different parameters to inspect and find interesting features in gene diversity data set.
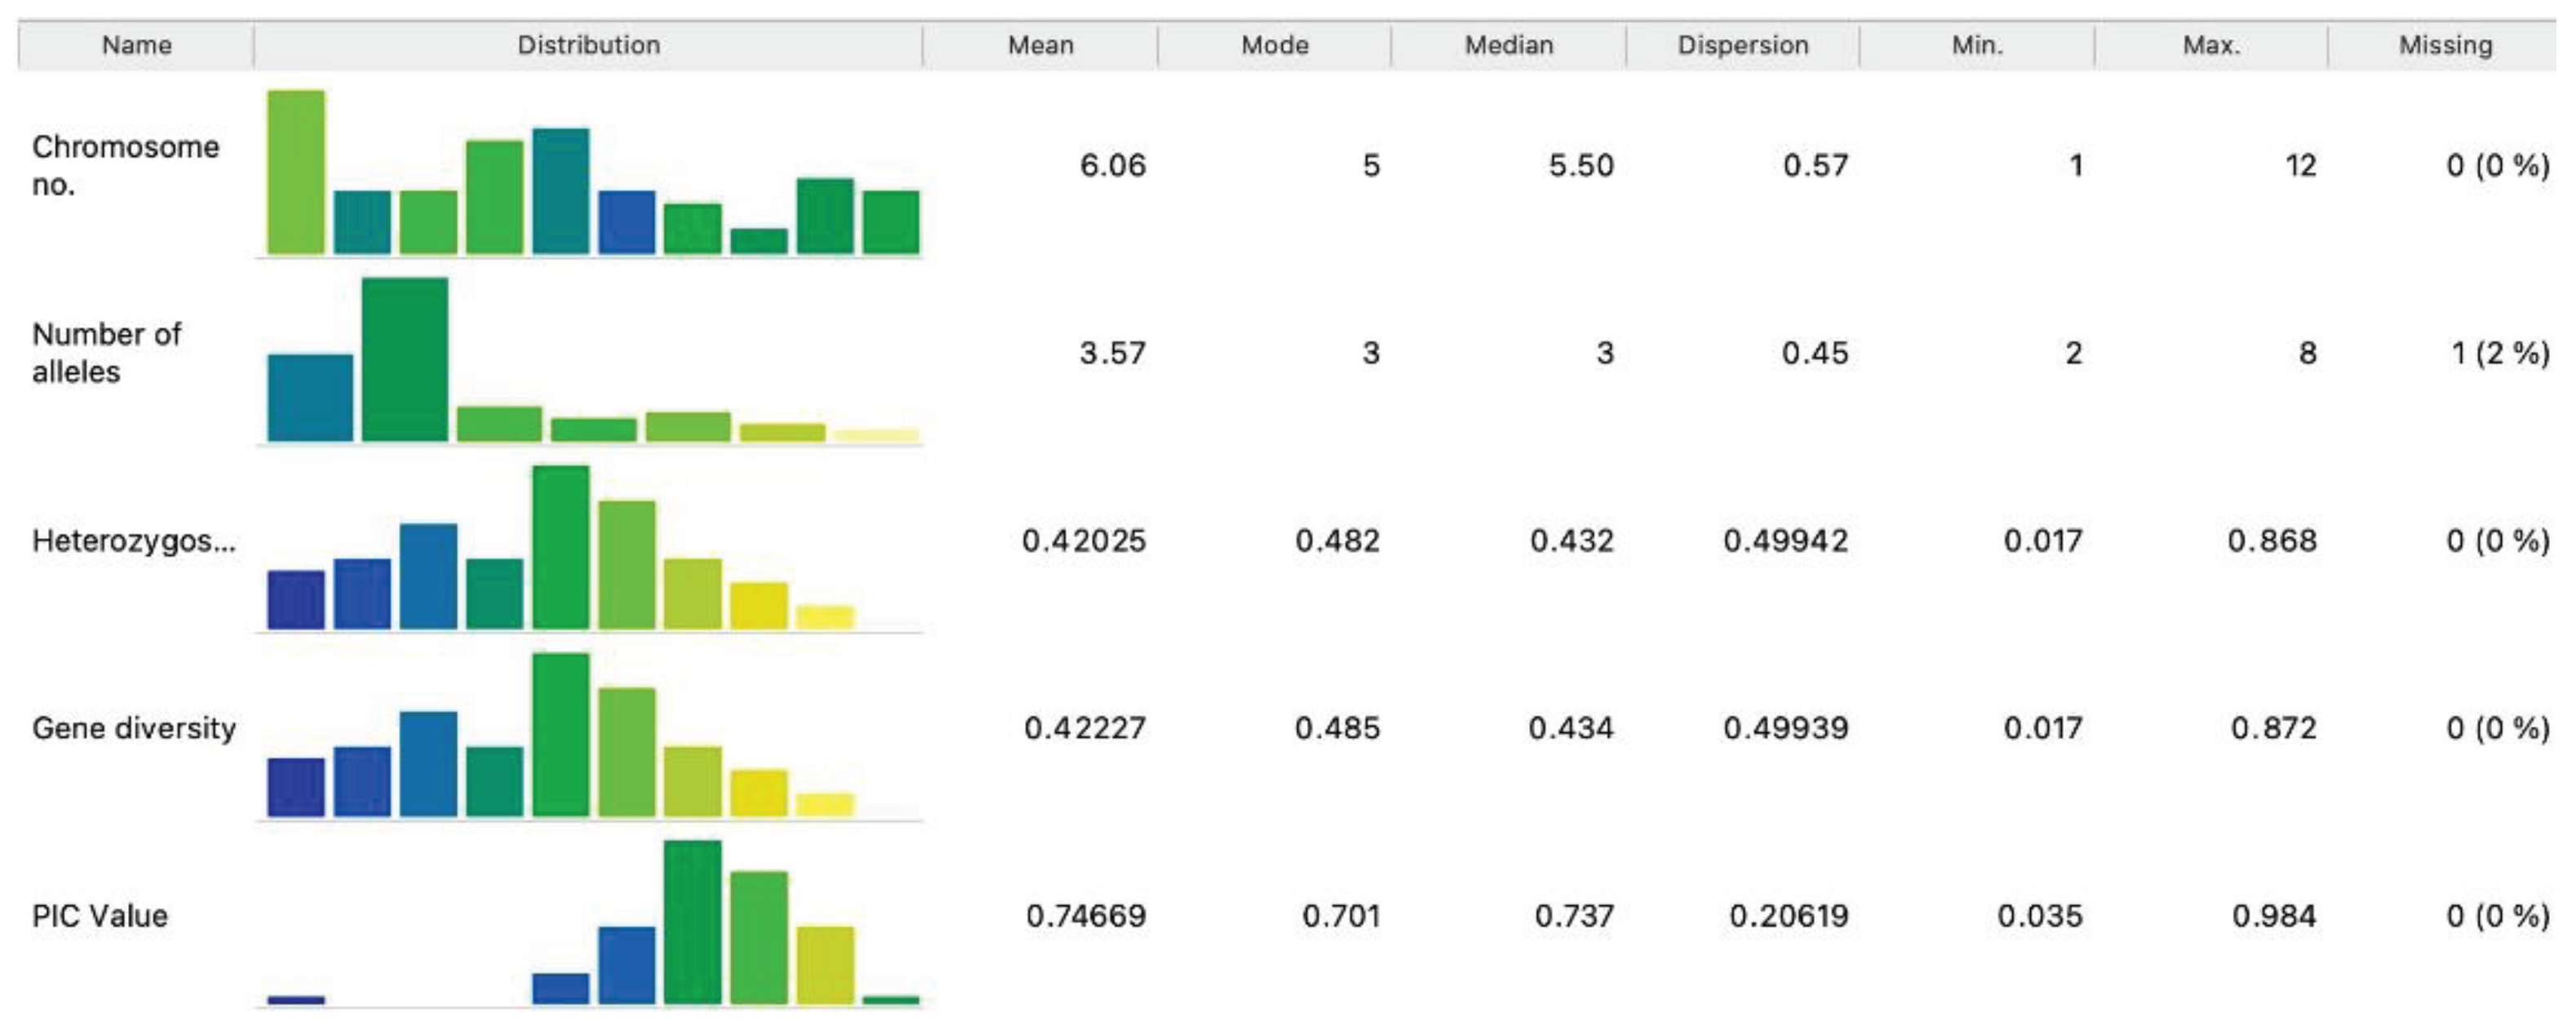
Figure 2.
Scatter plot visualization of chromosome markers and SSR motifs with exploratory analysis and data visualization enhancements.
Figure 2.
Scatter plot visualization of chromosome markers and SSR motifs with exploratory analysis and data visualization enhancements.
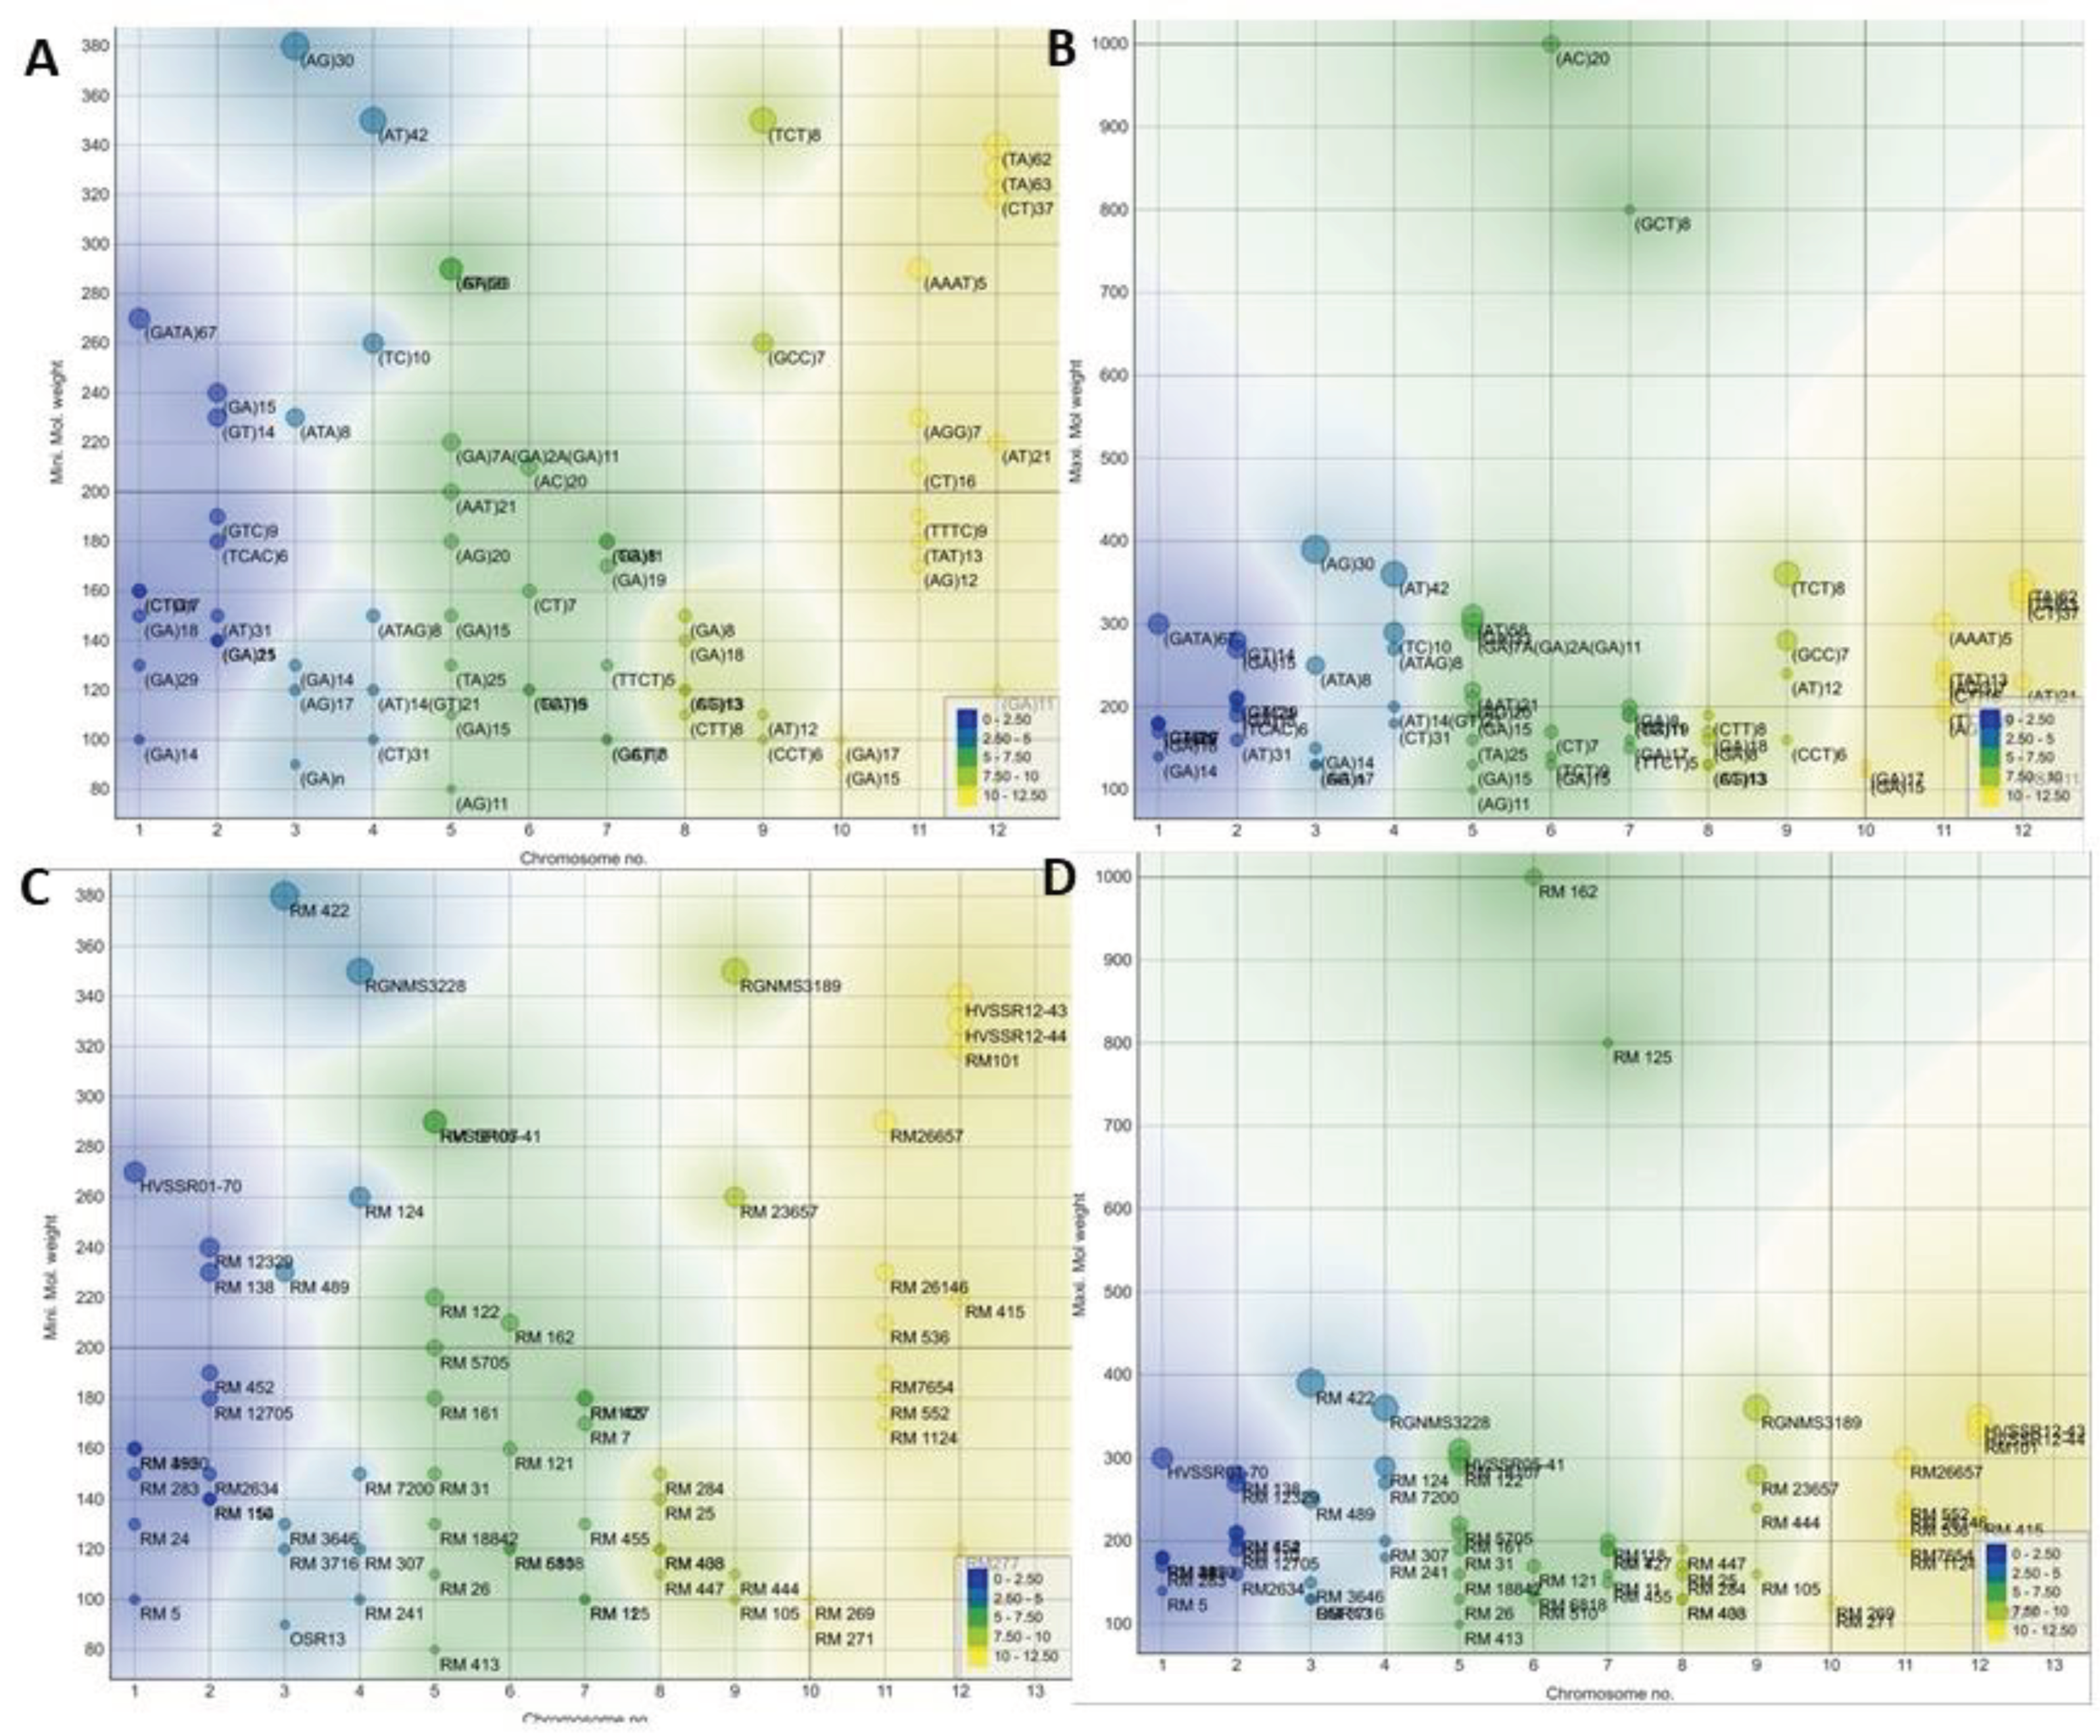
Figure 3.
Population structure of 116 accessions in sub group-1 and membership probability of assigning genotypes of sub group-1 (K = 3).
Figure 3.
Population structure of 116 accessions in sub group-1 and membership probability of assigning genotypes of sub group-1 (K = 3).
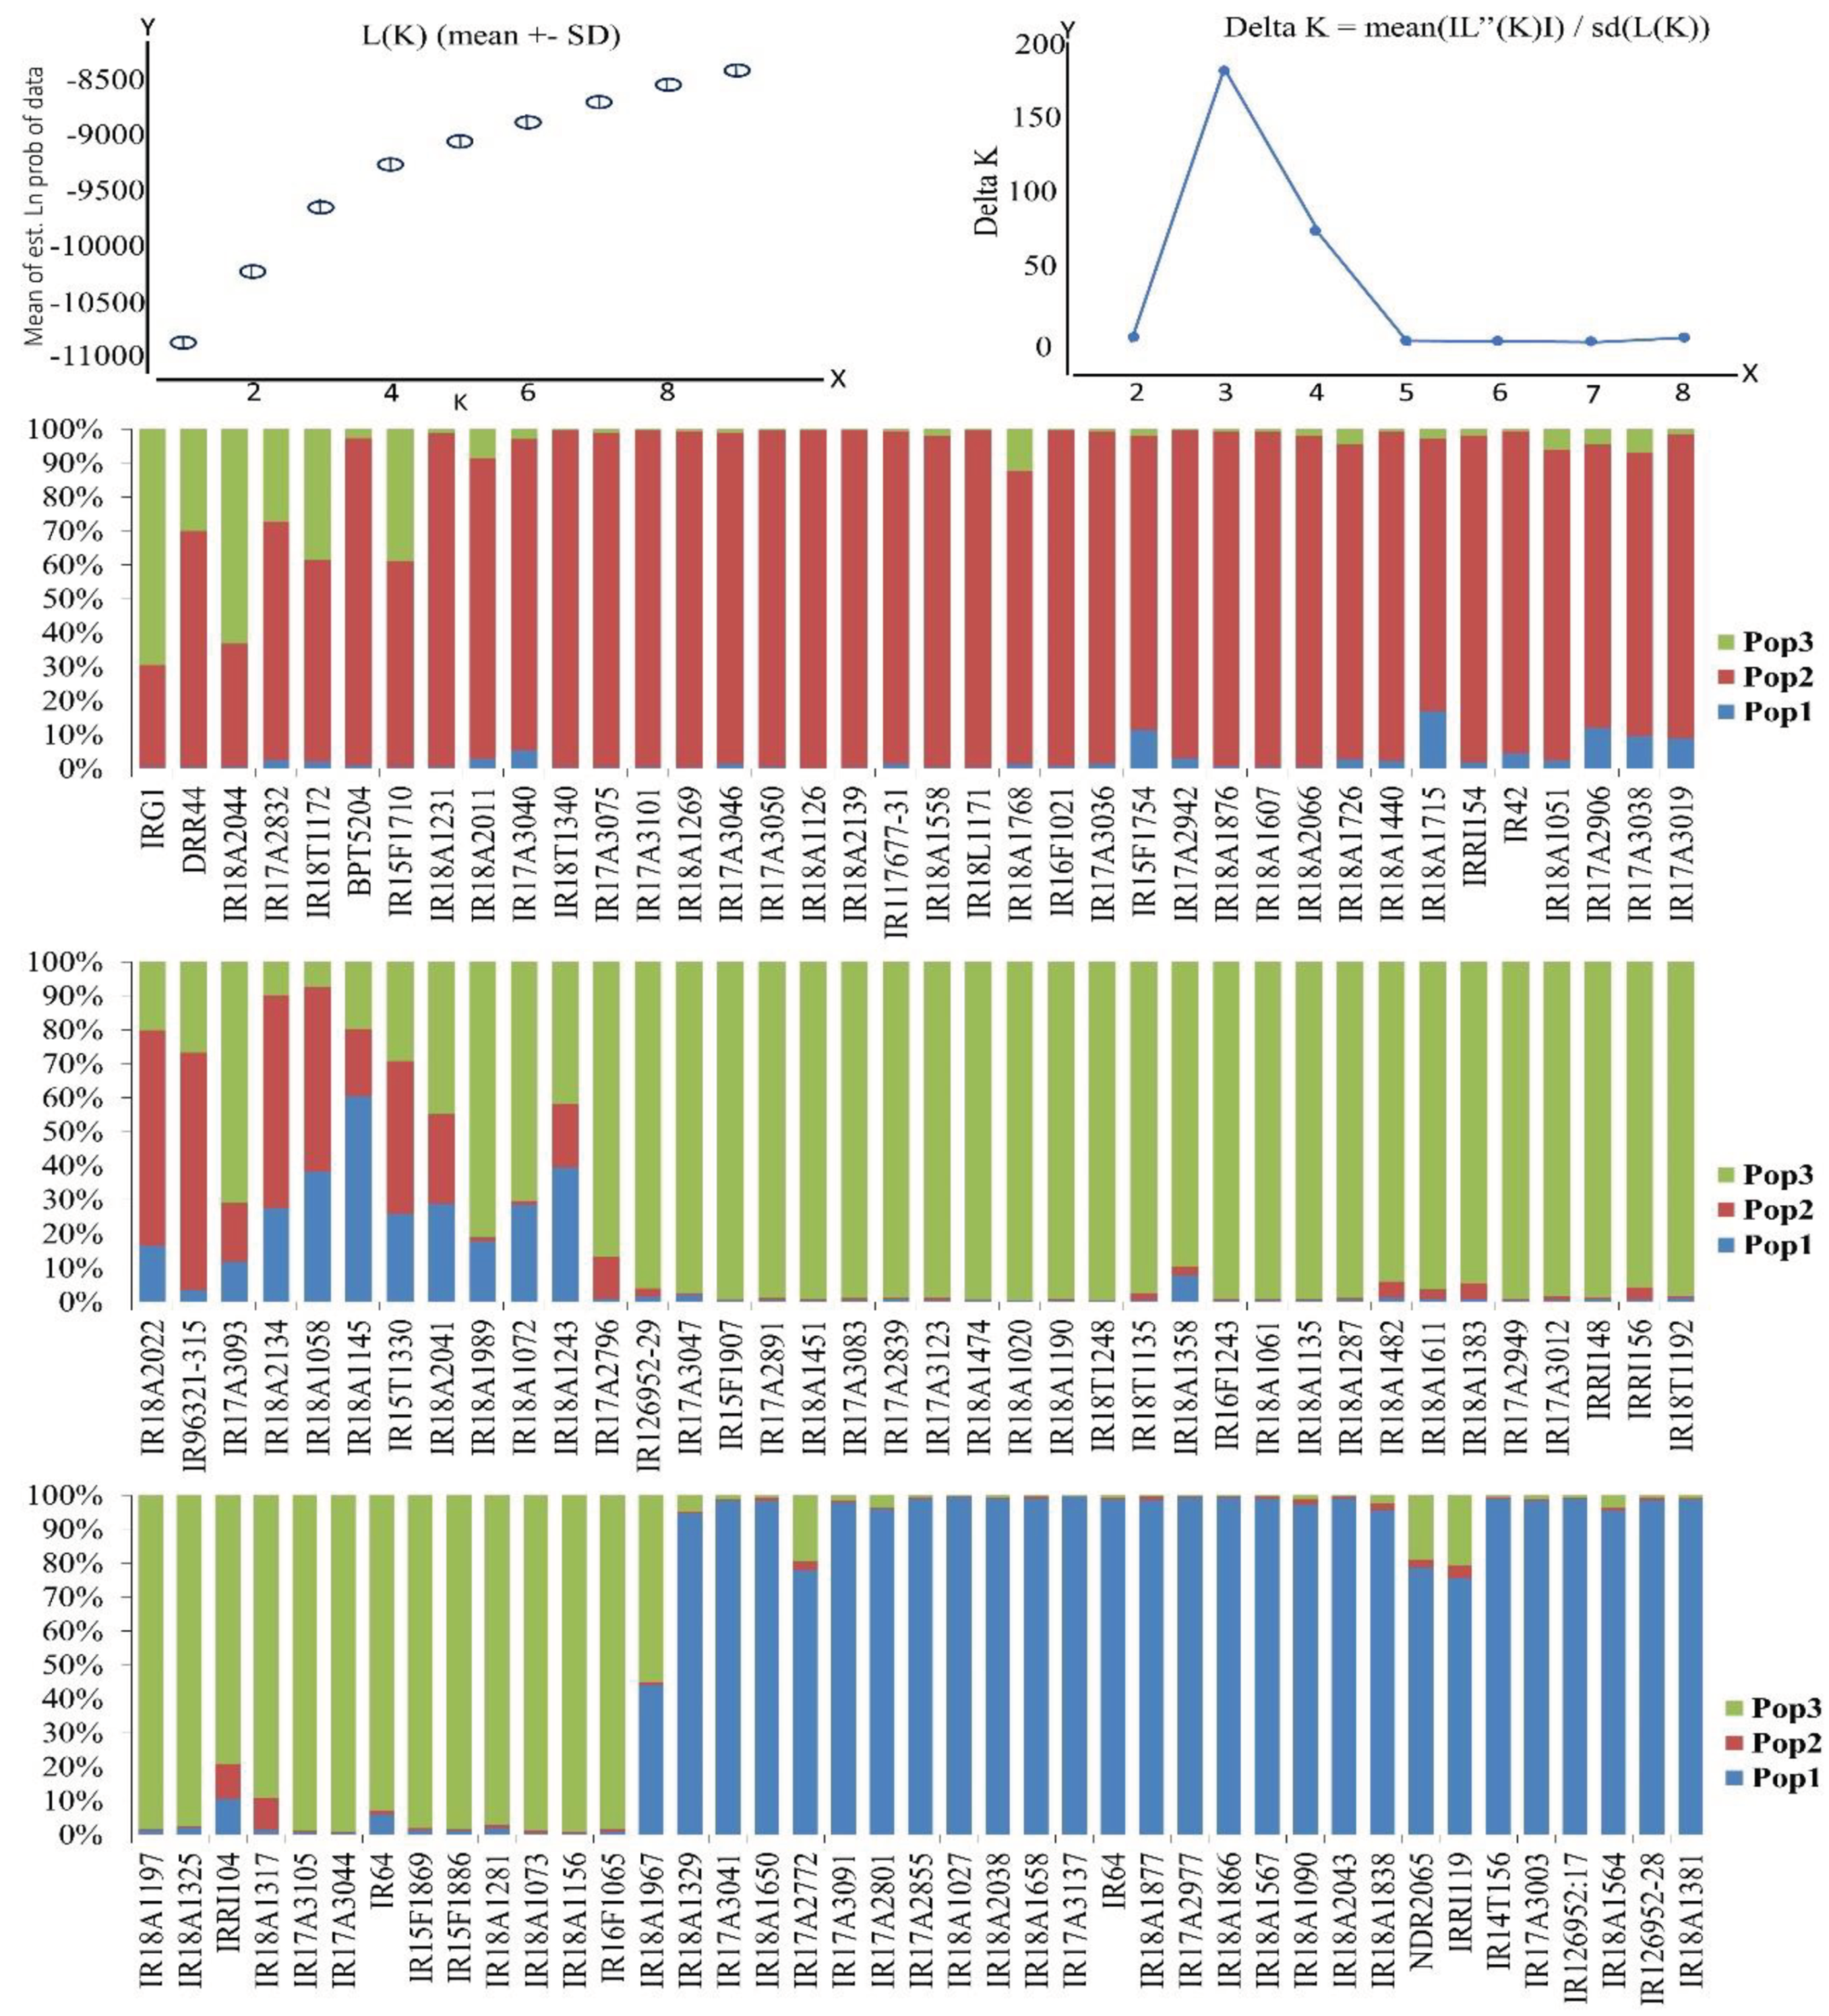
Figure 4.
Genetic relatedness through Jaccard coefficient; Neighbor joining tree of 116 rice genotypes.
Figure 4.
Genetic relatedness through Jaccard coefficient; Neighbor joining tree of 116 rice genotypes.
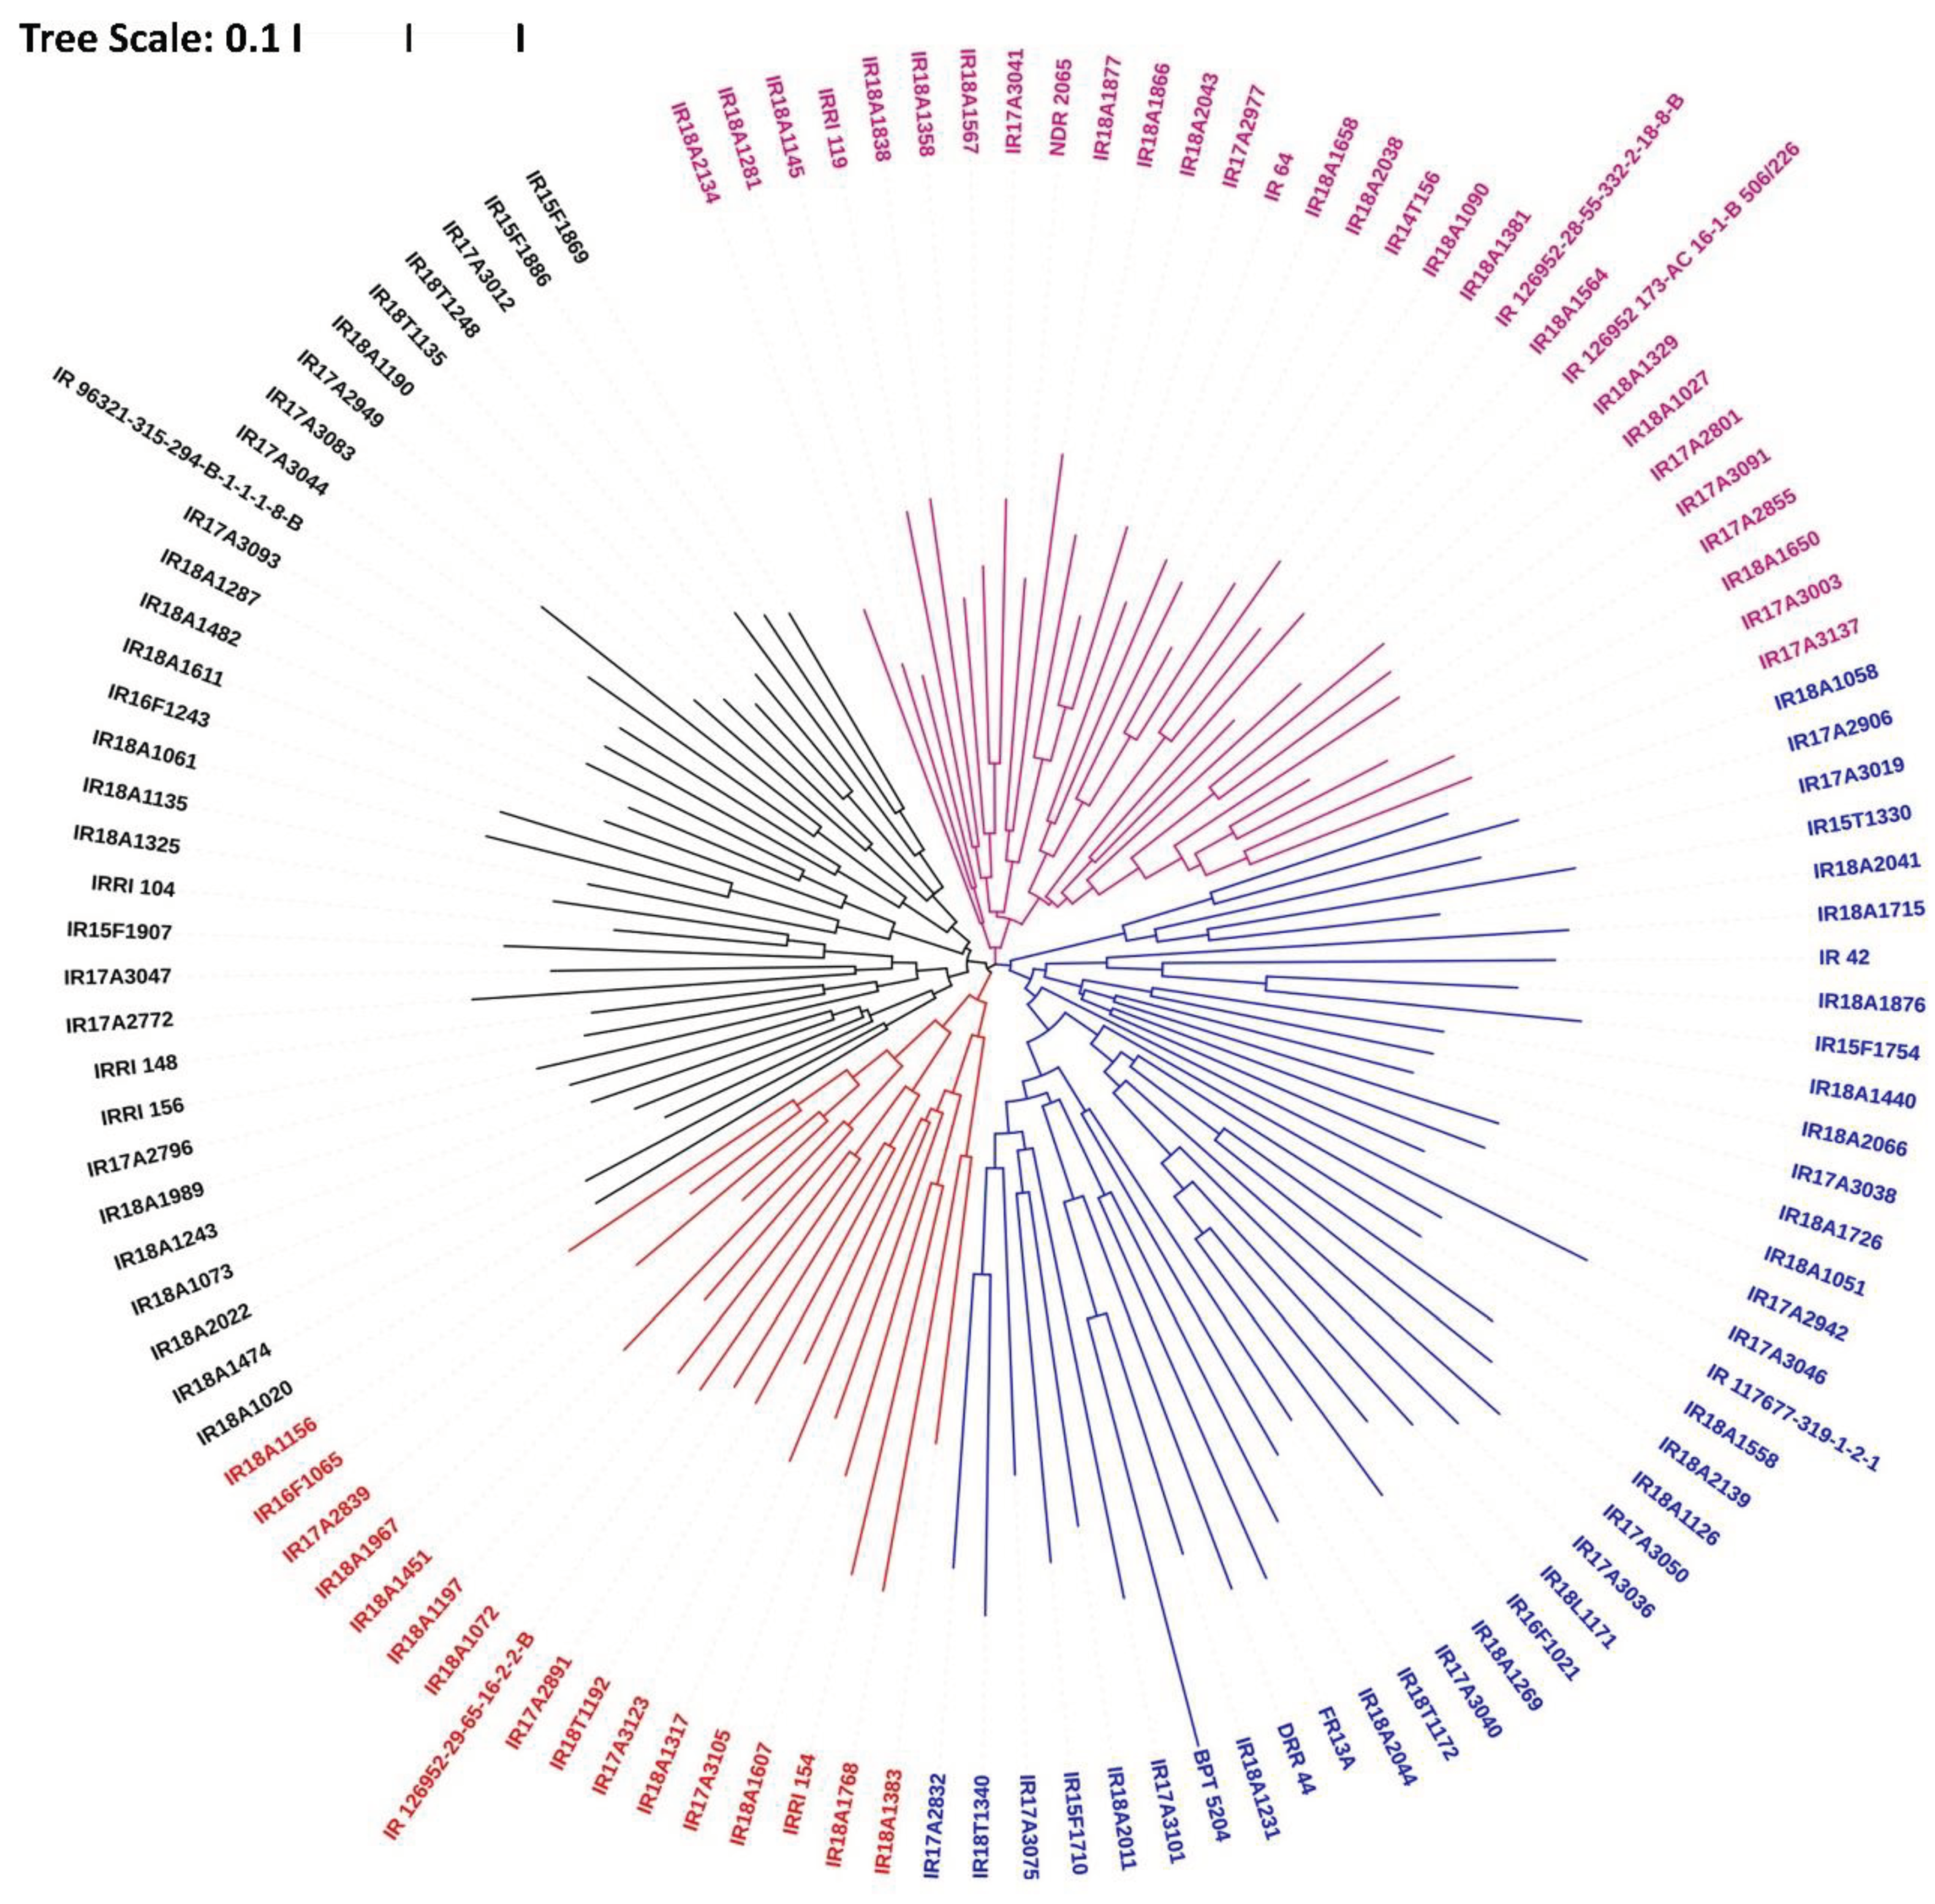
Figure 5.
Principal Coordinates of 116 accessions based on 64 SSR loci. Coord 1 and Coord 2 represent first and second coordinates, respectively.
Figure 5.
Principal Coordinates of 116 accessions based on 64 SSR loci. Coord 1 and Coord 2 represent first and second coordinates, respectively.
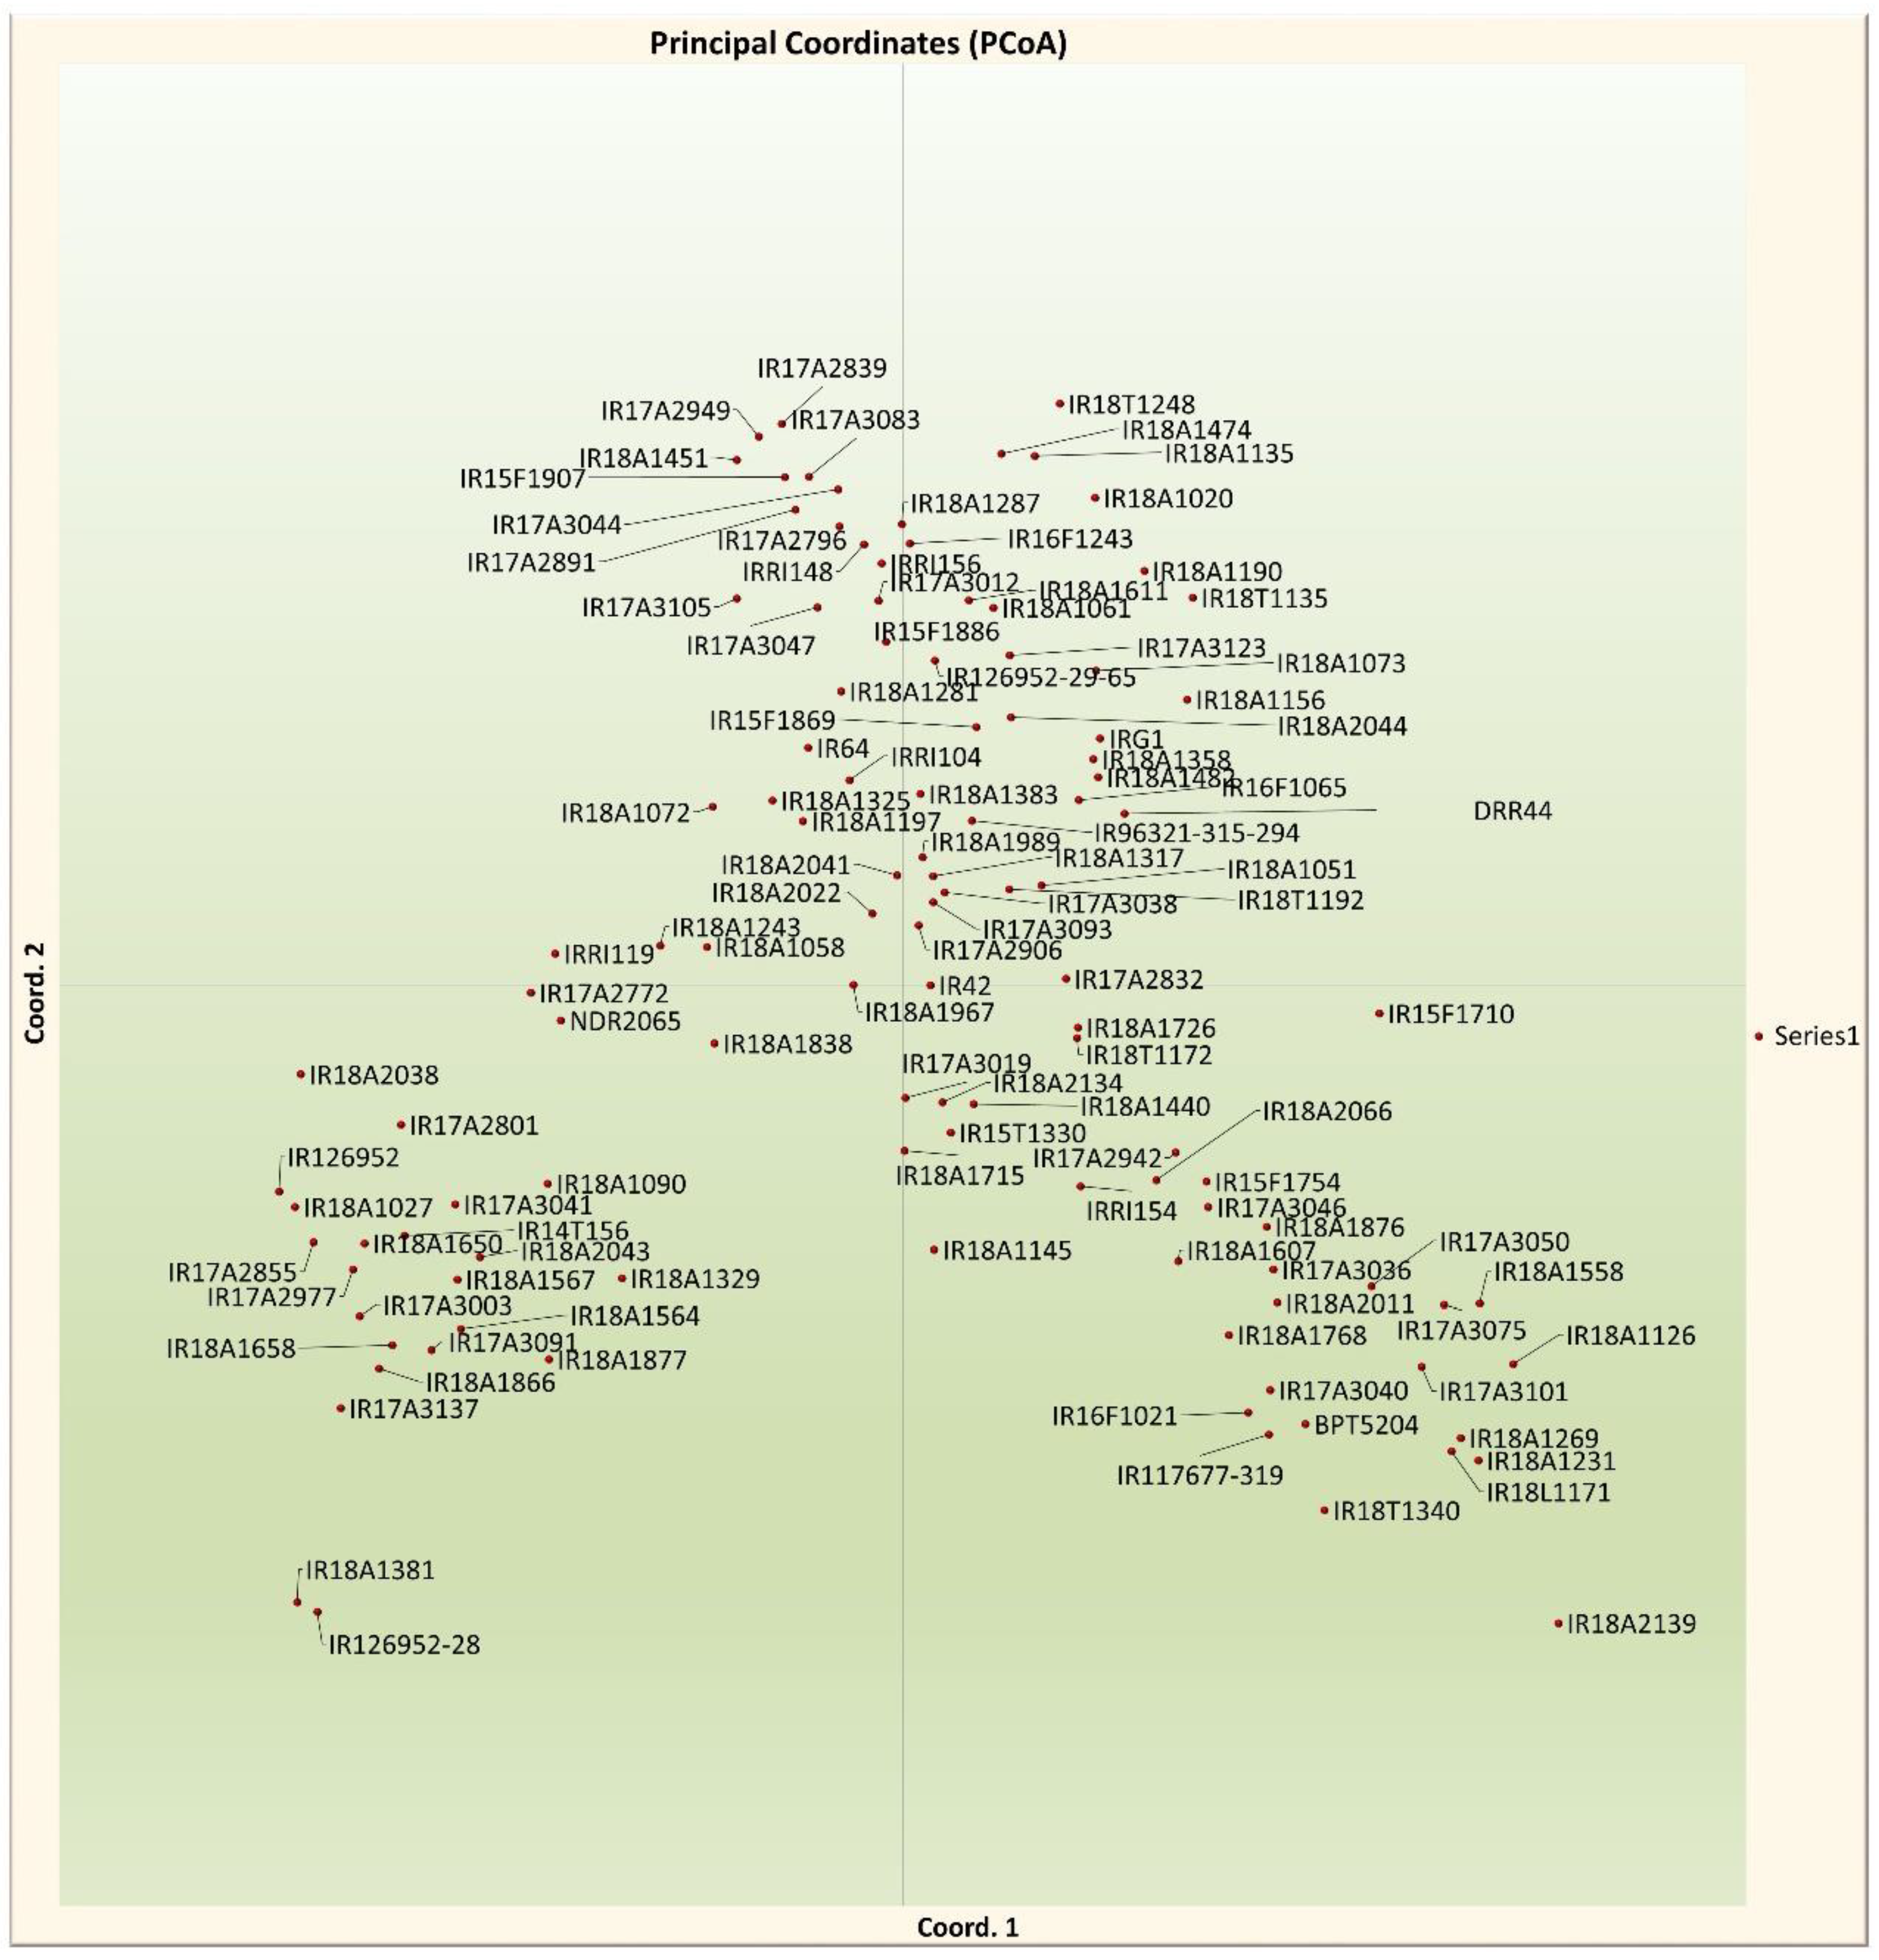
Figure 6.
Percentages of Molecular Variance.
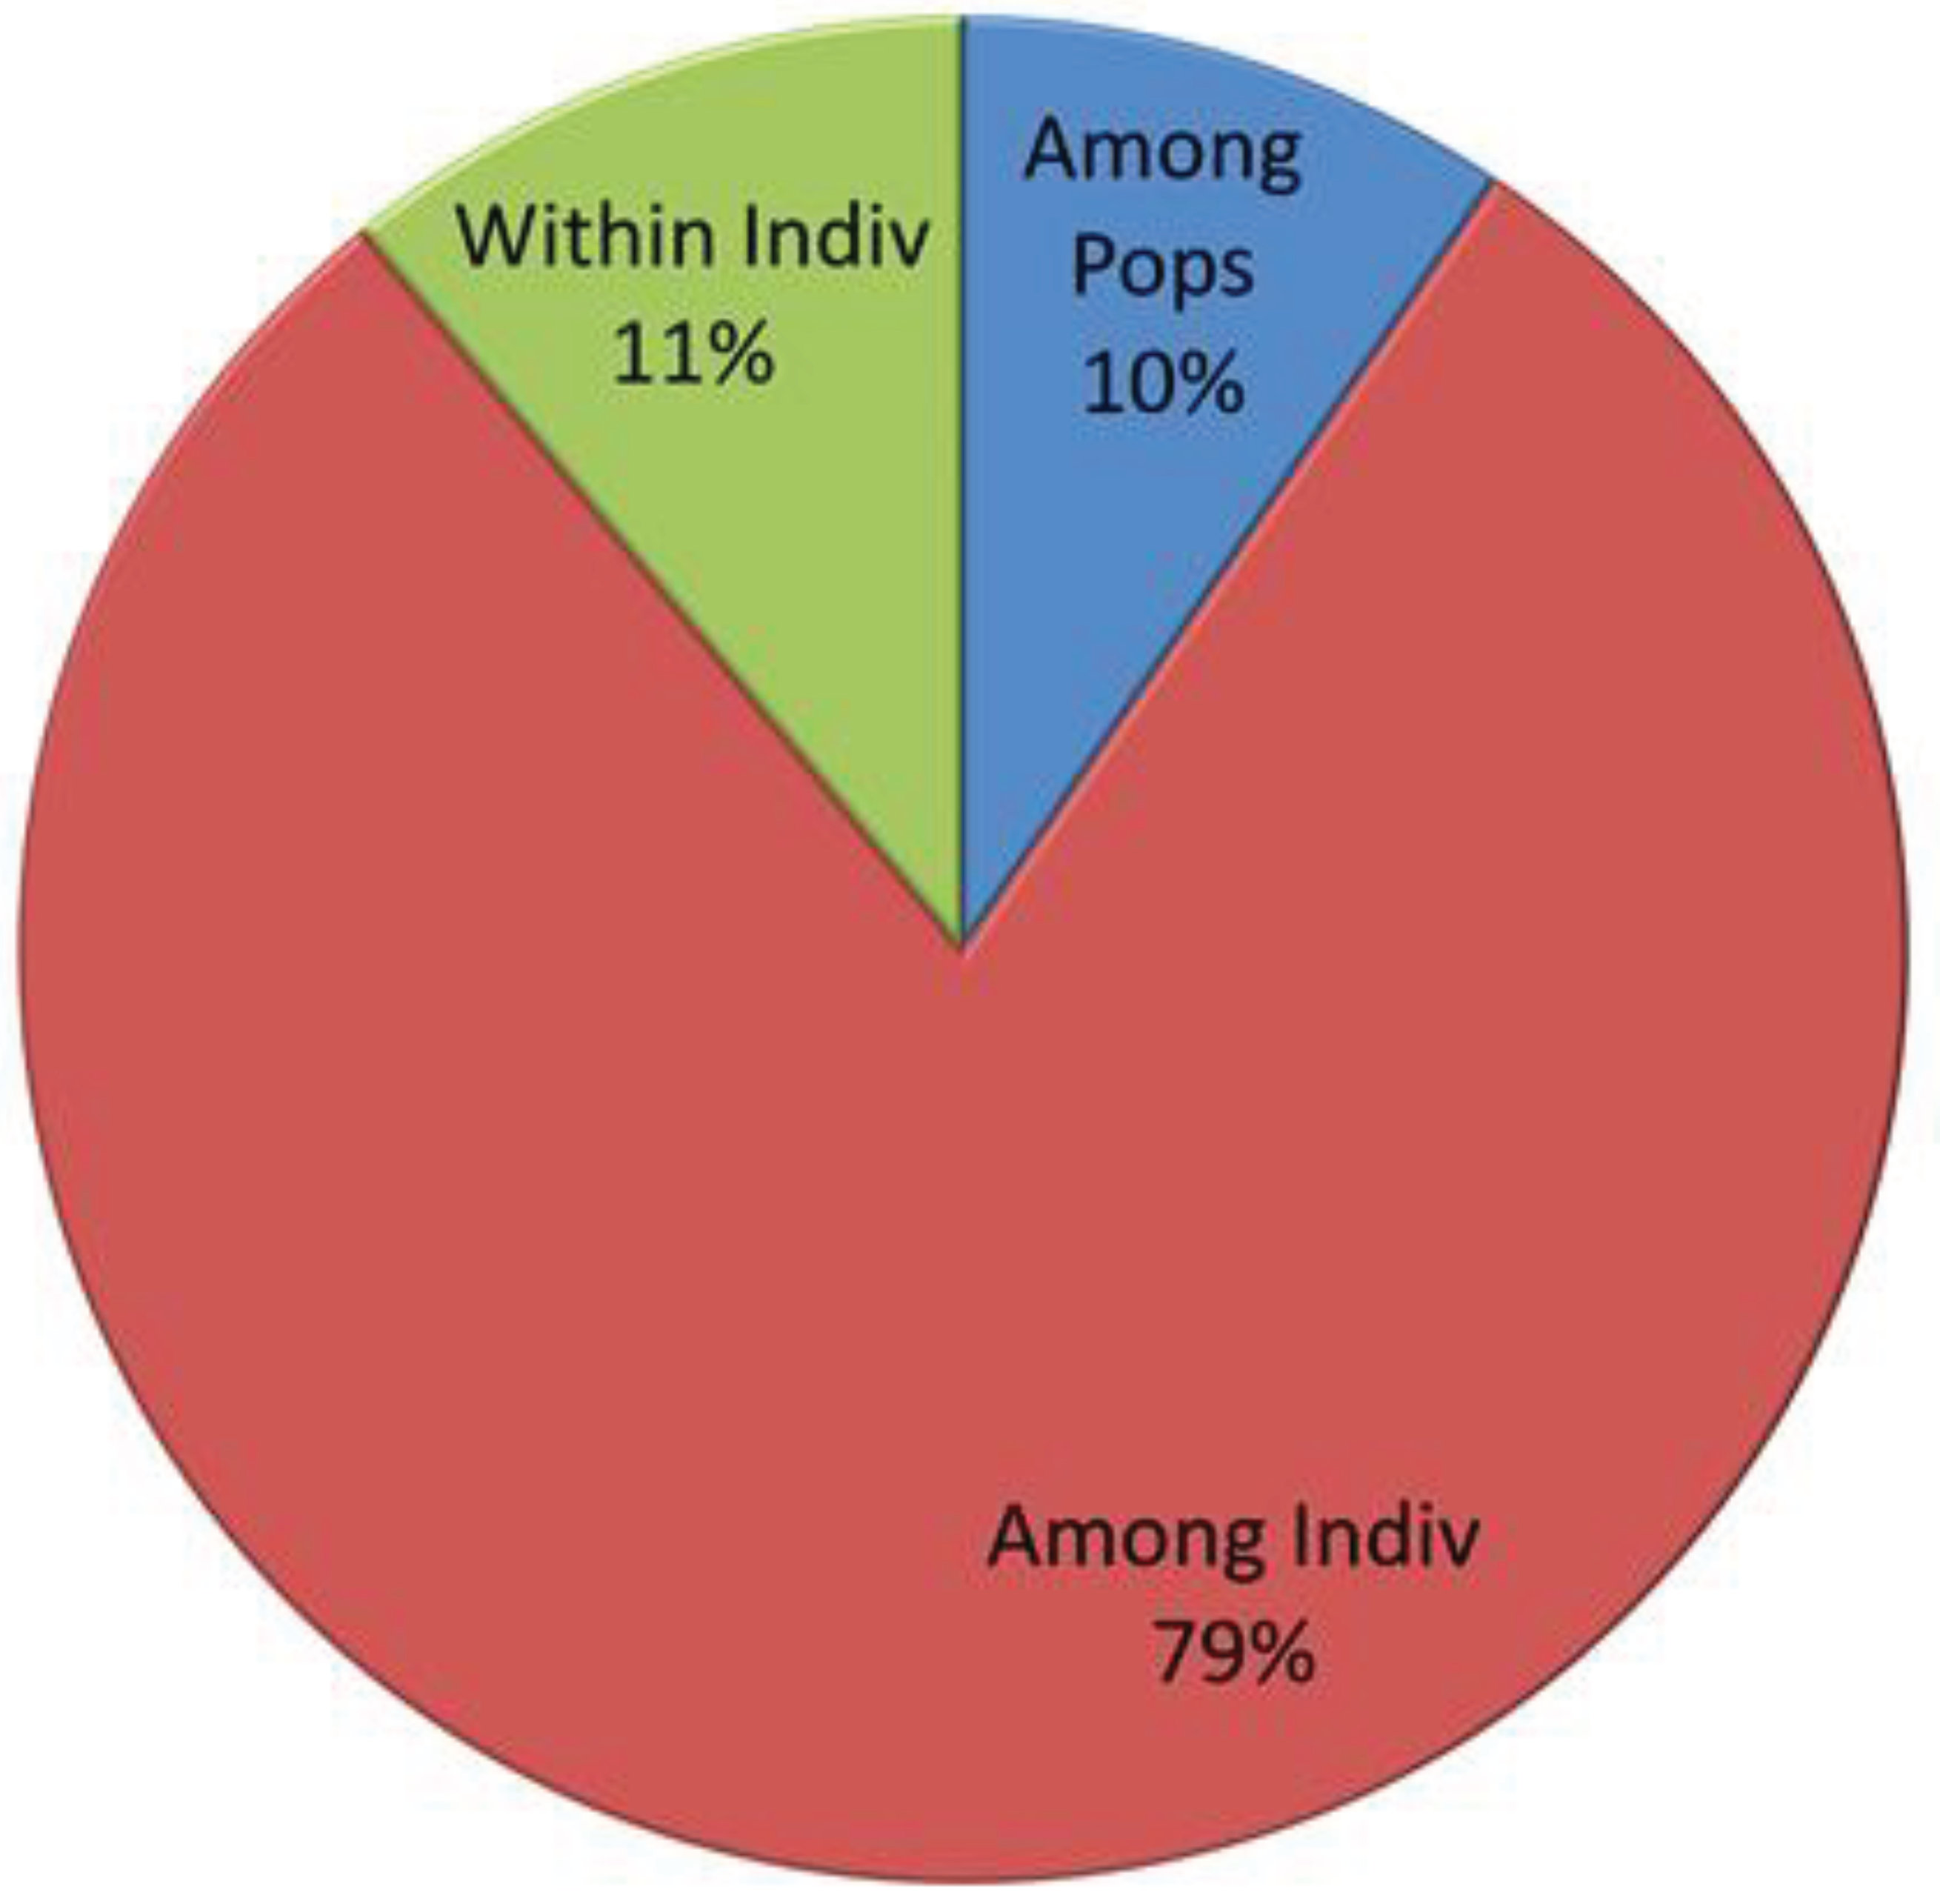

Table 1.
Details of SSR loci used for genotyping in the 116 rice accessions and their genetic diversity parameters.
Table 1.
Details of SSR loci used for genotyping in the 116 rice accessions and their genetic diversity parameters.
| Marker | Chromosome no. | SSR Motif | Mini. Mol. weight | Maxi. Mol weight | Number of alleles | Heterozygosity | Gene diversity | PIC Value |
|---|---|---|---|---|---|---|---|---|
| RM 495 | 1 | (CTG)7 | 160 | 180 | 3 | 0.494 | 0.497 | 0.722 |
| RM 283 | 1 | (GA)18 | 150 | 170 | 3 | 0.138 | 0.139 | 0.566 |
| RM 24 | 1 | (GA)29 | 130 | 180 | 6 | 0.811 | 0.815 | 0.969 |
| RM 5 | 1 | (GA)14 | 100 | 140 | 5 | 0.674 | 0.677 | 0.870 |
| HVSSR01-70 | 1 | (GATA)67 | 270 | 300 | 3 | 0.500 | 0.502 | 0.803 |
| RM 3520 | 1 | (CT)31 | 160 | 180 | 5 | 0.540 | 0.543 | 0.763 |
| RM 12329 | 2 | (GA)15 | 240 | 270 | 4 | 0.694 | 0.698 | 0.908 |
| RM 154 | 2 | (GA)21 | 140 | 210 | 8 | 0.819 | 0.823 | 0.925 |
| RM 110 | 2 | (GA)15 | 140 | 200 | 7 | 0.754 | 0.758 | 0.924 |
| RM 12705 | 2 | (TCAC)6 | 180 | 190 | 3 | 0.583 | 0.585 | 0.815 |
| RM 452 | 2 | (GTC)9 | 190 | 210 | 3 | 0.253 | 0.254 | 0.623 |
| RM2634 | 2 | (AT)31 | 150 | 160 | 3 | 0.584 | 0.586 | 0.830 |
| RM 138 | 2 | (GT)14 | 230 | 280 | 6 | 0.518 | 0.520 | 0.836 |
| RM 489 | 3 | (ATA)8 | 230 | 250 | 3 | 0.047 | 0.048 | 0.860 |
| RM 3716 | 3 | (AG)17 | 120 | 130 | 3 | 0.437 | 0.439 | 0.983 |
| OSR13 | 3 | (GA)n | 90 | 130 | 3 | 0.338 | 0.340 | 0.701 |
| RM 3646 | 3 | (GA)14 | 130 | 150 | 3 | 0.383 | 0.384 | 0.734 |
| RM 422 | 3 | (AG)30 | 380 | 390 | 2 | 0.393 | 0.395 | 0.729 |
| RM 307 | 4 | (AT)14(GT)21 | 120 | 200 | 3 | 0.339 | 0.341 | 0.740 |
| RM 7200 | 4 | (ATAG)8 | 150 | 270 | 8 | 0.868 | 0.872 | 0.980 |
| RGNMS3228 | 4 | (AT)42 | 350 | 360 | 3 | 0.405 | 0.407 | 0.984 |
| RM 241 | 4 | (CT)31 | 100 | 180 | 4 | 0.582 | 0.585 | 0.845 |
| RM 124 | 4 | (TC)10 | 260 | 290 | 3 | 0.323 | 0.325 | 0.959 |
| RM 122 | 5 | (GA)7A(GA)2A(GA)11 | 220 | 290 | 7 | 0.758 | 0.761 | 0.942 |
| RM 413 | 5 | (AG)11 | 80 | 100 | 3 | 0.560 | 0.563 | 0.925 |
| RM 18107 | 5 | (GA)33 | 290 | 300 | 2 | 0.436 | 0.438 | 0.755 |
| RM 5705 | 5 | (AAT)21 | 200 | 220 | 3 | 0.624 | 0.626 | 0.828 |
| HVSSR05-41 | 5 | (AT)58 | 290 | 310 | 3 | 0.400 | 0.402 | 0.799 |
| RM 161 | 5 | (AG)20 | 180 | 210 | 3 | 0.075 | 0.076 | 0.507 |
| RM 26 | 5 | (GA)15 | 110 | 130 | 0.620 | 0.623 | 0.694 | |
| RM 18842 | 5 | (TA)25 | 130 | 160 | 3 | 0.482 | 0.485 | 0.776 |
| RM 31 | 5 | (GA)15 | 150 | 190 | 6 | 0.482 | 0.485 | 0.846 |
| RM 510 | 6 | (GA)15 | 120 | 130 | 2 | 0.454 | 0.456 | 0.515 |
| RM 121 | 6 | (CT)7 | 160 | 170 | 2 | 0.224 | 0.225 | 0.640 |
| RM 6818 | 6 | (TCT)9 | 120 | 140 | 3 | 0.430 | 0.432 | 0.718 |
| RM 162 | 6 | (AC)20 | 210 | 1000 | 5 | 0.167 | 0.168 | 0.495 |
| RM 427 | 7 | (TG)11 | 180 | 190 | 2 | 0.334 | 0.336 | 0.701 |
| RM 11 | 7 | (GA)17 | 100 | 160 | 5 | 0.569 | 0.572 | 0.816 |
| RM 7 | 7 | (GA)19 | 170 | 190 | 2 | 0.238 | 0.239 | 0.684 |
| RM 455 | 7 | (TTCT)5 | 130 | 150 | 3 | 0.277 | 0.278 | 0.649 |
| RM118 | 7 | (GA)8 | 180 | 200 | 2 | 0.035 | 0.034 | 0.035 |
| RM 125 | 7 | (GCT)8 | 100 | 800 | 7 | 0.413 | 0.415 | 0.682 |
| RM 408 | 8 | (CT)13 | 120 | 130 | 2 | 0.017 | 0.017 | 0.517 |
| RM 25 | 8 | (GA)18 | 140 | 170 | 4 | 0.486 | 0.488 | 0.719 |
| RM 284 | 8 | (GA)8 | 150 | 160 | 2 | 0.176 | 0.177 | 0.600 |
| RM 433 | 8 | (AG)13 | 120 | 130 | 2 | 0.031 | 0.031 | 0.663 |
| RM 447 | 8 | (CTT)8 | 110 | 190 | 4 | 0.278 | 0.279 | 0.710 |
| RM 23657 | 9 | (GCC)7 | 260 | 280 | 3 | 0.216 | 0.217 | 0.690 |
| RGNMS3189 | 9 | (TCT)8 | 350 | 360 | 2 | 0.423 | 0.425 | 0.771 |
| RM 444 | 9 | (AT)12 | 110 | 240 | 6 | 0.691 | 0.694 | 0.909 |
| RM 105 | 9 | (CCT)6 | 100 | 160 | 4 | 0.406 | 0.408 | 0.703 |
| RM 271 | 10 | (GA)15 | 90 | 120 | 3 | 0.137 | 0.137 | 0.564 |
| RM 269 | 10 | (GA)17 | 100 | 130 | 4 | 0.620 | 0.623 | 0.834 |
| RM 26146 | 11 | (AGG)7 | 230 | 240 | 3 | 0.251 | 0.252 | 0.581 |
| RM 1124 | 11 | (AG)12 | 170 | 190 | 3 | 0.130 | 0.131 | 0.656 |
| RM 552 | 11 | (TAT)13 | 180 | 250 | 6 | 0.291 | 0.292 | 0.692 |
| RM 536 | 11 | (CT)16 | 210 | 230 | 3 | 0.434 | 0.436 | 0.709 |
| RM26657 | 11 | (AAAT)5 | 290 | 300 | 3 | 0.603 | 0.606 | 0.846 |
| RM7654 | 11 | (TTTC)9 | 190 | 200 | 3 | 0.550 | 0.553 | 0.800 |
| RM 415 | 12 | (AT)21 | 220 | 230 | 2 | 0.175 | 0.176 | 0.678 |
| RM101 | 12 | (CT)37 | 320 | 330 | 3 | 0.564 | 0.567 | 0.817 |
| RM277 | 12 | (GA)11 | 120 | 130 | 2 | 0.480 | 0.483 | 0.648 |
| HVSSR12-43 | 12 | (TA)62 | 340 | 350 | 2 | 0.655 | 0.658 | 0.734 |
| HVSSR12-44 | 12 | (TA)63 | 330 | 340 | 2 | 0.227 | 0.228 | 0.871 |
Table 2.
Genetic variability among studied traits.
| Characters | Mean | Range | Var (g) | Var (p) | GCV (%) | PCV (%) | ECV (%) |
|---|---|---|---|---|---|---|---|
| DFF | 107.65 | 86.60- 125.27 | 93.72 | 95.03 | 8.99 | 9.06 | 1.32 |
| SV | 32.33 | 17.41-56.75 | 70.32 | 75.97 | 25.96 | 26.98 | 5.65 |
| PH (cm) | 118.51 | 71.80-171.80 | 225.48 | 226.44 | 12.67 | 12.70 | 0.97 |
| PL | 113.96 | 52.21-179.08 | 554.43 | 615.66 | 20.65 | 21.76 | 61.23 |
| SPP | 93.84 | 0.00-165.21 | 54.39 | 71.64 | 8.66 | 9.93 | 17.25 |
| BYP | 28.50 | 14.61-48.50 | 28.91 | 31.94 | 18.86 | 19.82 | 3.03 |
| HI | 22.32 | 16.43-35.03 | 6.94 | 9.29 | 11.81 | 13.66 | 2.35 |
Table 3.
Population structure group of accession based on Inferred ancestry values.
| G. No. | Genotypes | Inferred ancestry | Structure group | ||
| Q1 Q2 Q3 | |||||
| RG1 | IRG1 | 0.004 | 0.301 | 0.695 | AD |
| RG2 | DRR44 | 0.004 | 0.695 | 0.3 | AD |
| RG3 | IR18A2044 | 0.006 | 0.362 | 0.631 | AD |
| RG4 | IR17A2832 | 0.025 | 0.704 | 0.272 | AD |
| RG5 | IR18T1172 | 0.02 | 0.595 | 0.386 | AD |
| RG6 | BPT5204 | 0.01 | 0.964 | 0.026 | SG2 |
| RG7 | IR15F1710 | 0.004 | 0.607 | 0.389 | AD |
| RG8 | IR18A1231 | 0.006 | 0.981 | 0.012 | SG2 |
| RG9 | IR18A2011 | 0.028 | 0.887 | 0.085 | SG2 |
| RG10 | IR17A3040 | 0.053 | 0.917 | 0.03 | SG2 |
| RG11 | IR18T1340 | 0.003 | 0.993 | 0.003 | SG2 |
| RG12 | IR17A3075 | 0.004 | 0.986 | 0.011 | SG2 |
| RG13 | IR17A3101 | 0.005 | 0.991 | 0.004 | SG2 |
| RG14 | IR18A1269 | 0.003 | 0.992 | 0.006 | SG2 |
| RG15 | IR17A3046 | 0.015 | 0.975 | 0.01 | SG2 |
| RG16 | IR17A3050 | 0.005 | 0.99 | 0.005 | SG2 |
| RG17 | IR18A1126 | 0.002 | 0.994 | 0.003 | SG2 |
| RG18 | IR18A2139 | 0.003 | 0.995 | 0.002 | SG2 |
| RG19 | IR117677-31 | 0.015 | 0.978 | 0.006 | SG2 |
| RG20 | IR18A1558 | 0.004 | 0.974 | 0.021 | SG2 |
| RG21 | IR18L1171 | 0.003 | 0.995 | 0.003 | SG2 |
| RG22 | IR18A1768 | 0.014 | 0.865 | 0.122 | SG2 |
| RG23 | IR16F1021 | 0.008 | 0.988 | 0.003 | SG2 |
| RG24 | IR17A3036 | 0.015 | 0.977 | 0.007 | SG2 |
| RG25 | IR15F1754 | 0.114 | 0.867 | 0.019 | SG2 |
| RG26 | IR17A2942 | 0.031 | 0.964 | 0.005 | SG2 |
| RG27 | IR18A1876 | 0.007 | 0.985 | 0.008 | SG2 |
| RG28 | IR18A1607 | 0.006 | 0.986 | 0.008 | SG2 |
| RG29 | IR18A2066 | 0.006 | 0.975 | 0.019 | SG2 |
| RG30 | IR18A1726 | 0.027 | 0.927 | 0.046 | SG2 |
| RG31 | IR18A1440 | 0.023 | 0.969 | 0.008 | SG2 |
| RG32 | IR18A1715 | 0.168 | 0.805 | 0.027 | SG2 |
| RG33 | IRRI154 | 0.018 | 0.964 | 0.018 | SG2 |
| RG34 | IR42 | 0.044 | 0.95 | 0.006 | SG2 |
| RG35 | IR18A1051 | 0.024 | 0.915 | 0.061 | SG2 |
| RG36 | IR17A2906 | 0.119 | 0.835 | 0.046 | SG2 |
| RG37 | IR17A3038 | 0.096 | 0.837 | 0.068 | SG2 |
| RG38 | IR17A3019 | 0.089 | 0.896 | 0.016 | SG2 |
| RG39 | IR18A2022 | 0.165 | 0.634 | 0.2 | AD |
| RG40 | IR96321-315 | 0.035 | 0.697 | 0.267 | AD |
| RG41 | IR17A3093 | 0.118 | 0.171 | 0.711 | AD |
| RG42 | IR18A2134 | 0.275 | 0.627 | 0.098 | AD |
| RG43 | IR18A1058 | 0.382 | 0.545 | 0.073 | AD |
| RG44 | IR18A1145 | 0.604 | 0.198 | 0.197 | AD |
| RG45 | IR15T1330 | 0.257 | 0.45 | 0.292 | AD |
| RG46 | IR18A2041 | 0.287 | 0.265 | 0.448 | AD |
| RG47 | IR18A1989 | 0.178 | 0.012 | 0.811 | SG3 |
| RG48 | IR18A1072 | 0.285 | 0.012 | 0.704 | AD |
| RG49 | IR18A1243 | 0.394 | 0.187 | 0.419 | AD |
| RG50 | IR17A2796 | 0.01 | 0.123 | 0.867 | SG3 |
| RG51 | IR126952-29 | 0.016 | 0.024 | 0.96 | SG3 |
| RG52 | IR17A3047 | 0.02 | 0.006 | 0.974 | SG3 |
| RG53 | IR15F1907 | 0.004 | 0.003 | 0.993 | SG3 |
| RG54 | IR17A2891 | 0.006 | 0.005 | 0.99 | SG3 |
| RG55 | IR18A1451 | 0.004 | 0.004 | 0.992 | SG3 |
| RG56 | IR17A3083 | 0.004 | 0.007 | 0.989 | SG3 |
| RG57 | IR17A2839 | 0.008 | 0.004 | 0.988 | SG3 |
| RG58 | IR17A3123 | 0.006 | 0.006 | 0.988 | SG3 |
| RG59 | IR18A1474 | 0.004 | 0.003 | 0.993 | SG3 |
| RG60 | IR18A1020 | 0.003 | 0.003 | 0.994 | SG3 |
| RG61 | IR18A1190 | 0.004 | 0.005 | 0.991 | SG3 |
| RG62 | IR18T1248 | 0.003 | 0.003 | 0.994 | SG3 |
| RG63 | IR18T1135 | 0.005 | 0.021 | 0.974 | SG3 |
| RG64 | IR18A1358 | 0.077 | 0.027 | 0.896 | SG3 |
| RG65 | IR16F1243 | 0.004 | 0.006 | 0.991 | SG3 |
| RG66 | IR18A1061 | 0.004 | 0.004 | 0.993 | SG3 |
| RG67 | IR18A1135 | 0.005 | 0.003 | 0.992 | SG3 |
| RG68 | IR18A1287 | 0.007 | 0.004 | 0.99 | SG3 |
| RG69 | IR18A1482 | 0.012 | 0.048 | 0.94 | SG3 |
| RG70 | IR18A1611 | 0.009 | 0.027 | 0.964 | SG3 |
| RG71 | IR18A1383 | 0.008 | 0.048 | 0.944 | SG3 |
| RG72 | IR17A2949 | 0.005 | 0.005 | 0.99 | SG3 |
| RG73 | IR17A3012 | 0.006 | 0.011 | 0.983 | SG3 |
| RG74 | IRRI148 | 0.008 | 0.005 | 0.987 | SG3 |
| RG75 | IRRI156 | 0.007 | 0.036 | 0.957 | SG3 |
| RG76 | IR18T1192 | 0.011 | 0.007 | 0.982 | SG3 |
| RG77 | IR18A1197 | 0.013 | 0.004 | 0.983 | SG3 |
| RG78 | IR18A1325 | 0.02 | 0.005 | 0.976 | SG3 |
| RG79 | IRRI104 | 0.106 | 0.103 | 0.791 | AD |
| RG80 | IR18A1317 | 0.014 | 0.095 | 0.89 | SG3 |
| RG81 | IR17A3105 | 0.007 | 0.004 | 0.989 | SG3 |
| RG82 | IR17A3044 | 0.005 | 0.003 | 0.992 | SG3 |
| RG83 | IR64 | 0.06 | 0.012 | 0.928 | SG3 |
| RG84 | IR15F1869 | 0.012 | 0.007 | 0.981 | SG3 |
| RG85 | IR15F1886 | 0.011 | 0.005 | 0.984 | SG3 |
| RG86 | IR18A1281 | 0.019 | 0.009 | 0.972 | SG3 |
| RG87 | IR18A1073 | 0.006 | 0.008 | 0.986 | SG3 |
| RG88 | IR18A1156 | 0.004 | 0.006 | 0.991 | SG3 |
| RG89 | IR16F1065 | 0.009 | 0.008 | 0.983 | SG3 |
| RG90 | IR18A1967 | 0.441 | 0.009 | 0.549 | AD |
| RG91 | IR18A1329 | 0.945 | 0.006 | 0.049 | SG1 |
| RG92 | IR17A3041 | 0.984 | 0.004 | 0.012 | SG1 |
| RG93 | IR18A1650 | 0.983 | 0.01 | 0.007 | SG1 |
| RG94 | IR17A2772 | 0.78 | 0.026 | 0.195 | AD |
| RG95 | IR17A3091 | 0.978 | 0.006 | 0.016 | SG1 |
| RG96 | IR17A2801 | 0.959 | 0.005 | 0.036 | SG1 |
| RG97 | IR17A2855 | 0.99 | 0.004 | 0.006 | SG1 |
| RG98 | IR18A1027 | 0.994 | 0.003 | 0.003 | SG1 |
| RG99 | IR18A2038 | 0.99 | 0.003 | 0.007 | SG1 |
| RG100 | IR18A1658 | 0.99 | 0.005 | 0.005 | SG1 |
| RG101 | IR17A3137 | 0.995 | 0.002 | 0.003 | SG1 |
| RG102 | IR18A1877 | 0.985 | 0.01 | 0.005 | SG1 |
| RG103 | IR17A2977 | 0.993 | 0.003 | 0.004 | SG1 |
| RG104 | IR18A1866 | 0.993 | 0.003 | 0.004 | SG1 |
| RG105 | IR18A1567 | 0.989 | 0.007 | 0.004 | SG1 |
| RG106 | IR18A1090 | 0.972 | 0.015 | 0.012 | SG1 |
| RG107 | IR18A2043 | 0.99 | 0.006 | 0.004 | SG1 |
| RG108 | IR18A1838 | 0.955 | 0.02 | 0.024 | SG1 |
| RG109 | NDR2065 | 0.788 | 0.023 | 0.19 | SG1 |
| RG110 | IRRI119 | 0.756 | 0.036 | 0.208 | AD |
| RG111 | IR14T156 | 0.99 | 0.004 | 0.006 | AD |
| RG112 | IR17A3003 | 0.984 | 0.005 | 0.011 | SG1 |
| RG113 | IR126952:17 | 0.99 | 0.003 | 0.007 | SG1 |
| RG114 | IR18A1564 | 0.953 | 0.01 | 0.036 | SG1 |
| RG115 | IR126952-28 | 0.985 | 0.008 | 0.007 | SG1 |
| RG116 | IR18A1381 | 0.988 | 0.004 | 0.009 | SG1 |
Table 4.
Summary of AMOVA between groups and accessions and Fixation Indices using Fst values.
| Source | df | SS | MS | Est. Var. | Percent |
|---|---|---|---|---|---|
| Among the Population | 3 | 351.793 | 117.264 | 1.575 | 10% |
| Among Individuals | 112 | 3137.005 | 28.009 | 13.099 | 79% |
| Within Individuals | 116 | 210.000 | 1.810 | 1.810 | 11% |
| Total | 231 | 3698.797 | 16.484 | 100% | |
| F-Statistics | Value | P(rand >= data) | |||
| Fst | 0.096 | 0.001 | |||
| Fis | 0.879 | 0.001 | |||
| Fit | 0.890 | 0.001 | |||
Disclaimer/Publisher’s Note: The statements, opinions and data contained in all publications are solely those of the individual author(s) and contributor(s) and not of MDPI and/or the editor(s). MDPI and/or the editor(s) disclaim responsibility for any injury to people or property resulting from any ideas, methods, instructions or products referred to in the content. |
© 2024 by the authors. Licensee MDPI, Basel, Switzerland. This article is an open access article distributed under the terms and conditions of the Creative Commons Attribution (CC BY) license (https://creativecommons.org/licenses/by/4.0/).
Copyright: This open access article is published under a Creative Commons CC BY 4.0 license, which permit the free download, distribution, and reuse, provided that the author and preprint are cited in any reuse.


