
Submitted:
13 March 2024
Posted:
15 March 2024
You are already at the latest version
Abstract
This investigation introduces an efficient method for assessing the reliability of semi-rigid steel frame connections in existing buildings, explicitly targeting the Top Angle and Seat Pad (TA-SP) semi-rigid connection commonly used in Australian cities' high-rise buildings. The moment capacity of these connections was examined through parameter power model testing, meticulously considering the bending, shear, and prying forces actions to determine the weakest elements in the connection system. A plastic hinge model was applied to ensure computational efficiency and accuracy in assessing the connections' ultimate strength. Comparatively, the finite element (F.E) method M−θ curves were introduced to scrutinise the nonlinear behaviour of the connection, providing validation for the predicted analytical approach. Further emphasis was placed on identifying the reliability of the weakest elements in the connection system, employing the First-Order and Second-Order Reliability Methods models to estimate their reliability index. The correlation between the model's failure probability and a percentile error was also explored, utilising Monte Carlo simulation reference for refined validation. Novel formulas and methodologies were introduced to compute the locked-chain-series system reliability, which accounts for the inherent material and geometric variability. The findings highlight the critical significance of the weakest element in determining the overall reliability of the existing TA-SP connection.
Keywords:
Semi-rigid connection
; M−θ relationship
; Finite element F.E.
; Locked chain series system
; Reliability index
; System reliability index
; Target reliability index
1. Introduction
The interest is increasing in developing assessment methods or possibilities for determining the reliability of the existing ageing building's frames. Notably, the ageing building's frames exposed to lateral force were a significant hazard source and the primary requirement of a safety measure. Therefore, many recent studies have focused on evaluating building resilience, i.e., the holistic ability to minimise loss through reliability, redundancy, and recoverability against extreme loads. Indeed, considering uncertainties in seismic demands, the response values of existing building members, such as beams, columns, and connections, exhibit significant correlations due to uncertain ground motion strengths.
However, assessing the seismic safety of older aging buildings that do not meet current design standards necessitates a fast and effective method. In this context, gathering all available data, including construction materials and structural drawings, is crucial to understanding the interconnected members of the building and the flexibility of its structural system. In this case, many numerical models were developed to assess the connection flexibility, offering valuable insights into the underlying system. Hardy Cross [1] is accredited for his contributions to understanding structural behaviours, especially the rotational flexibility of connections. Since then, considerable experimental and numerical work has been carried out, leading to the development of the semi-rigid connection.
In the early design development stage, riveted, bolted, and welded connections contributed to how the semi-rigid connections transmit forces and deform under various load conditions. This information is now well-established and integral to the design methods. The design codes, such as AISC-LRFD [2] and Eurocode 3 [3], provide deep insight into the design model that considers the moment-rotation relationships. The applications of design model parameters, such as initial stiffness (Rki), ultimate moment capacity (Mu), and shape parameter (n), are essential factors in semi-rigid connections. The backgrounds of detailed experimental tests and numerical analysis are vigorously accessible in the preceding works of literature – see, for example, Richard and Abbott [4] Kishi and Chen [5], Colson and Louveau [6], Azizinamini et al. [7], Bjorhovde Colson & Brozzetti [8], Pekcan, Mander and Chen [9], Faella et al. [10] and Ahmed et al. [11]. The review regarding the established methodologies is clearly outlined in (ANSI/AISC 360-10 and Eurocode 3 Part 1- 8) [3]) which permit the consideration of the semi-rigid behaviours that reflect the ranking in the classification.
Over the past few decades, designing a semi-rigid connection has been challenging due to the complex calculations required to determine the influential parameters factor. Therefore, extensive research has been carried out to develop advanced analysis techniques that accurately account for the parameters' power mode of the semi-rigid connections using the three-dimensional nonlinear finite element analysis. The 3D version is a virtual reality that uses advanced computer modelling technology to enhance design concepts. The work of Pirmoz & Danesh [12] and Smitha & Babu [13] provides early insight into the need to consider the moment-rotation behaviour on bolted top and seat angle connections using the F.E. method. Ahmed et al. [14] developed a nonlinear finite element model to investigate the effects of prying forces thoroughly and involved rigorous analysis of the moment-rotation behaviour of T-SA connection with double web angles. The results indicated that the local contact area influences the connection parameter profiles. Further, Diaz et al. [15] comprehensively reviewed more literature and outlined the significant findings of various semi-rigid connections.
The main focus of this paper is to assess the reliability of the existing Top Angle and Seat Pad (TA-SP) connection, widely utilised in high-rise buildings across Australian cities erected from the 1920s to the 1960s. The semi-rigid connection types within the building frame joints combine stiffness and flexibility, presenting a unique characteristic compared to entirely rigid or flexible connections. This specific connection has not been previously studied, and no established procedures exist to analyse its behaviour. The connection system consists of various elements exposed to tensile force, and the weakest elements can be susceptible to bending-type behaviour. The tensile strength at which bending occurs is the design criterion for the compression of the elements.
Meanwhile, a computer program model is a convenient method to assess the F.E. nonlinear behaviours of an existing connection, enabling the characterisation of failure behaviours while ensuring both safety and operational efficiency. The structural reliability methods model also provides a standardised method to assess the overall connection system reliability at multiple levels. In this context, the current study focuses on analysing changes in the cross-section of the weakest elements to evaluate the system reliability of existing connections.
Both approaches mimic a fast seismic advancement gaining significance due to the widespread use of the TA-SP connection in Australian metropolises. Moreover, the basic principle of the structural reliability concept may pose challenges, as it involves assessing the failure probability of the weakest elements. This evaluation is intricately linked to the overall cross-section of the existing connection, magnifying the probability of system failure. Hence, the system reliability index becomes the foundation of a new method that aligns with the essential criteria of ISO 13822 [16], ISO 2394 [17], and JCSS [18].
2. Investigation Methods and Framework
The primary purpose of the current study is to estimate the reliability of the existing TA-SP semi-rigid connection. For this reason, a comparison was conducted between the existing connection's theoretical representation and the nonlinear finite element (F.E.) analysis method using ABOUCS [19] computer programs.
However, the general results cannot be dependable measurement sources, as the uncertainties cause significant errors. Therefore, it is imperative to exercise carefulness and not be considered based solely on the results of any critical decisions. For instance, loading, material properties, and engineering models are primary measures of uncertainties.
Hence, structural reliability methods that refer to an organised investigation approach were proposed for the current research and investigation purposes. This delineates various reliable methods for efficiently gathering and organising information that is applicable across computational models. This includes the First Order Reliability Method (FORM) [20] and the Second Order Reliability Method (SORM) [21], which were initially introduced. This is followed by the Monte Carlo simulation (MCS) [22], which plays a vital role in validating the accuracy of the analysis, particularly in determining the failure probability of the existing connection.
In this context, the steps are essential in capturing the essence of the new approach initiating a system reliability study. Therefore, the following inclusive flowchart outlines the steps in Figure 1 to streamline the process and address the existing connection reliability issues.
2. Deterministic Analyses of the Existing Connection System
2.1. Assessing the Failure Probability in the TA-SP Connection System
The prototype of the TA-SP connection model is proposed to determine the reliability index and the probability of failure. Typically, failures involve multiple random variables related to the connection system, expressed through the system's failure modes. The model shows a sequence of interconnected elements; accordingly, despite the complexity of the connection system, Figure 2 depicts the existing TA-SP connection prototype containing ten independent elements.
However, it is crucial to note that the existing connection model operates within a statically determined framework, rendering it susceptible to system failures. This vulnerability stems from the possibility of plastic hinges forming in any of its weakest elements. Consequently, such hinge development can trigger failures across the connection system. Intrinsically, each element of the model is susceptible to failure mode and therefore, the probability of the system failure is based on the weakest link of the -th element, as previously quoted by the expression of Freudenthal [23]
Where = the event failure in an i-th mode of . Hence, the probability of system failure can be expressed by:
Where , is the joint probability of the density function of stochastic variables, and the g(X) 0 is the limit state function, Where X is a vector of stochastic variables of the system and can be defined using the relationship between the applied force , and the resistance of the element , where X is (…) of the system variables, and is a physical model of statistical uncertainty. In this context, the limit state event is merely expressed by the conditions of g(X) 0 is safe and relatively g(X) < 0 is failure set, and the relevant equation can then be described as:
Where , is a function of shear force in i-th element, and is the resistance of the i-th element. With such a perspective, the expression of Weibull gives the cumulative distribution function of the i-th strength, as given in the following equation [24]:
2.2. Analysing the TA-SP Connection Through Locked Chain System
The semi-rigid connection consists of unified inter-reliant mechanisms. Its performance is governed by the limit state function and is assumed to have two crucial conditions: the system's functional and failure state. System failure is then related to the individual element, and the forces can be either in the state of function or failure. For instance, if one of the elements fails, the other elements may not hold the connection system and instantaneously cause a brittle failure with low statical determinations. This type of failure is expressed by the failure mode of the individual component En and is likely to lead to a series of system failures. For instance, Figure 3 illustrates that the locked chain-series system comprises ten independent elements of the existing connection, which expresses their applications to the failure modes.
Generally, failure can occur through the applied tensile forces on the system performance, and Xi represents the force distribution among the elements. Relatively, the strength of the connected elements distribution is denoted by Si. Where (i) is the failure event of the i-th element and i = 1, 2, ... n. Thus, the failure state of the weakest link element is given by En = {Xi > Si}, and the domain conditions are the clockwise rotational failure mechanism of the connection signifying the failure event. Accordingly, the failure probability of the union events from the limit state function is given by rearranging Equation 1.
In this instance, the applied force and resistance are stochastic variables. Past experimental test data likely define the resistance parameters of the existing connection elements. The integral functions of the parameters represent a mean and standard division, and each variable possesses a statistical distribution that factors its model uncertainty. In order to emphasise the uncertainties, the distribution can be based on the und, underlying properties of the random variable. The probability distribution is based on the underlying properties of the random variable. In this study, the statistical properties of the random variables are taken from the most practical recommendations of JCSS [18], Ellingwood [25], Fisher & Galambos [26], Galambos & Ravindra [27], Kennedy & Gad Aly [28], whilst the section properties are taken from Melcher et al. [29], Holicky & Sykora [30]. In addition, the past research provides the existing steel data, including 1923-A3, 1936-A36, 1955-A36, and 1963-A36 steel products with strengths of 124, 138, 158, and 158 MPa [25]. The upper range for yield strength can be determined by 0.95(fy − 4 ksi) or 0.95(fy − 28 MPa) [25], and specific variables related to the TA-SP connection are outlined in the following Table 1.
The average tension strength for the fillet weld section is about 1.05, with a coefficient of variation of 0.04 [26]. The shear strength ratio to electrode tensile strength is about 0.84 with a coefficient variation of 0.1, while the shear weld strength ratio is 0.88 with a coefficient of variation of 0.11. However, if the weld fabrication is involved, a coefficient of variation of 0.15 is recommended [26].
2.3. Ultimate Moment Capacity of the TA-SP Connection
The clockwise rotational mechanism of the existing connection operates as a locked series system, transmitting a tensile force into individual elements. The strengths of the connection's weakest elements can influence failure. For example, Figure 4(a) schematically illustrates the existing connection-locked chain series system, and the weakest element among the individual elements indicates the failure in a series system.
Unlike elements, (E3) and (E9) operate subsystems in parallel, requiring separate assessments. In simpler terms, assessing the parallel systems is a complicated and exceptional process, as schematically illustrated in Figure 4(b). However, these subsystems are limited to small activities and occur in sequence, even though they are not necessarily as they are related to stochastic variables.
The system's failure is contingent upon the strength of its weakest element. In this context, the Drucker yield criterion [31] helps as a primary tool for evaluating the ultimate tensile shear force exerted on the locked chain-series system. Notably, the prying force exerted by fasteners (E1) and (E3) is pivotal, resulting in tension forces () due to contact effects, thereby altering the geometrical and material strength changes of the connected element (E2). In this context, failure mechanisms play a crucial role in defining the limit state function for each element within the system. Subsequently, Tresca's yield criterion [32] arises as pivotal in determining the limit state condition for the weakest element (E2), indicating the most vulnerable link, in the system:
Where is a proportional load factor (PLF), is the gauge length is applied tensile force. In addition, the Australian Standard gives the limit state function of the weld section [33].
Where is a compressive force, is the moment at the centre of rotation, is a weld throat depth and , denoted by the ultimate strength of the weld section. Among other things, the general procedure is linked with the moment–rotation relationship behaviour and the connection curve parameters can be discussed using the curve-fitting approaches. In this context, the preceding equation for the ultimate moment capacity of the existing TA-SP connection is given by:
It is also essential to note that the moment-rotation relationships can be effectively expressed in a self-contained format, enabling easy reference to Equation 8. The parameters, such as initial stiffness, ultimate moment, and rotational capacity, can be cross-referenced with the author's previous work to avoid duplication (see Appendix A).
3. Analysing the Weakest Element Failure Mechanisms in the System
The study extends an investigation initiative that evaluated the numerical and analytical performance of the existing connection elements. A prototype of the connection was developed, and the gauge distance was assessed by adjusting the thickness of the vertical leg and stretching (gauge length) limits, thus migrating inelastic demands from the beam-column interface. For this purpose, Figure 5 illustrates the prototype of the existing TA-SP connection and its geometrical parameters are outlined in Table 2 for meticulous analysis of the connection responses, mainly focusing on measuring the failure mechanisms and the load-carrying capacities of the weakest elements in the system.
The conventional method for assessing the weakest element involves the failure and safe state. To better understand, Figure 6 illustrates the failure mechanism of the weakest elements during the full range of the beam rotation's hysteretic behaviour.
At gauge, distance (), in both scenarios exhibits identical effects, ensuring equal pre-yield stiffness under unformed transferred force. However, while both elements initially demonstrate comparable pre-yielding behaviour at similar gauge distances, their responses diverge post-yielding. This leads to decreased capacities and heightened sensitivity to overall connection stability, as illustrated in Figure 7(a) and Figure 7 (b) for their failure and safe states, respectively. Their analyses entail incrementally varying the Proportional Load Factor (PLF) from 0.0 to 1.0 between the ultimate and plastic moment capacity connection responses, as elaborated in Appendix A. Their conditions are initially expressed by Equations 6 and 7 and involve a linear analysis focusing on the connection responses represented in the failure mode. It also elucidates the distinctive failure mechanisms of these weakest elements, comparing the ultimate beam rotation yields when assigned to 119.2 kN ultimate tensile force.
To further validate these findings, the subsequent section delves into how the weakest elements influence the nonlinear moment-rotation relationship under the beam's clockwise rotational failure mechanism, providing additional justification for the proposed analysis.
4.0. Modelling Finite Element Method
Three-dimensional nonlinear F.E. models were developed in ABOUCS [19] commercial software for the existing TA-SP connection. The steel material with fy ≈ 210 MPa and fu ≈ 435 MPa yield strength is used for beams and columns, and a 0.2% post-yield stiffness ratio is used in both cases. The connection between the top angles, seat pad, beam, and column is modelled as a system of nonlinear elements with distributed plasticity, and the load will transmute from the beam to the column via riveted top angles and seat pad connection. This arrangement is depicted in Figure 8 using a 3D finite element model.
The number of independent contact interfaces was considered for the suitable interaction between the connected portions. Contact-friction interfaces are used to simulate the contact between each element and the surrounding parts. Figure 9 illustrates the advanced modelling implemented in the von Mises yield criterion [34], which services the simplified model strategy.
The fastener pretension was applied for a thermal gradient on the fastener yield. Since there is no information about the amount of fastener pretension in the earlier study, the design values of the pretension force described by ANSI/AISC 360-10 [35] were applied. At the initial loading stage, about 178 kN pretension force was used for a 22.3 mm diameter rivet fastener. Each element was modelled based on a plastic-borne approach, and zero nonlinear rotations were placed to simulate the formation of hinges in the weakest elements. These effects can also translate to the moment-rotation relationship curve expressing the curve parameters mode.
4.1. Validation
Indeed, to facilitate the practical application of the nonlinear F.E. mothed process, the moment-rotation curve that includes essential parameters like initial stiffness (Rki), ultimate moment resistance (Mu), and shape parameters (n) at different curve levels employed, enabling a more profound consideration of the weakest element's effect as depicted in Figure 10. This highlights the critical parameter mode of the existing TA-SP connection, offering valuable insights into the connection behaviours.
Indeed, the analysis reveals an elastic-to-plastic transition examined at increments of 0.01 rotation. As per ANSI/AISC 360-10 guidelines [35], the rotational limit for ultimate resistance stands at 0.02 radians. In addition, the plastic resistance rotation for stiffness degradation during a complete cycle is about 0.03 radians, as evidenced in the moment-rotation relationship curve of this study. While comparing the predicted results with those of the F.E. model, the F.E. method yielded slightly superior results than the analytically predicted value (see Appendix A). Nonetheless, both methods demonstrated relatively close results and accurately captured the behaviour of the TA-SP connection parameters.
5.0. Structural Reliability Methods
This study introduces structural reliability for evaluating the TA-SP connection system. It discusses commonly used techniques, like FORM [20] and SORM [21], to simplify calculations and determine the reliability index. The Monte Carlo Simulation (MCS) [22] was introduced to compare the results' accuracy. Meanwhile, advanced computational tools like MATCAD [36] and spreadsheets were employed to streamline simulations (see Appendix B).
5.1. First-Order Reliability Method FORM
The First Order Reliability Method aims to represent uncorrelated random variables in a linear limit state function utilising the first and second moments [37]. The method includes the First-Order Second-Moment (FOSM) and the Advanced First-Order Second-Moment (AFOSM) approach. The FOSM method ignores information about the distribution of random variables. Conversely, the distribution of random variables is aptly utilised in AFOSM.
5.1.1. Estimating the Probability of Failure Using FOSM
The clockwise rotational mechanism of the existing connection represents an optimal scenario for plastic failure, delineating the minimum reliability of its weakest elements. The connection system is deterministic and distributes the tensile force equally among elements despite variations in strength and size. The FOSM approximation is ideal but encounters limitations due to the first-order Taylor expansion for managing the nonlinear limit state functions. Thus, the failure probability of the weakest element can be estimated by substituting Equation 1 and 4 into Equation 9.
Consequently, it can be simplified by including the Proportional Load Factor:
The resistance and the load will be modelled as independent Gaussian random variables with N(µRi, σRi) and N(µSi, σSi), respectively. Where Si is the mean value of the applied moment at the i-th element and, relatively, Ri is the mean value of the plastic moment capacity of the i-th element, , is Proportional Load Factor (PLF) ranging from 0.0 to 1.0, and , is the standard devotion for the i-th element. The equation for calculating the reliability index of the TA-SP connection can be expressed by the inverse cumulative distribution of the standard normal function [20,38]:
5.1.2. Estimating the Probability of Failure Using AFOSM
Advanced First-Order Second Moment is the transition of the reduced variable in the standardised coordinated system [37], and thus, the reduced random variable be expressed by:
Where i is designated by , of the limit state function of the component as referred to in Equation 3 and can be rewritten as . This represents the minimum vector distance point from the origin of x*and simplifies the random variables of ( at the design point. However, for a more refined analysis of consistent coordination, the Hasofer-Lind reliability index [39] can be used to determine the minimum vector distance point from the limit state surface:
It also represents the minimum random variables of the load-carrying capacity (), and the applied moment (). Both variables are independent and expressed by Gaussian random variables N(, ) and N(, ):
From this perspective, the limit state function can be driven by:
Where , is a Gaussian distribution comprising the chain rules. As such, the partial derivative of the performance function at the design point of the origin is given by:
Then, the reduced design point (n – 1) of the variable is expressed by:
Where is a direction cosine at the minimum distance point of , that could be articulated by the following equation [40]:
Hence, the normalised value of the design point at the origin space is given by:
Accordingly, Figure 11 illustrates the uncorrelated minimum distance point at the limit state surface for elements E2 and E7.
Where and denote the design points at the limit state surface, reflecting the reduced reliability index. Accordingly, Table 3 elucidates this convergence, observed at the third iteration cycle, indicating their corresponding failure probabilities.
5.2. Estimating the Probability of Failure Using SORM
The Second-Order Reliability Method (SORM) is a technique used for reliability analysis that considers the second-order effects. It provides a more accurate estimation of the reliability index by considering the nonlinearity of the limit state function and the non-normal distribution of input variables at the limit state surface [21]. SORM is a robust method that quickly delivers reliable results using the First-Order Reliability Method (FORM). The method involves the Rosenblatt transformation [41], which converts random variables , to a non-normal distribution in the U space. The conversion of the random variables to standard variables is given by:
The mean () and standard deviation () of , for the minimum distance of a design point () are crucial parameters. Similar methodologies are applied to estimate the equivalent parameters for log-normal . The failure probability can be computed using the probabilistic model of g(), representing the direction cosine at the minimum distance design point [37]. This approach is applied to the TA-SP connection elements, as depicted in Figure 12, with its background briefly discussed in a prior study [42].
The Rosenblatt transformation is a differential operator wherein the eigenvector function scale is definite by (n x 1) matrix with the differential equations. The relationship between the eigenvector function and the decomposed diagonalised matrix encompasses the rotational coordination (θ). by emphasising its geometrical descriptions. Such perspective has a diagonalised matrix that the following equation can formulate:
Where θ = 270º + tan–1(/), and is the, transforms the random variable to the reduced distance. Consequently, for determining the second derivative performance function of the chain rule differentiation. Such expression in matrix form is given by:
Hence, the second derivative of the limit state function at the design point is given by:
Where i is an individual connection element of (, …) and thus, the last row and last column are computed for the eigenvalues of the matrix . Intrinsically, the system failure probability approximation is given by taking the eigenvalue () of the matrix , into account [21]:
Where and are first-order reliability indexes [20] representing elements E2 and E7. Accordingly, Equation 24 can be transformed into the inverse standard normal distribution function, expressing the weakest elements' reliability index.
6.0. Results in Percental Error
In order to compare FORM and SORM precision, ten thousand simulations were performed using the Monte Carlo Simulation (MCS) [22], measuring the number of performance functions g(x). Furthermore, the system reliability-based analysis, where the performance function is more efficient in determining the probabilities of failure. As for efficiency, recent literature highlights the percentile error as a measure of efficiency, comparing the probability of failure. This generally involves a set of numbers that indicate the fractional difference in calculating the probabilistic model [43]. Thus, control of the percental error is given by:
In this respect, the MCS provides a reference for comparison, and Table 4 presents the calculated probabilities of failure and the percentile error and plots the corresponding failure mechanism of the existing TA-SP connection in Figure 13 and Figure 14.
While each method meets stable conditions, the AFOSM and FOSM overestimate the probability of failure, exhibiting lower efficiency than SORM in percentile errors. Specifically, SORM yields about 27.1% and 49.7% higher than the AFOSM and 87.7% and 154.33% higher than the FOSM. This discrepancy is expected as SORM accounts for both first and second-order effects, capturing the curvature of the performance function.
Similarly, MCS yields approximately 100.1% and 113.1% higher values than AFOSM and 195.6% and 262.1% higher than FOSM. However, it captures 80% and 65.7% of the overall percentile errors. Comparing SORM with MCS is a crucial part of the study; the MCS is approximately 57.4% higher in E2 and 45.99% higher in E7. Despite these differences, they are almost close in their order of magnitude and are not very significant.
7.0. System Reliability Analysis of the Existing TA-SP Connection
Over the past four decades, extensive research has focused on evaluating the reliability of individual structural members to inform design codes. However, upon comparing the reliability of single members to that of entire systems, it becomes apparent that the system consistently exhibits higher reliability due to the advantageous load distribution effect. Various failure modes are examined in assessing the existing TA-SP connection, treating each element model as a parallel system. This approach allows the overall system to be conceptualised as a series of parallel systems [44]. The analysis employs rigorous methods to forecast the reliability index, assigning each element its potential failure mode within the i-th element of the system. Ultimately, the weakest link in the system determines the connection's overall failure, as illustrated in Figure 15. Such probability of system failure can be expressed by rearranging Equation 5.
Where i = 2 and i = 7 elements enclose the relationships among the union of the weakest link events. A typical chain series system describing the clockwise rotational mechanism under tension, compression, and combined actions is illustrated in Figure 15.
Likewise, the performance function of the series system can be transformed into the inverse standard normal distribution function. This allows for determining the system reliability index concerning the clockwise rotational mechanism of the TA-SP connection, emphasising the influence of the weakest elements in the chain series system.
A comparison of the system failure probabilities and the percentile errors is summarised in the following Table 5.
8.0. Target Reliability Index Considerations
The reliability-based approach ensures that structures meet a certain level of reliability, exceeding desired target levels through operational design procedures. Establishing standardised procedures for existing steel members, equivalent to new ones, presents challenges but offers the benefits of a reliable framework with built-in margins. Various works explore appropriate target reliability levels, as seen in ISO 13822 [16], ISO 2394 [17], and JCSS [18], where the consequence of failure determines the target reliability index. Progress in standardisation builds upon a substantial foundation of literature and research, including influential papers by Allen [45] and Ellingwood [25].
Nevertheless, recent investigations such as Holicky and Sykora [30], Vrouwenvelder and Vrouwenvelder [46], Tanner et al. [47], Steenbergen et al. [48], Sýkora et al. [49] have significantly contributed to the standards. Their collective work is crucial in shaping and improving the standards and guidelines within the practice or field.
ISO 2394 [17] states that the requirements for assessing existing structures are the same as those for designing a new structure. However, a lower target reliability index may be justified for existing structures based on economic, social, and sustainable factors (ISO 13822, Annex F [50]). For lower failure consequences, the target reliability index is 2.3. Moderate failure consequences range from 3.1 to 3.8, while higher failure consequences require a target reliability index of 4.3 [17].
FEMA performance assessment guidelines capture a more elaborate literature review [51] and offer detailed insights, suggesting a failure probability of less than 5% to avoid severe damage, signifying a hazard that encounters a 99.9% failure probability. Melcher et al. [29] repeated a 5% probability of failure, and a 1.75 reliability index is recommended for the existing structural member subjected to earthquake shaking. The most relevant information is effectively embedded in the LRFD specification. This could serve as background input, and the target reliability index ranges from 2.5 to 3.0 [2]. Similarly, JCSS [18] provides the structural performance requirements with single and multiple failure probabilities. Additionally, Fischer et al. propose acceptance criteria of 2.7 to 3.0 for ductile failure members and 2.8 to 3.4 for brittle failure, considering life safety consequences [52].
The comparison of the present study outlined in Table 5 highlighted the significance of adhering to the proper reliability index level. It highlights the alignment with the lower reliability index implied by the acceptance criteria. The consecutive steps of the lower target reliability index range from 2.3 to 2.5, corresponding to the consequences of failure, operational lifetime, and the cost of safety measures [2,17,18]. However, these guidelines indicate an acceptable reliability index (βa) lower than the design values for the single-element reliability index (see Table 5), emphasising the relative contributions of plastic and ductile failure mechanisms.
9.0. Conclusion
The article introduces a vital breakthrough in research and structural engineering practice. It proposes new techniques for evaluating the system reliability of existing TA-SP connections, which show significant advances. These methods align with the limit state approaches for designing new semi-rigid connection models. Providing a comparative study of the TA-SP connection behaviours to the revised equations proposed by Kishi and Chen [5] also demonstrated the efficacy of the initial stiffness, ultimate moment capacity, and stiffness degradation of the existing TA-SP connection.
The study extended its scope for assessing the nonlinear finite element (F.E.) analysis of the moment-rotation relationship behaviours, implying the connection performance and consistency of the three-parameter power model.
Further to the finite element analysis, a new closed-chain series system method has been introduced, incorporating a rule-based process to account for uncertainties in material properties, geometric properties, and models to ensure safety. This new process involves evaluating the linear approximation of the limit state function, followed by second-order second-moment approximations to obtain the nonlinear limit state at the performance surface [21]. This involves delving into the failure probability of the weakest link elements in the connection system, employing advanced assessment methods that yield more refined verification and include rigorous reliability and system reliability-based analysis. A comparison between the First Order Reliability Method (FORM) and the Second Order Reliability Method (SORM) was conducted, revealing their disparities in the approximations. The percentile error was used to measure their differences based on 10,000 sample tests of the Monte Carlo Simulation reference (MCS) [22], confirming compliance and adhering to ISO 13822 [16], ISO 2394 [17], and JCSS [18], standards was paramount to meet the target reliability index.
In conclusion, the study lays the groundwork for integrating technical specifications into the next version of the semi-rigid connection assessment framework. By leveraging harmonised relationships among semi-rigid connection counterparts, the proposed methods offer an opportunity to introduce new assessment methods into the standard that present two distinct perspectives: one proposing an alternative methodology for advanced assessment analysis verified against AN-SI/AISC 360-10 [35], Eurocode 3 Part 1-8 [3], and the other one is introduced in a more operational analysis to standardise the existing connection system reliability index. Both perspectives yield significant results, offering practical applications for experts, specialists, engineers, and researchers engaged in high-reliability verification of aging buildings. Therefore, the methodologies introduced are custom-made to meet the demands of professionals seeking meticulous assessment frameworks in the field.
Notation
The following symbols are used in this paper:
= 0.6 or 0.8 fillet weld category
= inverse cumulative distribution of the standard function
=union operator in set
= set intersection operator between two sets
= proportional load factor (PLF)
= standard devotion
= mean value
= eigenvalue function scale
= reliability index
= direction cosine at the minimum distance point
= Weld throat length and height
= second derivative limit state function at the design point
= top angle width
= weld section width
= decomposed diagonalised matrix
= distance at the centre of rotation
= distance at the centre of rotation
= second derivative performance function
= event failure in an i-th mode
En = failure state of the weakest link element
= Elastic Modulus
Fi = shear force function in i-th element
= probability density function of stochastic variables
= the cumulative distribution function of the strength
= yield stress
fu = yield strength
= yield stress of the weld section
= gauge length
g = limit state function,
h = height
i = the failure event of the i-th element, (i = 1, 2, ... n)
= reduction factor 1.0 for all connection
= moment at the centre of the weald section
= ultimate moment capacity of the connection
n = shape parameter of the connection
= probability of failure
= design point at the limit state surface
Ri = mean value of the plastic moment capacity
R'i = reduced resistance element random variables
Rki = initial stiffness of the TA-SP connection
= design point at the limit state surface
= mean value of the applied moment for the i-th element
S'i = reduced applied moment random variables
= seat-pad weld throat depth
= top angle thickness
= applied compressive force
= applied tensile force
= applied moment to weld section
= applied monent to x direction
= applied moment to y direction
= Nominal capacity of fillet weld
= applied moment to z-direction
w = width
= Fillet weld
= vector distance point from the origin space
X = vector of stochastic variables
, = applied force to the i-th element
= reduced random variable for i-th element
= tensile force distribution among the elements
= resistance element for i-th element
= transformation of a random variable to standard variables
= Gaussian distribution comprising the chain rules
Zx = Modulus of section
= Modulus of weld section-
Acknowledgments
The authors thank the esteemed technical staff of the University of Royal Melbourne Institute of Technology (RMIT) for their cooperation and support in this study. Financial support provided by the Commonwealth Support Place (CSP), Government Operation Grant (GPG), and RTP for conducting this investigation is invaluable, and the authors remain grateful.
References
- Cross, H. Analysis of Continuous Frames By Distributing Fixed-End Moments. Trans. Am. Soc. Civ. Eng. 1932, 96, 1–10. [Google Scholar] [CrossRef]
- American Institute of Steel Construction AISC "Manual of steel construction," load and resistance factor design-LRFD, Second ed, AISC, 1994, Chicago IL, U.S.
- EN 1993 Eurocode 3: "Design of steel structures part 1– 1: general building rules," 2005.
- Richard, R.M.; Abbott, B.J. Versatile Elastic-Plastic Stress-Strain Formula. J. Eng. Mech. Div. 1975, 101, 511–515. [Google Scholar] [CrossRef]
- N. Kishi, & W. F. Chen, "Moment-rotation relations of semi-rigid connections with angles", Journal of Structure Engineering, (ASCE), 1987, Vol. 116, no. 7, pp. 1813-1834. [CrossRef]
- Colson, & J.M. Louveau, "Connections Incidence on the Inelastic Behaviour of Steel Structural", Euromech Colloquium, 174, 1983.
- et al. , "Cyclic characteristics of bolted semi-rigid steel beam to column connections."PhD thesis.," Dept. Civ. Engrg., Univ. of South Carolina, Columbia, SC., 1985.
- R. Bjorhovde, A. R. Bjorhovde, A. Colson, & J. Brozzetti, "Classification system for beam-to-column connections," Journal of Structural Engineering, (AISC), 1990, Vol. 116, no. 11, pp. 3059-3076.
- G. Pekcan, J.B. G. Pekcan, J.B. Mander, & S.S. Chen, Experimental & analytical study of low-cycle fatigue behaviour of semi-rigid top and seat angle connections, 1995, NCEER-95-0002.
- Faella, V. Piluso, and G. Rizzano, "Structural Steel Semi-rigid Connections Theory Design, and Software" Engineering, Materials Science, Corpus ID: 107124660, 1999.
- Ahmed, N. Kishi, K.Matsuoka, and M.Komuro, "Nonlinear analysis on prying of top- and seat-angle connections."," Journal of the. Appled. Mechanics., 2001, Vol. 4, no1, pp., 227–236.
- Pirmoz, K. Seyed, A. Mohammadrezapour, E., and D. Saedi, "Moment-rotation behaviour of bolted top-seat angle connections." Journal of Construction Steel Research, (ELSEVIER), 2009, Vol. 65 no.4, pp.973– 984. [CrossRef]
- M.S. Smitha and S. Babu "Behaviour of top and seat angle semi-rigid connections," Journal of the Institution of Engineers (India), - A, 2014, Vol. 94, no. 3, pp. 153–159. [CrossRef]
- Ahmed, A. Prediction of moment–rotation characteristic of top- and seat-angle bolted connection incorporating prying action. Int. J. Adv. Struct. Eng. 2017, 9, 79–93. [Google Scholar] [CrossRef]
- Díaz, C.; Martí, P.; Victoria, M.; Querin, O.M. Review on the modelling of joint behaviour in steel frames. J. Constr. Steel Res. 2011, 67, 741–758. [Google Scholar] [CrossRef]
- ISO 13822, "Bases for design of structures assessment of existing," ISO TC98/SC2, Geneva, Switzerland, 2010.
- ISO 2394, "General principles on structure reliability," 2nd ed, ISO, Geneva, Switzerland, 1998.
- JCSS, "Probabilistic model code," Joint Committee on Structural Safety, Zurich, 2001.
- ABOUCS, CAE user's manuals. Version 6.14,: Hibbitt Karlsson & Sorensen, RI, USA, 2014.
- Cornell, "A probability-based structural code," American Concrete Institute Structural Journal, 1969, Vol. 66 no 12, pp. 974–985.
- Breitung, K. Asymptotic Approximations for Multinormal Integrals. J. Eng. Mech. 1984, 110, 357–366. [Google Scholar] [CrossRef]
- G. Bucher, "Adaptive Sampling an iterative, fast Monte Carlo procedure," Journal of Structural Safety, (ELSEVIER), 1988, Vol. 5, no. 2, pp. 119-126. [CrossRef]
- Freudenthal, "Safety, reliability and structural design," Journal of the Structural Division, (ASCE), 1961, Vol. 87, no 3, pp. 1–16. [CrossRef]
- W. Weibull, "A statistical theory of the strength of the material," Proceeding Royal Sweden. Institute Engineering res, 1939, Vol. 15, pp 1887-1979.
- Ellingwood, B.R. Reliability-based condition assessment and LRFD for existing structures. Struct. Saf. 1996, 18, 67–80. [Google Scholar] [CrossRef]
- J. Fisher, M. J. Fisher, M. Ravindra, and T. Galambos "Load and resistance factor design criteria for connection," Journal of the Structural Division, (ASCE), 1978, Vol. 104, pp. 1427–1441.
- T. Galambos, and M. Ravindra, "Properties of steel for use chapter in LRFD," Journal of the Structural Division,(ASCE), 1968, Vol. 104, no. 9, pp. 1459–1468.
- Kennedy, D.J.L.; Aly, M.G. Limit states design of steel structures—performance factors. Can. J. Civ. Eng. 1980, 7, 45–77. [Google Scholar] [CrossRef]
- R. E. Melchers, Structural reliability analyses and prediction, 1st ed, Chichester: New York: Jonh Wiley & Sons Inc, 2017.
- Sýkora M, Holický M, Marková J, Target reliability levels for assessment of existing structures, culled from M.H. FABER, J. KÖHLER and K. NISHIJIMA, eds. In: Proc. ICASP11, CRC Press/Balkema, pp. 1048-1056, 1-. 4 August.
- Drucker, D.C. The Effect of Shear on the Plastic Bending of Beams. J. Appl. Mech. 1956, 23, 509–514. [Google Scholar] [CrossRef]
- H. Tresca, "Sur l’ecoulement des corps solides soumis a de fortes pressions.," Comptes rendus de l’Académie des Sciences, 1864Vol. 59, pp. 754.
- AS 4100 Australian standard, Steel structures, Australian, 2020.
- R.E. von Mises, Mechanik der festen Körper im plastisch- deformablen Zustand, Corpus ID: 138864271, Materials Science, https://resolver.sub.uni-goettingen.de/purl PPN252457811, 1913.
- ANSI/AISC 360, Specification for Structural Steel Buildings, American Institute of Steel Construction, Chicago, US, 2010.
- MATCAD, MATCAD user's manuals, 2014.
- Halder and, S. Mahadevan, Probability, Reliability and Statistical Methods in Engineering Design, New York: Jonh Wiley & Sons Inc., 2000.
- Ang, A.H.-S.; Tang, W.H. Probability Concepts in Engineering Planning and Design: Basic Principles, Volume 1; John Wiley & Sons: Hoboken, NJ, USA, 1975. [Google Scholar]
- M. Hasofer and N. C. Lind, "An exact and invariant first-order reliability format," Journal of Engineering Mechanics, 1974, Vol. 100, pp. 111–121.
- Rackwitz, R.; Flessler, B. Structural reliability under combined random load sequences. Comput. Struct. 1978, 9, 489–494. [Google Scholar] [CrossRef]
- Rosenblatt, M. Remarks on a Multivariate Transformation. Ann. Math. Stat. 1952, 23, 470–472. [Google Scholar] [CrossRef]
- Bastidas-Arteaga and, A.-H. Soubra, Reliability Analysis Methods, in HAL Id: in2p3-01084369, France, HAL Archives Ouvertes ID: in2p3-01084369, University of Nantes, Ge M Laboratory, UMR CNRS 6183, Nantes, France, 2015.
- J. Zhang and. X. Du, "A second-order reliability method with first-order efficiency," The American Society of Mechanical Engineers, (ASME), 2010, Vol. 132, no. 10, pp 101006 (8 pages).
- P.Thoft-Christensen, and J.Dalsgård Sørensen "Reliability of structural systems with correlated elements," Journal of Applied Mathematical Modelling- (ELSEVIER), 1982, Vol. 6, pp. 171-178.
- Allen, D.E. Limit states criteria for structural evaluation of existing buildings. Can. J. Civ. Eng. 1991, 18, 995–1004. [Google Scholar] [CrossRef]
- T. Vrouwenvelder and N. Scholten," Assessment criteria for existing structures," Journal of Structural Engineering International, (IABSE), 2010, Vol. 20, no. 1, pp. 62–65.
- P. Tanner and C. L. Sarache, "Semi-probabilistic models for the assessment of existing concrete structures," in 11th International Conference on Applications of Statistics and Probability in Civil Engineering, Zurich, Switzerland, 1–4 August.
- Steenbergen, R.D.J.M.; Sýkora, M.; Diamantidis, D.; Holický, M.; Vrouwenvelder, T. Economic and human safety reliability levels for existing structures. Struct. Concr. 2015, 16, 323–332. [Google Scholar] [CrossRef]
- ISO, International Organisation for Standardisation/ South African National Standard, 2016a. ISO13822: 2010/SANS 13822:2016. Bases for Design of Structures. Assessment of Existing Structures. Geneva, Switzerland: ISO, 2016.
- Sykora, M.; Diamantidis, D.; Holicky, M.; Jung, K. Target reliability for existing structures considering economic and societal aspects. Struct. Infrastruct. Eng. 2016, 13, 181–194. [Google Scholar] [CrossRef]
- Federal Emergency Management Agency (FEMA), "Interim Guidelines Evaluation, Repair, Modification and Design of Welded Steel Moment Frame," Report (SAC Joint Venture), no. SAC-95-02, Washington, D.C, 1995.
- Fischer, K.; Viljoen, C.; Köhler, J.; Faber, M.H. Optimal and acceptable reliabilities for structural design. Struct. Saf. 2018, 76, 149–161. [Google Scholar] [CrossRef]
Figure 1.
Flowchart for the proposed investigation methods.
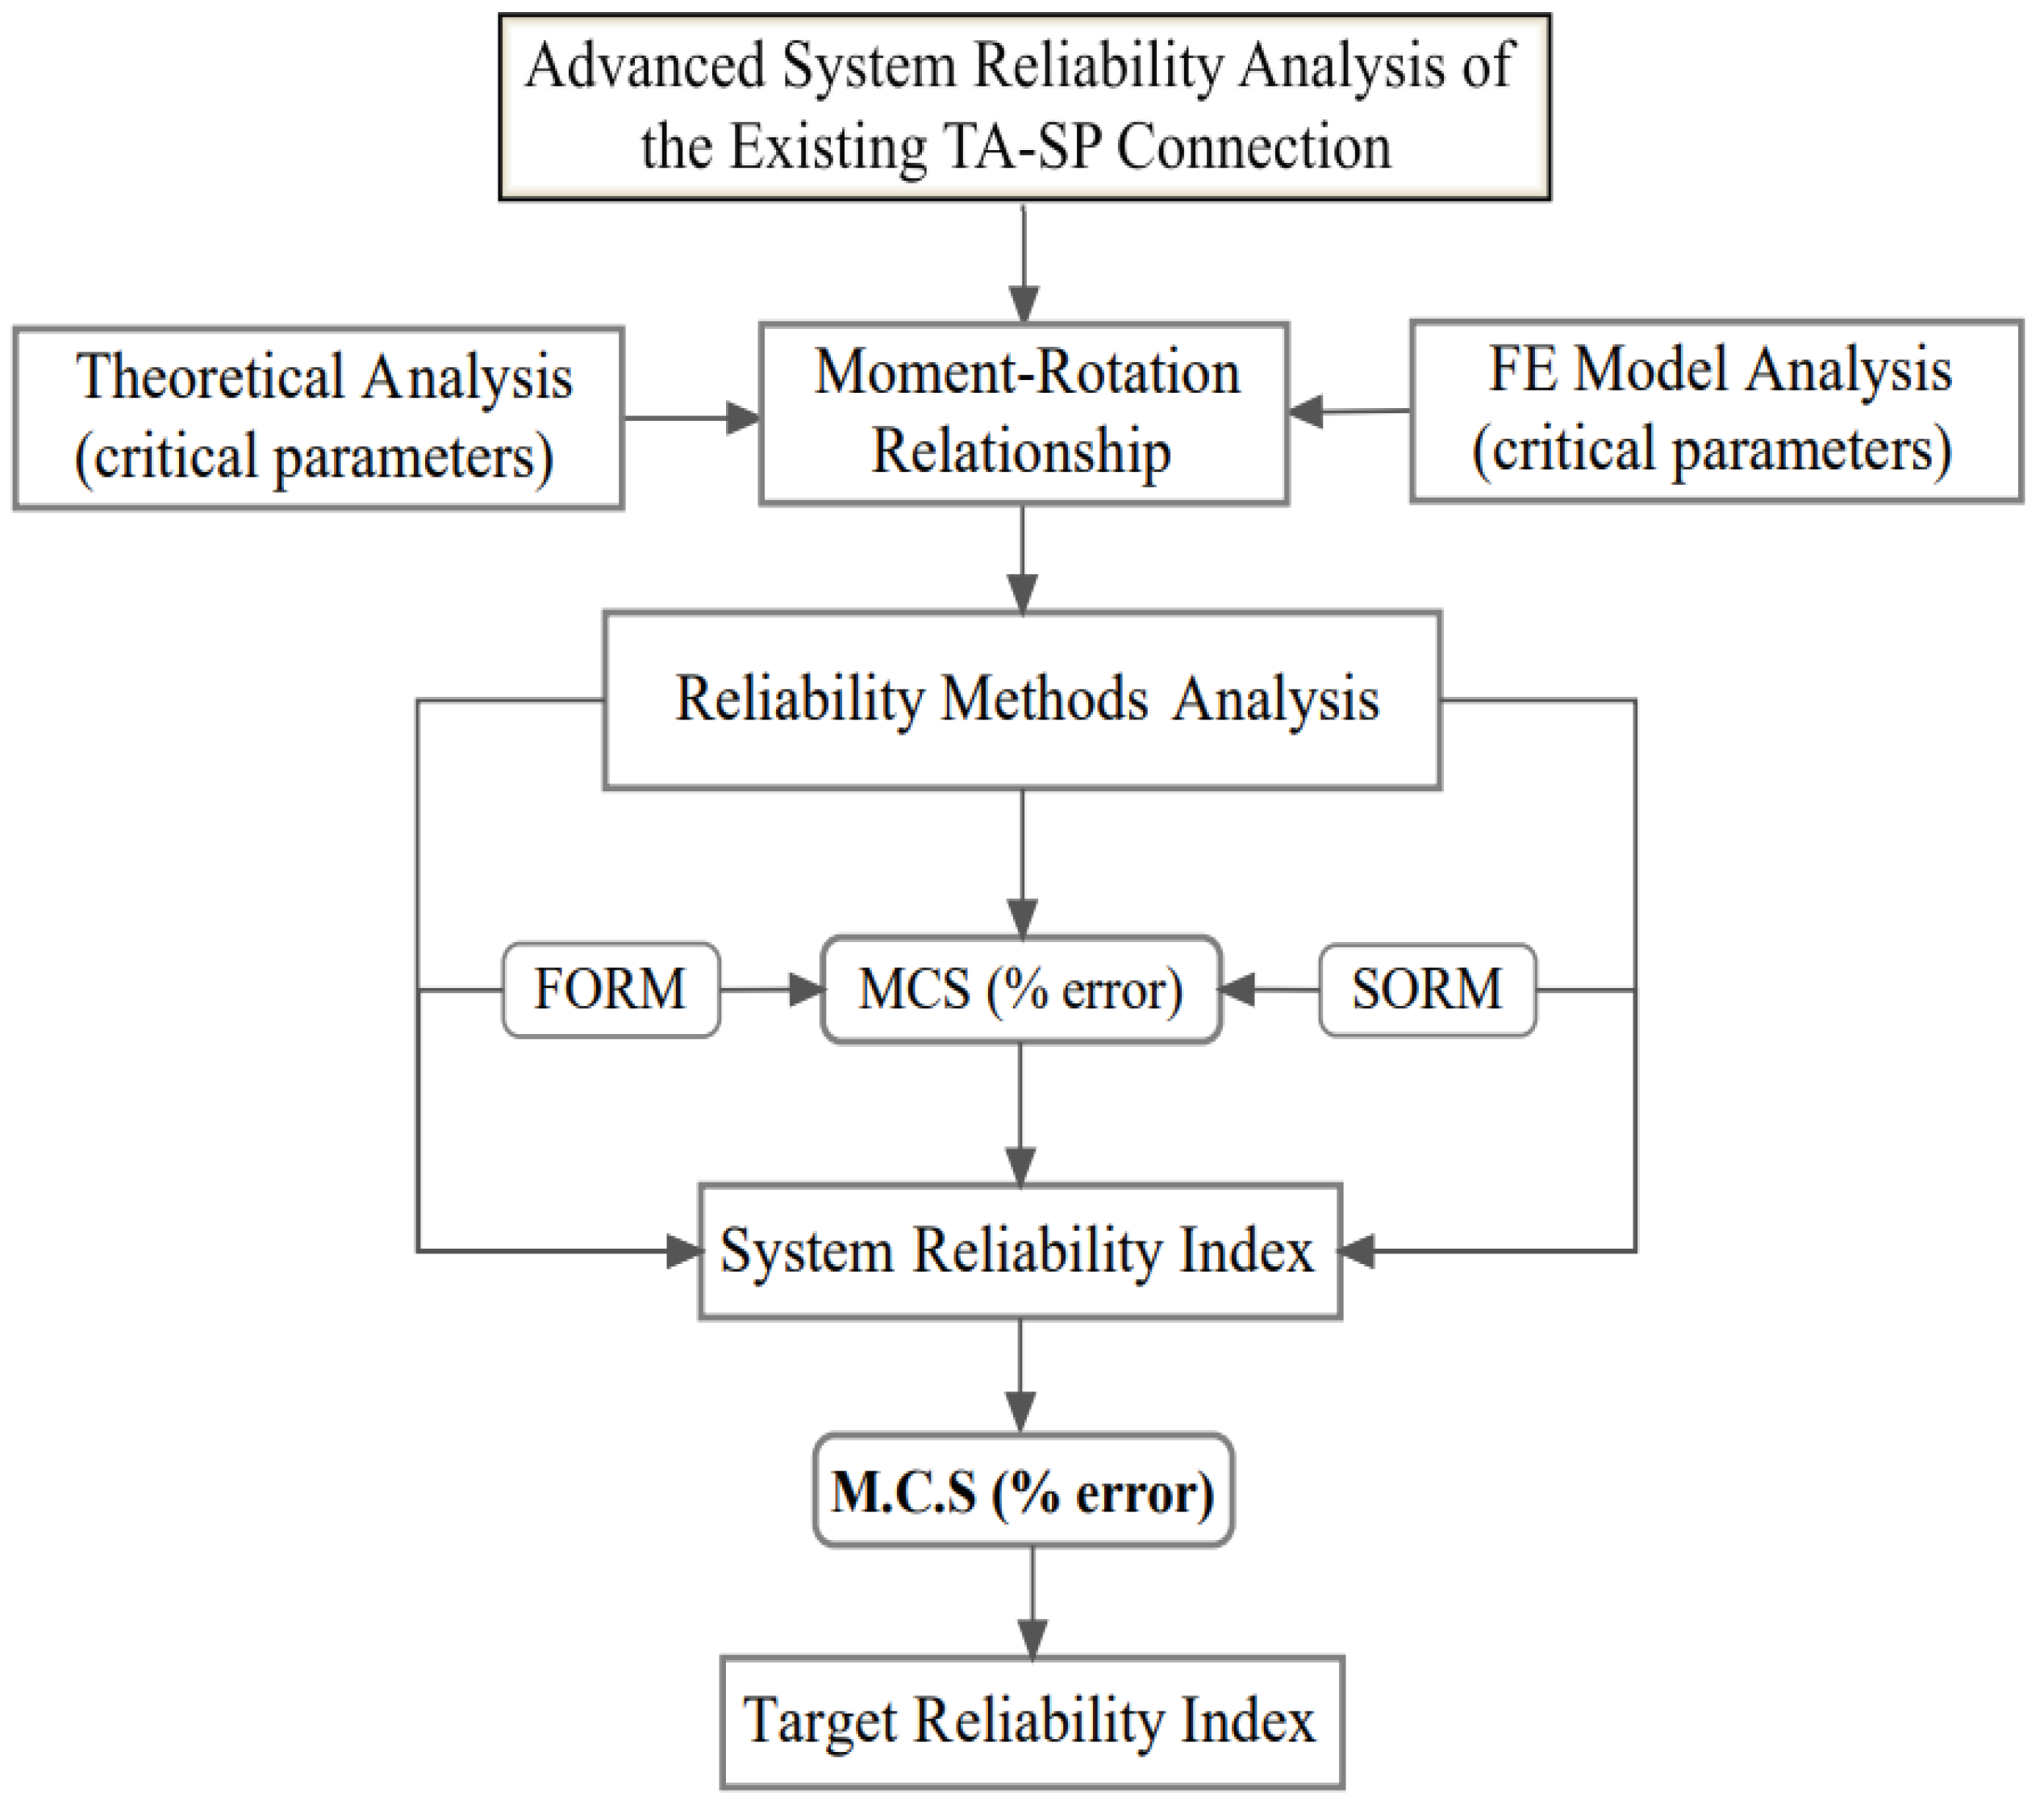
Figure 2.
Existing TA-SP semi-rigid connection prototype: (a) represents a typical 1920- 1960s semi-rigid connection used in Australian metropoles and (b) describes the TA-SP connection elements.
Figure 2.
Existing TA-SP semi-rigid connection prototype: (a) represents a typical 1920- 1960s semi-rigid connection used in Australian metropoles and (b) describes the TA-SP connection elements.
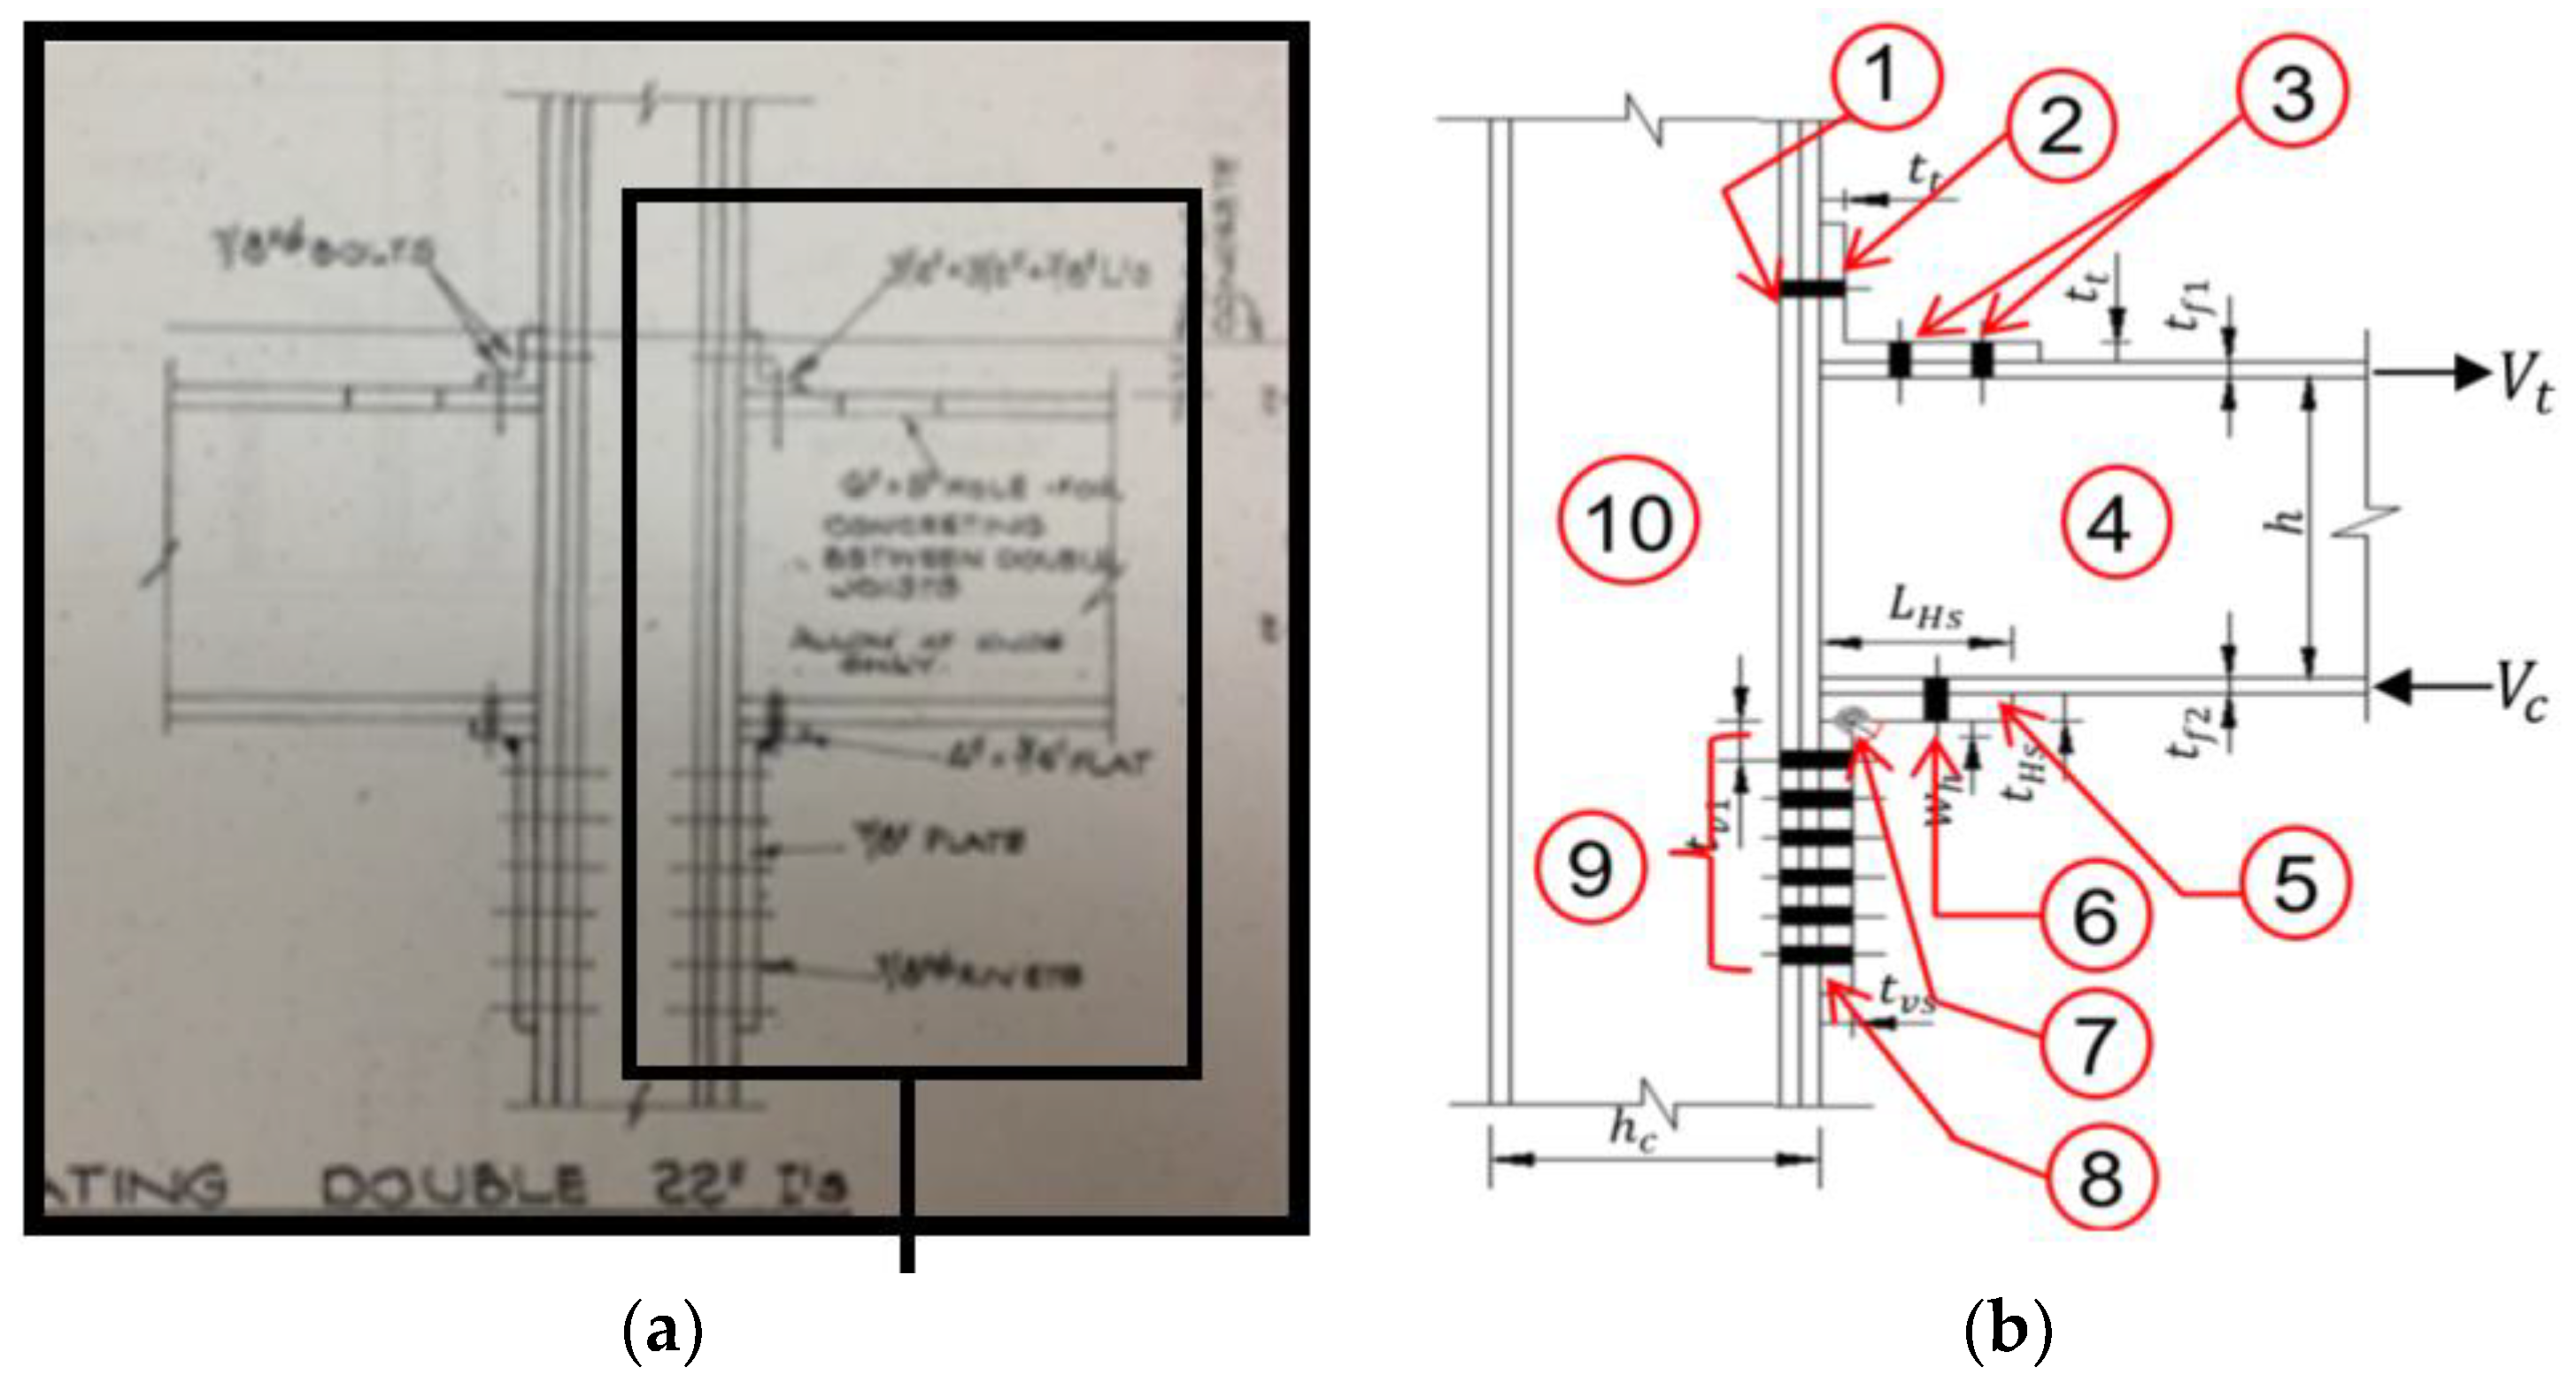
Figure 3.
Locked chain-series system of the existing TA-SP connection.

Figure 4.
a): Locked-chained elements of the TA-SP connection in a series system.
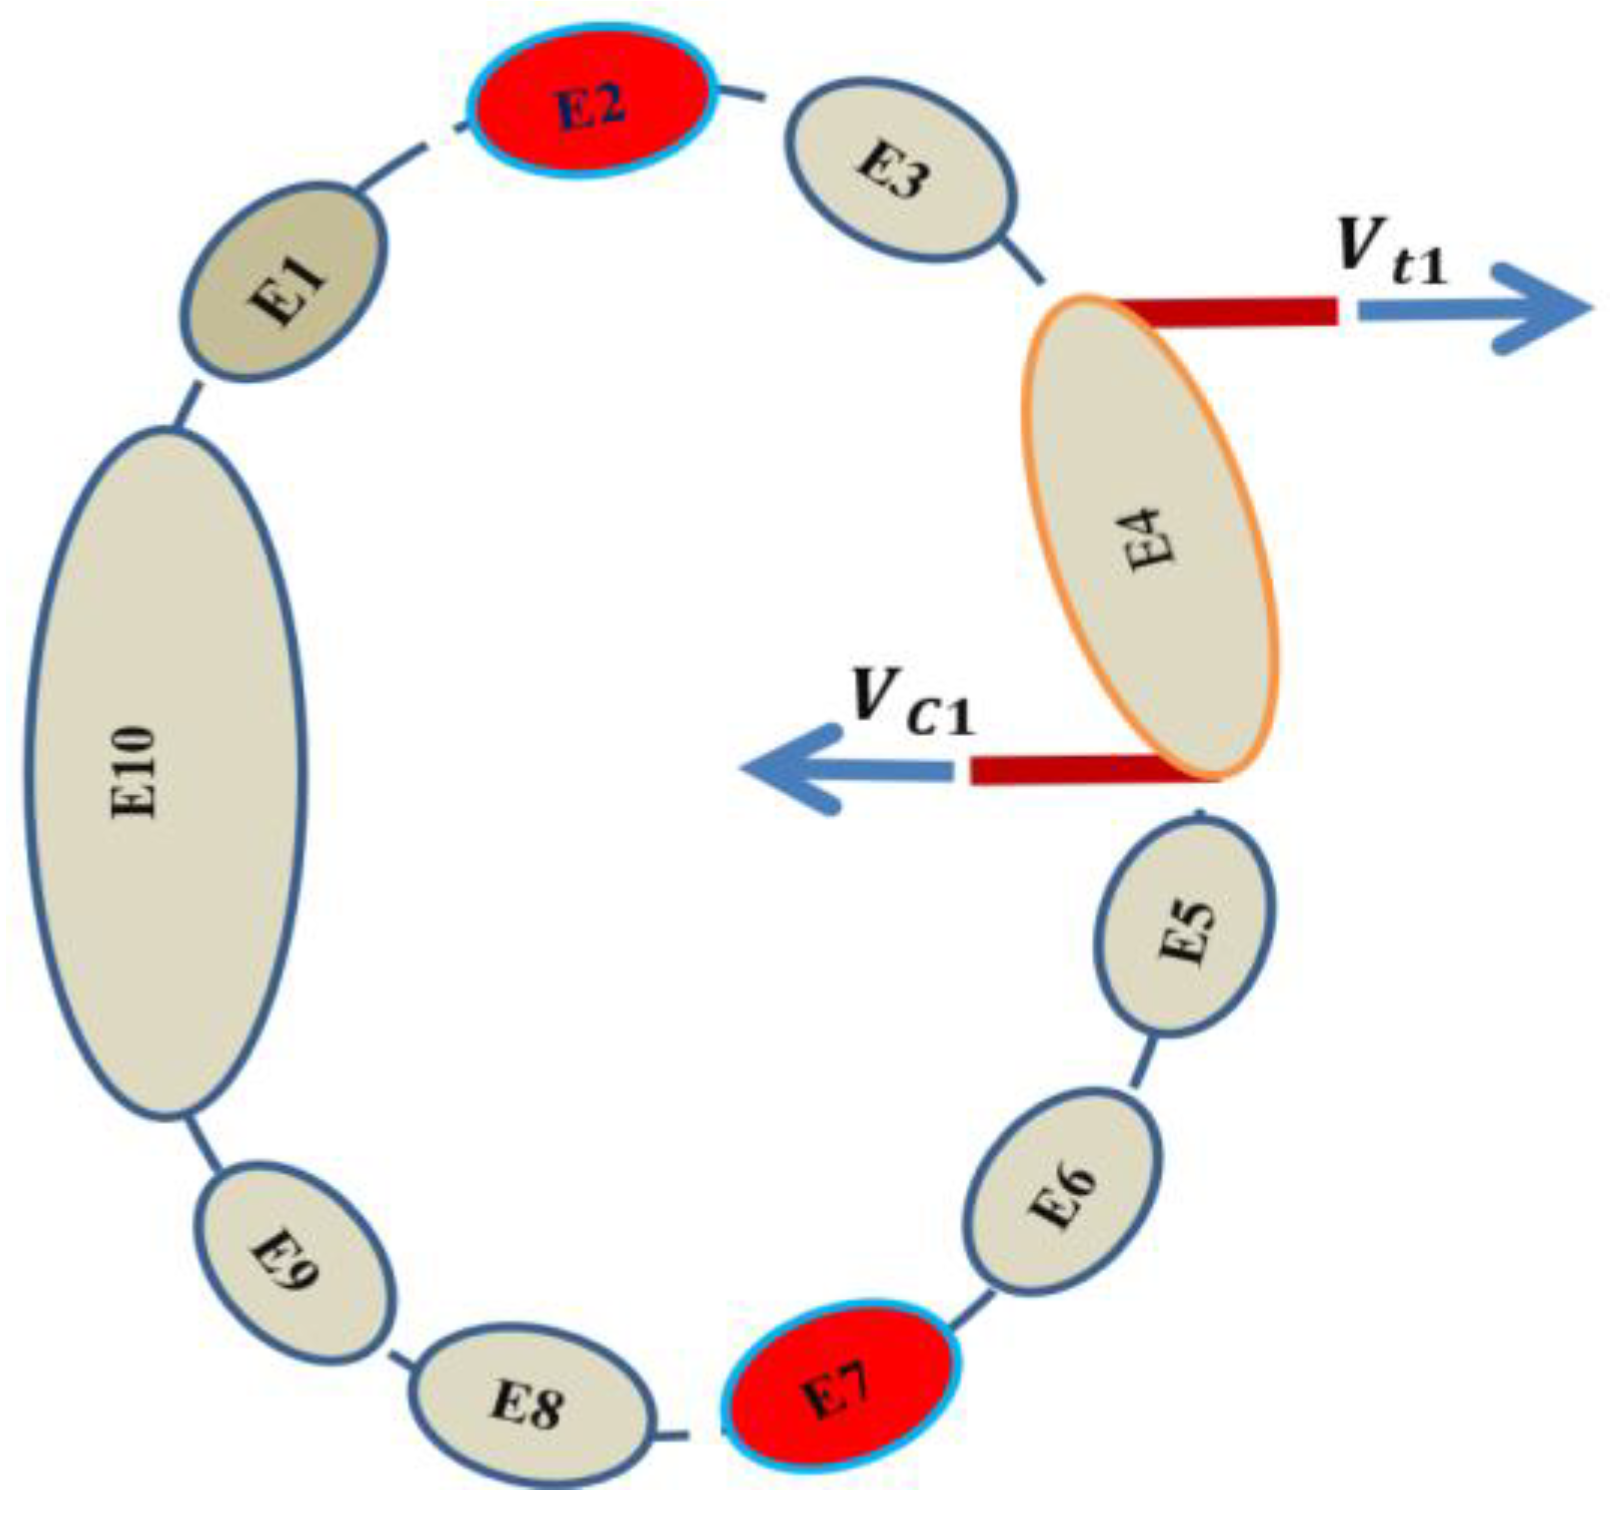
Figure 4.
b): Clockwise rotational failure mechanism in series system configurations.
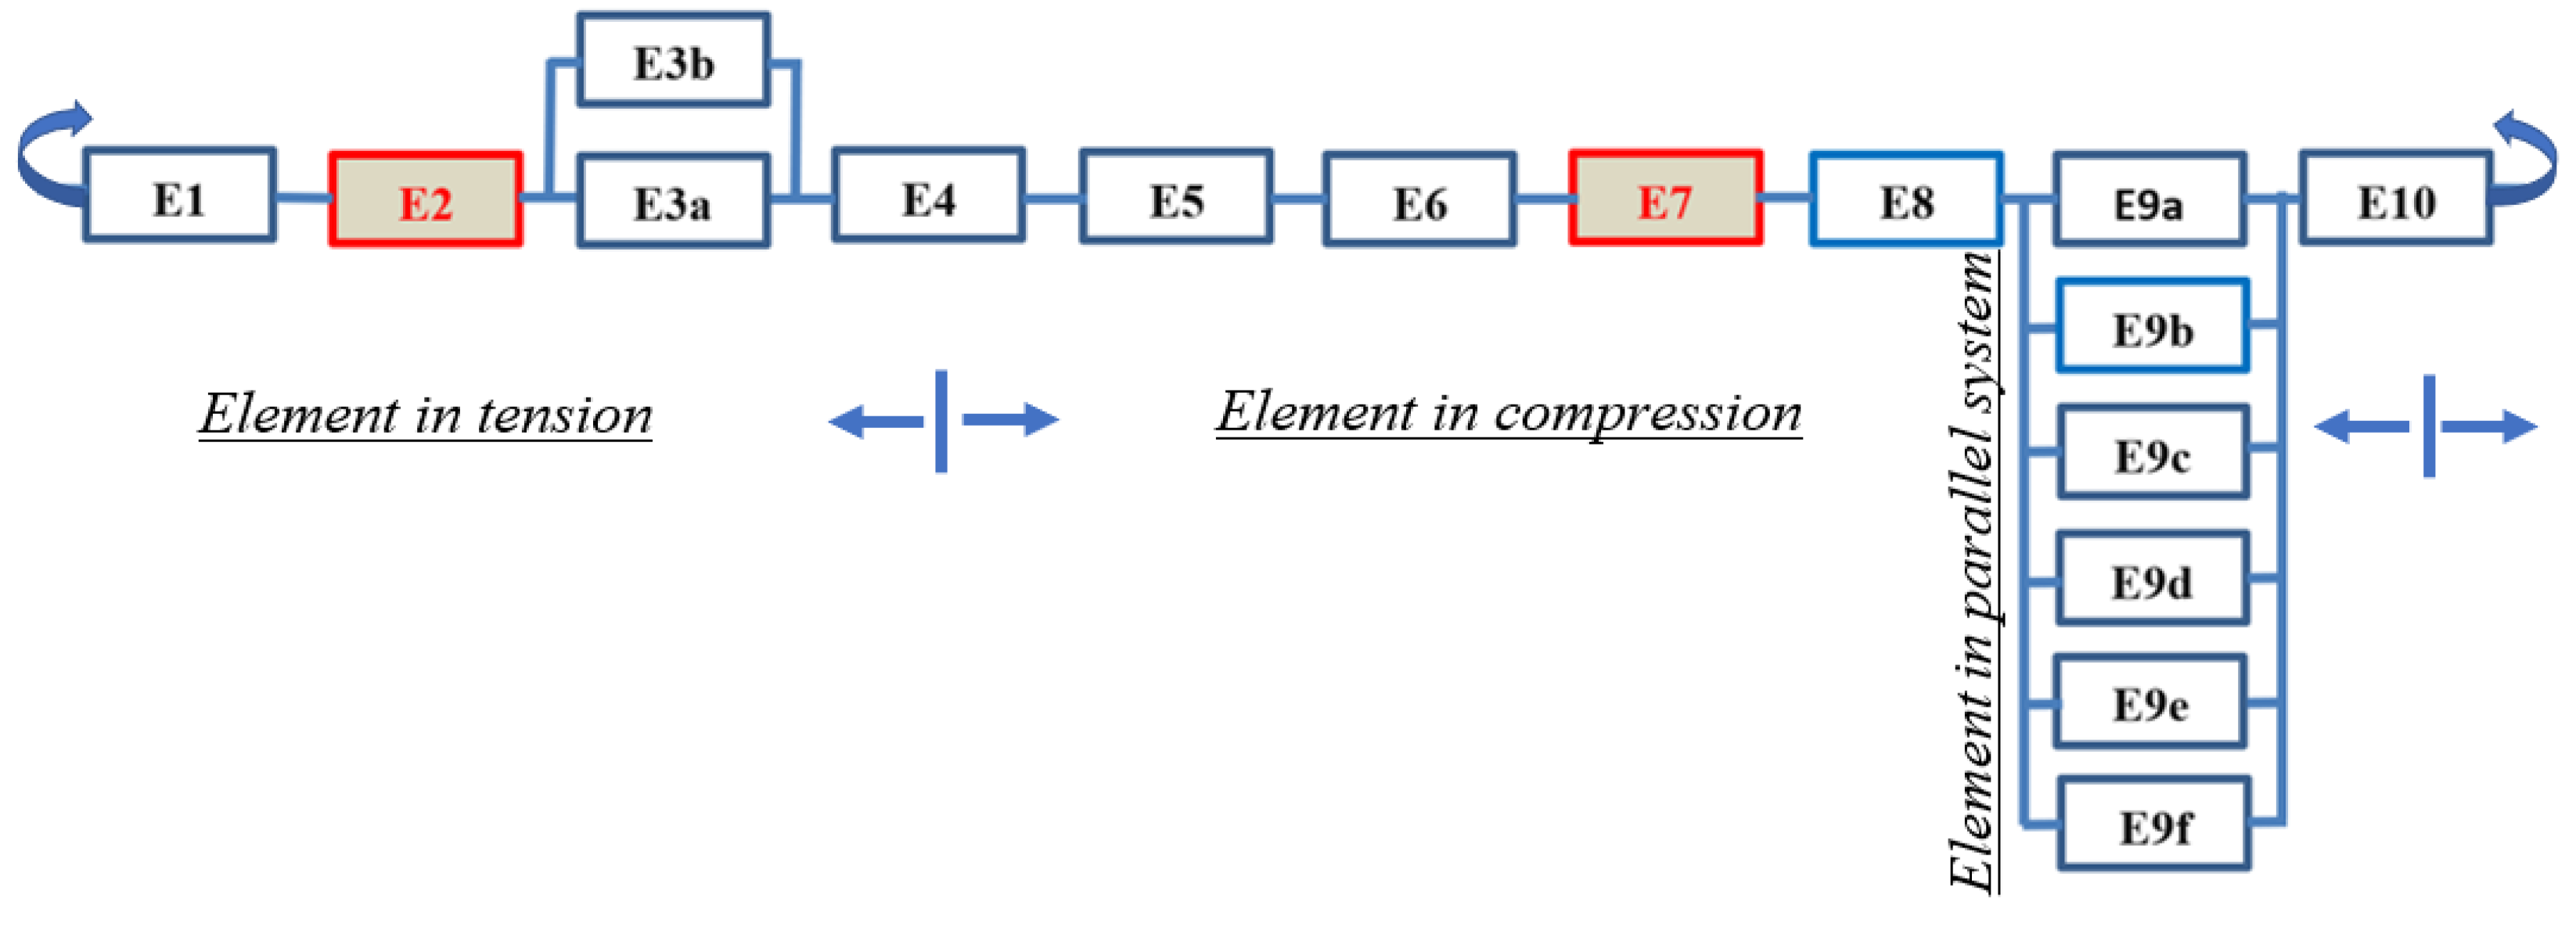
Figure 5.
1920s to 1960s classes TA-SP connection considered in this study prototype.
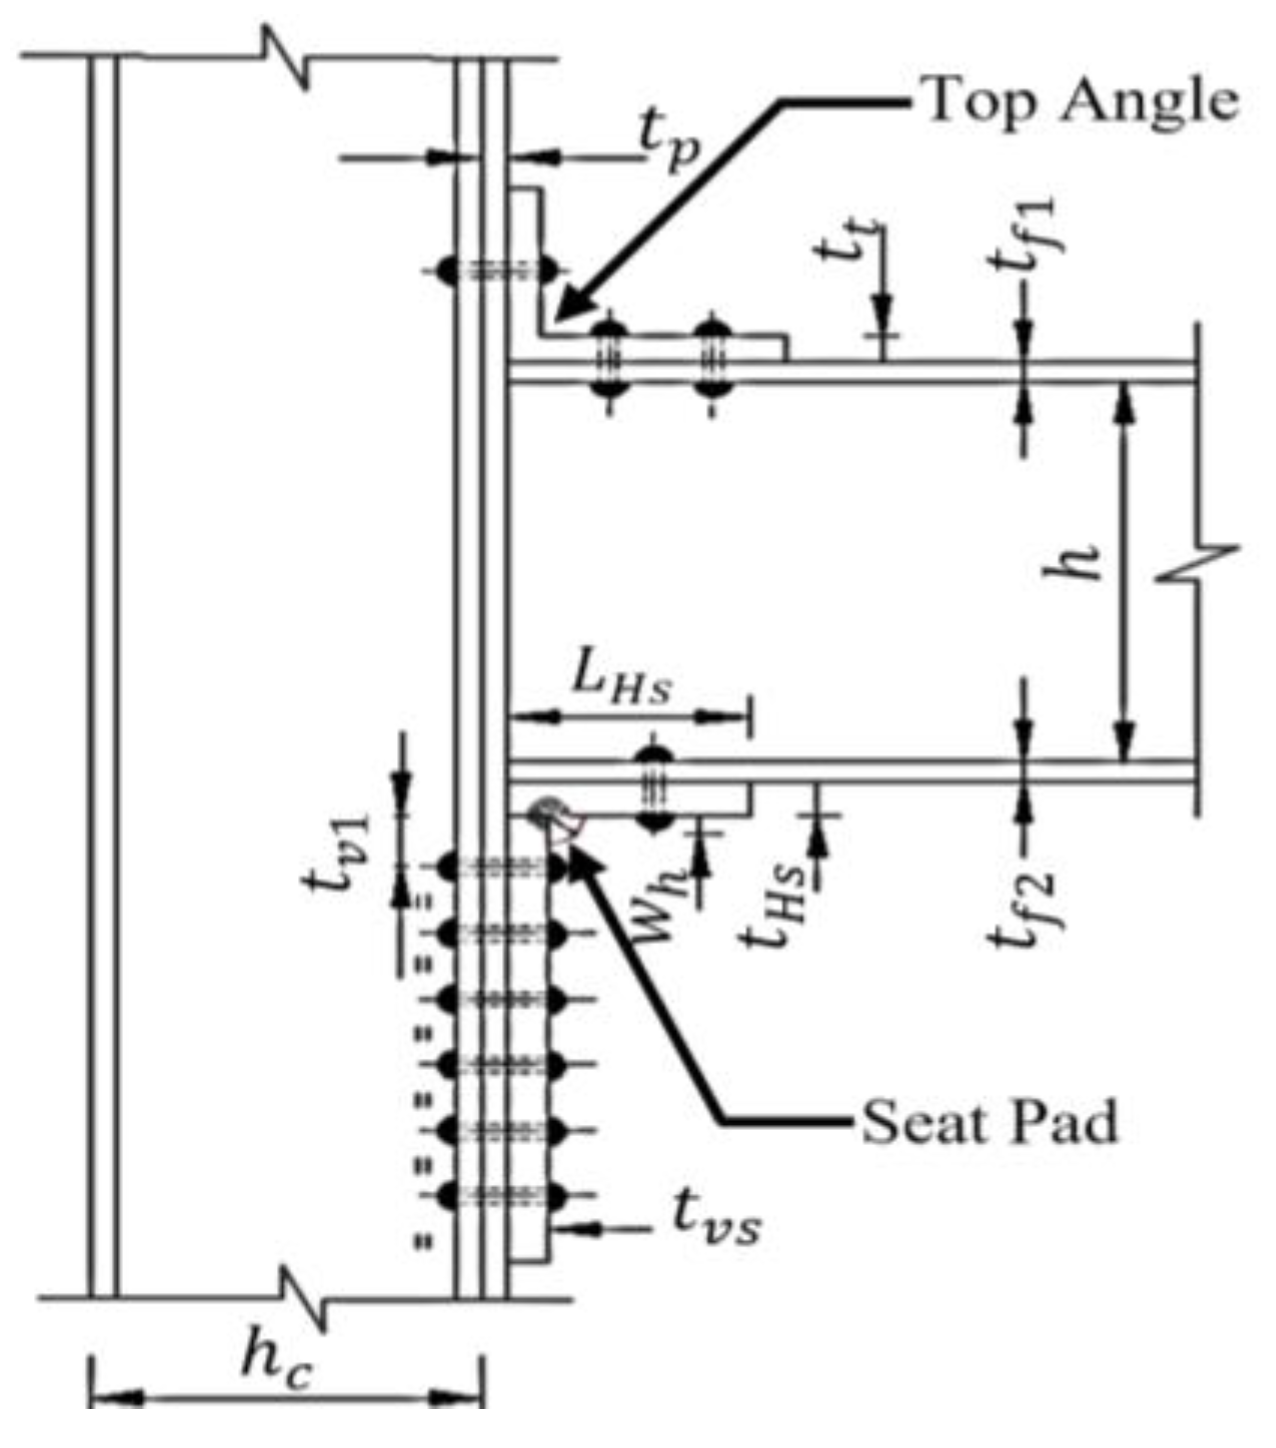
Figure 6.
Failure mechanism of the weakest link elements: (a) represents the Top angle (E2) failure mechanism under tensile force and (b) describes the Seat-Pad weld (E7) failure mechanism behaviours under compressive force.
Figure 6.
Failure mechanism of the weakest link elements: (a) represents the Top angle (E2) failure mechanism under tensile force and (b) describes the Seat-Pad weld (E7) failure mechanism behaviours under compressive force.
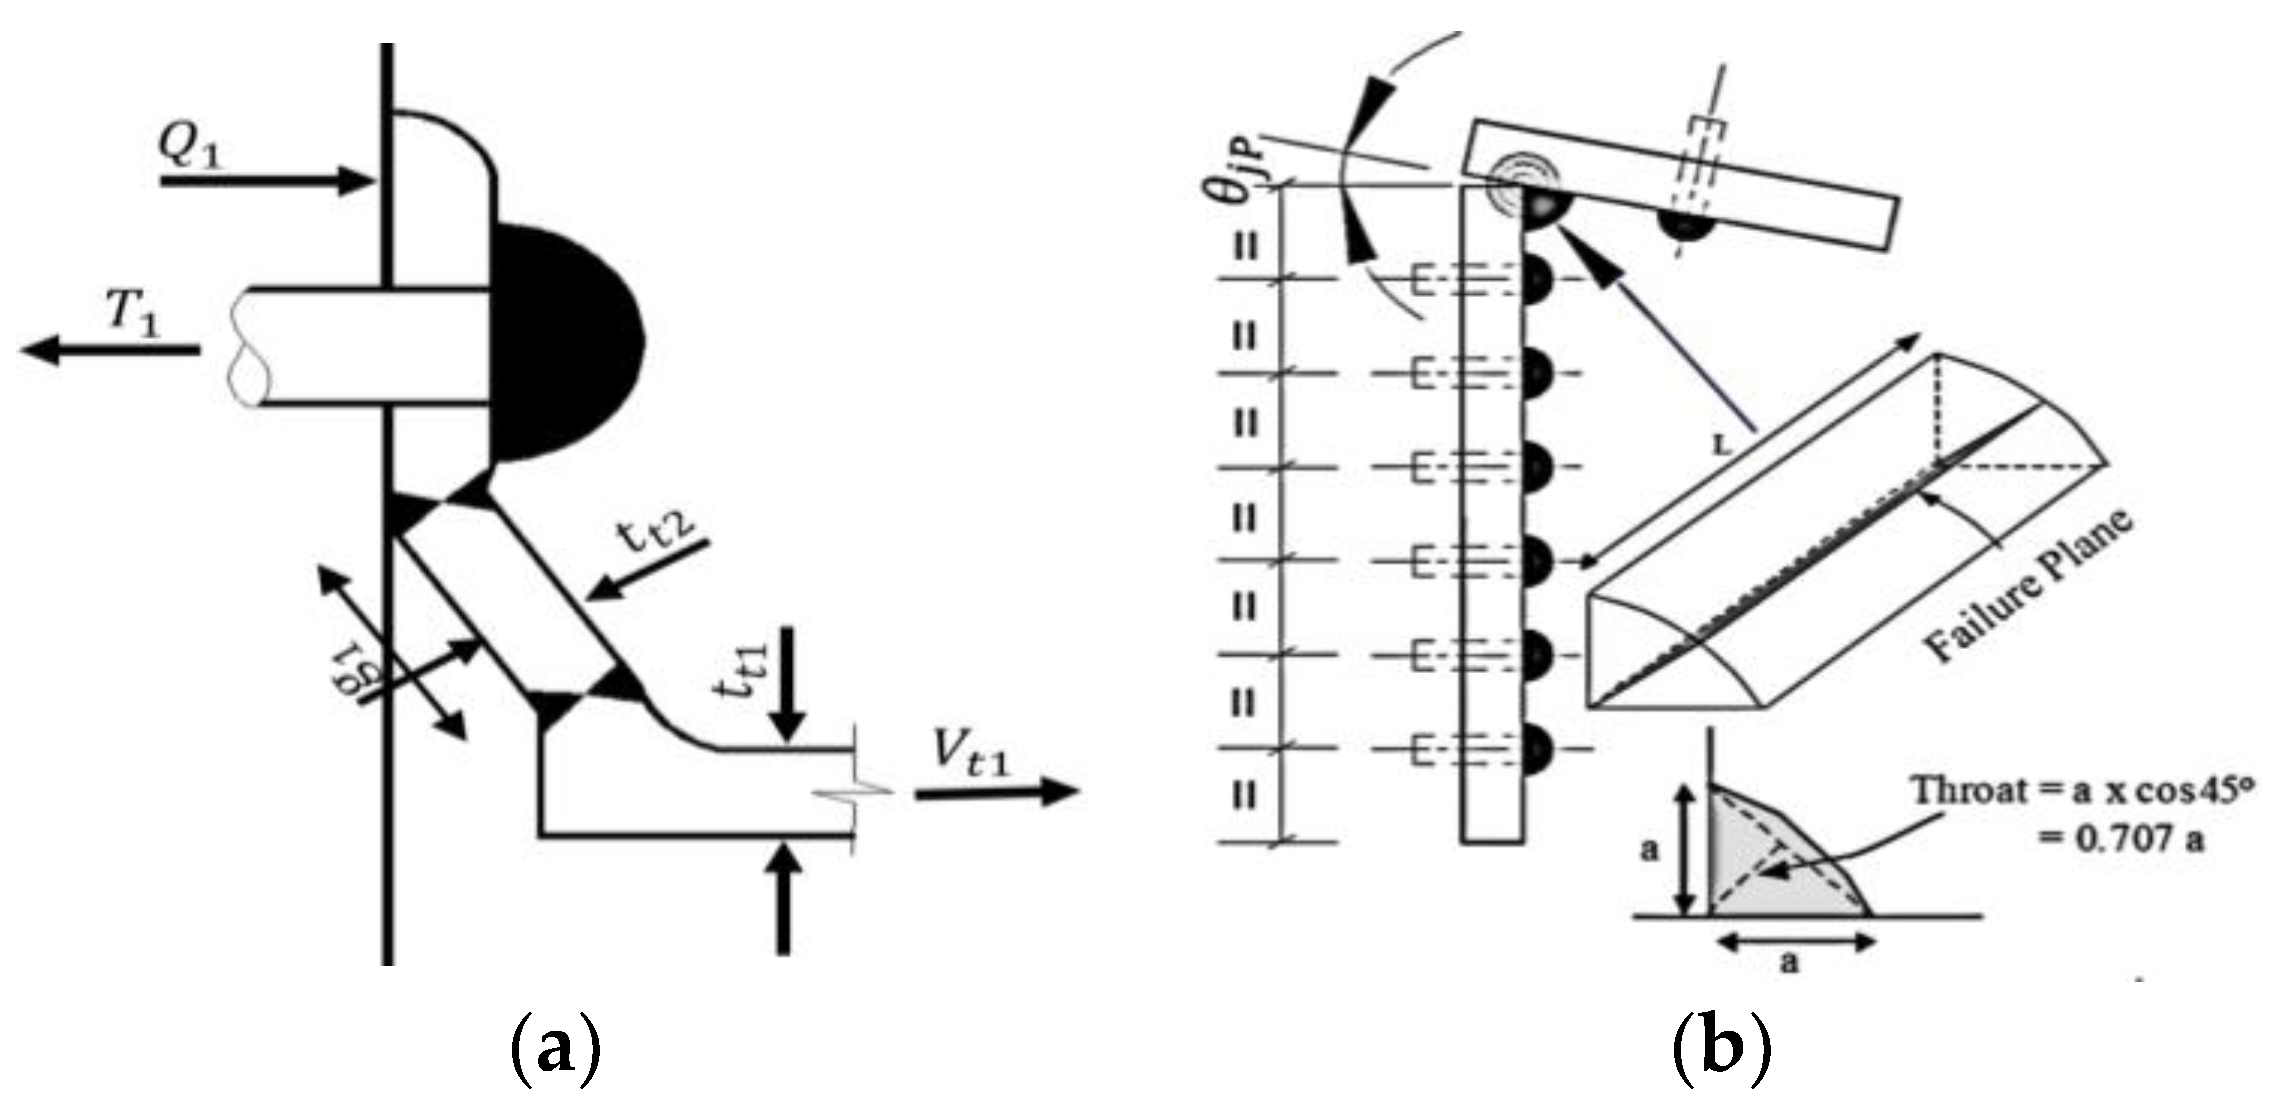
Figure 7.
a): Applied and resisting moment Vs to the gauge length-Element (E2).
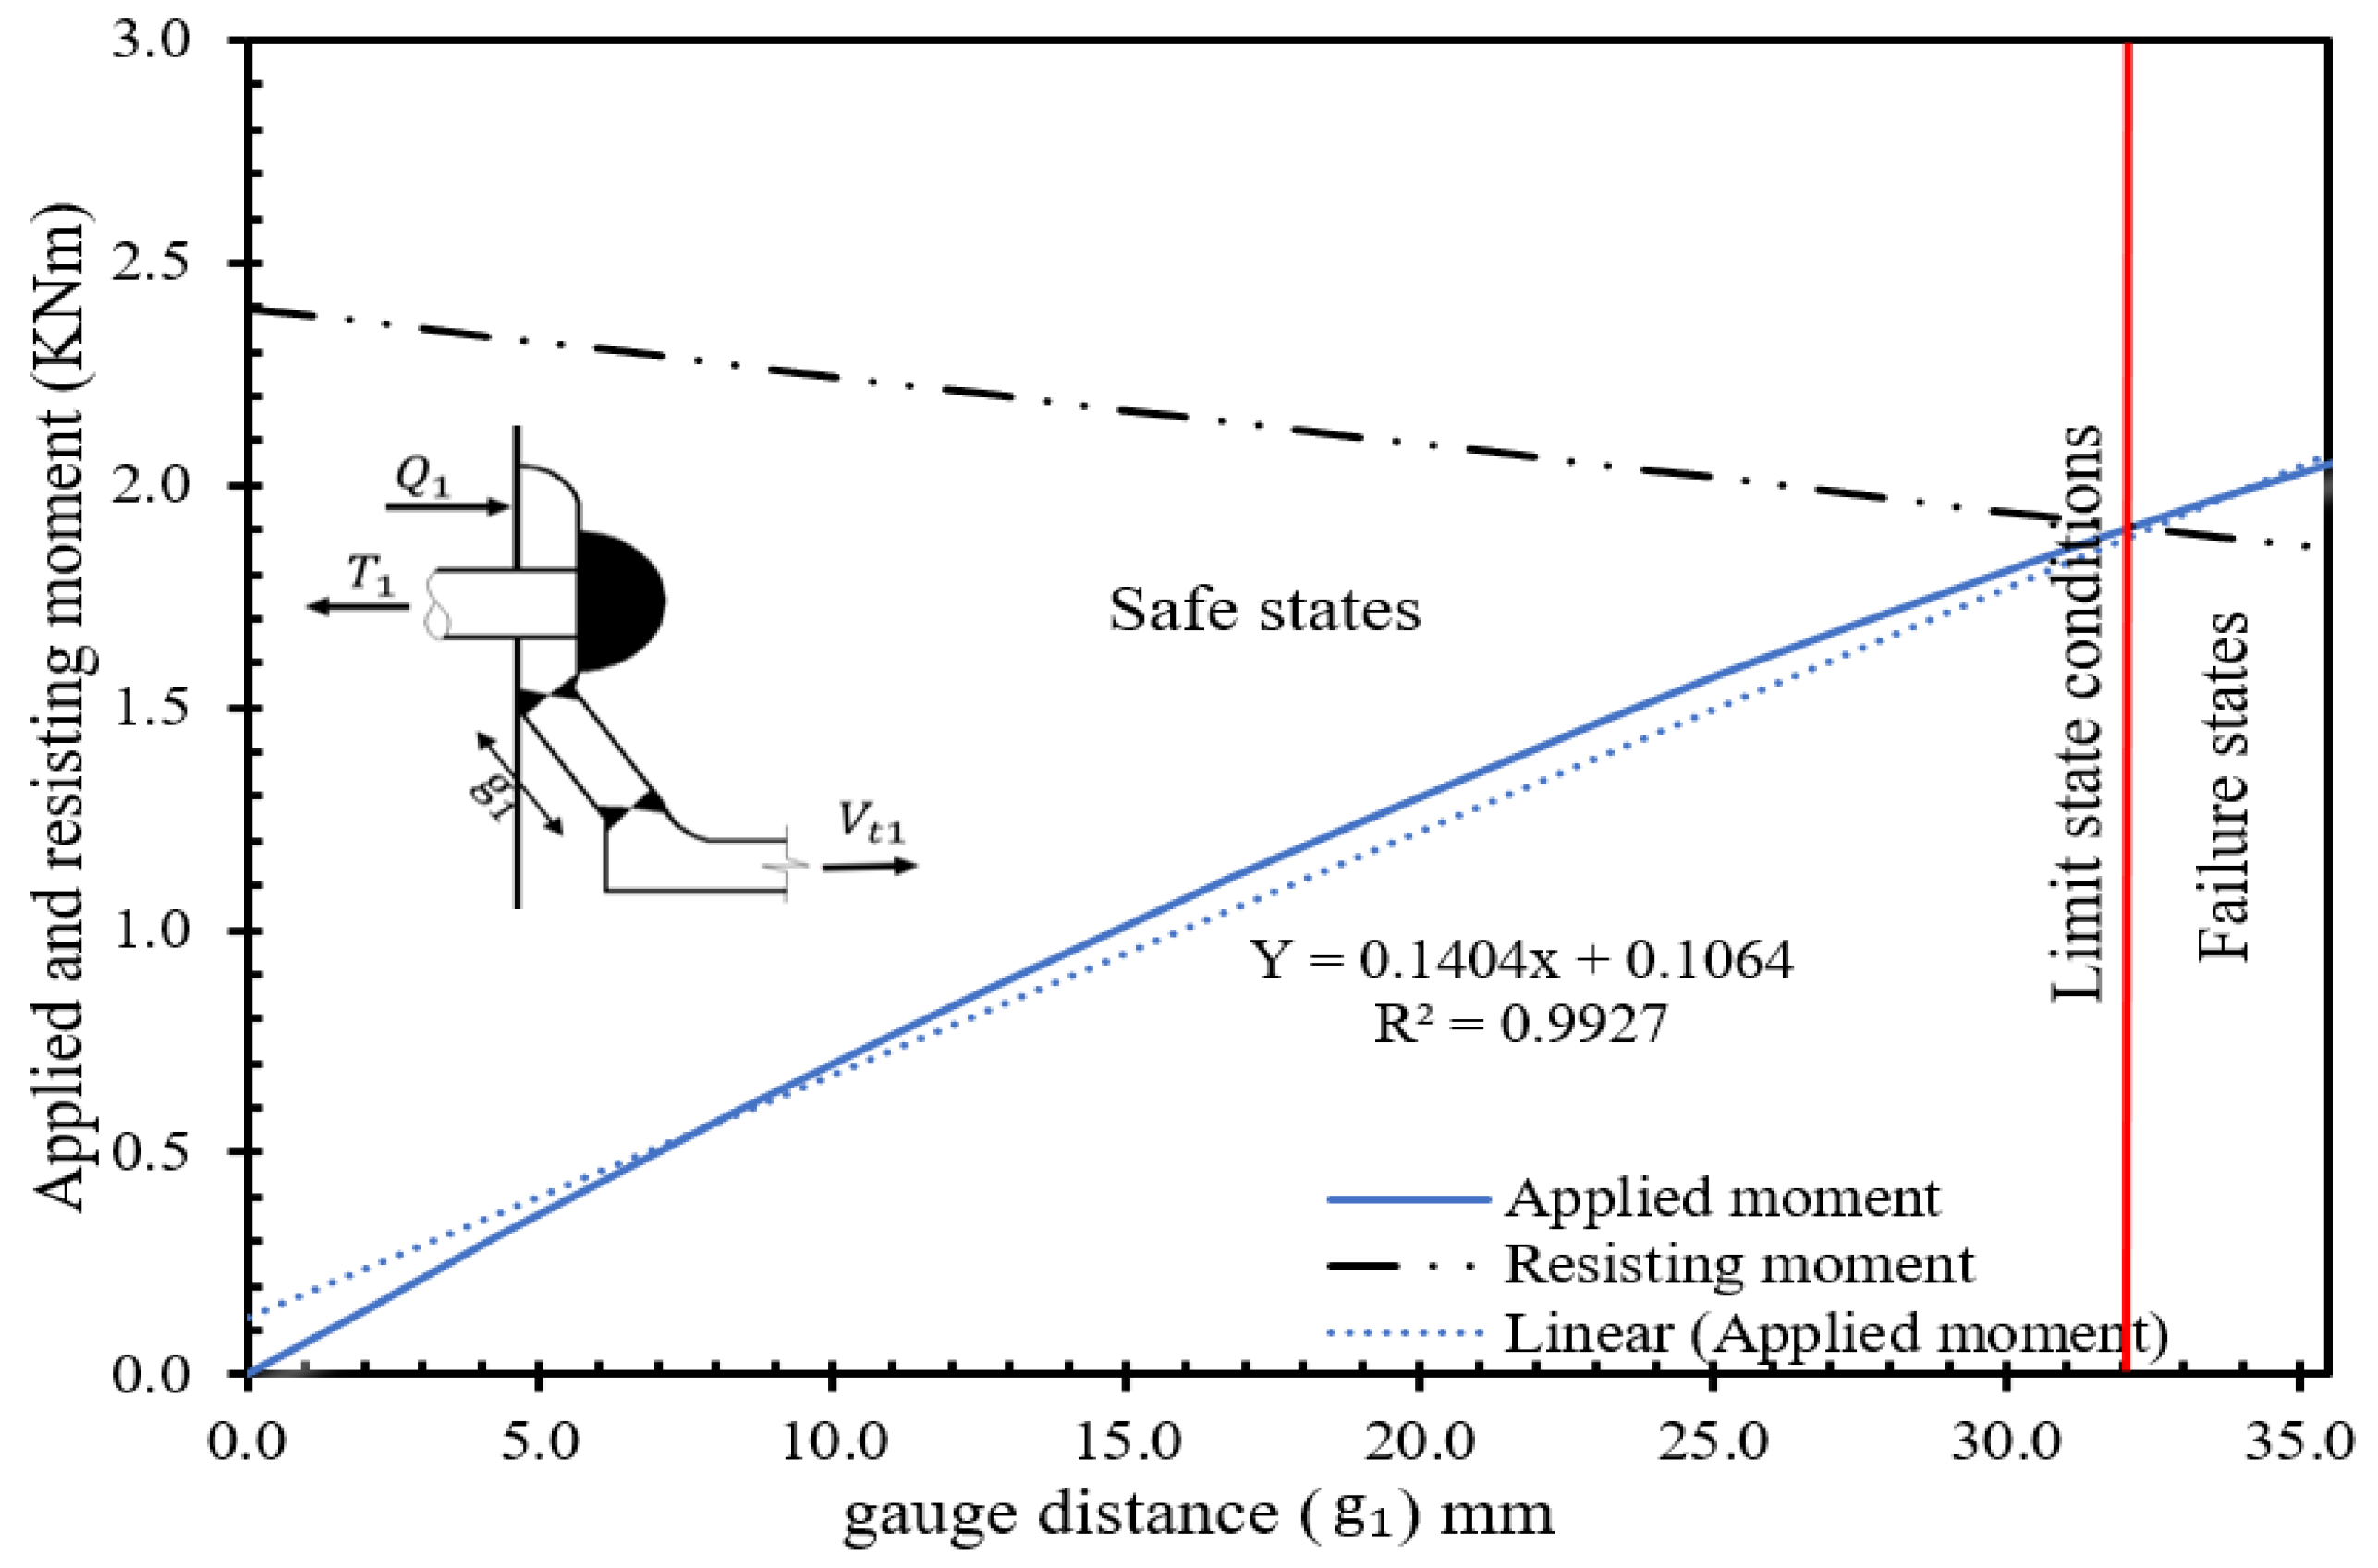
Figure 7.
b): Applied and resisting moment Vs to the gauge length-Element (E7).
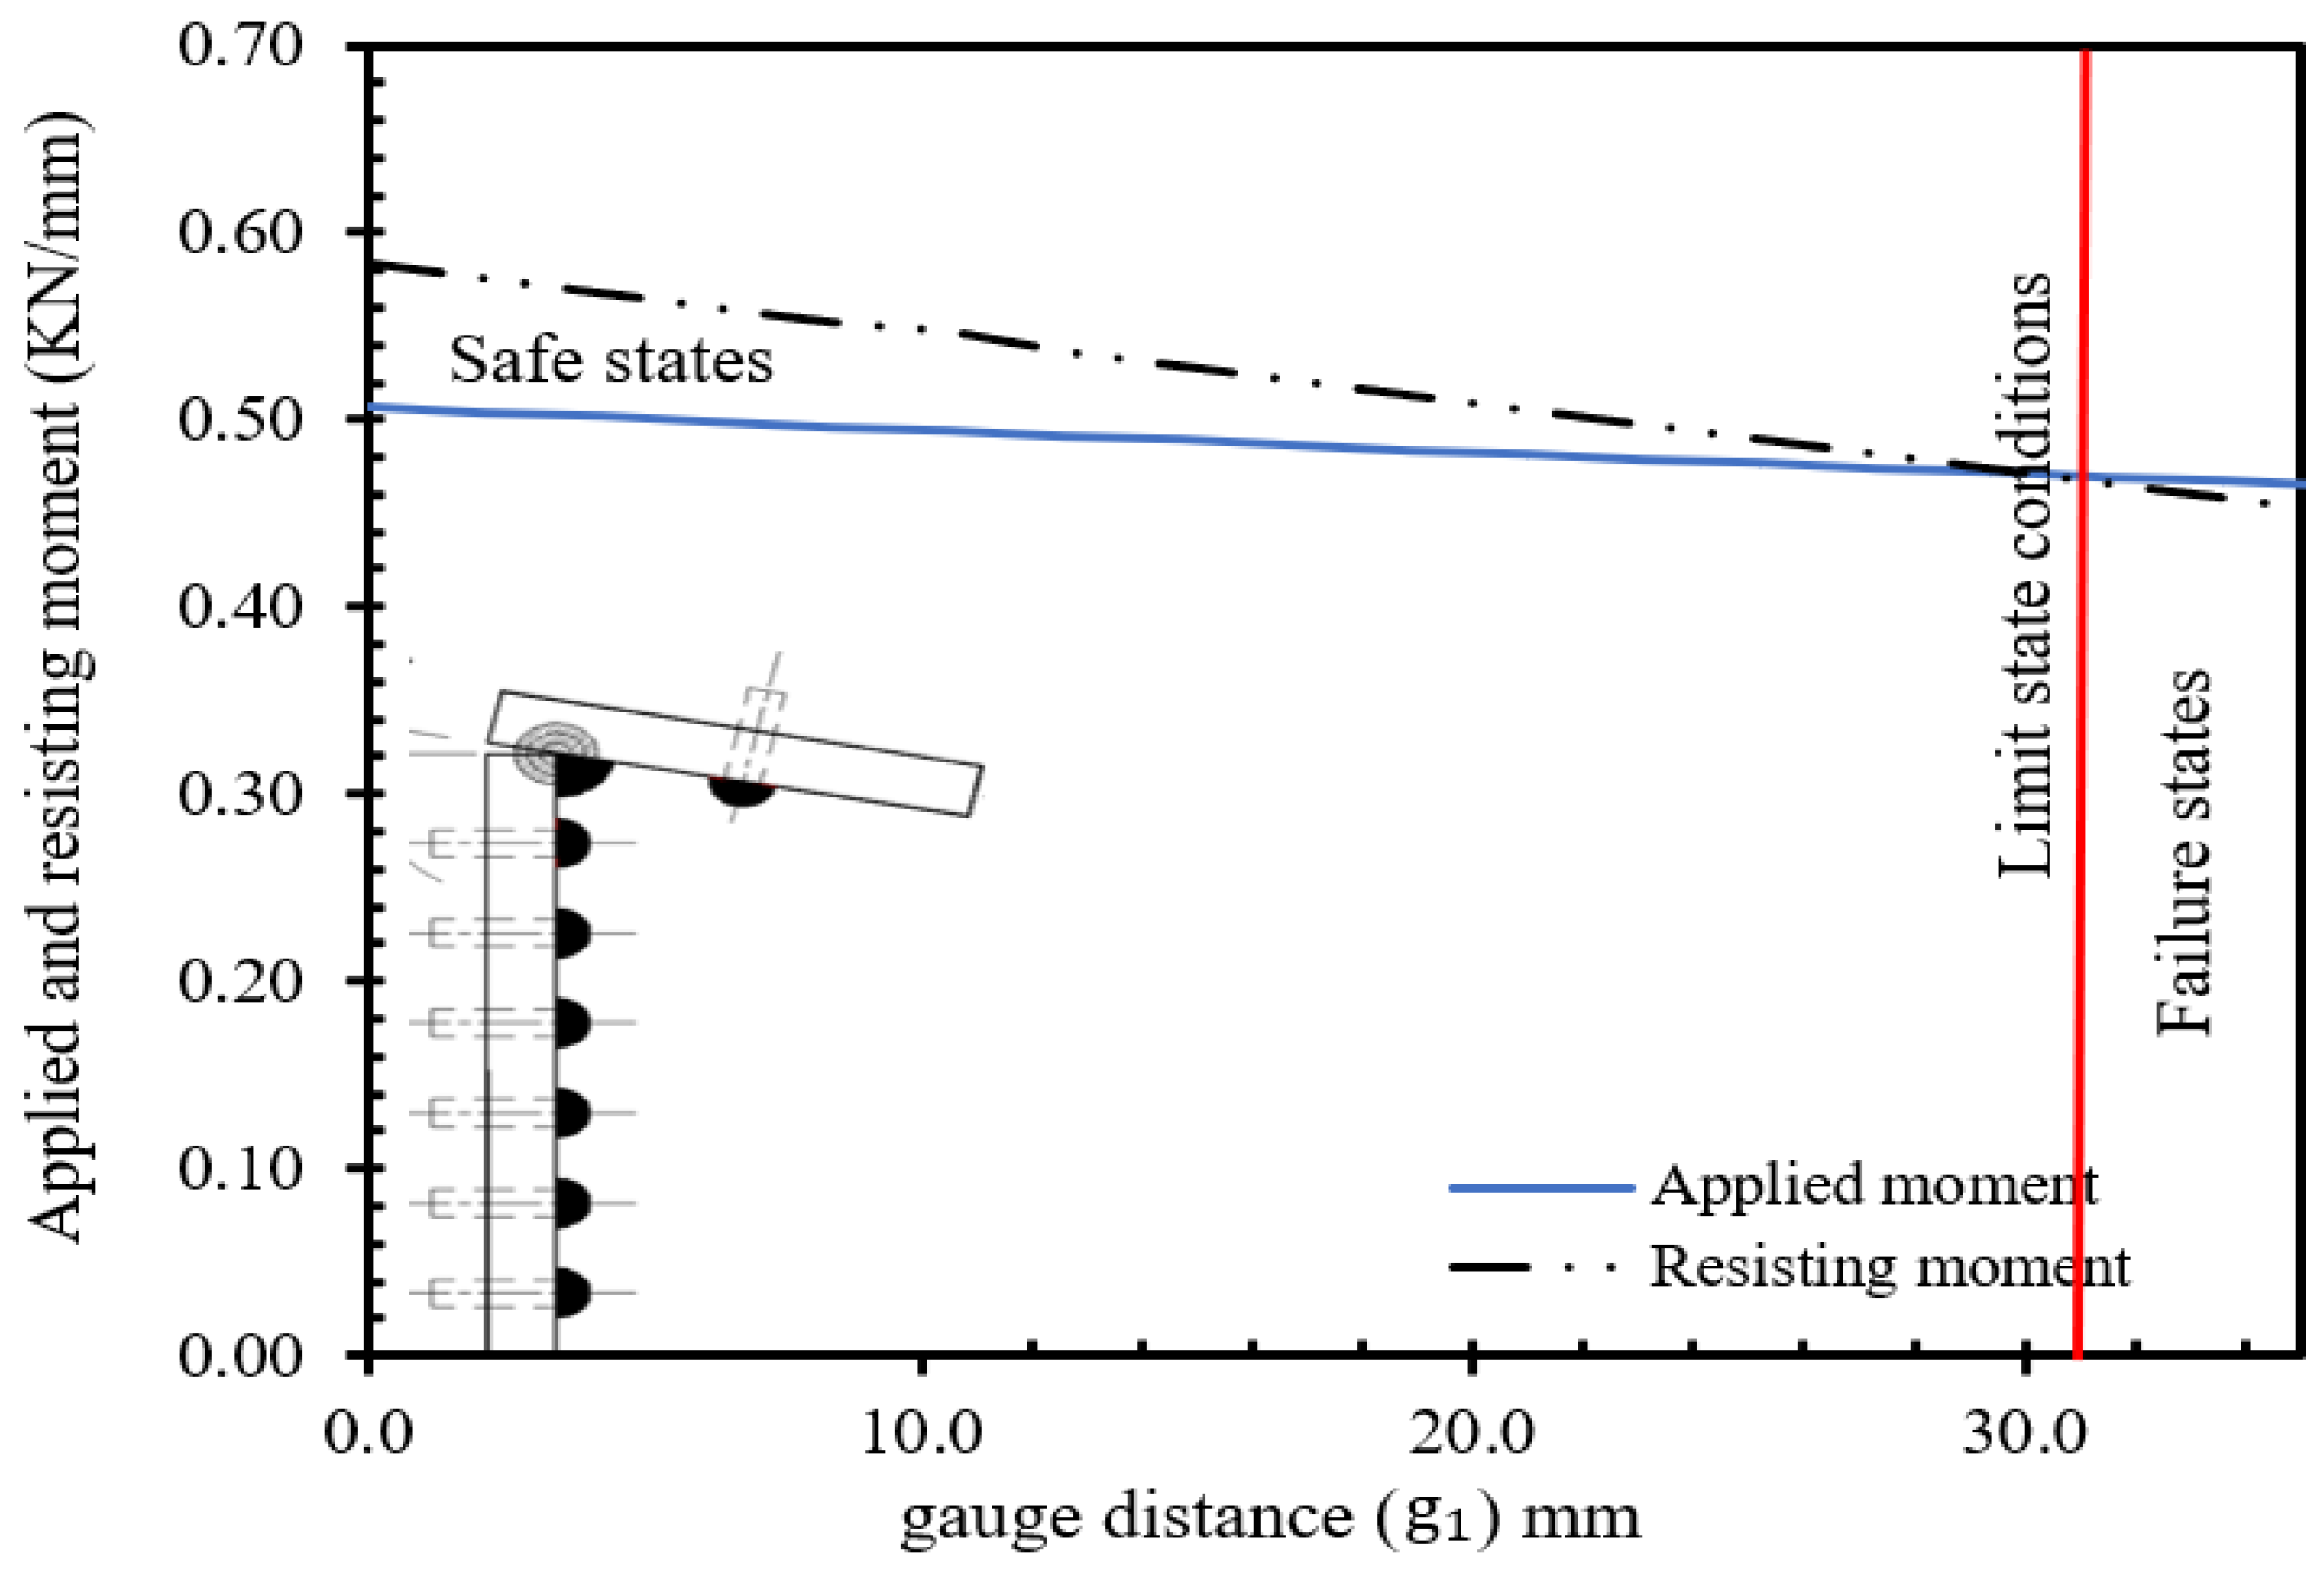
Figure 8.
The existing TA-SP connection 3D model.
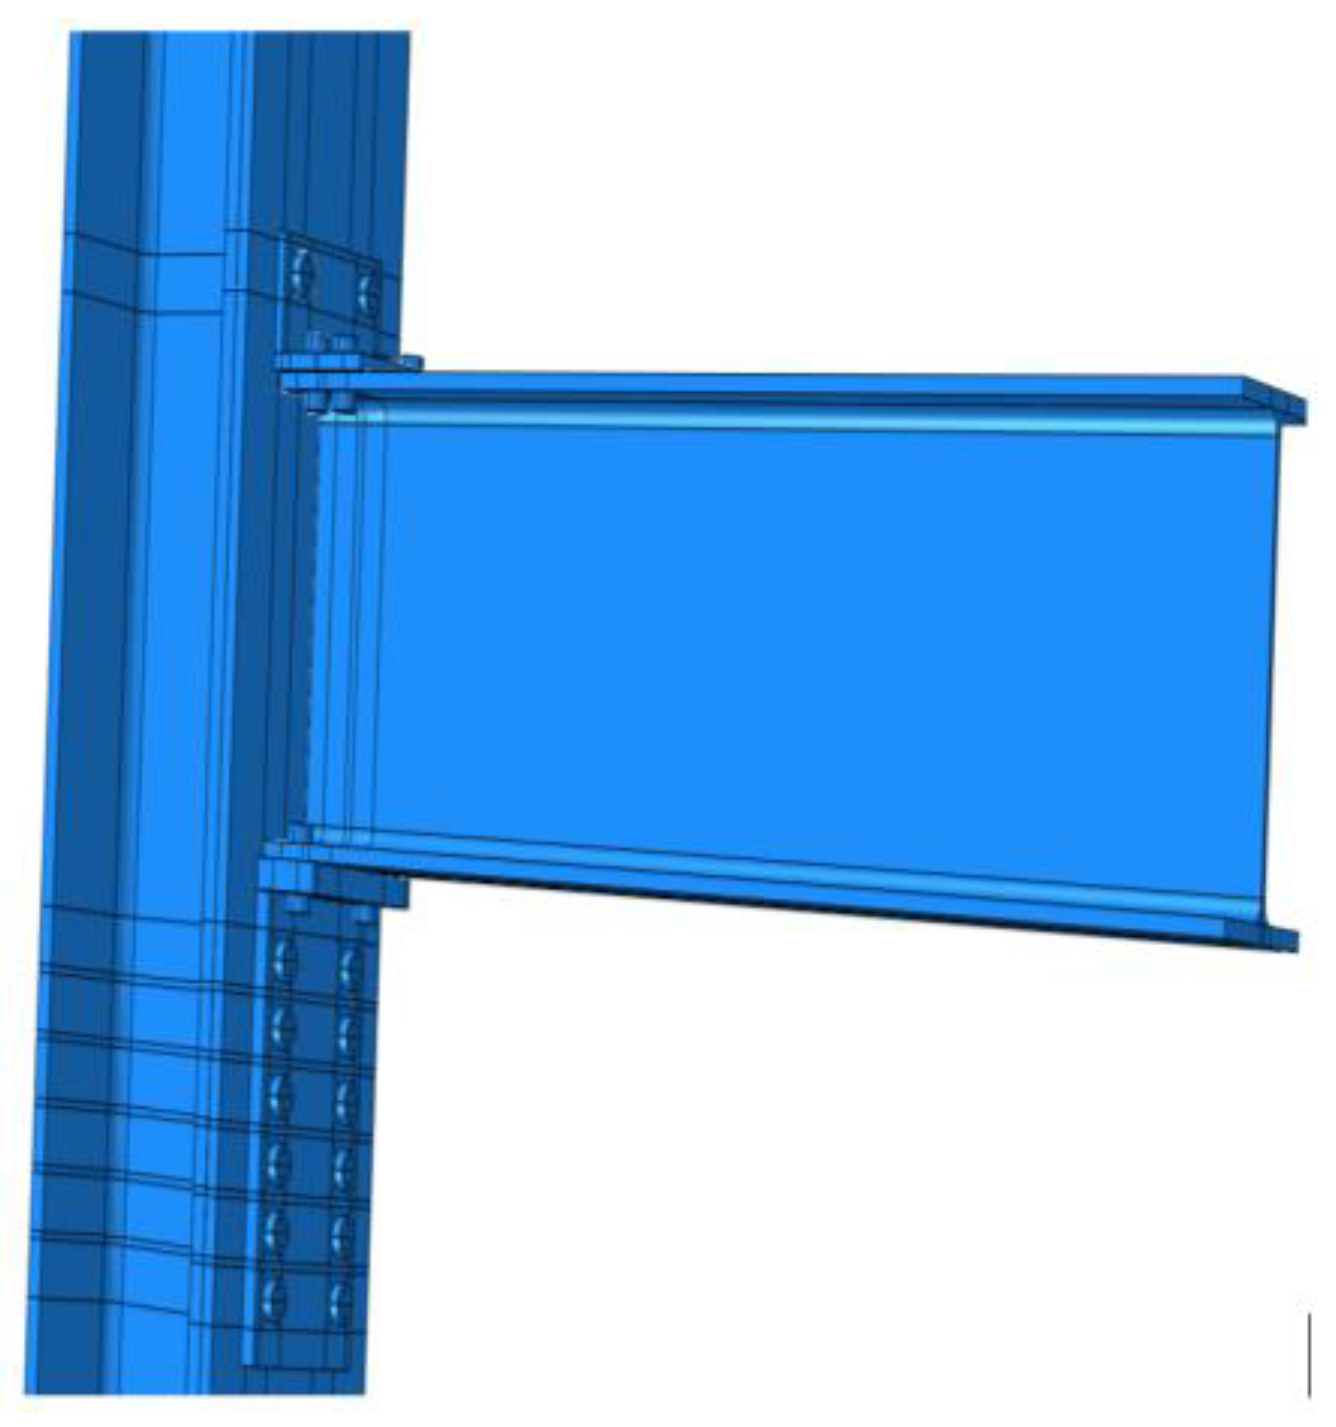
Figure 9.
The von Mises criterion under the ultimate load of the TA-SP connection clockwise rotational failure mechanism behaviours.
Figure 9.
The von Mises criterion under the ultimate load of the TA-SP connection clockwise rotational failure mechanism behaviours.
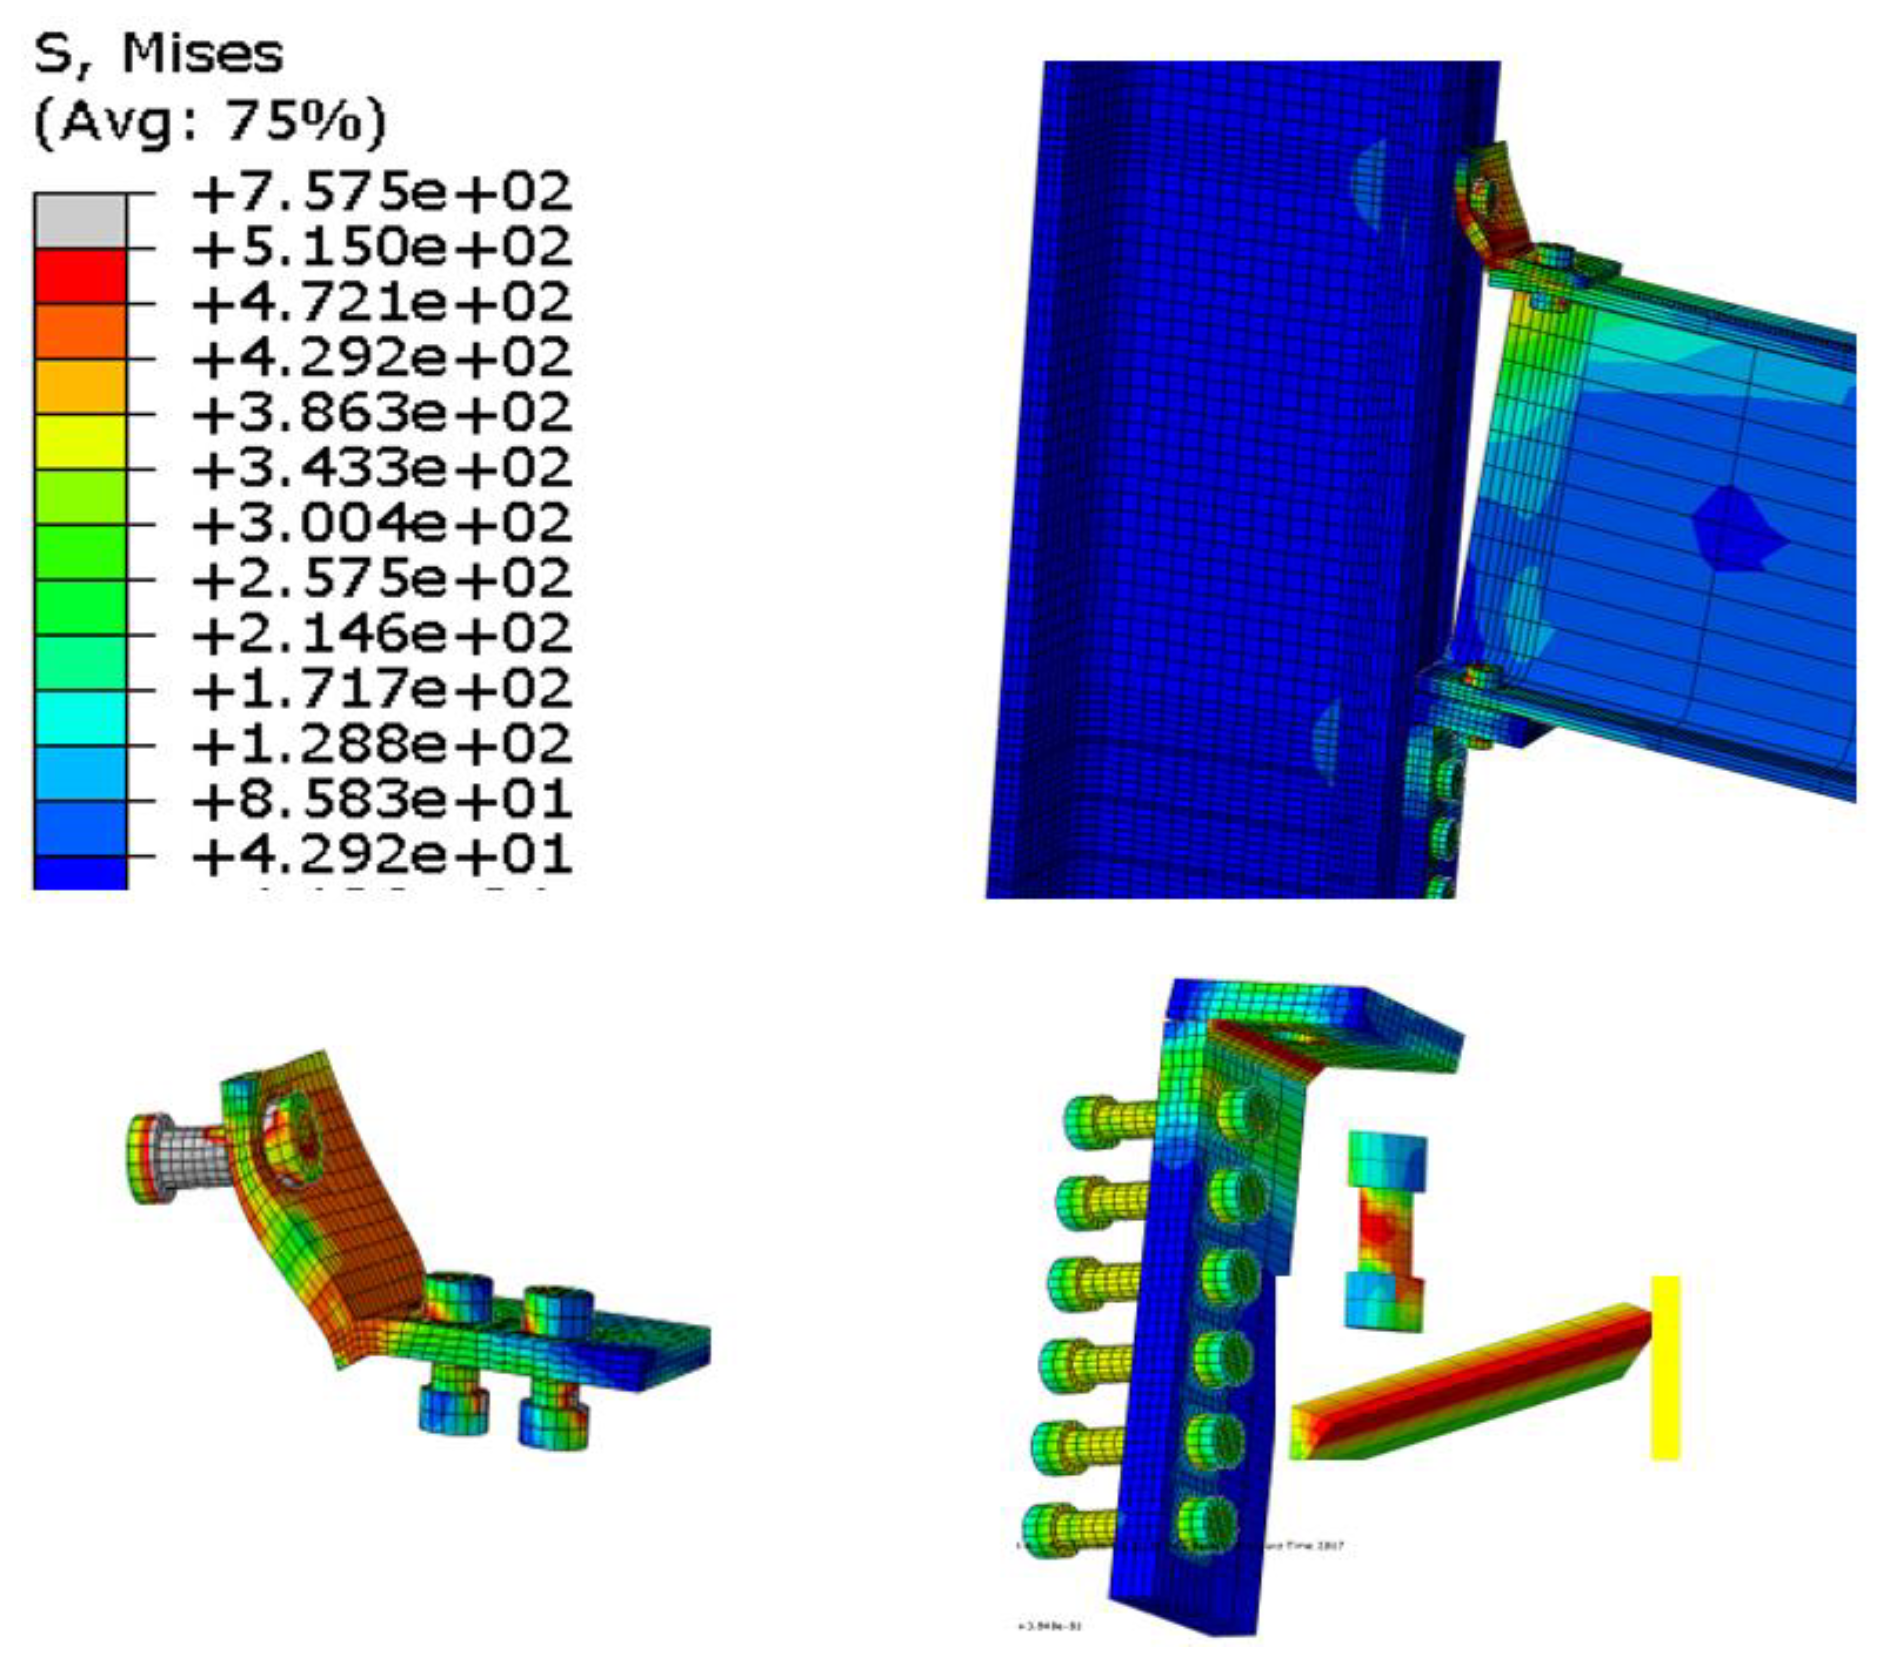
Figure 10.
Moment-rotation relationship curve describing the TA-SP connection parameters.
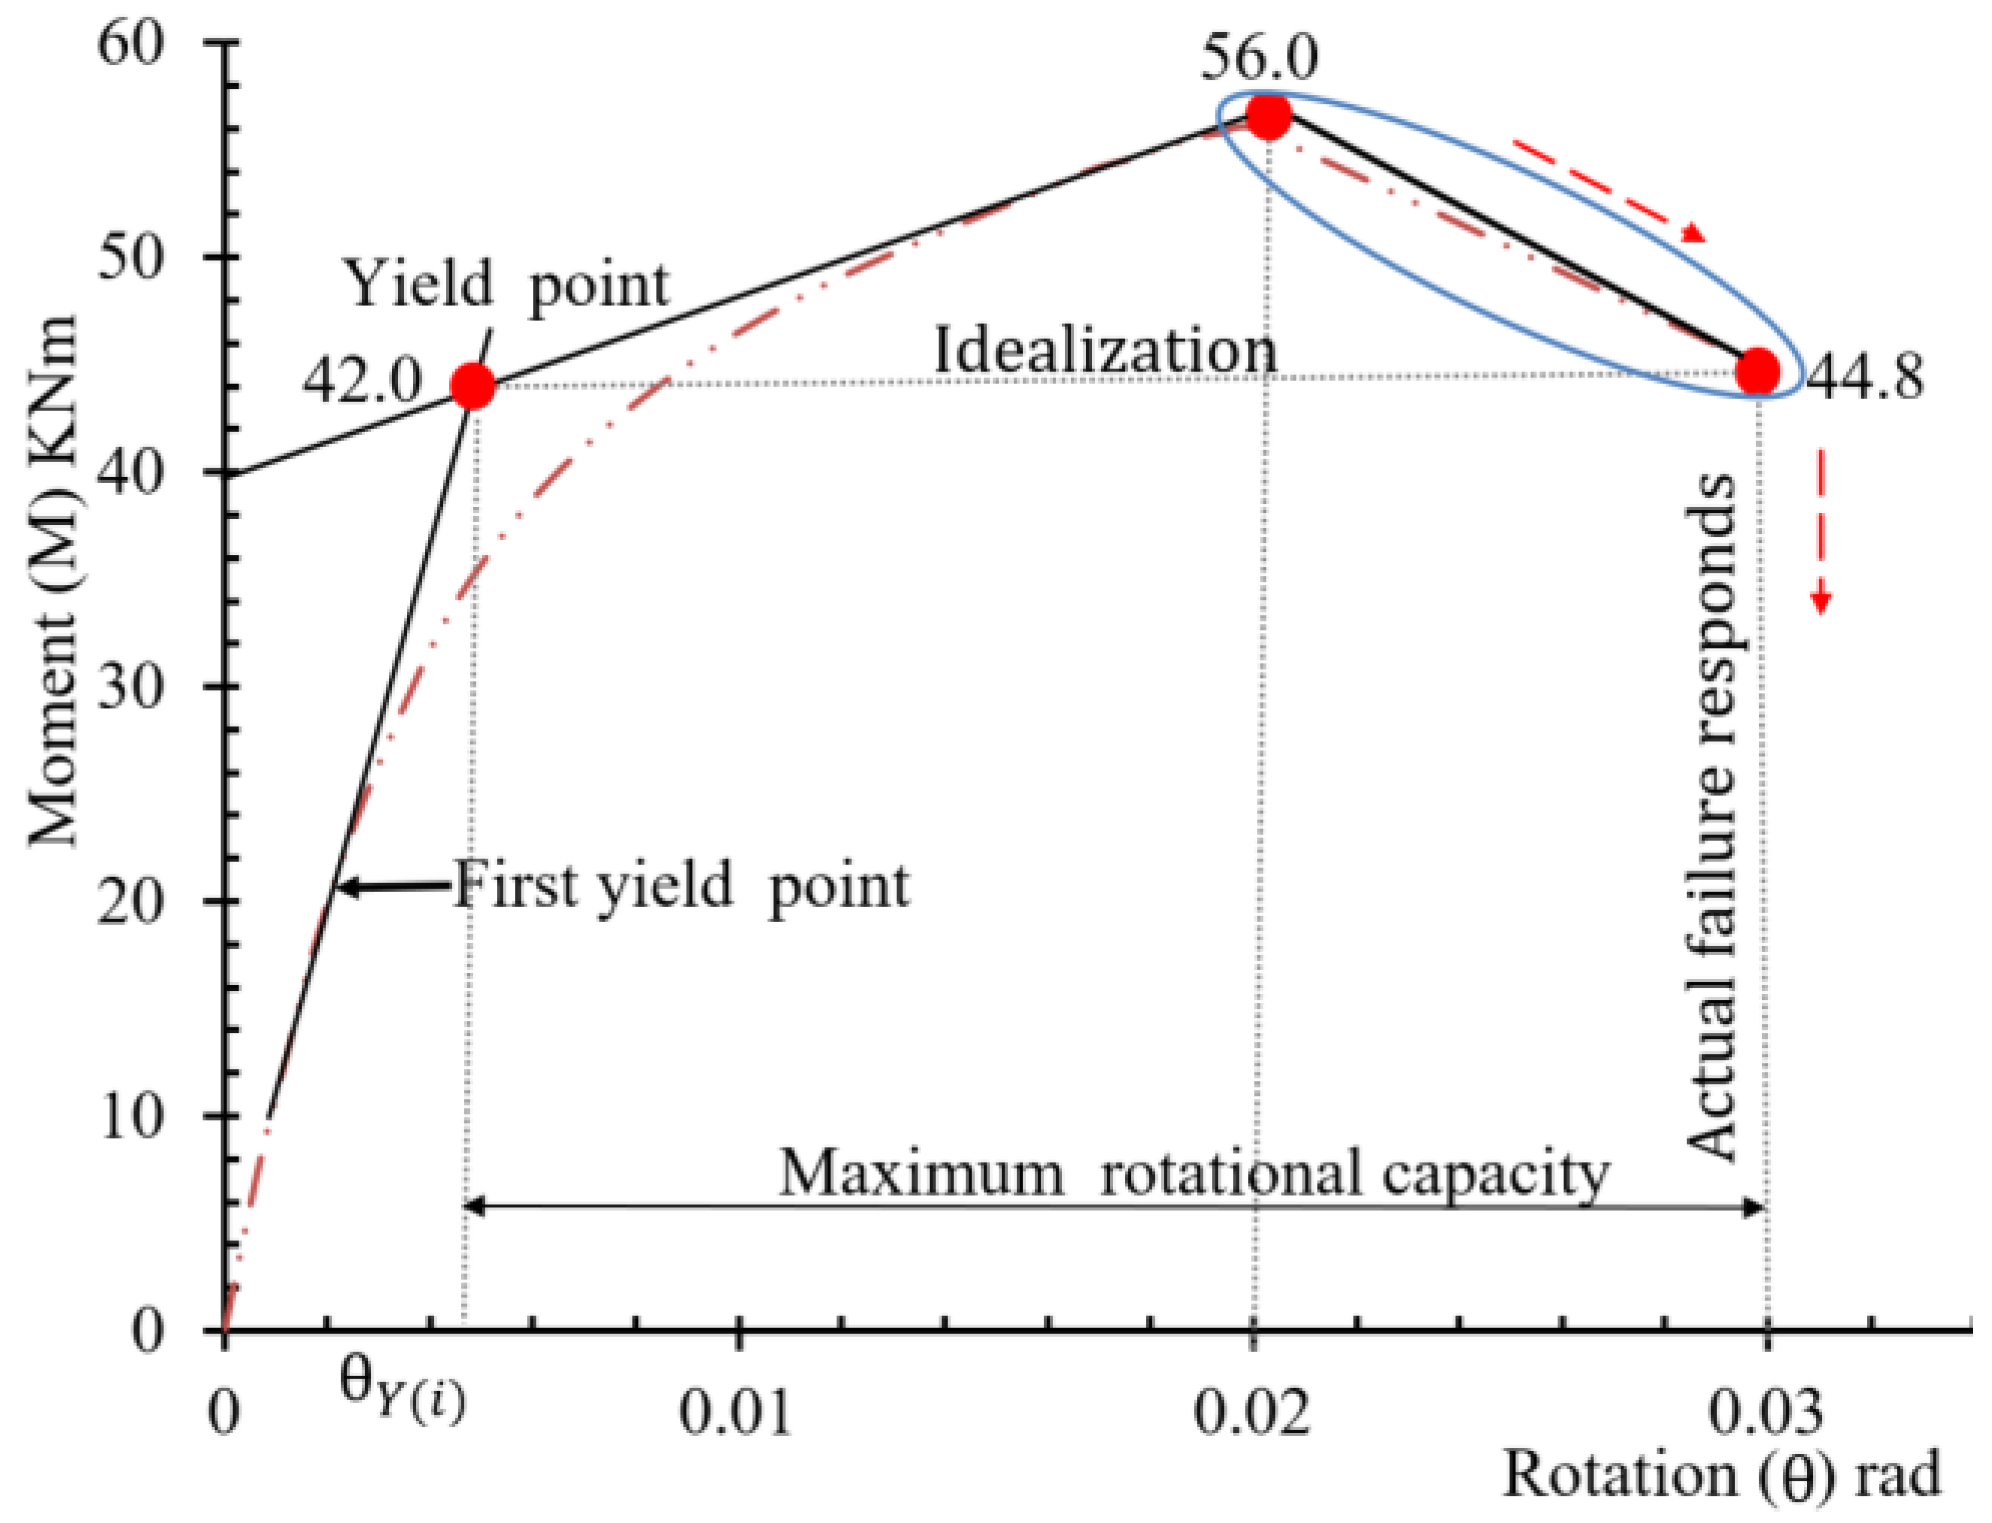
Figure 11.
Uncorrelated coordinate of the minimum distance from the origin.
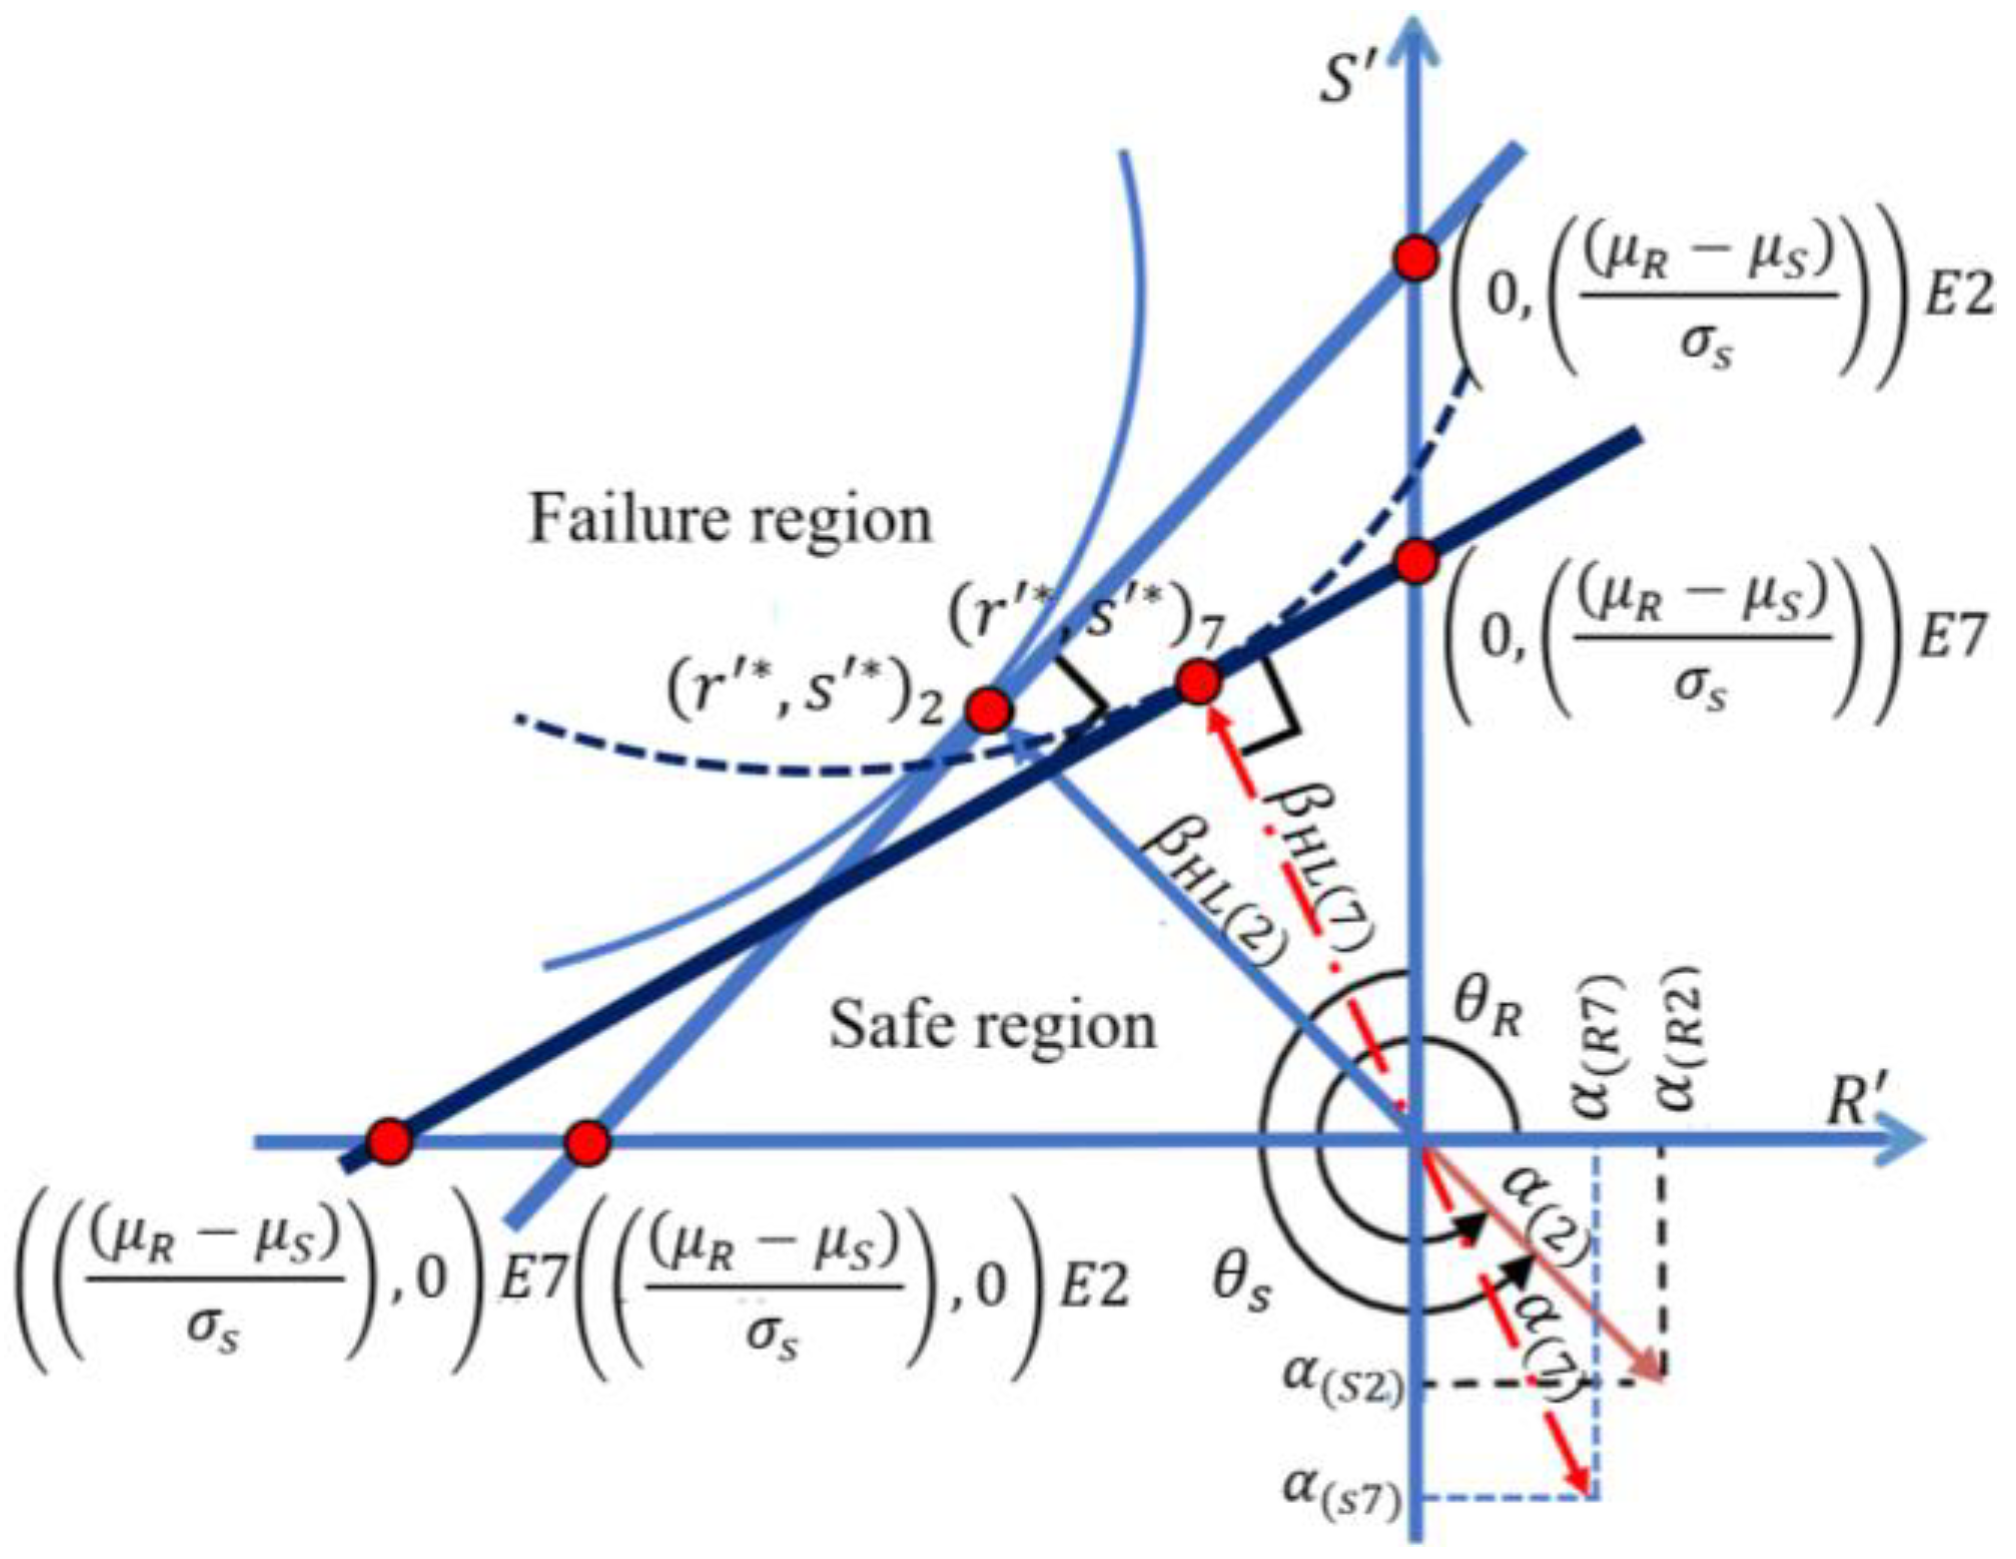
Figure 12.
Uncorrelated variables rotation at the axis of the reduced space.
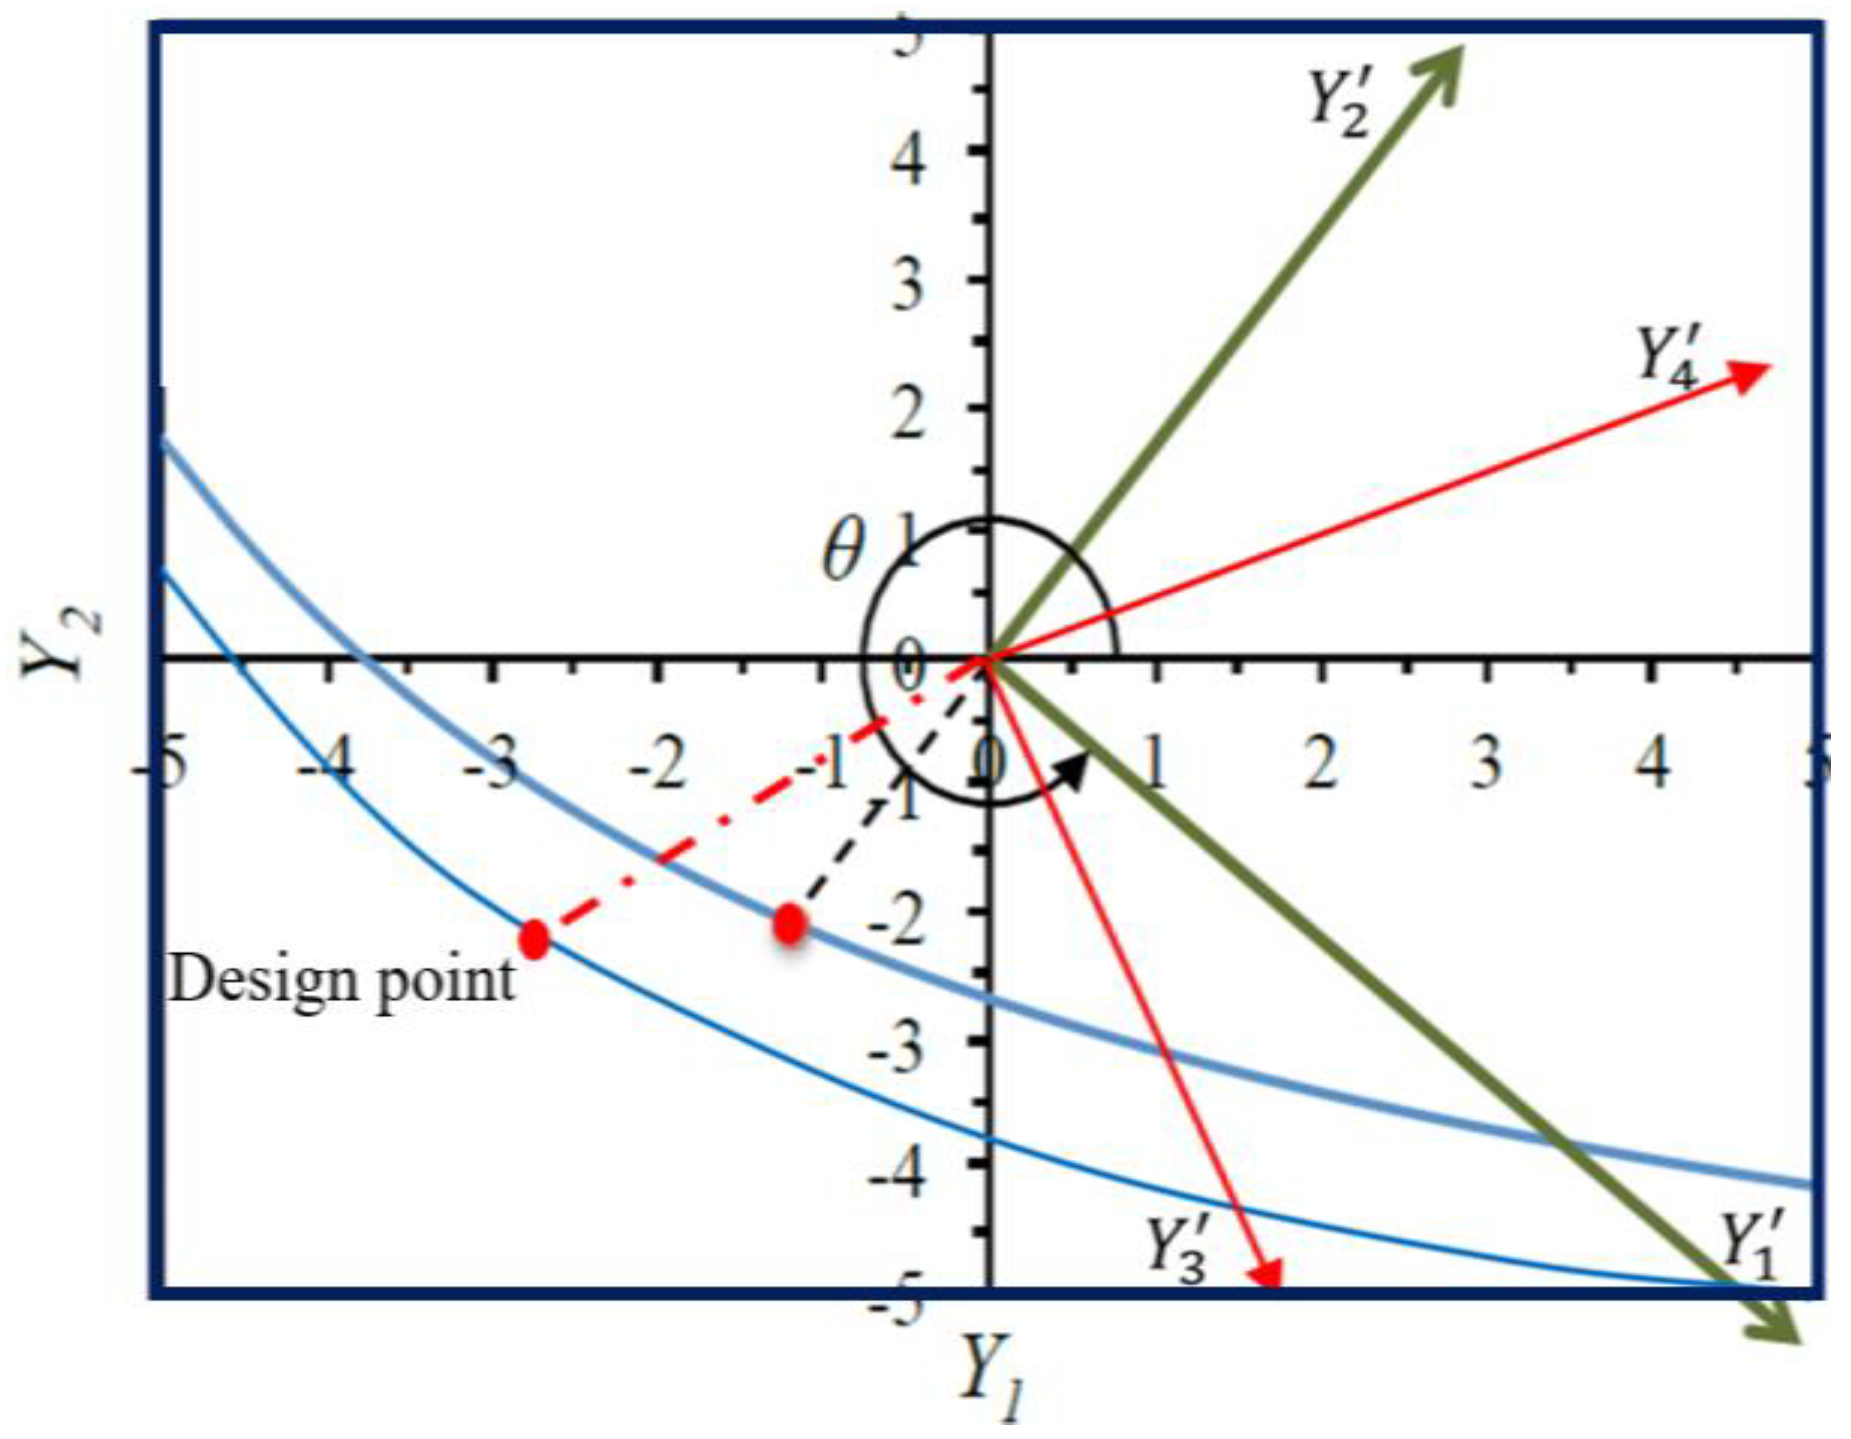
Figure 13.
Variation of the reliability index vs. proportional load factor - Element (E2).
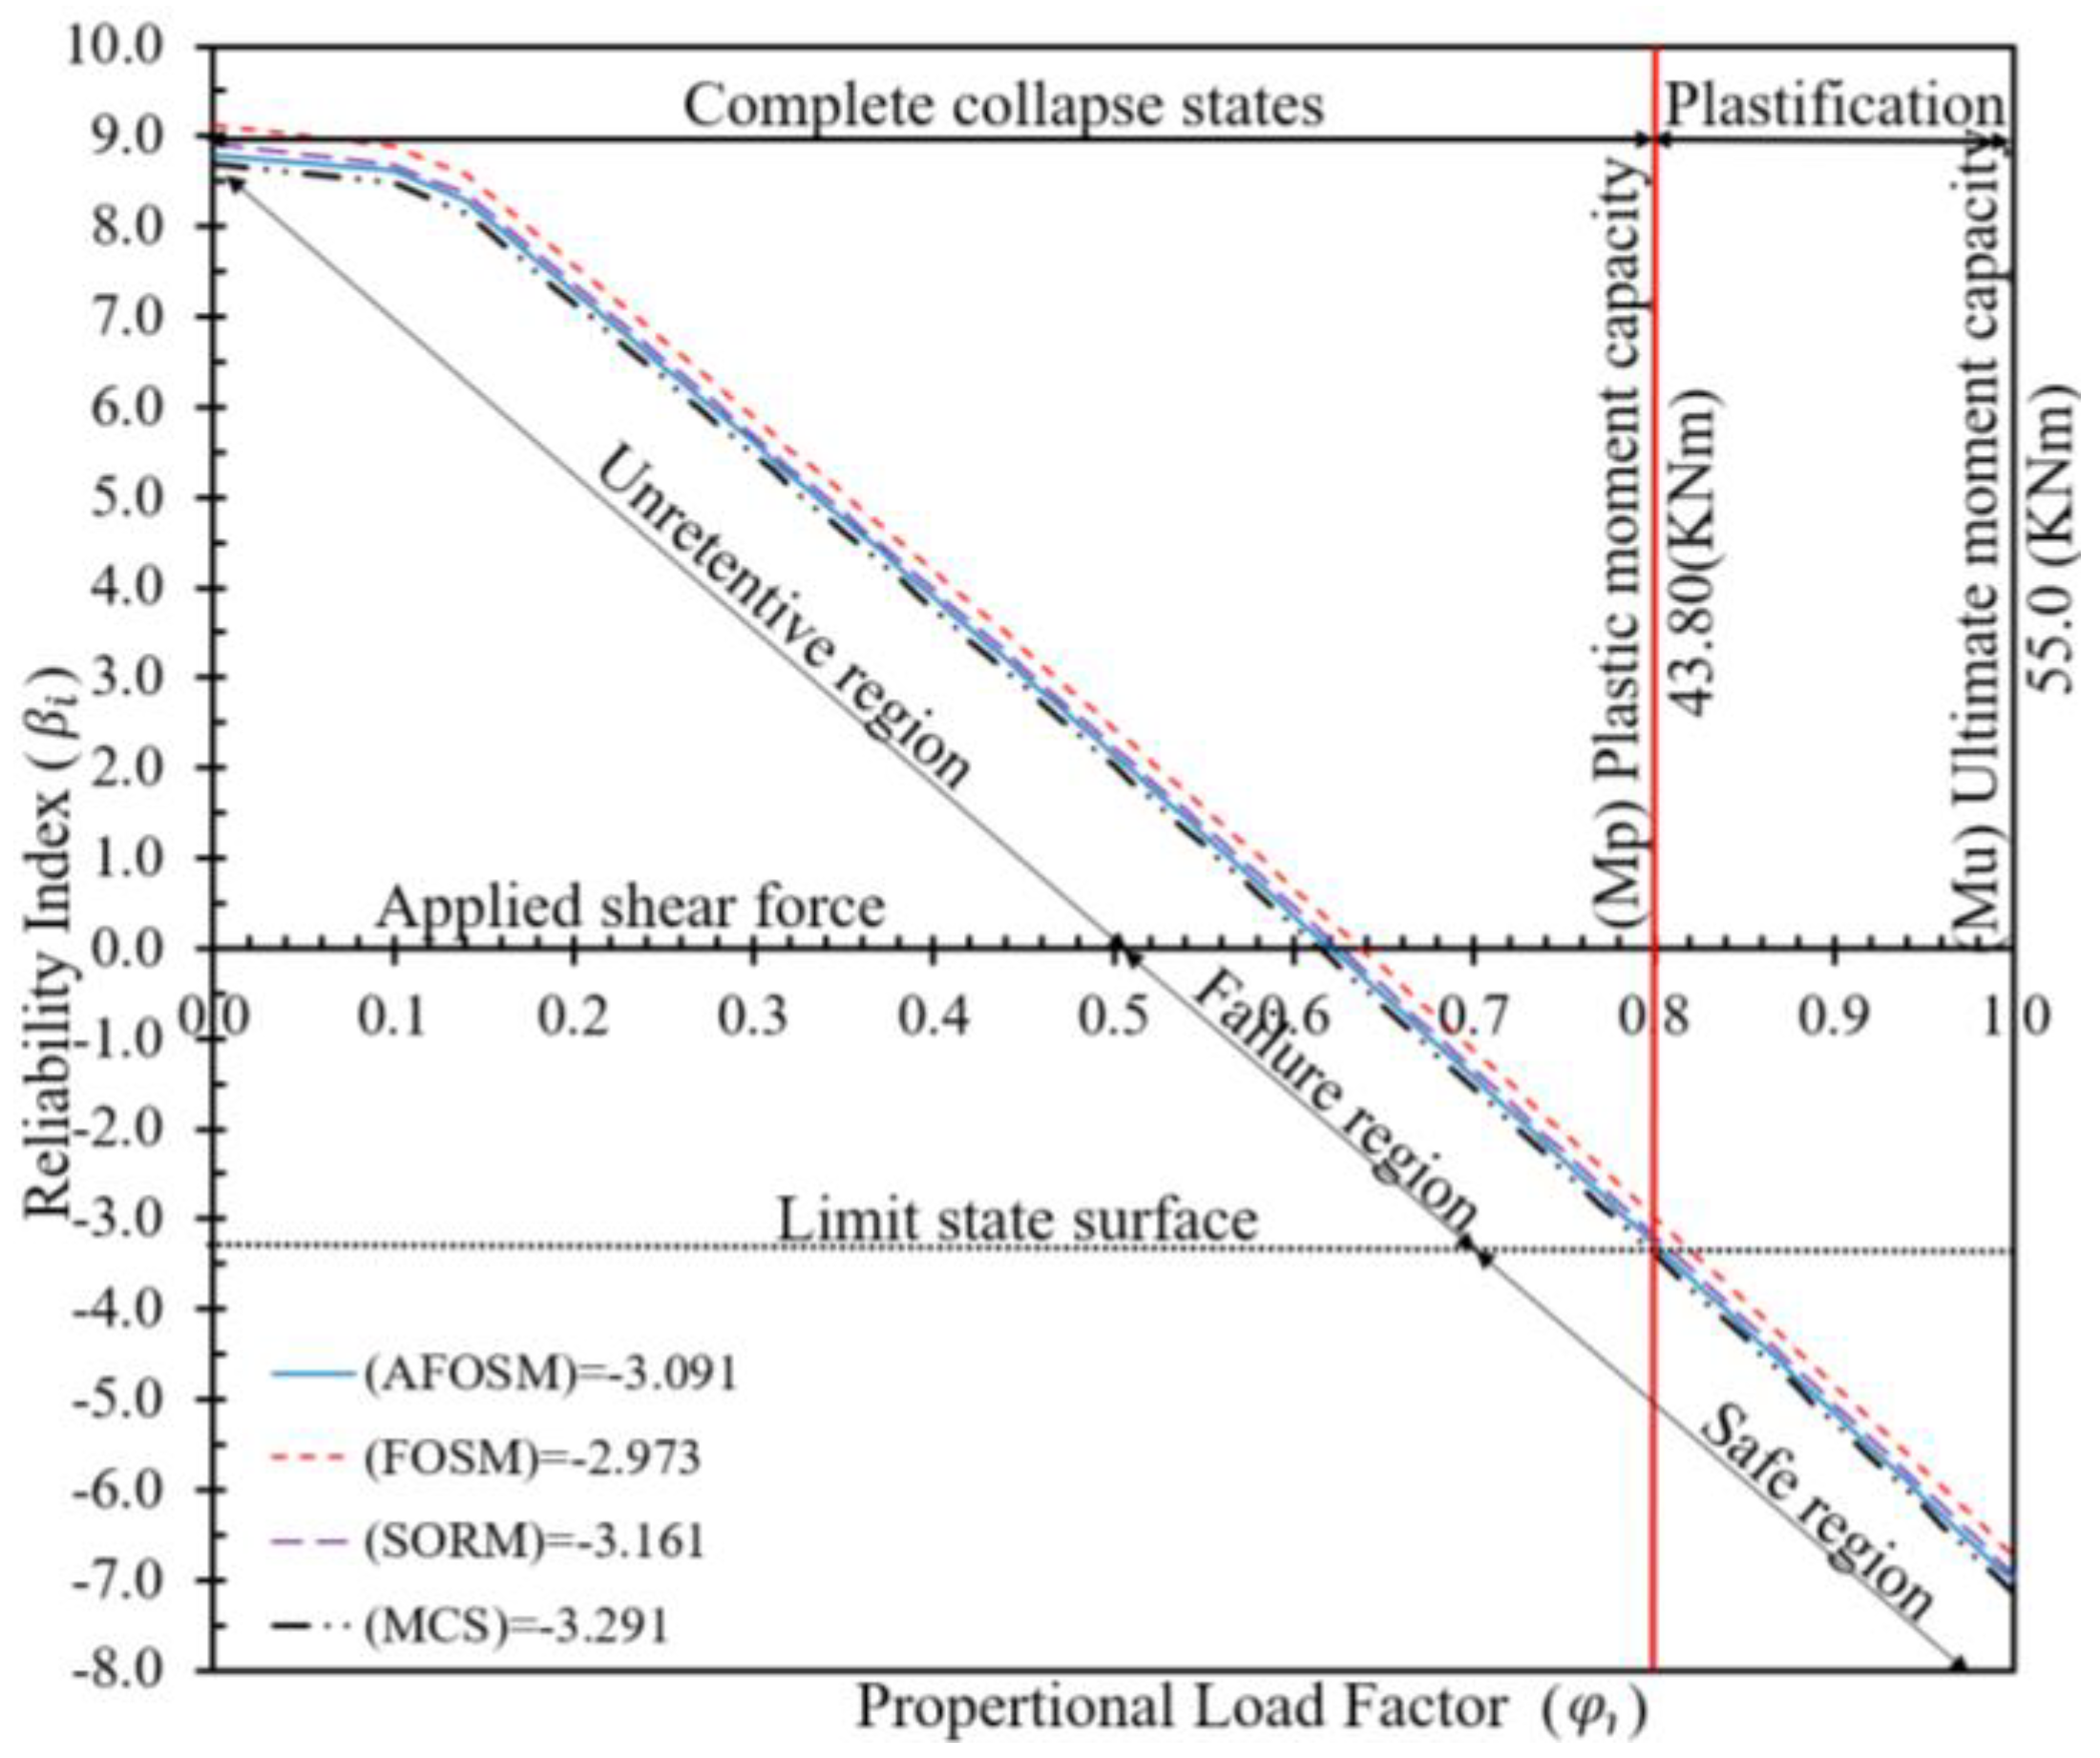
Figure 14.
Variation of the reliability index vs. proportional load factor - Element (E7).
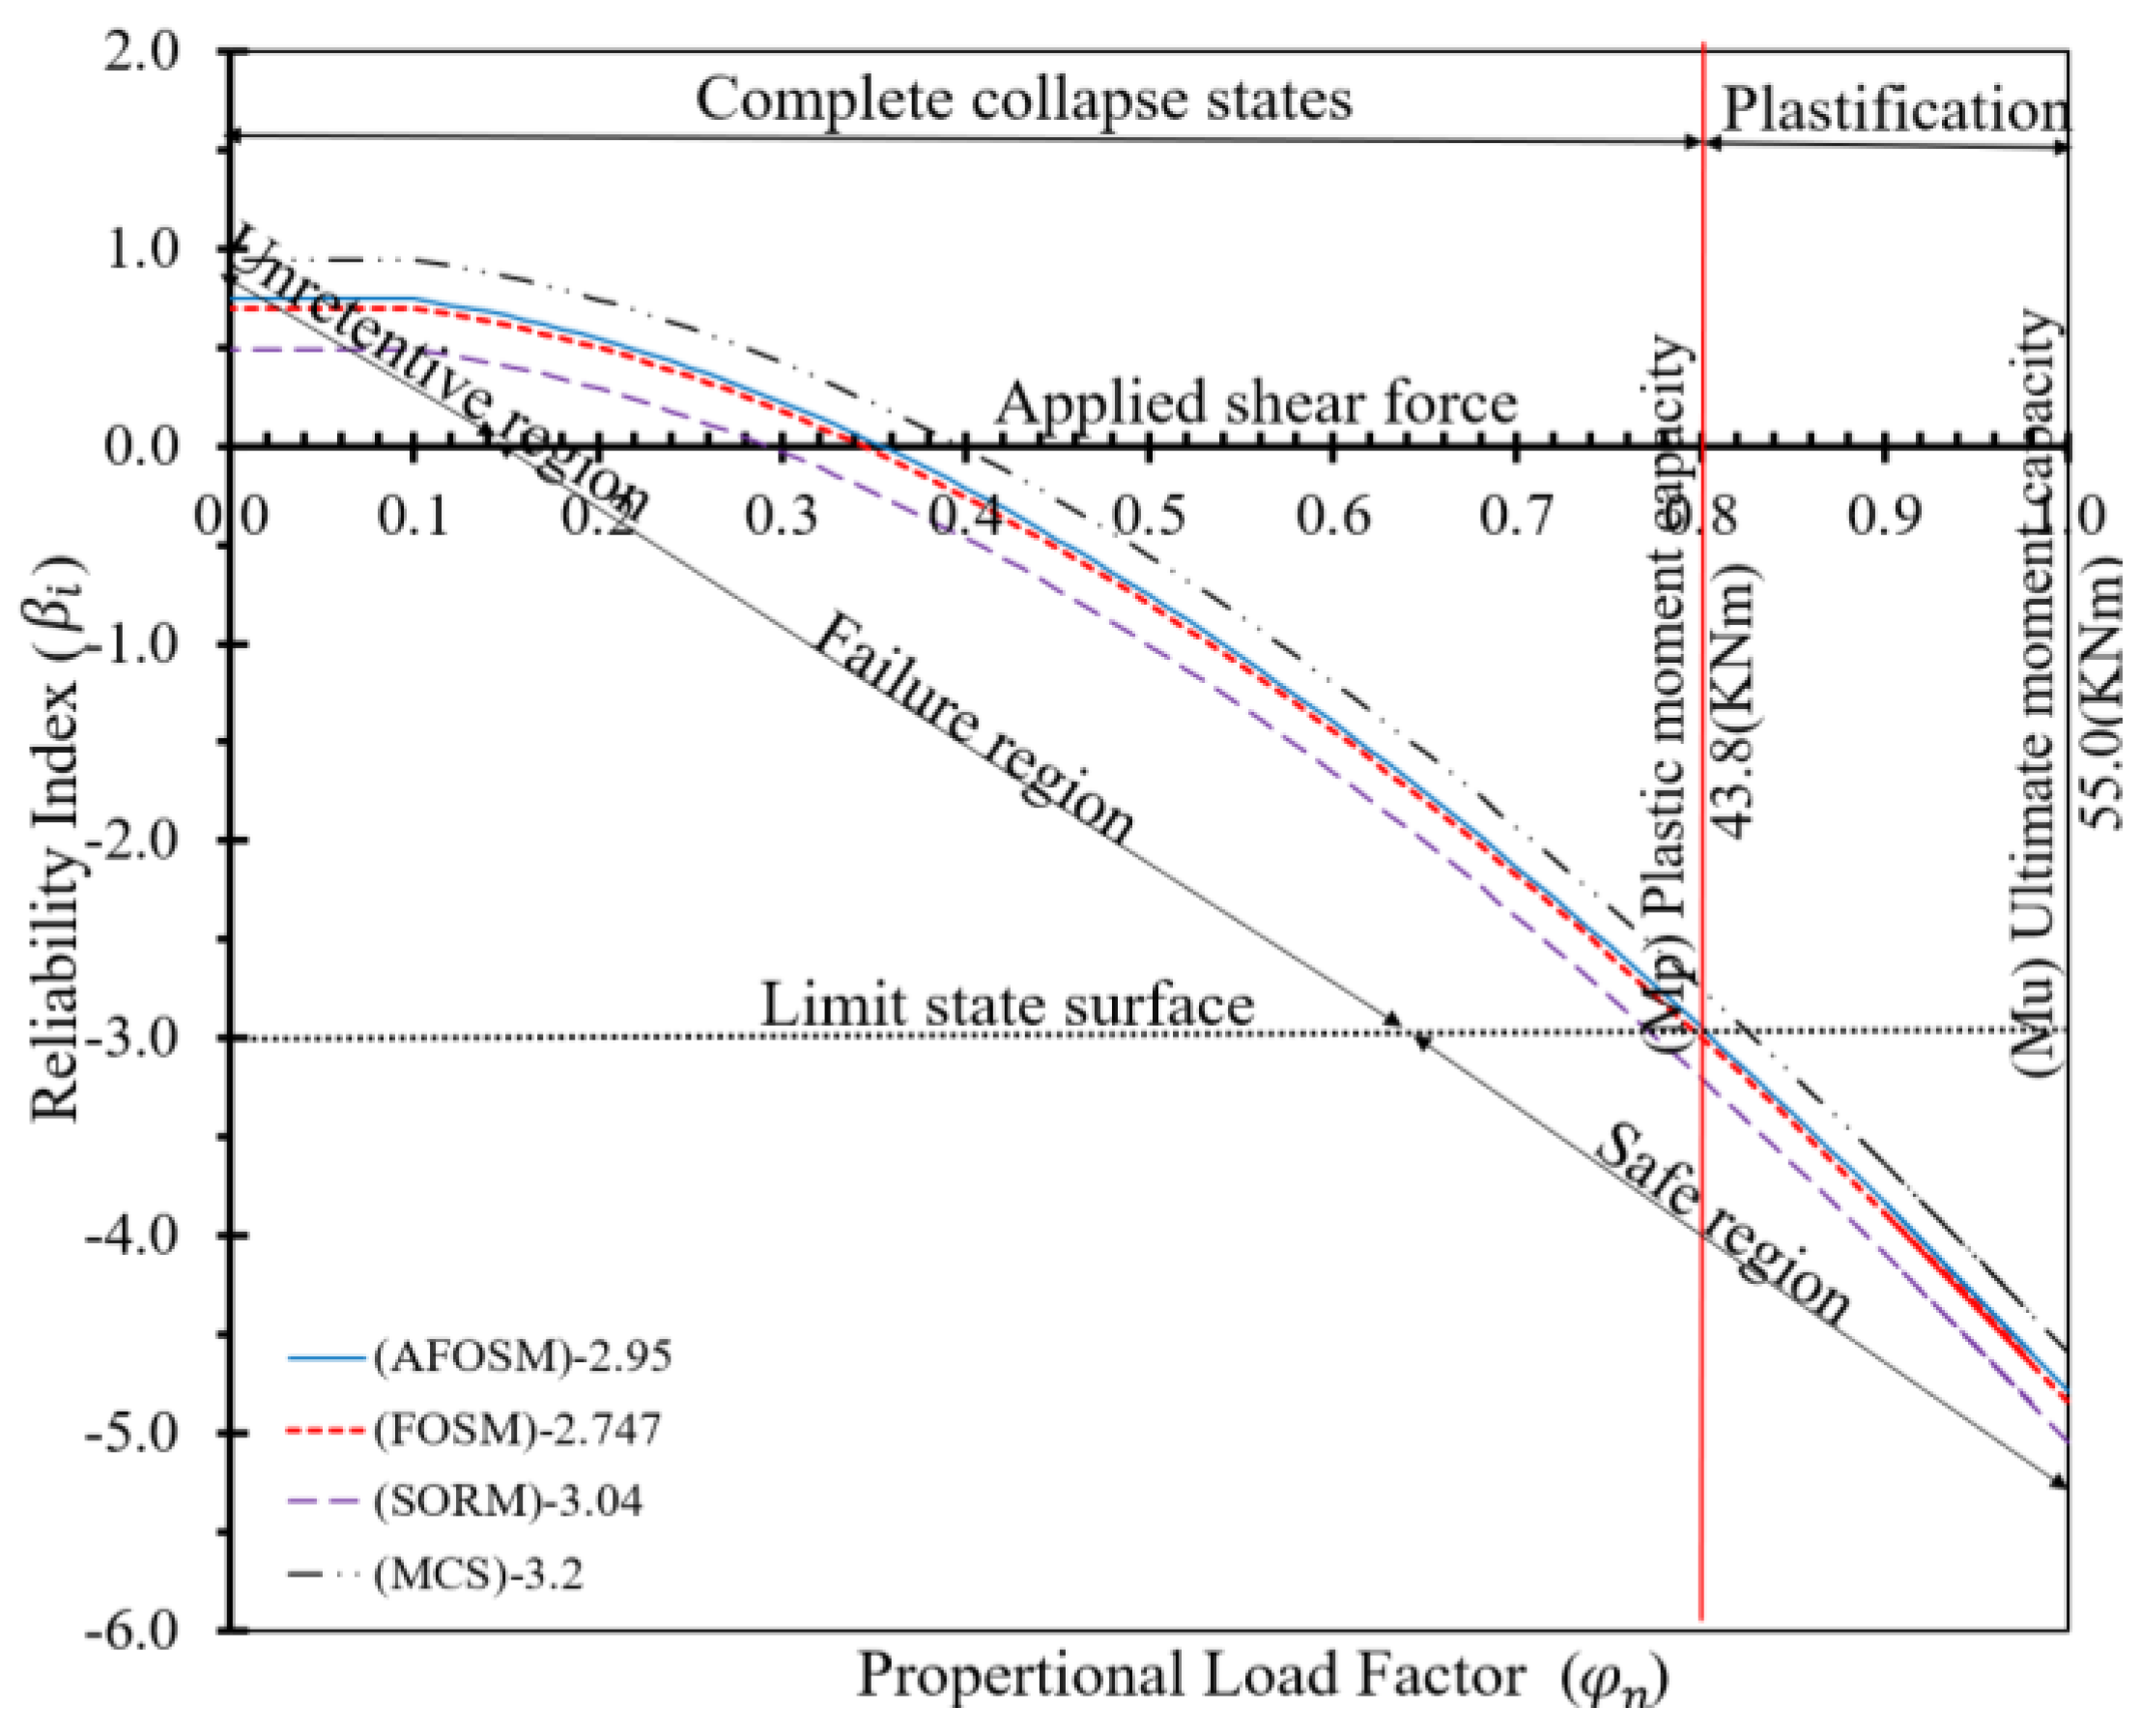
Figure 15.
Clockwise Rotational Failure Mechanism in the Chain Series System of the Existing TA-SP Connection.
Figure 15.
Clockwise Rotational Failure Mechanism in the Chain Series System of the Existing TA-SP Connection.
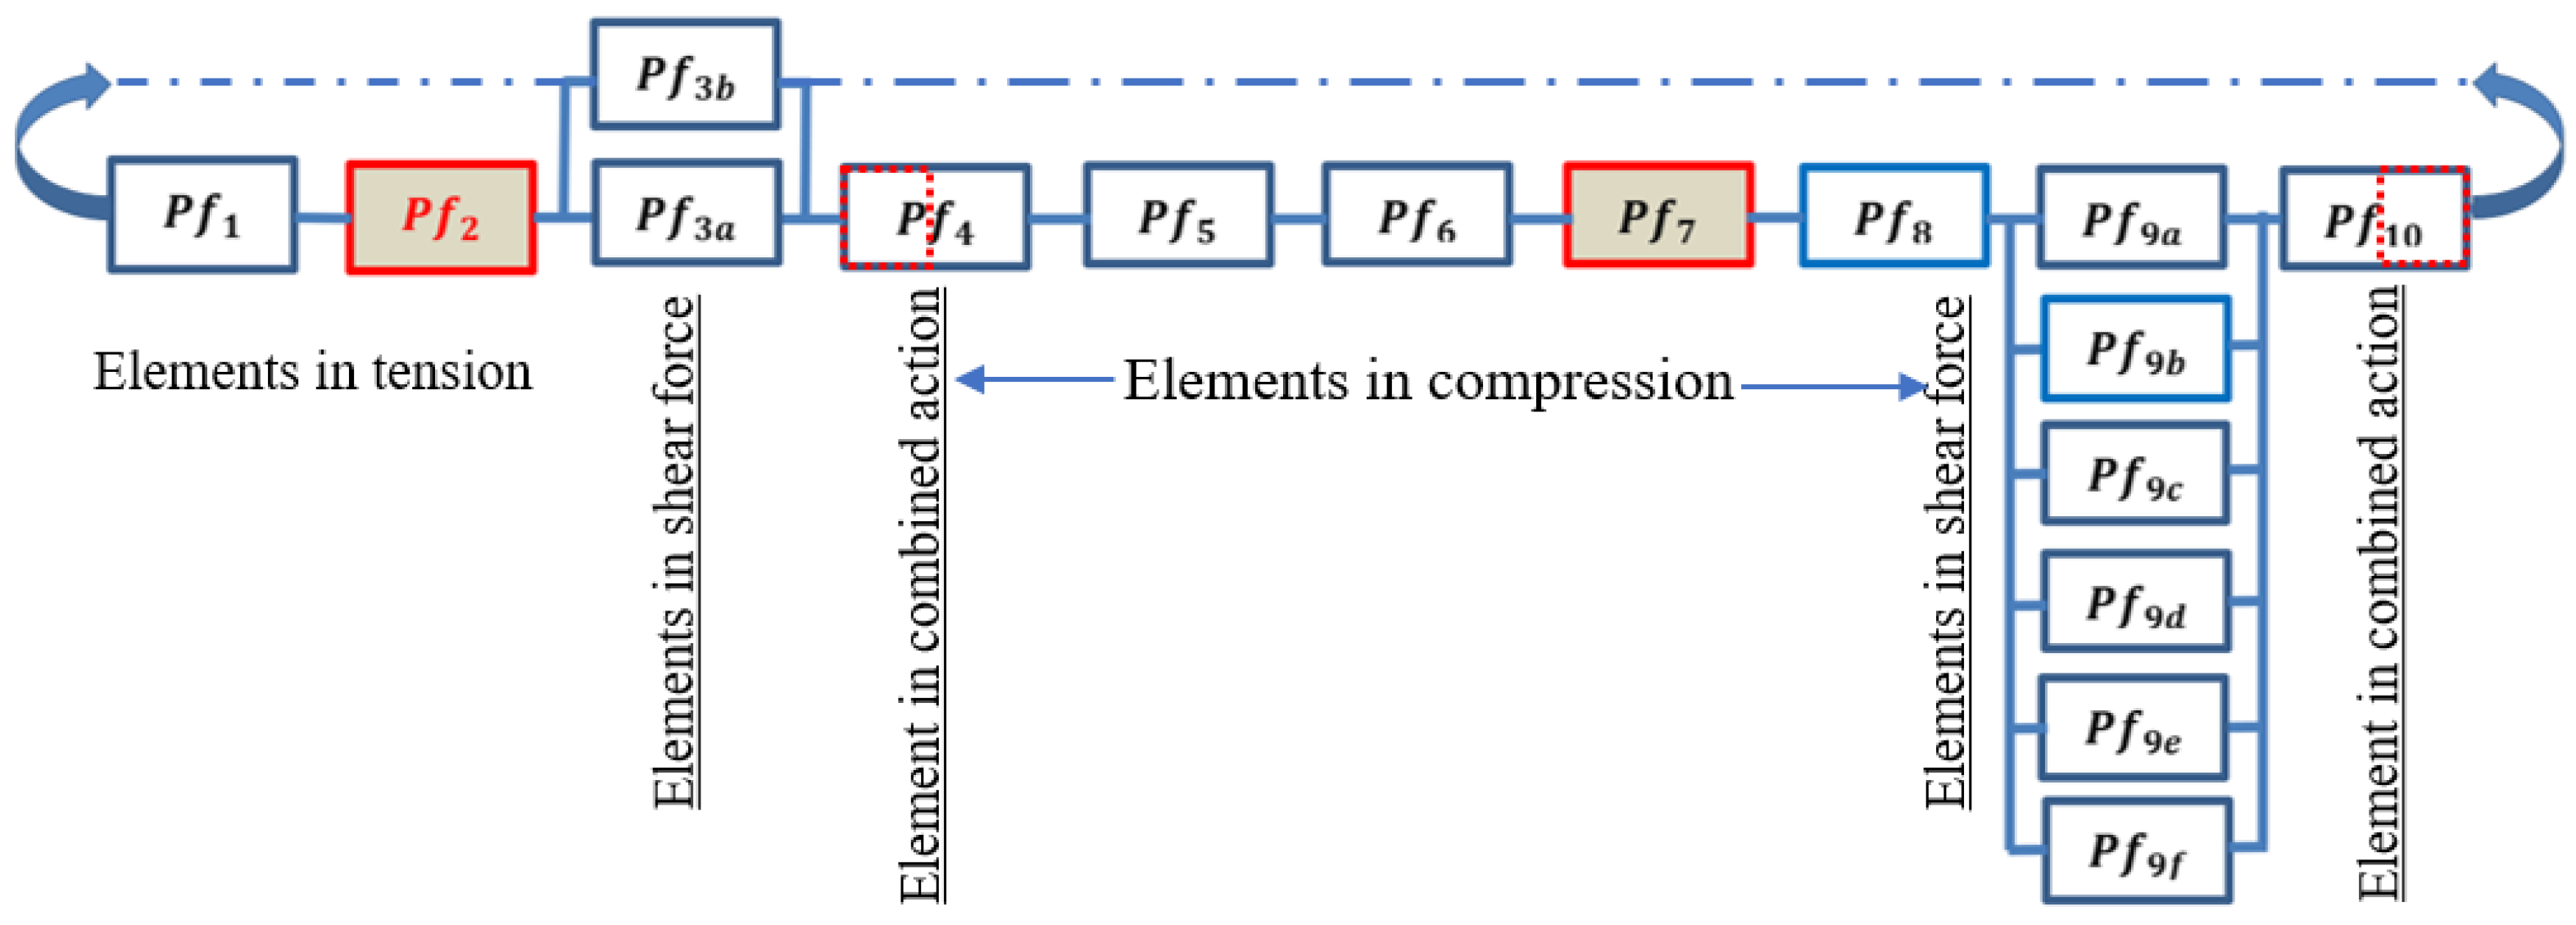

Table 1.
Statistical variables and probability distributions.
| Variables | Symbol | Distribution | E [ ] | Cov |
|---|---|---|---|---|
| Section model | Zx | Normal | 1.00 | 0.05 |
| Thickness | t | Normal | 0.964 | 0.0390.025 |
| Yield stress | Log-normal | 1.05 | 0.110 | |
| Elastic Modulus | Log-normal | 1.00 | 0.060 | |
| Fillet weld | Log-normal | 0.88 | 0.150 | |
| height & width | h&w | Normal | 1.00 | 0.002 |
Table 2.
Geometrical parameter of the existing connection.
| Beam | W14 × 38 |
| Column | W12 × 96 |
| Top Angle | 152.4 × 101.6 × 12.7mm |
| Seat Pad | 100(H) × 19.1 + 350(V) × 22.23mm |
| Rivet- Accessory plate | 22.0mm 10.0mm |
Table 3.
Summary of the iterative cycle.
| Iteration cycle | Element (E2) | Element (E7) | ||
| No | () | () | () | () |
| 1 | -3.098 | 9.73E-04 | −3.199 | 6.89E-04 |
| 2 | -3.080 | 4.26E-03 | −3.198 | 6.93E-04 |
| 3 | -3.080 | 1.04E-03 | −3.198 | 6.93E-04 |
Table 4.
Failure probability and percentile Error.
| Top angle (E2) | Weld (E7) | |||||
| Types | Error | Error | ||||
| AFOSM | −3.09 | 9.99E-04 | 100.1% | −2.92 | 1.74E-03 | 113.1% |
| FOSM | −2.97 | 1.48E-03 | 195.6% | −2.75 | 2.96E-03 | 262.1% |
| SORM | −3.16 | 7.86E-04 | 57.4% | −3.05 | 1.16E-04 | 42.4% |
| MCS | −3.29 | 4.99E-04 | −3.15 | 8.16E-04 | ||
Table 5.
Summary of the Proposed Methods and Percentile Errors.
| Type | Error (%) | ||
| AFOSM | 2.74E-03 | −2.78 | 108.2 |
| FOSM | 4.43E-03 | −2.62 | 236.8 |
| SORM | 1.95E-03 | −2.89 | 48.1 |
| MCS | 1.12E-03 | −3.03 |
Disclaimer/Publisher’s Note: The statements, opinions and data contained in all publications are solely those of the individual author(s) and contributor(s) and not of MDPI and/or the editor(s). MDPI and/or the editor(s) disclaim responsibility for any injury to people or property resulting from any ideas, methods, instructions or products referred to in the content. |
© 2024 by the authors. Licensee MDPI, Basel, Switzerland. This article is an open access article distributed under the terms and conditions of the Creative Commons Attribution (CC BY) license (https://creativecommons.org/licenses/by/4.0/).
Copyright: This open access article is published under a Creative Commons CC BY 4.0 license, which permit the free download, distribution, and reuse, provided that the author and preprint are cited in any reuse.


