Submitted:
11 March 2024
Posted:
11 March 2024
You are already at the latest version
Abstract
Comprehensively understanding the spatial ecology and habitat preferences of endangered species is essential for population restoration and conservation. We investigated the home range and movement of the endangered Amur soft-shell turtle (Pelodiscus maackii) in the Ussuri River, Heilongjiang Province, Northeastern China. The study involved tracking 19 Amur soft-shell turtles from late June to mid-October, 2022, resulting in complete and partial home range size data for eight subadults and two adults, respectively. The primary analysis focused on eight subadults, and the models that best described daily movement were identified. We also explored the potential factors influencing home range size. Mean movement rate ranged from 39.18 ± 20.04 m to 72.45 ± 29.36 m and was positively correlated with the linear home range and water temperature. The most insightful home range estimate was a 95% kernel density estimate, employing likelihood cross-validation smoothing with constraints set to the river boundaries. The mean home range size was 1.02 ha and was not correlated with body size. Subadults tended to establish well-defined home ranges over time; whereas, defining home ranges for adults proved challenging. This research addresses a gap regarding the ecology of the Amur soft-shell turtle and provides a foundation for future conservation plans.
Keywords:
Amur soft-shell turtle
; Pelodiscus maackii
; spatial ecology
; movement rate
; home range
; conservation
1. Introduction
Amur Soft-shell turtle (Pelodiscus maackii, hereafter AST) [1] is a freshwater turtle species that has historically thrived across Northeast China, the Russian Far East, the Korean Peninsula, and Japan [1,47]. However, the population in Northeastern China has drastically declined in recent decades owing to the effects of anthropogenic activities, such as uncontrolled hunting and habitat destruction, and has completely disappeared from many of its original habitats (Hou. Unpublished content). Although described as early as the 19th century and likely currently critically endangered, research on this species is desperately lacking. Only a few articles, i.e., Baek et al. [8] on the sequencing of its complete mitochondrial genome and Chang et al. [11] and Suzuki and Hikida [54] on surveys of freshwater turtle species in South Korea and Japan, morphologically and molecularly proved that ASTs inhabit the rivers of both countries and are suspected to be native to both regions. Overall, there is a notable absence of fundamental ecological research on ASTs throughout their distribution range, which presents a barrier to comprehending their environmental needs in natural habitats and hinders endeavors to effectively evaluate and protect this species.
Spatial ecology is important for riverine turtles because it directly ties them to their adaptations for resource acquisition, reproduction, and survival within the ever-changing dynamics of their environment [31]. Recognizing the critical role of spatial data in unraveling the ecology of an organism and guiding protective management, this study aimed to examine the movement and home ranges of P. maackii. The current study is important because it fills a knowledge gap regarding the natural history of this poorly studied species and may establish a theoretical foundation for future conservation efforts. Another objective of this study was to provide a set of management recommendations for the protection of ASTs in the Ussuri River.
2. Materials and Methods
2.1. Study Site, Radio Telemetry, and Data Collection
The study was conducted near Jewelry Island, situated in the mid-stream part of the Ussuri River, Heilongjiang Province, China (Figure 1). The study area lies to the south of Jewelry Island, encompassing two primary water channels and a segment of a tributary known as Small Wood Creek. Within this region, shallow water bodies with depths < 1.5 m were primarily situated near the shoreline and water channel 2. Water channel 1 and Small Wood Creek were deeper, with depths ranging from 2.5‒3 m. The main watercourse of the Ussuri River maintains depths of 4‒6 m. The bottom sediment in the area consists predominantly of muddy and sandy composition, with sandy soil prevailing along the main watercourse shoreline and sandy-gravel content in the upper reaches of Small Wood Creek. The vegetation along the shoreline was dominated by willow (Salix sp.), reed (Phragmites sp.), and sedge (Cyperus sp.). The climate of this area is cold temperate continental monsoon, characterized by distinct four seasons with a long cold winter and short warm summer. The average annual temperature is 3.5 ℃, with an extreme low temperature of -36.1 ℃ recorded in winter and an extreme high temperature of 35.2 ℃ recorded in summer. Most of the study area has retained its natural, undisturbed landscape, with only a small portion featuring an altered shoreline formed by piles of large boulders in the southern section. The human population density in this region is minimal, although it is frequently visited by fishermen engaged in fishing. A fishing settlement is located in the northern part of the research area, near the mouth of Small Wood Creek. Because the Ussuri River serves as a border between Russia and China, our study was confined to the Chinese side of the river, precluding the possibility of exploration on the Russian side.
Specially designed traps were deployed in this region to capture ASTs, and fish meat and guts were used as bait. Traps were checked and rebaited daily. However, because of the overall scarcity of ASTs in the Ussuri River (Chinese side), we did not catch a sufficient number of suitably sized specimens for our telemetry research. Therefore, we enlisted local fishers to assist in capturing ASTs to supplement our samples (Figure 2). When a novel specimen was obtained, we measured body mass with precision to the nearest gram with electronic scales, and plastron length (PL) was measured using tree calipers. Sex was distinguished on the basis of multiple characteristics similar to those of other soft-shell turtle species. To the best of our knowledge, there is no literature available on the means by which to determine the sexually mature size of ASTs. However, according to several observations of fishermen processing captured ASTs, we found that female Amur soft-shell turtles weighing around 900 g had begun to develop ovaries; whereas, males around 800 g had basically fully developed secondary sexual characteristics. Hence, we used this criterion to determine the sexual maturity of ASTs.
We attached high-frequency transmitters (164 MHz; AL-2F, Holohil Systems Ltd., Caro Ontario, Canada) onto the turtles by drilling holes in the posterior side of the carapace with a handheld electric drill and then fastening the transmitters in place using 2.60-mm wide zip ties threaded through the drilled holes (Figure 3). The radio transmitter weight did not exceed 8% of the body mass of the turtle. A TRX-1000S receiver (Carbondale, IL, USA) and three-element antenna were used to track the radio-tagged turtles. After releasing the turtles into the study region, they were allowed to acclimatize for 1 week before commencing the tracking procedure. Turtles were intensively tracked daily by boat and occasionally by wading from June, 2022 to mid-October, 2022, coinciding with the peak activity periods of ASTs in this region (Hou. Unpublished content) .Position data was recorded via a handheld global positioning system (GPS Garmin 60 CSX). On occasions where a close approach was not attainable, such as when the turtles ventured into the Russian side, locations were determined by triangulation from the nearest accessible areas to the turtles. We measured the daily water temperature using a substrate thermometer as a predictor variable for daily movement rates. Upon finishing the tracking study, all radio transmitters were carefully detached from the turtles and all turtles were released in good health. Our research was approved by the Fisheries Department of Hulin County.
2.2. Home Range Analysis
To study the spatial utilization of each radio-tracked AST, we calculated the linear range, 100% minimum convex polygon (MCP), and fixed kernel density estimates (KDE) at 50% and 95% levels. The linear range, as defined by Sexton [46], represents the direct distance between the two furthest locations and serves as an indicator of turtle activity intensity and capability over a given time period [39]. While the MCP method may offer graphical simplicity and exhibit reasonable comparison stability [34], it is important to note that this approach may include extensive areas that are never used by animals, as indicated by previous studies [24,55]. Kernel analysis uses a nonparametric probability density approach to estimate the home range size [55,56], which has the potential to reveal variations in the intensity of usage within the home range. A crucial aspect of kernel analysis is the selection of an appropriate value for the smoothing parameter h [50], which is predominantly addressed by two widely adopted methods: least-squares cross-validation (LSCV) and likelihood cross-validation (CVh) [56,57,50]. However, because of its perceived drawbacks and inferior performance [40,51,25,21], LSCV was generally discounted, and we selected CVh for calculate the smoothing parameter in our analysis. Smoothing parameters were calculated using an Animal Space Use Program [23]. According to the guidelines provided by Row and Blouin‒Demers [43], who advocated adjusting the smoothing parameter to achieve equivalence as much as possible between the 95% kernel area and the MCP area in home range size studies of herpetofauna to achieve a more accurate analysis. Hence, for comparison, we chose the calculated parameter that aligned 95% of the kernel area most closely with the corresponding MCP area for all turtles. We calculated the MCP and kernel density estimates using the minimum bounding geometry and kernel density tools in ArcGIS Pro [16]. For animals inhabiting linear habitats, area estimates often encompass substantial areas of unutilized space [3]; hence, we clipped the MCP and kernel density contours to the river [22]. Linear range (LR) size was calculated in Arcgis pro [16], and, as the species predominantly inhabits aquatic environments, LRs traversing terrestrial areas were adjusted to reflect the shortest distance through water [10]. The degree of home range overlap for each turtle was quantified as the proportion of its entire home range that intersected with the ranges of other turtles [18]. The analysis was performed using the ‘adehabitat’ package for Cran R [9]. The relationship between range size and body size was determined using Spearman’s rank correlation test. Significance was determined at α = 0.05.
On several occasions, radio transmitters were displaced from turtles by tangling to fish nets or twigs after a period of radio tracking, and we used bootstrapped MCP to determine whether the home range size for these turtles asymptoted with the acquired location data [20]. For each turtle, we employed a bootstrapping method to estimate the MCP home range area by incrementally adding radio-locations, with 100 iterations per increment, using 'Move' package [29]. To determine if the home range size became asymptotic, we used nonlinear regression with a monomolecular growth function [28] to estimate the asymptotic home range size. If the MCP home range size was ≥ 90% of the asymptote, this suggests that we had gathered a satisfactory number of radiolocations to precisely establish the individual's home range. Turtles exhibiting non-asymptotic MCP home ranges were disregarded for subsequent analyses.
2.3. Movement Analysis
Considering the predominant aquatic behavior of ASTs, we operated under the assumption that their movements were restricted to the river channel. We determined the movement distance (m) through the river using the least-cost path tools in ArcGIS Pro [16], which calculated the shortest path between consecutive points along a polygon representing the river. For points where the distances traversed land areas, we used polygon-to-raster tools in ArcGIS Pro [16] to compute the shortest curved pathways between points through the river channels. This method illustrates the minimal movement necessary to travel between these locations within river channels. Although the turtles may have taken more extended routes, quantifying such possibilities remains impossible. Therefore, we based our comparisons of movement rates on the minimum distance traveled between locations.
We calculated the daily movement rate in meters by dividing the distance between successive locations by the number of days. Subsequently, we computed the minimum, maximum, and mean movement rates for each turtle. To explore potential factors influencing the movement rate, we utilized a mixed-effects model. Predictor variables were chosen based on previous studies and our experience, and included water temperature [15], sex [2], LR, and PL. All continuous predictor variables were z-transformed and represented as standard deviation (SD) units. Seventeen candidate mixed-effects models were created to explain the movement rate (m/d). To assess the multicollinearity among the predictor variables, we computed the variance inflation factor (VIF) using the vif function from the R package usdm [36]. A VIF > 10 signified the presence of problematic multicollinearity [12] and required a reexamination of the variables. The null model consisted solely of the intercept, while the global model included all covariates and two-way interactions. We assessed the residual plot and histogram of the global model for patterns and normality. In instances where the assumptions of normality and variance posed challenges, we opted for a natural log transformation of the movement rate variable. Additionally, quadratic terms for water temperature were introduced to account for potential fluctuations in movement patterns, allowing for peaks and troughs to be accommodated. Individual turtles were included in the random-effects analysis. When conducting the analyses, we only included turtles with asymptotic home range sizes because we used the complete LR as a predictor variable. Mixed-effects models were generated in R version 4.2.0 [45] utilizing the lme4 package [6]. Model ranking was conducted using the AICC with the R package AICcmodavg [33]. Models falling within two AICC units of the top model received substantial support and were incorporated into their confidence sets [4]. For ranking mixed models, we employed maximum likelihood estimation, and restricted maximum likelihood was applied to the top model for parameter estimation. Strong predictors were identified as parameters with 95% confidence intervals (CIs) that did not broadly overlap with zero. The calculation of marginal and conditional R2 values was performed using the r.squaredGLMM function in the R package MuMIn [35,7].
3. Results
We attached radio transmitters to 12 subadults (seven females and five males, weighing 520‒680 g) and 7 adults (three males and four females, weighing 910–2950 g). The mean PL for subadults was 13.9 ± 0.43 (SD) cm and that for adults was 22.11 ± 4.30 (SD) cm (Table A1). We acquired a complete home range for 8 of the 12 subadults; however, no complete home range was obtained for any adult (Figure 4, Table A1). Subadults weighing < 700 g tended to primarily inhabit the edge area, restricting their movement to the vegetated shoreline and slow-velocity water channels. They rarely ventured into deep open water for unknown reasons and easily established a home range within our study area. Unfortunately, our study was greatly influenced by intense fishing activities in this area, leading to a notable effect as evidenced by entanglement of some specimens in fish nets, causing detachment of radio transmitters. In contrast to subadult ASTs, adults, particularly those of a large size, exhibited a tendency to explore deeper water areas. Unlike younger turtles, mature turtles never confined their active range to the shoreline and water channels. Compelling evidence suggested that adult turtles, particularly larger ones, confidently utilized both sides of the river, extending their home range well into the Russian territory, which was inaccessible during this study due to permit restrictions. In addition, the telemetry study showed that large adults could rapidly move large distances. On several occasions, signals from adult ASTs vanished within the second or third day post-release (Table A1) despite comprehensive searches conducted several kilometers upstream and downstream. Limitations in equipment and personnel constrained us from regularly extending the search beyond 10 km, and we were unable to cross the middle line of the river into the Russian territory. Hence, determining whether these adults migrated to the waterways on the Russian side, or traveled an extensive long distance upstream or downstream, remains challenging. A total of 672 locations were recorded between June 20 and October 10, 2022, for all turtles. No mortality was observed during the study period.
3.1. Home Range Analysis
Clipped KDE, MCP, and LR were calculated for eight subadult turtles for which the complete home range size was achieved, along with two adult turtles (ID 13 and 14) with > 10 locations for comparison (Figure 5). The chosen calculated CVh smoothing parameter was 17 for eight subadults and 120 for two adults. The number of core areas (clipped 50% KDE CVh) varied from 1‒5 for all turtles.
The mean LR size was 693 ± 238 (SD) m and ranged from 388‒1145 m among the eight subadults, with a coefficient of variation (CV) of 34% (Table A1; Figure 5). There was no statistically significant relationship between LR and either PL or Body Mass (BM) (LR and PL: rs = -4.52, p = 0.27, n = 8; LR and BM: rs = -0.429, p = 0.27, n = 8). Sizes of MCPs among eight subadults ranged from 1.30–3.65 ha (CV = 35%) with a mean of 2.03 ± 0.72 (SD) ha (Table A1; Figure 5). There was no significant relationship between MCP size and body size (MCP and PL: rs = -0.286, p = 0.5, n = 8; MCP and BM: rs = -0.262, p = 0.54, n = 8). 95% and 50% KDE ranged from 0.66‒2.07 ha (CV = 43%) and 0.07‒0.18 ha (CV = 34%), respectively, with mean sizes of 1.02 ± 0.44 (SD) ha and 0.099 ± 0.034 (SD), respectively (Table A1; Figure 5). No significant relationships between KDE and body size for eight subadults turtles were observed (95% KDE and PL: rs = -0.443, p = 0.27, n = 8; 95% KDE and BM: rs = -0.335, p = 0.42, n = 8; 50% KDE and PL: rs = -0.449, p = 0.27, n = 8; 50% KDE and BM: rs = -0.424, p = 0.29, n = 8).
The MCP of each turtle overlapped with the MCPs of 3–7 other turtles (mean = 0.91 ± 0.57 ha SD, n = 8). Mean MCP overlap areas varied from 0.65 ± 0.43 (SD) ha to 1.73 ± 0.45 (SD) ha. The total 95% KDEs overlapped with 3–7 other turtles (mean = 0.48 ± 0.23 [SD] ha, n = 8), with mean areas of overlap ranging from 0.28 ± 0.10 (SD) ha to 0.77 ± 0.33 (SD) ha. The 50% KDEs overlapped with 2–7 core areas of other turtles (mean = 0.047 ± 0.021 [SD] ha [n = 8]), with mean areas of overlap ranging from 0.024 ± 0.008 (SD) ha to 0.078 ± 0.008 (SD) ha (Table 1).
3.2. Movement Analysis
We used eight subadult turtles with complete home range sizes for movement analysis. The turtles exhibited infrequent extended stays at single locations. The count of movements recorded for each turtle ranged from 57 to 78, minimum movement rates varied from 8.5‒18.6 m/day for all turtles, and maximum movement rates varied from 89.9‒275.6 m/day for all turtles (Table A1). Furthermore, telemetry studies of limited locations acquired from individuals 13 and 14 revealed that the daily distances traveled by adults were significantly greater than those travelled by immature ASTs (Table A1). However, we did not obtain sufficient data to analyze this phenomenon in a systematic and in-depth manner.
All predictor variables in our movement rate models exhibited VIF values of <3.2, suggesting that multicollinearity was not problematic. To normalize the data, we employed a natural log transformation of movement rates (back-transformed after analyzing the figures).
The top mixed effects model for movement rate was “Global model” (Table 2 and Table A2). Both LR and water temperature showed confidence intervals that did not overlap with zero (Table 3). Movement rate was positively correlated with LR and water temperature (Figure 6). The rest interaction terms showed less pronounced effects, with confidence intervals largely overlapping zero (Table 3).
4. Discussion
4.1. Home Range
The rationale behind selecting this study area stemmed from catch records supplied by local fishermen. These records revealed that turtles were sporadically encountered at this specific location; whereas, turtles were seldom or never captured in other adjacent river sections. This information led us to infer that this particular area is the preferred habitat for ASTs, rendering it an ideal location for ecological studies.
Among the eight subadult ASTs that established a complete home range in the study area, the individual LRs exhibited considerable variability, ranging from 388‒1145 m. This notable divergence in LRs between individuals has also been observed in other soft-shell turtle species [37,44]. The MCP estimator yields values ranged from 1.30‒3.65 ha. It is worth noting that this method may encompass areas that animals have never used, potentially resulting in overestimation of the actual range size. Despite this limitation, the MCP is widely employed for home range estimates and is commonly used to enable inter- and intra-species comparisons across various studies [42,26]. The KDEs also encompassed areas not utilized by turtles, but to a much lesser extent. Clipping the KDE to the river boundary helped define a more accurate representation of space utilization [22]. Notably, KDEs using CVh smoothing yielded larger estimates than those using LSCV smoothing. LSCVs tend to be under-smoothed [21], which may result in unrealistically fragmented home ranges [53] . There is no consensus on the optimal smoothing parameter, and the under-smoothing of LSCV does not offer reasonable areas of activity for this highly mobile species. We assert that clipping 95% KDE using CVh smoothing provided a meaningful home range estimate for ASTs, with the clipped 50% KDE (CVh) representing core areas [26]. Some AST home ranges included a few core areas, whereas those of others included several. This variation is not surprising considering the differences observed in home range sizes. It is widely accepted that animals often demonstrate multimodal home ranges [5] and space use often varies along a continuum from sedentary to nomadic [32]. In general, turtles employ diverse foraging tactics, likely influenced by balancing trade-offs in utilizing various resources [52], leading to variations in home ranges among individuals.
Serial autocorrelation, wherein radio-locations exhibit partial dependence on previous locations, has the potential to compromise the validity of home range estimates [49]. This effect was most pronounced when locations were recorded at very short time intervals, restricting the animals from moving to different areas. In our study, we mitigated autocorrelation concerns, as radiographs were never taken on the same day, and the ASTs demonstrated the capability of traversing large distances in a short time. To define a complete home range with sufficient samples, the home range size must reach an asymptotic value for animals that exhibit limited wandering or nomadic behavior [27,20]. Home ranges for subadult ASTs that were never interrupted or were interrupted by fishing activity after an extensive radio tracking period would be asymptotic with a well-defined home range, indicating that immature ASTs did not behave nomadically. This is likely because of the tendency of subadult ASTs to restrict their range to specific areas near the shoreline with abundant vegetation and calm shallow water bodies.
There was a certain extent of home range overlap among subadult ASTs. Spearman's rank correlation analysis revealed no association between home range size and body size. This lack of correlation may have been attributed to the fact that the analyzed individuals were in approximately the same weight range with small variations, making it challenging to discern a meaningful relationship between home range size and body size. Nevertheless, body size may be an important factor when considering large numbers of individuals.
4.2. Movement
The magnitude of river turtle movement varies depending on the life history requirements related to foraging, reproduction, and survival [31]. The active period for ASTs is from mid-May to mid-October (Hou, Unpublished content); therefore, our study covered the most active period. Turtles were rarely inactive during the tracking period, and adult and subadult ASTs differed significantly in their daily movement patterns. Although the location data for adult ASTs were limited, the available information indicated that both the mean and maximum daily movement rates of subadult ASTs were considerably lower than those of their adult counterparts. The reason for the shorter daily movement rate in subadults may have been based on the following three points: First, these subadults were reluctant to enter open deep water because they mainly confined their active range to a relatively limited area surrounded by deep water, rendering frequent and extensive movement unnecessary. Water body size is believed to play an important role in determining the overall magnitude of movement of riverine organisms [58]. Moreover, variations in resource distribution can lead to diverse movement patterns with densely concentrated resources contributing to reduced movement rates [32]. These vegetated shorelines and slow-velocity water channels provide a rich habitat for small organisms such as insect larvae, crustaceans, mollusks, snails, amphibians, and small fish [13], which are potential prey for juvenile ASTs, diminishing their necessity to cover extensive distances in the search for food. Another possible explanation is that immature ASTs are not subjected to breeding pressures, unlike adults who must cover greater distances to search for mates or suitable egg-laying sites [17]. Consequently, this lack of breeding-induced impulsion may lead immature ASTs to adopt a distinct movement pattern compared to that of adults.
The telemetry data acquired for adult ASTs indicated that they did not restrict their range to shallow, nearshore areas with abundant vegetation or water channels. The daily movement rates of adult ASTs observed in our study were similar to those documented for adult smooth soft-shell turtles (Apalone mutica) in the Kaskaskia River in Illinois, North America [44]. However, this previous study did not include subadults; therefore, we could not make a relevant comparison. Some sudden loss of signals from several larger adults within a brief period is likely attributable to an escape response triggered by the stress induced by capture and relocation [37]. Notably, one released adult female (2720 g) was recaptured the following spring 55 km upstream with the radio transmitter still attached; this distance was beyond our tracking capabilities.
The mixed-effects model showed a significant positive correlation between water temperature and the daily movement rate. We observed no discernible peak in the movement rate at intermediate temperatures, which was followed by a decline as the temperature increased further [38,30,44]. This may have been attributed to the relatively low water temperatures in the study area, which is characterized by a temperate climate. The maximum water temperature in summer in our study area does not exceed 26 ℃, which does not impose thermal inhibition on the activity level of ASTs. Consequently, it is reasonable that the movement rate of ASTs inhabiting this region exhibited a monotonous positive correlation with water temperature without experiencing estivation owing to excessively high water temperatures, as observed in other freshwater turtle species from warmer climates [14]. Another factor showing a positive correlation with the daily movement rate was LR, which serves as an indicator of the active range of animals[39]. Notably, individuals with an LR of 1145 m also had the highest average daily movement rate. This correlation indicated that ASTs with broader activity ranges also demonstrated greater mobility. Such varied movement patterns among animals residing in the same habitat have shown the potential for diverse strategies for resource exploration among different individuals [41,19].
4.3. Conservation and Management
Based on our investigation, we found a lack of awareness regarding the uniqueness and rarity of ASTs among local residents, who often mistake ASTs for common consumable Chinese soft-shelled turtles (Pelodiscus sinensis). Unfortunately, this misconception results in the total absence of protective measures from local authorities. Consequently, there are no constraints on hunting and selling ASTs, which further exacerbates the decline of this endangered species. Relevant protection measures must be implemented immediately to avoid further population decline. Moreover, these vital shallowly vegetated shorelines and undisturbed water channels play crucial roles in the survival of immature ASTs. Unfortunately, these areas also experienced more intense fishing activities, which had a severe negative effect on the immature turtles residing there. The recurrent use of fishing nets in these critical zones resulted in entanglement of several subadult specimens during the study. Frequent fishing activities in these essential habitats can have a substantial detrimental effect on the long-term survival of ASTs in the Ussuri River.
Because of the intense fishing activities along the Chinese stretch of the Ussuri River, the AST population has suffered severe setbacks. We speculated that the persistence of the AST population in the Ussuri River was primarily because the opposite Russian territory remained virtually untouched and free from human interference or fishing activities, creating a crucial sanctuary for sustenance of the population. Despite this, the AST population in the Ussuri River remains at risk of collapse due to intense anthropogenic impacts on the Chinese side of the river. Hence, it is imperative to protect ASTs in China, particularly in areas that are critical for survival of immature turtles.
5. Conclusions
Given the constraints inherent to our study, we were only able to delineate the home ranges and movement patterns of subadult ASTs. Nonetheless, the importance of the immature phase in the life cycle of organisms cannot be overlooked and exploring the ecological characteristics of immature individuals has significant biological value. To comprehensively understand the ecology of ASTs at various life stages, future research should focus on home range and other ecological facets of adult ASTs. This may require a heightened commitment of labor, equipment, financial resources, and additional administration to conduct comprehensive telemetry studies spanning both Chinese and Russian territories. Notably, our findings underscore the need to preserve vital undisturbed areas for the survival of immature ASTs and urge future conservation efforts to focus on these specific habitats.
Finally, major flooding occurred at the end of our study, which forced cessation of our investigation. The effect of extended overbank flow on the movement and home ranges of turtles remains uncertain. Whether immature ASTs would utilize such flooding events for dispersal migration remains unknown. Further studies should examine the spatial ecology of ASTs during major flood events to determine how movement rates and home range sizes are affected.
Author Contributions
X.H.: Conceptualization; Data curation; Formal Analysis; Investigation; Methodology; Writing-original draft. H.S.: Funding acquisition; Project administration; Supervision; Writing-review & editing. All authors have read and agreed to the published version of the manuscript.
Funding
This research was funded by the National Natural Science Foundation of the People’s Republic of China [grant numbers 32170532 to H.S.].
Institutional Review Board Statement
Fieldwork was carried out in strict accordance with the guidelines of the Animal Research Ethics Committee of the Hainan Provincial Education Center for Ecology and Environment, Hainan Normal University (HNECEE-2016-005), which conforms to the Law of the People’ s Republic of China. No turtles were euthanized or injured for this study. All turtles were released in the original capture area at the end of the experiment.
Data Availability Statement
Data will be made available upon request.
Acknowledgments
The authors are grateful to Xue Song for her assistance with the fieldwork.
Conflicts of Interest
The authors declare no conflict of interest.
Appendix A

Table A1.
ID number, age group, sex, plastron length (cm, PL), body mass (g) number of radio-locations (n), linear range (m), minimum movement rate (m/day, Min Move), maximum movement rate (m/day, Max Move), mean movement rate (m/day, Mean Move), mean movement, standard deviation (Move SD), minimum convex polygon size (ha, MCP), clipped 95% KDE (CVh smoothing, ha), clipped 50% KDE (CVh smoothing, ha), home range proportion of asymptotic size (Prop. Asy.), and the final destination (End) for P. maackii radio-tracked in the Ussuri River, China in 2022.
| ID | Age group | Sex | PL | Body mass | Locations | Linear Range | Min Move | Max Move | Mean Move | Move SD | MCP | KDE 95% | KDE 50% |
Prop. Asy. |
End |
|---|---|---|---|---|---|---|---|---|---|---|---|---|---|---|---|
| 1 | Sub adult | Male | 13.8 | 560 | 68 | 615 | 14 | 137.4 | 60.25 | 28.77 | 1.79 | 0.86 | 0.09 | 1.01 | complete home range, released at the end |
| 2 | Sub adult | Male | 14 | 590 | 55 | 672 | 10.8 | 118.9 | 61.58 | 26.08 | 1.77 | 0.68 | 0.08 | 1.01 | complete home range caught by fish net and released |
| 3 | Sub adult | Male | 13 | 520 | 59 | 624 | 16.1 | 113.8 | 57.86 | 23.83 | 1.65 | 0.97 | 0.11 | 1.01 | complete home range, released at the end |
| 4 | Sub adult | Female | 13.6 | 580 | 67 | 1145 | 18.6 | 275.6 | 72.45 | 29.36 | 3.65 | 2.07 | 0.18 | 0.96 | complete home range, released at the end |
| 5 | Sub adult | Female | 14.3 | 617 | 62 | 388 | 10.8 | 89.9 | 48.12 | 19.64 | 1.30 | 0.66 | 0.07 | 1.01 | complete home range, released at the end |
| 6 | Sub adult | Female | 13.5 | 550 | 70 | 995 | 15.2 | 158.5 | 62.25 | 26.41 | 1.80 | 0.78 | 0.08 | 1.03 | complete home range, released at the end |
| 7 | Sub adult | Male | 14.2 | 615 | 75 | 632 | 9.2 | 133.7 | 49.77 | 22.58 | 2.71 | 1.32 | 0.11 | 0.92 | complete home range, released at the end |
| 8 | Sub adult | Female | 13.9 | 600 | 65 | 473 | 8.5 | 94.6 | 39.18 | 20.04 | 1.58 | 0.78 | 0.07 | 1.01 | complete home range, released at the end |
| 9 | Sub adult | Female | 14.6 | 680 | 29 | * | * | * | * | * | * | * | * | 0.58 | incomplete home range radio transmitter peeled off by fish net and released |
| 10 | Sub adult | Female | 14 | 600 | 18 | * | * | * | * | * | * | * | * | 0.68 | incomplete home range radio transmitter peeled off by fish net and released |
| 11 | Sub adult | Female | 13.7 | 578 | 30 | * | * | * | * | * | * | * | * | 0.70 | incomplete home range radio transmitter peeled off by fish net and escaped |
| 12 | Sub adult | Male | 14.5 | 620 | 32 | * | * | * | * | * | * | * | * | 0.69 | incomplete home range radio transmitter peeled off by unknown reason |
| 13 | Adult | Female | 16.8 | 1000 | 14 | * | 98.2 | 345.3 | 178.2 | * | * | * | 0.45 | incomplete home range signal stayed on Russia side | |
| 14 | Adult | Male | 17 | 1230 | 11 | * | 89.5 | 420.2 | 159.6 | * | * | * | 0.50 | incomplete home range signal disappeared after 11 locations | |
| 15 | Adult | Female | 22 | 2000 | 1 | * | * | * | * | * | * | * | * | * | signal disappeared the second day |
| 16 | Adult | Female | 26 | 2720 | 1 | * | * | * | * | * | * | * | * | * | signal disappeared the second day |
| 17 | Adult | Male | 19.5 | 1880 | 3 | * | * | * | * | * | * | * | * | * | signal disappeared the fourth day |
| 18 | Adult | Male | 24.5 | 2450 | 1 | * | * | * | * | * | * | * | * | * | signal disappeared the second day |
| 19 | Adult | Female | 29 | 2950 | 1 | * | * | * | * | * | * | * | * | * | signal disappeared the second day |
Appendix B
Table A2.
Model name and general structure for the 17 mixed-effects models describing the movement rate (m/day) of radio-tracked P. maackii in the Ussuri River, China, 2022 (W = water temperature; PL = plaque length; LR = linear home range; ID = turtle ID).
Table A2.
Model name and general structure for the 17 mixed-effects models describing the movement rate (m/day) of radio-tracked P. maackii in the Ussuri River, China, 2022 (W = water temperature; PL = plaque length; LR = linear home range; ID = turtle ID).
| Model Name | Structure |
|---|---|
| Global | 1+W+W2+LR+Sex+PL+W*LR+W*PL+W*Sex+1|id |
| Temp. and linear home range interaction | 1+W+W2+LR+W*LR+1|id |
| Temp., linear home range, and sex interaction | 1+W+W2+LR+Sex+W*LR+W*Sex+1|id |
| Temp., linear home range, and body size interaction | 1+W+W2+LR+PL+W*LR+W*PL+1|id |
| Temp., sex, and body size interaction | 1+W+W2+Sex+PL+W*Sex+W*PL+1|id |
| Temp. and linear home range | 1+W+W2+LR+1|id |
| Temp. and linear home range linear effect and interaction | 1+W+LR+W*LR+1|id |
| Temp. | 1+W+W2+1|id |
| Temp., sex, and body size | 1+W+W2+Sex+PL+1|id |
| Main linear effect | 1+W+LR+Sex+PL+1|id |
| Temp. and sex interaction | 1+W+W2+Sex+W*Sex+1|id |
| Temp. and body size interaction | 1+W+W2+PL+W*PL+1|id |
| Temp. and linear home range linear effect | 1+W+LR+1|id |
| Temp., sex, and body size linear effect | 1+W+Sex+PL+1|id |
| Temp. and sex | 1+W+W2+Sex+1|id |
| Temp. and body size | 1+W+W2+PL+1|id |
| Null | 1+1|id |
References
- Brandt, J.F. Observationes quaedam ad generis trionychum species duas novas spectantes. Bull. Acad. Imper. Sci. St. Petersbourg Cl. Phys.-Mathemat 1857, 16: 110-111.
- Bodie, J.R.; Semlitsch, R.D. Spatial and temporal use of floodplain habitats by lentic and lotic species of aquatic turtles. Oecologia 2000, 122: 138-146. [CrossRef]
- Blundell, G.M.; Maier, J.A.K.; Debevec, E.M. Linear home ranges: effects of smoothing, sample size, and autocorrelation on kernel estimates. Ecological monographs 2001, 71(3): 469-489.
- Burnham, K.P.; Anderson, D.R. Model Selection and Multimodel Inference: A Practical Information—Theoretic Approach, 2nd ed.; Springer-Verlag: New York, NY, USA, 2002; pp. 1–488.
- Börger, L.; Dalziel, B.D.; Fryxell, J.M. Are there general mechanisms of animal home range behaviour? A review and prospects for future research. Ecology letters 2008, 11(6): 637-650. [CrossRef]
- Bates, M.M.; Bolker, B.; Walker, S. Fitting linear mixed-effects models using lme4. Journal of Statistical Software 2015, 67(1): 1-48.
- Barton, B., 2019. K. MuMIn: Multi-Model Inference. R Package Version 1.42.1. Available online: https://CRAN.R-project.org/package=MuMIn.
- Baek, H.; Kim, P.; Kim, Y.C.; et al. The complete mitochondrial genome of the Amur soft-shelled turtle (Pelodiscus maackii Brandt, 1858), from South Korea. Mitochondrial DNA Part B 2022, 7(3): 498-500.
- Calenge, C. The package adehabitat for the R software: a tool for the analysis of space and habitat use by animals. Ecol. Model 2006, 197, 516–519. [CrossRef]
- Carrière, M.A. Movement patterns and habitat selection of common map turtles (Graptemys geographica) in St.Lawrence Islands National Park, Ontario, Canada. MSc Thesis, University of Ottawa, Ottawa, Canada,., 2007.
- Chang, M.H.; Song J.Y.; Koo, K.S. The Status of Distribution for Native Freshwater Turtles in Korea, with Remarks on Taxonomic Position. Korean J. Environ. Biol 2012, 30, 151-155.
- Dormann, C.F.; Elith, J.; Bacher, S.; et al. Collinearity: a review of methods to deal with it and a simulation study evaluating their performance. Ecography 2013, 36(1): 27-46.
- Duncan, M.B. Distributions of small nongame fishes in the lower Yellowstone River. The American Midland Naturalist 2016, 175(1): 1-23. [CrossRef]
- Ernst, C.H. Environmental temperatures and activities in wild spotted turtles, Clemmys guttata. Journal of Herpetology 1982: 112-120. [CrossRef]
- Ernst, C.H.; Lovich, J.E. Turtles of the United States and Canada, 2nd ed., The Johns Hopkins University Pres:Baltimore, MD, USA, 2009; pp. 1–827.
- ESRI, 2022. ArcGis Pro 3.0.1. Environmental Systems Research Institute, Redlands, CA.
- Gibbons, J.W. Movement patterns among turtle populations: applicability to management of the desert tortoise. Herpetologica 1986: 104-113.
- Geffen, E.; Mendelssohn, H. Home range use and seasonal movements of the Egyptian tortoise (Testudo kleinmanni) in the northwestern Negev, Israel. Herpetologica 1988: 354-359.
- Gibbons, J.W. The slider turtle. In Life History and Ecology of the Slider Turtle; Gibbons, J.W., Ed., Smithsonian Institution Press: Washington, DC, USA, 1990; pp. 3–18.
- Harris, S.; Cresswell, W. J.; Forde, P.G.; et al. Home-range analysis using radio-tracking data–a review of problems and techniques particularly as applied to the study of mammals. Mammal review 1990, 20(2-3): 97-123.
- Horne, J.S.; Garton, E.O. Likelihood cross-validation versus least squares cross-validation for choosing the smoothing parameter in kernel home-range analysis. The Journal of Wildlife Management 2006, 70(3): 641-648. [CrossRef]
- Hodder, K.H.; Masters, J.E.G.; Beaumont, W.R.C.; Gozlan, R.E.; Pinder, A.C.; Knight, C.M.; Kenward, R.E. Techniques for evaluating the spatial behaviour of river fish. Hydrobiologia 2007, 582, 257–269. [CrossRef]
- Horne, J.S.; Garton, E.O. 2015. Animal Space Use 1.3. Available online: http://www.webpages.uidaho.edu/population_ecology/animal_space_use.htm (accessed on 13 February 2015).
- Jennrich, R.I.; Turner, F.B. Measurement of non-circular home range. Journal of theoretical Biology 1969, 22(2): 227-237. [CrossRef]
- Jones, M.C.; Marron, J.S.; Sheather, S.J. A brief survey of bandwidth selection for density estimation. Journal of the American statistical association 1996, 91(433): 401-407.
- Kenward, R.E. A Manual for Wildlife Radio Tagging. London: Academic Press, 2001; pp. 1-311.
- .Kernohan, B.J.; Gitzen, R.A.; Millspaugh, J.J. Analysis of animal space use and movements. In Radio Tracking and Animal Populations; Millspaugh, J.J., Marzluff, J.M., Eds., Academic Press: San Diego, CA, USA, 2001; pp. 125–166.
- Koya, P.R.; Goshu, A.T. Solutions of rate-state equation describing biological growths. American Journal of Mathematics and Statistics 2013, 3(6): 305-311.
- Kranstauber, B.; Smolla, M.; Scharf, A. move: Visualizing and Analyzing Animal Track Data_. R package version 4.2.2, 2023.
- Lovich, J.E. Geographic variation in the seasonal activity cycle of spotted turtles, Clemmys guttata. Journal of Herpetology 1988, 22(4): 482-485. [CrossRef]
- Moll, D.; Moll, E.O. The Ecology, Exploitation and Conservation of River Turtles; Oxford University Pres:New York, NY, USA, 2004; pp. 1–393.
- Mueller, T.; Fagan, W.F. Search and navigation in dynamic environments–from individual behaviors to population distributions. Oikos 2008, 117(5): 654-664. [CrossRef]
- Mazerolle, M.J. Model selection and multimodel inference using the AICcmodavg package. R Vignette 2020, 2020: 22.
- Nilsen, E.B.; Pedersen, S.; Linnell, J.D.C. Can minimum convex polygon home ranges be used to draw biologically meaningful conclusions?. Ecological research 2008, 23: 635-639. [CrossRef]
- Nakagawa, S.; Schielzeth, H. A general and simple method for obtaining R2 from generalized linear mixed-effects models. Methods in ecology and evolution 2013, 4(2): 133-142.
- Naimi, B.; Hamm, N.A.S.; Groen, T.A.; et al. Where is positional uncertainty a problem for species distribution modelling?. Ecography 2014, 37(2): 191-203. [CrossRef]
- Plummer, M.V.; Shirer, H.W. Movement Patterns in A River Population of the Softshell Turtle, Trionyx Muticus; Occasional Papers of the Museum of Natural History 1975.; The University of Kansas: Lawrence, KS, USA, 43, pp. 1–26.
- Plummer, M.V. Activity, habitat and population structure in the turtle, Trionyx muticus. Copeia 1977: 431-440. [CrossRef]
- Pluto, T.G.; Bellis, E.D. Seasonal and annual movements of riverine map turtles, Graptemys geographica. Journal of Herpetology 1988: 152-158. [CrossRef]
- Park, B.U.; Marron, J.S. Comparison of data-driven bandwidth selectors. Journal of the American Statistical Association 1990, 85(409): 66-72.
- Plummer, M.V.; Mills, N.E.; Allen, S.L. Activity, habitat, and movement patterns of softshell turtles (Trionyx spiniferus) in a small stream. Chelonian Conservation and Biology 1997, 2: 514-520.
- Powell, R.A. Animal home ranges and territories and home range estimators. Research techniques in animal ecology: controversies and consequences, 2000; 442: 65-110.
- Row, J.R.; Blouin-Demers, G. Kernels are not accurate estimators of home-range size for herpetofauna. Copeia 2006, 2006(4): 797-802. [CrossRef]
- Ross, J.P.; Bluett, R.D.; Dreslik, M.J. Movement and home range of the smooth softshell turtle (Apalone mutica): Spatial ecology of a river specialist. Diversity 2019, 11(8): 124. [CrossRef]
- R Core Team, 2021. R: A language and environment for statistical computing. R Foundation for Statistical Computing, Vienna, Austria. URL https://www.R-project.org/.
- Sexton, O.J. Spatial and temporal movements of a population of the painted turtle, Chrysemys picta marginata (Agassiz). Ecological Monographs 1959, 29(2): 113-140. [CrossRef]
- Stejneger, L. Herpetology of Japan and adjacent territory. Government Printing Office, Washington DC, 1907. [CrossRef]
- Sutcliffe, A.G.; Poole, T.B. An experimental analysis of social interaction in the common marmoset (Callithrix jacchus jacchus). International Journal of Primatology 1984, 5: 591-607. [CrossRef]
- Swihart, R.K.; Slade, N.A. Influence of sampling interval on estimates of home-range size. The Journal of Wildlife Management 1985: 1019-1025. [CrossRef]
- Silverman, B.W. Density estimation for statistics and data analysis. Chapman & Hall, London, United Kingdom, 1986.
- Sain, S.R.; Baggerly, K.A.; Scott, D.W. Cross-validation of multivariate densities. Journal of the American Statistical Association 1994, 89(427): 807-817.
- Svanbäck R.; Bolnick, D.I. Intraspecific competition affects the strength of individual specialization: an optimal diet theory method. Evolutionary Ecology Research 2005, 7(7): 993-1012.
- Steury, T.D.; McCarthy, J.E.; Roth, T.C.; et al. Evaluation of Root-n Bandwidth Selectors for Kernel Density Estimation. The Journal of Wildlife Management 2010, 74(3): 539-548. [CrossRef]
- Suzuki D; Hikida T. Taxonomic status of the soft-shell turtle populations in Japan: a molecular approach. Current herpetology 2014, 33(2): 171-179. [CrossRef]
- Worton, B.J. A review of models of home range for animal movement. Ecological modelling 1987, 38(3-4): 277-298. [CrossRef]
- Worton, B.J. Kernel methods for estimating the utilization distribution in home-range studies. Ecology 1989, 70(1): 164-168. [CrossRef]
- Worton, B.J. Using Monte Carlo simulation to evaluate kernel-based home range estimators. The Journal of wildlife management 1995: 794-800. [CrossRef]
- Woolnough, D.A.; Downing, J.A.; Newton, T.J. Fish movement and habitat use depends on water body size and shape. Ecology of Freshwater Fish 2009, 18(1): 83-91. [CrossRef]
Figure 1.
Heilongjiang Province, China. The red dot indicates the study site in the Ussuri River and the red square denotes the research area. Maps were designed using ArcGis Pro [16].
Figure 1.
Heilongjiang Province, China. The red dot indicates the study site in the Ussuri River and the red square denotes the research area. Maps were designed using ArcGis Pro [16].
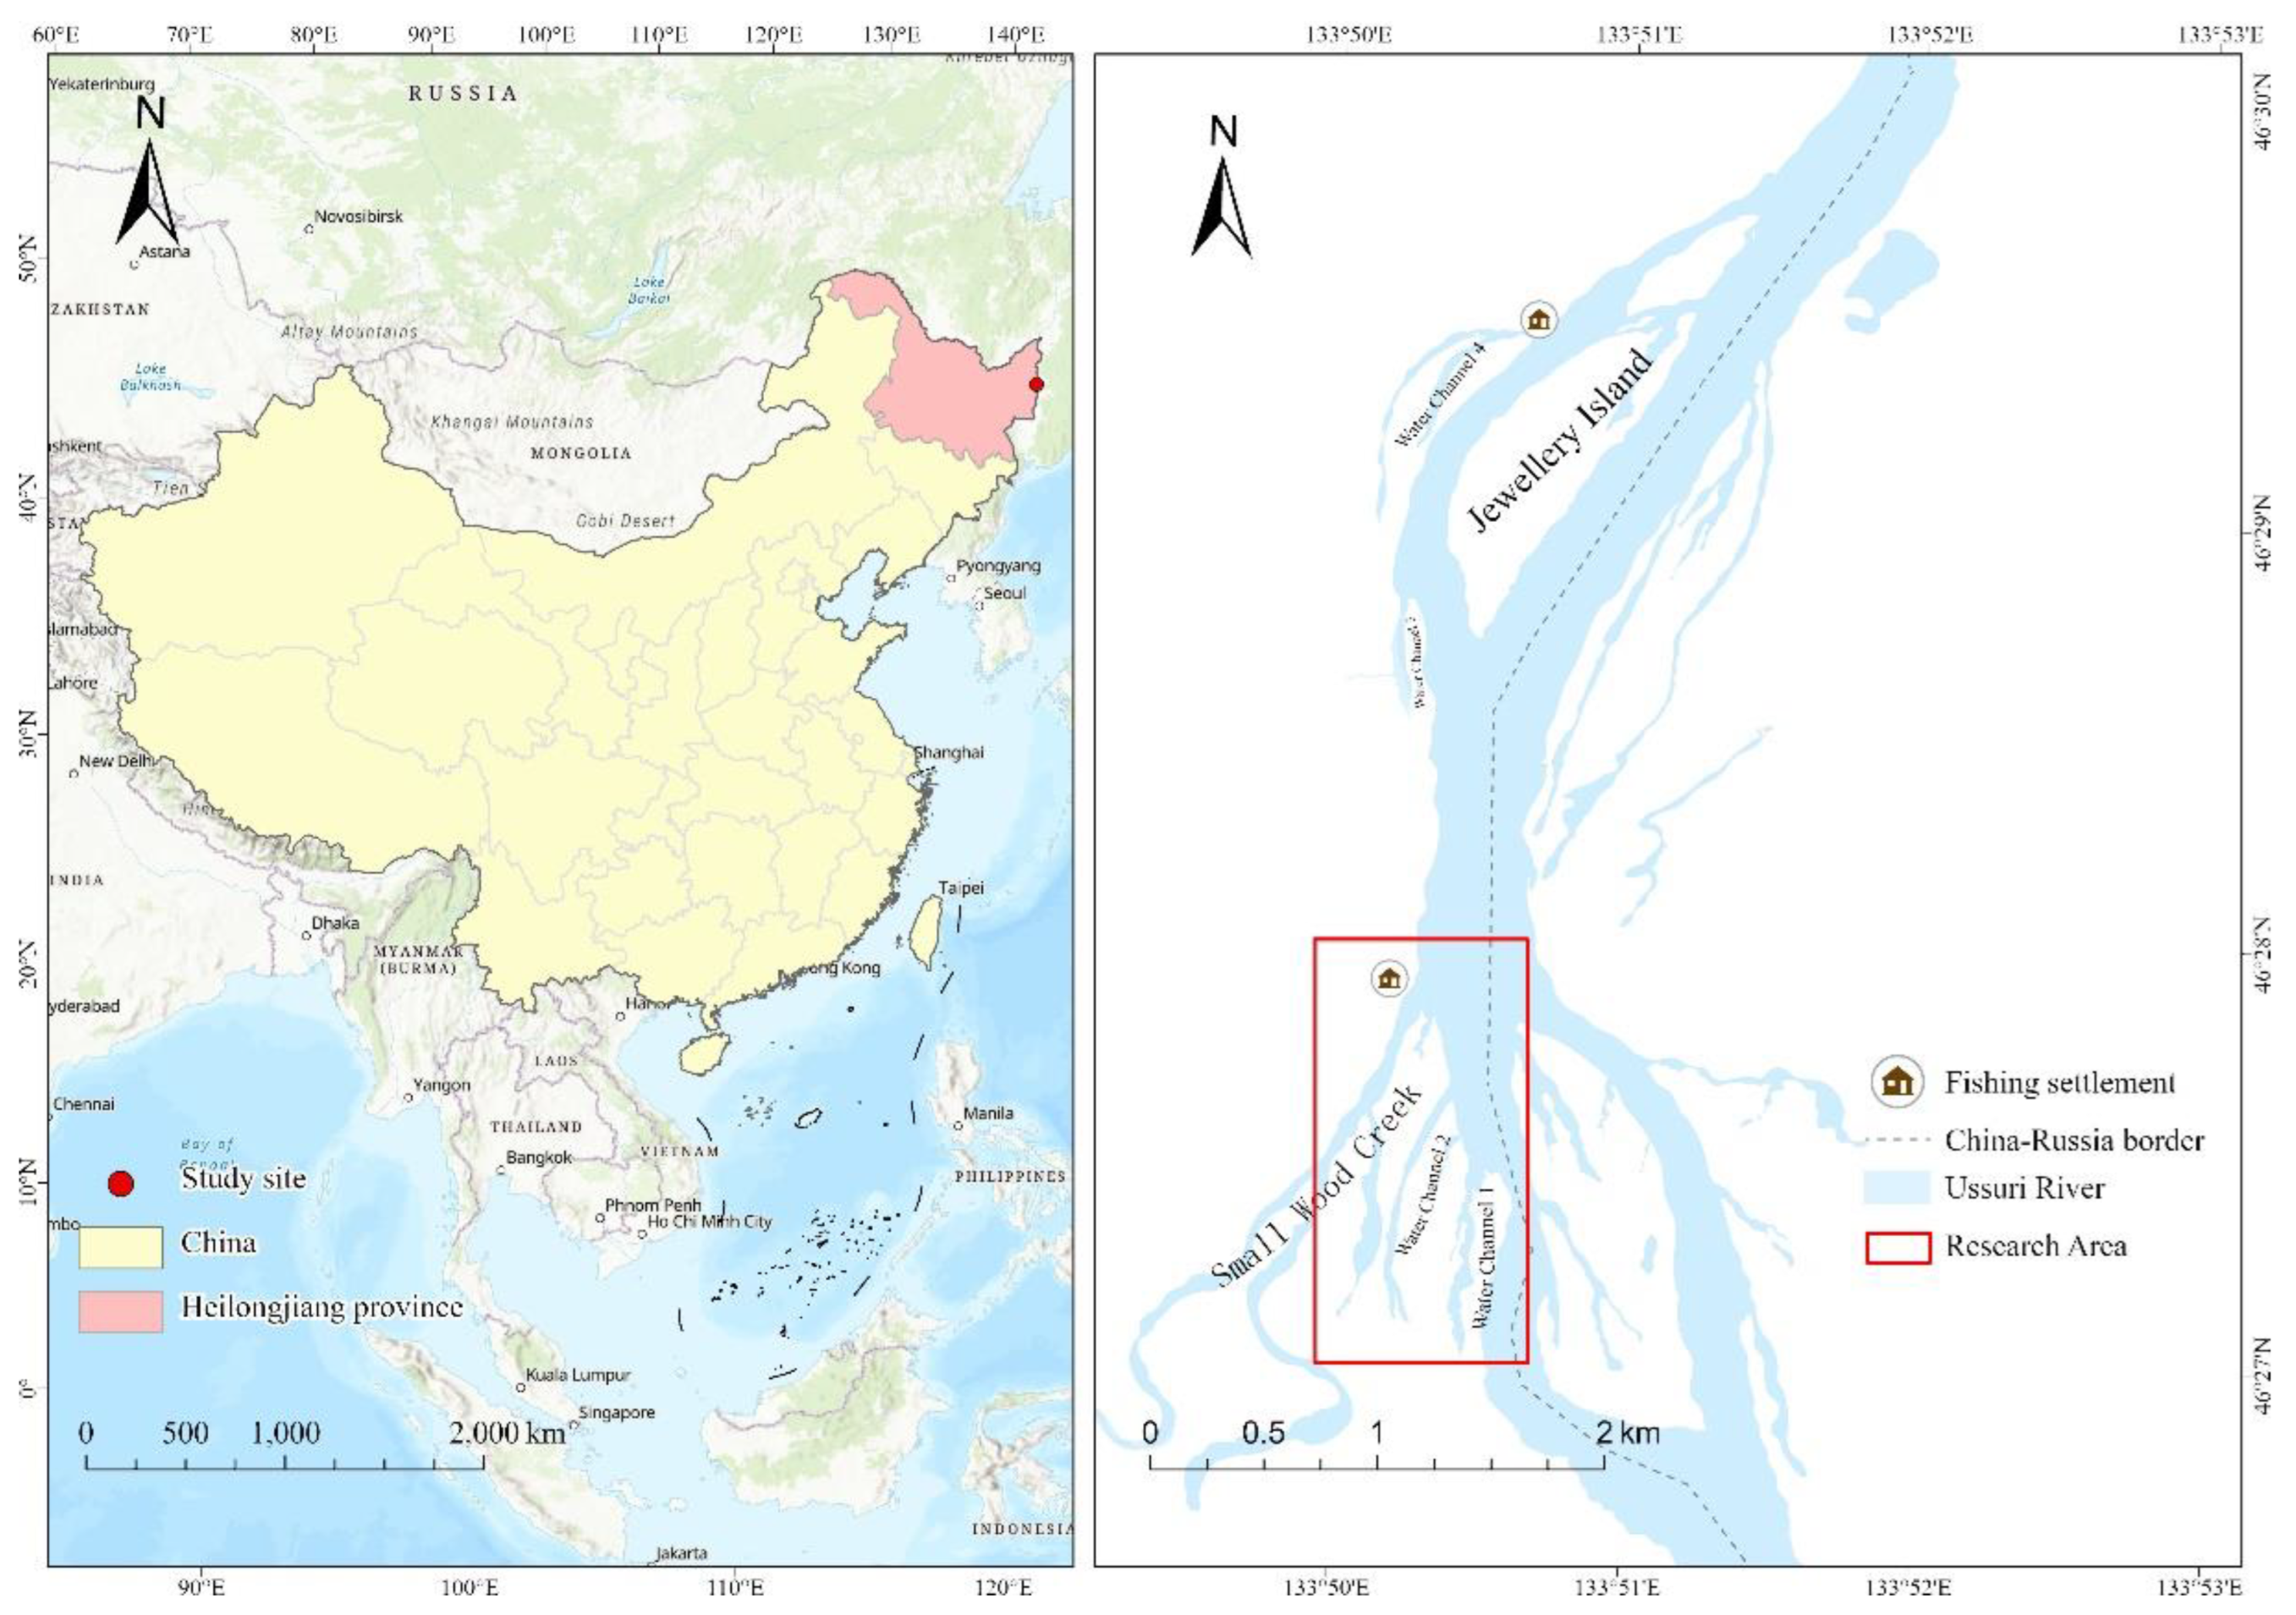
Figure 2.
(a) Subadult male (590 g) and (b) adult female (2720 g) Pelodiscus maackii with radio transmitters attached in the Ussuri River, China, in 2022.
Figure 2.
(a) Subadult male (590 g) and (b) adult female (2720 g) Pelodiscus maackii with radio transmitters attached in the Ussuri River, China, in 2022.
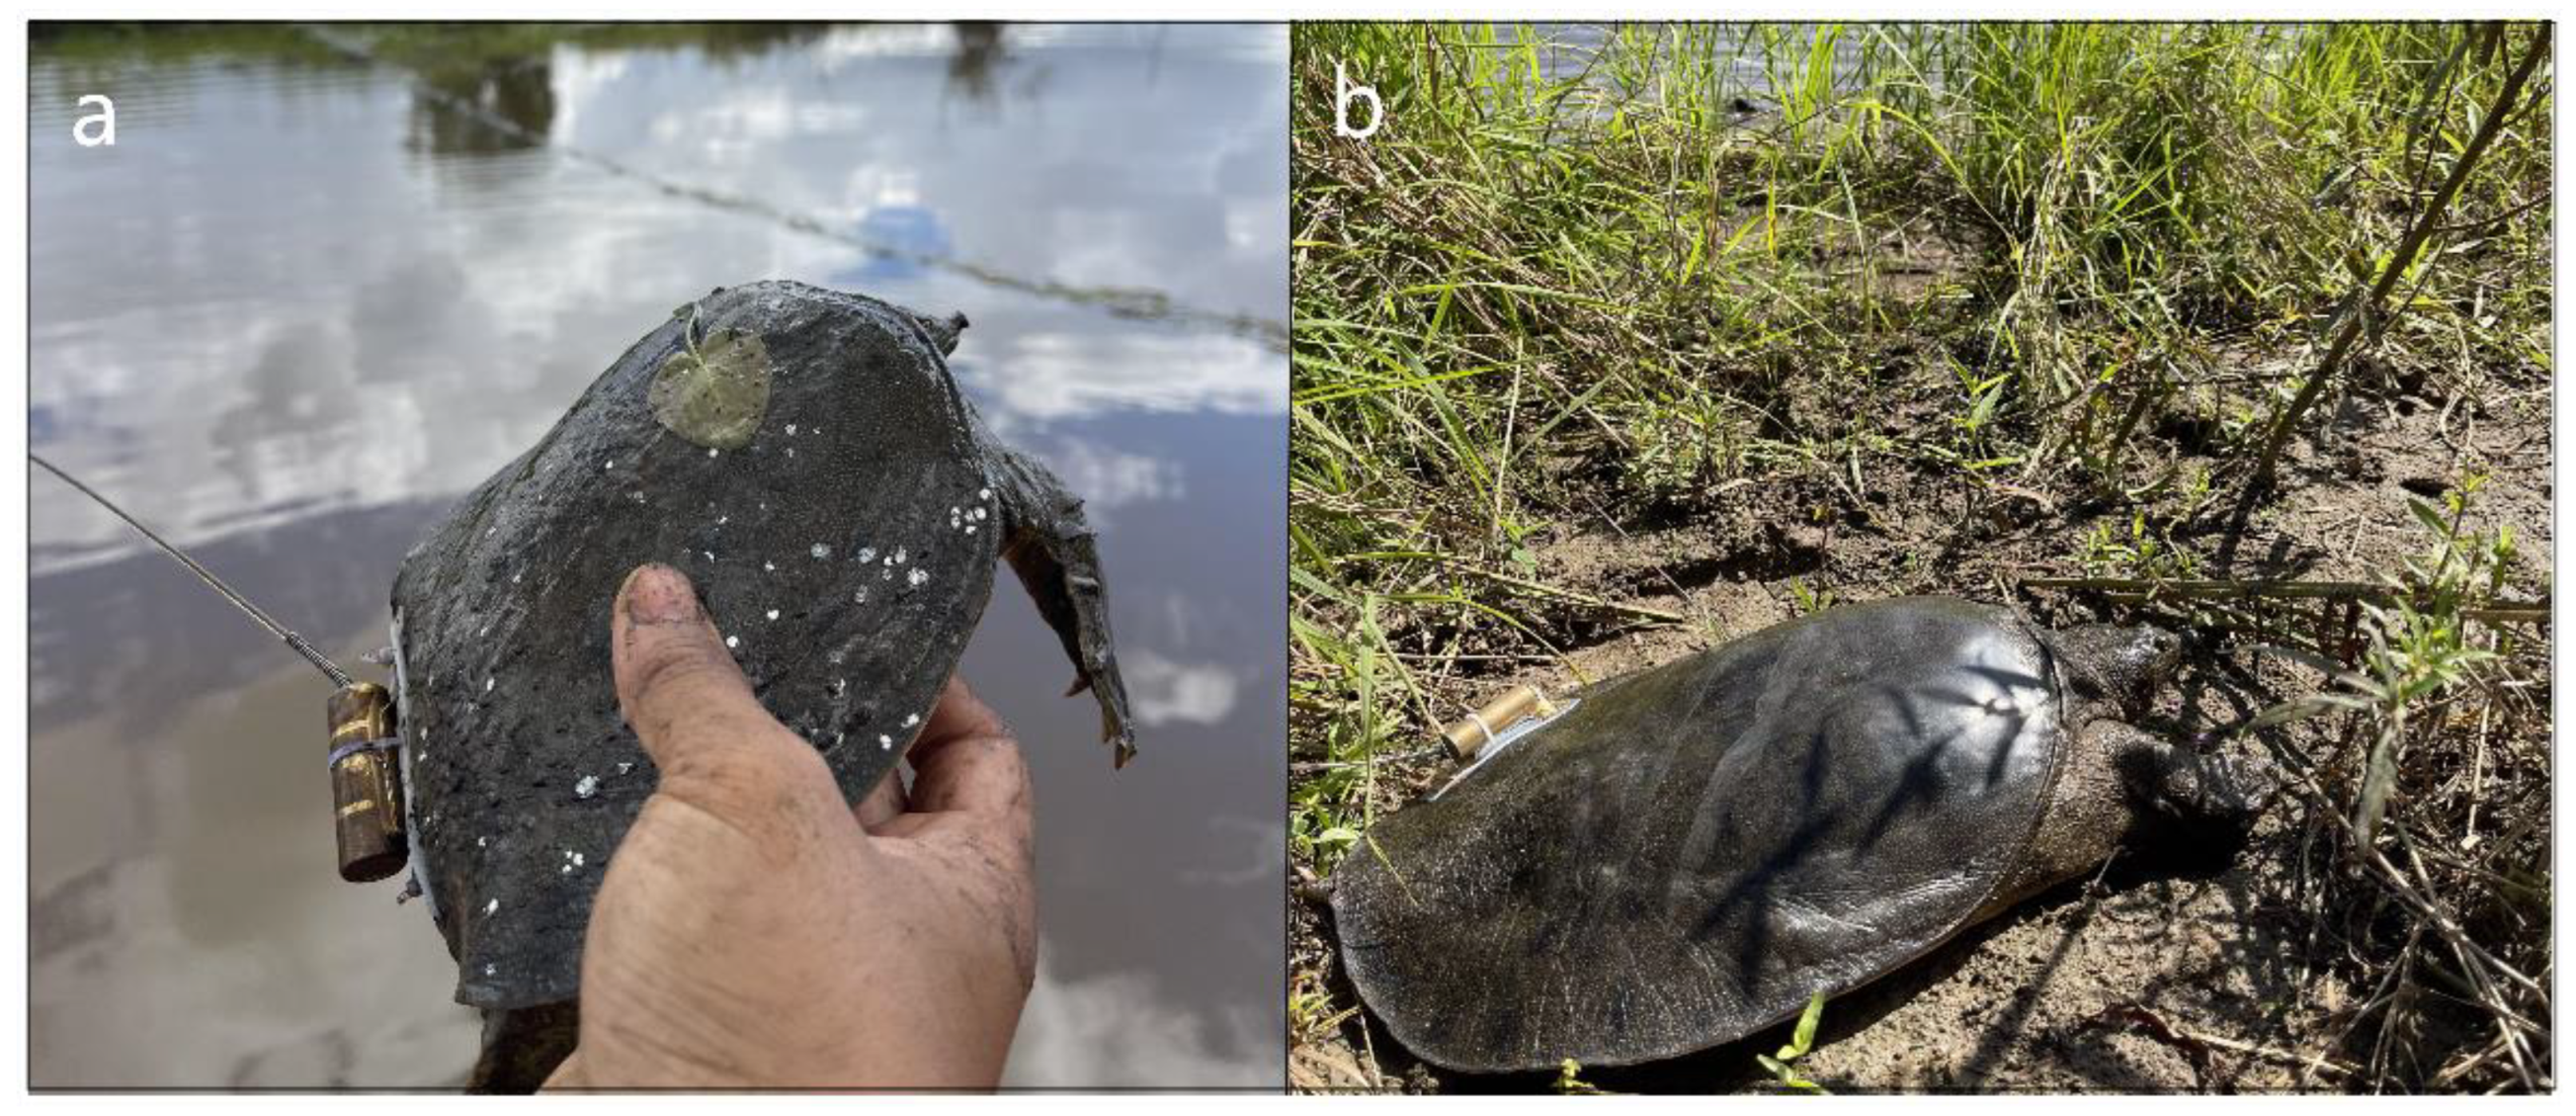
Figure 3.
Radio transmitter attachment for P. maackii seen from (a) ventral view and (b) dorsal view.
Figure 3.
Radio transmitter attachment for P. maackii seen from (a) ventral view and (b) dorsal view.
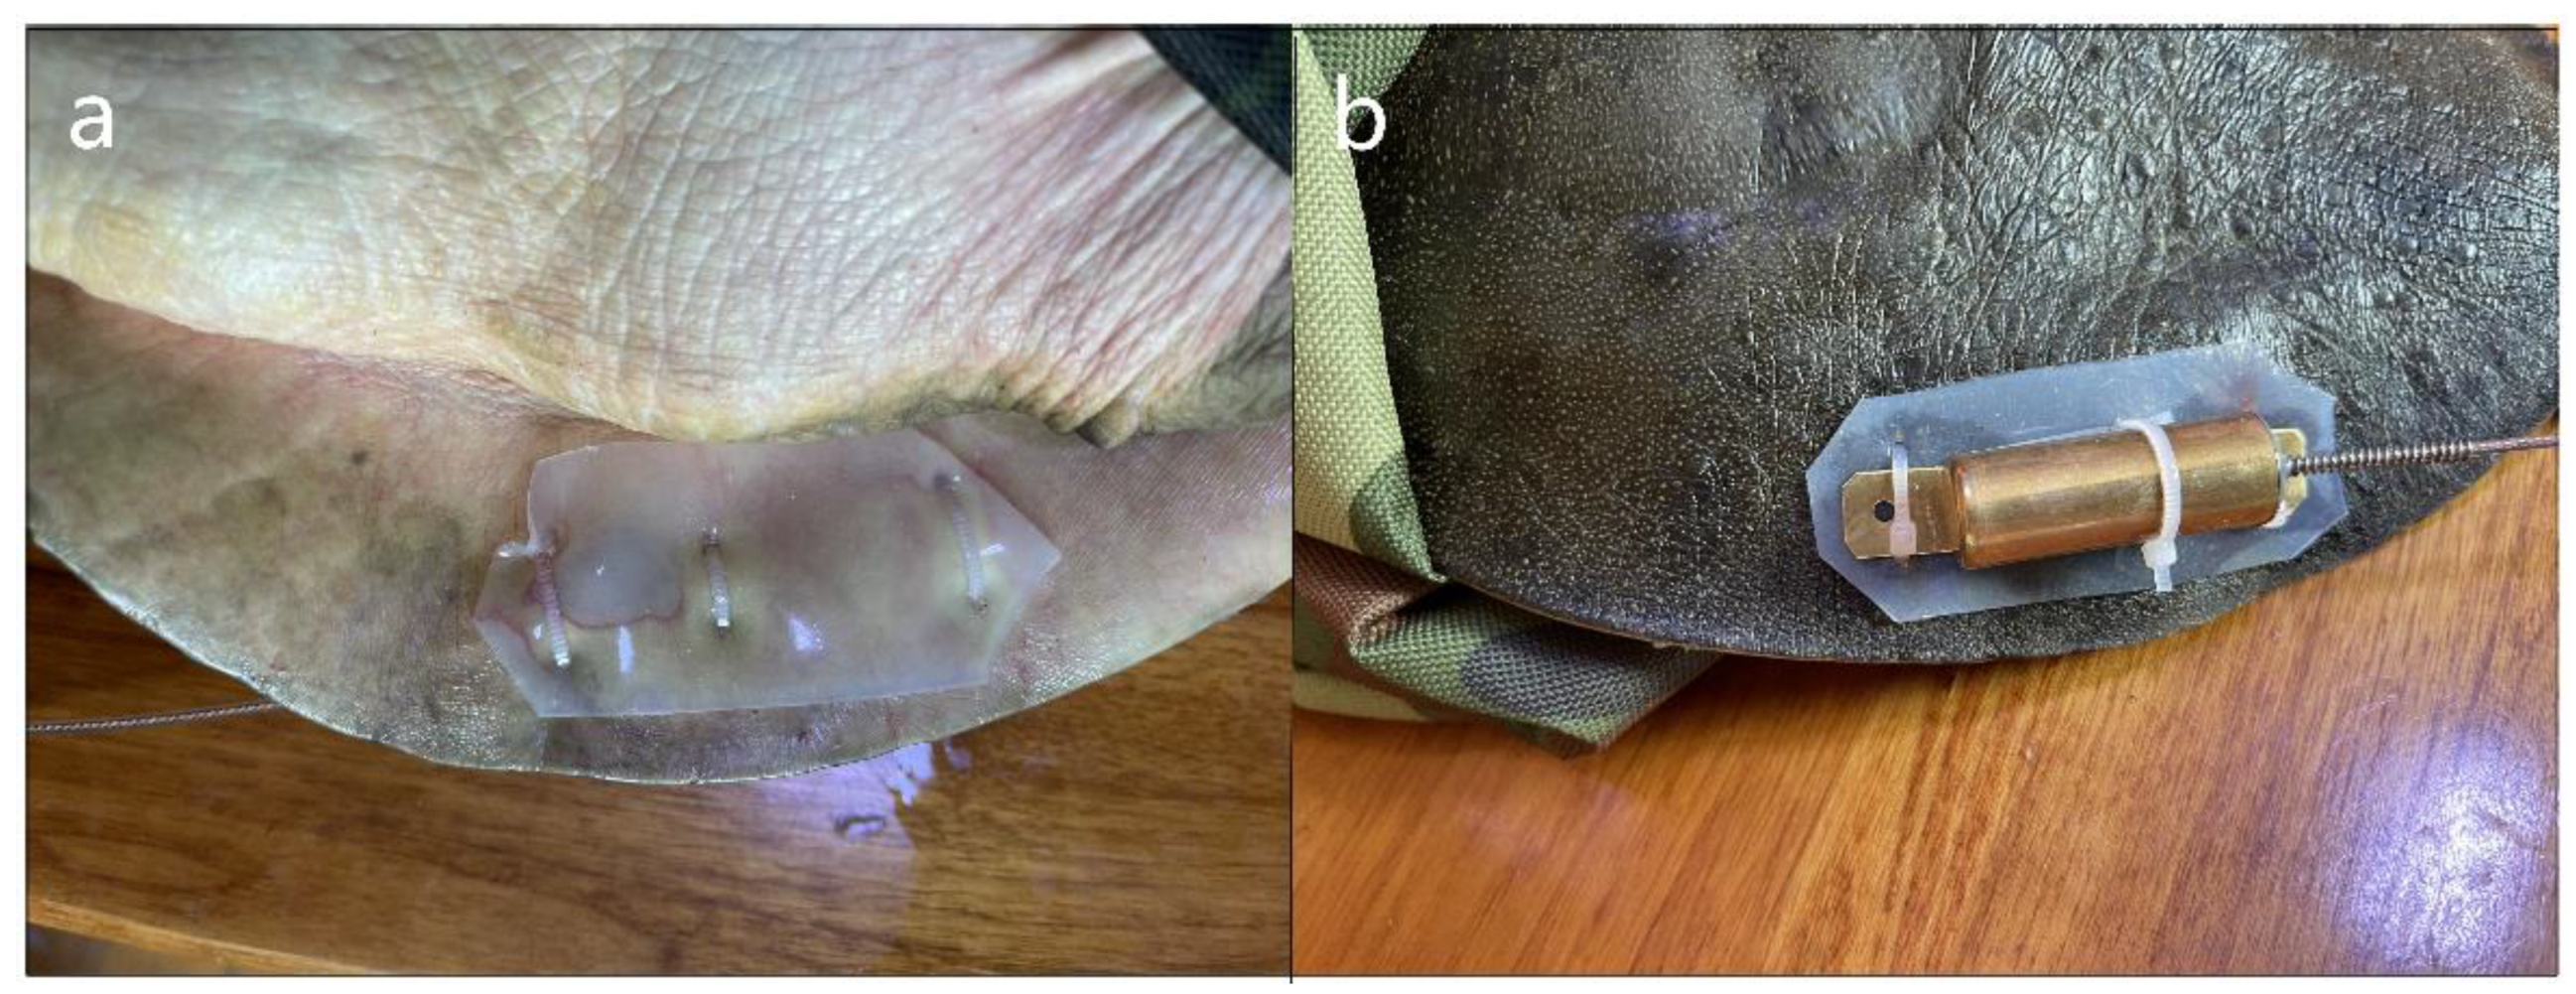
Figure 4.
Incremental area analysis plot for 10 P. maackii specimens The horizontal axis represents the number of coordinates for the minimum convex polygon (MCP) home range size and the vertical axis represents the range of the MCP area.
Figure 4.
Incremental area analysis plot for 10 P. maackii specimens The horizontal axis represents the number of coordinates for the minimum convex polygon (MCP) home range size and the vertical axis represents the range of the MCP area.
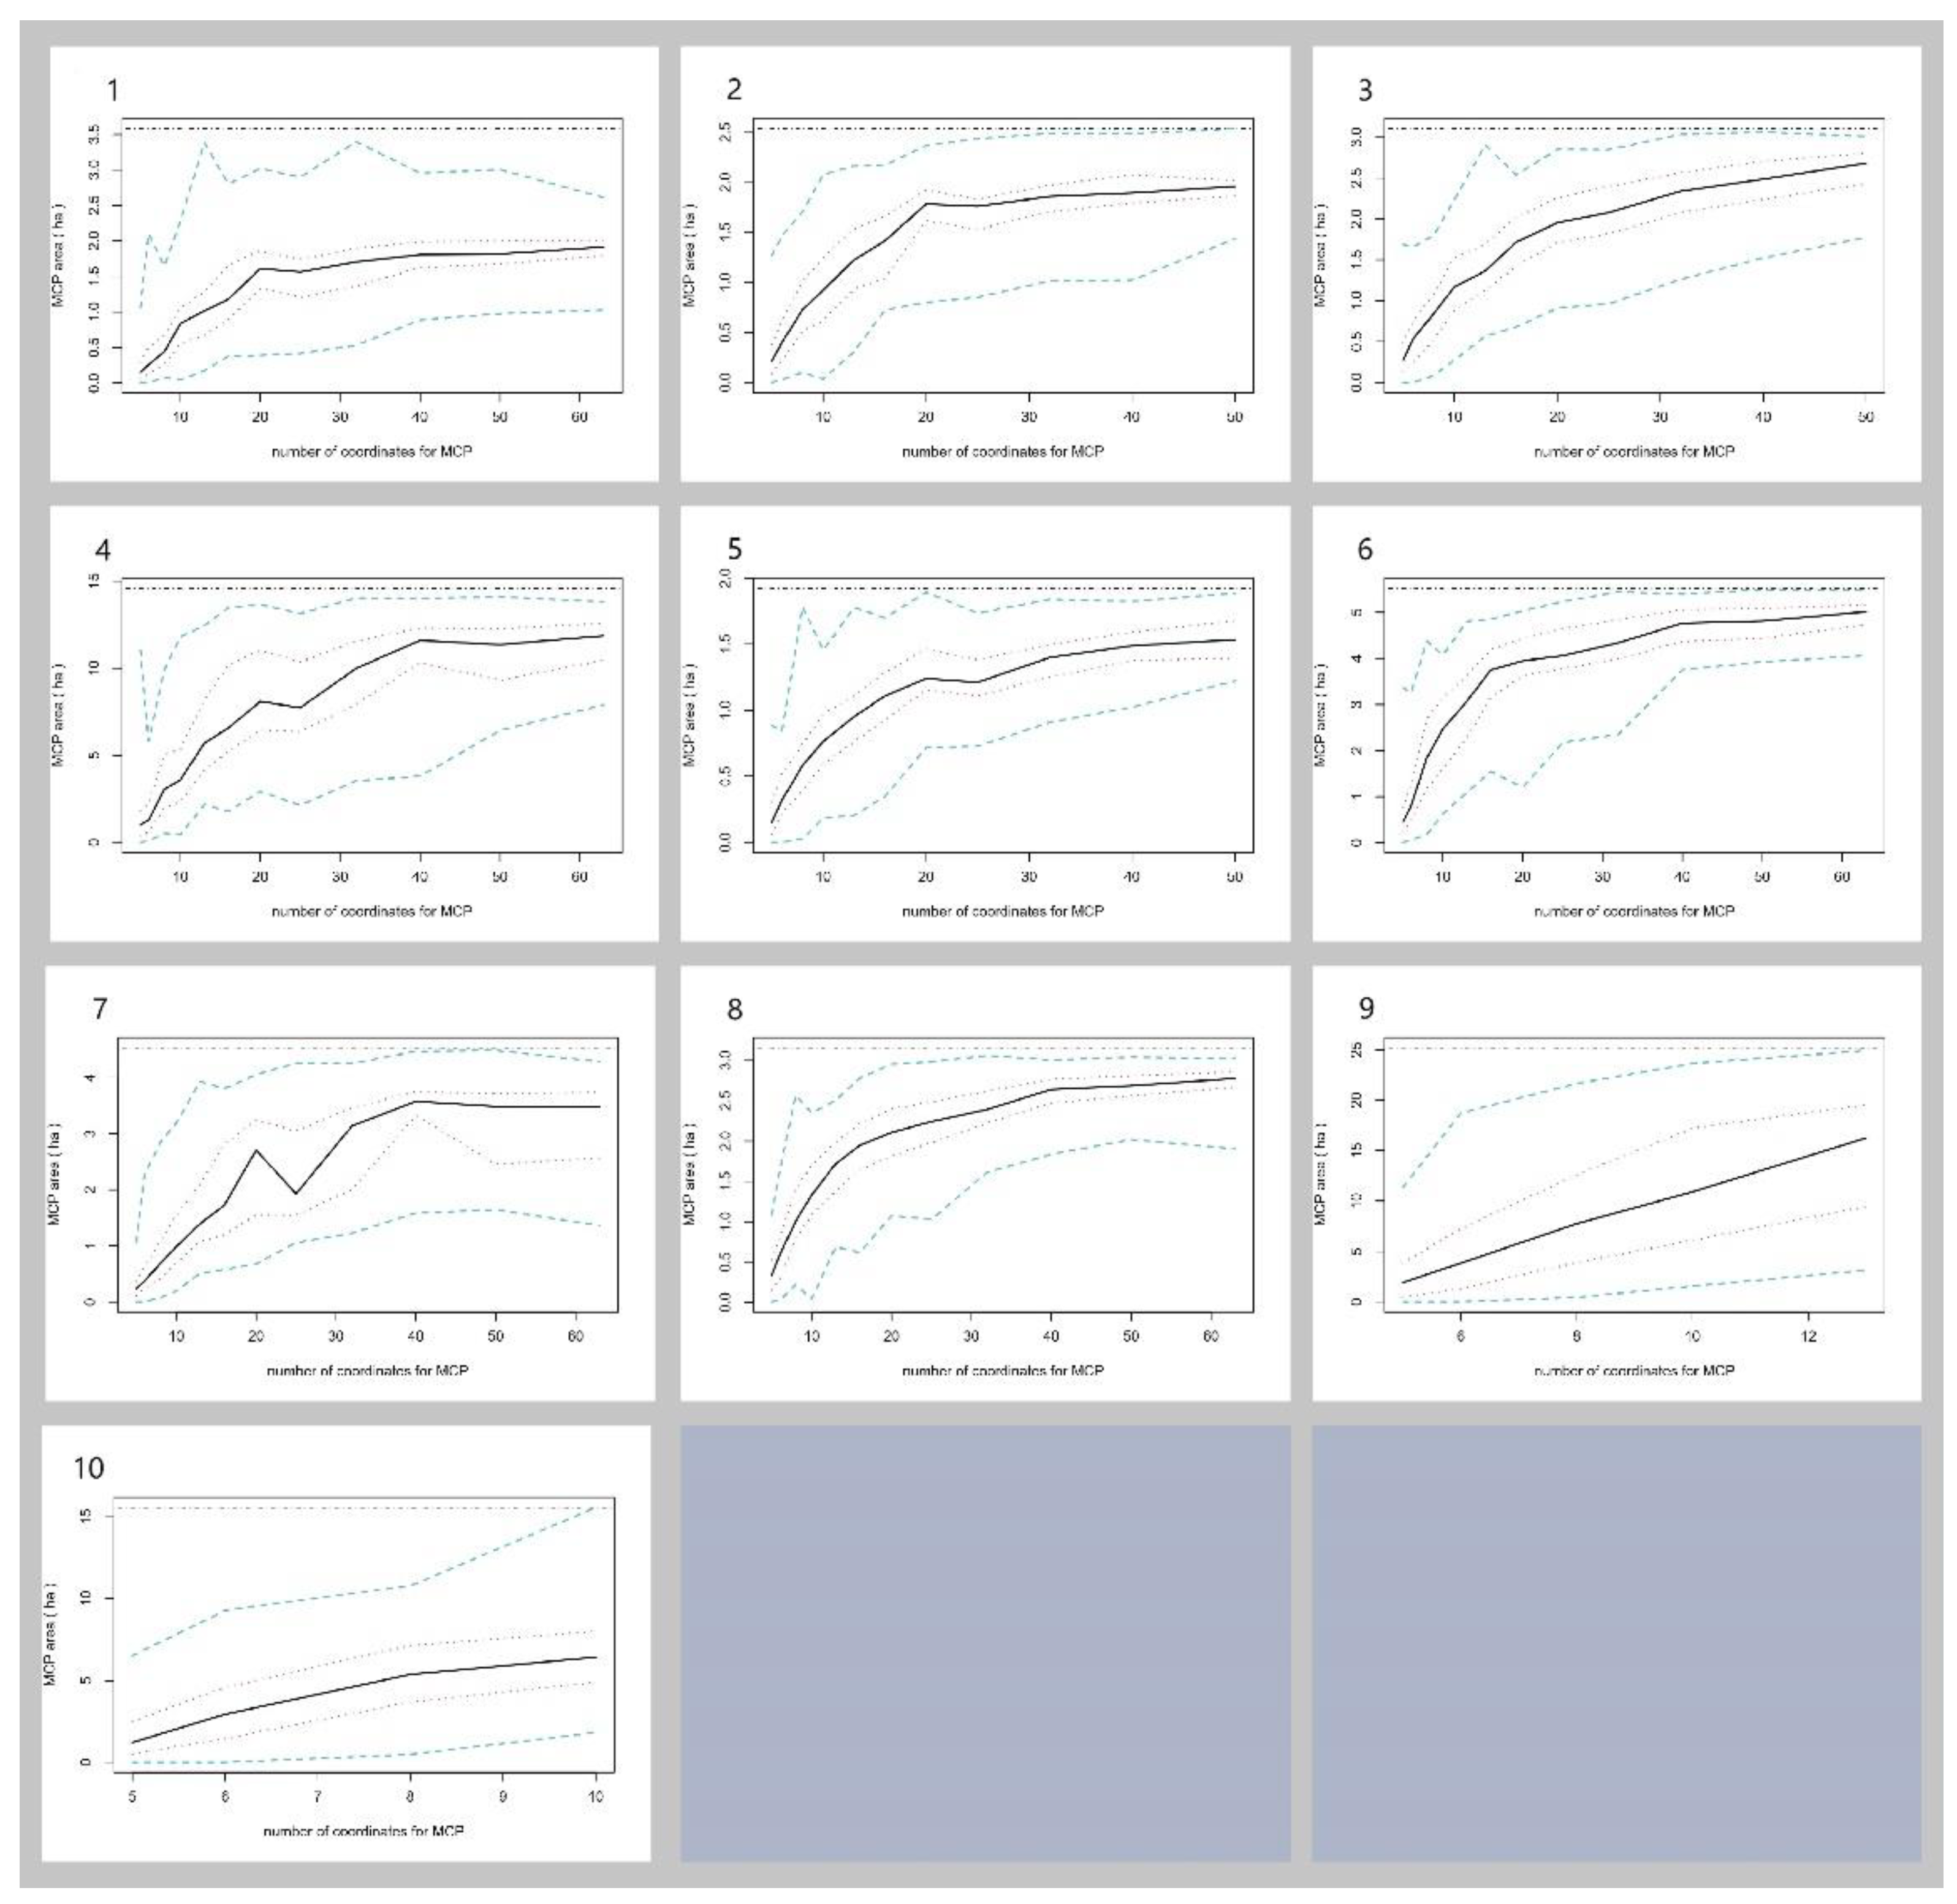
Figure 5.
Study area showing 10 P. maackii MCPs, linear home ranges (LRs), 95% kernel density estimates (KDEs), and 50% KDE home ranges. Maps were designed using ArcGIS Pro software [16].
Figure 5.
Study area showing 10 P. maackii MCPs, linear home ranges (LRs), 95% kernel density estimates (KDEs), and 50% KDE home ranges. Maps were designed using ArcGIS Pro software [16].
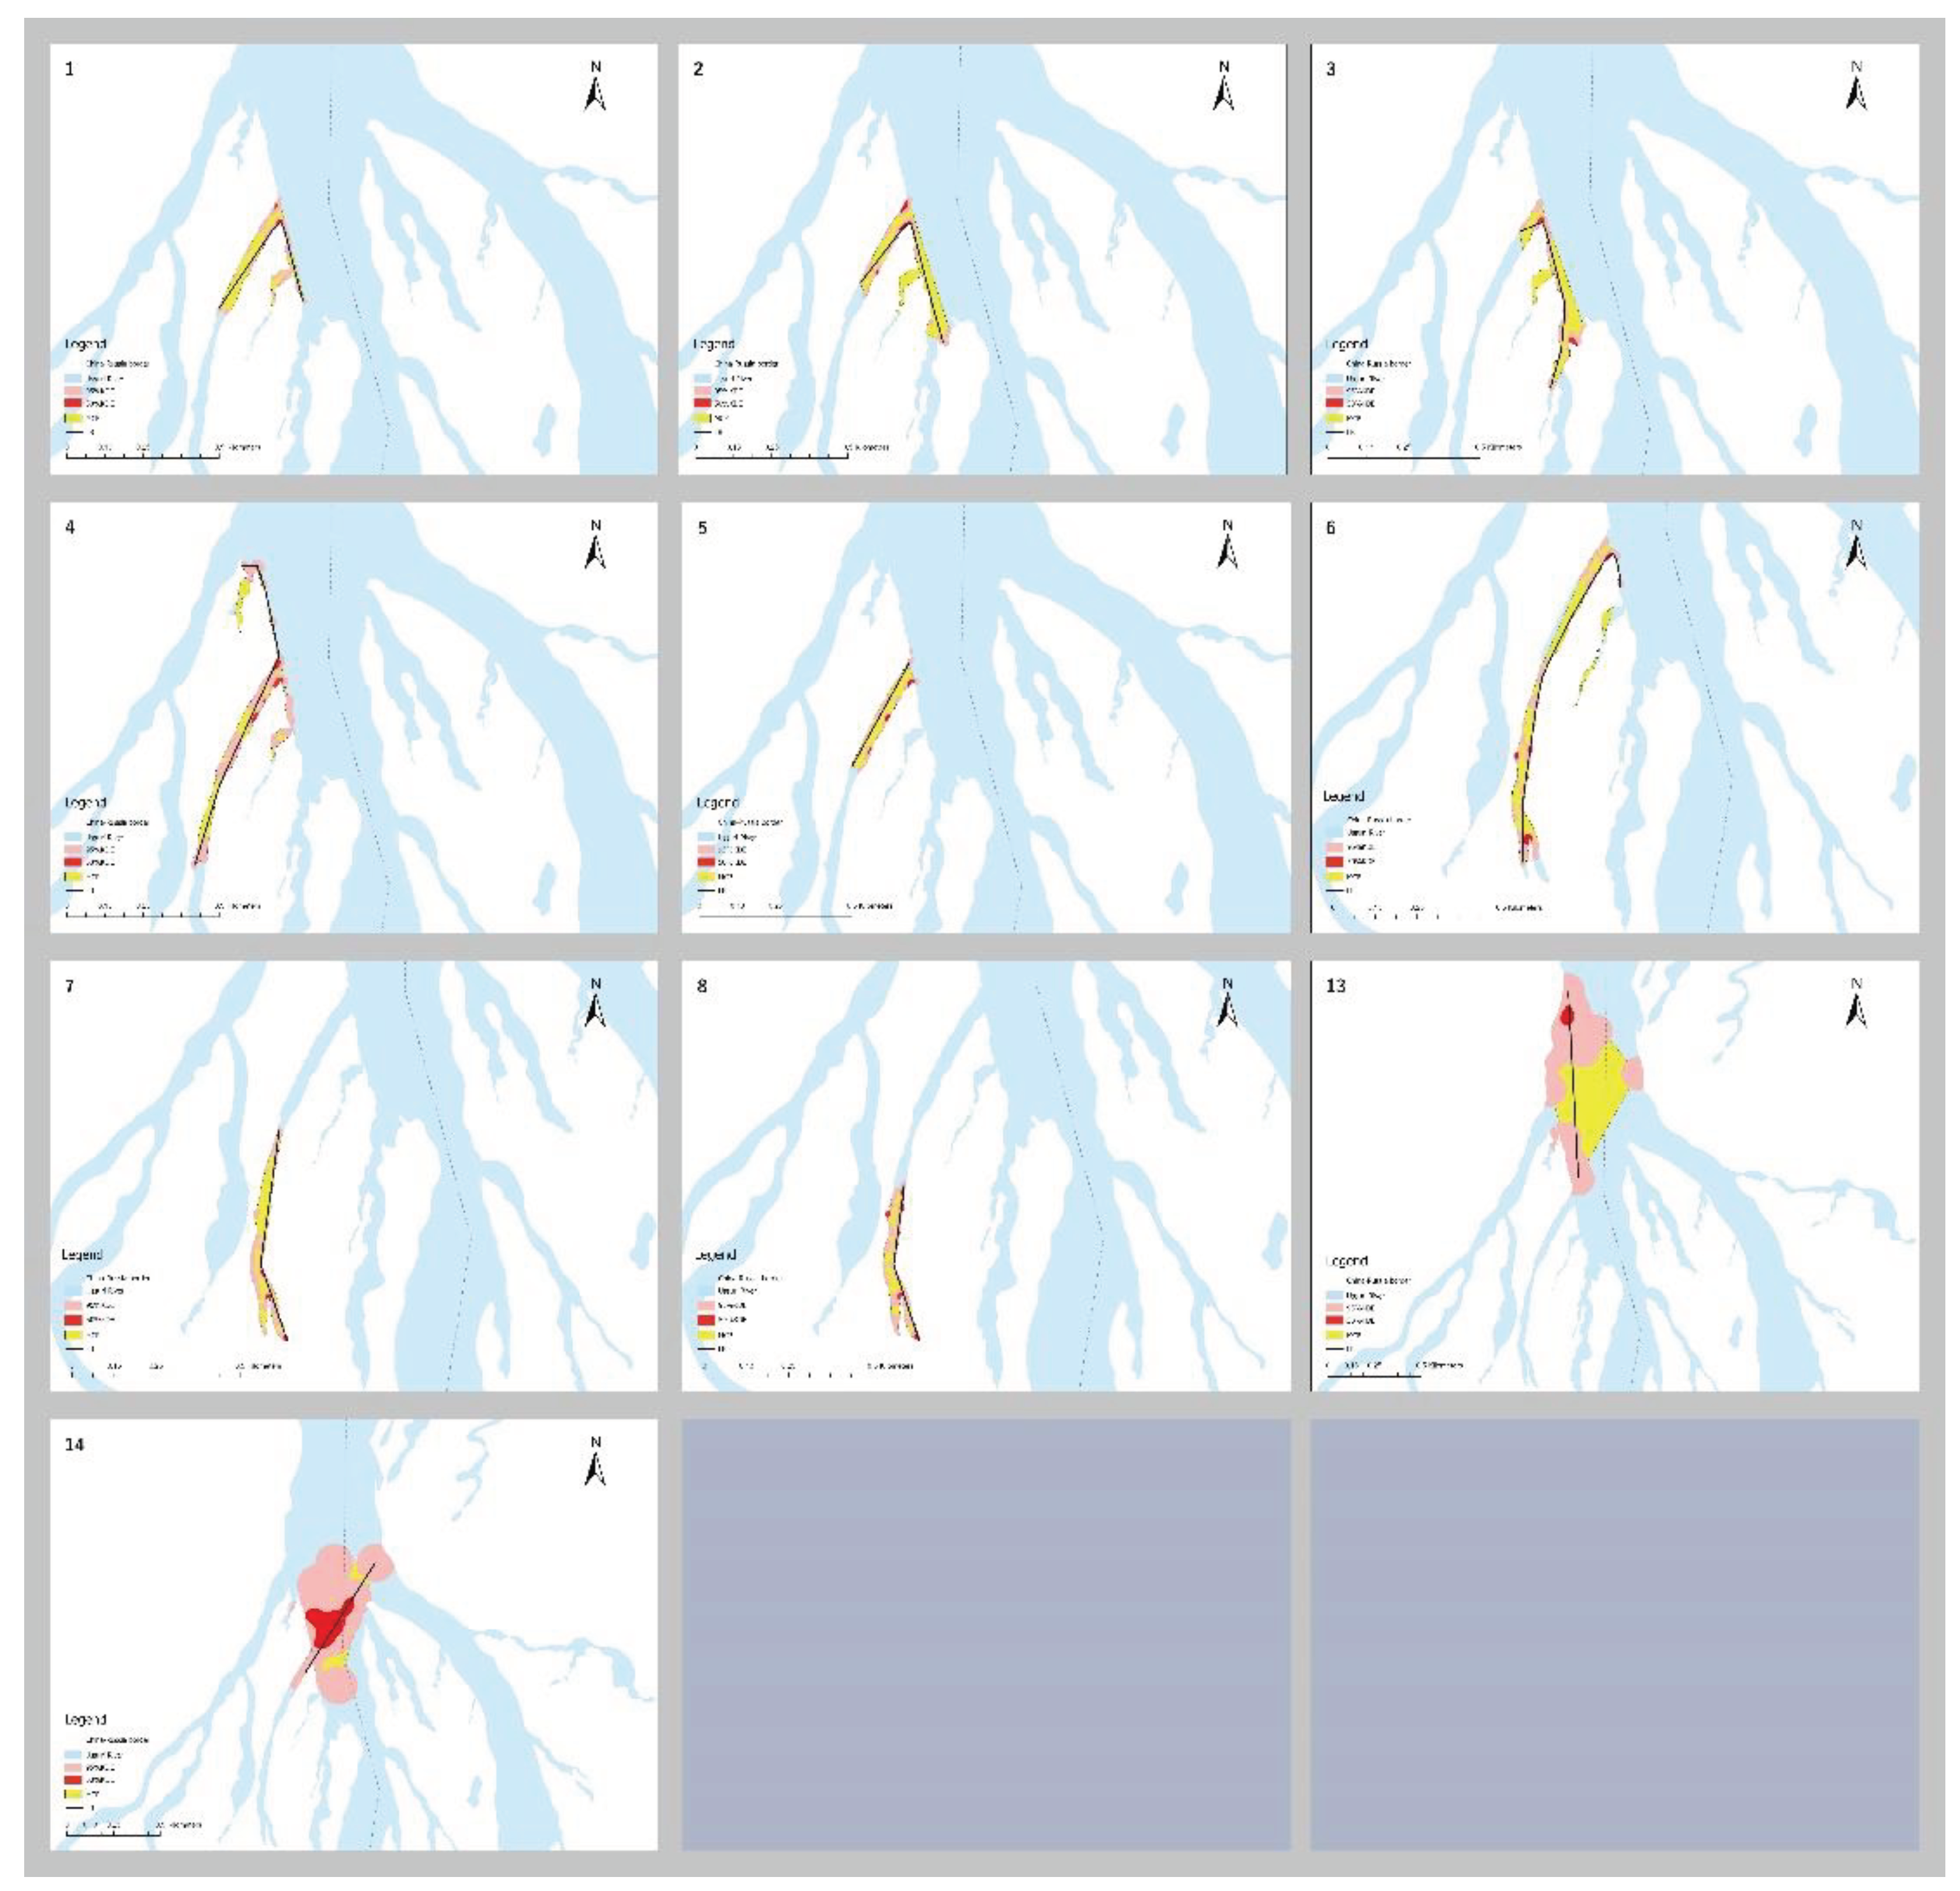
Figure 6.
Movement rate (m/day) and 95% confidence intervals for P. maackii for covariate effects of: (a) linear home range (m); (b) water temperature (℃).
Figure 6.
Movement rate (m/day) and 95% confidence intervals for P. maackii for covariate effects of: (a) linear home range (m); (b) water temperature (℃).
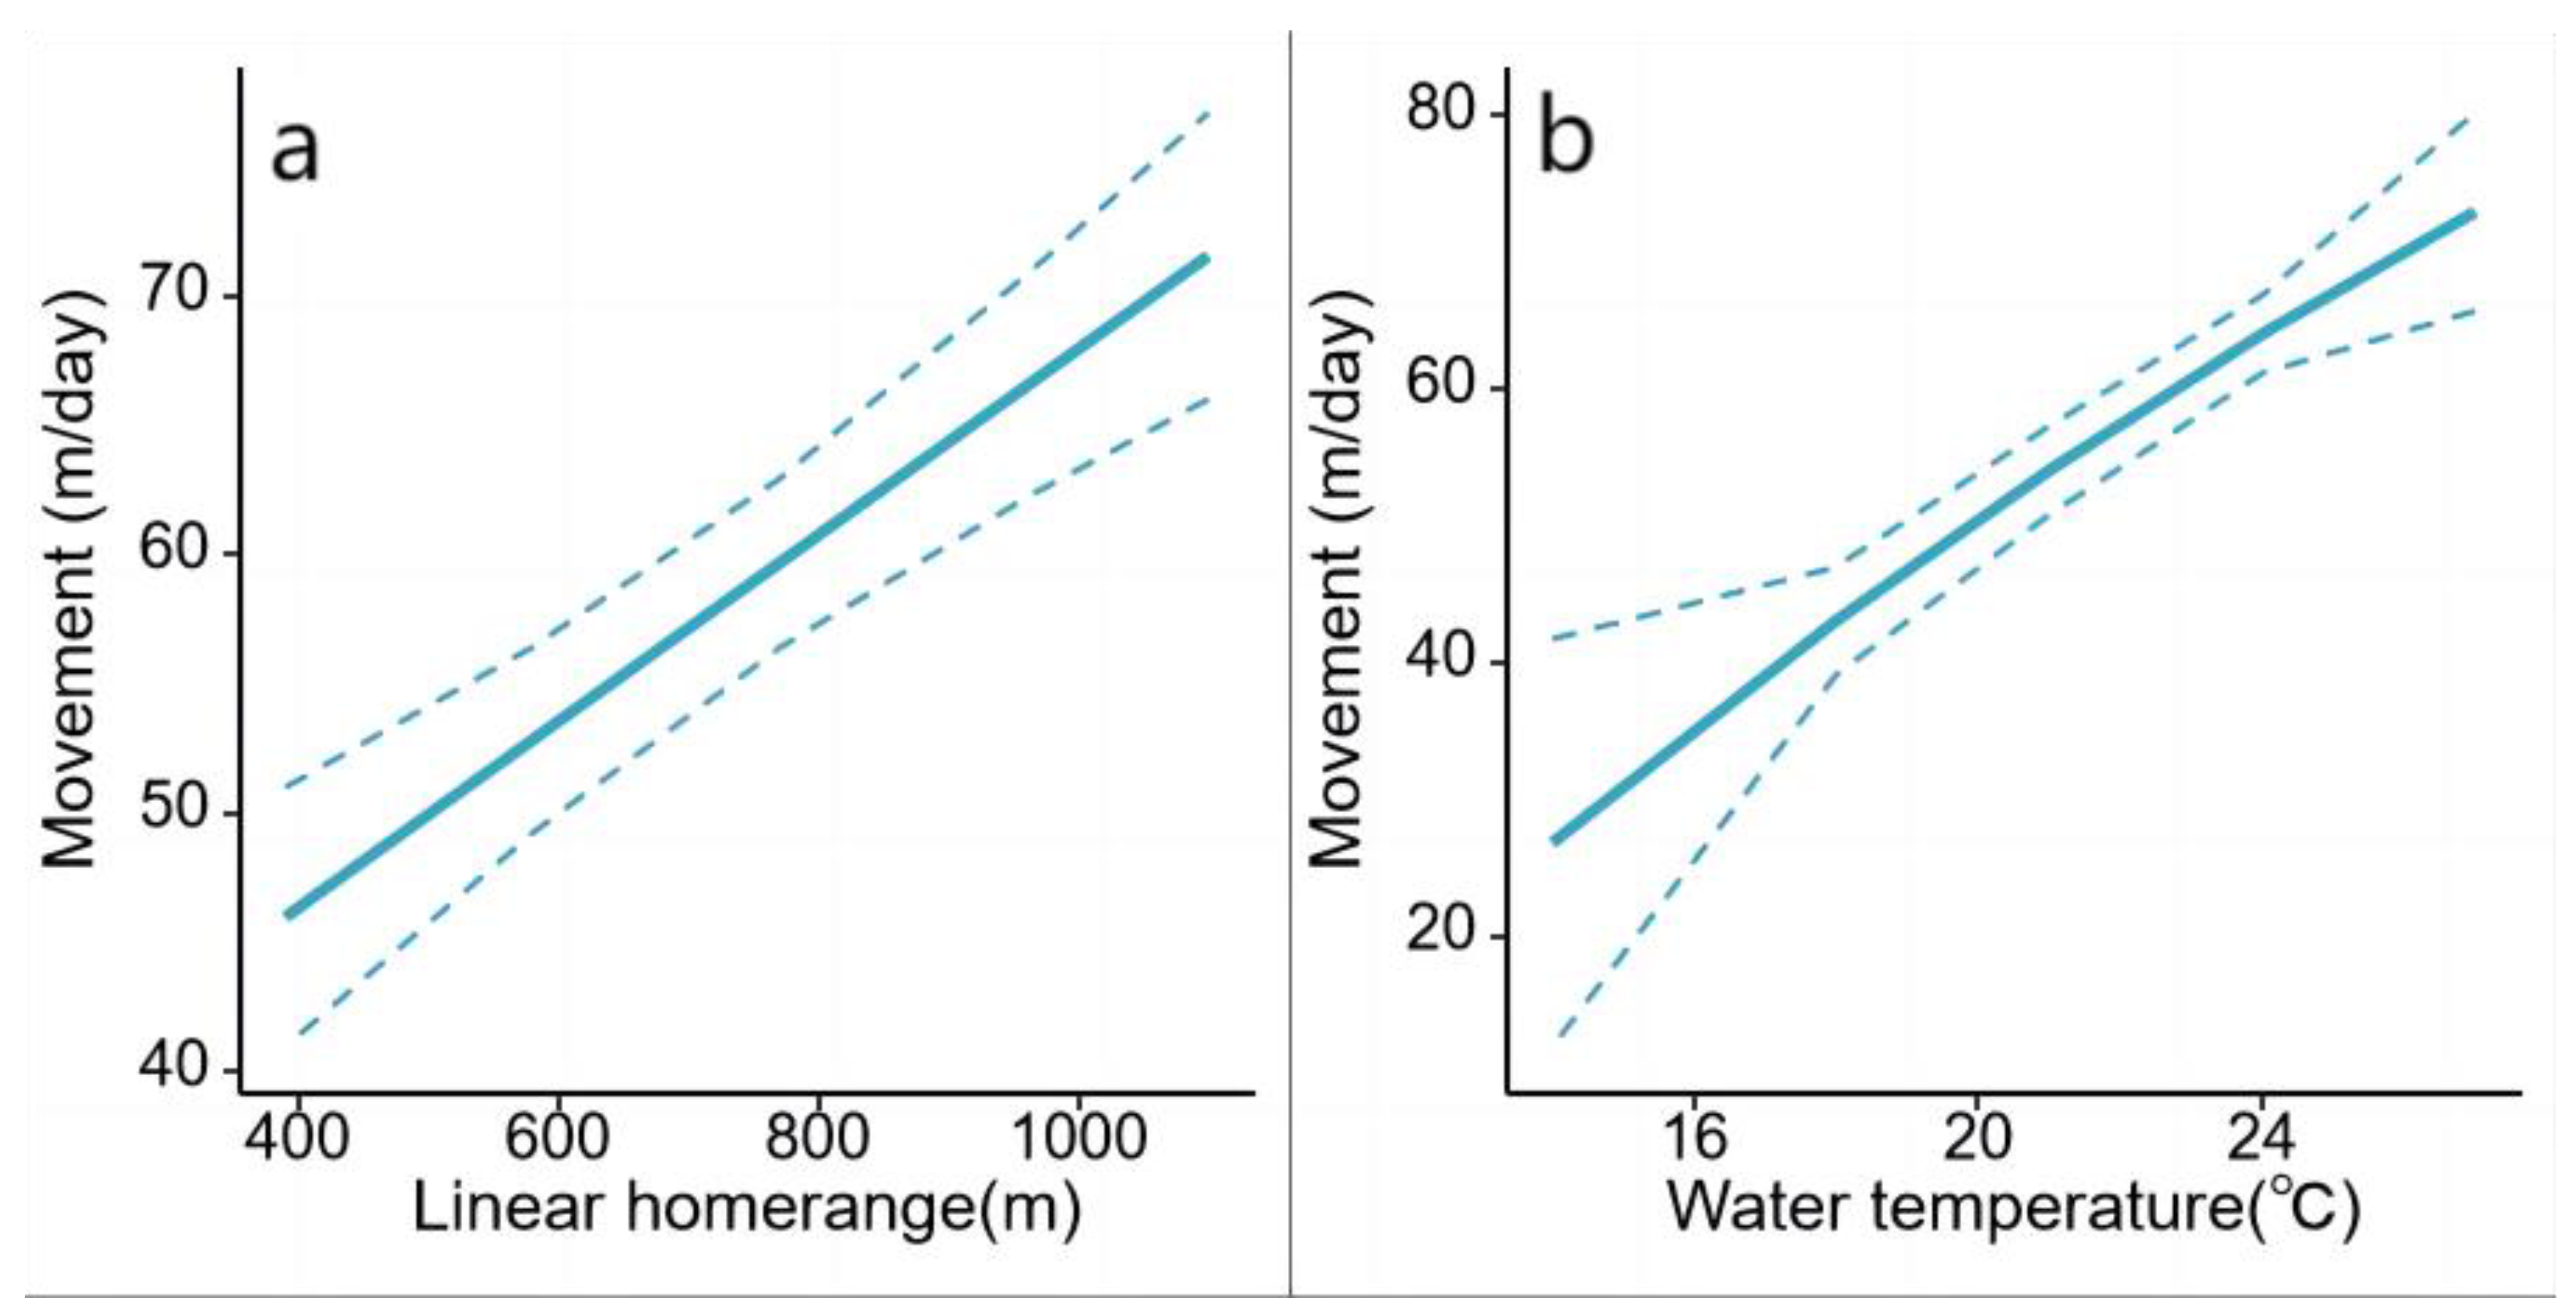
Table 1.
Overlap of home range areas of eight sub adult P. maackii that attained complete home range size, presented as the percentage of the total range of the individuals listed in the left column (see Table A1 for definition of abbreviations).
Table 1.
Overlap of home range areas of eight sub adult P. maackii that attained complete home range size, presented as the percentage of the total range of the individuals listed in the left column (see Table A1 for definition of abbreviations).
| MCP | ||||||||
|---|---|---|---|---|---|---|---|---|
| ID | 1 | 2 | 3 | 4 | 5 | 6 | 7 | 8 |
| 1 | 88.89 | 55.84 | 20.53 | 84.04 | 38.5 | 0 | 0 | |
| 2 | 63.01 | 80.14 | 17.38 | 73.08 | 30.81 | 0 | 0 | |
| 3 | 48.42 | 31.97 | 15.96 | 17.4 | 15.67 | 0 | 0 | |
| 4 | 83.63 | 70.84 | 37.42 | 100 | 64.68 | 41.49 | 8.55 | |
| 5 | 38.12 | 45.89 | 10.77 | 13.18 | 29.86 | 0 | 0 | |
| 6 | 0 | 35.77 | 12.7 | 76.91 | 82.82 | 81.05 | 80.52 | |
| 7 | 0 | 0 | 0 | 6.67 | 0 | 56.49 | 90.47 | |
| 8 | 0 | 0 | 0 | 1.85 | 0 | 43.03 | 69.31 | |
| 95% KDE | ||||||||
| ID | 1 | 2 | 3 | 4 | 5 | 6 | 7 | 8 |
| 1 | 64.75 | 54.78 | 36.92 | 68.86 | 29.85 | 0 | 0 | |
| 2 | 0.73 | 49.79 | 31.49 | 76.58 | 31.14 | 0 | 0 | |
| 3 | 0.56 | 44.96 | 20.07 | 30.41 | 22.45 | 0 | 0 | |
| 4 | 0.78 | 86.75 | 61.26 | 97 | 43.09 | 24.1 | 19.83 | |
| 5 | 0.65 | 79.9 | 31.87 | 34.4 | 22.8 | 0 | 0 | |
| 6 | 0.35 | 42.38 | 0 | 40.31 | 45.56 | 82.19 | 72.53 | |
| 7 | 0 | 0 | 0 | 9.21 | 0 | 54.55 | 86.94 | |
| 8 | 0 | 0 | 0 | 7.46 | 0 | 47.11 | 69.66 | |
| 50% KDE | ||||||||
| ID | 1 | 2 | 3 | 4 | 5 | 6 | 7 | 8 |
| 1 | 51.3 | 43.31 | 28.63 | 35.97 | 24.32 | 0 | 0 | |
| 2 | 88.54 | 42.42 | 43.39 | 63.79 | 23.89 | 0 | 0 | |
| 3 | 80.45 | 47.29 | 23.3 | 28.81 | 22.76 | 0 | 0 | |
| 4 | 100 | 92.16 | 42.06 | 96.5 | 28.43 | 0 | 0 | |
| 5 | 77.09 | 76.88 | 41.43 | 39.47 | 23.45 | 0 | 0 | |
| 6 | 0 | 30.38 | 34.43 | 27.71 | 34.33 | 74.64 | 80.79 | |
| 7 | 0 | 0 | 0 | 0 | 0 | 33.17 | 45.04 | |
| 8 | 0 | 0 | 0 | 0 | 0 | 52.96 | 53.93 | |
Table 2.
Model rank, model name, number of parameters (K), −2 Log likelihood (−2LL), Akaike information criterion adjusted for small samples (AICc), difference in AICc value from the top model. value (∆AICc), Akaike weight (wi), marginal R2 (R2[m]), and conditional R2(R2[c]) for the top five and intercept-only mixed effects models describing movement rate of P. maackii in the Ussuri River, China (Full model structures are provided in Appendix B Table A2).
| Rank | Model Name | K | -2LL | AICc | ∆AICc | wi | R2(m) | R2(c) |
|---|---|---|---|---|---|---|---|---|
| 1 | Global | 11 | -2284.17 | 4590.87 | 0 | 0.83 | 0.26 | 0.26 |
| 2 | Temp., linear home range, and sex interaction | 9 | -2288.68 | 4595.73 | 4.86 | 0.07 | 0.26 | 0.26 |
| 3 | Main linear effect | 7 | -2291.24 | 4596.71 | 5.84 | 0.04 | 0.25 | 0.26 |
| 4 | Temp. and linear home range interaction | 7 | -2292.5 | 4599.23 | 8.36 | 0.01 | 0.26 | 0.26 |
| 5 | Temp., linear home range, and body size interaction | 9 | -2290.54 | 4599.45 | 8.57 | 0.01 | 0.26 | 0.26 |
| 17 | Null | 3 | -2345.27 | 4696.58 | 105.71 | 0 | 0 | 0.15 |
Table 3.
Real parameter estimates, standard error, lower confidence interval, and upper confidence interval for the top mixed-effects model describing the movement rate of P. maackii in the Ussuri River,China.
Table 3.
Real parameter estimates, standard error, lower confidence interval, and upper confidence interval for the top mixed-effects model describing the movement rate of P. maackii in the Ussuri River,China.
| Effect | Estimate | SE | LCI | UCI |
|---|---|---|---|---|
| Intercept | 54.83 | 2.49 | 49.94 | 59.72 |
| Water Temp. | 12.6 | 1.92 | 8.84 | 16.37 |
| (Water Temp.)2 | -0.49 | 1.19 | -2.81 | 1.84 |
| Linear home range (LR) | 8.71 | 1.45 | 5.87 | 11.55 |
| Sex | 5.5 | 4.51 | -3.35 | 14.35 |
| Plastron Length (PL) | -2.35 | 1.97 | -6.22 | 1.51 |
| Water Temp. * LR | -1.73 | 1.28 | -4.24 | 0.78 |
| Water Temp. * PL | 2.8 | 2.05 | -1.21 | 6.82 |
| Water Temp. * Sex | -7.1 | 4.74 | -16.39 | 2.2 |
Disclaimer/Publisher’s Note: The statements, opinions and data contained in all publications are solely those of the individual author(s) and contributor(s) and not of MDPI and/or the editor(s). MDPI and/or the editor(s) disclaim responsibility for any injury to people or property resulting from any ideas, methods, instructions or products referred to in the content. |
© 2024 by the authors. Licensee MDPI, Basel, Switzerland. This article is an open access article distributed under the terms and conditions of the Creative Commons Attribution (CC BY) license (http://creativecommons.org/licenses/by/4.0/).
Copyright: This open access article is published under a Creative Commons CC BY 4.0 license, which permit the free download, distribution, and reuse, provided that the author and preprint are cited in any reuse.


