
Submitted:
08 March 2024
Posted:
11 March 2024
You are already at the latest version
Abstract
Sorghum grain processing can improve the nutritional content by promoting dietary properties that contribute to food security and economic development. The quality, nutritional content, and processing properties of sorghum bicolor grain can greatly affected by the inbred line races and variance in pericarp colour.The current study assessed the influence of the Husking Fraction Time Units (HFTU) process, which employed set time units per second (S), on the variation in the nutritional profile of fifty-one inbred line sorghum varieties based on distinct pericarp colours. When the assessment of the nutritional profile was involved: dry matter, total protein besides, namely mineral (P, K, S, Ca, Mg, Na, Fe, Zn, and Mn). The variety groups showed a significance value of (P < 0.05), indicating the study hypothesis's truth.The results demonstrated substantial impacts implied by the Husking Fraction Time Unit (HFTU) technique. This occurrence was noted when the dry matter percentage was increased in the husked products, specifically the endosperm (grits) and bran. The protein percentage redistributed by 19.2% compared to the whole grain and bran content. In comparison, the ratio of N/S was 14:1 in the S. bicolor and 12:1 in the kafirin in the bran part. Moreover, a strong correlation was observed among the examined minerals of S.bicolor and kafirin, such as the correlation between Ca: P, K: Na, and Fe: Zn attributed 80 (S) time unit, with correlation coefficients of R = 0.784 and R = 0.586, R= 517, R= 0.884, R= 0.745, and R = 0.893, respectively. At the same time, the 80 (S) time unit showed a significant effect on the colour property profile.The study results could benefit breeders and nutrition specialists in developing genotypes and processing sorghum grains, promoting research, and aiding several industrial sectors owing to the grain's adaptability and nutritional properties.
Keywords:
mineral contents
; total protein
; husking process
; colour profile
; S. bicolor
; kafirin.
1. Introduction
Sorghum (Sorghum bicolor L.) is a vital staple crop worldwide, especially in dry locations, and plays a significant role in supplying essential sustenance to millions of people, particularly in developing nations [1]. Despite its importance, sorghum has been relatively understudied compared to prominent crops such as maize, wheat, and rice [2]. Sorghum bicolor is recognized as a staple drought-tolerant crop worldwide. In response to climate change and the need to reduce CO2 emissions, sorghum has been increasingly cultivated in various places, replacing maize and wheat [3,4]. Sorghum is well recognized as a lucrative cereal grain crop owing to its high productivity and ability to thrive in many conditions. The mentioned studies [5,6] highlight the significant role of this component in agricultural methods worldwide. The rise in sorghum usage in the Mediterranean can be attributed to climate change, which has prompted improvements in agricultural techniques and increased awareness of the health benefits associated with sorghum consumption. Overcoming new challenges in this area can aid in expanding sorghum production in Europe, making it a valuable focus for food science research [7,8,9]. The growing fascination with sorghum grain processing has resulted in its heightened utilisation owing to its nutritional attributes and advantages for those with gluten intolerance [10,11]. The husking process for sorghum grain involves removing the outer layer to reach the edible kernel, which may also improve taste and digestion [2]. Hence, grain processing may be regarded as a viable approach to enhance the bioavailability of minerals in processed sorghum grain [12]. The by-products, such as bran, provide useful carbohydrates for various uses [13]. all the mentioned characteristics make sorghum a useful dietary choice with promising prospects in food production [14]. The anti-nutritional content and functional qualities of sorghum may be effectively controlled by processing, suggesting its versatility for many dietary applications [15].
Plant breeders use controlled hybridizations, such as male sterility lines in sorghum breeding, to improve yield and quality. They employ procedures that consider the development patterns and pollination tendencies of varieties of crops [16]. Exploring male sterility induction techniques in sorghum, focusing on several ways to improve yield and quality in sorghum breeding programmes [17,18]. In addition, the grain colour profile is crucial since it directly impacts the grain's nutritional composition and overall quality [19]. Sorghum exhibits variations in pericarp colour, including white, black, and red, which might affect the nutritional and antioxidant characteristics due to the flavonoid concentration in the aleurone layer and seed coat of the grain [20]. The colour of the grain is mostly governed by genetic regulation, with several alleles controlling the grain's colour [21]. The measurement of colour is crucial in evaluating grain and grain products since it significantly impacts the quality of the final product. Moreover, in industry, it is advantageous for the grain colour variation to enhance the texture and appearance of end product responses within a product shape quality, which can allow to creation of novel products based on the colour variation properties [5,22]. All the mentioned characteristics indicated the crucial role of colour measurement for our inbred line sorghum varieties [21]. Despite the valuable insight about sorghum in male sterility lines, the relationship between the husking process and the nutritional characteristics of sorghum, especially in male sterility lines, needs to be better recognised. For several reasons, it is crucial to comprehend the effects of husking on the nutritional content of diverse sorghum races Male Sterility Lines. Firstly, it guarantees that sorghum grains are used to their fullest potential in human and animal diets, maximising their nutritional advantages [23,24]. Additionally, it offers significant information for food processing firms to create effective food processing industries that reduce nutritional loss [25]. Understanding the relationship between male sterility lines in sorghum breeding programmes and grain processing procedures is crucial for sustainable agricultural growth due to the increasing significance of male sterility lines [26,27]. As the Inbred line varieties are essential for producing crop varieties with increased nutritional quality and high yield potential. They serve as the genetic basis for breeding programmes aimed at enhancing crops' nutritional value and productivity [28].
On other hand, the Studying the colour characteristics of sorghum is important because it offers useful information on its nutritional content, processing compatibility, and consumer appeal, which in turn affects its use in food, feed, and industrial purposes [29,30]. Specifically, the previous investigations indicated the efficiency of time-unit processing on sorghum nutritional properties [31]. Different cultivars are classified depending on their tannin content. The Konica Minolta CR-410 colorimeter is used for general colour categorization [32,33].
The study aimed to investigate how the husking method changed the nutritional value of three types of sorghum grown on male sterility lines over 30 (S) and 80 (S) time units. The research attempted to clarify the effect of husking on the overall nutritional quality of sorghum grains by analysing differences in nutrient content such as dry matter, proteins, and minerals. Additionally, by comparing these effects across various sorghum races, one might aim to identify race-specific differences that can impact nutritional results, contributing to the diverse races' future improvements.
2. Material and Methods
2.1. Collection and Sample Preparations
We acquired identical samples of three sorghum racial varieties from Alpha Seed Breeding House in Karcag, catogerised to three sorghum races with various ripping time such as (S. bicolor), had early and middle early ripping time. In contrast, the kafirin races were distinguished with late ripping stage. The samples were dried, and the grain samples were finely processed using the Retsch SK-3 hammer mill with a 1 mm sieve. The careful grinding process, which ensured the samples were homogeneous, was essential for producing accurate and reliable analytical results. The milled whole grains were compared to the hulled grains for the investigation outcomes.
2.2. Application of Husking Procedure
The sorghum grains were husked using the TM05C husker equipment from Satake Engineering Co. in Hiroshima, Japan. Following [34] instructions, the Satake TM05C grain testing mill (TM05C, Satake Engineering Co., Hiroshima, Japan) processed 50 g of sorghum grains in the husker with a 46–60 mesh abrasive wheel and 54 Kw power (SATAKE, 1896). The abrasive wheel rotated at 800–1,100 rpm and was sifted through a No. 60 mesh sieve (4760 µm). The analysis found that the effective grain size diameters varied between 3.0 mm, 3.2 mm, 3.6 mm, 4.0 mm, and 4.5 mm. The grain size range of 4.0 mm–4.5 mm was the most efficient and was selected for the Husking-Fraction Time Unit (HFTU) method research.
2.3. Determination of the Crude Protein
The nitrogen levels in sorghum samples were analysed using the Kjeldahl technique according to [35]. The tube was inserted into a block heater set at a temperature range of 420–430 °C for 2 hours. Following digestion, the samples were left to cool. Furthermore, we used Converter 6.25 to determine the total protein content.
2.4. Determination of Dry Matter
The following steps measured the dry matter content:
Drying Procedure: The sample was put in an oven set to a temperature range of 130–135 °C. The sample was dried in the oven until it reached a consistent weight. All moisture content was successfully eliminated from the model.
Measuring the weight of the dehydrated sample: The desiccated sample was cautiously removed from the oven. The dried sample's weight was documented [36]. The sample's dry matter content was determined using the following formula:
Dry Matter Content (%) = Weight of Dried Sample × 100
Weight of Original Sample
Weight of Original Sample
2.5. Determination of Mineral Elemental Contents
The grain samples collected during the experiments were analysed at the Central Chemical Laboratory of the Agricultural Centre, University of Debrecen. To ensure accuracy, we validated the measurements using a genuine wheat sample designated as BCR CRM 189 (whole grain) from the International Plant Exchange Network, University of Wageningen, as cited by [37]. The measurements were carried out in many stages [38]. We used inductively coupled plasma optical emission spectroscopy (ICP-OES) technology with the iCAP 7400 instrument from Thermo Scientific. The chemical reagents were obtained from VWR International Ltd. (Geldenaaksebaan, Belgium) for conducting element measurements at precise wavelengths: P 177.495 nm, K 404.721 nm, S 183.801 nm, Ca 183.034 nm, Mg 285.204 nm, Na 330.237 nm, Cu 324.754 nm, Fe 238.204 nm, Zn 213.856 nm, and Mn 259.373 nm. We measured 1 g of each sample. The materials underwent aqueous acid digestion, including predigesting and digestion stages. The samples were subjected to heat at 60°C for 30 minutes using a model block digestion equipment (MIM OE-718/A) after adding 10 ml of nitric acid (HNO3, 69% v/v). After a brief cooling period, 3 cm3 of hydrogen peroxide (H2O2, 30% v/v) was introduced to the samples, which were then moved to the first digestion phase. We raised the temperature of the digestor to 120°C and maintained it for 90 minutes before switching it off and letting it stabilise for 10 to 20 minutes. The capacity was raised to 50 cm3 using ultra-pure water from Millipore S.A.S. France. We filtered the homogenised suspension using an MN 640W filter paper. The elements' concentration was indicated based on the weight of the grains when dry, measured in mg/kg-1.
2.6. Evaluation of Hulled S.bicolor Grain Colour
The colours of the husked grains were quantified in terms of L* (whiteness), a* (redness), b* (yellowness), and Y (brightness) values using a Chroma metre (CR-410, Minolta Co. Ltd., Japan) (Konica Minolta, 2002).
2.7. Statistical Analysis
The statistical analysis was performed using SPSS 28.0 software. Descriptive data was used to show the sample size of the original data findings for all variables. The data sets were assessed for Gaussian normality, confirming normal distributions in dry matter, total protein, and mineral contents. An ANOVA one-way analysis was used to determine the variation in dry matter and total protein. Additionally, a separate model was used to analyse differences in mineral content. A linear regression was performed for the colour profile analysis and Pearson correlation to determine statistical significance at a significance level of P≤0.05. The visualisation was created using SAS 17 software.
3. Results and Discussion
3.1. Influence of the (HFTU) Process Attributed to Diverse Sorghum Races
The results showed that the (HFTU) process based on 30 (S) and 80 (S) time units positively impacted the redistribution and concentration of the nutritional contents of the husked product
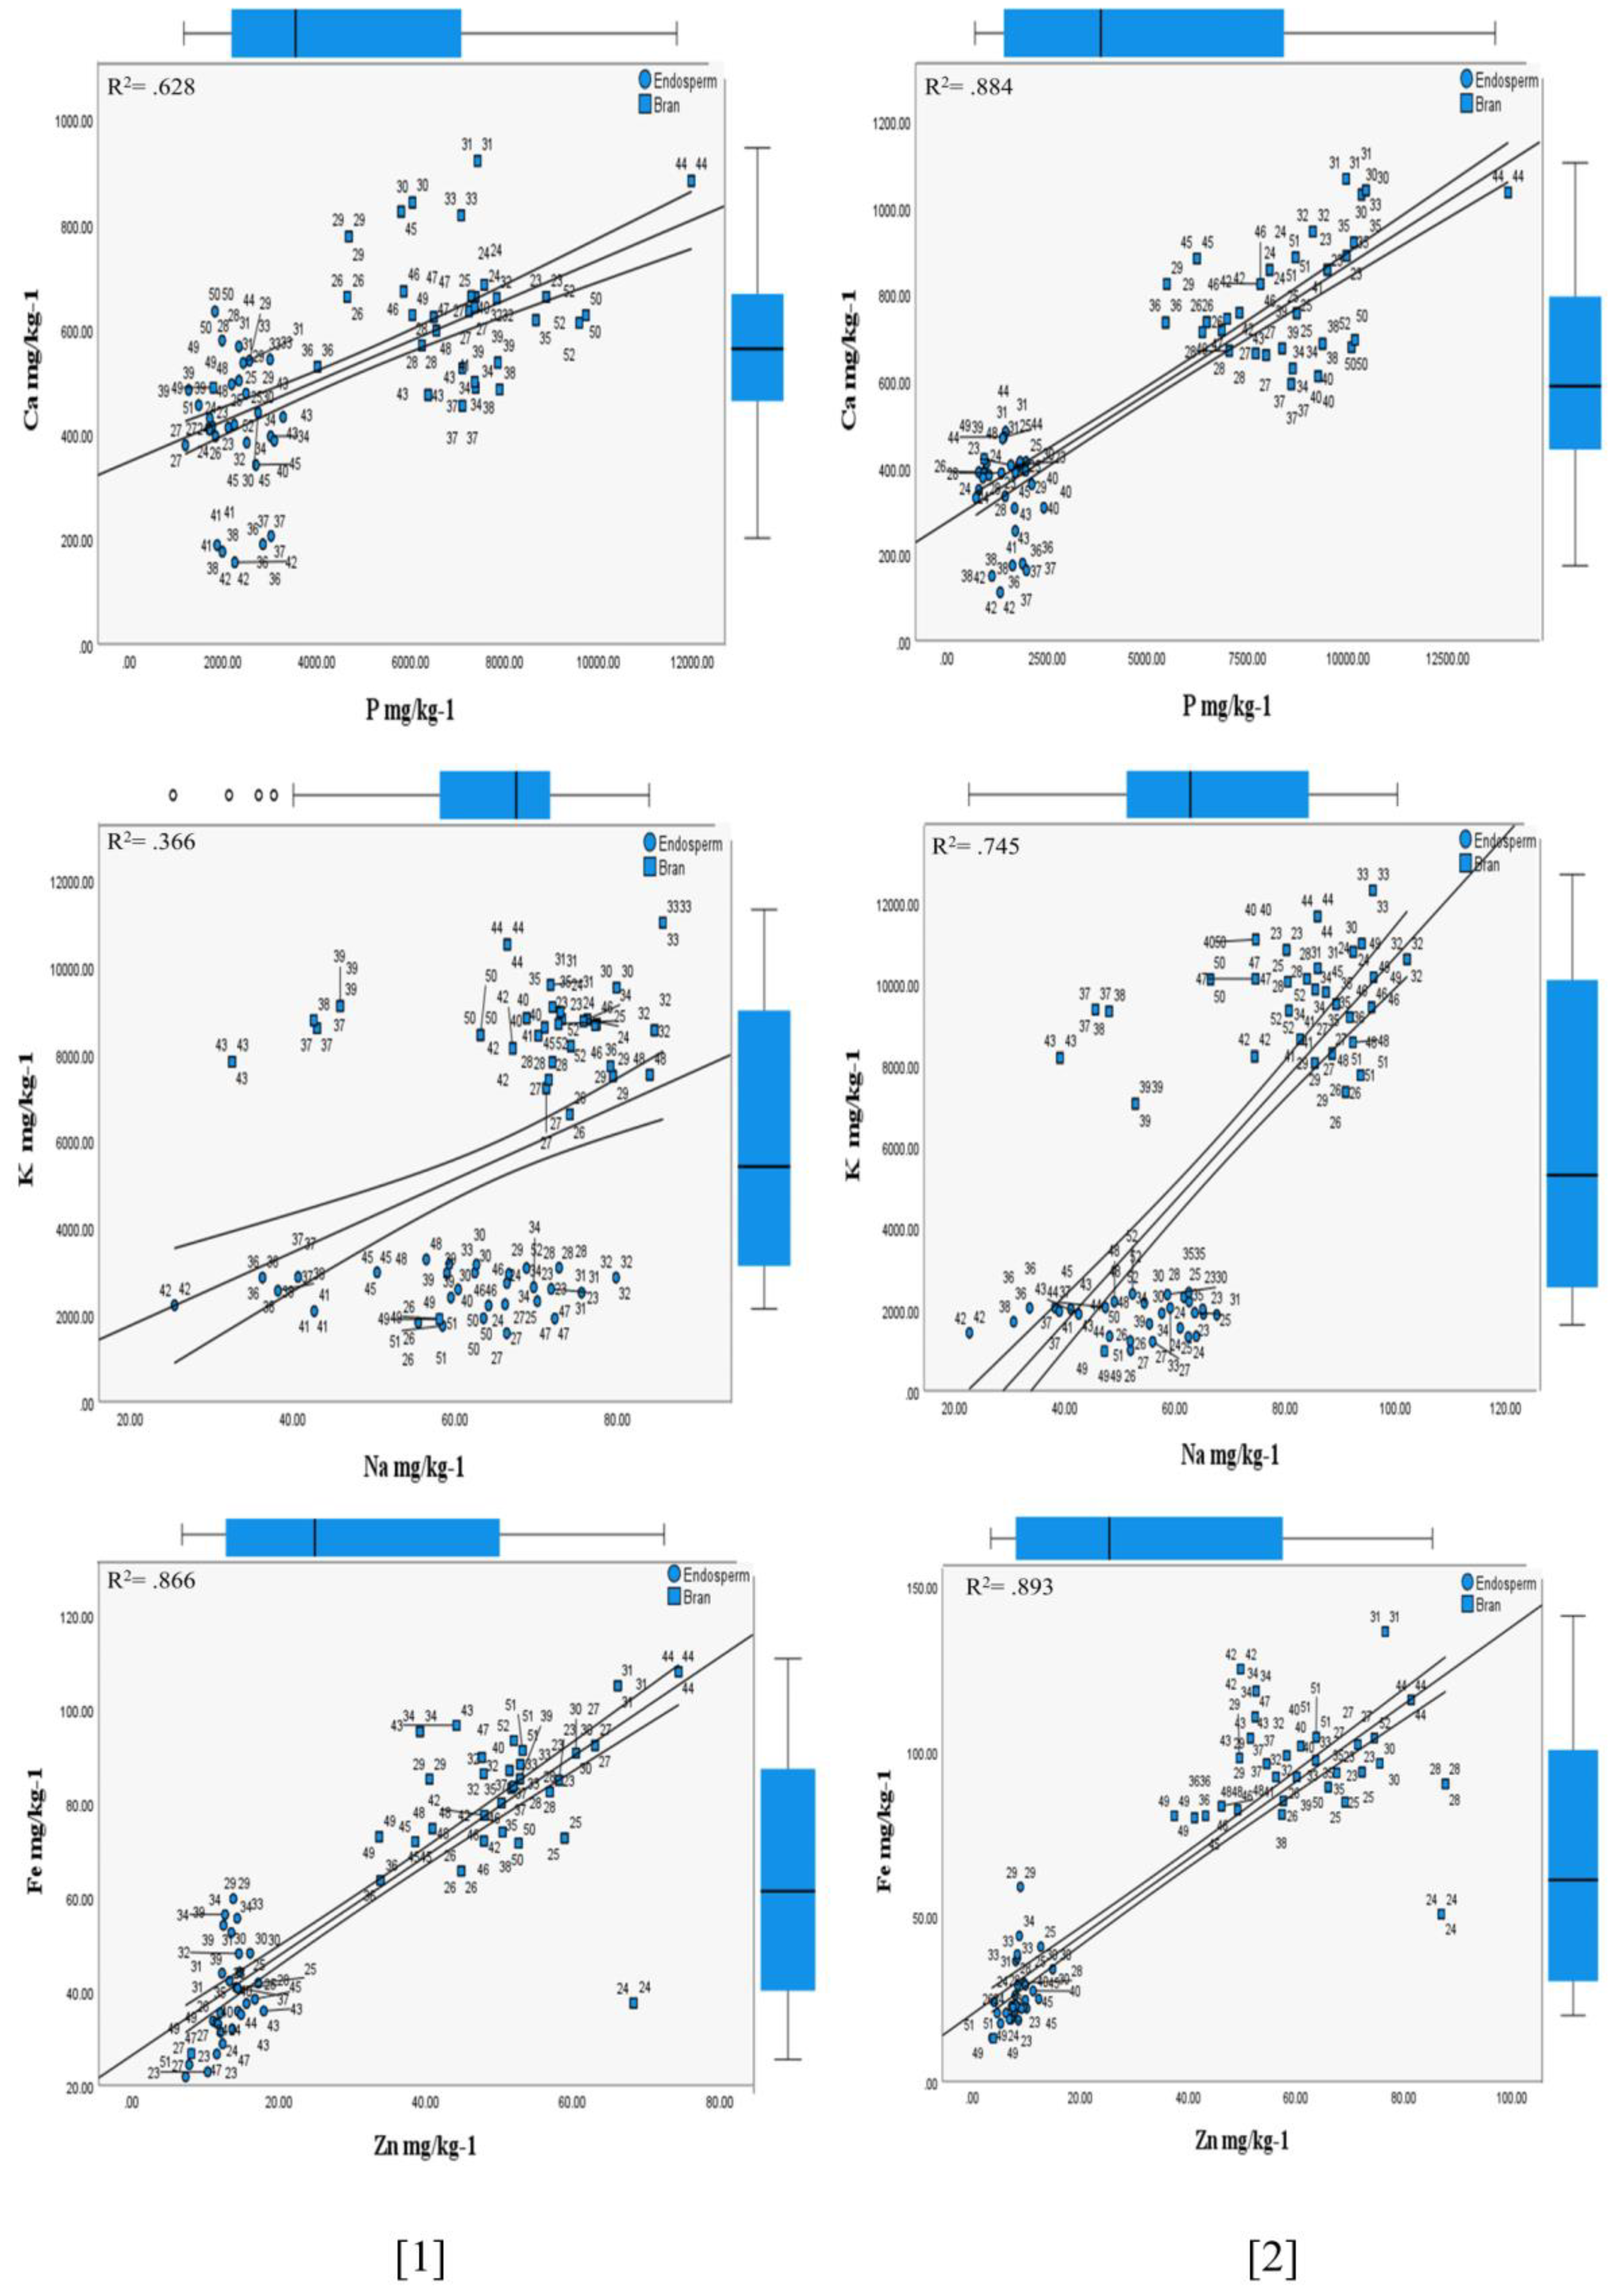
(bran and endosperm (grits)) attributed to the sorghum inbred line races, as are explained in Table 1 and Table 2. When the impact of the (HFTU) Process was highlighted, the changes in the dry matter, total protein, P, K, S, Ca, Mg, Cu, Fe, Zn, Na, and Mn, attributed to two husked products bran and endosperm (grits) compared to the grinding whole grains processed by hammer mill. Which could facilitate understanding the (HFTU) process in nutritional concentrations and redistribution based on the differences of sorghum (S. bicolor, and kafirin) inbred line race varieties [40], the authors reported the impact of variety variation on the sorghum flour type and end product. The correlations were performed for most associated mineral contents that can affect each other, such as Ca: P, K: Na, and Fe: Zn, as shown in Figure 1[1,2]. and Figure 2[1,2].
3.1.1. Influence of the (HFTU) Process on the Dry Matter and Crude Protein
On the other hand, the dry matter was evidenced the positive impact by the (HFTU) process by the positive impact of the husked products compared to the ground whole grains, as was displayed in Table 1 and Table 2; no significant variation was observed among the respective varieties, P > 0.05. The revealed result aligned with [41], reported that the nutrient composition of sorghum grains can vary depending on the variety and year of cultivation, which can indirectly affect the dry matter content of the grains.
The efficiency evaluations of the results were evaluated according to protein% redistribution, reconcentrate, and accumulation in the husked product (bran and endosperm (grits)) attributed to the maturity stages, Table 1 and Table 2, with a significance value (P < 0.05) when the variation of the crude protein % was 19.2% based on the ground whole grains/endosperm (grits) and 10.4% based on the whole grains/bran. The highest protein content was observed within 1.7% in the endosperm (grits) compared to 0.87% in the bran. Which were evidenced by 28.9% of the total varieties having a higher concentration of the protein % in the endosperm compared to the bran attributed to the different ripping stages; (Alpha 4) S.bicolor variety showed the highest protein % content in the endosperm within 1.5% and 1.2% in the bran; the results were lined to previous study was reported by [42,43] authors they reported the relationships between the protein content of with the maturity stages focusing on the protein content in the endosperm part among different maturity stages inbred lines. The revealed results of the protein% indicated that the protein% levels at acceptable ranges in Table 1 and Table 2; according to [44], the author was reported that the Protein constitutes 12% of the grain on a dry-weight basis, and sorghum cultivars vary substantially in total protein. The accuracy and precision of the findings showed that Kiffin races have an abundant protein content (Table 2). The result was aligned with the previous report [43], that the highest total protein content in these lines was almost double that in the kafirin mutant line.
The results for the protein % content in husked grain, indicated that it can meet the recommended dietary protein intake for different sexes and age groups. This topic has been discussed by [45], who have explored the impact of plant protein sources on human health.
3.1.2. Influence of the (HFTU) Process on the Mineral Contents
Phosphorus
A sufficient intake of dietary phosphorus minerals can play a crucial role in humans [46], the study was examined the correlation between cardiovascular illnesses and sufficient dietary phosphorus intake. Therefore, based on the maturity stages, the implication of the (HFTU) process on the phosphorus in diverse inbred line S. bicolor varieties was investigated.
Figure 1.
Relationships between most interacted mineral contents of the S. bicolor races implied by the (HFTU )process attributed to 30 (S) and 80 (S) time units, P≤0.05. *Numbers [1] correlation based on 30 (S) time unit, [2] correlation based on 80 (S) time unit, the linear correlation analysis was performed based on mean values, with a 95% confidence level.
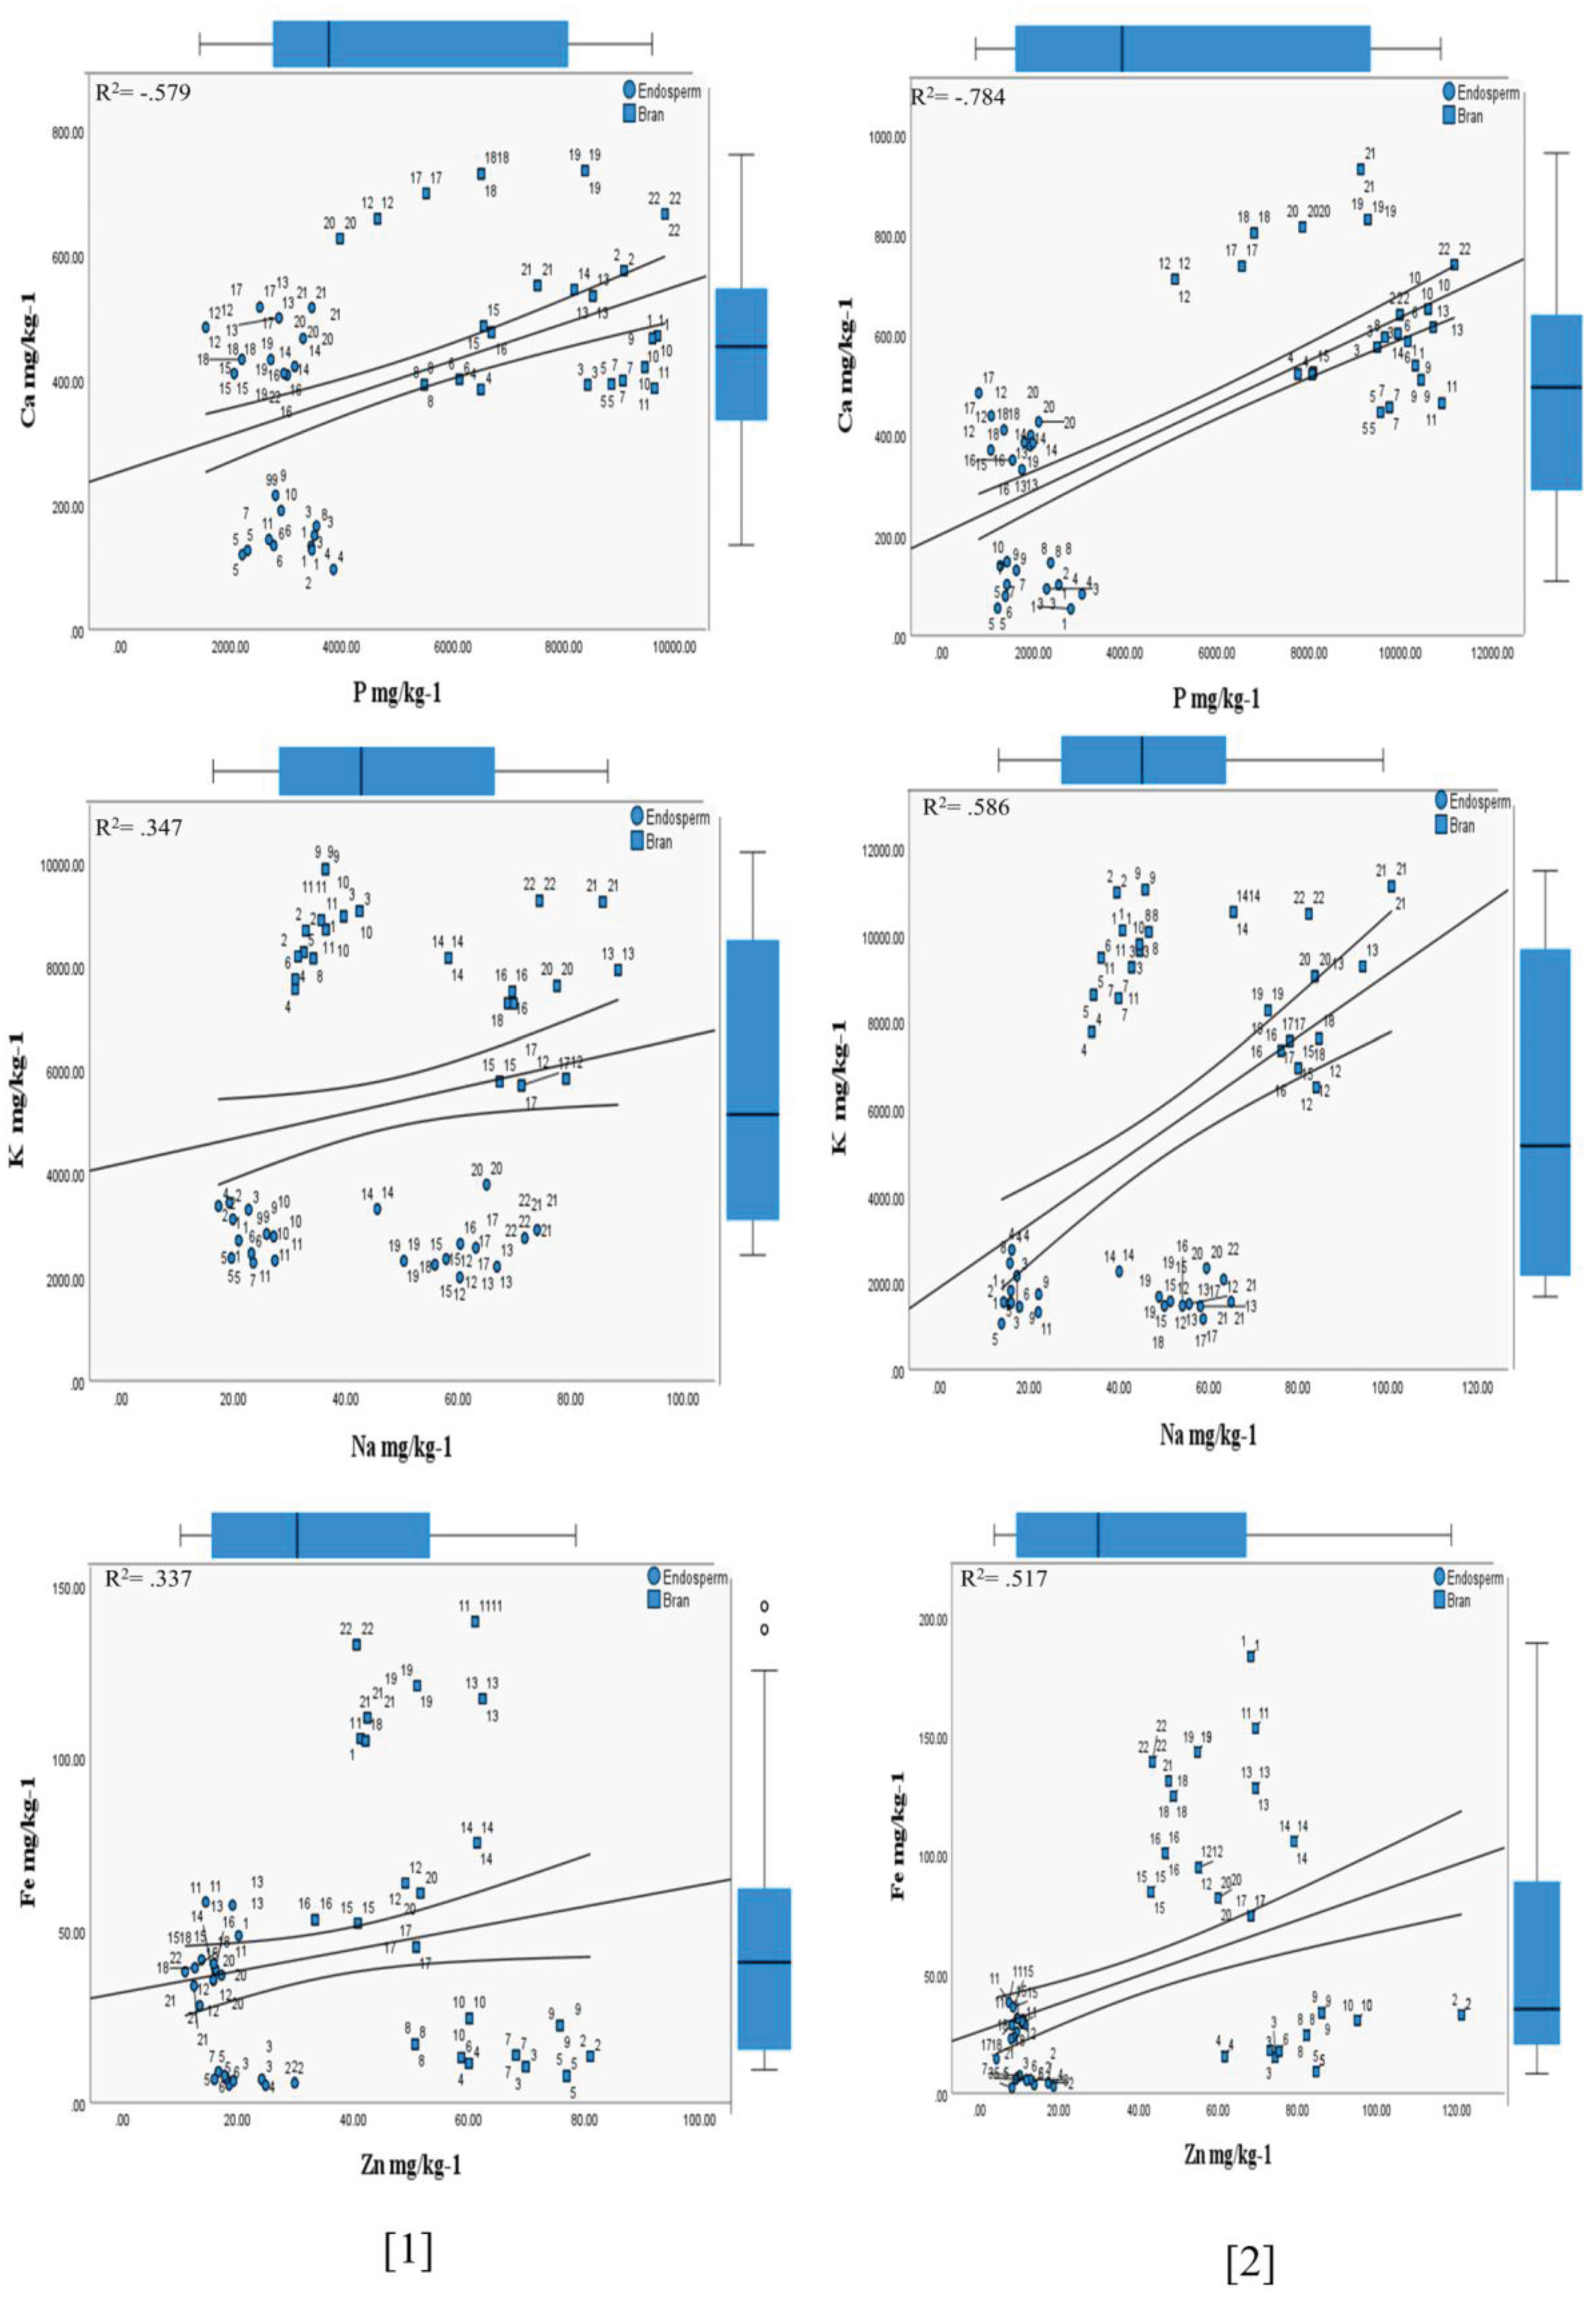
The (HFTU) process positively impacted P mg/kg-1 accumulation in Table 1 and Table 2 in the studied varieties. The P mg/kg-1 contents represented the highest accumulation in the bran within 7985 mg/kg-1 compared to 3137 mg/kg-1 in the whole grains, and the variation of whole
grains/bran was recorded within 154.6%. In contrast, the lowest accumulation was observed in the endosperm grits attributed to early, middle, and late maturity stages, as was shown in Figure 1[1,2] and Figure 2[1,2]. When the variation of 30 (S) and 80 (S) time units was represented within 18.1% in the bran, the revealed finding aligned with [47]; the finding highlighted the importance of considering the distribution of essential nutrients, such as phosphorus, in different parts of the grain, and its implications for food processing, nutritional quality, and food security.
Potassium
Sorghum is a highly nutritious dietary source of important elements, such as potassium, for meeting nutritional requirements and ensuring food security [48,49].
Potassium mineral showed an abundant K mg/kg-1 content in the respective varieties Table 1 and Table 2. The K mg/kg-1 contents were varied attributed to sorghum races, when the Alpha 4 S. bicolor variety (early ripping) showed the highest average of 9754.7 mg/kg-1 attributed to 80 (S) time unite Figure 1[1,2] and Figure 2[1,2], particularly, in the case of kafirin races, which indicated the quality of the respective sorghum races.
The revealed results indicated that the availability of the potassium mineral was abundant during the various ripping stages; that is, sorghum grain crop can consume approximately 80% of the potassium required for production but has only produced 50% of the final plant dry weight prior investigation had revealed variations in traits such as growth stage, grain colour, and yield implied on the nutritional content of sorghum [44]. K mg/kg-1 did not show a significance value (P > 0.05) in the case of whole grain (ground) and husked grain based on sorghum Kafirin races (late ripping stage); the finding lined with [50], the study reported that the variation of potassium concentrations based on the variety, not showed statistical difference (P > 0.05).
Sulphur
The obtained results showed that S mg/kg-1 was affected by the (HFTU) process attributed to 30 (S) time units in the case of the kafirin races, compared to 80 (S) time units when their observed average was demonstrated at 1078 mg/kg-1 and 978.8 mg/kg-1, respectively, with a significance value of P < 0.05. In addition, sulphur mineral showed a good ratio of N/S within 14:1 and 12:1 among the (S.bicolor), and (kafirin) races investigated varieties Table 1 and Table 2, which can refer to sulphur-containing amino acids (methionine and cystine), as well as, we estimated that the (HFTU) process has a positive implication on the nutritional composition availability on the respective inbred line S.bicolor varieties. The findings were linked to [50,51].
Calcium
Generally, sorghum grains are considering as non-rich source for the calcium mineral, which was evidenced the reliability of the finding measurement outcomes implied from the (HFTU) process, Figure 1[1,2] and Figure 2[1,2]. In addition to the observed averages in the whole grain, endosperm (grits), and bran within 447.2 mg/kg-1, 335.5 mg/kg-1, and 655.9 mg/kg-1, respectively.
Table 1 and Table 2 demonstrated the variability attributed to hummer mill and husker TMC50 products according to various maturity stages. Furthermore, calcium mineral levels have a crucial combination with the phytic acids, which can affect the mineral availability and sorghum grain digestibility; according to these binds, as are demonstrated in Figure 1[1,2] and Figure 2[1,2], we can predict that the husked products have a good range of digestibility factors [52,53], authors were explained the binds and implications of the mineral contents and antinutritional in the sorghum grains such as the correlation and ratio of Ca: P. our finding outcomes showed that ratio of Ca: P in the S.bicolor and kafirin races were recorded at 1:12, 1:9, and 1:8, respectively. The recorded results were lined to [54]; the report discussed the effect of Ca: P in sorghum grains in the dietary system.
Figure 2.
Relationships between most interacted mineral contents of the kafirin races implied by the (HFTU )process attributed to 30 (S) and 80 (S) time units, P≤0.05. *Numbers [1] correlation based on 30 (S) time unit, [2] correlation based on 80 (S) time unit, the linear correlation analysis was performed based on mean values, with a 95% confidence level.
Magnesium
The results showed that the (HFTU) process has varied impacts on the Mg mg/kg-1 contents on the whole grain and husked products of the respective varieties based on the various three races, as shown in Table 1 and Table 2. That was allowed to estimate that Mg mg/kg-1 contents were impacted by the variety attributed to sorghum races, which implied from the time unit variations, as the 30 (S) time unit shows the highest concentration of Mg mg/kg-1 within 1657.1 mg/kg-1 compared to 1053.4 mg/kg-1 attributed to 80 (S) time unite Figure 1[1,2], the result was aligned to [55], the study was discussed that the grain processing could affect the mineral distribution and concentration based on fraction milling, leading to nutritional value enhancements. Despite to mentionable variation of Mg mg/kg-1 among the respective sorghum races, the statistical analysis did not show a significance value of (P > 0.05) for the husked fraction products. While the variation ratio of whole grain to bran, was demonstrated at ratio of 5:1.
On the other hand, The Ca: Mg ratio is crucial for maintaining good health, and any deviations from this ratio, especially caused by dietary supplements, as was reported at 1.70-2.60 (weight to weight) according to [56], which was lined our findings showed that ratio was displayed at 2:1.
Sodium
Sodium (Na) mineral content in the cereal grains is a crucial measurement due to the healthy diet issue; the (HFTU) process showed a significant impact on the Na mg/kg-1 redistribution and concentration on the husked S.bicolor grains (Table 1 and Table 2). Based on the revealed result of sodium (Na) mg/kg-1, the mineral showed a reduction, as was noticed on the endosperm (grits), when the S. bicolor and kafirin showed an average of 36.9 mg/kg-1 and 61.8 mg/kg-1attributed to 30 (S) time unit. At the same time, 36.9 mg/kg-1 and 54.4 mg/kg-1 was attributed to 80 (S) time unit, with a significance value of (P < 0.05).
On the other hand, the observed K: Na was calculated to estimate the grain quality [57], as the calculation displayed at 142:1 in the case of the S. bicolor races and 125:1 in the case of the kafirin races as implied from 30 (S) and 80 (S) time units Figure 1[1,2] and Figure 2[1,2], lined to Na mg/kg-1 levels measured by [58].
Potassium and sodium minerals are crucial in cereal grains, significantly impacting taste, moisture content, and consistency. Excessive sodium content may result in baked foods with a rough or chewy texture. These ions also affect the nutritional composition of cereal grains. Regulations may enforce sodium restrictions or mandate the use of potassium-based additions to improve nutrition, which may affect the composition and quality of cereal grain products [59].
On the other hand, the revealed ratio of K: Na was observed within 97:1, compared to 69:1 in the case of ground (whole grains), as the finding was linked to [13,60], as total evaluated ratio belonged to all investigated inbred line varieties (Table 1 and Table 2). Accordingly, the reported results can be highly recommended for creating and developing products from the husked sorghum grains, specifically, products based on the late maturity stages due to association with other nutrient contents such as protein. Results supported the results were reported by [61], authors compared the sorghum protein content and mineral profile to other cereal grains.
Copper
Copper (Cu) mg/kg-1 was the lowest investigated mineral content among all the respective S.bicolor varieties. The observed average among the husked products endosperm (grits) and bran ranged from 2.8 mg/kg-1 to 10 mg/kg-1 Table 1 and Table 2; the bran recorded the highest average within 10.0 mg/kg-1. In contrast, the obtained bran/ whole grain ratio was displayed at 3:1 for the (S. bicolor) races, P < 0.05, while the highest average of 16 mg/kg-1 was observed among (kafirin) races, P > 0.05.
The alpha 4 variety (S. bicolor) early mature grains exhibited a high concentration of Cu (measured in mg/kg-1) in the endosperm (grits). This finding contrasts the results observed in other investigated grains, specifically those (S. bicolor) and the kafirin race. However, it is worth noting that the Cu mg/kg-1 content in all grains fell within acceptable ranges, as [62], the authors were discussed, and they reported the recommended copper intake for different dietary groups.
Iron
The (HFTU) process positively impacted Fe mg/kg-1 contents among all investigated sorghum inbred line races; however, the effect of the (HFTU) process fluctuated in a high concentration of endosperm (grits) and bran, specifically among the (S. bicolor) races as is represented in Table 1 and Table 2, the result supposed the maturity stages were affected on the grain hardness as was revealed in previous study related with the hardness of the cereal grain [63], the result reported that the nutrient content and sedimentation volume in grain varied across different maturity stages.
As evidence of the (HFTU) process precision and accuracy, the content of the iron mineral was associated with total protein contents, for example, Apha4 and alph5 (Table 1); the result was lined with previous findings [64], the research suggested that increasing the iron concentration in sorghum grains might enhance their protein content, hence improving their nutritious value.
Zinc
The findings were indicated that Zn mg/kg-1 contents was enhanced after the (HFTU) process as was evidenced by higher accumulation in the husked grain (bran) than ground grain (whole grain) within an average of 23.3 mg/kg-1and 58.7 mg/kg-1, respectively. The findings are demonstrated in Table 1 and Table 2.
As well as the positive effect of the fraction time unites variation was demonstrated by the increasing proportionally average were implied from 30 (S) and 80 (S) time unites within an average 53.1 mg/kg-1 and 64.4 mg/kg-1, respectively, besides calculated variation ratio within 9.64%. Zinc mineral result was independently from protein results Table 1 and Table 2, which was contrary to [64], as the author revealed that Zinc (Zn) mineral was highly associated with levels of the crude protein in that investigated sorghum grains. While the revealed results of the enhanced Zn mg/kg-1 levels in the examined inbred line varieties, were lined to achieved report by [67].
Moreover, Figure 1[1,2] and Figure 2[1,2] showed that 80 (S) time units significantly impacted the reconcentration of iron and zinc minerals in the diverse sorghum races (S.bicolor and kafirin) confirmed the result outcomes [68], as evidenced by a strong correlation between Fe mg/kg-1 and Zn mg/kg-1 in case of S. bicolor and kafirin with a coefficient correlation of r = .517 and r = 893, respectively.
The findings indicated that the observed levels of Fe mg/kg-1 and Zn mg/kg-1were in acceptable ranges, which can allow to create of healthy sorghum products to meet the desired nutritional and commercial product requirements lined study by [22,25], as the researcher was discussed the crucial required nutritional features that can influence the end products.
Manganese
Due to the crucial role of manganese (Mn) mg/kg-1, it belongs to the investigated minerals, the obtained results showed a good implication of the (HFTU) process on Mn mg/kg-1 accumulation in the husked products within an average of 34.6 mg/kg-1 compared to the ground grains (whole grains) as recorded (bran) attributed to sorghum race varieties, supported to study outcome report by [69,70] average within 17.7 mg/kg-1 as shown in Table 1 and Table 2. On the other hand, the variation ratio implied from 80 (S) and 30 (S) time units was observed at 10.13 %, with a significance value of (P < 0.05).
3.1.3. Evaluation of Colour Profile
The finding was indicated that genetic variation was controlled colour characteristic profiles [21]. and grain process was affected by the colour profile of the examined inbred line varieties. Enhances texture and appearance [71,72,73]. The results indicated that the colour characteristics of investigated varieties were influenced by the (HFTU) process, which was attributed to 30 (S) and 80 (S) time units.
Colour Characteristics Attributed to 30 (S) and 80 (S) Time Unites
Based on the findings obtained from the Husking Fraction Time Unit (HFTU) technique, the colour characteristics of the assessed varieties showed fluctuations across 30 (S) and 80 (S) time units, as shown in Figure 3[1–4]. These fluctuations were statistically significant, with a significance value of (P < 0.05). The results indicated that the colour change characteristic was present in all stages of grain maturity [15]. Specifically, the positive spectrum of colour parameters in the endosperm (grits) was seen commencing at 30 (S) time units.
Contrary to the colour changes of the bran attributed to 80 (S) time units, the brown pericarp colour of the middle and late maturity stages as shown in (Table 1 and Table 2) was affected by the negative spectrum of a* at (-2). Additionally, the observed reductions in darkness (L*) and brightness (Y) were implied from the (HFTU) process of 80 (S) time units, with their spectrums ranging from 40 to 70 and 35 to 50, respectively.
4. Conclusion
In summary, this research contributes to the broader understanding of sorghum grain quality and processing, particularly in the context of male sterility lines. By comprehensively assessing the nutritional consequences of the husking process across different sorghum races, we aim to inform agricultural practices and food policies, ultimately enhancing food security and nutritional well-being on a global scale.
The processing of sorghum grains is a complex undertaking affected by several crucial aspects, including the diverse races and the colour of the grain's pericarp, which showed a significant variation in the nutritional profile of the examined inbred line varieties. During our inquiry, we examined the complex correlation between these parameters, and sorghum grain processing was attributed to the (HFTU) process based on two fraction time units, namely 30 (S) and 80 (S).
Certainly, the results of our investigation demonstrated that the time units of Husking Fraction had a crucial influence in optimising the processing outcomes. We found a clear association between the time per second and the nutritional profile of the husked grains, which evidenced the accuracy of the obtained findings. For example, notice the buildup of nutritional content in the endosperm (girts) of the alpha-4 (S. bicolor) variety. In addition, we have discovered distinct correlations between protein concentration and iron content in the initial and intermediate phases of maturation, highlighting the significance of timing in optimising nutritional quality.
Furthermore, our research provides insight into the influence of processing on the decrease of tannins, namely via the husking procedure based on the employed fraction of time units per second. By explaining the differences that have been seen, we can make sorghum grain processing methods more effective and high-quality while also considering how these techniques may affect the maturity stage of the grains that have been tested. Hence, the inquiry sought to select the key nutritional components that might be optimised by food consumption to improve metabolic health.
Nevertheless, it is crucial to recognise the intrinsic variety in the characteristics of sorghum grains, as shown by the wide range of colour attributes seen in our studies. The presence of diversity highlights the intricate nature of sorghum processing and emphasises the need for customised methods to match the varied properties of the grains. In particular, the (HFTU) process showed an acceptable level of investigated minerals; besides, the revealed ratios of the essential minerals can interact and affect each other, such as Ca: P, K: Na, and Fe: Zn, respectively.
Inbred line variants are vital in creating genetic variety, maintaining desirable traits, and generating variations without compromising production. Consequently, they play a crucial role in enhancing the nutritional value of key food crops.
We develop processing methods that improve nutritional value and reduce tannin levels to enhance the final product's texture, flavour, shelf life, and nutritional profile. These methods also help determine the product's suitability for customer preferences and specific applications.
The study's lack of a hardness test was one of its flaws. That has resulted in limitations in figuring out how hardness affects the nutritional content of the endosperm (grits) and bran after they have been husked. Subsequent investigations should use hardness testing to acquire additional, complete comprehension. In addition, physical property tests for the same husked product can facilitate sorghum product creation.
Funding
The research was funded by the Stipendium Hungaricum with the registration number SHE-14103-007/2020 and included cooperation with the agricultural institutions' exchange programme at the University of Debrecen.
Data Availability Statement
The authors indicate that the data supporting the study's conclusions is available in the publication. The corresponding author may provide the raw or analysed data supporting the results of this study upon request.
Conflicts of Interest
The authors affirm that they do not have any conflicting financial interests or personal relationships that might have influenced the study's findings.
References
- M. S. Hossain, M. N. Islam, M. M. Rahman, M. G. Mostofa, and M. A. R. Khan, “Sorghum: A prospective crop for climatic vulnerability, food and nutritional security,” J. Agric. Food Res., vol. 8, no. October 2021, p. 100300, 2022. [CrossRef]
- E. V. Aguiar, F. G. Santos, V. A. V. Queiroz, and V. D. Capriles, “A Decade of Evidence of Sorghum Potential in the Development of Novel Food Products: Insights from a Bibliometric Analysis,” Foods, vol. 12, no. 20, 2023. [CrossRef]
- T. T. George, A. O. Obilana, A. B. Oyenihi, A. B. Obilana, D. O. Akamo, and J. M. Awika, “Trends and progress in sorghum research over two decades, and implications to global food security,” South African J. Bot., vol. 151, pp. 960–969, 2022. [CrossRef]
- C Henley, “Sorghum : An Ancient , Healthy and Nutritious Old World Cereal Sorghum : An Ancient , Healthy and Nutritious Old World Cereal Table of Contents,” p. 33, 2010.
- R. C. N. Thilakarathna, G. D. M. P. Madhusankha, and S. B. Navaratne, “Potential food applications of sorghum (Sorghum bicolor) and rapid screening methods of nutritional traits by spectroscopic platforms,” J. Food Sci., vol. 87, no. 1, pp. 36–51, 2022. [CrossRef]
- J. Jóvér, G. Kovács, L. Blaskó, C. Juhász, and E. Kovács, “Evaluation of Sweet Sorghum (Sorghum Bicolor) Hybrids As Bioenergy Feedstocks in Relation To Climatic Aspects,” Nat. Resour. Sustain. Dev., vol. 10, no. 2, pp. 161–174, 2020. [CrossRef]
- J. Jóvér, E. Kovács, P. Riczu, J. Tamás, and L. Blaskó, “Spatial decision support for crop structure adjustment - A case study for selection of potential areas for sorghum (Sorghum bicolor (L.) Moench) production,” Agrokem. es Talajt., vol. 67, no. 1, pp. 49–59, 2018. [CrossRef]
- J. G. Höhn and R. P. Rötter, “Impact of global warming on European cereal production,” CAB Rev. Perspect. Agric. Vet. Sci. Nutr. Nat. Resour., vol. 9, no. December 2017, 2014. [CrossRef]
- J. Berenji, J. Dahlberg, V. Sikora, and D. Latkovič, “Origin , History , Morphology , Production , Improvement , and Utilization of Broomcorn [ Sorghum bicolor ( L .) Moench ] in Serbia Author ( s ): Janoš Berenji , Jeff Dahlberg , Vladimir Sikora and Dragana Latković Published by : Springer on behalf of New,” vol. 65, no. 2, pp. 190–208, 2011.
- R. Maurya and D. G. , Thirupataiah Boini , Lakshminarayana Misro , Thulasi Radhakrishnan , Aswani Pulikunnel Sreedharan, “Comprehensive review on millets : Nutritional values , effect of food processing and dietary aspects,” J. Drug Res. Ayurvedic Sci. |, 2023. [CrossRef]
- D. Baholet, K. Mrvova, P. Horky, and L. Pavlata, “Comparison of nutrient composition of sorghum varieties depending on different soil types,” Proc. 25Th Int. Phd Students Conf. (Mendelnet 2018), vol. 25, pp. 100–103, 2018, [Online]. Available: http://mendelnet.cz/artkey/mnt-201801-0019_Comparison-of-nutrient-composition-of-sorghum-varieties-depending-on-different-soil-types.php.
- Conference, T. H. E. Geneticss, S. Of, and B. O. F. Proceedings, “Annual conference the geneticss society of nigeria book of proceedings,” no. October, 2021.
- S. Widowati and P. Luna, “Nutritional and Functional Properties of Sorghum (Sorghum bicolor (L.) Moench)-based Products and Potential Valorisation of Sorghum Bran,” IOP Conf. Ser. Earth Environ. Sci., vol. 1024, no. 1, 2022. [CrossRef]
- L. Girard and J. M. Awika, “Sorghum polyphenols and other bioactive components as functional and health promoting food ingredients,” J. Cereal Sci., vol. 84, no. October, pp. 112–124, 2018. [CrossRef]
- M. N. S. Htet, B. Feng, H. Wang, L. Tian, and V. Yadav, “Comparative assessment of nutritional and functional properties of different sorghum genotypes for ensuring nutritional security in dryland agro-ecosystem,” Front. Nutr., vol. 9, no. November, pp. 1–13, 2022. [CrossRef]
- D. A. S. John Milton Poehlman, “Breeding Field Crops,” Iowa State Univ. Press /Ames, no. Fourth Edition, 1995, [Online]. Available: ISBN 0 8138 2427 3.
- J. Chen, Y. Jiao, H. Laza, P. Payton, D. Ware, and Z. Xin, “ Identification of the First Nuclear Male Sterility Gene ( Male-sterile 9 ) in Sorghum ,” Plant Genome, vol. 12, no. 3, pp. 1–12, 2019. [CrossRef]
- Z. Xin et al., “Morphological characterization of a new and easily recognizable nuclear male sterile mutant of sorghum (Sorghum bicolor),” PLoS One, vol. 12, no. 1, pp. 1–14, 2017. [CrossRef]
- C. K. Black and J. F. Panozzo, “Accurate technique for measuring color values of grain and grain products using a visible-NIR instrument,” Cereal Chem., vol. 81, no. 4, pp. 469–474, 2004. [CrossRef]
- M. Sedghi, A. Golian, P. Soleimani-Roodi, A. Ahmadi, and M. Aami-Azghadi, “Relationship between color and tannin content in sorghum grain: Application of image analysis and Artificial Neural Network,” Rev. Bras. Cienc. Avic., vol. 14, no. 1, pp. 57–62, 2012. [CrossRef]
- L. Li et al., “Grain color formation and analysis of correlated genes by metabolome and transcriptome in different wheat lines at maturity,” Front. Nutr., vol. 10, no. February, 2023. [CrossRef]
- Batariuc, I. Coțovanu, and S. Mironeasa, “Sorghum Flour Features Related to Dry Heat Treatment and Milling,” Foods, vol. 12, no. 11, 2023. [CrossRef]
- M. Muthamilarasan and M. Prasad, “Small Millets for Enduring Food Security Amidst Pandemics,” Trends Plant Sci., vol. 26, no. 1, pp. 33–40, 2021. [CrossRef]
- D. Saha, M. V. C. Gowda, L. Arya, M. Verma, and K. C. Bansal, “Genetic and Genomic Resources of Small Millets,” CRC. Crit. Rev. Plant Sci., vol. 35, no. 1, pp. 56–79, 2016. [CrossRef]
- G. A. Nayik, T. Tufail, F. Muhammad Anjum, and M. Javed Ansari, Cereal Grains: Composition, Nutritional Attributes, and Potential Applications, no. February. 2023.
- C. P. Karumba, “Improvement of somatic embryogenesis and androgenesis systems for sorghum [ Sorghum bicolor ( L .) Moench,” Ph.D. Diss., 2021.
- Kumar et al., “Recent Advances in Sorghum Genetic Enhancement Research at ICRISAT,” Am. J. Plant Sci., vol. 02, no. 04, pp. 589–600, 2011. [CrossRef]
- K. B. Gaikwad et al., “Enhancing the Nutritional Quality of Major Food Crops Through Conventional and Genomics-Assisted Breeding,” Front. Nutr., vol. 7, no. November, 2020. [CrossRef]
- T. L. Souza, L. A. Souza, I. S. Barbosa, D. C. M. B. Santos, R. G. O. Araujo, and M. G. A. Korn, “Mineral and Trace Elements in Nutritious Flours: Total Contents, In Vitro Bioaccessibility and Contribution to Dietary Intake,” Biol. Trace Elem. Res., vol. 201, no. 9, pp. 4600–4611, 2023. [CrossRef]
- K. Ertl and W. Goessler, “Grains, whole flour, white flour, and some final goods: an elemental comparison,” Eur. Food Res. Technol., vol. 244, no. 11, pp. 2065–2075, 2018. [CrossRef]
- N. U. Sruthi, P. S. Rao, and B. D. Rao, “Decortication induced changes in the physico-chemical, anti-nutrient, and functional properties of sorghum,” J. Food Compos. Anal., vol. 102, no. June, p. 104031, 2021. [CrossRef]
- T. S. Steinberg, E. P. Meleshkina, O. G. Shvedova, O. V. Morozova, and N. S. Zhiltsova, “Changes of the Optical Properties of Top-Grade Flour (Semolina) From Durum Wheat During Its Ripening,” Pis. Sist. Syst., vol. 3, no. 2, pp. 24–28, 2020. [CrossRef]
- Konica Minolta, “Chroma Meter Konica Minolta Cr-400/410. Instruction Manual,” p. 160, 2002, [Online]. Available: http://sensing.konicaminolta.com.mx/products/cr-410-chroma-meter-difference-with-colorimeter/support/cr-400-410_instruction_eng.pdf.
- N. Wang, “Optimization of a laboratory dehulling process for lentil (Lens culinaris),” Cereal Chem., vol. 82, no. 6, pp. 671–676, 2005. [CrossRef]
- ISO 20483:2013, “INTERNATIONAL STANDARD of the nitrogen content and calculation of the crude protein content — Kjeldahl method iTeh STANDARD PREVIEW iTeh STANDARD PREVIEW,” vol. 2013, 2013.
- K. J. Hellevang, “Grain Moisture Content Effects and Management,” NDSU Extension Service. pp. 1–8, 1995, [Online]. Available: http://www.ag.ndsu.edu/extension-aben/documents/ae905.pdf.
- 37. J. T. John R.N. Taylor, “ICC Handbook of 21st Century Cereal Science and Technology.” pp. 161–171, 2023. [CrossRef]
- B. Kovács, Z. Gyôri, and J. Prokisch, “Communications in Soil Science and Plant Analysis A study of plant sample preparation and inductively coupled plasma emission spectrometry parameters,” Commun. Soil Sci. Plant Anal., no. October 2014, pp. 37–41, 1996. [CrossRef]
- N. R. D. H. Smith, Applied Regression Analysis. 1998.
- R. Rumler1, D. Bender2*, A. Marti3, S. Biber1, and Regine Schönlechner, “Investigating the impact of sorghum variety and type of flour on chemical, functional, 4 rheological and baking properties.” 2024. [CrossRef]
- Osman et al., “Nutrient Composition and In Vitro Fermentation Characteristics of Sorghum Depending on Variety and Year of Cultivation in Northern Italy,” Foods, vol. 11, no. 20, 2022. [CrossRef]
- H. E. Cuevas, K. H. S. Peiris, and S. R. Bean, “Assessment of Grain Protein in Tropical Sorghum Accessions from the NPGS Germplasm Collection,” Agronomy, vol. 13, no. 5, 2023. [CrossRef]
- Khan, N. A. Khan, S. R. Bean, J. Chen, and and Y. J. , Zhanguo Xin, “Variations in Total Protein and Amino Acids in the Sequenced Sorghum Mutant Library,” pp. 1–14, 2023. [CrossRef]
- N. M. Kamal, Y. S. A. Gorafi, H. Tomemori, J. S. Kim, G. M. I. Elhadi, and H. Tsujimoto, “Genetic variation for grain nutritional profile and yield potential in sorghum and the possibility of selection for drought tolerance under irrigated conditions,” BMC Genomics, vol. 24, no. 1, pp. 1–16, 2023. [CrossRef]
- K. S. Poutanen et al., “Grains - a major source of sustainable protein for health,” Nutr. Rev., vol. 80, no. 6, pp. 1648–1663, 2022. [CrossRef]
- M. Gutiérrez, “The connection between dietary phosphorus, cardiovascular disease, and mortality: Where we stand and what we need to know,” Adv. Nutr., vol. 4, no. 6, pp. 723–729, 2013. [CrossRef]
- N. Chhikara, B. Abdulahi, C. Munezero, R. Kaur, G. Singh, and A. Panghal, “Exploring the nutritional and phytochemical potential of sorghum in food processing for food security,” Nutr. Food Sci., vol. 49, no. 2, pp. 318–332, Jan. 2019. [CrossRef]
- W. Khalid et al., “Nutrients and bioactive compounds of Sorghum bicolor L. used to prepare functional foods: a review on the efficacy against different chronic disorders,” Int. J. Food Prop., vol. 25, no. 1, pp. 1045–1062, 2022. [CrossRef]
- W. Laskowski, H. Górska-Warsewicz, K. Rejman, M. Czeczotko, and J. Zwolińska, “How important are cereals and cereal products in the average polish diet?,” Nutrients, vol. 11, no. 3, 2019. [CrossRef]
- Z. S. Mohammed, A. H. Mabudi, Y. Murtala, S. Jibrin, S. Sulaiman, and J. Salihu, “Nutritional Analysis of Three Commonly Consumed Varieties of Sorghum (Sorghum bicolor L.) in Bauchi State, Nigeria,” J. Appl. Sci. Environ. Manag., vol. 23, no. 7, p. 1329, 2019. [CrossRef]
- Torbica, M. Belović, L. Popović, J. Čakarević, M. Jovičić, and J. Pavličević, “Comparative study of nutritional and technological quality aspects of minor cereals Aleksandra,” J. Food Sci. Technol., vol. 58, no. 1, pp. 311–322, 2021. [CrossRef]
- M. M. Tasie and B. G. Gebreyes, “Characterization of Nutritional, Antinutritional, and Mineral Contents of Thirty-Five Sorghum Varieties Grown in Ethiopia,” Int. J. Food Sci., vol. 2020, 2020. [CrossRef]
- M. G. Galán, A. Weisstaub, A. Zuleta, and S. R. Drago, “Effects of extruded whole-grain sorghum (Sorghum bicolor (L.) Moench) based diets on calcium absorption and bone health of growing Wistar rats.,” Food Funct., vol. 11, no. 1, pp. 508–513, Jan. 2020. [CrossRef]
- J. C. Vötterl, J. Klinsoda, Q. Zebeli, I. Hennig-Pauka, W. Kandler, and B. U. Metzler-Zebeli, “Dietary phytase and lactic acid-treated cereal grains differently affected calcium and phosphorus homeostasis from intestinal uptake to systemic metabolism in a pig model,” Nutrients, vol. 12, no. 5, 2020. [CrossRef]
- F. Thielecke, J. M. Lecerf, and A. P. Nugent, “Processing in the food chain: Do cereals have to be processed to add value to the human diet?,” Nutr. Res. Rev., vol. 34, no. 2, pp. 159–173, 2021. [CrossRef]
- R. B. Costello, A. Rosanoff, Q. Dai, L. G. Saldanha, and N. A. Potischman, “Perspective: Characterization of Dietary Supplements Containing Calcium and Magnesium and Their Respective Ratio-Is a Rising Ratio a Cause for Concern?,” Adv. Nutr., vol. 12, no. 2, pp. 291–297, 2021. [CrossRef]
- and M. National Academies of Sciences, Engineering, Dietary Reference Intakes for Sodium and Potassium. 2019.
- N. Khan et al., “Determination of Macronutrients in Spices by Inductively Coupled Plasma-Optical Emission Spectrometry,” Anal. Lett., vol. 47, no. 14, pp. 2394–2405, 2014. [CrossRef]
- S. Qamar, M. Aslam, F. Huyop, and M. A. Javed, “Comparative study for the determination of nutritional composition in commercial and noncommercial maize flours,” Pakistan J. Bot., vol. 49, no. 2, pp. 519–523, 2017.
- C. Williams, C. Ronco, and P. Kotanko, “Whole grains in the renal diet-Is it time to reevaluate their role?,” Blood Purif., vol. 36, no. 3–4, pp. 210–214, 2014. [CrossRef]
- X. Zhou, T. Yue, Z. Wei, L. Yang, L. Zhang, and B. Wu, “Evaluation of nutritional value, bioactivity and mineral content of quinoa bran in China and its potential use in the food industry.,” Curr. Res. food Sci., vol. 7, p. 100562, 2023. [CrossRef]
- J. L. Bresson et al., “Scientific Opinion on Dietary Reference Values for copper,” EFSA J., vol. 13, no. 10, pp. 1–51, 2015. [CrossRef]
- E. H. Horst, S. López, M. Neumann, F. J. Giráldez, and V. H. B. Junior, “Effects of hybrid and grain maturity stage on the ruminal degradation and the nutritive value of maize forage for silage,” Agric., vol. 10, no. 7, pp. 1–17, 2020. [CrossRef]
- Ashok Kumar, K. Anuradha, and B. Ramaiah, “Increasing grain Fe and Zn concentration in sorghum: progress and way forward,” J. SAT Agric. Res., vol. 11, no. 12, pp. 1–5, 2013.
- S. Anitha et al., “Millets Can Have a Major Impact on Improving Iron Status, Hemoglobin Level, and in Reducing Iron Deficiency Anemia–A Systematic Review and Meta-Analysis,” Front. Nutr., vol. 8, no. October, pp. 1–14, 2021. [CrossRef]
- F. Dasa and T. Abera, “Factors Affecting Iron Absorption and Mitigation Mechanisms : A review,” Int. J. Agric. Sci. Food Technol., vol. 4, pp. 24–30, 2018.
- Kotla et al., “Identification of QTLs and candidate genes for high grain Fe and Zn concentration in sorghum [Sorghum bicolor (L.)Moench],” J. Cereal Sci., vol. 90, p. 102850, 2019. [CrossRef]
- Gaddameedi et al., “The location of iron and zinc in grain of conventional and biofortified lines of sorghum,” J. Cereal Sci., vol. 107, no. May, p. 103531, 2022. [CrossRef]
- S. H. S. Omer and Jing Hong Xueling Zheng and Reham Khashaba, “Sorghum Flour and Sorghum Flour Enriched Bread :,” 2023.
- R. Rumler and R. Schönlechner, “Effect of Sorghum on Rheology and Final Quality of Western Style Breads: A Literature Review,” Foods, vol. 10, no. 6, p. 1392, 2021. [CrossRef]
- E. Habyarimana, P. De Franceschi, S. Ercisli, F. S. Baloch, and M. Dall’Agata, “Genome-Wide Association Study for Biomass Related Traits in a Panel of Sorghum bicolor and S. bicolor × S. halepense Populations,” Front. Plant Sci., vol. 11, no. November, pp. 1–19, 2020. [CrossRef]
- S. A. Ayuba, Z. H. Bello, Z. Shehu, and T. Ibrahim, “Effect of Processing on White Sorghum Variety Consumed in Sokoto,” vol. 13, no. 4, pp. 45–50, 2020. [CrossRef]
- M. Abd El-Raouf, E.-M. El - Metwally, and A. Bahar Elddin, “PERFORMANCE OF SOME GRAIN SORGHUM (Sorghum bicolor l. Moench) GENOTYPES UNDER DIFFERENT SOWING DATES IN EGYPT,” J. Plant Prod., vol. 4, no. 5, pp. 763–772, 2013. [CrossRef]
Figure 3.
Features of the colour profile of the investigated inbred line varieties based on the endosperm (grits) and bran, P≤0.05. The letter refers to [1]: endosperm colour properties in case of 30 (S), [2]: bran endosperm colour properties in case of 30 (S), [3]: endosperm colour properties in case of 80 (S), [4]: bran colour properties in case of 80 (S), 22a: refers to alpha 22variety (kafirin races),51a: refers to alpha 51variety (kafirin races).
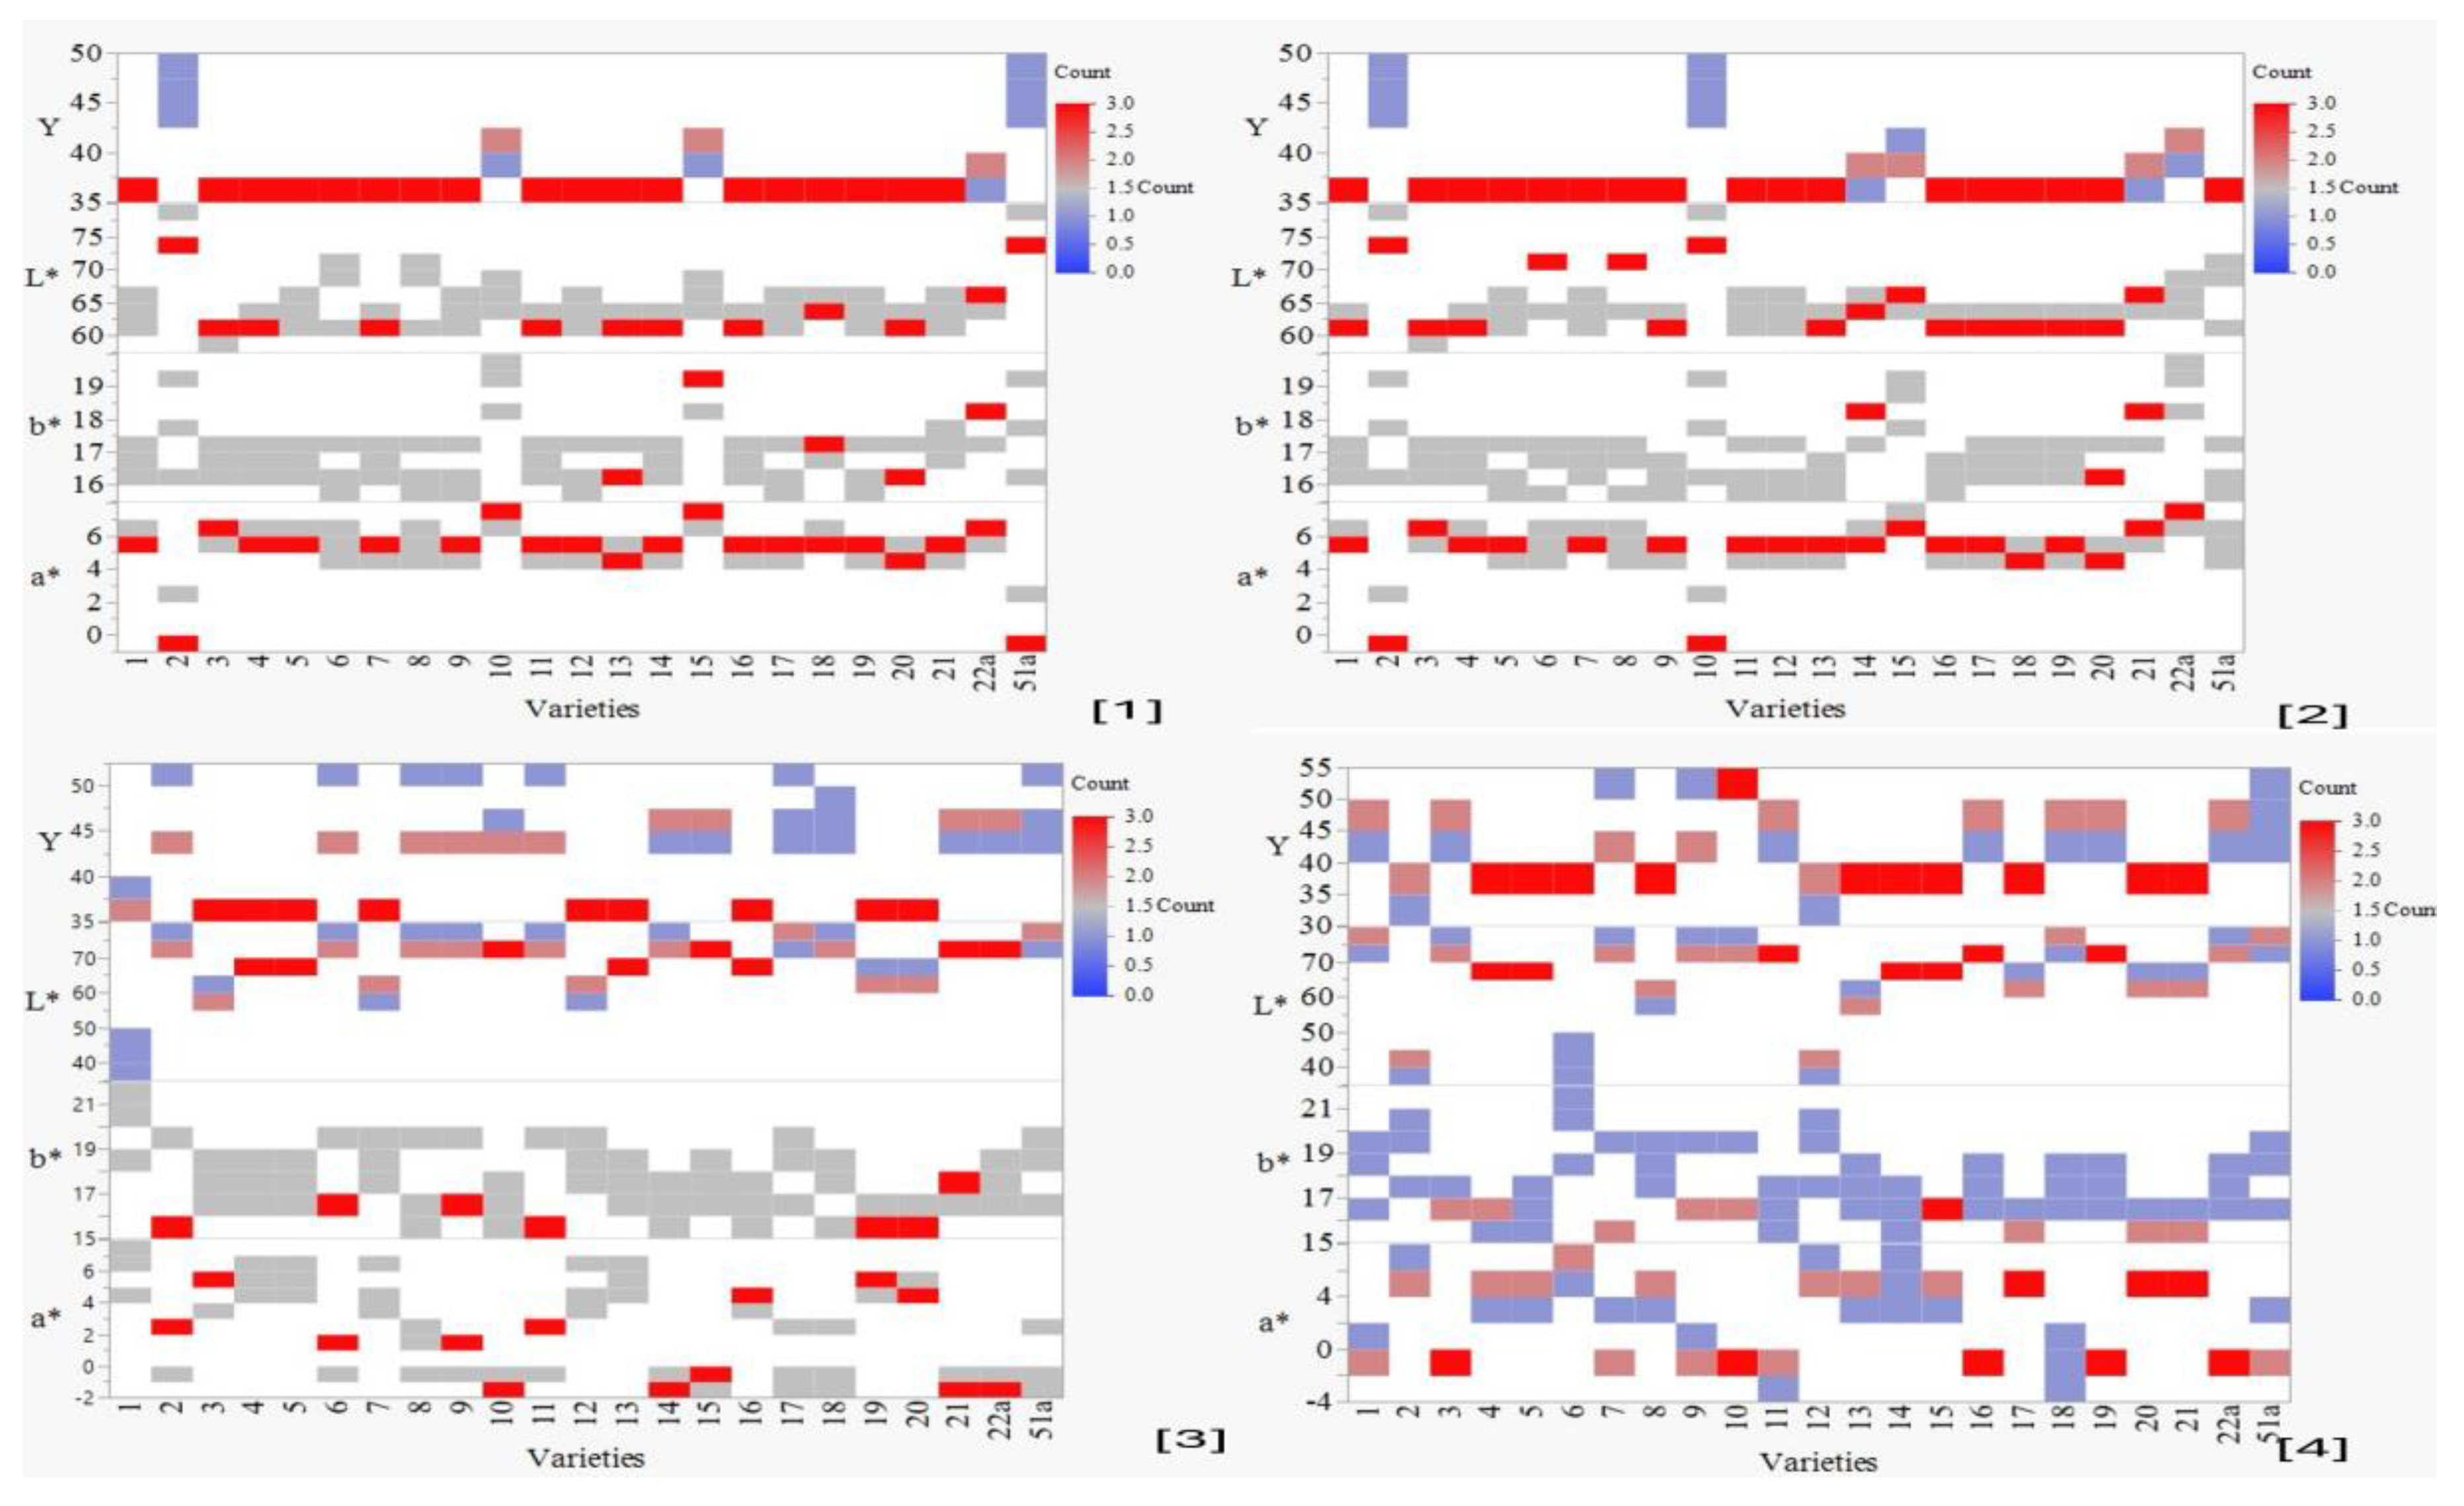

Table 1.
Descriptive analysis of the nutritional contents of diverse S.bicolor race varieties on male sterility line.
Table 1.
Descriptive analysis of the nutritional contents of diverse S.bicolor race varieties on male sterility line.
| Codes | Processed Grains | Pericap Colour |
D.M g/kg-1 |
Protein g/kg-1 |
P mg/kg-1 |
K mg/kg-1 |
S mg/kg-1 |
Ca mg/kg-1 |
Mg mg/kg-1 |
Cu mg/kg-1 |
Fe mg/kg-1 |
Zn mg/kg-1 |
Na mg/kg-1 |
Mn mg/kg-1 |
|---|---|---|---|---|---|---|---|---|---|---|---|---|---|---|
| 1 | 1 | 986±0.03 | 22±0.13 | 4201±36.1 | 3932±2926.3 | 1727±12.4 | 174±6.1 | 2643±0.16 | 4±.23 | 83±0.07 | 29±0.003 | 23±00.31 | 16±1.1 | |
| 2 | Brown | 987±0.47 | 8±0.64 | 2630±201.7 | 2965±166.9 | 1372±54.3 | 114±14.3 | 1721±447.5 | 5±.70 | 25±0.73 | 24±6.8 | 18±2.1 | 11±2.8 | |
| 3 | 987±0.47 | 14±0.21 | 9993±347.8 | 9404±771.8 | 1889±130.2 | 505±37.7 | 4722±166.3 | 8±2.8 | 145±42.6 | 55±14.7 | 34±2.4 | 37±13.6 | ||
| 2 | 1 | 890±0.13 | 23±0.03 | 3877±81.2 | 3650±.41 | 1517±202.1 | 176±8.0 | 2313±0.13 | 6.4±.30 | 39±0.31 | 31±0.12 | 21±.37 | 15±2.2 | |
| 2 | White | 990±0.05 | 16±0.26 | 3005±496.7 | 2929±87.4 | 1591±32.6 | 93±43.7 | 1645±541.6 | 3±0.70 | 39±10.5 | 15±5.1 | 18±3.6 | 8±3.0 | |
| 3 | 990±0.05 | 13±0.10 | 9525±492.9 | 9830±1260.4 | 1705±95.3 | 607±36.3 | 4951±458.3 | 13±4.41 | 23±10.6 | 101±21.9 | 36±3.6 | 57±20.7 | ||
| 3 | 1 | 991±0.04 | 12±0.60 | 3712±14.2 | 2983±0.44 | 1760±67.2 | 261.3±12.1 | 2344±0.27 | 4±0.20 | 35±.01 | 28±0.10 | 21±1.0 | 15±2.2 | |
| 2 | Brown | 991±0.04 | 9±0.58 | 2396±119.2 | 3729±469.0 | 1579±142.6 | 122±31.2 | 1645±468.8 | 3±0.78 | 26±0.63 | 18±6.7 | 20±2.9 | 9±3.1 | |
| 3 | 991±0.04 | 18±0.55 | 9525±492.9 | 9830±1260.4 | 1705±95.3 | 607±36.3 | 4951±458.3 | 13±4.4 | 23±10.6 | 101±21.9 | 36±3.9 | 57±20.7 | ||
| 4 | 1 | 990±0.05 | 20±0.11 | 4185±128.0 | 4047±11.0 | 1555±20.3 | 243±11.2 | 2350±0.33 | 3±0.51 | 30±0.82 | 30±0.10 | 27±0.5 | 14±.23 | |
| 2 | Brown | 990±0.05 | 15±0.02 | 8452±1527.8 | 9565±208.01 | 1412±67.5 | 90±7.3 | 2906±507.6 | 10±0.20 | 94±1.1 | 22±11.3 | 17±0.6 | 33±2.4 | |
| 3 | 990±0.05 | 12±0.09 | 8953±579.6 | 9345±319.1 | 1703±214.2 | 484±100.8 | 4312±233.3 | 9±1.5 | 13±2.5 | 72±2.4 | 44±1.2 | 36±.15 | ||
| 5 | 1 | 98.4±0.28 | 17±0.41 | 2155±125.1 | 2289±192.2 | 1437±234.0 | 192±118.5 | 1399±248.8 | 3.2±0.20 | 39±15.2 | 24±7.0 | 23±.31 | 16±1.12 | |
| 2 | Brown | 991±0.06 | 8±0.02 | 1712±539.8 | 2213±170.5 | 1293±49.4 | 87±35.7 | 1525±97.7 | 3±0.50 | 30±3.0 | 12±4.2 | 17±3.1 | 8±0.9 | |
| 3 | 991±0.05 | 12±0.09 | 2128±407.8 | 3160±663.0 | 1716±85.5 | 453±75.3 | 2342±277.2 | 5±1.7 | 26±0.05 | 61±0.9 | 32±1.6 | 19±1.0 | ||
| 6 | 1 | 980±0.04 | 20±0.02 | 3505±97.1 | 5326±0.29 | 1612±164.0 | 264±21.8 | 2384±.21 | 4±0.1 | 46±0.11 | 26±0.20 | 22±9.7 | 25±6.5 | |
| 2 | White | 991±0.07 | 6±0.02 | 2081±756.2 | 2450±9.3 | 1482±99.3 | 107±30.3 | 143±521.4 | 3±0.5 | 24±0.8 | 16±2.5 | 21±2.8 | 9±3.2 | |
| 3 | 991±0.06 | 12±0.10 | 9199±383.6 | 8442±198.0 | 1688±16.9 | 419±29.1 | 4142±94.2 | 10±1.1 | 28±0.6 | 81±4.2 | 33±1.0 | 32±1.4 | ||
| 7 | 1 | Brown | 894±0.02 | 13±0.01 | 2521±357.1 | 2514±180.8 | 1522±246.2 | 323±153.1 | 1298±336.2 | 5±1.1 | 26±2.2 | 25±4.6 | 27±0.05 | 16±0.10 |
| 2 | 991±0.05 | 12±0.02 | 1861±481.1 | 1397±129.4 | 1251±23.2 | 114±13.6 | 1351±342.2 | 2±0.20 | 18±0.85 | 13±3.5 | 20±4.3 | 11±3.4 | ||
| 3 | 991±0.05 | 19±0.03 | 8130±2209.8 | 8606±947.0 | 1815±237.4 | 494±29.1 | 4542±617.7 | 10±0.50 | 15±2.4 | 67±9.0 | 34±2.7 | 40±6.3 | ||
| 8 | 1 | 984±0.07 | 20±0.02 | 3733±112.3 | 4041±0.24 | 1312±75.0 | 296±.15 | 2516±.08 | 6±0.41 | 28±.03 | 25±.23 | 29±12.5 | 21±7.4 | |
| 2 | White | 991±0.06 | 9±0.32 | 2958±638.7 | 2945±542.9 | 1141±62.8 | 155±10.9 | 1735±338.5 | 3±0.5 | 26±0.6 | 15±2.8 | 18±1.9 | 15±3.5 | |
| 3 | 991±0.06 | 11±0.11 | 9199±383.6 | 8442±198.0 | 1688±16.9 | 419±29.1 | 4142±94.2 | 10±1.1 | 28±0.6 | 81±4.2 | 33±1.0 | 32±1.4 | ||
| 9 | 1 | 985±0.08 | 12±0.001 | 2742±93.4 | 2547±447.0 | 1347±254.0 | 274±.38 | 1714±222.4 | 2±0.39 | 31±12.9 | 19±7.9 | 27±0.11 | 24±1.1 | |
| 2 | White | 991±0.06 | 19±0.33 | 2215±644.5 | 2782±55.9 | 1192±48.1 | 173±46.3 | 1316±429.0 | 3±0.30 | 26±0.42 | 16±4.0 | 24±2.0 | 10±2.6 | |
| 3 | 990±0.02 | 10±0.01 | 7564±2281.3 | 4105±1054.7 | 1689±213.7 | 427±31.1 | 4065±590.8 | 13±2.3 | 20±4.0 | 66±17.2 | 40±6.8 | 55±11.4 | ||
| 10 | 1 | White | 983±0.23 | 18±.003 | 2644±179.1 | 4617±311.0 | 1586±415.4 | 319±298.5 | 1578±254.7 | 4±1.0 | 35±12.0 | 23±7.8 | 28±57.1 | 19±7.9 |
| 2 | 990±0.02 | 14±0.35 | 2165±644.5 | 1659±138.1 | 1402±166.2 | 169±23.6 | 782±2.2 | 1±0.40 | 17±1.1 | 13±4.6 | 22±6.1 | 9±3.6 | ||
| 3 | 990±0.02 | 15.±0.39 | 10013±464.3 | 10455±646.6 | 1652±47.4 | 494±111.6 | 4744±363.6 | 14±2.2 | 28±5.5 | 81±5.5 | 41±5.2 | 53±6.6 | ||
| 11 | 1 | 983±0.23 | 8±0.001 | 2390±372.1 | 5261±197.0 | 1562±280 | 335±173.0 | 1712±155.6 | 4±0.51 | 36±8.4 | 23±3.6 | 30±14.7 | 13±2.9 | |
| 2 | Brown | 990±0.02 | 15.5±0.38 | 1981±771.7 | 2820±544.0 | 1331±103.0 | 142±2.4 | 1176±496.2 | 2±0.50 | 48±11.0 | 11±3.8 | 25±2.9 | 8±1.9 | |
| 3 | 990±0.02 | 10±0.26 | 10019±622.0 | 10868±94.9 | 1931±95.9 | 488±24.2 | 4045±191.8 | 11±0.23 | 27±3.3 | 78±19.1 | 42±2.7 | 61±4.6 | ||
| 12 | 1 | 986±0.01 | 19±0.50 | 2790±1824.1 | 5524±456.8 | 1044±237.0 | 534±119.5 | 1942±942.3 | 5±2.5 | 37±6.9 | 22±7.0 | 34±10.8 | 20±4.4 | |
| 2 | Brown | 991±0.06 | 12±0.34 | 1315±255.3 | 2753±266.4 | 901±35.5 | 461±24.8 | 929±163.5 | 4±0.20 | 33±2.4 | 13±2.6 | 58±2.5 | 8±1.9 | |
| 3 | 991±0.06 | 18±0.08 | 10259±690.5 | 9067±205.5 | 1688±82.1 | 536±126.9 | 4620±168.1 | 8±0.47 | 147±7.5 | 65±4.5 | 39±3.9 | 37±4.4 | ||
| 13 | 1 | Brown | 985±0.04 | 12±0.01 | 3589±114 | 2936±.38 | 1244±.24 | 509±2.12 | 2226±.16 | 6±0.30 | 44±.41 | 24±.20 | 66±12.8 | 15±.71 |
| 2 | 990±0.05 | 9±0.53 | 2307±611.3 | 1328±136.6 | 1086±47.6 | 415±91.8 | 1424±401.3 | 3±0.19 | 44±14.1 | 14±5.2 | 62±4.7 | 9±2.4 | ||
| 3 | 990±0.02 | 14±0.59 | 4860±240.1 | 6163±368.7 | 1335±44.8 | 425±42.4 | 2994±99.6 | 10±1.9 | 79±17.0 | 52±3.3 | 82±2.6 | 29±5.5 | ||
| 14 | 1 | 985±0.13 | 8±0.001 | 3740±520.9 | 4252±0.27 | 1150±77.2 | 274±4.6 | 1536±.17 | 4±0.40 | 41±.20 | 17±.43 | 73±.11 | 14±.10 | |
| 2 | White | 991±0.02 | .93±0.16 | 2546±662.8 | 3787±514.5 | 1057±66.3 | 411±11.7 | 1068±290.3 | 2±0.10 | 31±5.5 | 13±3.4 | 43±2.9 | 9±2.9 | |
| 3 | 990±0.02 | 14±0.12 | 9607±1194.0 | 11949±30.2 | 1622±117.4 | 684±29.3 | 4398±520.0 | 14±0.94 | 122±5.9 | 66±3.8 | 91±3.2 | 40±.20 | ||
| 15 | 1 | 981±0.11 | 15±0.02 | 3667±86.1 | 3443±126.8 | 1095±18.6 | 419±20.0 | 1883±.01 | 3±0.42 | 50±.05 | 22±.10 | 60±8.3 | 15±1.8 | |
| 2 | Brown | 990±0.01 | 8±0.42 | 2279±804.6 | 3056±451.6 | 885±56.9 | 379±31.5 | 1139±395.0 | 2±0.20 | 31±8.3 | 12±4.0 | 57±3.3 | 9±3.0 | |
| 3 | 990±0.02 | 19±0.12 | 7319±841.9 | 6363±636.1 | 1344±149.5 | 574±32.0 | 3079±261.6 | 8±1.7 | 68±17.7 | 42±1.2 | 74±6.9 | 24±3.4 | ||
| 16 | 1 | 985±0.36 | 7.8±0.003 | 3529±1038.1 | 3308±637.2 | 975±94.3 | 611±94.5 | 1747±547.3 | 3±0.9 | 34±5.3 | 18±4.1 | 63±.10 | 18±1.2 | |
| 2 | Brown | 990±0.06 | 13±0.15 | 1664±937.6 | 2365±221.9 | 1154±3.8 | 500±17.2 | 788±461.6 | 3±0.70 | 21±7.5 | 9±4.9 | 61±2.3 | 5±1.3 | |
| 3 | 991±0.02 | 15±0.09 | 7378±752.8 | 7421±89.3 | 1325±118.2 | 506±21.7 | 3404±81.7 | 4±0.94 | 77±26.1 | 40±7.3 | 73±3.6 | 26±5.7 | ||
| 17 | 1 | 983±0.15 | 13±0.1 | 4285±383.3 | 3308±637.2 | 1154±293.6 | 544±174.2 | 1747±547.3 | 3.5±.61 | 49±2.7 | 25±2.8 | 59±9.8 | 16±2.0 | |
| 2 | Brown | 991±0.01 | 15±0.39 | 1777±459.9 | 2354±123.3 | 1118±136.8 | 423±11.7 | 980±249.5 | 2±0.5 | 34±5.7 | 10±2.4 | 53±3.0 | 12±2.0 | |
| 3 | 990±0.07 | 15±0.25 | 6023±558.9 | 6628±1017.2 | 1131±81.5 | 499±24.9 | 2713±483.6 | 10±1.85 | 60±16.0 | 60±9.4 | 75±3.7 | 18±1.4 | ||
| 18 | 1 | 986±0.01 | 12±0.11 | 3723±249.1 | 3526±500.0 | 1236±64.5 | 478±3.1 | 1828±42.6 | 4±0.21 | 51±.65 | 22±2.3 | 61±6.9 | 15±2.4 | |
| 2 | White | 990±0.01 | 12±0.10 | 2323±433.9 | 1995±349.4 | 935±53.6 | 411±37.6 | 1149±196.8 | 3±0.20 | 35±6.2 | 14±2.3 | 50±.71 | 10±1.8 | |
| 3 | 990±0.05 | 14±0.41 | 6652±161.1 | 7449±185.4 | 1430±34.8 | 718±21.2 | 3249±215.9 | 6±0.28 | 115±10.8 | 45±3.6 | 77±18.6 | 36±11.8 | ||
| 19 | 1 | 990±0.60 | 10±0.1 | 3001±752.4 | 3521±1008.2 | 1308±177.1 | 265±29.4 | 1684±334.9 | 3±0.6 | 40..11 | 17±5.0 | 66±5.0 | 15±3.4 | |
| 2 | Brown | 990±0.07 | 15±0.30 | 2629±907.6 | 2234±744.3 | 757±84.5 | 433±64.4 | 1198±362.6 | 2±0.40 | 28±6.0 | 10±2.4 | 69±4.9 | 7±1.3 | |
| 3 | 99.12±0.01 | 17±0.40 | 8826±492.5 | 7765±542.1 | 1331±85.8 | 767±40.5 | 3434±146.2 | 8±0.47 | 132±12.2 | 53±2.0 | 71±1.8 | 35±4.9 | ||
| 20 | 1 | 984±0.01 | 12±0.1 | 3546±92.1 | 3760±1416.0 | 1022±49.6 | 534±22.2 | 2182±1103.3 | 3±2.2 | 34±.20 | 16±6.1 | 79±7.1 | 17±10.1 | |
| 2 | Brown | 990±0.05 | 15±0.47 | 2706±650.5 | 3061±795.8 | 757±84.5 | 433±64.4 | 1198±362.6 | 2±.40 | 28±6.0 | 10±2.4 | 69±4.9 | 7±1.3 | |
| 3 | 990±0.02 | 12±0.53 | 5909±133.4 | 8330±786.5 | 1308±32.4 | 783±52.6 | 3406±293.9 | 10±2.36 | 71±11.5 | 56±4.5 | 81±3.3 | 30±5.6 | ||
| 21 | 1 | 984±0.06 | 10±0.01 | 3792±123.2 | 4014±11.3 | 1179±19 | 426±4.0 | 1523±.01 | 4±0.10 | 48±.12 | 15±0.10 | 74±0.12 | 16±.10 | |
| 2 | White | 990±0.05 | 15±0.39 | 2471±530.7 | 2412±373.3 | 1119±136.8 | 398±14.5 | 1044±211.1 | 3±0.10 | 35±3.6 | 10±0.61 | 68±4.6 | 5±1.7 | |
| 3 | 990±0.02 | 12±0.53 | 83322±878.9 | 10177±1035.2 | 1206±160.0 | 721±130.8 | 3856±504.6 | 6±0.45 | 121±10.6 | 45±2.8 | 93±8.2 | 40±2.1 | ||
| Ground grains | - | - | 0.23 | <.001 | <.001 | <.001 | <.001 | <.001 | 0.28 | <.001 | <.001 | 0.001 | 0.02 | <.001 |
| Husked grains | - | - | <.001 | <.001 | 0.49 | 0.91 | <.001 | <.001 | 0.28 | <.001 | <.001 | 0.14 | 0.05 | 0.01 |
*Numbers refer to 1: whole grins (ground), 2: endosperm (grits), 3: bran, values of the mineral mg/kg-1 were analysed based on three replication readings, while the dry matter and protein% were analysed based on two replication readings, P≤0.05.
Table 2.
Descriptive analysis of the nutritional contents of diverse kafirin race varieties on male startility line.
Table 2.
Descriptive analysis of the nutritional contents of diverse kafirin race varieties on male startility line.
| Codes |
Processed grains |
Pericap color |
D.M g/kg-1 |
Protein g/kg-1 |
P mg/kg-1 |
K mg/kg-1 |
S mg/kg-1 |
Ca mg/kg-1 |
Mg mg/kg-1 |
Cu mg/kg-1 |
Fe mg/kg-1 |
Zn mg/kg-1 |
Na mg/kg-1 |
Mn mg/kg-1 |
|---|---|---|---|---|---|---|---|---|---|---|---|---|---|---|
| 22 | 1 | Brown | 981±0.06 | 13±.001 | 2263±306.2 | 4642±375.2 | 1241±370.0 | 661±248.6 | 1159±890.0 | 7±0.10 | 26±3.5 | 21±9.7 | 74±7.9 | 19±6.0 |
| 2 | 991±0.05 | 9±0.07 | 1654±280.7 | 2239±386.0 | 757±84.5 | 409±4.5 | 885±154.2 | 2±0.4 | 23±.3 | 10±.10 | 68±4.6 | 10±.91 | ||
| 3 | 990±0.02 | 13±0.53 | 10486±737.6 | 9869±673.8 | 1462±144.0 | 741±208.1 | 3585±245.2 | 8±0.10 | 136±3.4 | 42±1.5 | 78±4.3 | 43±3.0 | ||
| 23 | 1 | White | 986±0.03 | 11±0.10 | 2762±184.2 | 3012±797.5 | 815±192 | 475±132 | 1450±416.4 | 4±1.0 | 28±5.3 | 24±7.9 | 64±8.9 | 23±6.2 |
| 2 | 991±0.49 | 14±0.22 | 1343±467.4 | 1891±381.2 | 715±53.9 | 412±34.4 | 711±248.8 | 3±0.50 | 41±.46 | 9±3.3 | 64±2.8 | 6±1.1 | ||
| 3 | 993±0.32 | 10±0.39 | 7802±266.5 | 9784±1094.4 | 1728±166.5 | 775±124.3 | 3718±549.5 | 16±1.6 | 44±7.2 | 78±10.2 | 84±8.7 | 21±3.9 | ||
| 24 | 1 | White | 987±0.98 | 19±0.12 | 3741±1127.1 | 4660±2206.3 | 1000±32.2 | 523±133.3 | 1395±176.4 | 5±0.01 | 30±9.9 | 22±4.1 | 70±5.6 | 17±9.9 |
| 2 | 990±3.45 | 9.3±0.12 | 2232±280.1 | 2113±215.9 | 989±34.5 | 431±36.1 | 1318±146.4 | 3±0.20 | 27±7.0 | 8±3.5 | 67±3.5 | 13±2.6 | ||
| 3 | 991±0.44 | 8±0.02 | 8046±737.1 | 9362±744.1 | 1226±135.3 | 770±93.8 | 3491±125.0 | 11±1.0 | 79±6.6 | 64±5.5 | 77±4.2 | 37±3.6 | ||
| 25 | 1 | White | 984±0.24 | 14±0.02 | 3105±66.0 | 3234±170.8 | 1046±16.0 | 554±.50 | 1611±0.01 | 3±0.9 | 51±.11 | 23±.10 | 64±.01 | 12±.07 |
| 2 | 991±0.01 | 14±0.01 | 1317±570.9 | 1406±449.9 | 804±54.1 | 389±6.1 | 703±315.5 | 3±0.50 | 24±.10 | 6±2.0 | 54±1.9 | 8±.93 | ||
| 3 | 991±0.07 | 16±1.3 | 5561±1002.1 | 6977±401.5 | 1091±111.8 | 708±51.6 | 2842±389.7 | 10±0.70 | 75±10.6 | 51±7.0 | 85±9.2 | 26±3.9 | ||
| 26 | 1 | White | 985±0.08 | 13±0.04 | 2453±313.1 | 3253±1483.5 | 996±202.0 | 4438±123.3 | 2718±949.4 | 4±0.10 | 54±.40 | 27±2.1 | 66±8.4 | 22±8.2 |
| 2 | 990±0.12 | 11±0.05 | 999±218.6 | 1390±201.2 | 877±75.2 | 370±90.1 | 517±122.6 | 3±0.84 | 35±6.0 | 6±2.0 | 61±5.7 | 13±.22 | ||
| 3 | 993±0.02 | 20±0.77 | 7467±249.9 | 7749±584.7 | 1182±190.3 | 698±40.3 | 3253±250.8 | 11±1.2 | 97±4.2 | 67±4.6 | 80±9.4 | 35±1.4 | ||
| 27 | 1 | White | 985±0.08 | 132±0.10 | 2069±11.0 | 3253±1483.5 | 1160±13.0 | 609±.90 | 1264±.01 | 4±1.3 | 29±.01 | 16±.10 | 79±10 | 17±.11 |
| 2 | 990±0.03 | 118±0.18 | 1670±338.6 | 2690±429.4 | 1048±56.9 | 476±98.7 | 1007±198.5 | 4±0.50 | 59±.30 | 12±2.5 | 67±6.1 | 9±.34 | ||
| 3 | 991±0.05 | 10.0±0.50 | 6635±441.6 | 8964±1260.2 | 1289±103.2 | 648±15.7 | 3383±360.7 | 10±1.5 | 92±16.8 | 72±16.8 | 82±3.2 | 35±4.0 | ||
| 28 | 1 | White | 983±0.01 | 13±0.10 | 2546±392.2 | 2589±291.0 | 1106±349.1 | 599±233.7 | 1434±389.2 | 2±0.30 | 40±10.2 | 35±24.2 | 70±9.5 | 28±.8 |
| 2 | 990±0.30 | 12±0.31 | 2230±358.5 | 2459±292.4 | 896±21.0 | 450±71.1 | 1070±210.0 | 3±0.42 | 41±7.7 | 11±2.7 | 64±2.0 | 7±.97 | ||
| 3 | 991±0.08 | 21±0.78 | 5079±440.9 | 7773±306.8 | 1724±70.4 | 619±54.7 | 2736±106.0 | 10±.030 | 93±17.2 | 45±4.9 | 86±7.9 | 42±3.8 | ||
| 29 | 1 | White | 981±0.01 | 11±0.10 | 2766±219.3 | 3043±681 | 1262±327 | 592±220.1 | 1218±217.3 | 4±0.80 | 40±7.6 | 37±29.7 | 65±7.1 | 24±4.7 |
| 2 | 990±0.04 | 14±0.14 | 2356±425.2 | 2668±330.5 | 1066±42.6 | 432±55.9 | 1306±142.3 | 3±0.50 | 40±3.9 | 16±.66 | 61±2.0 | 7±1.7 | ||
| 3 | 990±0.02 | 17±1.1 | 8184±2356.8 | 10249±799.8 | 1594±121.3 | 7100±26.2 | 3411±354.9 | 12±1.3 | 121±17.2 | 68±8.2 | 79±7.7 | 30±2.4 | ||
| 30 | 1 | White | 981±1.01 | 7.0±0.05 | 4299±317.9 | 2704±175.9 | 892±212.1 | 566±94.2 | 1464±311.8 | 3±0.70 | 56±27.5 | 16±12.0 | 77±8.9 | 23±7.4 |
| 2 | 990±0.20 | 14±0.15 | 1946±528.2 | 2188±352.5 | 765±48.5 | 483±55.5 | 1045±250.1 | 3±0.50 | 40±36.5 | 10±2.3 | 64±8.1 | 8±2.2 | ||
| 3 | 991±0.05 | 15±0.003 | 8682±1384.8 | 9980±435.5 | 1745±148.0 | 935±103.4 | 3995±49.0 | 14±2.0 | 92±6.8 | 71±5.6 | 93±9.5 | 30±1.9 | ||
| 31 | 1 | White | 980±0.46 | 10±0.001 | 2060±540.1 | 6371±452.4 | 1140±316.2 | 518±217.0 | 1674±335.0 | 4±0.85 | 59±27.4 | 22±6.9 | 78±10.9 | 17±8.1 |
| 2 | 991±0.03 | 13±0.30 | 1980±574.6 | 2430±467.7 | 954±78.5 | 385±80.9 | 1038±268.0 | 3±0.62 | 43±5.7 | 11±3.4 | 64±8.1 | 8±2.2 | ||
| 3 | 991±0.07 | 19±0.36 | 9473±711.0 | 9589±1128.2 | 1281±184.2 | 993±80.1 | 3412±204.3 | 10±0.80 | 93±5.0 | 53±5.6 | 91±5.6 | 28±4.1 | ||
| 32 | 1 | White | 987±0.16 | 16±0.03 | 2780±864 | 3709±1972.9 | 1016±153.0 | 485±.68 | 1483±395.9 | 4±1.50 | 45±6.1 | 28±126 | 67±9.1 | 23±7.0 |
| 2 | 991±0.03 | 12±0.08 | 2402±655.9 | 2596±614.7 | 933±89.0 | 450±71.1 | 1165±309.9 | 3±0.50 | 50±6.6 | 11±3.3 | 61±1.9 | 7±1.4 | ||
| 3 | 991±0.01 | 13±0.23 | 8755±1848.8 | 11658±696.1 | 1597±137.5 | 802±156.3 | 4074±233.3 | 12±1.7 | 107±12.6 | 58±5.8 | 81±5.2 | 38±4.6 | ||
| 33 | 1 | White | 980±0.21 | 12±1.0 | 2995±83.8 | 5270±349.1 | 1188±292.0 | 463±143.3 | 1477±333.5 | 4±1.5 | 46±4.7 | 26±2.9 | 67±8.0 | 17±1.8 |
| 2 | 990±0.11 | 12±0.19 | 2566±491.3 | 2269±399.1 | 1013±507.0 | 382±24.5 | 1311±215.5 | 3±0.21 | 33±9.5 | 11±2.2 | 64±6.6 | 9±1.4 | ||
| 3 | 980±0.10 | 16±0.35 | 7998±682.2 | 9301±604.5 | 1263±127.6 | 928±122.3 | 3132±90.6 | 7±1.1 | 87±7.3 | 46±4.3 | 81±9.4 | 26±1.9 | ||
| 34 | 1 | White | 982±0.19 | 10±0.01 | 3020±943.2 | 2894±840.2 | 998±159.0 | 450±76.4 | 1905±646.2 | 4±1.6 | 41±14.9 | 26±3.4 | 70±9.0 | 15±2.1 |
| 2 | 990±0.05 | 19±0.03 | 1974±291.2 | 2677±287.9 | 900±45.8 | 365±87.0 | 1084±154.7 | 2±.43 | 50±6.6 | 12±1.9 | 65±2.2 | 8±2.0 | ||
| 3 | 990±0.03 | 18±0.15 | 9399±810.6 | 9283±226.2 | 1499±4.1 | 558±76.5 | 3837±126.3 | 13±1.0 | 72±8.9 | 59±9.4 | 85±6.8 | 27±2.7 | ||
| 35 | 1 | White | 987±0.02 | 16±0.30 | 3337±523.2 | 2894±840.2 | 1051±237.1 | 278±159.4 | 1544±326.3 | 5±2.1 | 38±13.6 | 22±7.6 | 38±5.0 | 14±4.0 |
| 2 | 989±0.01 | 12±0.34 | 2368±526.1 | 2447±448.5 | 907±50.4 | 186±11.2 | 1144±257.1 | 2±0.04 | 39±14.4 | 11±.31 | 35±1.4 | 8±2.0 | ||
| 3 | 989±0.50 | 17±0.09 | 4729±790.3 | 8445±792.6 | 1279±135.4 | 768±165.6 | 2656±187.7 | 8±0.91 | 90±7.1 | 37±3.9 | 44±1.3 | 26±2.9 | ||
| 36 | 1 | White | 980±0.01 | 14±0.12 | 2692±598.4 | 3295±1472.3 | 1123±236.6 | 288±178 | 2135±869.4 | 3±00.50 | 36±11.6 | 22±7.6 | 41±2.4 | 17±1.5 |
| 2 | 990±0.06 | 8.5±0.70 | 2501±568.3 | 2457±450.9 | 987±63.1 | 179±21.4 | 1153±218.3 | 2±0.20 | 32±9.9 | 12±2.6 | 39±1.3 | 7±1.6 | ||
| 3 | 99.0±0.23 | 16±0.01 | 7839±812.7 | 8976±429.2 | 1385±97.1 | 631±113.1 | 3377±124.9 | 12±1.4 | 77±3.9 | 53±1.6 | 45±2.9 | 28±.90 | ||
| 37 | 1 | White | 983±0.01 | 11±0.001 | 2375±1462.0 | 4846±381.7 | 1062±180 | 291±220 | 1800±902.3 | 5±4.2 | 31±12.3 | 22.6.6 | 38±7.8 | 19±6.0 |
| 2 | 99. 1±0.03 | 13±0.07 | 1554±471.1 | 2122±470.0 | 958±80.6 | 214±33.0 | 730±264.5 | 2±1.0 | 32±12.7 | 11±3.8 | 34±4.0 | 7±2.1 | ||
| 3 | 990±0.54 | 12±0.25 | 8624±809.5 | 9042±296.9 | 1437±93.3 | 523±75.7 | 3198±190.0 | 10±0.60 | 89±3.9 | 54±1.6 | 49±3.8 | 27±.50 | ||
| 38 | 1 | White | 987±0.01 | 73±0.02 | 3254±361.1 | 2681±271.3 | 960±165.2 | 518±122.0 | 1705±237.8 | 5±1.3 | 28±1.8 | 21±7.4 | 62±7.2 | 18±8.7 |
| 2 | 990±0.06 | 12±0.88 | 1130±148.5 | 202±411.0 | 856±21.4 | 431±40.0 | 721±253 | 3±0.50 | 36±19.2 | 10±2.8 | 57±2.2 | 6±4.0 | ||
| 3 | 990±0.76 | 18±0.25 | 8105±277.5 | 8076±1118.7 | 1391±176.4 | 585±110.0 | 3107±387.9 | 10±0.82 | 94±7.3 | 56±3.9 | 72±3.6 | 34±1.0 | ||
| 39 | 1 | White | 982±0.21 | 13±0.005 | 4348±274.0 | 4448±3570.5 | 1113±169 | 403±9.9 | 1362±173.9 | 4±0.40 | 36±8.6 | 20±4.3 | 62±8.3 | 13±4.5 |
| 2 | 991±0.03 | 10±0.15 | 2753±367.9 | 2369±233.3 | 1007±23.3 | 312±78.8 | 1329±184.8 | 3±0.60 | 32±4.5 | 13±1.7 | 57±3.2 | 9±1.0 | ||
| 3 | 993±0.42 | 17±0.11 | 8304±1036.8 | 9951±1241.5 | 1242±120.6 | 605.2±76.0 | 3772±189.2 | 12±0.50 | 88±4.7 | 56±5.1 | 76±6.7 | 32±1.7 | ||
| 40 | 1 | White | 985±0.03 | 11±0.10 | 3097±607.2 | 3797±1549.2 | 1039±159.9 | 339±181.0 | 1478±331.8 | 3±1.3 | 45±29.0 | 27±4.6 | 54±14.6 | 23±4.7 |
| 2 | 991±0.44 | 16±0.50 | 1623±0.10 | 1935±.27 | 897±.01 | 169±6.5 | 836±.10 | 2±0.01 | 29±.11 | 8±.03 | 39±.10 | 8±.11 | ||
| 3 | 991±0.22 | 17±0.08 | 8420±1164.2 | 8523±118.2 | 1352±74.4 | 626±17.3 | 3534±205.8 | 13±1.2 | 101±26.0 | 54±2.3 | 71±4.0 | 31±1.8 | ||
| 41 | 1 | White | 985±0.03 | 18±0.01 | 2826±573.1 | 3494±1644.0 | 1095±175.4 | 372±34.6 | 1419±199.1 | 3±1.0 | 36±8.8 | 16±4.1 | 44±27.3 | 14±3.3 |
| 2 | 990±0.05 | 10±0.12 | 1780±501.6 | 1822±434.0 | 1046±84.1 | 180±125.6 | 922±282.4 | 3±00.40 | 29±6.8 | 10±2.6 | 24±1.5 | 8±2.5 | ||
| 3 | 991±0.28 | 13±0.23 | 7162±106.8 | 8171±47.7 | 1233±40.7 | 678±195.6 | 3432±73.5 | 8±0.01 | 100±.01 | 49±.95 | 36±3.6 | 35±1.6 | ||
| 42 | 1 | White | 986±0.02 | 15±0.04 | 3324±1692.0 | 5285±2440.3 | 1269±256.2 | 605±254.2 | 1188±125.8 | 4±2.2 | 45±7.4 | 40±31.4 | 53±18.0 | 13±1.8 |
| 2 | 99.1±0.02 | 16±0.32 | 2492±861.3 | 2522±704.7 | 1037±73.4 | 365±132.1 | 968±308 | 2±0.70 | 29±6.8 | 14±48.2 | 51±9.1 | 8±2.7 | ||
| 3 | 990±0.82 | 20±0.68 | 7162±870.8 | 8003±195.9 | 1224±146.2 | 641±127.0 | 3379±191.8 | 6±0.30 | 112±4.2 | 48±4.0 | 76±10.3 | 35±2.9 | ||
| 43 | 1 | White | 985±0.01 | 10±0.01 | 3657±1946.0 | 5879±2889.8 | 1188±256.3 | 555±291.0 | 1948±808.9 | 6±2.6 | 34±10.5 | 24±8.1 | 58±14.7 | 23±8.5 |
| 2 | 991±0.01 | 10±0.44 | 1878±501.2 | 2501±496.8 | 1037±73.4 | 480±83.2 | 1035±275.4 | 3±0.62 | 29±6.5 | 12±3.7 | 53±6.3 | 7±1.9 | ||
| 3 | 990±0.06 | 15±0.23 | 10979±1088.0 | 11084±622.9 | 1643±115.1 | 567±101.0 | 4099±138.9 | 13±2.1 | 76±4.7 | 78±3.8 | 79±8.9 | 44±0.30 | ||
| 44 | 1 | White | 985±0.01 | 10±0.08 | 3699±1957.2 | 2632±497.4 | 1209±222.1 | 500±170.5 | 1987±779.3 | 4±1.8 | 39±15.1 | 25±6.6 | 59±17.0 | 16±4.6 |
| 2 | 990±0.01 | 8.8±0.48 | 2194±550.9 | 2491±529.5 | 1161±59.9 | 338±48.3 | 1062±273.4 | 3±0.60 | 32±7.2 | 15±2.4 | 46±5.0 | 9±1.5 | ||
| 3 | 990±0.01 | 24±0.85 | 6012±241.1 | 9196±645.7 | 1506±122.4 | 958±83.7 | 2936±144.9 | 9±0.53 | 77±5.6 | 41±2.5 | 87±9.9 | 25±2.3 | ||
| 45 | 1 | White | 984±0.01 | 10±0.06 | 2384±280.0 | 2968±815.4 | 1086±23.6 | 449±121.8 | 1458±313.6 | 3±0.70 | 34±7.8 | 17±3.6 | 58±14.1 | 19±1.0 |
| 2 | 991±0.03 | 9.2±0.36 | 1320±432.4 | 1767±487.3 | 933±99.2 | 405±21.6 | 729±289.0 | 2±0.50 | 25±7.3 | 11±2.8 | 63±.90 | 6±2.0 | ||
| 3 | 991±0.26 | 18±0.64 | 6829±1079.8 | 9047±403.7 | 1449±56.2 | 853±32.0 | 2904±116.6 | 9±.40 | 100±11.4 | 49±.67 | 74±.83 | 28±1.0 | ||
| 46 | 1 | White | 985±0.10 | 18±0.03 | 2532±271 | 4341±1161.4 | 1121±260.9 | 513±97.2 | 2117±918.6 | 4±2.2 | 40±14.5 | 20±1.7 | 75±9.7 | 17±2.6 |
| 2 | 990±0.04 | 7±0.35 | 1380±359.8 | 1620±317.6 | 849±33.7 | 410±43.7 | 772±214.0 | 3±.30 | 23±4.2 | 9±2.5 | 68±4.6 | 5±1.4 | ||
| 3 | 990±0.88 | 14±0.09 | 6737±272.6 | 9543±628.0 | 1567±31.6 | 747±83.2 | 3102±128.5 | 7±.60 | 79±4.8 | 50±2.6 | 88±4.5 | 26±.90 | ||
| 47 | 1 | White | 986±0.63 | 17±0.04 | 1801±641.1 | 3155±297.8 | 1056±325.2 | 508±126.7 | 1852±853.4 | 4±1.7 | 39±5.3 | 21±8.0 | 67±10.9 | 16±3.4 |
| 2 | 981±0.11 | 13±0.12 | 1787±433.6 | 2731±595.1 | 849±62.1 | 480±14.3 | 940±235.8 | 3±.10 | 28±5.7 | 10±2.3 | 53±4.0 | 11±2.6 | ||
| 3 | 991±0.02 | 15±0.30 | 6695±170.0 | 8038±561.7 | 1401±23.9 | 683±65.7 | 3147±109.1 | 9±.42 | 77±4.2 | 44±2.8 | 87±10.3 | 26±2.3 | ||
| 48 | 1 | White | 985±0.30 | 18±0.52 | 3090±593.8 | 3001±686.4 | 934±115.0 | 492±17.2 | 1553±154.5 | 4±1.0 | 49±1.4 | 21±5.8 | 58±7.0 | 14±4.0 |
| 2 | 991±0.05 | 12±0.28 | 1360±471.4 | 1434±508.1 | 858±22.4 | 478±83.3 | 523±303.4 | 2±.50 | 20±7.4 | 6±2.3 | 53±5.9 | 4±2.0 | ||
| 3 | 990±0.78 | 15±0.05 | 6198±183.4 | 9407±821.4 | 1417±14.1 | 657±65.7 | 2923±730.0 | 7±1.3 | 80±9.7 | 36±2.1 | 87±12.1 | 38±0.80 | ||
| 49 | 1 | White | 987±0.04 | 10±0.36 | 2898±420.0 | 2978±343.2 | 1043±327.0 | 549±134.3 | 2047±115.2 | 3±0.70 | 40±7.1 | 20±6.0 | 62±10.0 | 19±6.2 |
| 2 | 991±0.01 | 13±0.01 | 1364±507.3 | 1628±318.8 | 820±43.3 | 475±126.4 | 719±300.4 | 2±.50 | 24±7.5 | 9±3.7 | 56±8.4 | 4±1.5 | ||
| 3 | 991±0.10 | 13±0.10 | 9904±197.1 | 9266±915.8 | 1311±19.3 | 670±46.9 | 3395±194.4 | 10±2.0 | 98±7.2 | 59±7.3 | 77±3.5 | 29±1.5 | ||
| 50 | 1 | White | 988±0.34 | 16±0.05 | 2887±.15 | 3867±1131.4 | 954±66.1 | 635±.13 | 1326±.16 | 4±0.60 | 34±.05 | 15±.10 | 64±.50 | 10±0.21 |
| 2 | 990±0.02 | 12±0.28 | 1103±412.2 | 1482±287.8 | 734±26.7 | 400±78.9 | 531±230.4 | 2±0.50 | 17±4.7 | 5±2.0 | 55±3.6 | 5±0.30 | ||
| 3 | 991±0.24 | 15±0.16 | 7989±770.3 | 7582±187.9 | 1506±15.5 | 652±28.2 | 3733±220.5 | 11±3.1 | 99±5.9 | 6±.27 | 58±5.7 | 59±2.5 | ||
| 51 | 1 | White | 982±0.01 | 20±0.04 | 3307±1252 | 3058±638.0 | 1029±258.0 | 520±111.0 | 1907±654.4 | 3±0.80 | 40±11.1 | 24±7.0 | 68±14.5 | 15.3.8 |
| 2 | 991±0.02 | 9±0.14 | 1580±265.9 | 2726±379.1 | 875±48.7 | 448±48.7 | 929±5.5 | 3±0.10 | 33±4.5 | 12±3.9 | 61±9.0 | 8±00.84 | ||
| 3 | 90±90.30 | 14±0.63 | 12380±227.3 | 8760±631.8 | 1519±86.4 | 773±121.9 | 653±45.2 | 8±0.53 | 58±7.1 | 29±22.5 | 63±12.3 | 34±8.2 | ||
| Ground grains | - | - | <.001 | <.001 | 0.58 | 0.9 | 0.3 | 0.55 | 0.02 | 0.04 | 0.05 | 0.53 | <.001 | 0.28 |
| Husked grains | - | - | <.001 | <.001 | 0.76 | 0.08 | <.001 | <.001 | 0.93 | 0.54 | <.001 | 0.88 | <.001 | 0.04 |
*Numbers refer to 1: whole grains (ground), 2: endosperm (grits), 3: bran; values of the mineral mg/kg-1 were analysed based on three replication readings, while the dry matter and protein% were analysed based on two replication readings, P≤0.05.
Disclaimer/Publisher’s Note: The statements, opinions and data contained in all publications are solely those of the individual author(s) and contributor(s) and not of MDPI and/or the editor(s). MDPI and/or the editor(s) disclaim responsibility for any injury to people or property resulting from any ideas, methods, instructions or products referred to in the content. |
© 2024 by the authors. Licensee MDPI, Basel, Switzerland. This article is an open access article distributed under the terms and conditions of the Creative Commons Attribution (CC BY) license (http://creativecommons.org/licenses/by/4.0/).
Copyright: This open access article is published under a Creative Commons CC BY 4.0 license, which permit the free download, distribution, and reuse, provided that the author and preprint are cited in any reuse.


