

Submitted:
06 March 2024
Posted:
08 March 2024
You are already at the latest version
Abstract
In the process of oil and gas development and production, when the flow rate in the wellbore is large, the materials underground will be eroded, causing the operation to be unable to proceed smoothly and reducing the efficiency of oil and gas production. Therefore, optimizing the anti-erosion coating under high-speed flow conditions in wellbore is a very interesting thing. It can greatly improve operational efficiency. In this paper, laser cladding was used to prepare the new coating used in the PDC drill bit. Then, the effects of tungsten carbide and multi-layer graphene on the microstructure and properties of the tungsten carbide coating were studied. The research results indicate that, for new coatings, 60% tungsten carbide and 0.3% graphene are the optimal ratios. After adding WC, the hardness has significantly improved. However, when the WC content further increases more than 30%, the increase in hardness is relatively small. In addition, when the content of graphene is more than 0.3%, the branched structure became thicker, and not only the segregation of Cr, Si and W became very obvious again, but also the segregation of Fe occurred at the Ni enrichment site. The research results contribute to improving oil and gas production and operational efficiency under high-speed fluid flow conditions in the wellbore.
Keywords:
Wellbore
; High-speed fluid flow
; Optimization
; Materials
; Operational efficiency
1. Introduction
In the process of oil and gas development and production, when the flow rate in the wellbore is large, the materials underground will be eroded, causing the operation to be unable to proceed smoothly and reducing the efficiency of oil and gas production. Therefore, optimizing the anti-erosion coating under high-speed flow conditions in wellbore is a very interesting thing. It can greatly improve operational efficiency [1,2,3,4,5].
Under long-term operation or complex working conditions (such as composite wear [6] and mud erosion [7,8,9]), steel PDC drill bits may experience erosion and mud inclusion on the blade, especially in the main cutting section of the blade crown, which is prone to erosion. The impact force on the erosion area is relatively large, and the protective capacity of this area is relatively insufficient, greatly limiting the use of steel PDC drill bits. Nickel based alloy coatings are widely used in laser cladding processes due to their economy, good self-lubricating performance, and corrosion resistance [10,11]. Tungsten carbide has the characteristics of high hardness, high melting point, strong wear resistance and corrosion resistance, and is usually used as a wide range of coating materials [12,13,14,15,16]. Graphene has outstanding mechanical and thermal properties and two-dimensional sheet structure, which can also be used as coating material for laser cladding process [17,18]. It is necessary to use tungsten carbide and graphene as coating materials to prepare new coatings with good wear resistance and erosion resistance. For example, Zhan et al [19] studied the basic properties of multi-layer graphene and its application in the industrial field. This is a very important aspect to utilize graphene to improve the performance of materials at high temperatures. Jagannadham [20] developed a tungsten–graphene layered film by deposition of tungsten film by magnetron sputtering on the graphene covered copper foils. This product has high performance and high temperature resistance. Then, Chen et al [21] developed a graphene nanoplatelet-supported tungsten carbide nitride nanocomposites prepared via an in situ solid-state approach. This nanocomposite catalyzes the hydrogen evolution reaction with very low overpotential and is stable operating for at least 300 h in harsh acidic conditions. Recently, Xuan and Wang [22] developed a new type of high hardness coating for improving drill bit stability in unconventional oil and gas development. Moreover, the hardness of coatings under different cladding processes has been studied and explained.
However, even though many studies have been conducted on tungsten carbide coatings, these are still limited to the melting process. Especially, research on the influence of tungsten carbide and graphene content on the performance of the coating is crucial. However, these have not been studied and published. Therefore, in the present work, after preparing a new type of tungsten carbide coating, the effects of tungsten carbide content on the microstructure and properties of the tungsten carbide coating based nickel were studied, as well as the effects of multi-layer graphene content on the microstructure and properties of the new tungsten carbide coating based nickel.
2. Experimental Materials, Equipment and Methods
2.1. Experimental Materials
The experimental materials of this laser cladding project mainly include base plate and powder. The base plate is Q235 steel (Figure 1), and the powder includes Ni60A powder, tungsten carbide (WC) powder and single-layer graphene.
Specifically, Q235 steel was purchased from Shanghai Luosong Mechanical and Electrical Equipment Co., Ltd., and the material composition is shown in Table 1.
Ni60A powder was purchased from Asia New Materials Ltd. The powder composition is shown in Table 2
The micrographs of Ni60A powder, tungsten carbide powder and graphene powder under SEM are as shown in Figure 2.
From the powder SEM diagram, it can be seen that Ni60A powder particles are uniform, spherical powder, good mobility, less satellite powder around the powder; Graphene powder is a typical lamellar form.
2.2. Experimental Equipment
Powder laser cladding equipment was used in experiment. It can be seen in Figure 3.
The powder spreading laser cladding equipment consists of the four parts. The part I is chiller. The part II is voltage stabilizer. The part III is laser device. The part IV is cladding machine.
2.3. Experimental Methods
In this paper, the cladding mode is pre-powder laser cladding, and the specific research method is as follows:
First, determine the composition ratio of the powder to be studied, and then weigh and prepare the powder with an electronic balance. If graphene is required for powder preparation, add graphene and appropriate amount of alcohol into the beaker, crush the graphene with ultrasonic vibrator, and put the resulting graphene alcohol mixture into the vacuum drying oven for drying. Then add the graphene dispersant provided by the manufacturer, the main component is sodium dodecylbenzene sulfonate, and the added amount is 5-10% of the added graphene mass. Put the powder into the bottle after mixing. First place it outdoors for 1 hour, and then place it in the vacuum drying oven for 2 hours for drying. Use the ball mill for 8 hours of powder mixing.
Before powder spreading, grind the Q235 steel substrate with 60-mesh abrasive paper to remove the surface oxide film and increase the surface roughness, which is beneficial to improving the bonding between the substrate and the powder during cladding. In the test scheme, the proposed powder spreading thickness is 1.5mm. Based on the 0.5mm thick tape, three layers of tape are pasted on the Q235 steel substrate. The polyvinyl alcohol solution (ratio: 8:1000) is prepared with polyethylene cellulose. After mixing the appropriate amount with the studied powder, the sample surface is coated with a spoon. Take it out after drying for 2 hours in the vacuum drying oven and place it in the sealed bag filled with nitrogen for standby. Figure 4 shows the effect after powder spreading.
At the end of the powder spreading step, the powder in different areas shall be subject to cladding according to the parameters designed in the experiment. After cladding, the tape and the powder in the non-cladding part shall be removed. The cladding part shall be cut into the sample for experimental test by wire cutting, and the surface of the sample after cladding shall be further polished.
The following tests are mainly performed on the sample:
(1) Hardness test
Polish the sample section with 60 mesh, 120 mesh, 200 mesh and 400 mesh abrasive paper in order, and test the micro-hardness of the cladding section with HVS-1000A micro-vickel hardness tester. The applied load is 0.2kg and the holding time is 15s. Measure the hardness with four-point measurement method. Since the hardness measurement has a certain subjectivity, in order to ensure the accuracy of the average hardness results obtained, 10 points are randomly selected from the cladding on two planes parallel to and perpendicular to the laser aisle of the same sample for testing. All 20 points are sequenced from high to low, and the average value and standard deviation are calculated after removing the maximum value and the minimum value.
(2) XRD Test
The sample test surface was ground smooth and subjected to XRD testing using a Brook D8 X-ray diffractometer goniometer. The specific parameters use working voltage of 40kV, working current of 30mA, scanning speed of 6 °/min and scanning range of 10 ° - 90 °. Use Jade6.5 software to analyze the test results.
(3) Microstructure observation
The specimen was ground smooth and polished, and the specimen section was corroded using a fresh aqua regia solution (HCl: HNO3=3:1) to analyze the microstructure. Scanning electron microscopy (SEM, Merlin, Zeiss) was used for micrographic observation, and the composition and distribution of cladding elements were measured by EDS test.
3. Effect of Tungsten Carbide Content on the Microstructure and Properties of New Coating
This project conducted pre-experiments to determine the experimental parameters and plan before work. According to relevant literature, WC content often has a significant impact on the hardness of the coating at a high level, and trace amounts of graphene can demonstrate its role. Therefore, in the pre-experimental stage, it was decided to use Ni60A+30% WC+0.1% graphene mixed powder to prepare the coating layer under different parameters, as the hardness of the coating layer can be used to preliminarily determine the material's resistance to mud erosion. Therefore, parameter selection is based on hardness. Specifically, the laser power is selected as 800W, 1200W, 1600W, and 2000W, as shown in Table 3.
The obtained hardness result is (Table 4):
According to the hardness test results, it can be seen that the average hardness values of the coatings obtained at 800W and 1200W are not significantly different. However, as the power increases, the hardness of the coatings obtained at 1200W, 1600W, and 2000W decreases significantly. Based on the above results, the cladding parameters determined in this pre-experiment are as follows: laser spot 4mm, laser power 1200W, speed 0.35m/min, overlap rate 50%, and protective gas 15L/min.
For this project, the research on the matching cladding process of the new tungsten carbide coating is as follows: The cladding parameters determined in the previous section first melted the pure Ni60A powder coating, and then prepared the coating with WC/Ni60A mixed powder with WC mass fractions of 10%, 20%, 30%, 40%, 50%, and 60%.
The hardness test results of WC/Ni60A coatings with different WC contents are shown in Table 5. It can be seen from the table that when WC is not added, the average hardness of Ni60A coatings is only 753.3HV. However, after adding WC, the hardness has significantly improved, especially when the WC content is 10% and 20%, the average hardness has increased by 13.3% and 32.6%, respectively. As the WC content continues to increase, the average hardness also increases, but the increase is smaller than the first 20%.
The hardness distribution of the cross-section of the cladding layer is shown in Figure 6. The hardness distribution area can be divided into the cladding layer zone, fusion zone, and heat affected zone. The cladding layer zone has the highest hardness, and the fusion zone belongs to the transition zone, where the hardness begins to decrease. It can be seen that the hardness value of the cladding layer zone does not change much, while the hardness of the fusion zone rapidly decreases, indicating that the fusion zone is relatively narrow.
Figure 7 shows the SEM image of the Ni60A coating, which shows a relatively uniform distribution of Fe and Si, while Cr exhibits significant segregation and aggregation in blocks or strips. Ni is widely distributed throughout the coating due to its highest content in Ni60A powder.
The EDS data obtained from point A and point B at the Cr enrichment site are shown in Table 6. It can be observed that there is a significant difference in the mass fractions of Cr and Ni between the two sites, while the composition of Si and Fe is not significantly different. It can be seen that the content of Ni is the highest among the two points, which is because the proportion of Ni in Ni60A powder is the highest. According to the combination of XRD analysis results and EDS analysis results, it can be concluded that the main components of Cr enrichment are Cr3C2 and M23C6, while the remaining areas are mainly solid solutions ɤ- Ni, Ni3Fe, M23C6, and Fe3C.
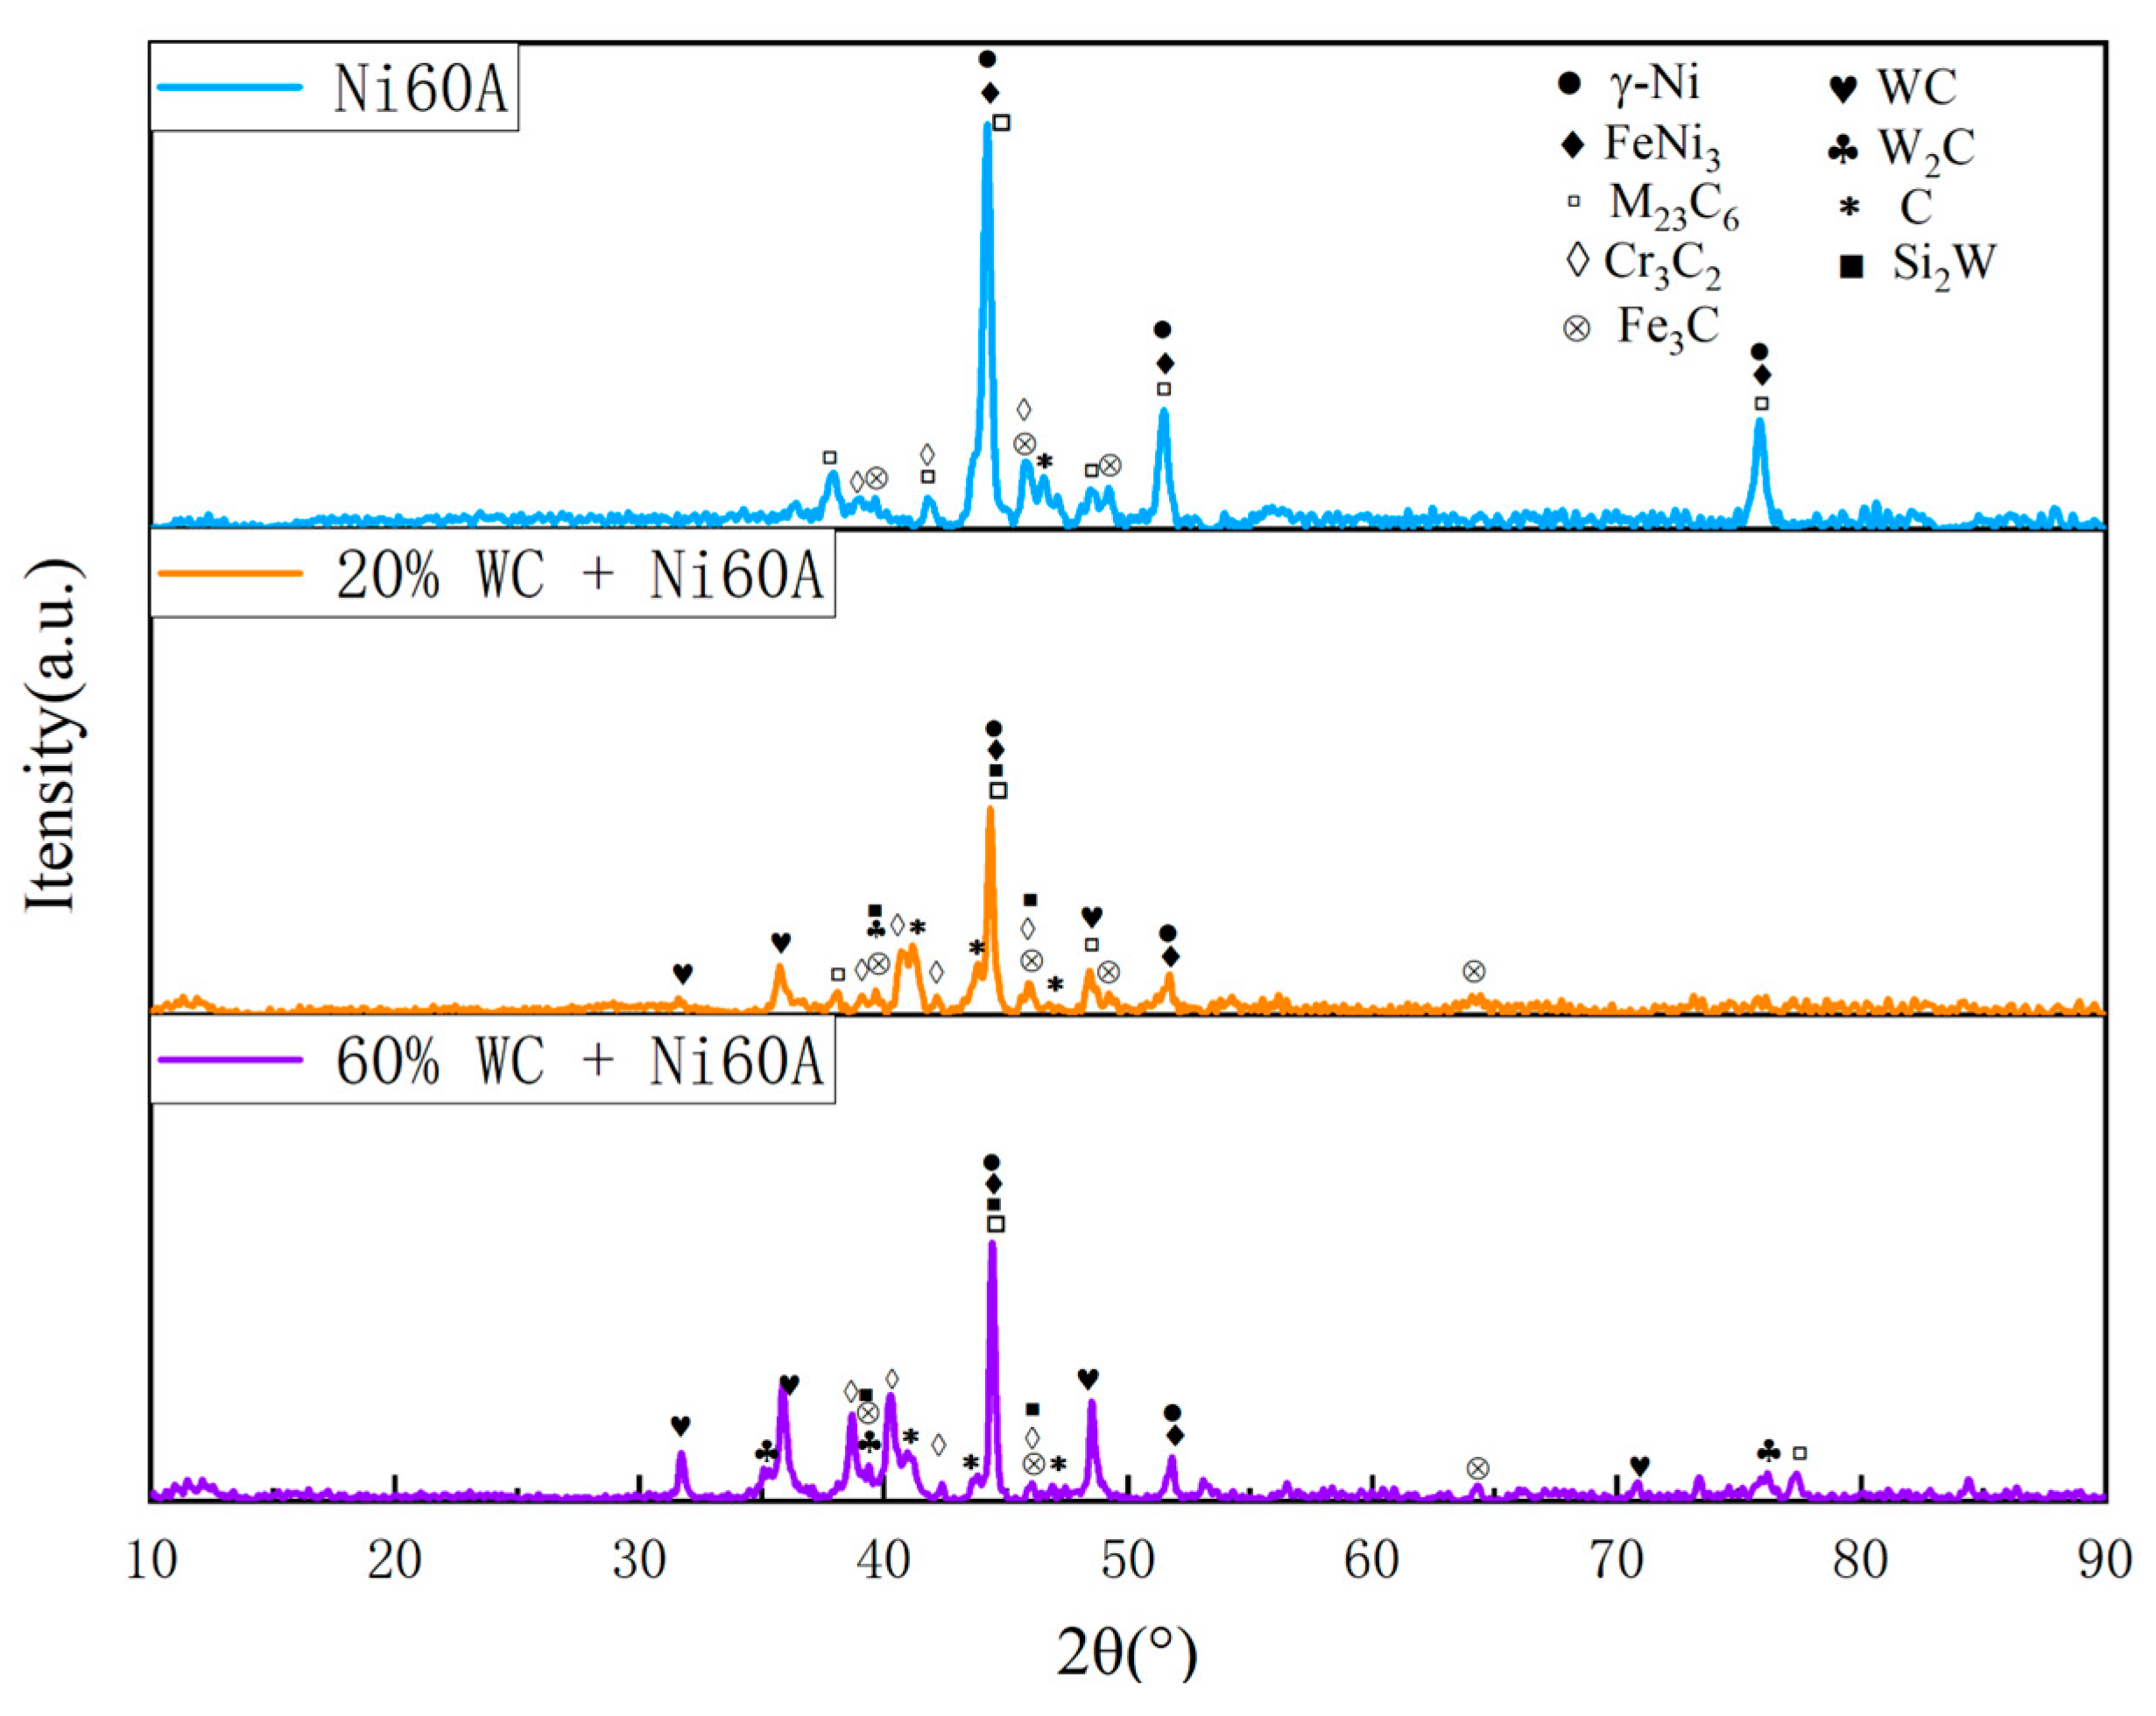
Figure 8 shows the SEM image of Ni60A+20% WC coating. Comparing with Figure 7, it can be seen that after the addition of WC, obvious snowflake like and branch like structures are formed at the Cr segregation area, resulting in significant Si element segregation in the obtained coating. From the EDS results at points C and D in Table 7, it can be seen that Si and W exhibit significant segregation at snowflake like dendrites. As shown in Figure 10, compared to the Ni60A coating, the Ni60A+20% WC coating increases WC, W2C, WSi2, W, and C. Due to the melting point of WC being 2870 ℃, the melting points of Ni, Fe, and Cr are 1453 ℃, 1538 ℃, and 1907 ℃, respectively. For low-speed laser cladding, excessive heat input can cause a certain amount of WC particles to decompose into carbides, resulting in a decrease in WC particles. On the other hand, it can increase the convection and stirring time of the molten pool, resulting in uneven distribution of WC particles. Based on the XRD detection results, it can be seen that during the melting process, WC partially decomposes into W and C due to heating, and some W will form WSi2 with Si at high temperatures, resulting in significant segregation of Si. At the same time, due to the decarburization phenomenon of WC at high temperatures, some WC will be converted into W2C. According to the theory of metal crystallization, due to the relatively high melting point of W and its compounds, the precipitated phase will first solidify during the cladding process, increasing the probability of non-uniform nucleation forming around it. Due to the much higher melting point of Cr than Ni, Cr and its compounds will first adhere to W and its compounds during the cladding process, which is manifested in SEM images as the segregation of Cr, Si, and W, forming snowflake like and branch like structures. At the same time, due to the randomness of the precipitation of W and its compounds, the distribution of W does not exhibit obvious segregation characteristics like Cr, but rather forms a feature of widespread distribution and partial segregation.
Figure 9 shows the SEM image of the Ni60A+60% WC coating. Unlike the snowflake like tissue of the Ni60A+20% WC coating, needle like interlaced tissue is formed in the majority of the areas at this time, while cluster like tissue is formed in a small portion of the areas. Comparing Figure 8, it can be seen that as the mass fraction of WC in the powder increases, the segregation phenomenon of W and Si becomes more obvious, but the distribution of Cr appears more uniform. According to the EDS scanning results at different positions of the Ni60A+60% WC coating in Table 8, it can be seen that when the proportion of WC in the powder is 60%, W is distributed throughout the coating, but segregation can still be clearly observed. The content difference of Si in different positions is very obvious, almost all of which exist in needle like tissues. Therefore, it can be further determined that the main compound formed by Si in the coating is WSi2. According to the above, due to the attachment of Cr and its compounds to the growth of W and its compounds, the distribution of Cr elements will be more uniform as W content increases. Due to the fact that the proportion of Ni element in this mixed powder is less than W, the Ni distribution area under the microscopic morphology is cut into polygonal areas one by one. It can be seen from Figure 10. As the WC content in the powder increases, the peaks of Cr3C2 and W2C in the Ni60A+60% WC coating are enhanced compared to the Ni60A+20% WC coating, while the peaks of M23C6 and WSi2 are relatively reduced. This is because more WC decomposes to produce C, resulting in an increase in the proportion of C in the formed C compound. Therefore, Cr3C2 and W2C increase, while M23C6 and WSi2 are limited by the content of Fe and Si, so as the proportion of WC in the powder increases, Its relative peak in XRD has decreased.
Figure 9.
Microstructure of Laser Cladding Ni60A+60% WC Coating.
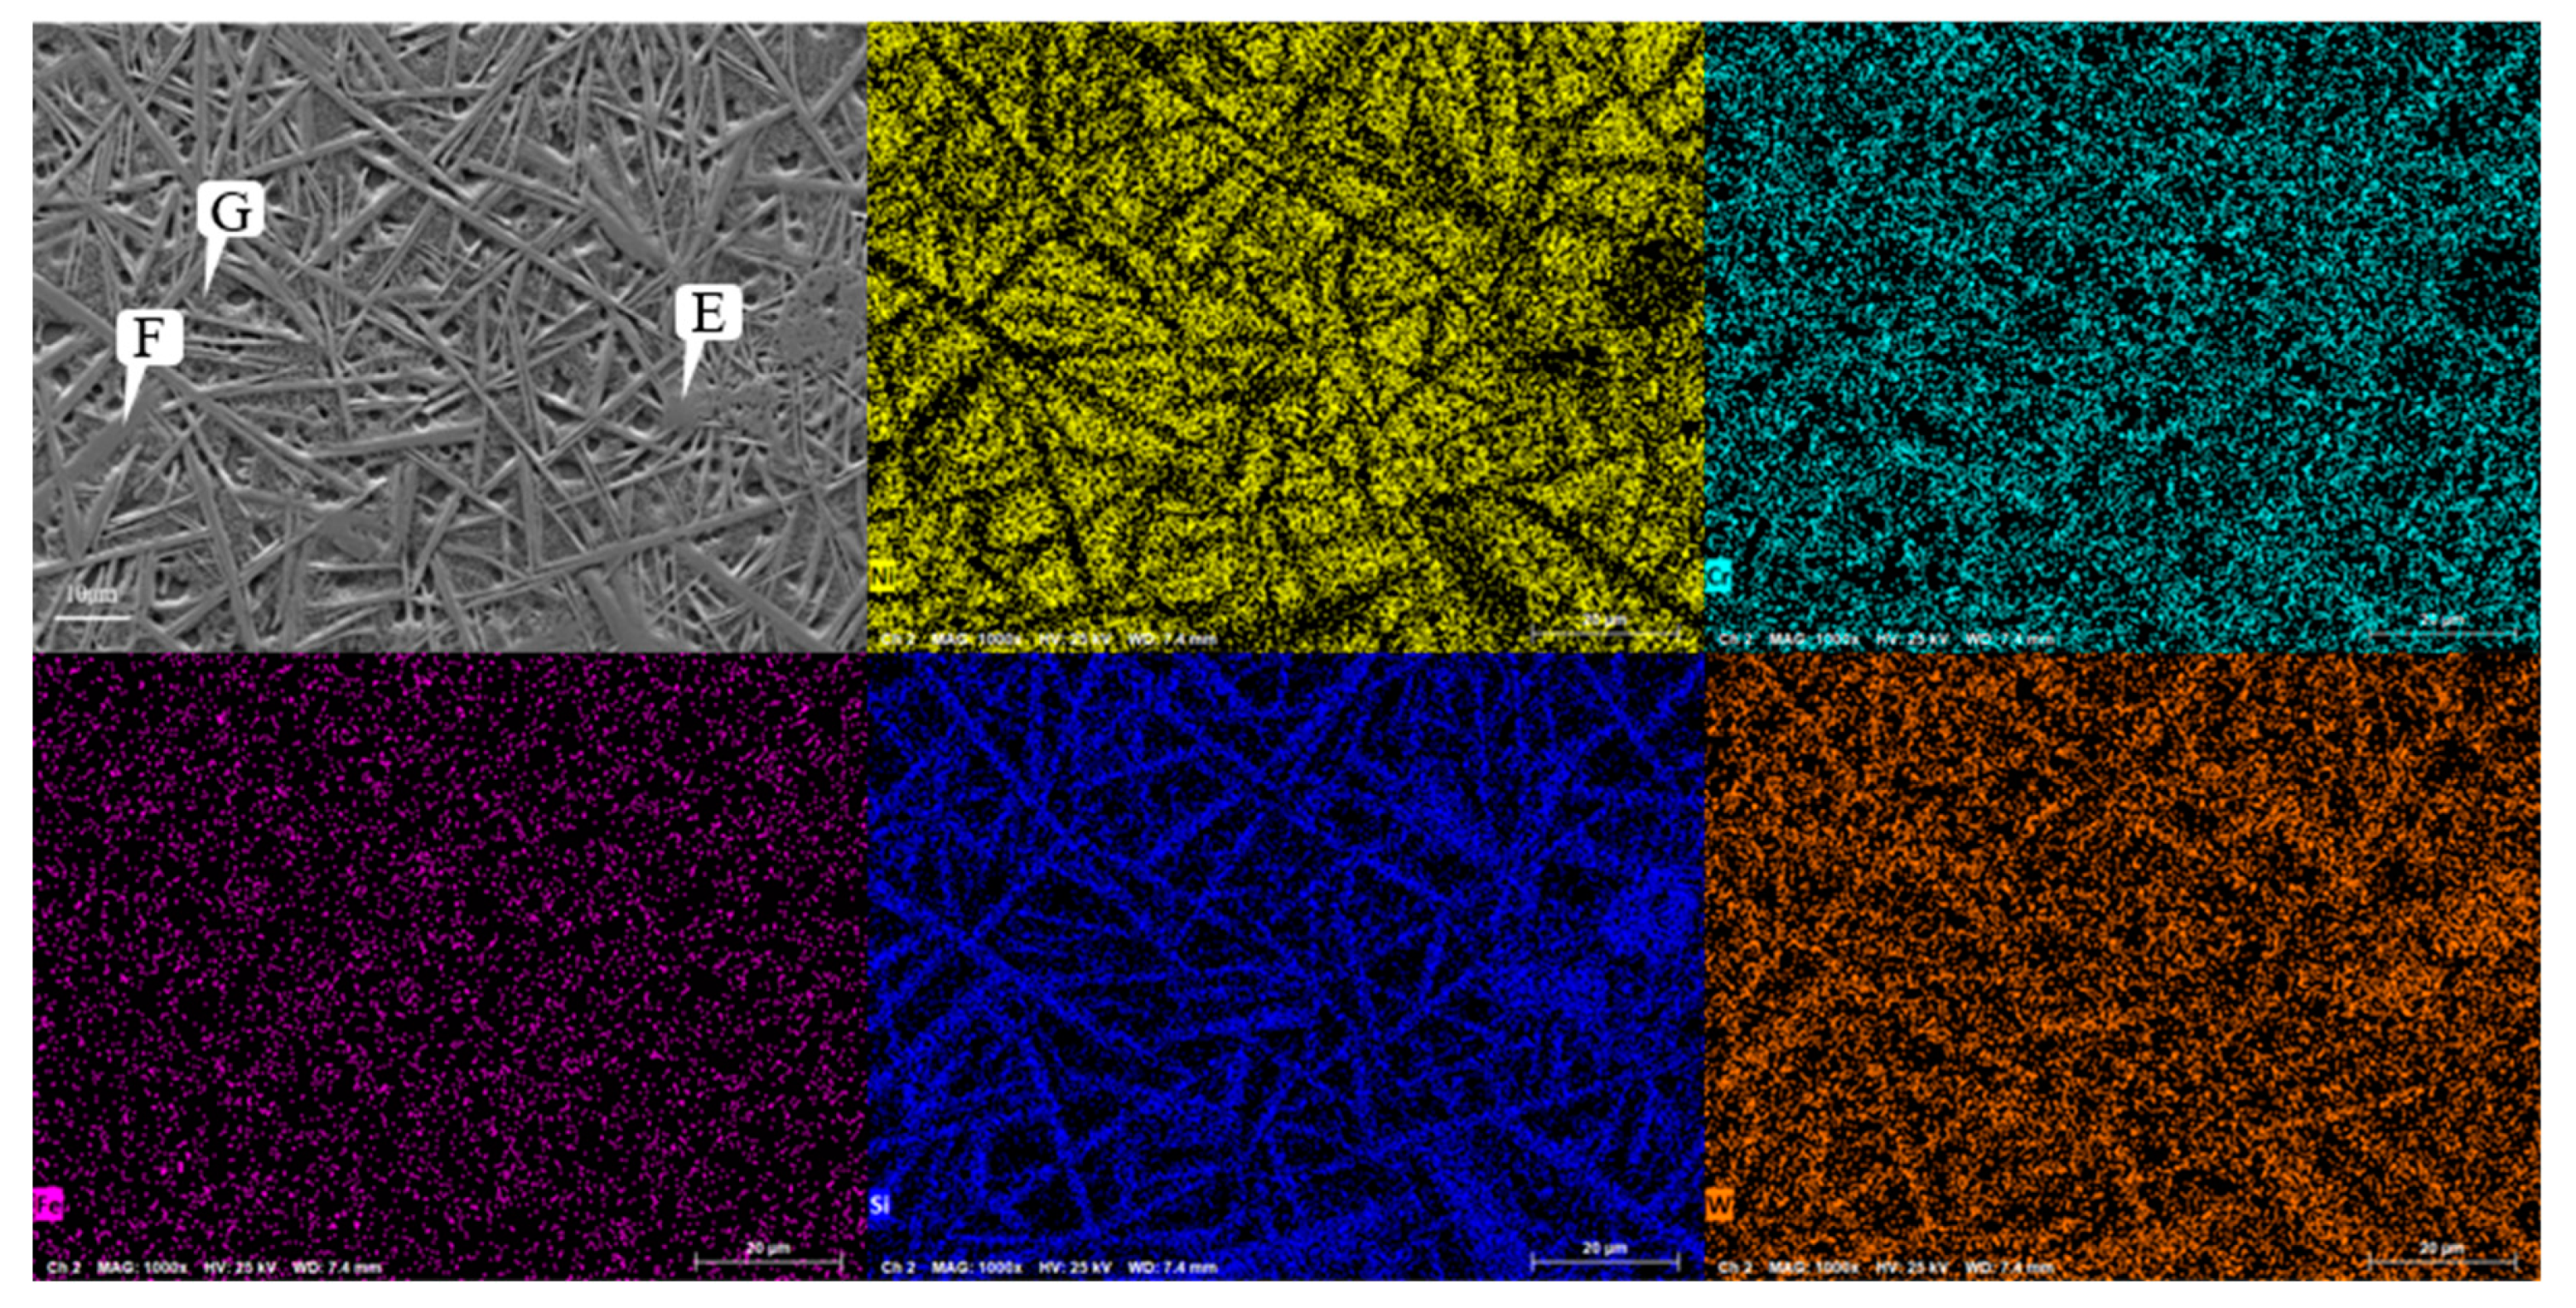
Figure 10.
X-ray diffraction patterns of WC/Ni60A composite coatings with different WC contents.
4. Effect of Graphene Content on Microstructure and Properties of New Coating
According to the research results in the previous section, Ni60A+20% WC coating was selected to study the content of graphene, and the specific configuration of Ni60A+20% WC+X% graphene (x=0, 0.1, 0.3, 0.5) mixed powder was used for cladding experiment.
The experimental hardness test results are shown in Table 9, and the section hardness distribution is shown in Figure 11. It can be seen that after adding graphene, the hardness of the coating is improved, and the measured hardness standard deviation is significantly reduced, indicating that after adding graphene, the hardness difference between different areas of the coating becomes smaller. However, with the increase of graphene content, when the graphene content increases to 0.5%, compared with 0.3%, the average hardness decreases, and the hardness standard deviation increases, indicating that the hardness difference between different areas of the coating increases at this time. This is because the addition of excessive graphene will produce aggregation phenomenon, resulting in uneven grain size and distribution in the microstructure, and the uniformity of coating hardness will be reduced.
Figure 12 shows the microstructure of the coating with different graphene content. As mentioned earlier, when graphene is not added, it presents snowflake like and branch like structures. With the increase of graphene content, the structure is refined first and then coarsened. When the content of graphene is 0.1%, the snowflake like structure is dispersed into smaller dot like structure, while the branch like structure becomes more slender. And, the part of the branch like structure is dispersed and composed of finer needle like structure. According to the scanning results of the coating layer containing 0.1% graphene in Figure 13, it can be found that although Cr, Si and W are still segregated, compared with Figure 18, the segregation region is more evenly distributed in the whole coating layer. When the graphene content is 0.3%, according to the surface scan results in Figure 14, it can be found that the segregation of Cr, Si and W is no longer obvious, especially the distribution of W and Cr in the whole region is relatively uniform. According to the analysis in Table 10 and Table 11, the element composition comparison of different positions obtained from the coating containing 0.1% graphene and the coating containing 0.3% graphene shows that the element segregation has been significantly improved with the graphene content increasing to 0.3%, At the same time, with the increase of graphene, the coarse dendrites are replaced by fine dendrites [9], which makes the microstructure of the coating more fine, effectively reducing the porosity of the coating, and this coating has stronger erosion resistance. However, when the content of graphene was further increased to 0.5%, it can be observed from Figure 12 that the structure was not further refined, but turned into a coarse strip structure. According to the scanning results of the coating layer containing 0.1% graphene in Figure 15, it can be found that not only the segregation of Cr, Si and W became very obvious again, but also the segregation of Fe in Ni enrichment. Comparing the EDS results in Table 6 and Table 12, it is found that when 0.5% graphene is added to the coating, the element segregation phenomenon is more serious than that of the coating without graphene.
Figure 16 shows the X-ray diffraction patterns of WC/Ni60A composite coatings with different graphene contents. According to the XRD results, the addition of graphene has no obvious effect on the phase composition. With the addition of graphene, the content of different phases changes, which is specifically reflected in the change of peak intensity of different phases. After the addition of graphene, the peak intensity corresponding to Cr3C2, WSi2 and W2C increases compared with other phases. The above phases are hard phases, and the increase of their content helps to improve the hardness of the coating. When the content of graphene increases to 0.3%, it can be seen that the peak value of the generated phase in the XRD test results is relatively uniform. Combined with the above microscopic morphology analysis, a small amount of graphene can make the structure distribution more uniform and the grains more refined, so the hardness of the coating will be increased, and the hardness difference at different positions will be reduced. However, when the content of graphene increased to 0.5, it can be seen that the peak intensities of Cr3C2 and C in XRD test increased significantly, but the peak intensities of W and its compounds and M23C6 decreased. It can be seen from Figure 15 that element segregation is serious at 0.5% graphene, which will lead to uneven hardness distribution of the coating. The above analysis is consistent with the hardness test results in Table 9. Because graphene can increase the thermal conductivity of the coating, when there is a small amount of graphene in the coating, the thermal energy input by the laser can be dispersed to a certain extent, making the generated phase distribution uniform and reducing element segregation. However, due to the agglomeration characteristics of graphene, with the increase of graphene content, combined with its excellent thermal conductivity, the laser energy will accumulate during the cladding process, leading to the enrichment of the generated phase during precipitation.
5. Conclusions
The conclusions obtained in this paper are as follows.
(1) The hardness of WC/Ni60A composite coating increases with the increase of WC content. When WC is not added, the average hardness of Ni60A coating is only 753.3HV. However, after adding WC, the hardness has significantly improved, especially when the WC content is 10% and 20%, the hardness has increased by 13.3% and 32.6%, respectively. When the WC content further increases, the increase in hardness is relatively small.
(2) The main components of Ni60A coating are ɤ- Ni, FeNi3, M23C6 (M=Fe, Cr), Cr3C2, Fe3C. In the SEM image, it can be seen that Cr exhibits obvious segregation, in the form of block or strip aggregation.
(3) After the addition of WC, new phases WC, W2C, WSi2, W, and C appeared in the coating. The distribution of W exhibits a characteristic of widespread distribution and partial segregation, with snowflake like and branch like tissues formed at the segregation of Cr, Si, and W.
(4) The average hardness of the coating first increased and then decreased with the increase of graphene content, and reached the maximum when the graphene content was 0.3%.
(5) The microstructure of the coating was refined first and then coarsened with the increase of graphene content. When the content of graphene was 0.3%, the branch like structure was dispersed into finer needle like structure, and the element distribution was more uniform. When the content of graphene was 0.5%, the branched structure became thicker, and not only the segregation of Cr, Si and W became very obvious again, but also the segregation of Fe occurred at the Ni enrichment site.
Declaration of Interest Statement
The authors declare that they have no known competing financial interests or personal relationships that could have appeared to influence the work reported in this paper.
Date availability
Date will be made available on request.
Acknowledgments
This work was supported by National Key Research and Development Program of China (“Novel Drilling Technology Combining Ultra-high Pressure Jet and Percussion for ROP Improvement in deep geothermal drilling”, grant no. 2021YFE0111400), and the Open Fund of State Key Laboratory of Shale Oil and Gas Enrichment Mechanisms and Effective Development, and the General Project of Jiangsu Province University Basic Science (NATURAL SCIENCE) Research (grant no. 22KJD430001).
References
- W. Yuan, R.Li, Z.Chen, J.Gu, A comparative study on microstructure and properties of traditional laser cladding and high-speed laser cladding of ni45 alloy coatings. Surface and Coatings Technology, 405(2020), 126582. [CrossRef]
- C. Chen, A. Feng, Y. Wei, Y. Wang, X. Pan, X. Song, Effects of WC particles on microstructure and wear behavior of laser cladding Ni60 composite coatings, Optics & Laser Technology, 163 (2023) 109425. [CrossRef]
- Q. Wang, F.Q. Chen, Q. Li, L. Zhang, H. Jin, J.W. Zhang, Microstructure and properties of Ni60 alloy coating prepared by electromagnetic compound field assisted laser cladding, Materials Chemistry and Physics, 291 (2022) 126678. [CrossRef]
- D.M. Goodarzi, J. Pekkarinen, & A.Salminen. Analysis of laser cladding process parameter influence on the clad bead geometry. Welding in the World, 61(2017), 883-891. [CrossRef]
- S. Xu, Q. Cai, G. Li, X. Lu, X. Zhu, Effect of scanning speed on microstructure and properties of TiC/Ni60 composite coatings on Ti6Al4V alloy by laser cladding, Optics & Laser Technology, 154 (2022) 108309. [CrossRef]
- R. K. Abbas. A review on the wear of oil drill bits (conventional and the state of the art approaches for wear reduction and quantification). Engineering Failure Analysis, 90(2018), 554-584. [CrossRef]
- C. Feng, W. Liu, & D. Gao. CFD simulation and optimization of slurry erosion of PDC bits. Powder Technology, 408(2022) 117658. [CrossRef]
- J. Zhao, G. Zhang, Y. Xu, R. Wang, W. Zhou, & D. Yang,Experimental and theoretical evaluation of solid particle erosion in an internal flow passage within a drilling bit. Journal of Petroleum Science and Engineering, 160(2018), 582-596. [CrossRef]
- O. Kendall, R. Abrahams, A. Paradowska, M. Reid, C. Qiu, P. Mutton, T. Schläfer, W. Yan, Influence of multi-layer laser cladding depositions and rail curvature on residual stress in light rail components, Engineering Failure Analysis, 150 (2023) 107330. [CrossRef]
- W. Zhang, X. Shang, M. Hu, X. He, B. Yang, K. Dai, X. Ni, L. Lu, L. Zhou, L. Zhang, D. Kong, C. Dong, Microstructure and corrosion-wear behaviors for laser cladding repaired martensitic stainless steels using Co-based and Ni-based powders, Materials Today Communications, 35 (2023) 106287. [CrossRef]
- S. Li, K. Huang, Z. Zhang, C. Zheng, M. Li, L. Wang, K. Wu, H. Tan, X. Yi, Wear mechanisms and micro-evaluation of WC + TiC particle-reinforced Ni-based composite coatings fabricated by laser cladding, Materials Characterization, 197 (2023) 112699. [CrossRef]
- V.I. Stanciu, V. Vitry, & F. Delaunois, Tungsten carbide powder obtained by direct carburization of tungsten trioxide using mechanical alloying method. Journal of Alloys and Compounds, 659(2016), 302-308. [CrossRef]
- D.Q.Dong, F,Y. He, X.H. Chen,H. Li, K. H.Shi, & L.Zhang, Effect of tungsten carbide particles on microstructure and mechanical properties of Cu alloy composite bit matrix. Journal of Iron and Steel Research International, (2023).1-12. [CrossRef]
- T. Wu, W. Shi, L. Xie, M. Gong, J. Huang, Y. Xie, K. He, Effects of re-melting process parameters on the forming quality of the Stellite 6/WC laser cladding layer, Optik, 269 (2022) 169887. [CrossRef]
- L. Chen, T. Yu, X. Chen, Y. Zhao, C. Guan, Process optimization, microstructure and microhardness of coaxial laser cladding TiC reinforced Ni-based composite coatings, Optics & Laser Technology, 152 (2022) 108129. [CrossRef]
- L. Mao, M. Cai, Q. Liu, &L. Han, Effects of spherical WC powders on the erosion behavior of WC-Ni hardfacing used for steel body drill bit. Surface and Coatings Technology, 409(2021), 126893. [CrossRef]
- M. Inagaki, &F. Kang, (2014). Graphene derivatives: graphane, fluorographene, graphene oxide, graphyne and graphdiyne. Journal of Materials Chemistry A, 2(33)(2014), 13193-13206. [CrossRef]
- T. Sattar, Current review on synthesis, composites and multifunctional properties of graphene. Topics in Current Chemistry, 377(2019), 1-45. [CrossRef]
- D.Zhan, J.X. Yan, Z.H. Ni, L. Sun, L.F. Lai, L. Liu, & Z.X. Shen, Z. X. Bandgap-Opened Bilayer Graphene Approached by Asymmetrical Intercalation of Trilayer Graphene. Small, 11(9-10) (2015), 1177-1182. [CrossRef]
- K. Jagannadham. Effect of interfacial interactions on the thermal conductivity and interfacial thermal conductance in tungsten–graphene layered structure. Journal of Vacuum Science & Technology A, 32(5)(2014). [CrossRef]
- W.F. Chen, J.M. Schneider, K. Sasaki, C.H. Wang, J. Schneider, Tungsten carbide–nitride on graphene nanoplatelets as a durable hydrogen evolution electrocatalyst. ChemSusChem, 7(9) (2014), 2414-2418. [CrossRef]
- L.C. Xuan, J.S. Wang. A new type of high hardness coating for improving drill bit stability in unconventional oil and gas development. Frontier in energy research, 2023, 11:1277648. [CrossRef]
Figure 1.
Q235 steel base plate.
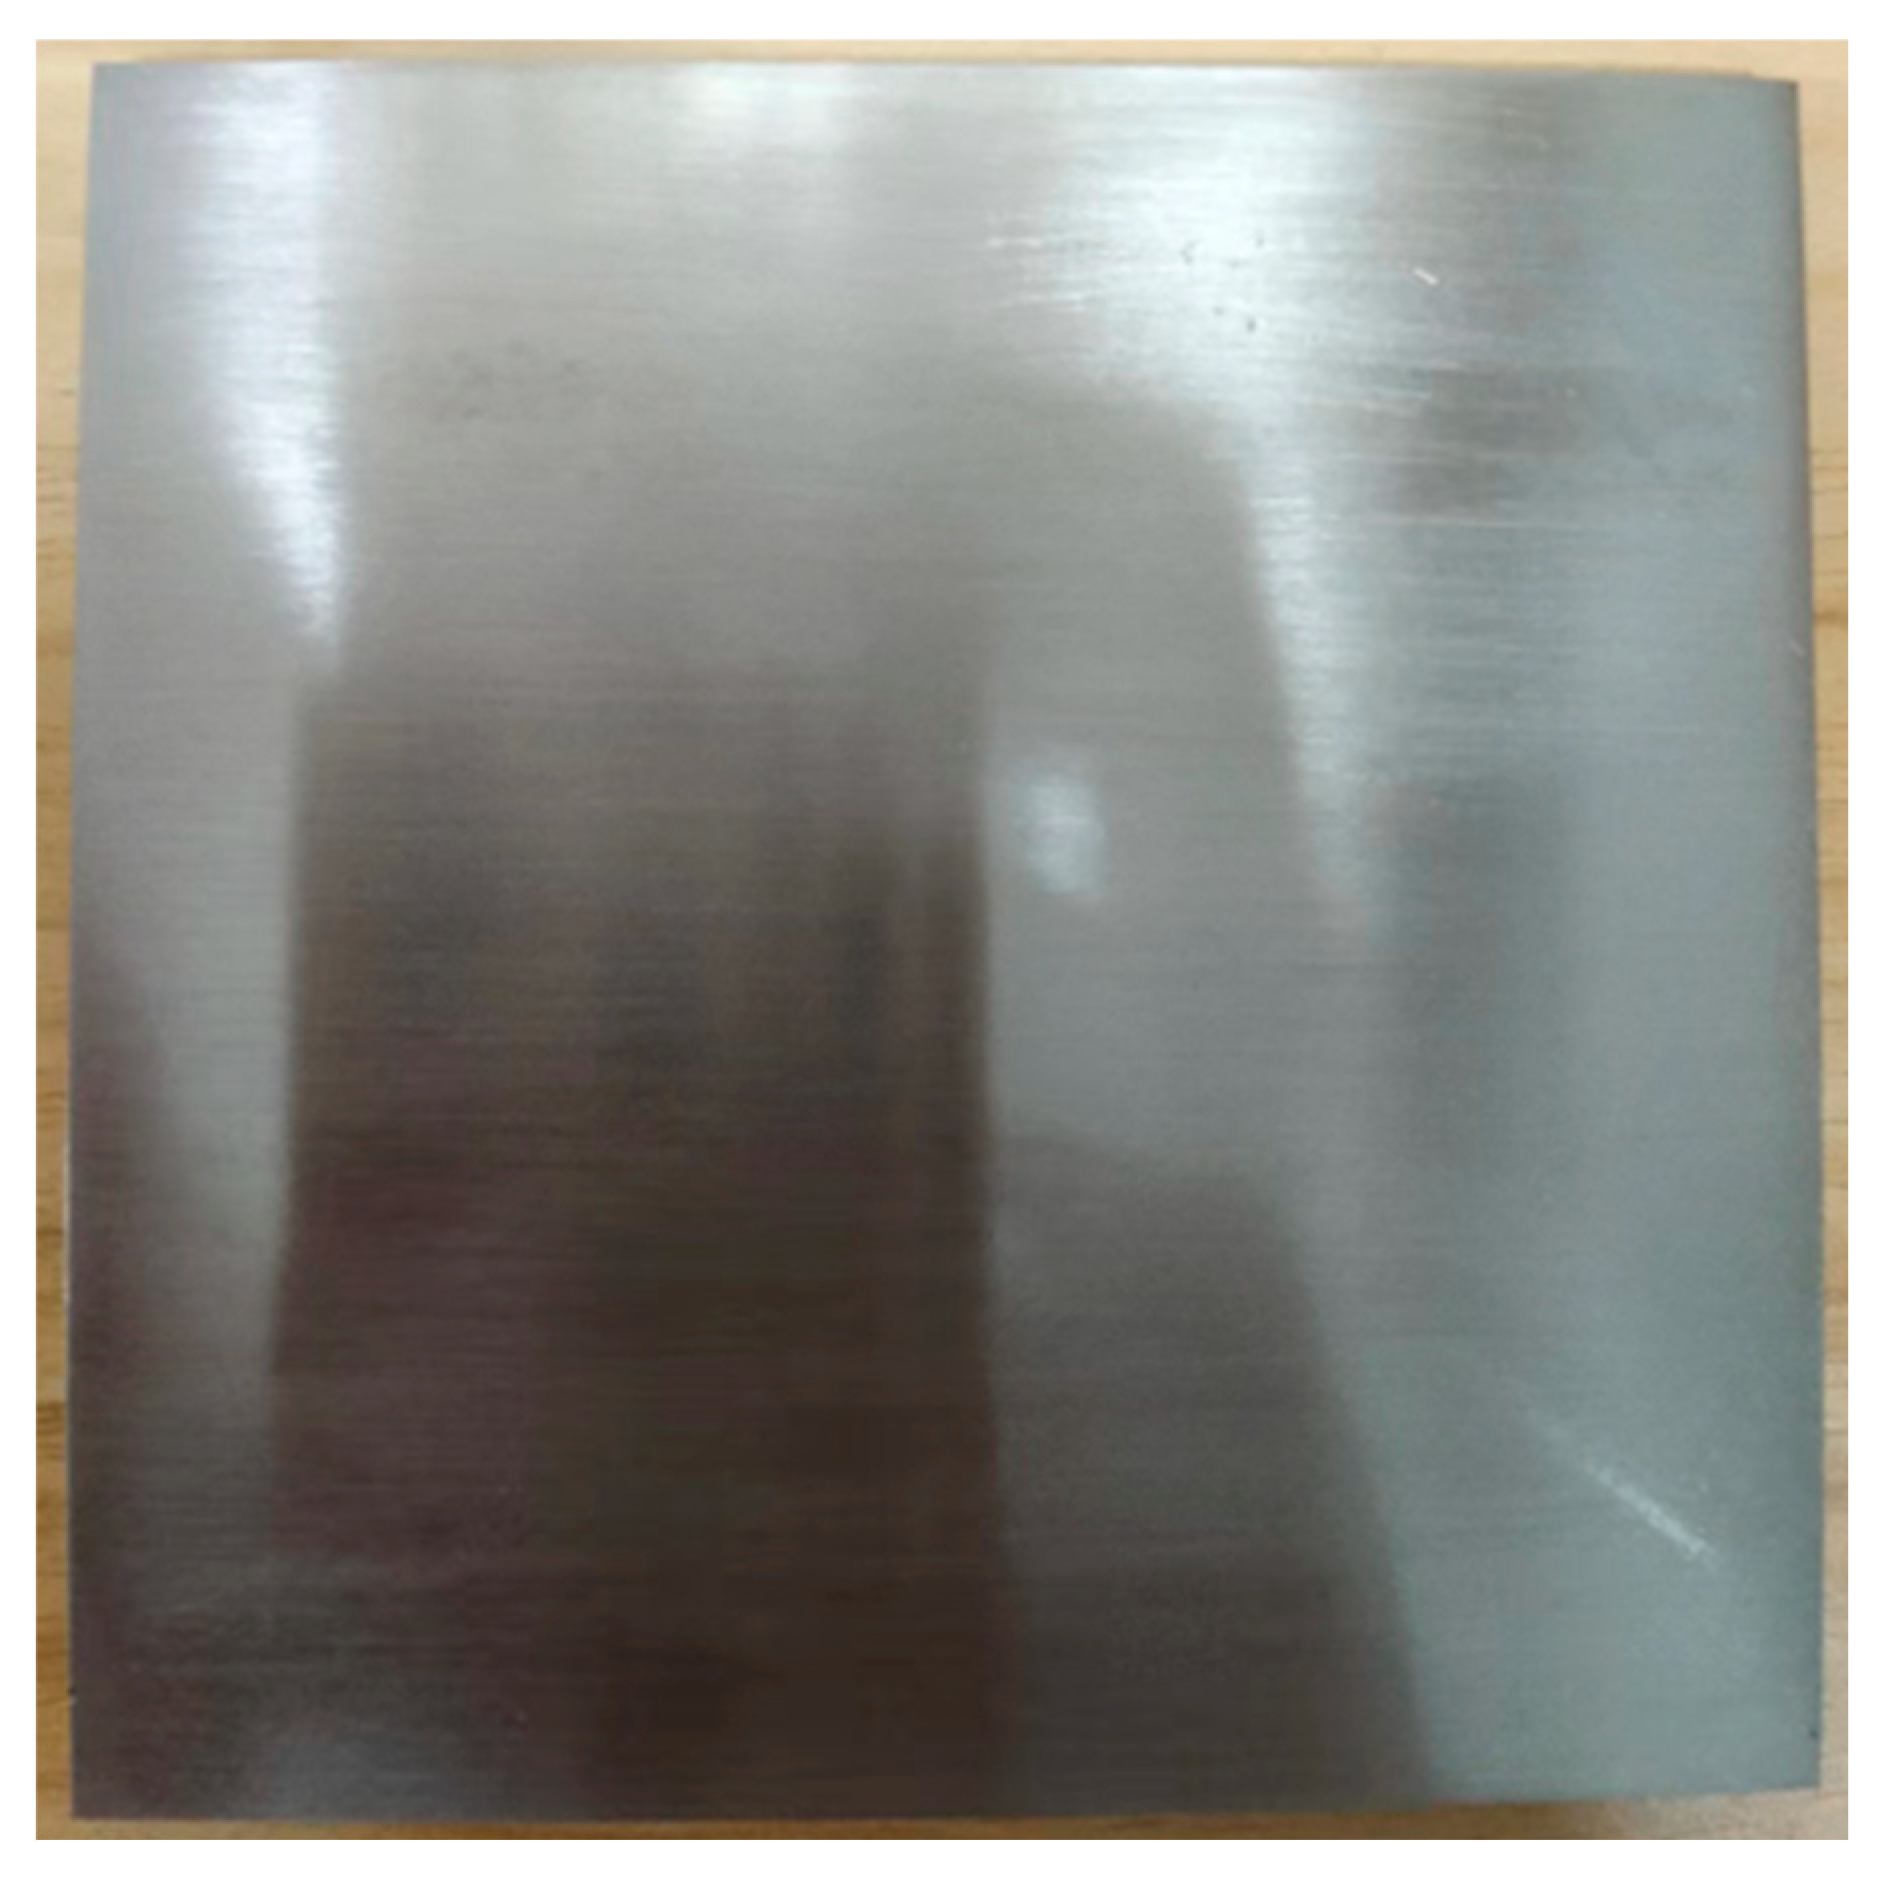
Figure 2.
The SEM of the powder; Ni60, WC, Graphene.

Figure 3.
Powder laying laser cladding equipment.
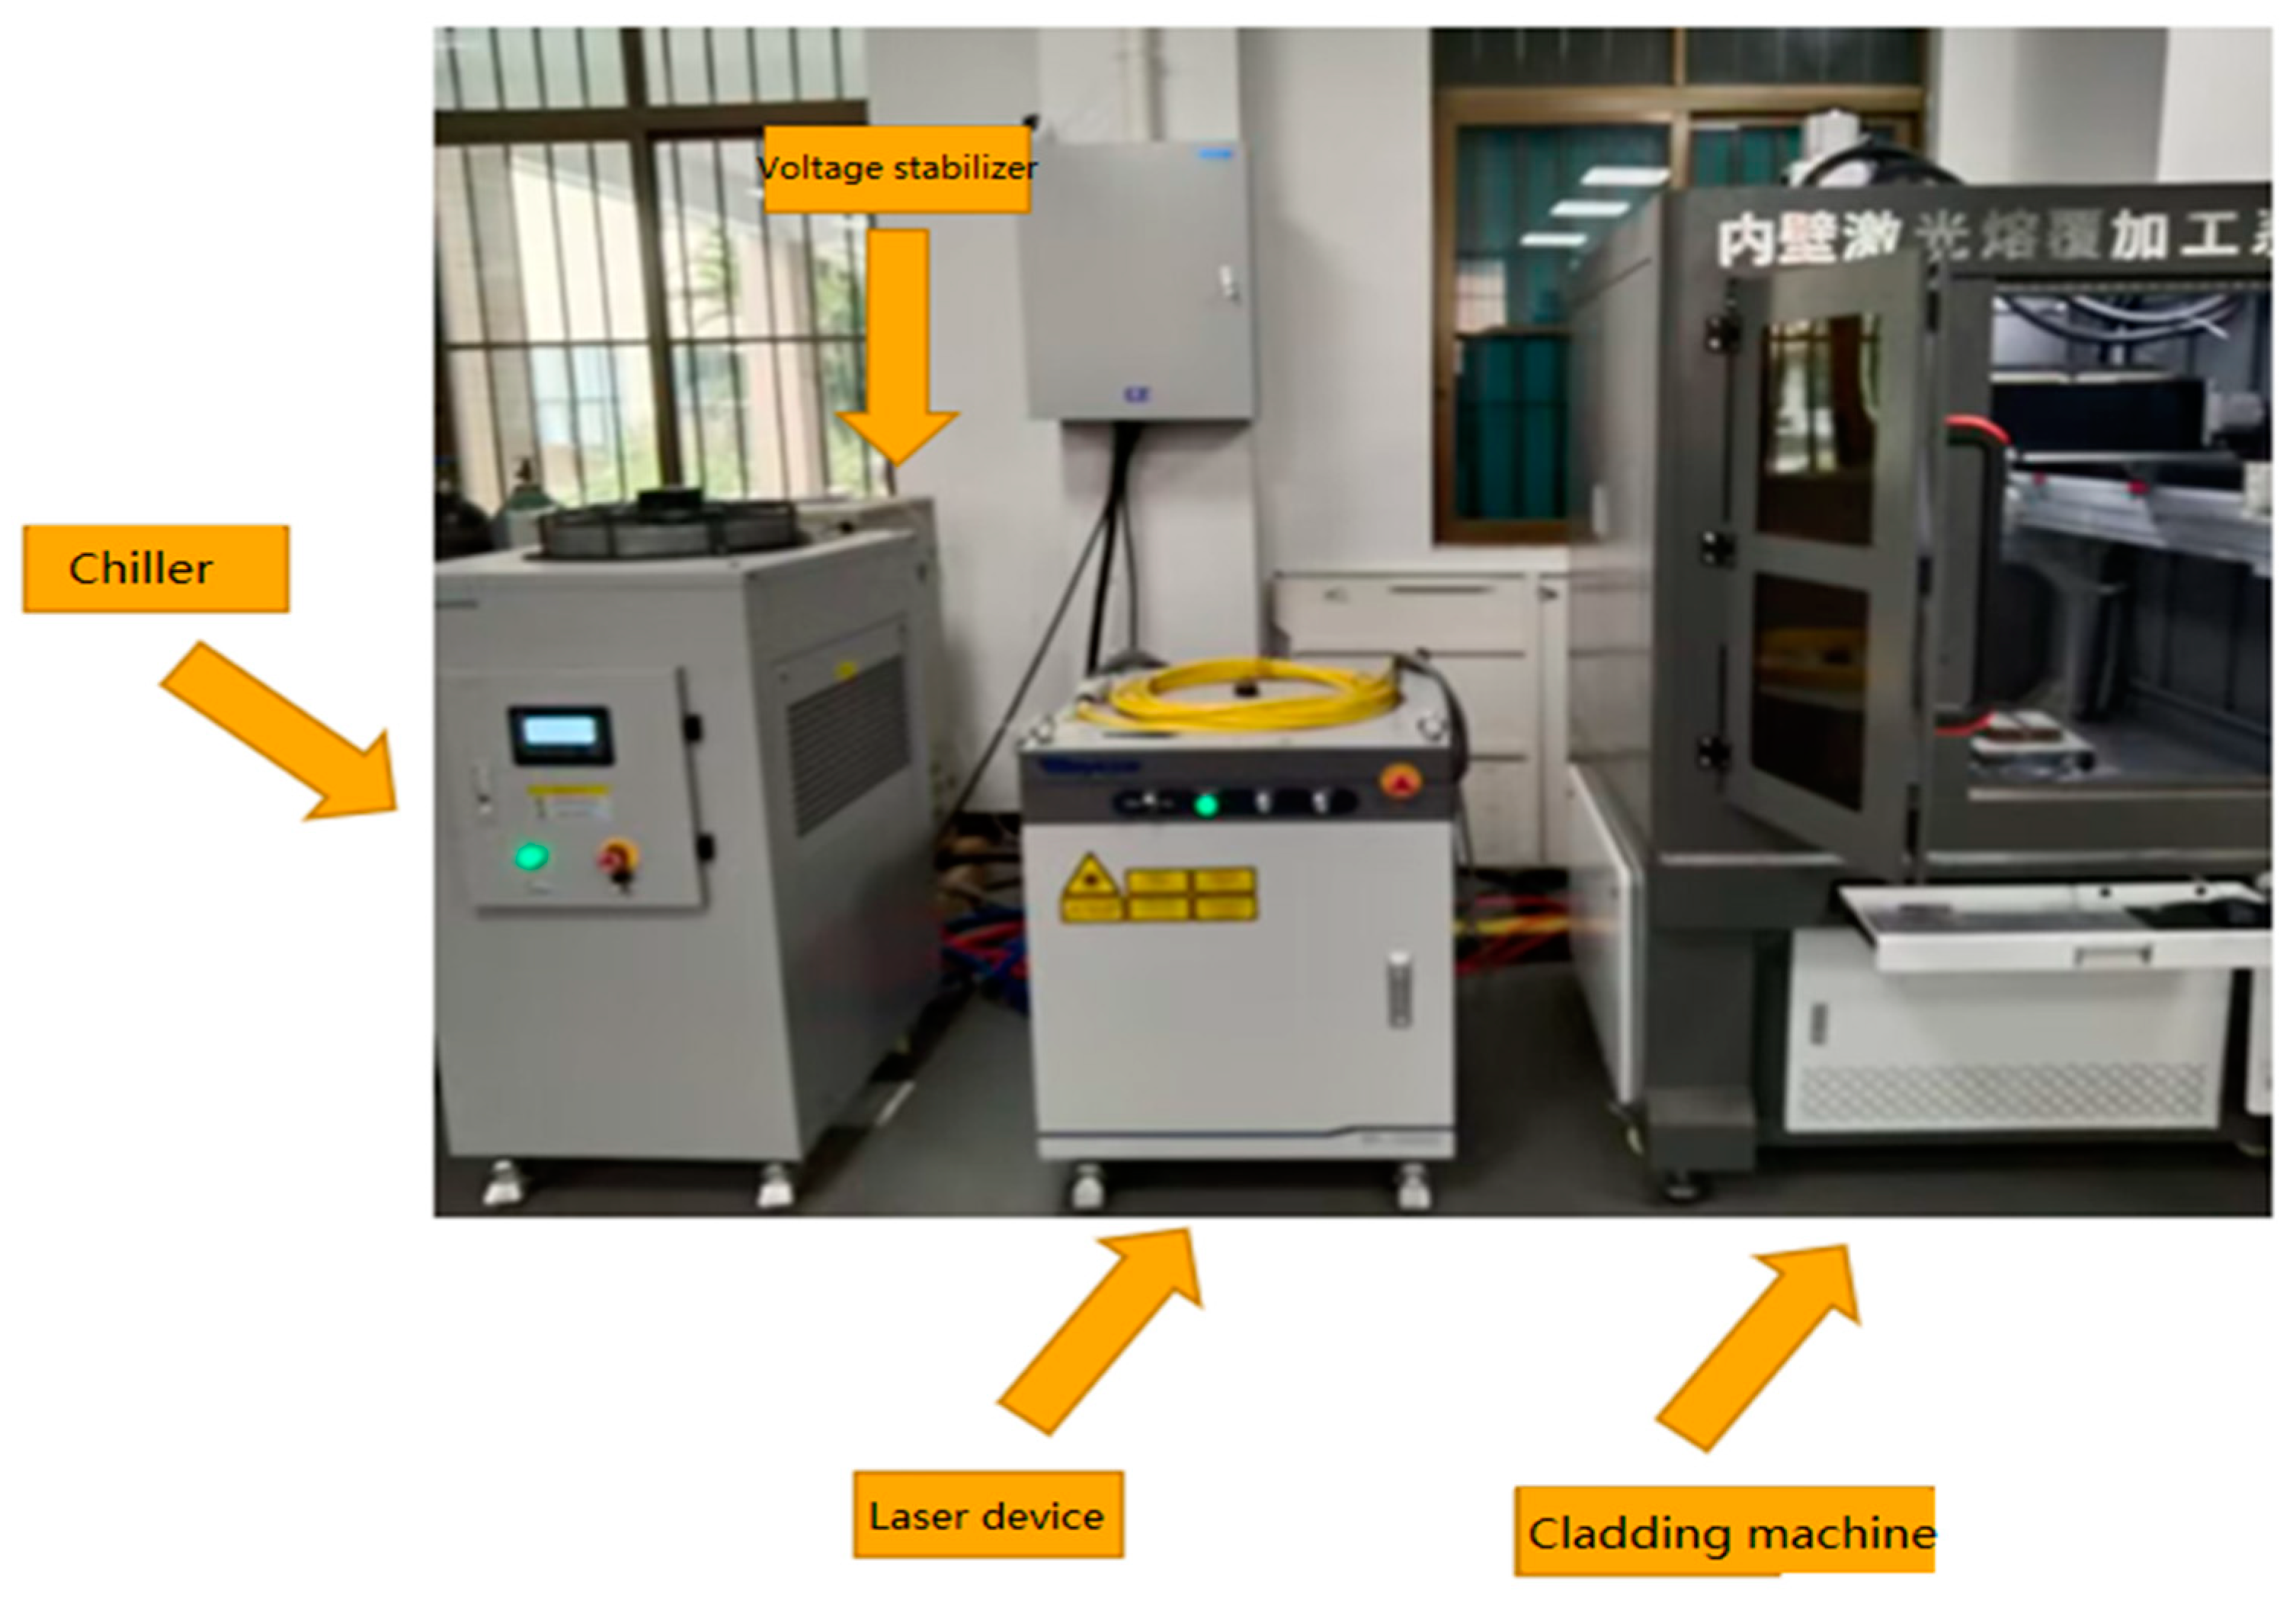
Figure 4.
Effect of powder spreading and drying.
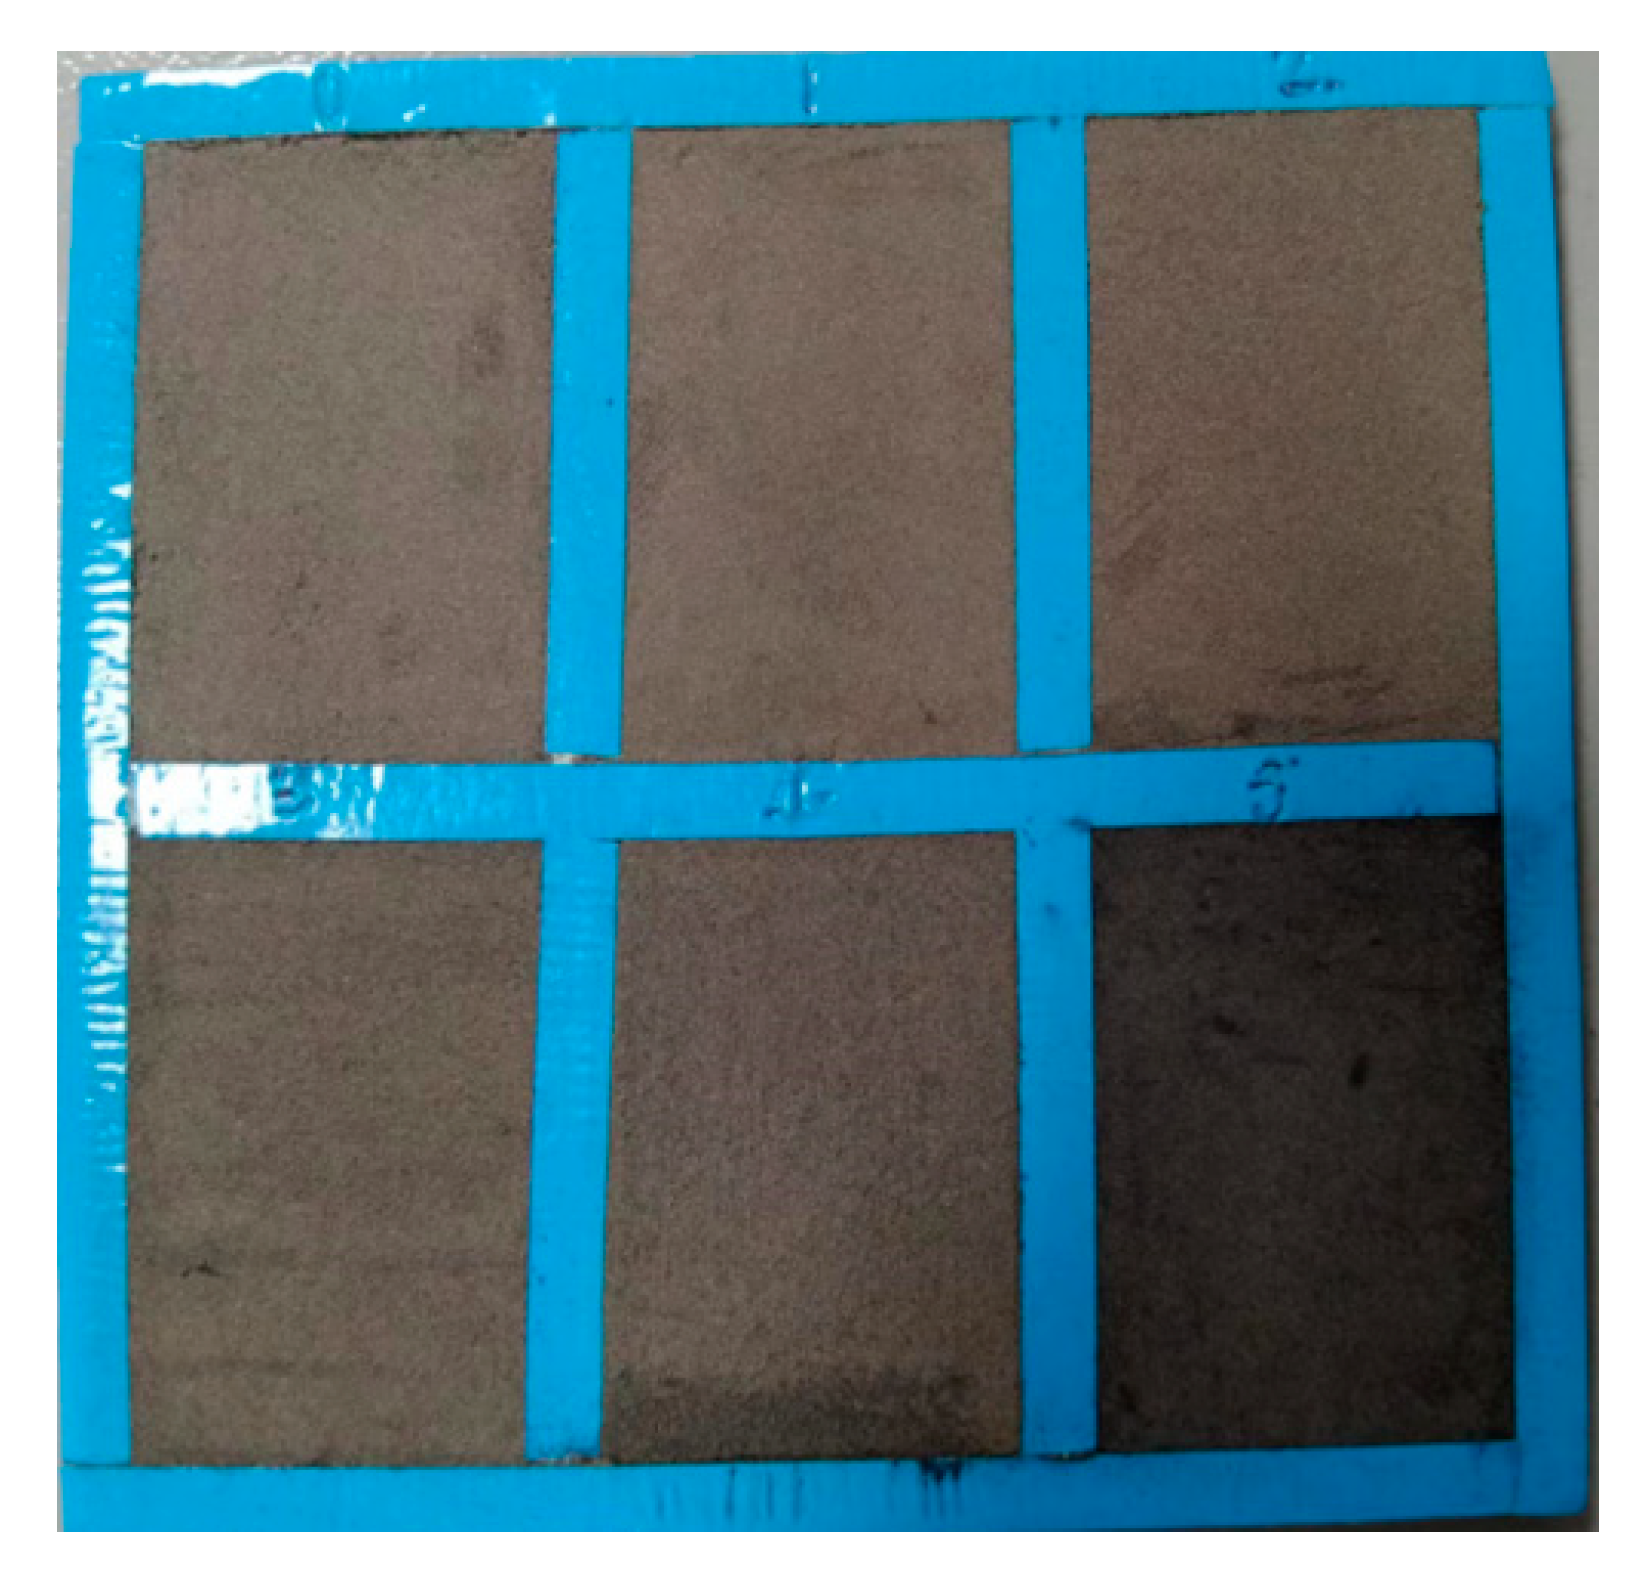
Figure 5.
Partial sample display.
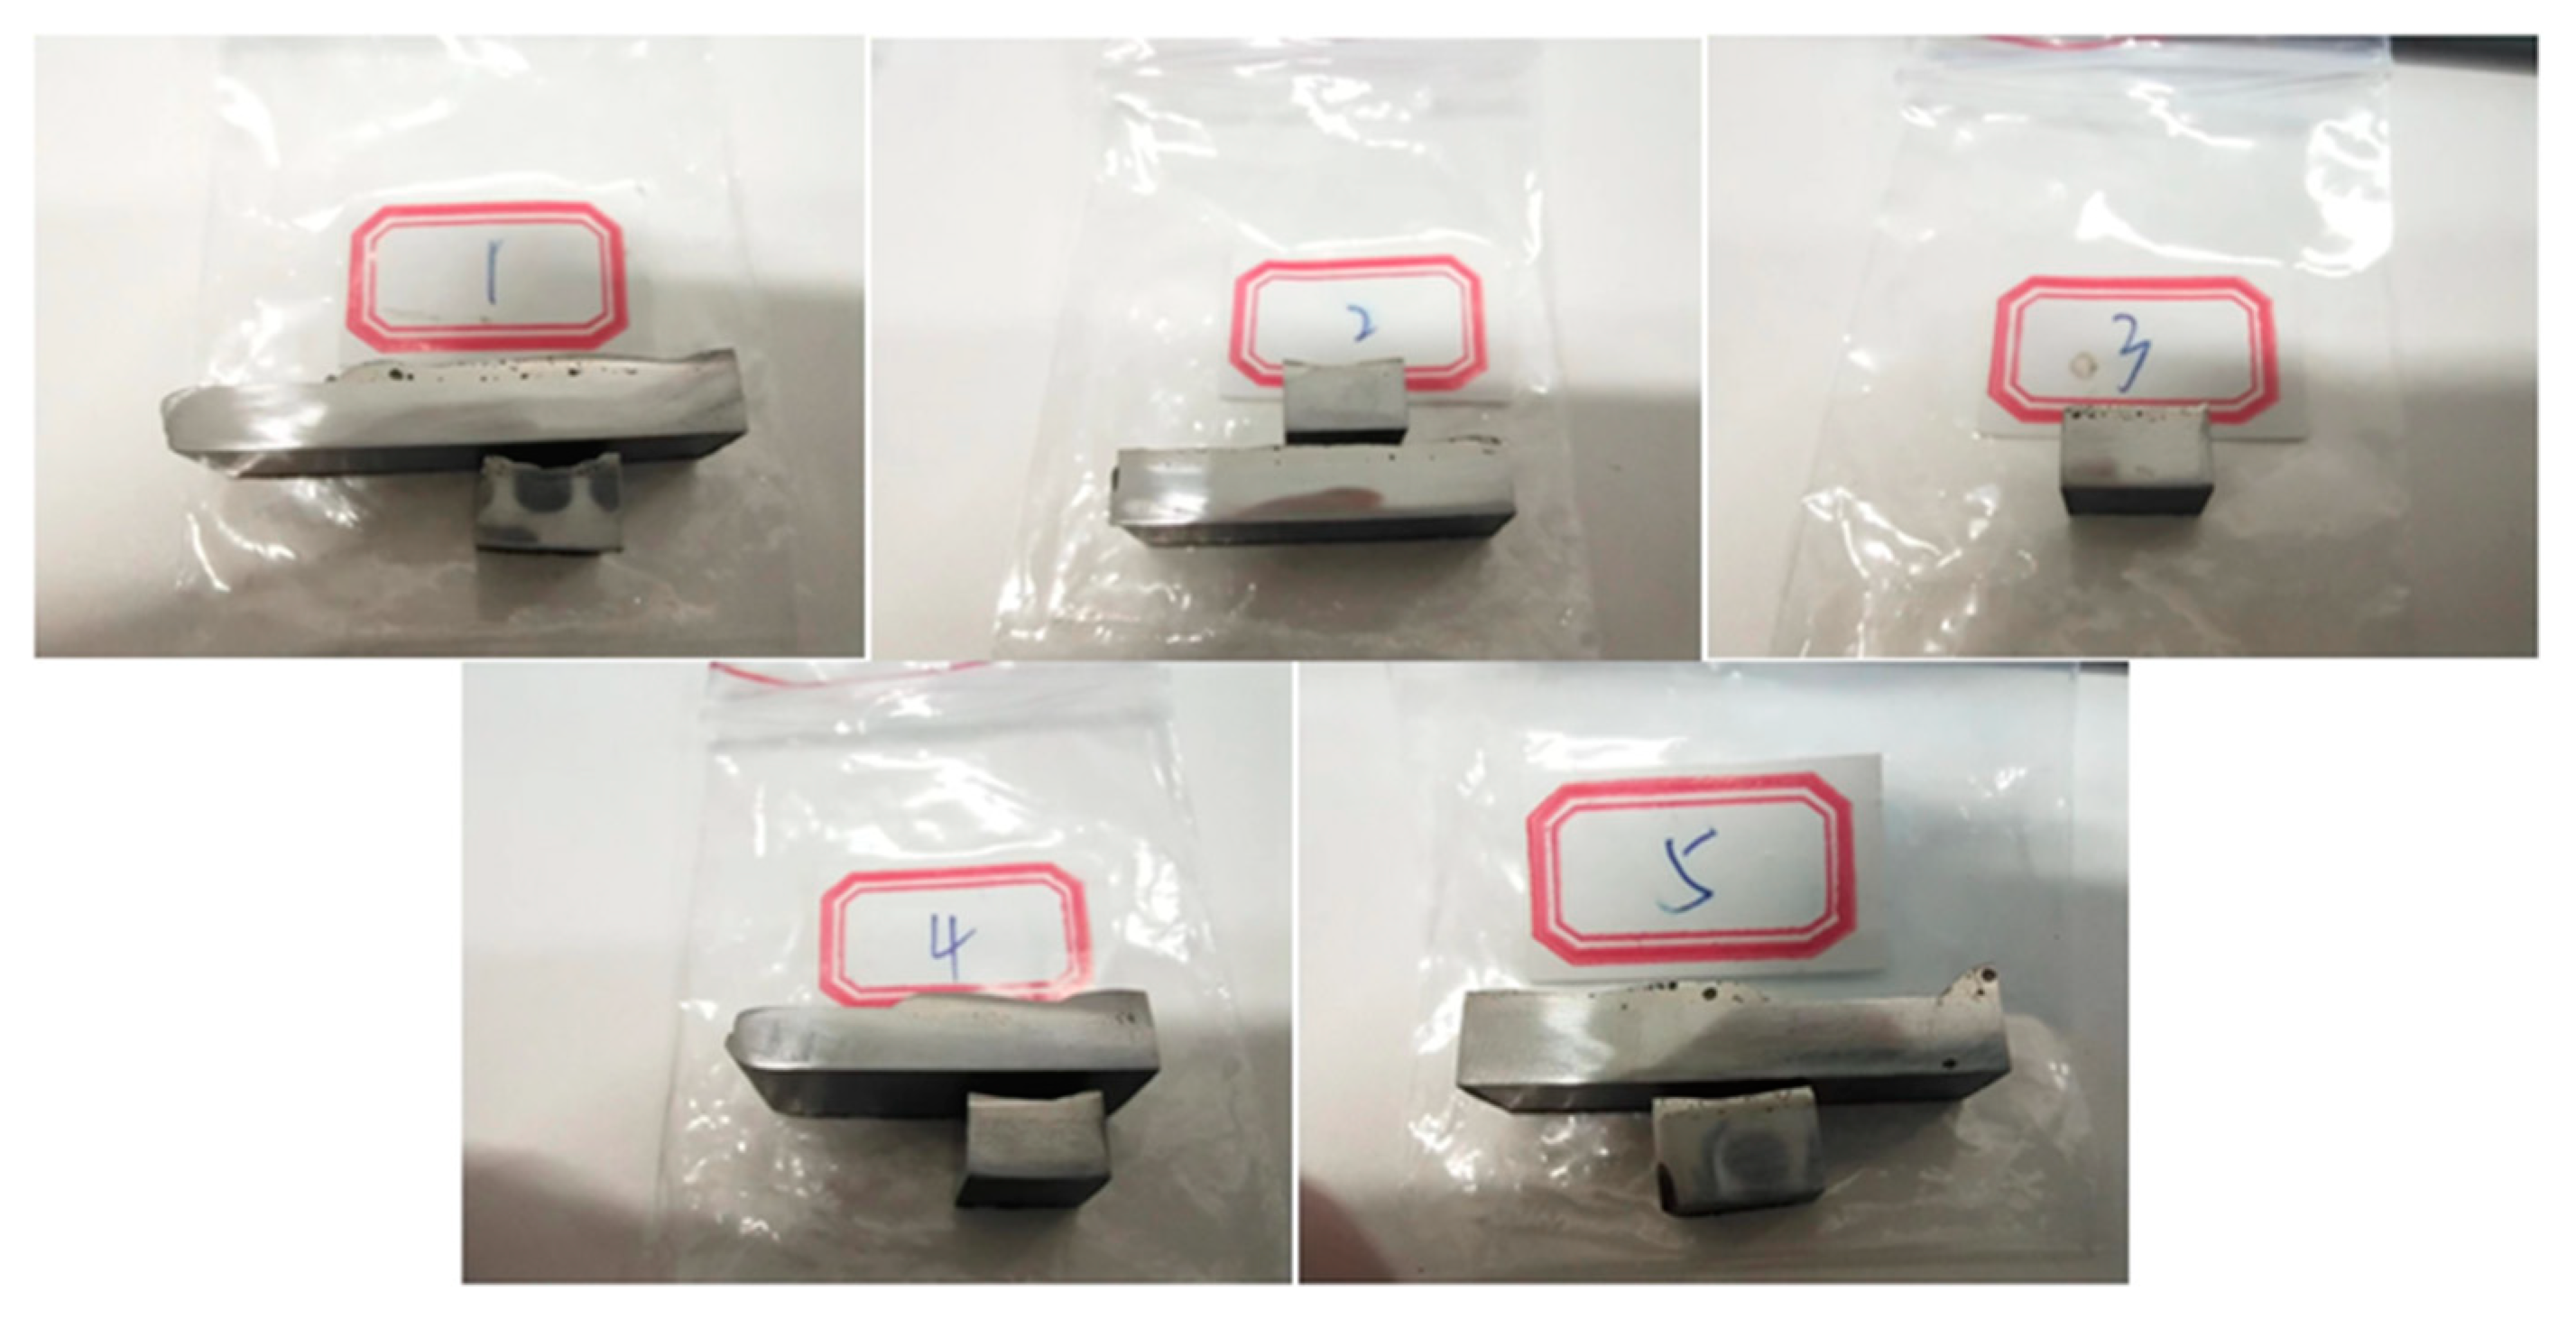
Figure 6.
Microhardness of Ni60A coating with different mass fractions of WC.
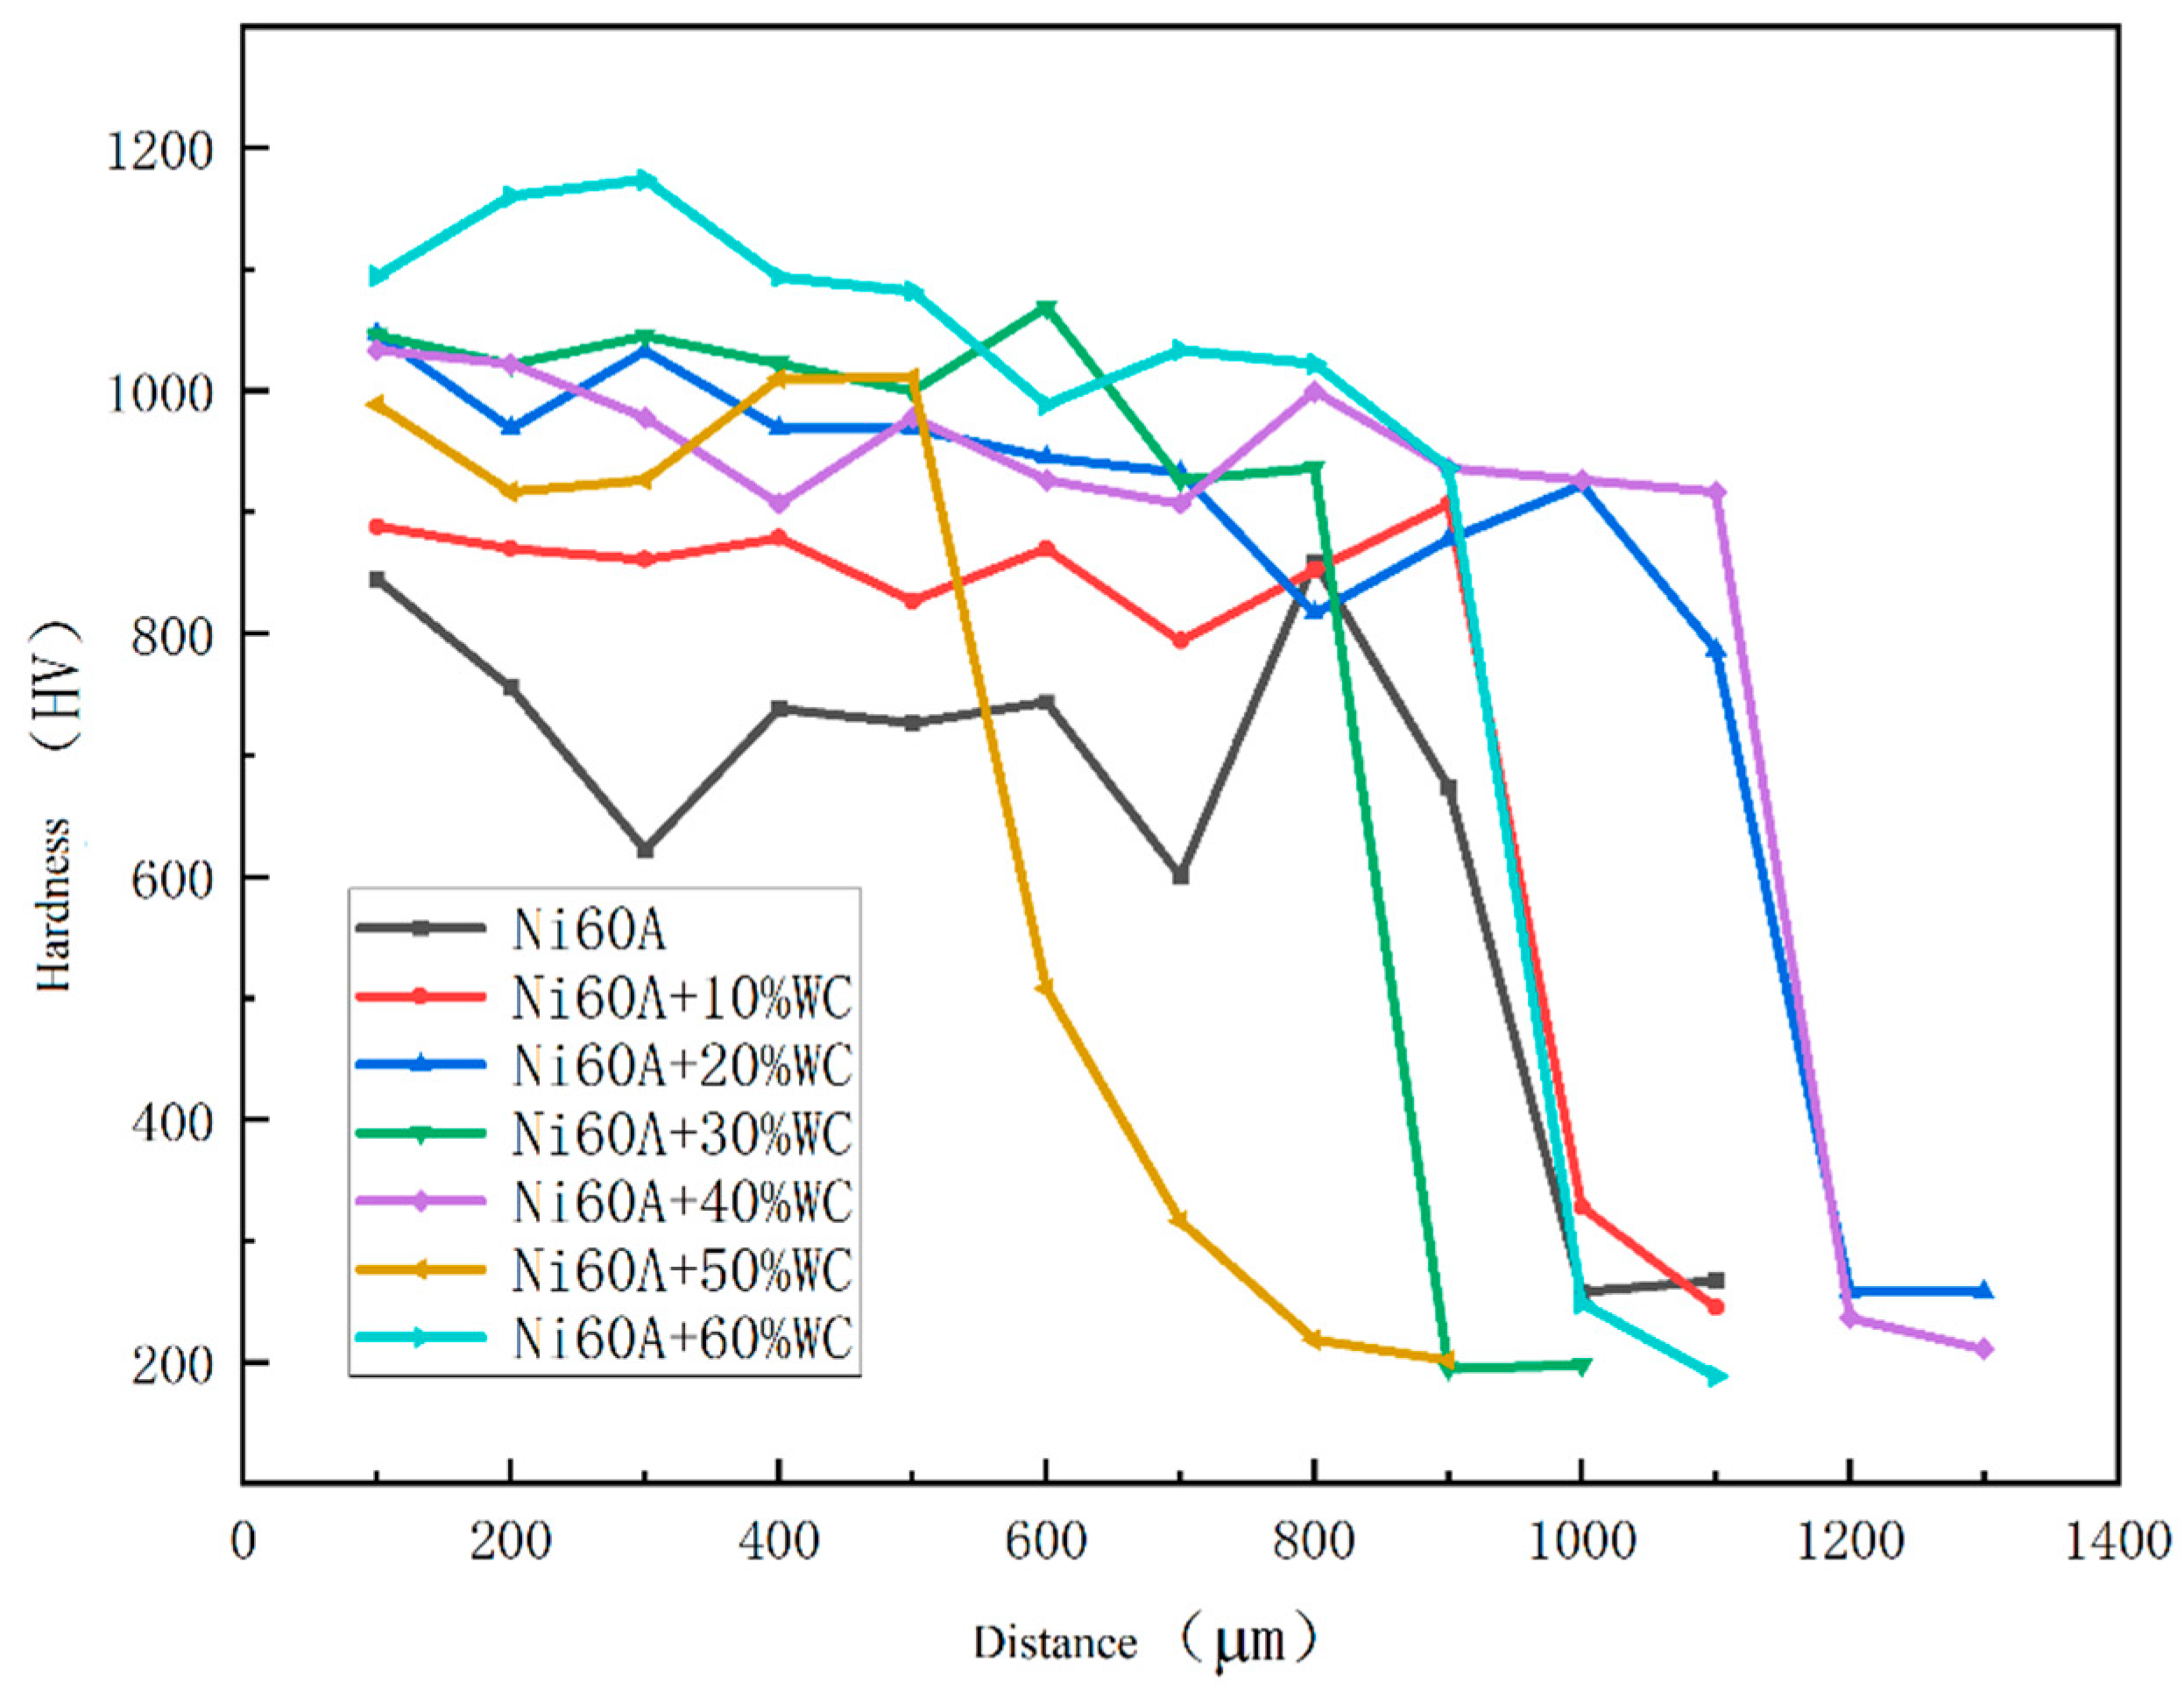
Figure 7.
Microstructure and Morphology of Laser Cladding Ni60A Coating.
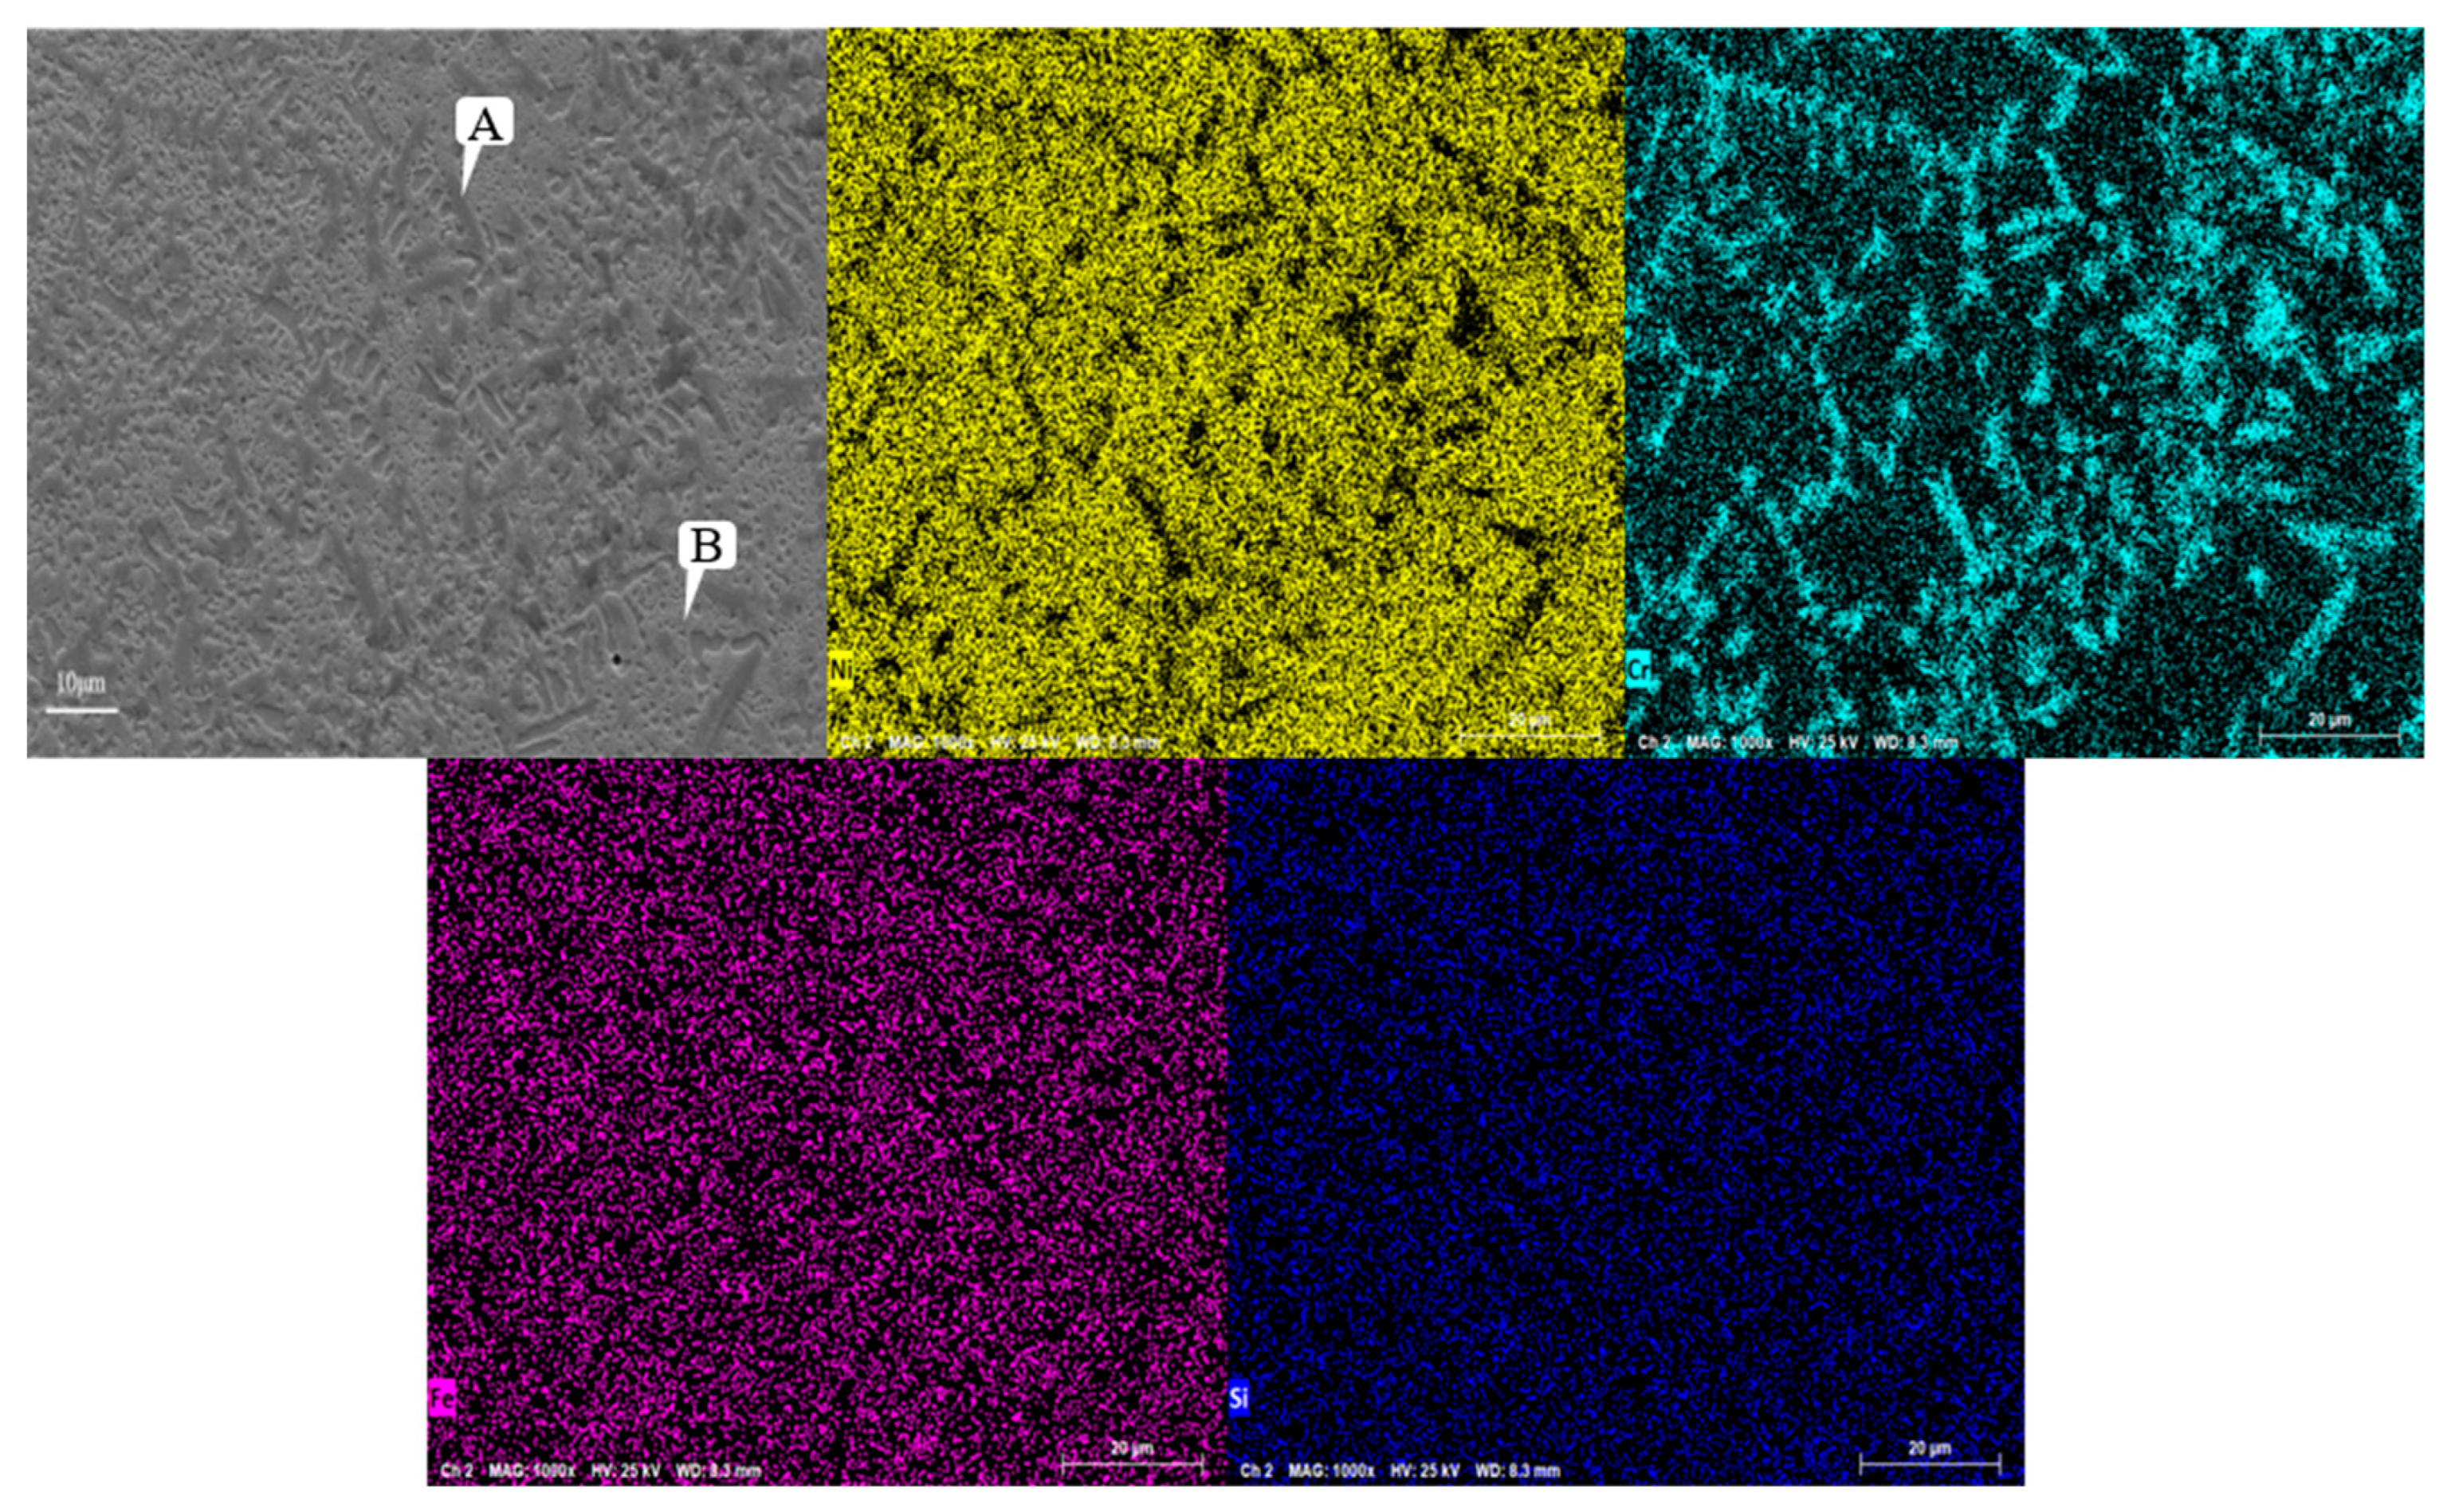
Figure 8.
Microstructure of Laser Cladding Ni60A+20% WC Coating.
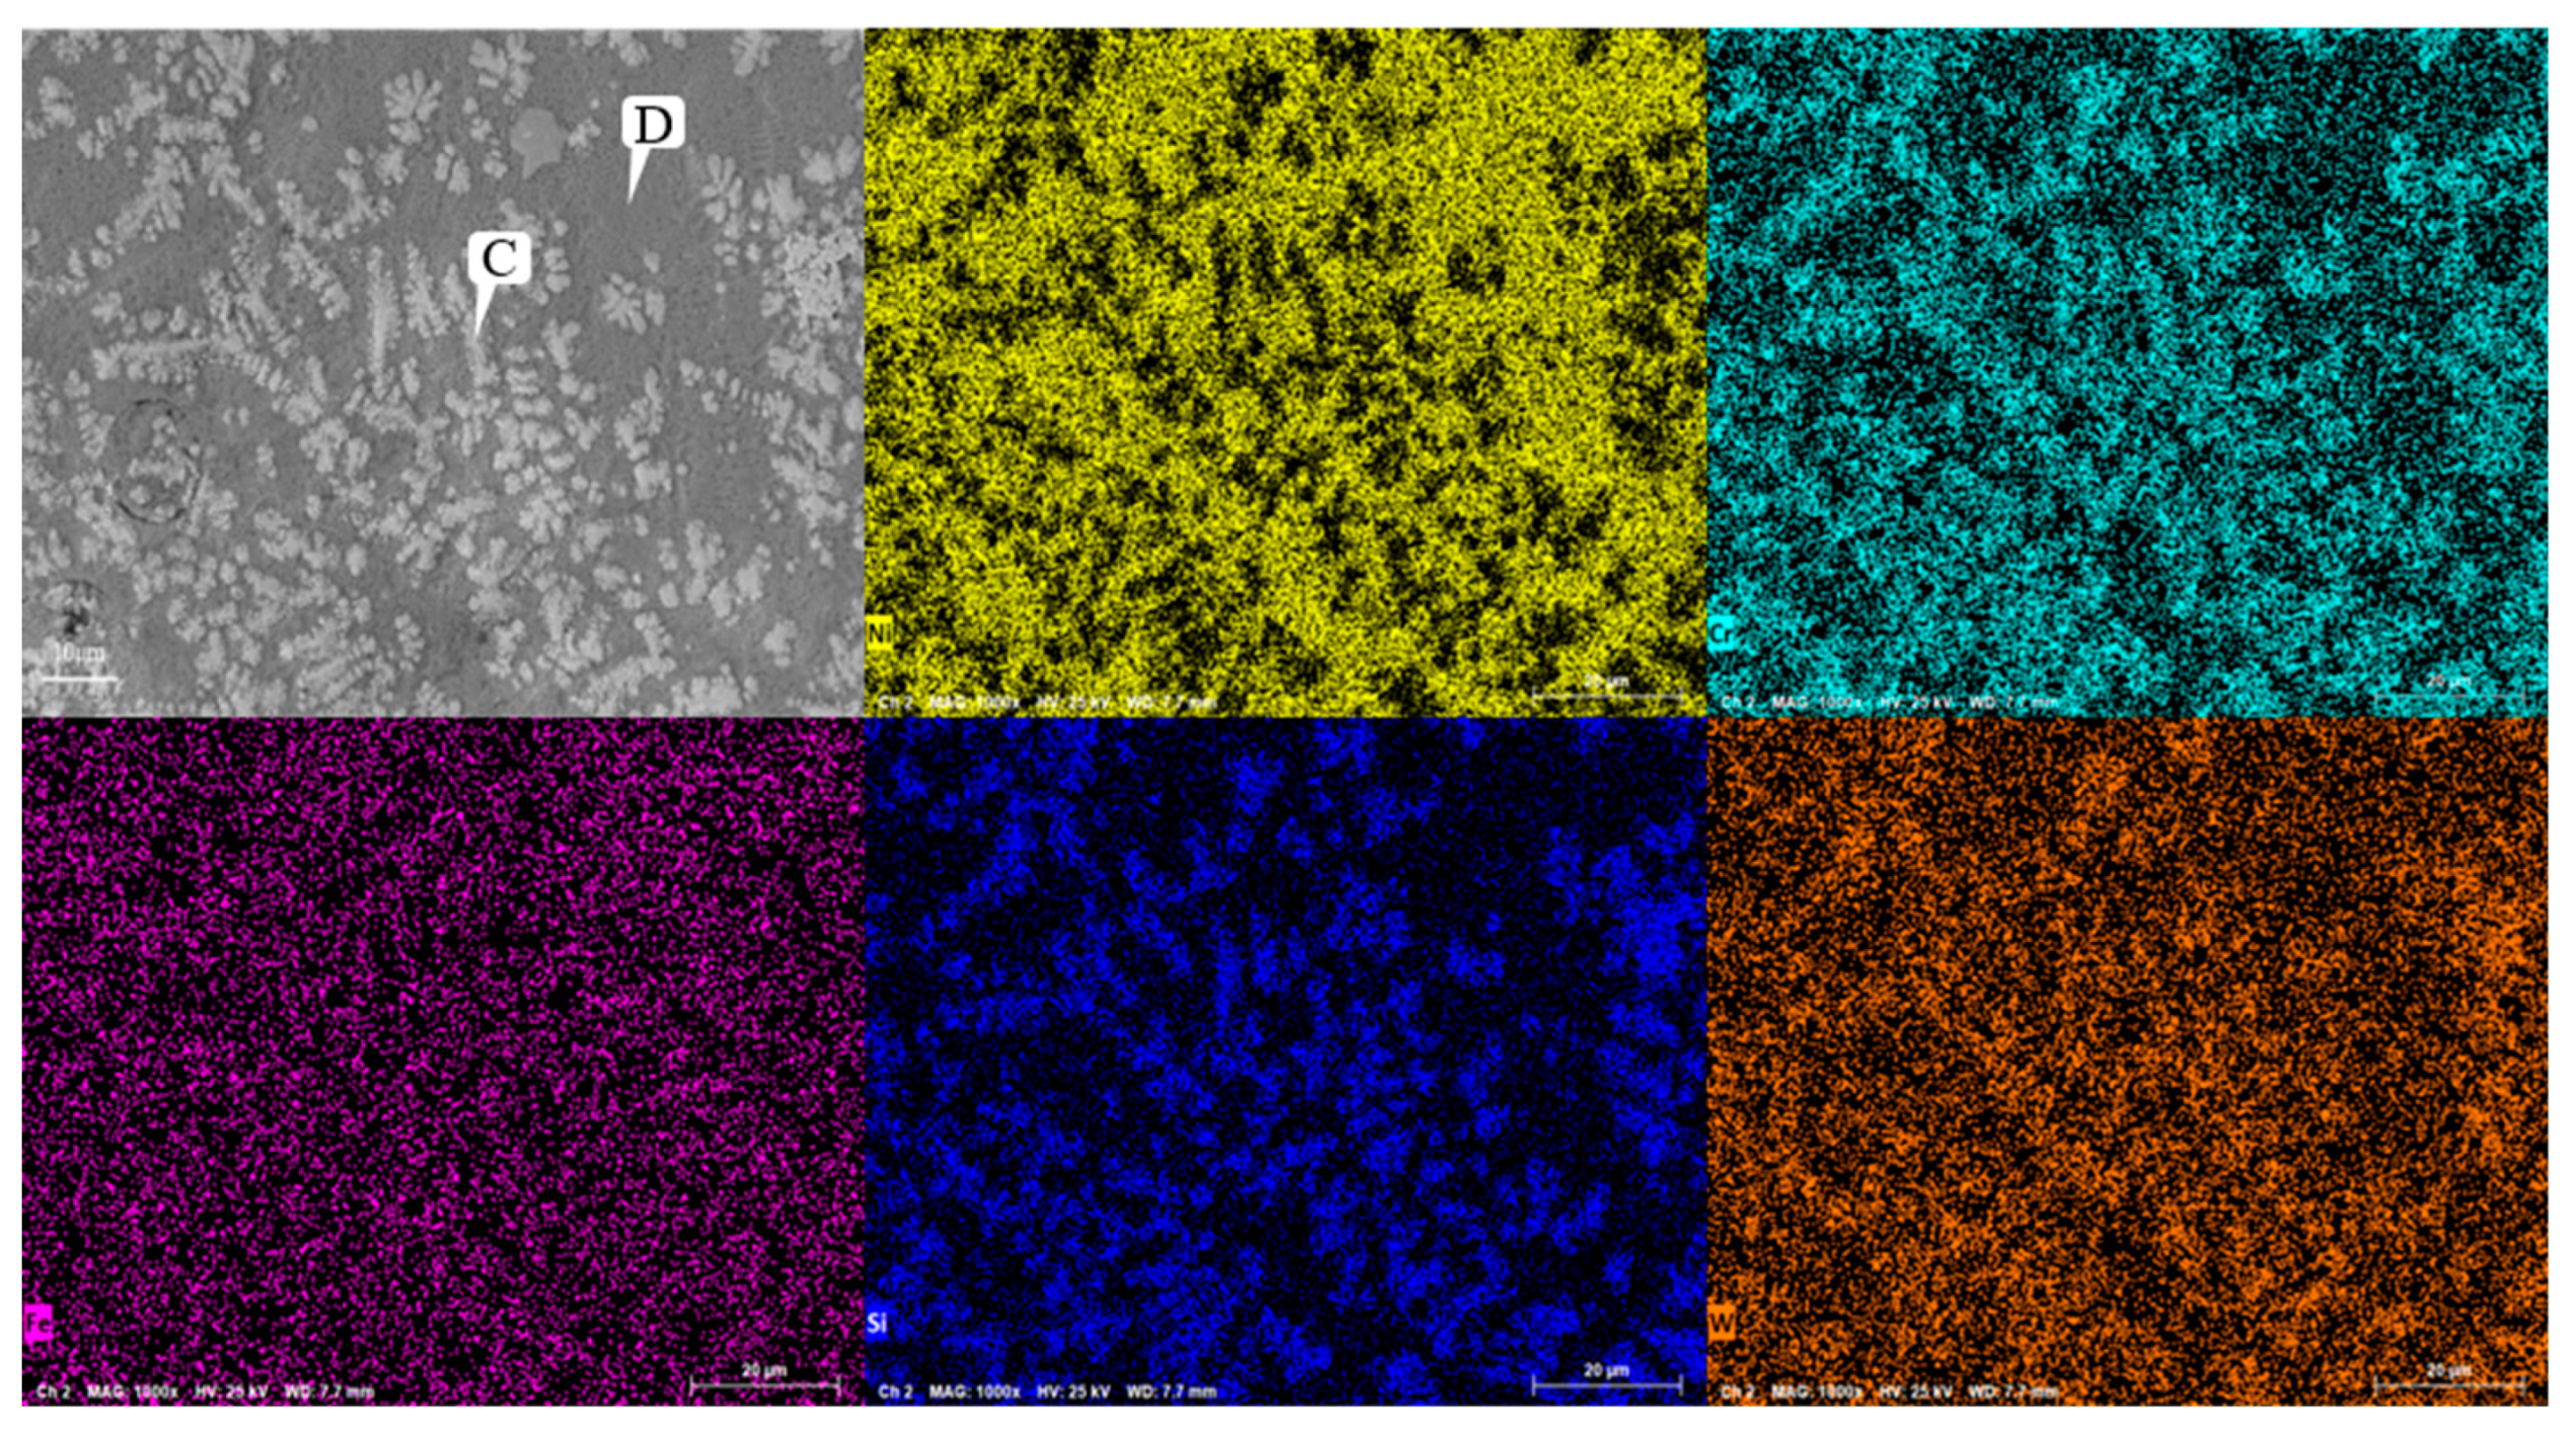
Figure 11.
Microhardness of coatings containing different mass fractions of graphene.
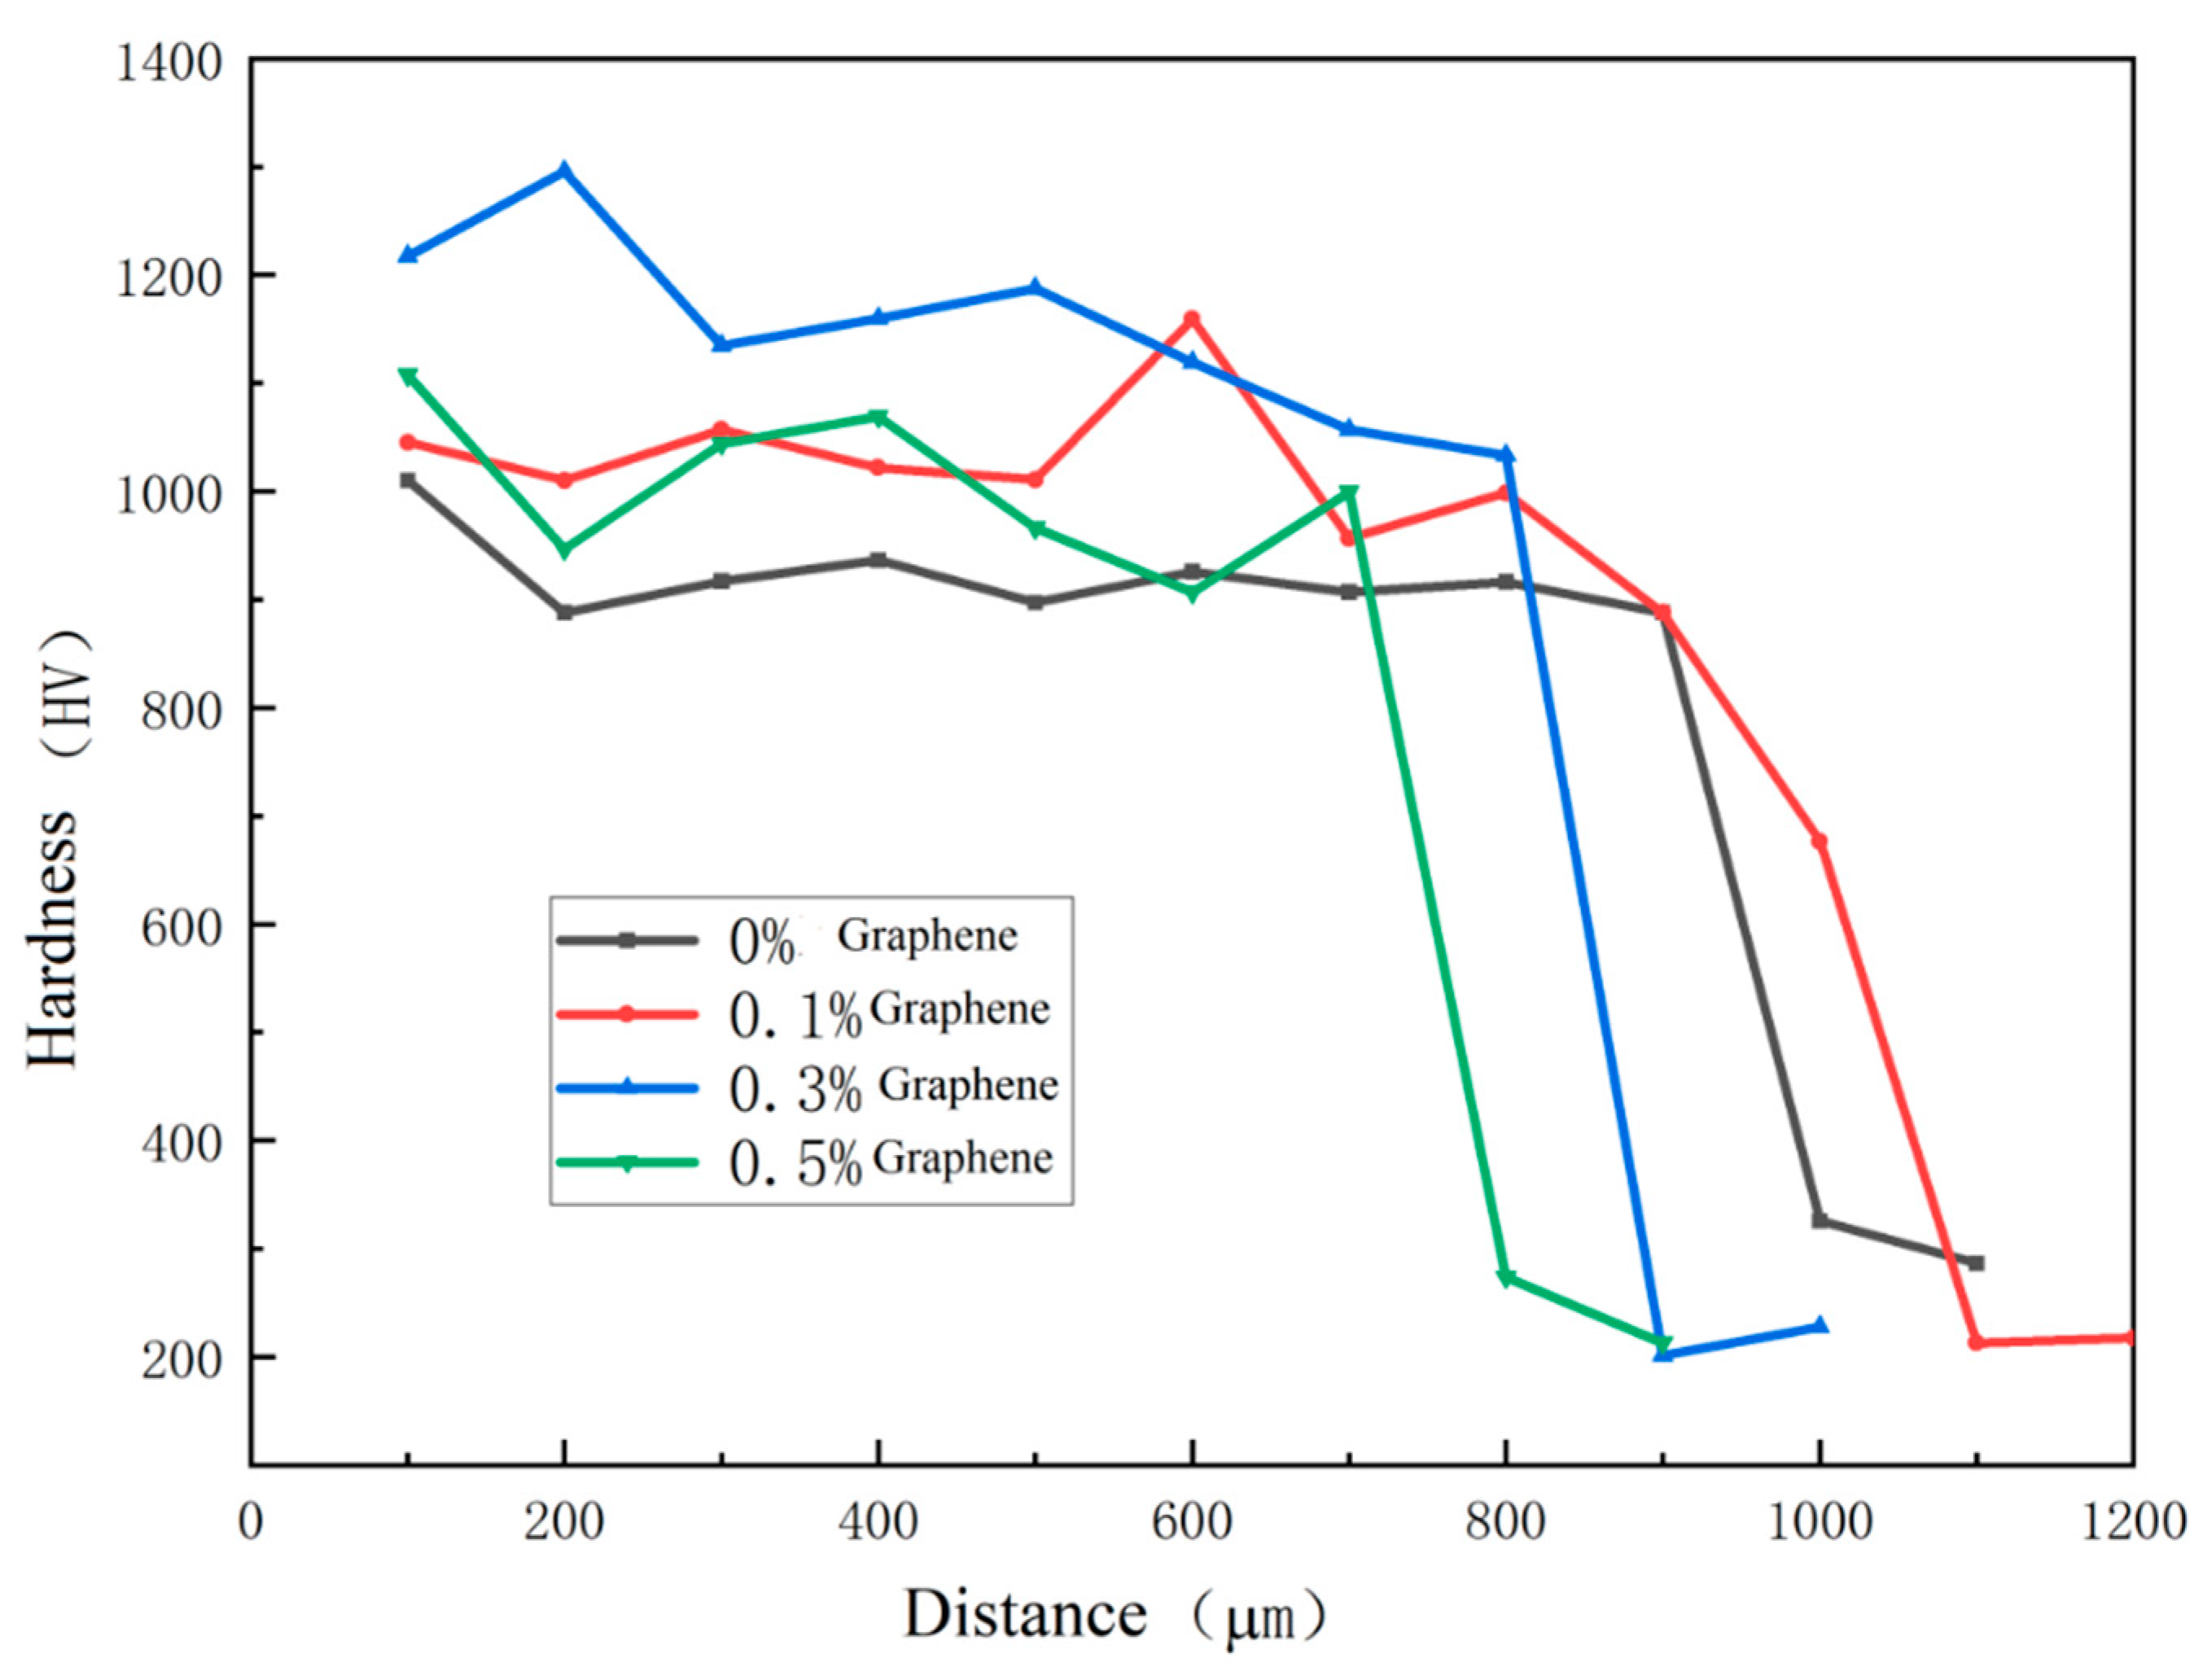
Figure 12.
Microstructure of tungsten carbide coatings based nickel with different graphene contents(a)0%;(b)0.1%;(c)0.3%;(d)0.5%.
Figure 12.
Microstructure of tungsten carbide coatings based nickel with different graphene contents(a)0%;(b)0.1%;(c)0.3%;(d)0.5%.
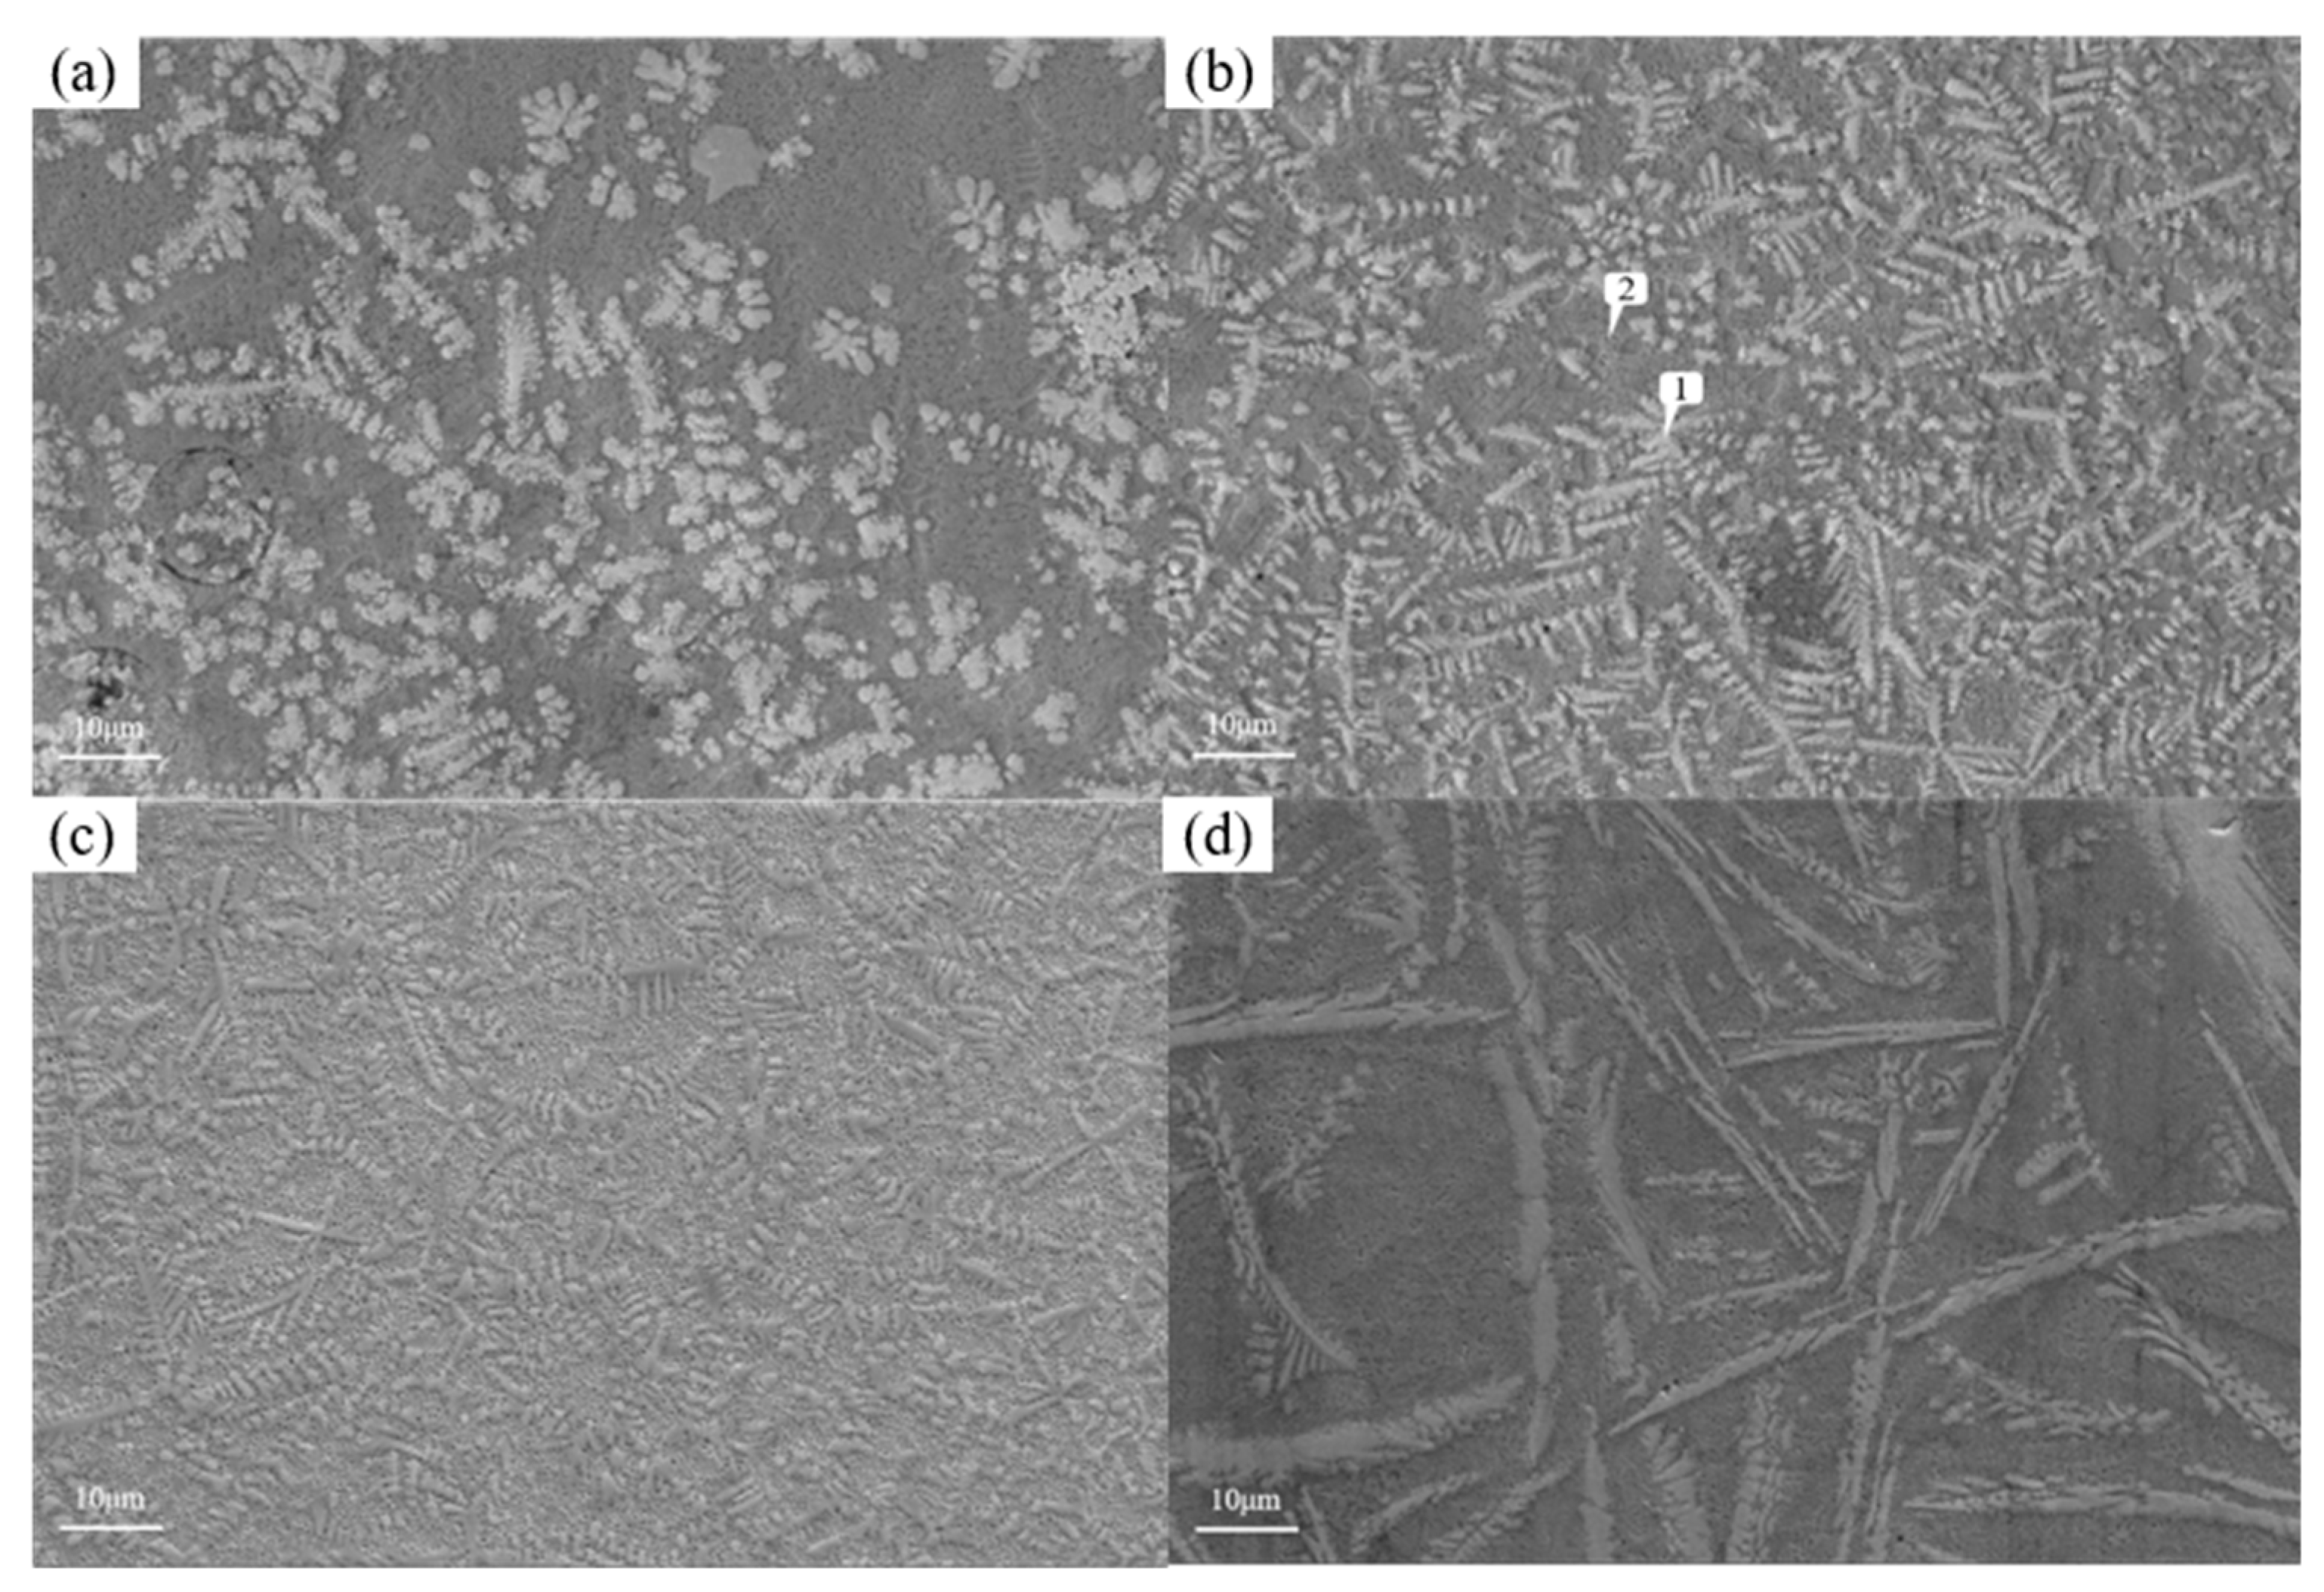
Figure 13.
Analysis of scanning composition of tungsten carbide coating based nickel containing 0.1% graphene.
Figure 13.
Analysis of scanning composition of tungsten carbide coating based nickel containing 0.1% graphene.
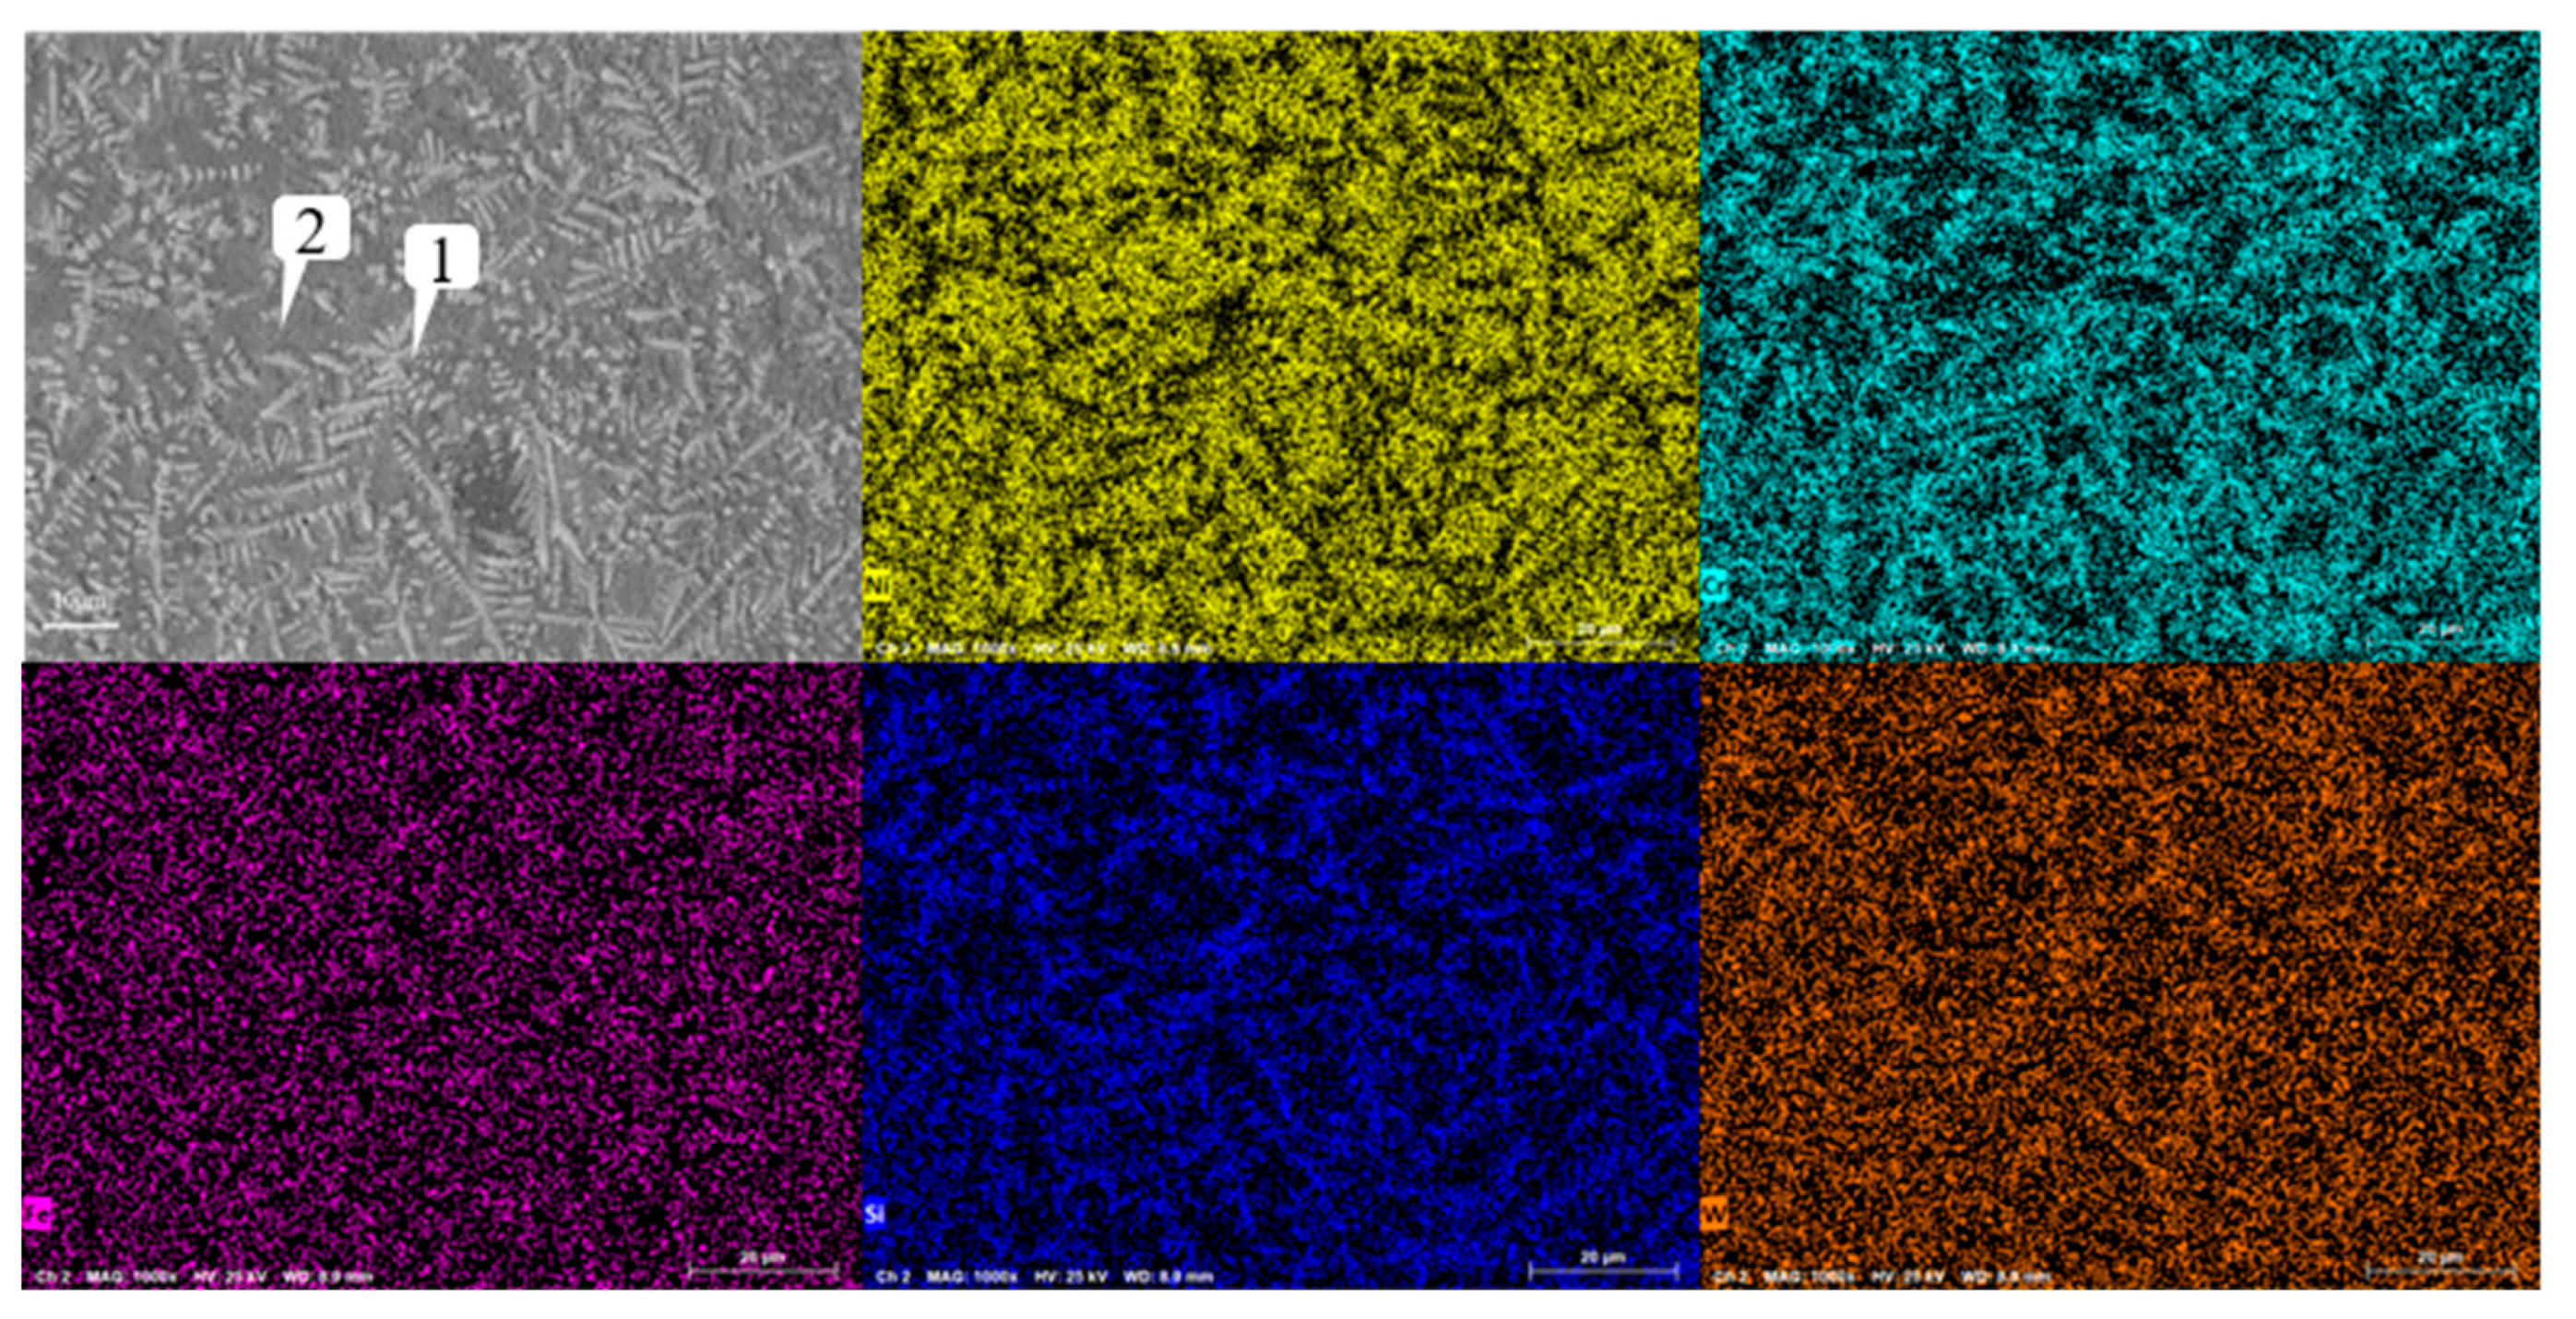
Figure 14.
Analysis of scanning composition of coating layer containing 0.3% graphene.
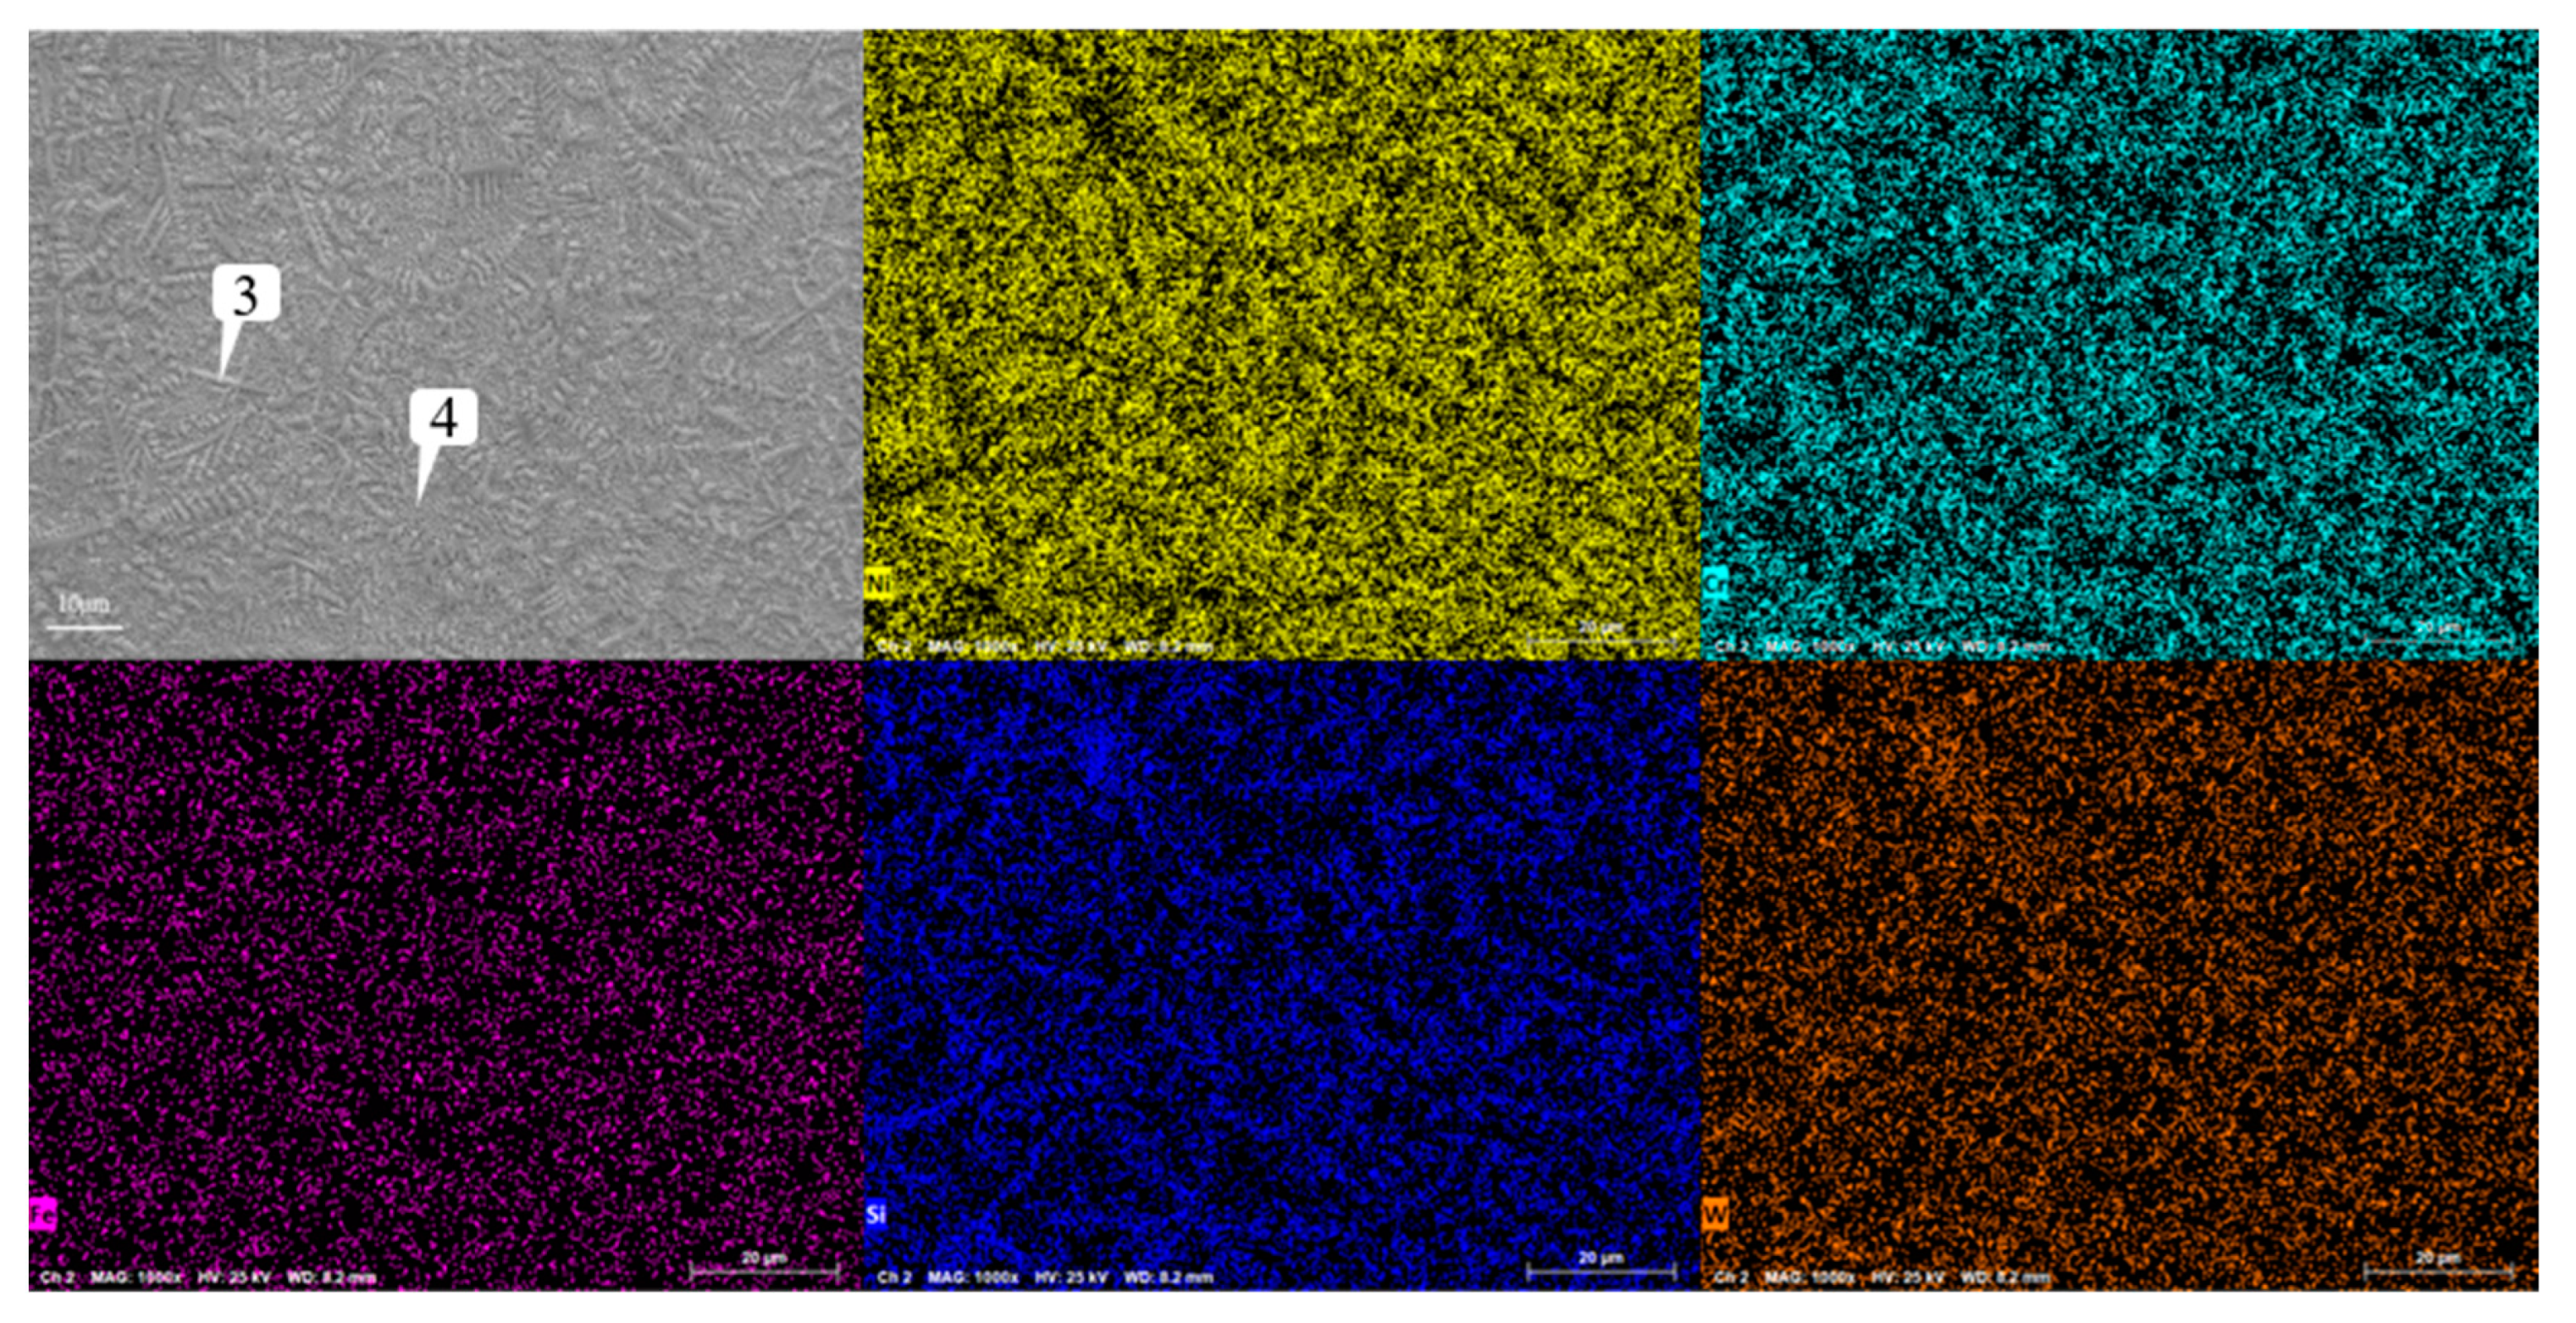
Figure 15.
Analysis of scanning composition of coating layer containing 0.5% graphene.
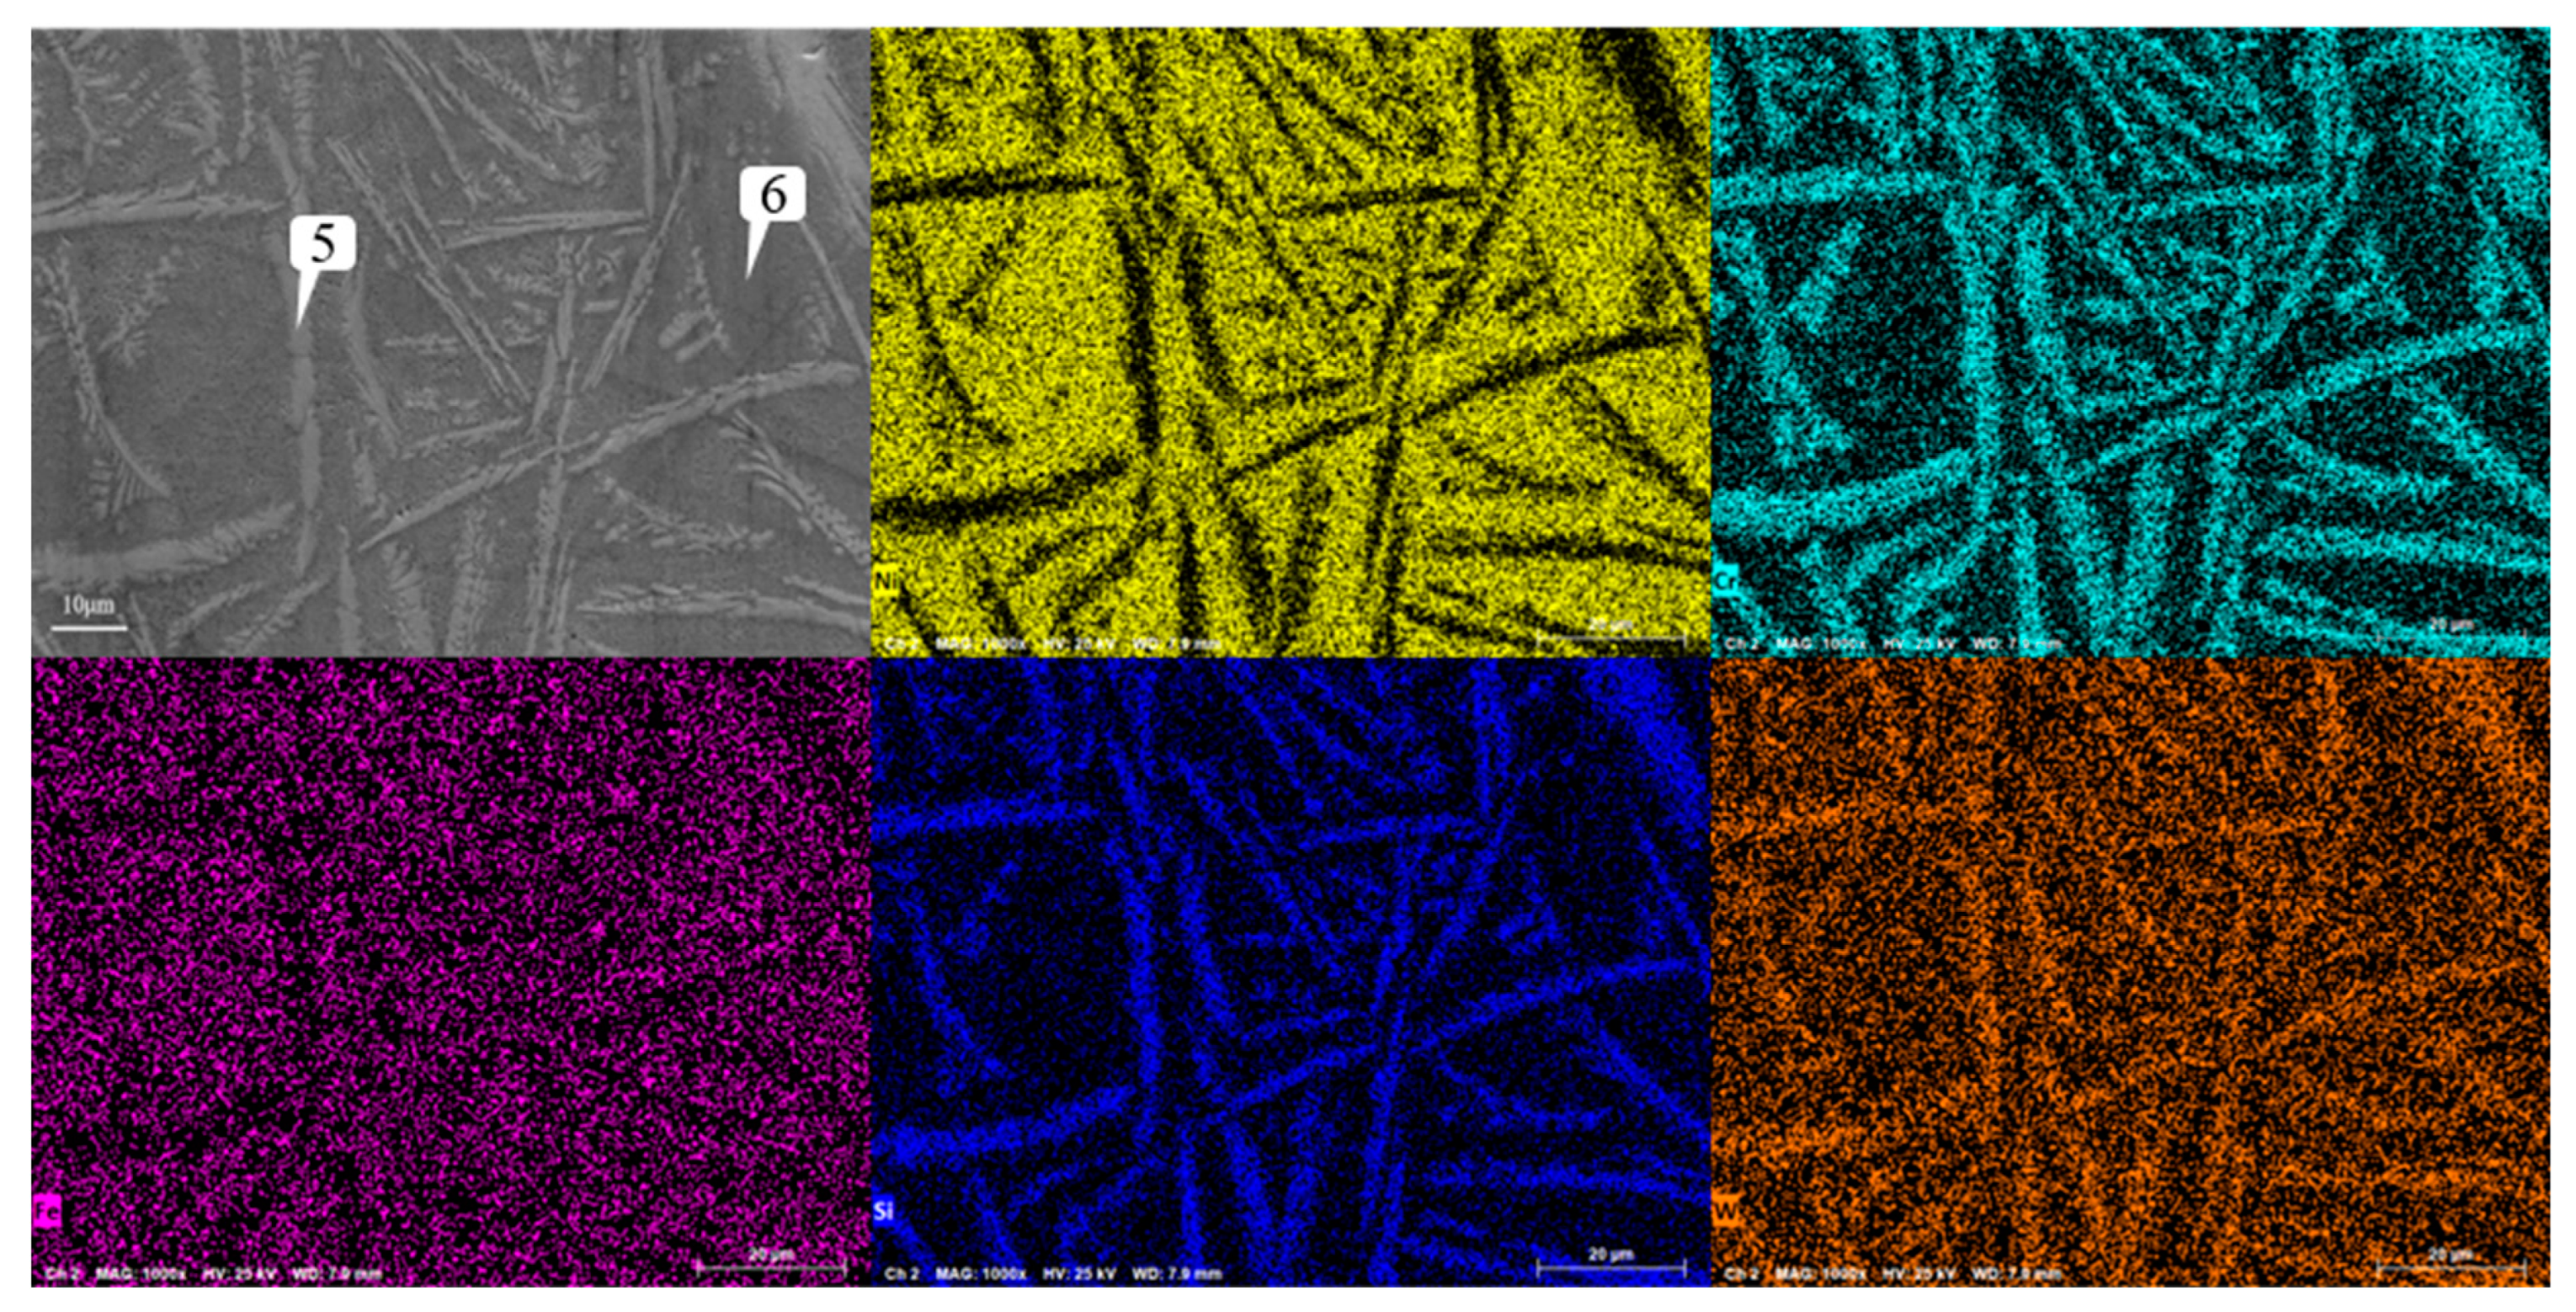
Figure 16.
X-ray diffraction patterns of WC/Ni60A composite coatings with different graphene contents.
Figure 16.
X-ray diffraction patterns of WC/Ni60A composite coatings with different graphene contents.
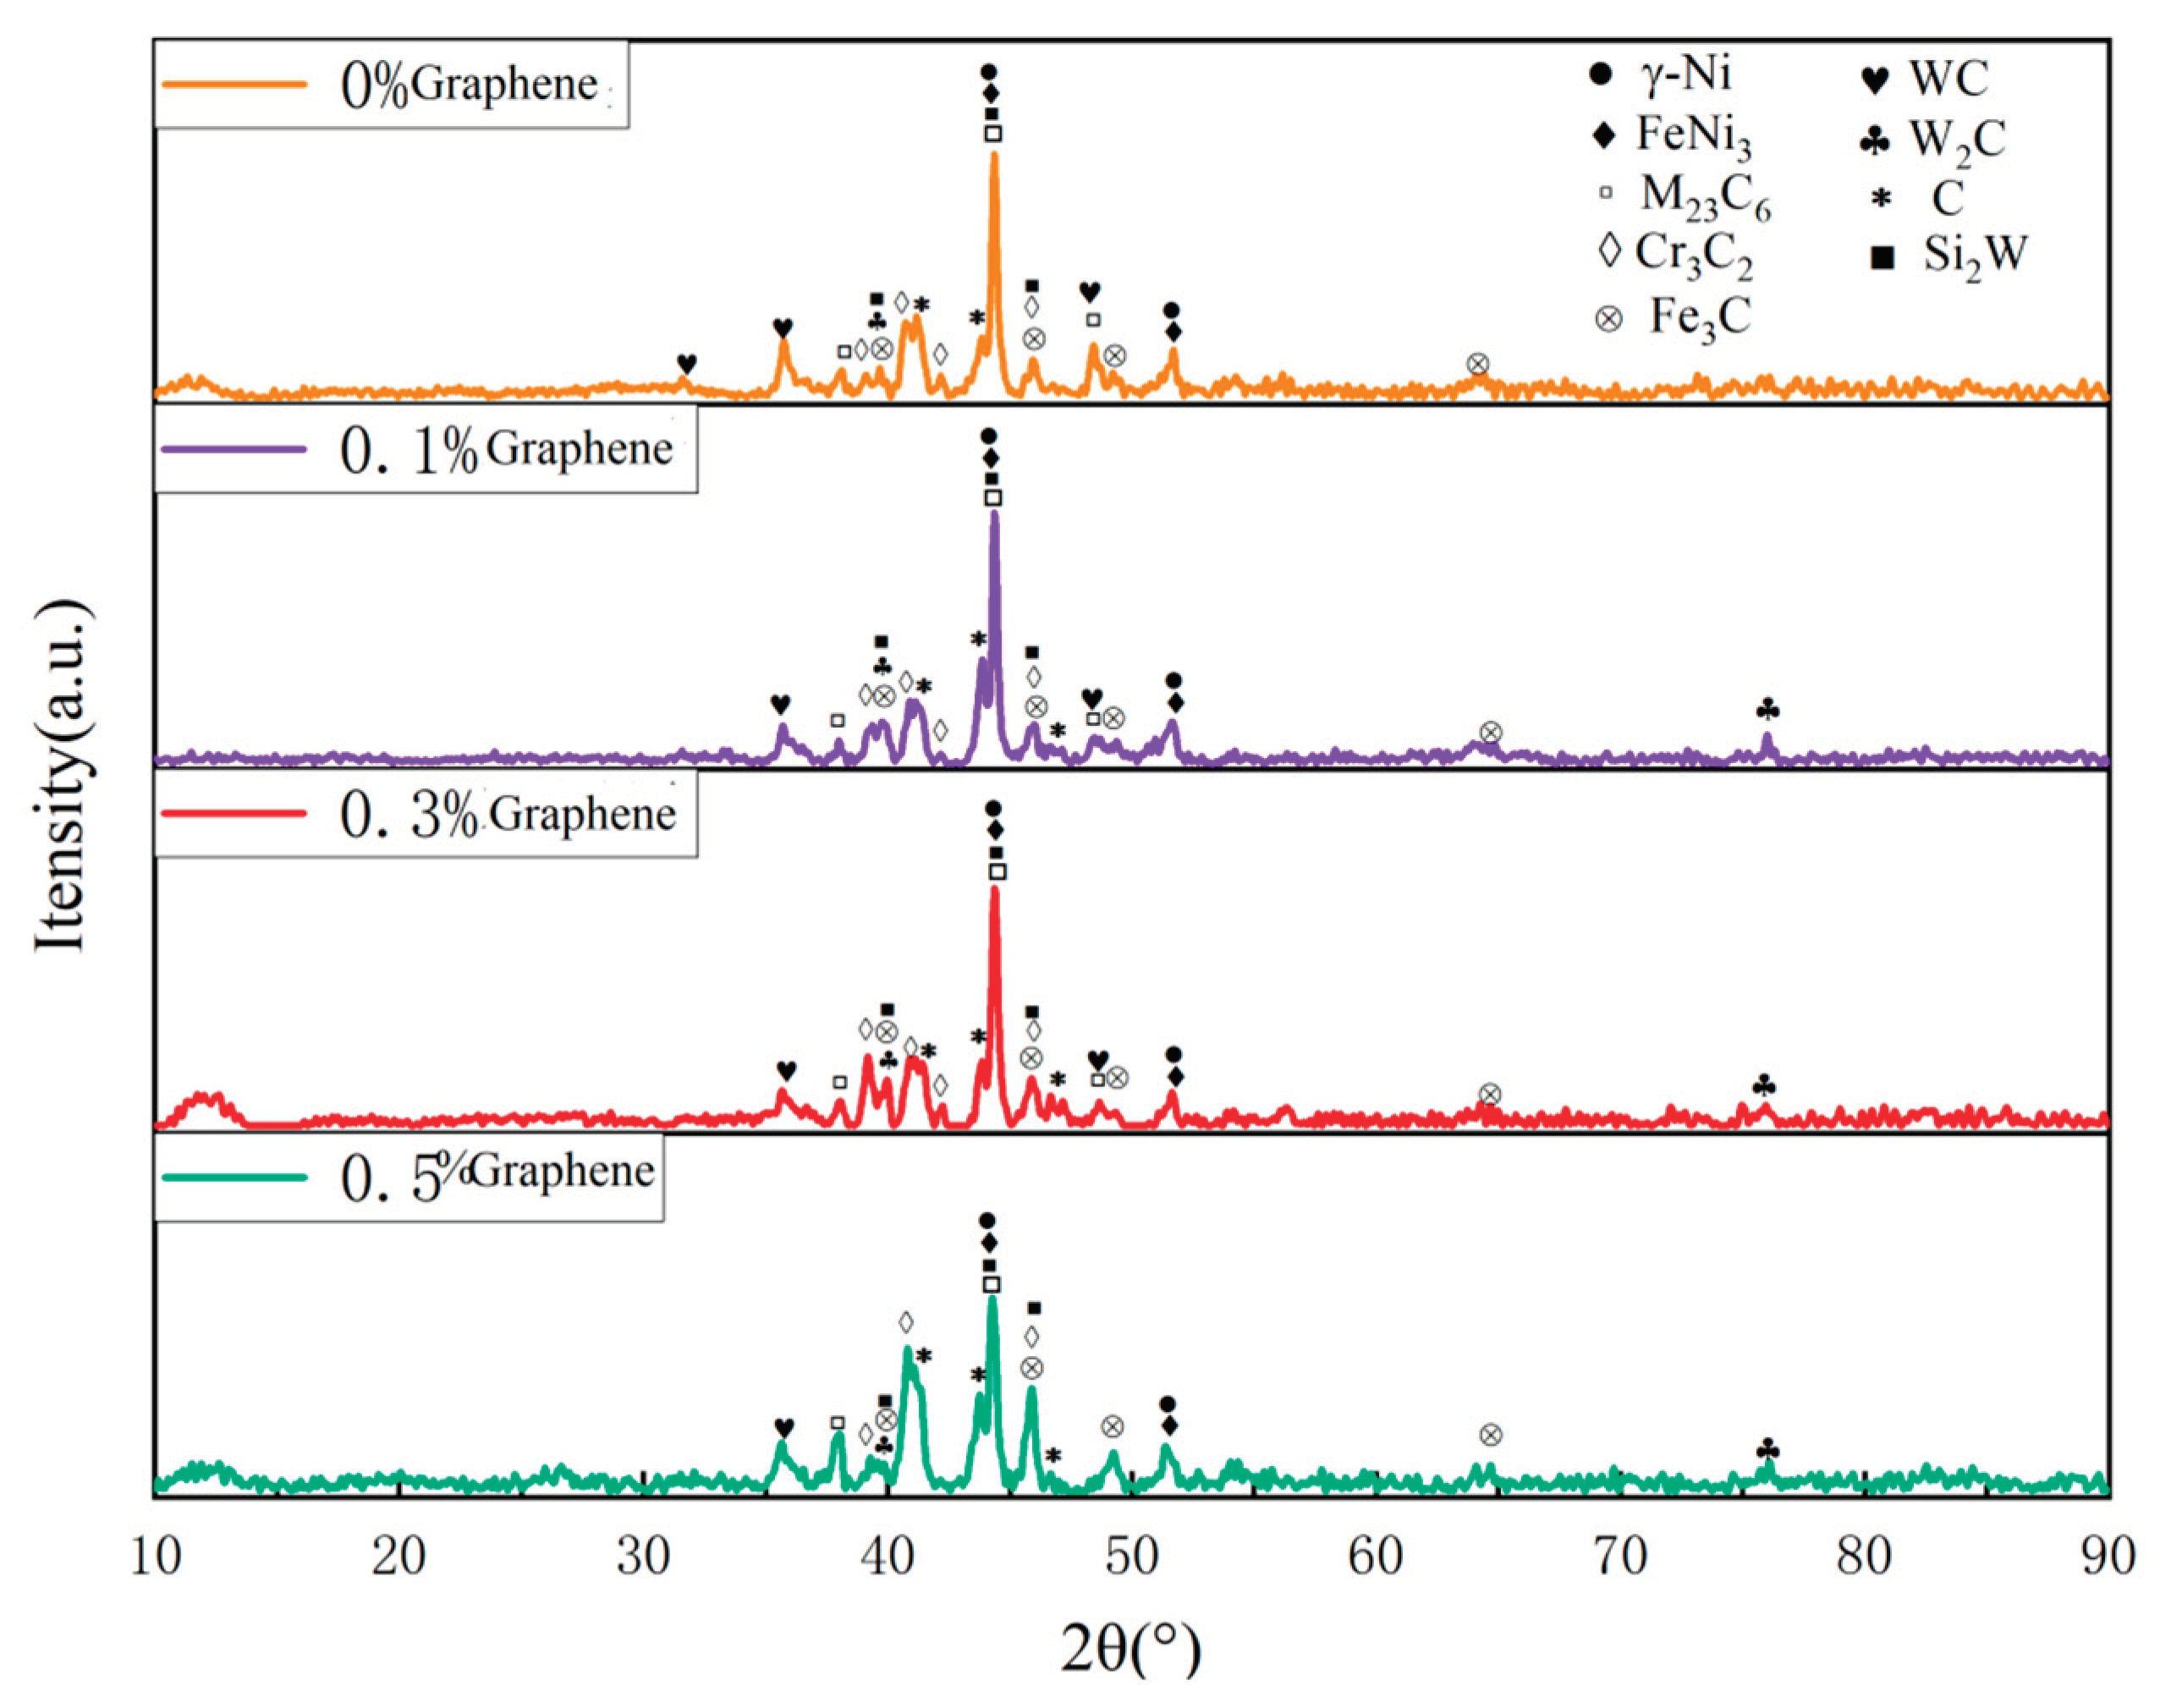

Table 1.
Q235 chemical composition table.
| Element | Fe | C | Si | Mn | Cr | Ni | Cu |
|---|---|---|---|---|---|---|---|
| Component(wt.%) | Bal. | 0.16 | 0.26 | 0.15 | 0.02 | 0.025 | 0.024 |
Table 2.
Chemical composition of Ni60A powder.
| Element | Ni | Cr | Fe | Si | B | C | O |
|---|---|---|---|---|---|---|---|
| Component(wt.%) | Bal. | 16.58 | 4.63 | 4.11 | 3.02 | 0.76 | 0.03 |
Table 3.
Pre-experimental parameters.
| Powder | Speed (m/min) |
light spot (mm) |
Over lapping ratio | Shielding gas (L/min) |
|---|---|---|---|---|
| Ni60A+30%WC +0.1% graphene |
0.35 | 4 | 50% | 15 |
Table 4.
Ni60A+30%WC+0.1% hardness results of graphene at different power levels.
| laser power(W) | 800 | 1200 | 1600 | 2000 |
| Average hardness(HV) | 1063.3 | 1086.2 | 732.6 | 526.8 |
Table 5.
Hardness of coatings with different tungsten carbide contents.
| WC content(wt.%) | 0% | 10% | 20% | 30% | 40% | 50% | 60% |
| Average hardness(HV) | 753.3 | 853.3 | 998.5 | 1000.3 | 1019.2 | 1022.1 | 1075.9 |
| Standard deviation | 78.3 | 58.2 | 70.5 | 72.3 | 112.6 | 79.6 | 52.0 |
Table 6.
Microstructure and composition of laser cladding Ni60A coating at different positions (mass fraction, %).
Table 6.
Microstructure and composition of laser cladding Ni60A coating at different positions (mass fraction, %).
| Position | Ni | Cr | Fe | Si |
|---|---|---|---|---|
| A | 55.19 | 35.70 | 4.89 | 4.22 |
| B | 82.12 | 8.73 | 5.11 | 4.04 |
Table 7.
Microstructure and composition of laser cladding Ni60A+20% WC coating at different positions (mass fraction, %).
Table 7.
Microstructure and composition of laser cladding Ni60A+20% WC coating at different positions (mass fraction, %).
| Position | Ni | Cr | Fe | Si | W |
|---|---|---|---|---|---|
| C | 22.11 | 28.56 | 3.50 | 7.07 | 38.76 |
| D | 70.95 | 7.36 | 4.53 | 2.74 | 14.42 |
Table 8.
Microstructure and composition of laser cladding Ni60A+60% WC coating at different positions (mass fraction, %).
Table 8.
Microstructure and composition of laser cladding Ni60A+60% WC coating at different positions (mass fraction, %).
| Position | Ni | Cr | Fe | Si | W |
|---|---|---|---|---|---|
| E | 3.99 | 2.47 | 1.78 | 10.94 | 80.82 |
| F | 7.64 | 11.19 | 2.03 | 6.69 | 72.45 |
| G | 56.99 | 7.47 | 2.49 | 0.73 | 37.27 |
Table 9.
Average hardness of laser cladding layers with different graphene contents.
| Graphene content(wt.%) | 0% | 0.1% | 0.3% | 0.5% |
| Average hardness | 998.5 | 1021.7 | 1076.9 | 1036.1 |
| Standard deviation | 70.5 | 48.8 | 50.2 | 59.4 |
Table 10.
Composition of coating with 0.1% graphene at different positions (mass fraction, %).
| Position | Ni | Cr | Fe | Si | W |
| 1 | 30.15 | 26.64 | 3.65 | 5.89 | 33.67 |
| 2 | 63.19 | 13.24 | 4.36 | 2.86 | 16.35 |
Table 11.
Composition of coating with 0.3% graphene at different positions (mass fraction, %).
| Position. | Ni | Cr | Fe | Si | W |
|---|---|---|---|---|---|
| 3 | 40.26 | 23.92 | 4.02 | 4.17 | 27.63 |
| 4 | 63.84 | 10.31 | 3.98 | 3.65 | 18.22 |
Table 12.
Composition of coating with 0.5% graphene at different positions (mass fraction, %).
| Position | Ni | Cr | Fe | Si | W |
|---|---|---|---|---|---|
| 5 | 8.33 | 32.08 | 1.95 | 9.32 | 48.32 |
| 6 | 85.48 | 3.20 | 5.95 | 0.55 | 4.82 |
Disclaimer/Publisher’s Note: The statements, opinions and data contained in all publications are solely those of the individual author(s) and contributor(s) and not of MDPI and/or the editor(s). MDPI and/or the editor(s) disclaim responsibility for any injury to people or property resulting from any ideas, methods, instructions or products referred to in the content. |
© 2024 by the authors. Licensee MDPI, Basel, Switzerland. This article is an open access article distributed under the terms and conditions of the Creative Commons Attribution (CC BY) license (http://creativecommons.org/licenses/by/4.0/).
Copyright: This open access article is published under a Creative Commons CC BY 4.0 license, which permit the free download, distribution, and reuse, provided that the author and preprint are cited in any reuse.


