
Submitted:
01 March 2024
Posted:
04 March 2024
You are already at the latest version
Abstract
Abstract: Patient blood samples are invaluable in clinical omics databases, yet current methodologies often fail to fully uncover the molecular mechanisms driving patient pathology. While Genome-scale Metabolic Models (GEMs) show promise in systems medicine by integrating various omics data, having only exometabolomic data remains a limiting factor. To address this gap, we introduce a comprehensive pipeline integrating GEMs with patient plasma metabolome. This pipeline constructs case-specific GEMs using literature-based and patient-specific metabolomic data. Novel computational methods, including adaptive sampling and an in-house developed algorithm for the rational exploration of the sampled space of solutions, enhance integration accuracy while improving computational performance. Model characterization involves task analysis in combination with clustering methods to identify critical cellular functions. The new pipeline was applied to a cohort of trauma patients to investigates shock-induced endotheliopathy using patient plasma metabolome data. By analyzing endothelial cell metabolism comprehensively, the pipeline identified critical substrates and contributed to the development of targeted therapeutic strategies. Our study demonstrates the efficacy of integrating patient plasma metabolome data into computational models to analyze endothelial cell metabolism in disease contexts. This approach offers a deeper understanding of metabolic dysregulations and provides insights into diseases with metabolic components and potential treatments.
Keywords:
Metabolic Network Analysis
; Genome-Scale Metabolic Models
; Exo-Metabolomics Integration
; Sampling Algorithms
; Endothelial Cell Metabolism
1. Introduction
Genome-scale metabolic models (GEMs) have been widely used in systems medicine to unravel the behavior of metabolic pathways and their contributions to the development and progression of diseases [1,2]. These models provide a comprehensive representation of an organism's metabolic network, capturing the intricate interconnectedness of biochemical reactions and the flow of metabolites [3]. This systems biology tool plays a crucial role in the study of diseases with a strong metabolic component, such as diabetes and cancer, where dysregulated metabolic pathways are key contributors to pathogenesis [4]. GEMs serve as a robust platform for integrating multiple omics data, including genomics, proteomics, and metabolic-related data which allows researchers to gain a holistic view of the molecular changes and identify key metabolic alterations associated with a specific disease or patient [5].
Metabolic-related data, including metabolomics data, measurements of metabolite consumption/secretion rates or time-course data, can be integrated into GEMs facilitating the identification of metabolic biomarkers, prediction of metabolic fluxes, and exploration of potential therapeutic targets [6]. Furthermore, GEMs can simulate the effect of genetic or environmental perturbations on the metabolic network, providing a framework to investigate the underlying mechanisms of disease development and progression [7].
However, studying the metabolism of Endothelial cells (EC), which play a crucial role in many diseases, presents unique obstacles that hinders the effective utilization of these methodologies. Obtaining viable samples directly from the microvascular endothelium is challenging due to the tissue's complexity, the fragility of EC, the need to preserve the endothelial phenotype, and the lack of suitable techniques [8].
Consequently, researchers often rely on in vitro cell culture models, such as Human Lung Microvascular ECs (HMVEC-L), to gain insights into endothelial biology and disease mechanisms. However, culturing HMVEC-L cells in vitro results in alterations compared to their in vivo counterparts due to the absence of physiological cues, including specific oxygen tensions, shear stress, and cell-cell interactions [9]. The two-dimensional monolayer culture fails to replicate the essential three-dimensional architecture observed in vivo, impacting cell behavior, gene expression, and endothelial barrier function. In vitro cultures' nutrient and oxygen supply may not precisely match the in vivo environment, leading to metabolic differences and altered cellular responses. Moreover, the absence of immune cells and other cellular interactions in vitro hinders understanding of crucial physiological processes involving ECs, such as immune responses, inflammation, and coagulation [10,11].
Since ECs are the most abundant cell type in the vascular compartment and have a direct impact on plasma metabolome, analyzing plasma metabolome can help in the study of EC dysregulation and alterations in the context of pathogenesis [12].
To address the need for integrating patient plasma metabolome into computational models describing endothelial metabolism, we have developed computational pipeline for the construction of case/patient-specific GEM of endothelium by using patient-specific plasma metabolome data with a generic GEM of endothelium.
The first step in our pipeline involves reconstructing case-specific EC GEMs. We constrain the boundaries of the generic reconstruction of EC metabolism using literature-based data. This step ensures that the model reflects the specific metabolic capabilities described for ECs. Subsequently, we determine the baseline model through flux sampling, allowing us to explore the feasible metabolic states of the cell [13]. Next, we define the minimum and maximum uptake/secretion rates of exchange reactions based on a Rational Exploration of Space Of Solutions (RESOS) of their respective flux distributions [14]. By re-scaling the baseline GEM thresholds using case-specific relative metabolomics in combination with flux sampling [13], we construct case/patient-specific GEMs. These case-specific models provide a more accurate representation of the metabolic capabilities of the ECs under specific conditions [15].
Next, we investigate the cellular capabilities of the case-specific EC GEMs. This involves applying a task analysis of a set of manually curated metabolic tasks [16], which allows us to assess the cell's ability to perform specific metabolic functions and identify any aberrations or limitations in the case-specific models [17].
To facilitate the interpretation of the results and identify patterns within the data, we employ clustering analysis in combination with heat map representation [18]. This allows for the stratification of patients based on their metabolic profiles and helps uncover distinct subgroups or phenotypes within the cohort [18,19].
In our pipeline, we have integrated novel computational methods that enhance the accuracy of exometabolomics data integration. Moreover, our approach considers the variability observed in the control group, allowing for the construction of patient-specific GEMs. This inclusion of patient-specific information ensures a more realistic representation of the metabolic profiles and enhances the precision of our models.
To address computational challenges, we have implemented a novel sampling algorithm called Adaptive Directions Sampling on a Box (ADSB) [20]. This algorithm significantly reduces the computational time required for exploring the solution space, enabling faster analysis of the metabolic models.
Furthermore, we have developed and incorporated a novel algorithm for RESOS. This algorithm has proven to be effective in improving the characterization of GEMs by systematically exploring different parameter configurations and identifying optimal solutions. This enhances our understanding of the metabolic network and provides valuable insights into the system behavior.
As a proof of concept, we apply this method to a cohort of 95 trauma patients, previously clustered into four groups (metabo-groups) based on their metabolic profiles in blood samples, which correlate with increasing mortality rates [17]. Trauma represents one of the leading causes of death globally, with significant morbidity and mortality rates [21]. Our previous research has linked poor prognosis in trauma patients to EC membrane damage caused by the over-activation of the sympathetic system, resulting in a condition known as shock-induced endotheliopathy (SHINE) [22]. SHINE leads to increased extravasation, tissue pressure, microvascular thrombus formation, impaired oxygen delivery, multiple organ failure (MOF), and ultimately, death [23].
By integrating patient plasma metabolome data into the EC-GEM, we aim to gain a deeper understanding of the metabolic alterations associated with SHINE and identify potential therapeutic interventions. Our comprehensive pipeline, encompassing case-specific GEM, task analysis, and results visualization, allows us to explore the intricate metabolic network of ECs in the context of the disease.
The presented pipeline offers a novel computational method to analyze patient plasma metabolome and investigate EC metabolism. By uncovering metabolic dysregulations and identifying critical substrates, this approach holds promise for improving our understanding of diseases with a metabolic component and developing targeted therapeutic strategies to mitigate their effects.
2. Results
2.1. Assessing RESOS Algorithm: Continuous vs. Discrete Approach
The in-house developed RESOS algorithm allows for a discrete or continuous approach (see Methods). The discrete method is faster, since it depends on the number of reactions in the model rather than the number of valid solutions. However, the binning of values in histograms reduces the resolution and similar solutions may have identical Euclidean distance value.
These two approaches were compared using two models, E. coli [24] and CHO [25], to determine the most appropriate strategy to explore the space of feasible flux solutions of a Flux Balance Analysis (FBA). The models were sampled with fix step lengths up to a total of 16000 points. Next, the Euclidean distances [26] between the “furthest” and “central” solution was computed as a function of the number of points sampled (Figure 1a). In both cases, the discrete method shows inconsistency between the number of sampling points and the distance between the central and furthest solutions. On the other hand, the continuous method eventually reaches a stable state, meaning that, no matter how many points are sampled, the distance between the furthest and central solution will not tend to vary significantly after a determined number of points. This behavior can be attributed to the dynamic percentile as it ensures that no outliers are considered.
In conclusion, despite the discrete method has shown to be faster, the continuous method is more accurate and reliable.
2.2. Assessing RESOS Algorithm: Dynamic Threshold and Determining the Optimal Number of Sampling Points
The standard approach to mitigate the effect of extreme solutions is to establish a threshold that defines a limit between the sampled solutions that will be considered for the analysis and those that will be rejected. For example, one might reject the first and last quartile of a population of solutions for a given reaction and only retain the central solutions corresponding to the second and third quartiles are considered [19]. In our case, one logical solution would be to establish a fixed percentile for every sampling, for example, eliminate those reactions whose total Euclidean distance value is above the percentile 90. However, this does not guarantee that the solutions recovered are, indeed, those belonging to the densest space of solutions. Instead of using an arbitrary threshold, the RESOS algorithm implements a dynamic non-arbitrary percentile method to identify the set of relevant solutions.
The dynamic non-arbitrary percentile method was applied on different models to determine the threshold for relevant solutions for each model. The assessed GEMs E. coli (iJO1366) [24], CHO (iCHO1766) [27], Human (Recon1) [28] and CHO (iCHO2101) [25] represent different organisms with different model size and different levels of complexity. This heterogeneity in the models allows us to evaluate the robustness of the approach to changing conditions.
We found the optimal thresholds for E. coli, CHO (iCHO1766 and iCHO2101 ) and Human GEMs to be the 38th, 47th, 45th and 50th percentiles, respectively. The algorithm discards solutions above these thresholds as outliers.
The algorithm determines the optimal distance between the central and farthest solutions, along with the number of solutions in between, to establish a threshold (percentile). These values can subsequently streamline computational analyses of the same network (e.g., simulating knock-outs), as they are fewer and more precise than arbitrary thresholds.
2.3. Assessing the Improvement of the Model’s Predictive Capabilities by Applying RESOS Algorithm
The RESOS algorithm aims to refine metabolic system characterization by pinpointing the densest region within the feasible flux solutions space of a GEM, thereby influencing model's predictive capabilities. We assess how RESOS compares to the ROOM method, commonly used for metabolic flux prediction post-perturbation, such as gene or reaction knockouts [29]. Both algorithms were applied to predict gene essentiality and synthetic lethality in E. coli K12 using the iJO1366 GEM, with results compared to experimental data from the literature [30,31,32].
Synthetic lethality describes an interaction where two separate events, individually harmless to cell viability, together cause cell death. This phenomenon is studied to understand metabolic network interactions and potential drug targets, particularly in diseases like cancer [33].
To enhance analysis performance, ROOM and RESOS were integrated into the ParallelSL algorithm, a parallelized version of FastSL that employs FBA to predict essential reactions, pairs (synthetic lethals), and triplets [15]. A systematic comparison between ROOM and RESOS methods was conducted using the E. coli iJO1366 GEM (refer to Methods section). The model's original boundaries remained unaltered, except for adjusting the lower bounds of oxygen and glucose exchange reactions to match experimental data [24]. Exchange reactions and the objective function (biomass) were excluded from analysis. Lethality threshold was set at 5% of the optimal biomass value.
To validate the predictions, essential genes and synthetic lethals for the E. coli K12 strain were obtained from literature [30,31,32]. Genes were mapped to associated reactions using the findRxnsFromGenes() function in the Matlab COBRA Toolbox [34]. Since this function retrieves all reactions involving a gene, the resulting list required further filtering based on logical relations between genes, using the following criteria:
If gene1 encodes reaction1:
if gene1∈essential genes → reaction1∈essential reactions
If gene1 or gene2 encode reaction1:
if gene1 and gene2 ∈ essential genes → reaction1∈essential reactions
If gene1 and gene2 encode reaction1:
if gene1 or gene2 ∈ essential genes → reaction1∈essential reactions
A similar approach was used for synthetic lethals (SLs), where reactions were identified for each gene in a set. These reactions were then combined into pairs to obtain the final set of SLs.
Finally, the reaction set and their combinations corresponding to experimentally measured essential reactions and synthetic lethals, respectively, were compared against the predicted ones (Figure 2). The reaction set comprised a total of 2583 reactions, encompassing all reactions contained in the model. For synthetic lethals, the total considered was 17,159 combinations of the reaction set.
The prediction ratio was calculated using equation 1
where TP, TN, FP and FN are respectively “true positive”, “true negative”, “false positive” and “false negative”. The analysis demonstrated that implementing the RESOS algorithm enhanced ER identification performance by reducing the error by 8.21%. Moreover, the utilization of the RESOS algorithm significantly bolstered predictive capabilities, reducing the error in synthetic lethal predictions by 57.22%. Complete contingency tables are provided in Supplementary Material 1.
2.4. Assessing Sampling Algorithm Performance
Sampling feasible flux solutions in GEMs is essential for understanding system metabolism. However, the time required for this task grows exponentially with model size or when conducting a systematic analysis with numerous simulations, posing a significant computational challenge. To mitigate this issue, the presented pipeline incorporates the ADSB algorithm, aimed at drastically reducing computational time [20]. The performance of ADSB was assessed through a comparative analysis with the gpSampler algorithm, a well-established and widely used method implemented in Matlab [17]. Both, ADBS and gpSampler algorithms were applied on two GEMs: the E. coli GEM EcoliCore [35] and the EC GEM iEC3006 [19]. These GEMs represent two different organisms with metabolic networks of different sizes and complexity offering a broader overview of the capabilities of both sampling algorithms. The E. coli model accounts with 95 reactions and 72 metabolites while the EC model accounts with 3006 reactions and 2114 metabolites.
The computational time required for a specific process can be influenced by various external factors, which poses challenges when comparing simulations. To evaluate this, we compared the time taken to load the COBRA toolbox before each simulation, revealing nearly identical durations using the same machine. This observation indicates that the computational times for each calculation are indeed comparable and do not significantly impact the overall trend and conclusions drawn from the analysis.
Here the number of sampling points was set to 10.000. The sampling time (in seconds) for the EcoliCore model was 45 and 72 for gpSampler and ADSB algorithms respectively, while for the iEC3006 model the sampling times were 8456 and 1056 also for gpSampler and ADSB.
The sampling time of the E. coli model was 14-fold lower (1056/72) than the EC model with the ADSB sampling algorithm, and it was 188-fold lower (8457/45) when using the gpSampler algorithm. This shows that the running time of gpSampler scaling is worse than ADSB when model complexity is increased (i.e. when analyzing a model with more reactions and metabolites).
When comparing the sampling time between algorithms applied to the same model, for the EC model the ADSB is 8 times faster (8457/1056) than the gpSampler, and for the E. coli model the gpSampler is 1.6 times faster (72/45) than the other sampling method. This suggests that the ADSB algorithm is best suited for complex models and that gpSampler performs best with simpler models. However, it is worth noting that the EcoliCore model is extremely small and simple compared to other GEMs. Considering this, while gpSampler has demonstrated being only 60% faster than ADSB, it's crucial to recognize that the majority of cases involve much larger GEMs. Consequently, the ADSB algorithm remains the preferred choice due to its efficiency, especially when dealing with larger models.
2.5. Applying the Protocol on the Trauma Patients Cohort
The protocol was implemented on a cohort of 95 trauma patients [19]. Initially, we constructed a baseline model for EC metabolism using the iEC3006 model [19]. This EC-specific model, derived from Recon 1, incorporated observed metabolic capabilities gathered from literature references and databases [19].
Activation of the biomass reaction was enforced by setting its lower boundary to 50% of the optimal value. Furthermore, the RESOS algorithm determined an optimal threshold, resulting in a 50% reduction in sampling for subsequent patient-specific models.
Subsequently, relative metabolomic data from each patient were integrated by normalizing measured blood sample concentrations against control group metabolomics data. To address control group heterogeneity, three ratios—minimum, mean, and maximum—were calculated for each patient. These ratios were used to reconstruct three GEMs per patient (minimum, mean, and maximum), and the RESOS and ADBS algorithms were employed to characterize each patient's metabolic flux profile.
The appropriateness of this approach was evaluated through PCA analysis of each patient's metabolic flux profile. Figure 3 illustrates distinct clustering of sampling points for patients number 24, 52 and 73 among models (minimum, mean and maximum), highlighting an improved description of each patient's EC metabolic capabilities through the integration of these three models. PCA for all patients' flux profiles can be found in supplementary material 2.
2.6. Identify Common Metabolic features in Trauma Patients Associated to Metabogroups with Different Mortality Rate
Once the patient-specific GEMs were characterized, we aimed to identify common metabolic features in trauma patients associated with metabo-groups exhibiting different mortality rates. The methodology utilized is outlined in detail below.
Drawing upon the characterized metabolic flux profiles of each patient, defined as the amalgamation of sampled solutions from the corresponding minimum, mean, and maximum models, we imposed these profiles as the metabolic boundaries of each patient-specific GEM. The patien-specific GEMs can be found in the Supplementary Material 3.
Following this, the metabolic capabilities of each patient were inferred by applying a task analysis on the individual patient-specific GEMs with the sampling-based imposed boundaries. The task analysis involved a meticulous evaluation of the relevance of 190 manually curated metabolic tasks [16] on each patient-specific GEM, in accordance with the methodology outlined in Henriksen et al [19]. The results were visually represented through a heatmaps with dendrograms, applying Euclidean distance and the complete cluster algorithm [36] (Figure 4).
The initial analysis failed to cluster patients into the four metabo-groups as described in Henriksen et al 2020 [17] (see Figure 4a). To gain deeper insights, we conducted the same clustering analysis on the same GEMs but now separated by metabo-groups and standardizing by row (See Figure 4b). This process internally standardizes the task activity values for each patient, positioning highly active tasks at the bottom of the heatmap and those with the lowest activity at the top. Next, we filtered metabolic tasks based on their consistent rank changes across metabogroups categorized by mortality rate (Groups A, B, C, and D), as outlined by Henriksen et al. (2020) [19], ensuring a minimum 10-position difference between Groups A and D.
As a result, 16 metabolic tasks were identified as relevant, exhibiting changes in activity that correlated with mortality rate across different metabogroups. The individual group clustering analysis revealed notable differences in the activity states of metabolic tasks, reminiscent of those described in Henriksen et al. 2023 [19]. For instance, an imbalance in ATP generation between glycolytic and oxidative phosphorylation pathways, as observed in the metabogroups outlined by Henriksen et al. 2023, was also evident in our analysis. Other relevant tasks that were identified were the synthesis of Cholesterol, Arginine, methiylglyoxal, alanine, Hydroxymethylglutaryl-CoA, mevalonate, glucuronate, cysteine, also synthesis of anthranilate, N-formylanthranilate, quinolinate from tryptophan and the degradation of methionine and homocysteine (Figure 4c).
To validate these findings, a new clustering analysis was performed, incorporating all patients but focusing solely on the 16 relevant metabolic tasks. This analysis revealed five clusters for columns (patients). Each cluster was then analyzed to determine the contribution of each metabo-group, with values ranging from 0 (no contribution) to 1 (full contribution) (Figure 4c).
Anomalies were observed in the first cluster, likely attributed to its small size. However, a clear trend emerged from Cluster 2 onwards: in Trauma group A, the abundance increased from 0 in Cluster 2 to 0.66 in Cluster 5. Similarly, Trauma group B exhibited an increase from 0.029 in Cluster 2 to 0.33 in Cluster 5. Group C displayed more oscillating behavior, likely due to its intermediate phenotype. Conversely, Group D, with the highest mortality rate, demonstrated a nearly identical trend but in the opposite direction to Group A (the group with the lowest mortality rate), decreasing from 0.68 in Cluster 2 to 0 in Cluster 5. Details of this analysis can be found in Supplementary Material 4.
3. Discussion
In this study, we undertook a comprehensive exploration of exo-metabolomics data integration and the development and implementation of novel algorithms that enhance the predictive capabilities of metabolic networks as well as improve the analysis performance in terms of computational time. More specifically, we have developed a novel algorithm to explore more efficiently the space of feasible flux solutions (RESOS) and have adapted and implemented the fast-sampling ADSB method. The pipeline development encompassed the use of exo-metabolomics and blibliomics from a number of sources as well as diverse models from a variety of organisms, including E. coli, Human and Chinese Ovarian Hamster, evaluating the impact of RESOS and ADSB application on the analysis performance and model’s predictive capabilities.
The RESOS algorithm enables two approaches: continuous and discrete. Both approaches were assesed, unveiling the superiority of the continuous method in terms of accuracy while the discrete approach required shorter computational time. This algorithm also enables to dynamically determine the optimal number of sampling points, RESOS showcased its ability to characterize the metabolic flux profile efficiently while reducing the number of required sampling points between 50 and 62% which implies an important decrease in the computational time which is specially crucial in studies where a large amount of simulations need to be done on the same GEM. Moreover, the algorithm integration significantly improved the predictive capabilities of the metabolic model, as evidenced by the comparison with the ROOM method in predicting gene essentiality and synthetic lethality in E. coli K12.
Our investigation also extended to the comparative analysis of two sampling algorithms:ADSB and gpSampler. Notably, ADSB showcased superior efficiency, particularly in complex models, it resulted in a significant 8.5-fold reduction in computational time, providing a substantial improvement in the overall efficiency of the metabolic network analysis. In addition, when considered in tandem with RESOS, which independently reduces computational time by 50-62%, the cumulative reduction in computational can be between 17 and 22.4-fold which is a substantial time reduction. This enhancement in simulation performance is particularly significant, especially considering the trend of GEMs expanding in size to accommodate the growing wealth of metabolic knowledge [37].
In systems medicine, understanding ECs is crucial due to their central role in physiological processes and their implication in numerous diseases. The dynamic nature of EC metabolism poses a challenge in comprehensively characterizing their functions. This complexity arises from their heterogeneity, responsiveness to environmental cues, and involvement in processes like angiogenesis, inflammation, and tissue repair [22].
ECs are relevant in systems medicine, particularly in maintaining vascular homeostasis and contributing to diseases such as cardiovascular disorders, inflammatory conditions, and cancer. Dysregulation of endothelial metabolism is linked to endothelial dysfunction, a hallmark of various diseases. Therefore, unraveling EC metabolism is imperative for understanding disease mechanisms, identifying therapeutic targets, and advancing personalized medicine [10,11,12]. Exploring endothelial metabolism presents significant challenges. Obtaining viable samples from microvascular endothelium remains difficult due to tissue complexity, cell fragility, and the need to maintain the endothelial phenotype in vitro. Additionally, the scarcity of suitable techniques can lead to deviations from in vivo conditions [8].
Our novel computational pipeline addresses these challenges. Implemented on a trauma patient cohort, it integrates metabolomics data with RESOS and ABSD sampling algorithms [20], providing a nuanced understanding of patients' EC metabolic capabilities. This application on trauma patients demonstrates the pipeline's utility in a clinical context, elucidating metabolic alterations associated with critical conditions.
We successfully applied the pipeline to integrate metabolic measurements from patient blood samples, generating patient-specific GEMs to elucidate metabolic processes underlying different metabolic groups with significant differences in mortality rate.
The integration of exometabolomics data is crucial in trauma patients, allowing measurement of extracellular metabolites for insights into EC responses to traumatic stress. Our pipeline facilitates efficient and accurate integration of exometabolomics data, enabling precise characterization of metabolic flux profiles in trauma patients' ECs.
In this sense our computational analysis revealed notable differences in the activity states of metabolic tasks, reminiscent of those described in Henriksen et al. 2023 [17] (see Figure 4c). For instance, an imbalance in ATP generation between glycolytic and oxidative phosphorylation pathways, as observed in the metabo-groups outlined by Henriksen et al. 2023, was also evident in our analysis. Furthermore, alterations in other metabolic tasks were identified.
In trauma patients cysteine synthesis is pivotal, as cysteine serves as a precursor of glutathione, a major antioxidant in the body. Given the heightened oxidative stress in trauma patients due to tissue injury and inflammation, maintaining sufficient cysteine levels is essential for preserving endothelial function and preventing vascular complications [38]. Glucuronate synthesis is another key pathway, with glucuronate playing a vital role in detoxification processes. Trauma patients, exposed to numerous medications and endogenous metabolites requiring elimination, have an increased demand for glucuronate. Additionally, glucuronate contributes to the synthesis of hyaluronic acid, supporting endothelial integrity and wound healing [39]. Mevalonate synthesis is essential for sustaining endothelial viability and responsiveness to stimuli. Mevalonate serves as a precursor of cholesterol and other critical molecules, including geranylgeranyl pyrophosphate (GGPP), involved in various cellular processes crucial for endothelial function [40]. Alanine and arginine synthesis are vital for endothelial health, with alanine supporting gluconeogenesis to provide energy for the endothelium and arginine serving as a substrate for nitric oxide (NO) synthesis, regulating vascular tone and inflammation. However, trauma-induced upregulation of arginase-1 expression may reduce arginine availability for NO synthesis, impacting endothelial relaxation and protection [41]. Methylglyoxal synthesis contributes to oxidative stress and inflammation in the endothelium by forming advanced glycation end products (AGEs). Elevated levels of methylglyoxal in trauma patients may lead to endothelial dysfunction and vascular complications [42]. Methionine and tryptophan degradation pathways generate metabolites that have both beneficial and detrimental effects. While methionine degradation yields homocysteine, which can cause endothelial damage and thrombosis, it also produces cysteine and glutathione, countering oxidative stress. Similarly, tryptophan degradation produces kynurenine, which affects mood and cognition, with potential neuroprotective or neurotoxic effects [43,44].
However, despite of these results, the lack of correlation between all metabolic tasks and mortality rates suggests a potential absence of a linear relationship between metabo-groups and metabolism. Therefore, conducting other approaches like machine learning analyses on these results could unveil non-linear relationships, enabling nuanced patient stratification based on metabolic capabilities.
The successful application of these methodologies in a clinical context, exemplified by the trauma patients cohort, underscores their potential for transformative contributions to personalized medicine and therapeutic interventions. This study lays the foundation for future research refining our understanding of cellular metabolism in health and disease, paving the way for innovative insights and applications in metabolic network analysis.
In conclusion, our computational pipeline advances understanding of EC metabolism in real-world clinical scenarios. The integration of exometabolomic data, coupled with advanced sampling algorithms, overcomes challenges posed by endothelial metabolism complexity, opening avenues for personalized medicine and therapeutic interventions. This work sets the stage for future investigations into EC metabolism in health and disease, contributing to the broader landscape of systems medicine research.
4. Materials and Methods
4.1. Protocol Overview
The presented protocol introduces a combination of existing and novel algorithms to effectively integrate exometabolomics data (i.e. patient’s plasma metabolome) into GEMs, enabling the elucidation of metabolic alterations.
The different approaches developed here have been tested with a diversity of GEMs as a proof of concept, to test and validate their capabilities. This subsection provides a general overview of the pipeline, while the subsequent subsections offer a more detailed description of each step.
Step 1: Baseline model characterization
First, a baseline model is reconstructed and characterized to determine the maximum and minimum flux allowed for all the metabolic reactions. This process involves the following:
- Omics integration: The cell/organisms physiological information is embed into the baseline GEM using literature-based data, which sets boundaries on the exchange reactions (Figure 5a).
- Exploration of the space of fealible flux solutions using the RESOS algorithm: An in-house developed algorithm is applied to analyze the sampled solutions and define the maximum and minimum flux allowed for each metabolic reaction. This algorithm identifies relevant regions and characterizes the metabolic flux spectrum without imposing arbitrary boundaries. Furthermore, the algorithm determines both the size and the number of solutions within the solution space to accurately profile the metabolic flux of a given network. These sampling parameters will be utilized in subsequent analyses, effectively reducing computational time.
- Outcome: The final outcome of this step is a characterization of the baseline GEM that includes the maximum and minimum flux allowed for all metabolic reactions (Figure 5b).
Step 2: Case-specific model characterization
- Here, the protocol integrates case-specific metabolomic data into the base-line model (Figure 5a). The following steps are involved:
- Omics integration: Relative exometabolomic data is integrated by calculating the ratio TMi/CMi, where TMi represents the concentration of the ith metabolite in the Tth condition (e.g., disease group, treated group, or individual patient) and CMi represents the concentration of the same metabolite in the control group. To accommodate control group heterogeneity, three models are reconstructed for each condition, using either the minimum, maximum, or mean value of the ith metabolite in the control group (CMi) to calculate the relative metabolomic data (Figure 5a).
- Sampling: The same sampling algorithm employed in the baseline model is applied, using the sampling parameters previously determined by RESOS algorithm in step 1 (Figure 5b).
- RESOS: The same algorithm used in the baseline model is applied for the case-specific analysis (Figure 5b).Outcome: As a result, three distinct GEMs are reconstructed for each case, and the case is characterized by combining the sampled solutions from the three models. This comprehensive approach provides a robust representation of the metabolic landscape for each specific case.
Step 3: Determining the metabolic capabilities of case-specific GEMs
- Generate a consensus case-specific GEM: First the three previously reconstructed GEMs (minimum, mean, and maximum) are combined into a single case-specific GEM. This is achieved by adjusting the boundaries of the new GEM using the RESOS algorithm’s output, applied to the fusion of solutions from the three individual case-specific GEMs.
Step 4: Results visualization and interpretation
To identify patterns and stratify the cases under study, a clustering analysis [18] in combination with a heat map representation is applied to the results obtained from the task analysis [19] (Figure 5a).
Figure 5.
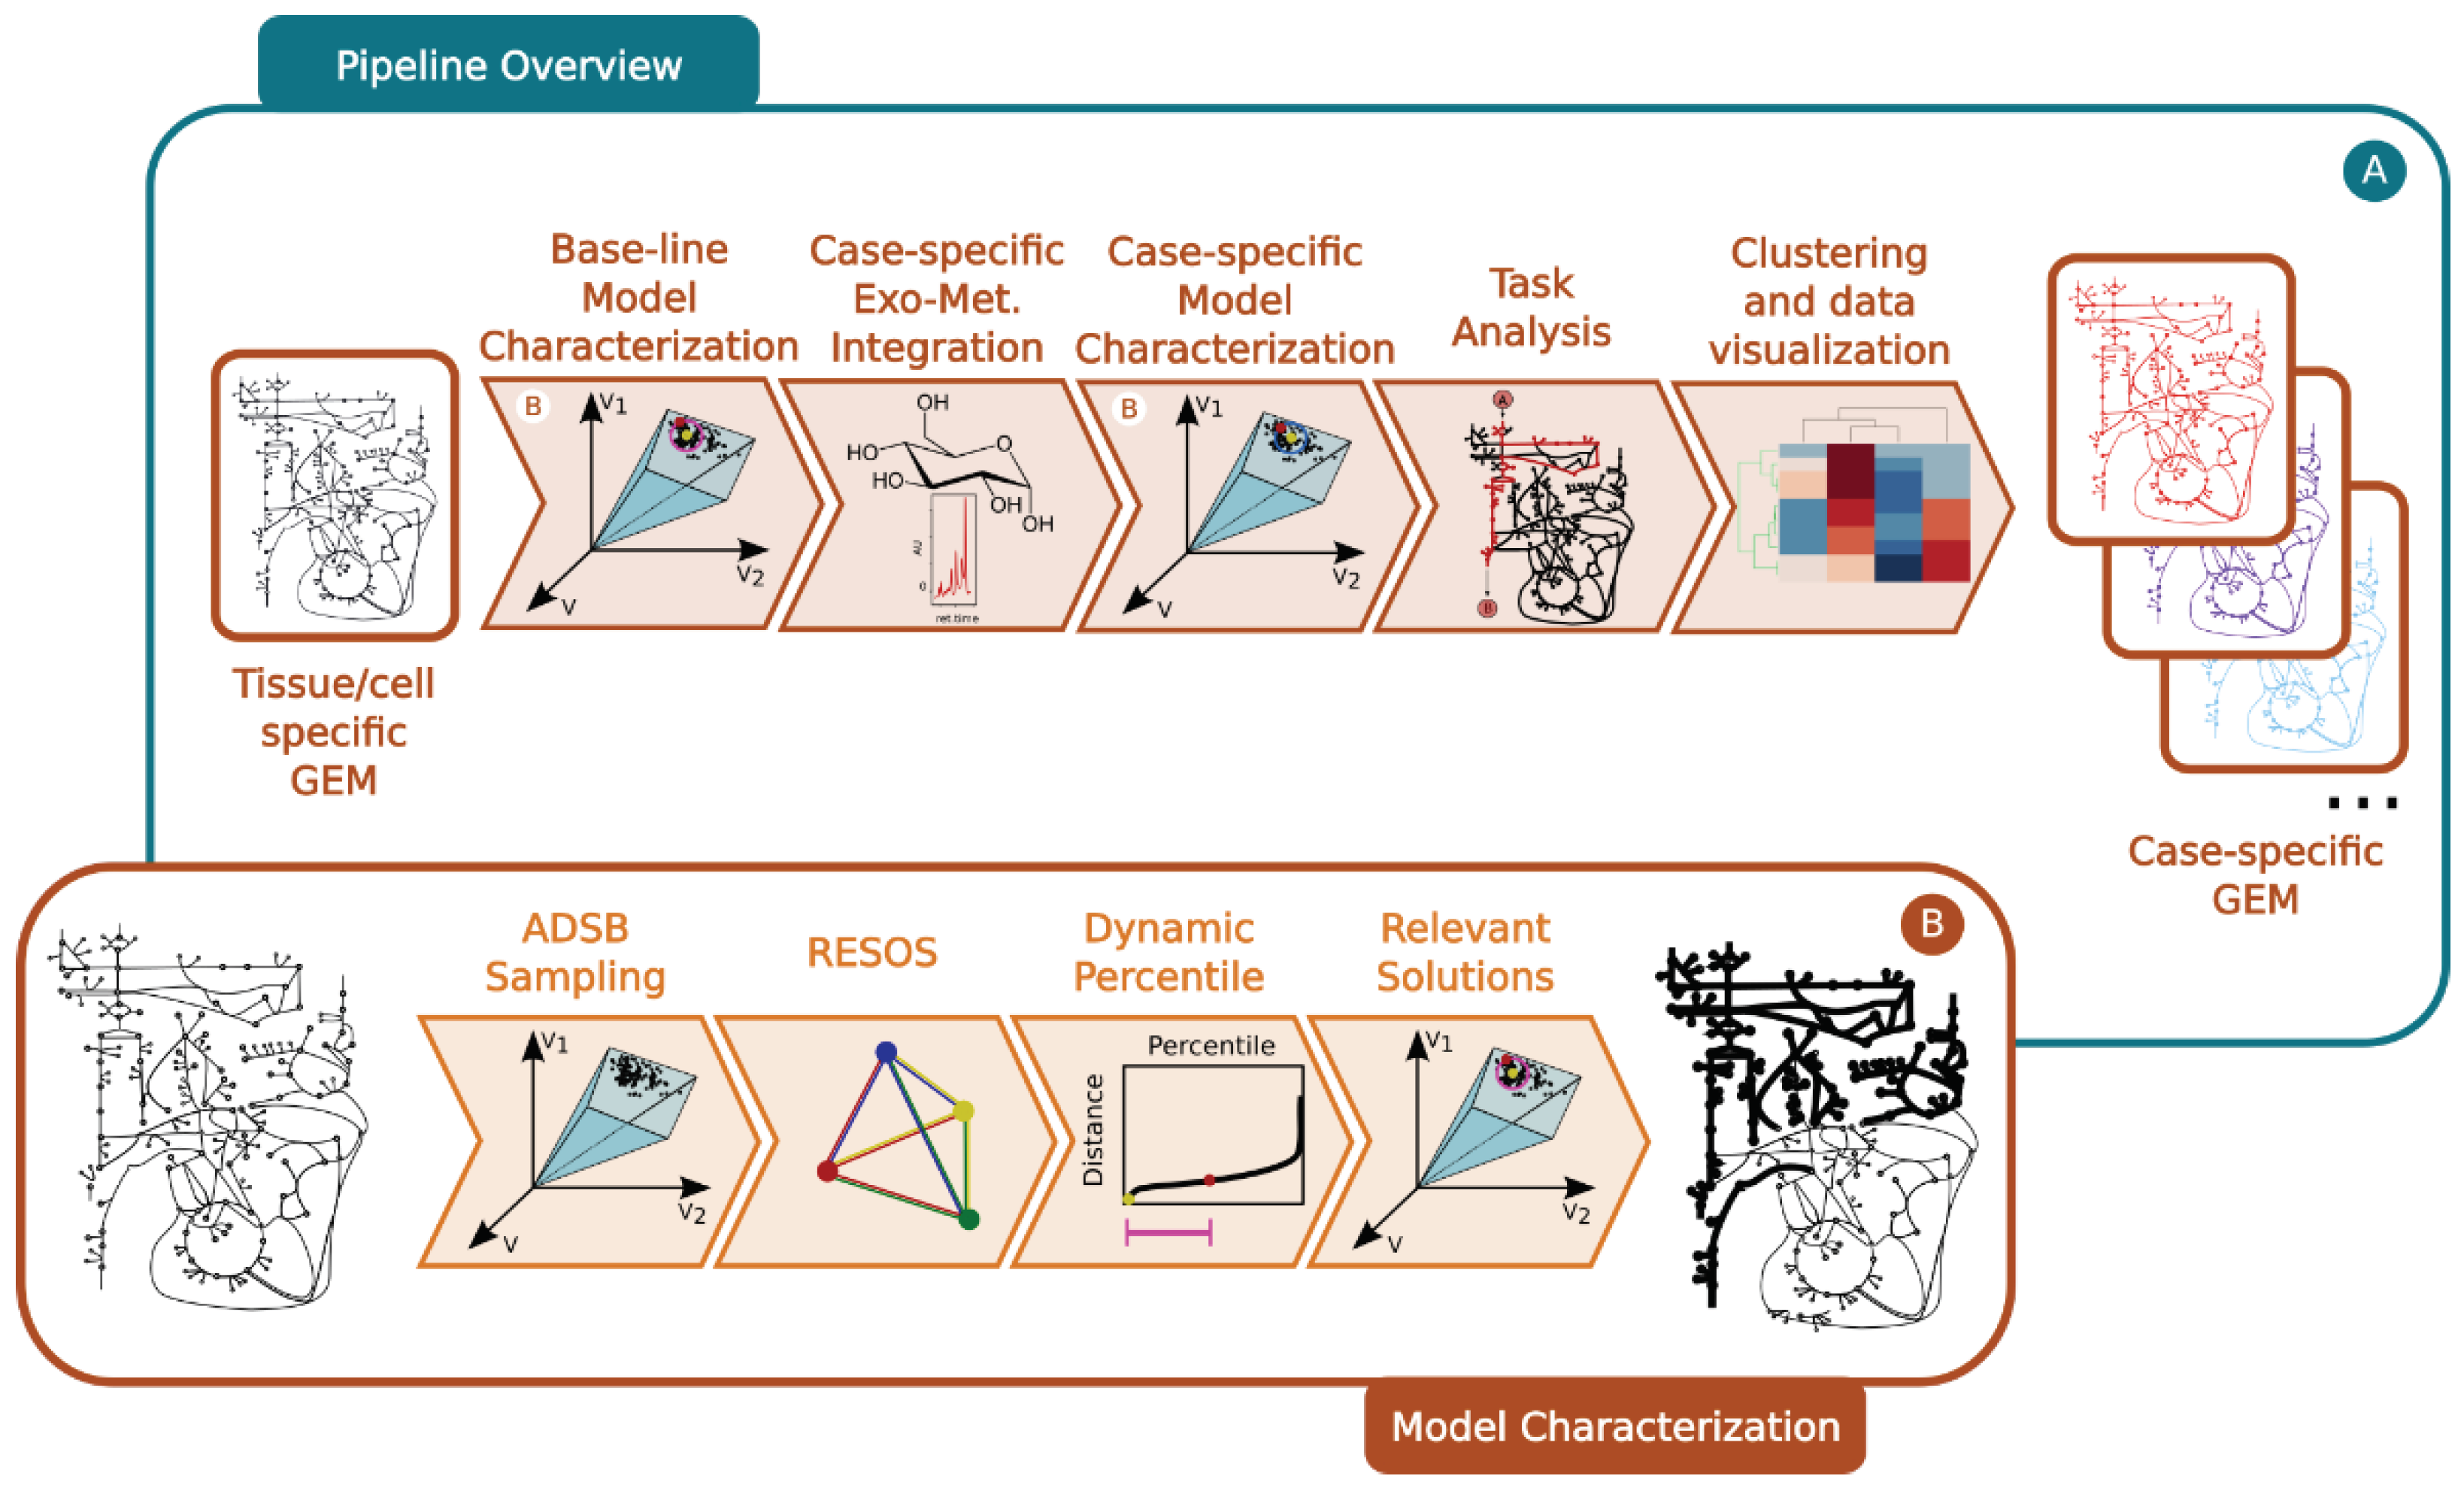
General overview of the developed pipeline: a. Pipeline overview: i. Using a tisuee/cells pecific GEM integrating the metabolic capabilities of the tissue/cell a base-line model is characterized. This characterization includes maximum and minimum flux capabilities for each metabolic reaction in the model as well as RESOS parameters to identify the relevant optimal space of feasible flux solutions. ii. Case-specific exometabolomic data is integrated to modify the boundaries of the base-line model to reflect the case-specific metabolic capabilities. iii. Model characterization of the case-specific GEM by using RESOS parameters determined in the previous step. iv. Task analysis to identify the metabolic capabilities of each case-specific model. v. Clustering and visualization of task analysis results. b. Detail on the model characterization process: i. ADSB Sampling algorithm is applied to identify solutions within the space of feasible optimal flux solutions of a FBA performed on a GEM. Next the RESOS algorithm is applied to i. determine the sum of Euclidean distances between all the sampled solutions, ii. identify the set of relevant sampled solutions that better characterize the metabolic system by implementing the dynamic percentile approach and iii. apply the parameters defined by the dynamic percentile to filter the relevant solutions from the space of feasible optimal flux solutions.
Figure 5.
General overview of the developed pipeline: a. Pipeline overview: i. Using a tisuee/cells pecific GEM integrating the metabolic capabilities of the tissue/cell a base-line model is characterized. This characterization includes maximum and minimum flux capabilities for each metabolic reaction in the model as well as RESOS parameters to identify the relevant optimal space of feasible flux solutions. ii. Case-specific exometabolomic data is integrated to modify the boundaries of the base-line model to reflect the case-specific metabolic capabilities. iii. Model characterization of the case-specific GEM by using RESOS parameters determined in the previous step. iv. Task analysis to identify the metabolic capabilities of each case-specific model. v. Clustering and visualization of task analysis results. b. Detail on the model characterization process: i. ADSB Sampling algorithm is applied to identify solutions within the space of feasible optimal flux solutions of a FBA performed on a GEM. Next the RESOS algorithm is applied to i. determine the sum of Euclidean distances between all the sampled solutions, ii. identify the set of relevant sampled solutions that better characterize the metabolic system by implementing the dynamic percentile approach and iii. apply the parameters defined by the dynamic percentile to filter the relevant solutions from the space of feasible optimal flux solutions.
4.2. Main Case of Study
As a proof of concept, the pipeline outlined in the previous section was applied to a cohort of 95 trauma patients, for whom blood plasma samples were obtained to measure the metabolome [17]. To establish a reference point, metabolomic data from a control group of 20 healthy individuals was utilized to calculate the relative metabolomic data employed in characterizing the reconstructions of patient-specific GEMs.
4.3. Experimental Data
Throughout the development and application of the tools and algorithms developed and applied in the presented pipeline, a wide range of omics data from diverse sources were employed. The following provides an overview of the data utilized:
- Exometabolomics: Blood samples from a cohort of 95 trauma patients [17] and a control group of 20 healthy individuals was used for exometabolomic analysis. This data was integrated into the EC GEM iEC3006 to generate trauma patient-specific GEMs.
4.4. Genome-Scale Metabolic Network Models
Throughout the development and implementation of the diverse tools and algorithms within the presented pipeline, multiple GEMs were utilized to serve distinct purposes. The ensuing GEMs were enlisted:
-
EC GEM iEC3006 (latest reconstruction of EC metabolism) [19]:
- ○
- To construct trauma patient-specific GEMs.
- ○
- To asses the performance of the ADSB sampling algorithm.
-
E. coli EcoliCore [35]:
- ○
- To asses the performance of the ADSB sampling algorithm.
-
E. coli K12 iJO1366 [24]:
- ○
- To evaluated the enhancement in the reliability of model predictions when applying the RESOS algorithm.
- ○
- To evaluated the dynamic percentile method implemented in the RESOS algorithm.
-
General Human GEM Recon1 [28]:
- ○
- To evaluated the dynamic percentile method implemented in the RESOS algorithm.
-
- ○
- To evaluated the dynamic percentile method implemented in the RESOS algorithm.
By utilizing these diverse GEMs, the pipeline was able to comprehensively assess the performance and reliability of the implemented algorithms across different biological systems, providing valuable insights into their effectiveness and applicability.
4.5. Exometabolomics Data Integration
Exometabolomics data from patients’ blood samples is often the only source of omics data available to study endothelium metabolism. In addition, this data is collected from a single time point, which makes the calculation of consumption/secretion rates impossible. To enable the integration of this source of information into a case-specific GEM reconstruction analysis, we have developed a computational approach to integrate relative exometabolomics data.
The process starts by reconstructing a base-line model, as previously explained. The base-line model is characterized by a sampling analysis using the ADSB algorithm [20], and the upper and lower thresholds of the exchange reactions are determined by applying the RESOS algorithm. This method also identifies the parameters required to characterize all the next case-specific models.
Once the baseline model is characterized, and its exchange reaction boundaries are defined, we integrate the case-specific exometabolomic data by modifying the boundaries of the corresponding exchange reactions defined in the baseline model as described in equation 1.
Here, the boundaries of the exchange reaction associated with the jth measured metabolite in the ith condition () are defined as a function of the boundary of the same exchange reaction defined in the baseline model () and the concentration of the jth metabolite in both the ith condition and in a control group ( and , respectively). In case the predicted exchange reaction flux in the base-line model is zero, an upper and lower boundaries of 10 and -10 are set for the characterization of the case-specific GEM. The applicability of this approach can extend to the integration of other types of metabolomic data, including intracellular metabolomics or labeled metabolomics [46].
4.6. Sampling Algorithm
In this pipeline we have incorporated a fast-sampling algorithm based on the Adaptive Directions Sampling on a Box (ADSB) algorithm, developed by Saa and Nielsen [20], which samples points from the feasible non-convex space. The algorithm employs a "shrinking" technique, gradually reducing the sampling space until a feasible flux distribution is obtained. This ensures a uniform sampling throughout the space, allowing for comprehensive exploration.
4.7. Exploring the Space of Feasible Flux Solutions Using RESOS Algorithm
The solutions obtained from sampling are all valid; however, it is unlikely to observe a uniform distribution within the solution space, and the presence of outlier solutions cannot be ignored. To this aim a novel algorithm for the Rational Exploration of Space Of Solutions (RESOS) is developed. The algorithm identifies the most representative set of solutions corresponding to the densest region of solutions within the space of feasible flux solutions. The set of soultions is between two representative solutions namely “central” and “furthest” solutions.
The furthest solution refers to the solution with the highest sum of Euclidean distances witht the other solutions within the space of feasible flux solutions. Conversely, the central solution corresponds to the solution with the smallest sum of Euclidean distances within the same space of solutions. To identify these regions with a high concentration of solutions, two methods have been developed: Continuous and Discrete.
The Discrete method is based on the frequency of reaction flux values within the sampled solutions. Solutions located in the densest regions tend to exhibit similar flux values for reactions compared to solutions in less dense areas. By comparing the frequency of possible values for each reaction, outliers can be identified. This method involves generating a histogram for each reaction and summing the frequencies across all solutions. Solutions with the highest total frequency values are located in the densest regions. Normalization is applied to ensure that the sum of the areas of each histogram bin always adds up to one.
On the other hand, the Continuous method provides a more straightforward approach by calculating the Euclidean distance of each solution against every other solution. This allows for a direct comparison of distances and helps identify the central and furthest solutions within the solution space.
By employing both the Discrete and Continuous methods, the pipeline enables the identification of regions with the highest concentration of solutions. These methods provide complementary insights into the structure and characteristics of the solution space, facilitating the recovery of representative solution sets for further analyses. The distance between two solutions (vectors) is computed by applying the equation 2.
where represents the number of reactions, and are two different vectors. The outcome is a squared symmetrical matrix in which the number of rows and columns corresponds to the number of sampled solutions. The sum of distances in each solution shows how far or close is it with respect to the other solutions. An example of a symmetrical matrix produced by the continuous method can be found in Table 1. This method also presents normalization, the total Euclidean distance per solution is normalized with sum of every Euclidean distance.
In both methods, once frequencies or distances are computed, the next step is to filter the solutions to determine the set of relevant solutions that characterize the metabolic system.
4.8. Identifying the Set of Representative FLUX solutions by Applying a Dynamic Non-Arbitrary Percentile Threhold Method
The set of relevant solutions is defined as the set between the central and the furthest solutions. While central solution is defined as the solution with the lowest sum of Euclidean distances with the other solutions, to define the furthest solution a threshold is required.
To this aim the RESOS algorithm incorporates a dynamic non-arbitrary percentile threshold method. The dynamic percentile is based on the difference between the total Euclidean distances in the furthest and the central solution. In other words, how far the central and furthest solution are from each other.
To obtaining a dynamic percentile, the algorithm tests every possible percentile from 1st to 100th. Within each test, the algorithm recovers the number of solutions generated and computes the difference between the total Euclidean distance or total frequency between the furthest and central solution depending if the used method is the continous or discrete approach respectively. These results can be represented graphicaly in a curve being its second derivative the inflection point where curve´s concavity changes. This change in the curve’s trend indicates that after that point, the distance between the central and furthest solution will tend to increase. Thus, after the inflection point, the risk of considering outliers increases continuously. In consequence, the percentile closest to the inflection point is chosen as threshold and all the solutions after this point are cosidered outlayer.
After the dynamic threshold is defined, it is saved for subsequent analyses with the same model. The data recovered is: i. Euclidean distance between furthest and central solution, and ii. number of valid solutions returned by the dynamic percentile. In other words, the attributes that the algorithm uses to define a representative set of solutions for a given model are the size of the space containing the solutions and its density. In subsequent sampling analyses with the same model (i.e in a knock out analysis or characterizing case-specific models relative to a base-line model), sampling is performed until the values for the sampling parameters previously described are reached (distance between central and furdest solution and density of solutions between these points)
4.9. Task Analysis
To explore the metabolic capabilities of the reconstructed GEMs, we utilized a collection of 190 manually curated metabolic tasks [16]. These tasks represent specific goals that cells must achieve by producing certain metabolic products from a set of substrates. Unlike predefined metabolic pathways that include all the reactions, here we focus on defining the source substrates and the final products.
To investigate the metabolic task,FBA was applied [47]. FBA allows us to measure the flow of substances within the cell's metabolic network by quantifying the maximum number of substances that can be exchanged between different groups of metabolites, considering specific constraints. This analysis was performed using the testPathway function within the Matlab COBRA toolbox.
4.10. Clustering Analysis
Task analysis results are represented graphically in a heatmaps with dendrograms by applying Euclidian distance and the complete cluster algorithm using the clustergram package in MATLAB [18]
5. Conclusions
The developed computational pipeline offers a robust and innovative approach, facilitating the efficient integration of exometabolomic data into GEM analyses, thereby providing a comprehensive understanding of cell metabolism. By harnessing advanced sampling algorithms and conducting a thorough analysis of metabolic tasks, we have effectively addressed the inherent complexities of endothelial metabolism.
Our pipeline offers a practical solution for integrating patient plasma metabolome data into computational models, facilitating the construction of patient-specific GEMs. Through the accurate characterization of metabolic flux profiles in trauma patients' ECs, we have identified critical metabolic alterations associated with traumatic stress.
Moreover, our investigation has unveiled significant differences in the activity states of metabolic tasks, indicative of underlying metabolic dysregulations. While certain metabolic tasks show promising correlations with mortality rates, the lack of a consistent linear relationship across all metabolic tasks suggests the potential presence of non-linear interactions. Thus, further exploration through, for example, machine learning analysis could provide valuable insights into nuanced patient stratification based on metabolic capabilities.
The successful application of our methodologies in a clinical context, as exemplified by the trauma patient cohort, underscores their transformative potential in personalized medicine and more effitient therapeutic interventions.
Our work contributes to the advancement of cellular metabolism understanding in both health and disease. By integrating exometabolomic data into Genome-Scale Metabolic Models (GEMs) analyses, we establish a robust foundation for future research in systems medicine. This interdisciplinary effort relies on iterative collaboration among clinical investigations, experimental models, and computational analyses. Our pipeline has the potential to revolutionize metabolic network analysis, paving the way for innovative approaches to personalized disease management and treatment.
Supplementary Materials
The following supporting information can be downloaded at the website of this paper posted on Preprints.org., Supplementary Material 1: Essential and synthetic Lethal reacions analysis, Supplementary Material 2: Patien-specific GEMs (minimum, mean and maximum), Supplemetary material 3: PCA plots of all the patients’ GEMs, Supplemetary material 4: Clustering analysis.
Author Contributions
Conceptualization, I.M.d.M., L.K.N. and P.I.J.; methodology, I.M.d.M.; software, I.M.d.M., F.S, I.M and E.B.; validation, I.M.d.M., F.S, I.M and E.B.; formal analysis, I.M.d.M., F.S, I.M and E.B.; investigation, I.M.d.M.; resources, L.K.N. and P.I.J.; data curation, I.M.d.M. and I.M; writing—original draft preparation, I.M.d.M.; writing—review and editing, I.M.d.M., L.K.N., P.I.J., F.S, I.M and E.B.; visualization, I.M.d.M., F.S, I.M and E.B.; supervision, I.M.d.M.; project administration, I.M.d.M. and P.I.J.; funding acquisition, L.K.N. and P.I.J. All authors have read and agreed to the published version of the manuscript.
Funding
I.M.d.M. and L.K.N. were supported by The Novo Nordisk Foundation (NNF Grant numbers: NNF20CC0035580; NNF14OC0009473; and NNF20SA0066621). P.I.J. was supported by the GCHSP program (F-22010-24).
Institutional Review Board Statement
Not applicable.
Informed Consent Statement
Not applicable.
Data Availability Statement
https://github.com/biosustain/GEM-Exometabolome, accessed on 1 March 2024.
Conflicts of Interest
The authors declare no conflicts of interest.
References
- Gu, C.; Kim, G.B.; Kim, W.J.; et al. Current status and applications of genome-scale metabolic models. Genome Biol 2019, 20, 121. [Google Scholar] [CrossRef]
- Zhang, C.; Hua, Q. Applications of Genome-Scale Metabolic Models in Biotechnology and Systems Medicine. Front. Physiol. 2016, 6, 413. [Google Scholar] [CrossRef] [PubMed]
- Kim, B.; Kim, W.J.; Kim, D.I.; Lee, S.Y. Applications of genome-scale metabolic network model in metabolic engineering. J. Ind. Microbiol. Biotechnol. 2015, 42, 339–348. [Google Scholar] [CrossRef]
- Passi, A.; Tibocha-Bonilla, J.D.; Kumar, M.; Tec-Campos, D.; Zengler, K.; Zuniga, C. Genome-Scale Metabolic Modeling Enables In-Depth Understanding of Big Data. Metabolites 2022, 12, 14. [Google Scholar] [CrossRef] [PubMed]
- Bi, X.; Liu, Y.; Li, J.; Du, G.; Lv, X.; Liu, L. Construction of Multiscale Genome-Scale Metabolic Models: Frameworks and Challenges. Biomolecules 2022, 12, 721. [Google Scholar] [CrossRef]
- Sarathy, C.; Breuer, M.; Kutmon, M.; Adriaens, M.E.; Evelo, C.T.; Arts, I.C.W. Comparison of metabolic states using genome-scale metabolic models. PLoS Comput Biol. 2021, 17, e1009522. [Google Scholar] [CrossRef]
- Ebrahim, A.; Brunk, E.; Tan, J.; O'Brien, E.J.; Kim, D.; Szubin, R.; Lerman, J.A.; Lechner, A.; Sastry, A.; Bordbar, A.; Feist, A.M.; Palsson, B.O. Multi-omic data integration enables discovery of hidden biological regularities. Nat Commun. 2016, 7, 13091. [Google Scholar] [CrossRef] [PubMed]
- Rossi, G.P.; Barton, M.; Dhaun, N.; Rizzoni, D.; Seccia, T.M. Challenges in the evaluation of endothelial cell dysfunction: a statement from the European Society of Hypertension Working Group on Endothelin and Endothelial Factors. J. Hypertens. 2023, 41, 369–379. [Google Scholar] [CrossRef]
- Bouïs, D.; Hospers, G.A.; Meijer, C.; Molema, G.; Mulder, N.H. Endothelium in vitro: a review of human vascular endothelial cell lines for blood vessel-related research. Angiogenesis 2001, 4, 91–102. [Google Scholar] [CrossRef]
- Comellas, A.P.; Briva, A.; Dada, L.A.; Butti, M.L.; Trejo, H.E.; Yshii, C.; Azzam, Z.S.; Litvan, J.; Chen, J.; Lecuona, E.; Pesce, L.M.; Yanagisawa, M.; Sznajder, J.I. Endothelin-1 impairs alveolar epithelial function via endothelial ETB receptor. Am. J. Respir. Crit. Care Med. 2009, 179, 113–122. [Google Scholar] [CrossRef]
- Mannino, R.G.; Qiu, Y.; Lam, W.A. Endothelial cell culture in microfluidic devices for investigating microvascular processes. Biomicrofluidics 2018, 12, 042203. [Google Scholar] [CrossRef]
- Carlsen, J.; Henriksen, H.H.; Marin de Mas, I.; Johansson, P.I. An explorative metabolomic analysis of the endothelium in pulmonary hypertension. Sci. Rep. 2022, 12, 13284. [Google Scholar] [CrossRef]
- Gelbach, P.E.; Cetin, H.; Finley, S.D. Flux sampling in genome-scale metabolic modeling of microbial communities. BMC Bioinformatics 2024, 25, 45. [Google Scholar] [CrossRef]
- Hashemi, S.; Razaghi-Moghadam, Z.; Nikoloski, Z. Maximizing multi-reaction dependencies provides more accurate and precise predictions of intracellular fluxes than the principle of parsimony. PLoS Comput Biol. 2023, 19, e1011489. [Google Scholar] [CrossRef]
- Arlot, S.; Celisse, A. A survey of cross-validation procedures for model selection. Stat. Surveys 2010, 4, 40–79. [Google Scholar] [CrossRef]
- Richelle, A.; Kellman, B.P.; Wenzel, A.T.; Chiang, A.W.T.; Reagan, T.; Gutierrez, J.M.; Joshi, C.; Li, S.; Liu, J.K.; Masson, H.; Lee, J.; Li, Z.; Heirendt, L.; Trefois, C.; Juarez, E.F.; Bath, T.; Borland, D.; Mesirov, J.P.; Robasky, K.; Lewis, N.E. Model-based assessment of mammalian cell metabolic functionalities using omics data. Cell Rep Methods 2021, 1, 100040. [Google Scholar] [CrossRef]
- Henriksen, H.H.; Marín de Mas, I.; Nielsen, L.K.; Krocker, J.; Stensballe, J.; Karvelsson, S.T.; Secher, N.H.; Rolfsson, Ó.; Wade, C.E.; Johansson, P.I. Endothelial Cell Phenotypes Demonstrate Different Metabolic Patterns and Predict Mortality in Trauma Patients. Int. J. Mol. Sci. 2023, 24, 2257. [Google Scholar] [CrossRef]
- Schonlau, M. Visualizing non-hierarchical and hierarchical cluster analyses with clustergrams. Comput. Stat. 2004, 19, 95–111. [Google Scholar] [CrossRef]
- Henriksen, H.H.; Marín de Mas, I.; Herand, H.; Krocker, J.; Wade, C.E.; Johansson, P.I. Metabolic systems analysis identifies a novel mechanism contributing to shock in patients with endotheliopathy of trauma (EoT) involving thromboxane A2 and LTC4. Matrix Biol Plus 2022, 15, 100115. [Google Scholar] [CrossRef]
- Saa, P.A.; Zapararte, S.; Drovandi, C.C.; Nielsen, L.K. LooplessFluxSampler: an efficient toolbox for sampling the loopless flux solution space of metabolic models. BMC Bioinformatics 2024, 25, 3. [Google Scholar] [CrossRef] [PubMed]
- DiMaggio, C.; Ayoung-Chee, P.; Shinseki, M.; Wilson, C.; Marshall, G.; Lee, D.C.; Wall, S.; Maulana, S.; Leon Pachter, H.; Frangos, S. Traumatic injury in the United States: In-patient epidemiology 2000–2011. Injury 2016, 47, 1393–1403. [Google Scholar] [CrossRef]
- Johansson, P.I.; Stensballe, J.; Ostrowski, S.R. Shock induced endotheliopathy (SHINE) in acute critical illness - a unifying pathophysiologic mechanism. Crit. Care 2017, 21, 25. [Google Scholar] [CrossRef] [PubMed]
- Bunch, C.M.; Chang, E.; Moore, E.E.; Moore, H.B.; Kwaan, H.C.; Miller, J.B.; Al-Fadhl, M.D.; Thomas, A.V.; Zackariya, N.; Patel, S.S.; Zackariya, S.; Haidar, S.; Patel, B.; McCurdy, M.T.; Thomas, S.G.; Zimmer, D.; Fulkerson, D.; Kim, P.Y.; Walsh, M.R.; Hake, D.; Kedar, A.; Aboukhaled, M.; Walsh, M.M. SHock-INduced Endotheliopathy (SHINE): A mechanistic justification for viscoelastography-guided resuscitation of traumatic and non-traumatic shock. Front. Physiol. 2023, 14, 1094845. [Google Scholar] [CrossRef] [PubMed]
- Orth, J.D.; Conrad, T.M.; Na, J.; Lerman, J.A.; Nam, H.; Feist, A.M.; Palsson, B.Ø. A comprehensive genome-scale reconstruction of Escherichia coli metabolism--2011. Mol. Syst. Biol. 2011, 7, 535. [Google Scholar] [CrossRef] [PubMed]
- Fouladiha, H.; Marashi, S.A.; Li, S.; Li, Z.; Masson, H.O.; Vaziri, B.; Lewis, N.E. Systematically gap-filling the genome-scale metabolic model of CHO cells. Biotechnol. Lett. 2021, 43, 73–87. [Google Scholar] [CrossRef]
- Shirkhorshidi, A.S.; Aghabozorgi, S.; Wah, T.Y. A Comparison Study on Similarity and Dissimilarity Measures in Clustering Continuous Data. PLoS One 2015, 10, e0144059. [Google Scholar] [CrossRef]
- Hefzi, H.; Ang, K.S.; Hanscho, M.; Bordbar, A.; Ruckerbauer, D.; Lakshmanan, M.; Orellana, C.A.; Baycin-Hizal, D.; Huang, Y.; Ley, D.; Martinez, V.S.; Kyriakopoulos, S.; Jiménez, N.E.; Zielinski, D.C.; Quek, L.E.; Wulff, T.; Arnsdorf, J.; Li, S.; Lee, J.S.; Paglia, G.; Loira, N.; Spahn, P.N.; Pedersen, L.E.; Gutierrez, J.M.; King, Z.A.; Lund, A.M.; Nagarajan, H.; Thomas, A.; Abdel-Haleem, A.M.; Zanghellini, J.; Kildegaard, H.F.; Voldborg, B.G.; Gerdtzen, Z.P.; Betenbaugh, M.J.; Palsson, B.O.; Andersen, M.R.; Nielsen, L.K.; Borth, N.; Lee, D.Y.; Lewis, N.E. "A consensus genome-scale reconstruction of Chinese hamster ovary cell metabolism". Cell Systems 2016, 3, 434–443.e8. [Google Scholar] [CrossRef]
- Duarte, N.C.; Becker, S.A.; Jamshidi, N.; Thiele, I.; Mo, M.L.; Vo, T.D.; Srivas, R.; Palsson, B.Ø. “Global reconstruction of the human metabolic network based on genomic and bibliomic data". Proc. Natl. Acad. Sci. U.S.A. 2007, 104, 1777–1782. [Google Scholar] [CrossRef]
- T. Shlomi, O. Berkman, and E. Ruppin, “Regulatory on/off minimization of metabolic flux changes after genetic perturbations,” Proceedings of the National Academy of Sciences of the United States of America, vol. 102, 2005.
- T. Baba, H. C. Huan, K. Datsenko, B. L. Wanner, and H. Mori, “The applications of systematic in-frame, single-gene knockout mutant collection of escherichia coli k-12,” Methods in Molecular Biology, vol. 416, 2007.
- G. Butland, M. Babu, J. J. Díaz-Mejía, F. Bohdana, S. Phanse, B. Gold, W. Yang, J. Li, A. G. Gagarinova, O. Pogoutse, H. Mori, B. L. Wanner, H. Lo, J. Wasniewski, C. Christopoulos, M. Ali, P. Venn, A. Safavi-Naini, N. Sourour, S. Caron, J. Y. Choi, L. Laigle, A. Nazarians-Armavil, A. Deshpande, S. Joe, K. A. Datsenko, N. Yamamoto, B. J. Andrews, C. Boone, H. Ding, B. Sheikh, G. Moreno-Hagelsieb, J. F. Greenblatt, and A. Emili, “esga: E. coli synthetic genetic array analysis,” Nature Methods, vol. 5, 2008.
- H. Mori, T. Baba, K. Yokoyama, R. Takeuchi, W. Nomura, K. Makishi, Y. Otsuka, H. Dose, and B. L. Wanner, “Identification of essential genes and synthetic lethal gene combinations in escherichia coli k-12,” Methods in Molecular Biology, vol. 1279, 2015.
- I. Apaolaza, E. S. José-Eneriz, L. Tobalina, E. Miranda, L. Garate, X. Agirre, F. Prósper, and F. J. Planes, “An in-silico approach to predict and exploit synthetic lethality in cancer metabolism,” Nature Communications, vol. 8, 2017.
- Heirendt, L.; Arreckx, S.; Pfau, T.; Mendoza, S.N.; Richelle, A.; Heinken, A.; Haraldsdóttir, H.S.; Wachowiak, J.; Keating, S.M.; Vlasov, V.; Magnusdóttir, S.; Ng, C.Y.; Preciat, G.; Zagare, A.; Chan, S.H.J.; Aurich, M.K.; Clancy, C.M.; Modamio, J.; Sauls, J.T.; Noronha, A.; Bordbar, A.; Cousins, B.; El Assal, D.C.; Valcarcel, L.V.; Apaolaza, I.; Ghaderi, S.; Ahookhosh, M.; Ben Guebila, M.; Kostromins, A.; Sompairac, N.; Le, H.M.; Ma, D.; Sun, Y.; Wang, L.; Yurkovich, J.T.; Oliveira, M.A.P.; Vuong, P.T.; El Assal, L.P.; Kuperstein, I.; Zinovyev, A.; Hinton, H.S.; Bryant, W.A.; Aragón Artacho, F.J.; Planes, F.J.; Stalidzans, E.; Maass, A.; Vempala, S.; Hucka, M.; Saunders, M.A.; Maranas, C.D.; Lewis, N.E.; Sauter, T.; Palsson, B.Ø.; Thiele, I.; Fleming, R.M.T. “Creation and analysis of biochemical constraint-based models: the COBRA Toolbox v3.0.". Nature Protocols 2019, 14, 639–702. [Google Scholar] [CrossRef]
- Orth, J. D., Fleming, R. M., Palsson, B. Ø. Reconstruction and Use of Microbial Metabolic Networks: the Core Escherichia coli Metabolic Model as an Educational Guide. EcoSal Plus 2010, 4. [Google Scholar]
- Ezugwu, A.E., Shukla, A.K., Agbaje, M.B. et al. Automatic clustering algorithms: a systematic review and bibliometric analysis of relevant literature. Neural Comput & Applic 2021, 33, 6247–6306. [Google Scholar]
- Marin de Mas I, Herand H, Carrasco J, Nielsen LK, Johansson PI. A Protocol for the Automatic Construction of Highly Curated Genome-Scale Models of Human Metabolism. Bioengineering (Basel) 2023, 10, 576. [Google Scholar]
- Hoffer, B. J., Pick, C. G., Hoffer, M. E., Becker, R. E., Chiang, Y. H., Greig, N. H. Repositioning drugs for traumatic brain injury - N-acetyl cysteine and Phenserine. Journal of Biomedical Science 2017, 24, 71. [Google Scholar]
- Gianola, S., Bargeri, S., Biffi, A., Cimbanassi, S., D’Angelo, D., Coclite, D., Facchinetti, G., Fauci, A. J., Ferrara, C., Di Nitto, M., Napoletano, A., Punzo, O., Ranzato, K., Tratsevich, A., Iannone, P., Castellini, G., Chiara, O. Structured approach with primary and secondary survey for major trauma care: an overview of reviews. World Journal of Emergency Surgery 2023, 18, 2. [Google Scholar] [CrossRef] [PubMed]
- Poggi A, Boero S, Musso A, Zocchi MR. Selective role of mevalonate pathway in regulating perforin but not FasL and TNFalpha release in human Natural Killer cells. PLoS One. 2013, 8, e62932. [Google Scholar]
- Costa, B. P., Martins, P., Veríssimo, C., Simões, M., Tomé, M., Grazina, M., Pimentel, J., Castro-Sousa, F. Argininemia and plasma arginine bioavailability – predictive factors of mortality in the severe trauma patients? Nutrition & Metabolism 2022, 13, 60. [Google Scholar]
- Todoriki S, Hosoda Y, Yamamoto T, Watanabe M, Sekimoto A, Sato H, Mori T, Miyazaki M, Takahashi N, Sato E. Methylglyoxal Induces Inflammation, Metabolic Modulation and Oxidative Stress in Myoblast Cells. Toxins (Basel) 2022, 14, 263. [Google Scholar] [CrossRef]
- Ploder, Martin, Spittler, Andreas, Schroecksnadel, Katharina, Neurauter, Gabriele, Pelinka, Linda E., Roth, Erich and Fuchs, Dietmar. "Accelerated Tryptophan Degradation in Trauma and Sepsis Patients is Related to Pro-inflammatory Response and to the Diminished in vitro Response of Monocytes". Pteridines 2009, 20, 54–61.
- Ploder M, Spittler A, Kurz K, Neurauter G, Pelinka LE, Roth E, Fuchs D. Accelerated tryptophan degradation predicts poor survival in trauma and sepsis patients. Int J Tryptophan Res. 2010, 3, 61–7.
- Pierre Tattevin, Delphine Monnier, Olivier Tribut, Joelle Dulong, Nadège Bescher, Frederic Mourcin, Fabrice Uhel, Yves Le Tulzo, Karin Tarte, Enhanced Indoleamine 2,3-Dioxygenase Activity in Patients with Severe Sepsis and Septic Shock. The Journal of Infectious Diseases 2010, 201, 956–966. [CrossRef]
- Marín de Mas, I.; Marín, S.; Pachón, G.; Rodríguez-Prados, J.C.; Vizán, P.; Centelles, J.J.; Tauler, R.; Azqueta, A.; Selivanov, V.; López de Ceráin, A.; Cascante, M. Unveiling the Metabolic Changes on Muscle Cell Metabolism Underlying p-Phenylenediamine Toxicity. Front. Mol. Biosci. 2017, 4, 8. [Google Scholar] [CrossRef] [PubMed]
- Orth, J. D., Thiele, I., & Palsson, B. Ø. What is flux balance analysis? Nature Biotechnology 2010, 28, 245–248. [Google Scholar] [CrossRef] [PubMed]
- Cascante, M.; de Atauri, P.; Gomez-Cabrero, D.; et al. Workforce Preparation: The Biohealth Computing Model for Master and PhD Students. J. Transl. Med. 2014, 12, S11. [Google Scholar] [CrossRef] [PubMed]
Figure 1.
a. Euclidean distance between the “furthest” and “central” solutions: Evolution of the distance between the central and furthest solution as points sample increase using E. coli iJO1366 and CHO iCHO2101 GEMs. Blue lines represent the continuous approach while red line represents the discrete approach. b. Optimal sampling points calculation via dynamic percentile method: Computed inflexion points as the second derivative of the curve representing the number of sampling points and distance between the central and furthest solutions. This evolution is represented by a blue line and the inflexion point with an orange circle with a number that indicates the percentile. The assessed GEMs are (from up to down and from left to right): E. Coli (iJO1366), CHO (iCHO1766), Human (Recon1) and CHO (iCHO2101).
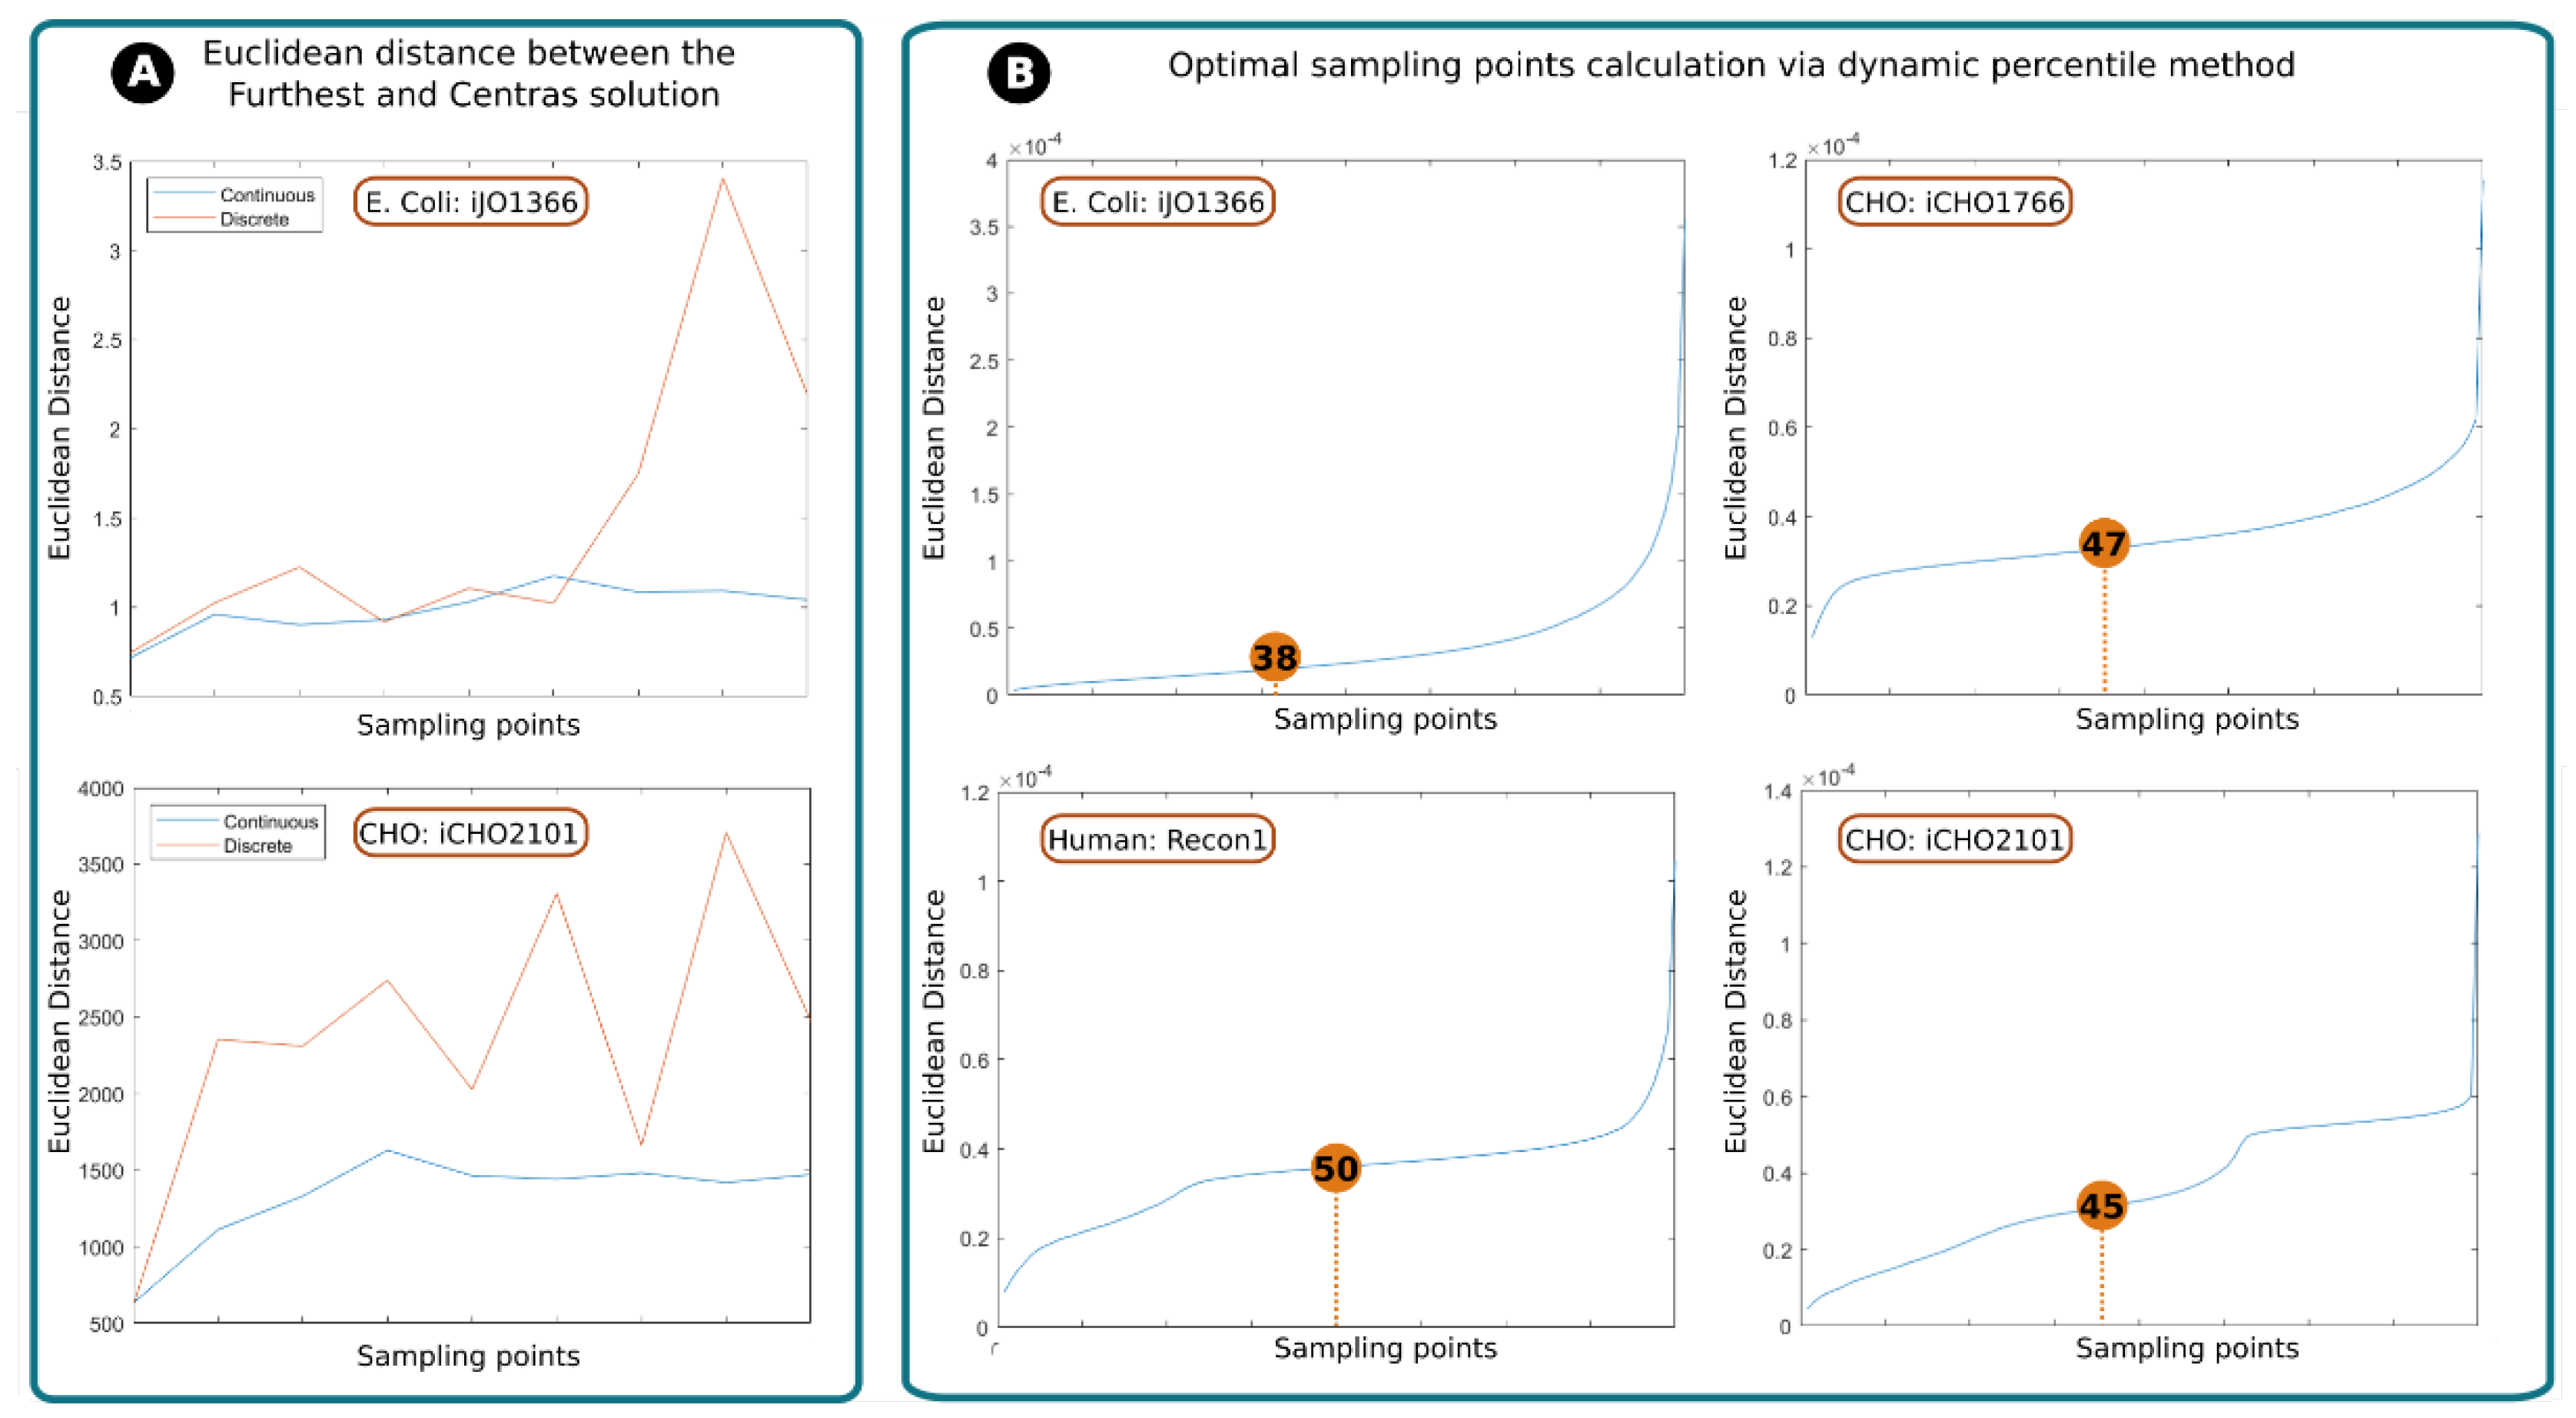
Figure 2.
Schematic representation of the algorithm comparison: The color of the arrows indicate whether a particular step was performed to predict only ERs (yellow), SLs (green) or both (black).
Figure 2.
Schematic representation of the algorithm comparison: The color of the arrows indicate whether a particular step was performed to predict only ERs (yellow), SLs (green) or both (black).
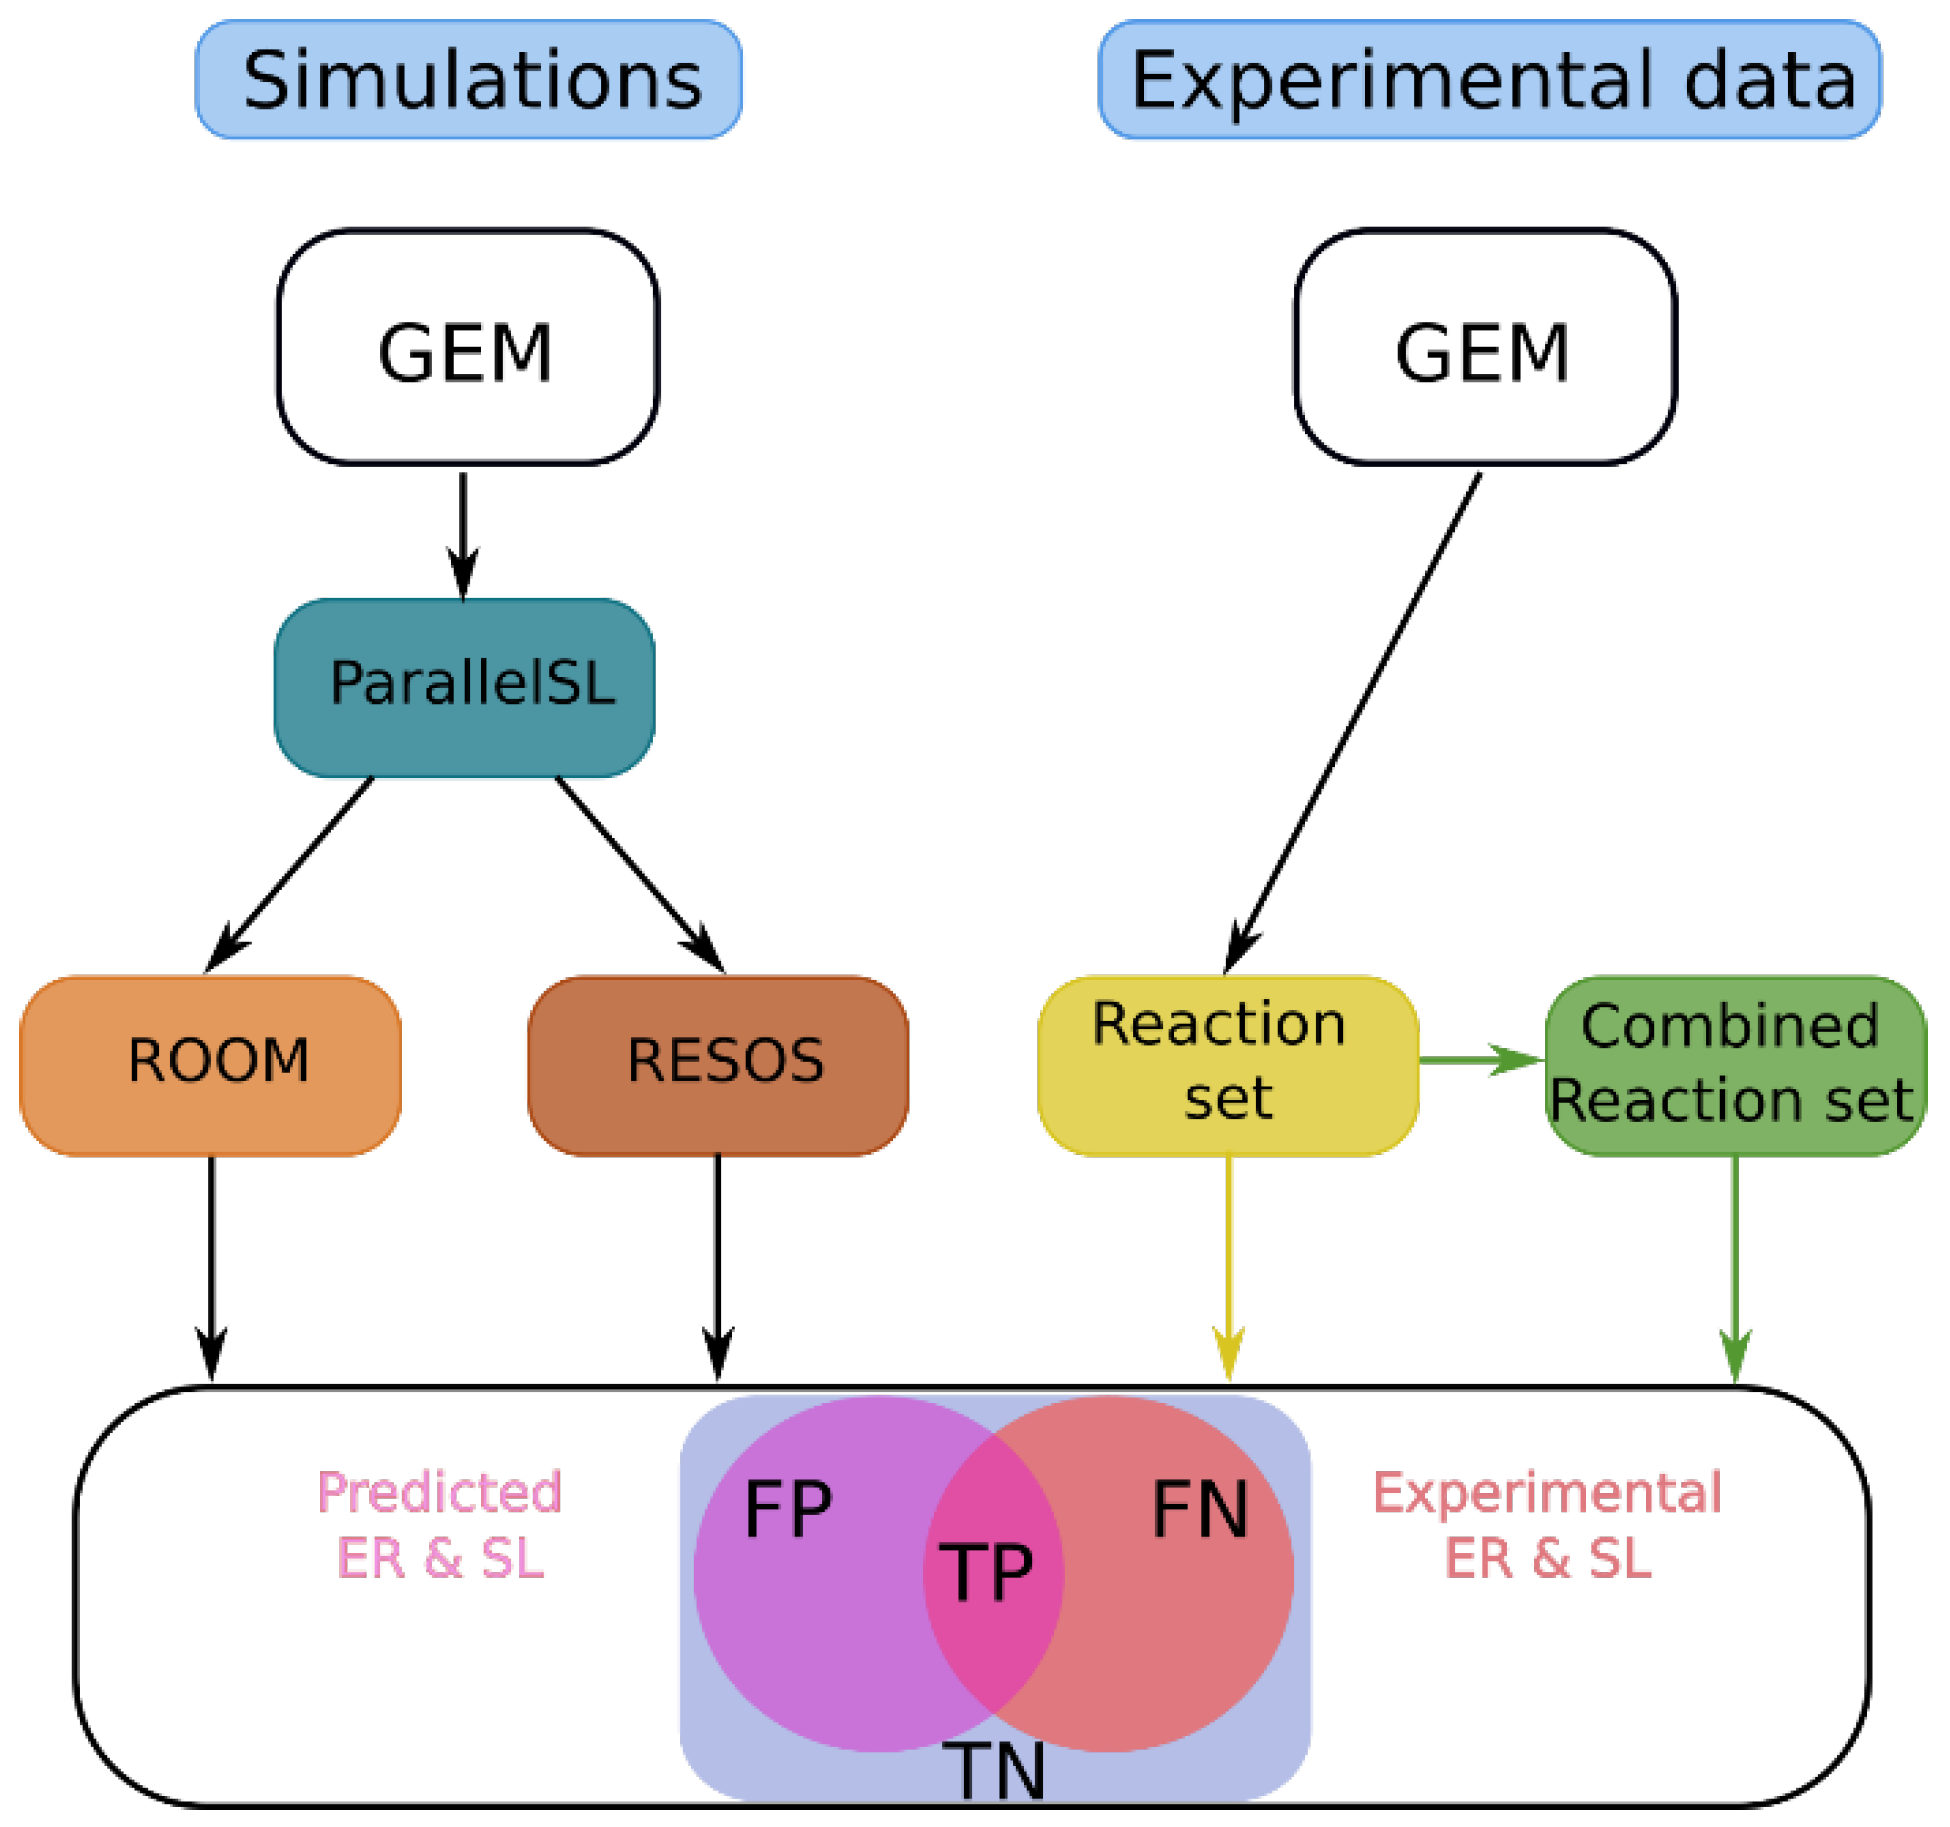
Figure 3.
PCA of the minimum, mean and maximum GEMs. The figure depicts PCAs illustrating the distribution of solutions obtained from three models employed to characterize the metabolic flux profiles of each patient (minimum, mean, and maximum). The plot presents PC1 and PC2 for patients 24, 52, and 73, serving as representative examples of the cohort.
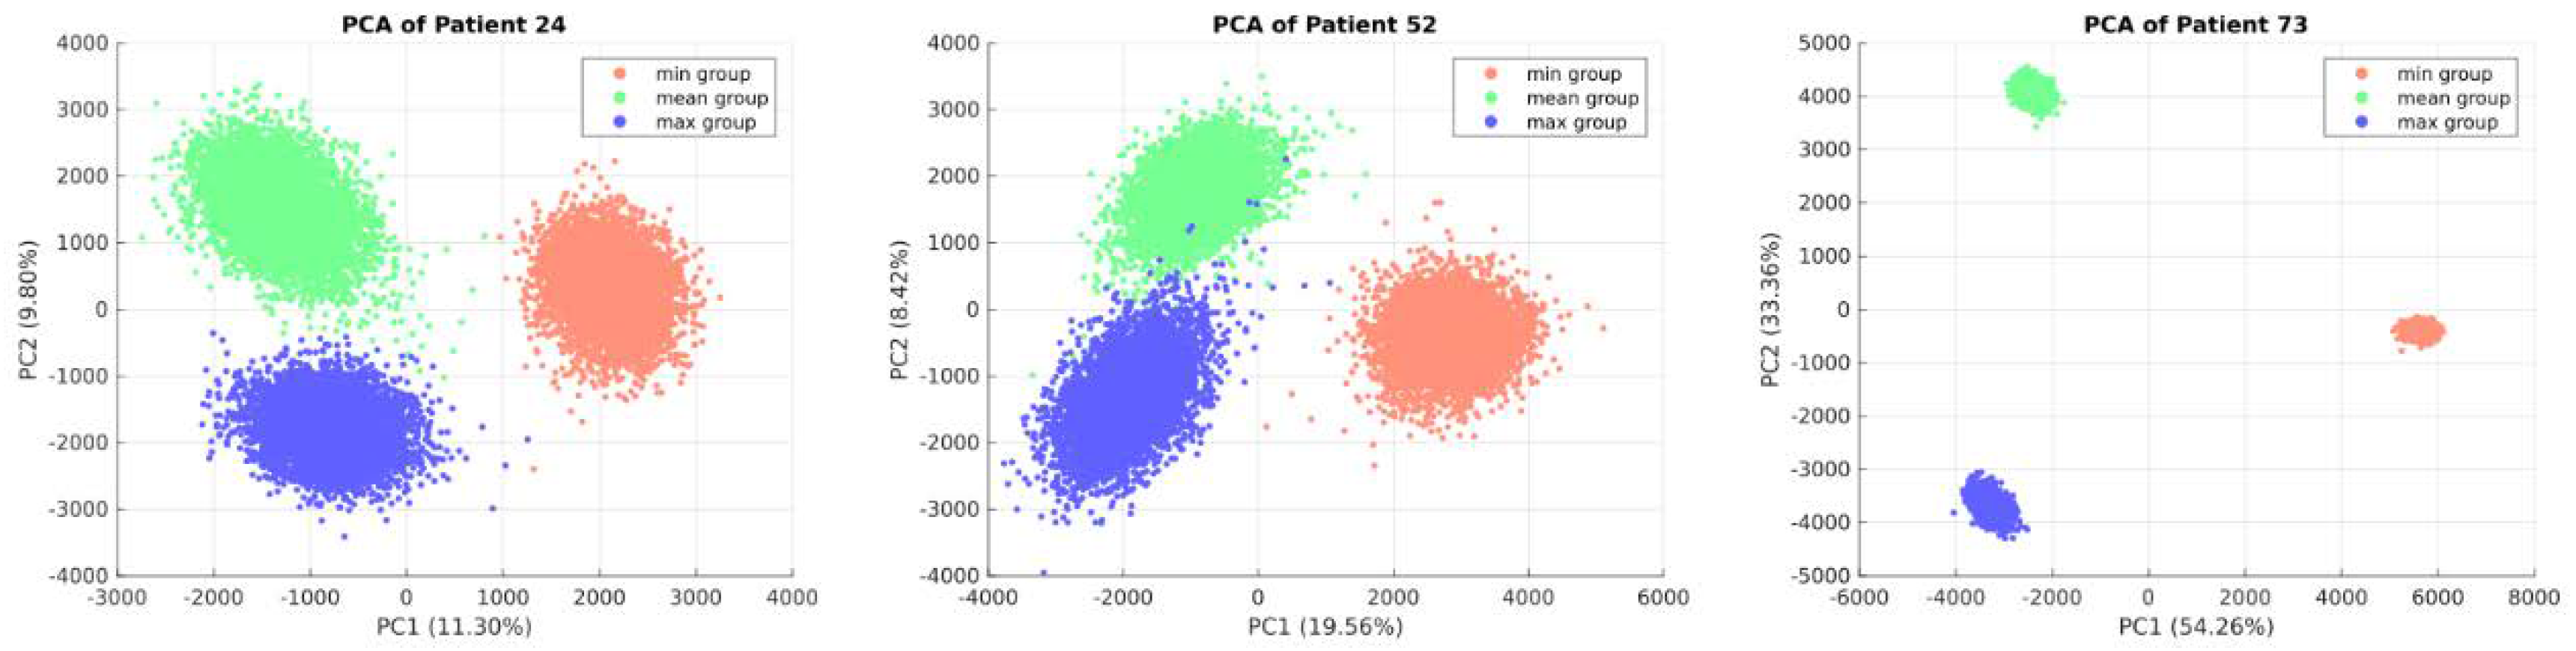
Figure 4.
Clustering analysis. a. Clustering analysis of the 190 task activities calculated for each patient-specific GEM. In the heatmap, red tones indicate overactivation, blue tones down activation and white inactivity. Patient-specific GEMs are represented by the columns and the metabolic tasks in the row. Trauma group A, B, C and D are represented by blue, green, pink and yellow respectively (heat map and trauma groups are interpreted in the same way in this figure). b. Clustering analysis performed on each trauma group individually and standardized by column. c. from left to right: I. Clustering analysis on all the patient-specific GEMs and the relevant metabolic tasks identified by the trauma group specific clustering analysis and five relevant column clusters ii. bar plot representing the proportion of each trauma group in each cluster.


Table 1.
Example of a symmetrical matrix when four valid solutions are given by the sampling. Here, the Euclidean distance is calculated between all the pairs (i.e. d12, d13, ...) and the overall distance for each solution is calculated by summing all the terms in the corresponding column.
Table 1.
Example of a symmetrical matrix when four valid solutions are given by the sampling. Here, the Euclidean distance is calculated between all the pairs (i.e. d12, d13, ...) and the overall distance for each solution is calculated by summing all the terms in the corresponding column.
| 1 | 2 | 3 | 4 | |
| 1 | 0 | |||
| 2 | 0 | |||
| 3 | 0 | |||
| 4 | 0 |
Disclaimer/Publisher’s Note: The statements, opinions and data contained in all publications are solely those of the individual author(s) and contributor(s) and not of MDPI and/or the editor(s). MDPI and/or the editor(s) disclaim responsibility for any injury to people or property resulting from any ideas, methods, instructions or products referred to in the content. |
© 2024 by the authors. Licensee MDPI, Basel, Switzerland. This article is an open access article distributed under the terms and conditions of the Creative Commons Attribution (CC BY) license (http://creativecommons.org/licenses/by/4.0/).
Copyright: This open access article is published under a Creative Commons CC BY 4.0 license, which permit the free download, distribution, and reuse, provided that the author and preprint are cited in any reuse.


