1. Introduction
Severe fever with thrombocytopenia syndrome (SFTS) is an emerging hemorrhagic fever caused by infection with the novel Bunyavirus (SFTSV). This zoonotic disease, primarily transmitted through tick bites, is characterized by high fever, leukopenia, and thrombocytopenia. Severe cases can lead to multi-organ failure, hemorrhage, and death. [
1,
2,
3] Since its initial identification in 2009, the number of reported cases has been increasing annually, with a notable prevalence in Asian regions including China, Japan, and Korea. [
4,
5,
6,
7] The disease predominantly occurs from April to October, with a peak incidence from May to July. [
8] In endemic areas, such as northeastern China and the rural mountainous and hilly regions of central and eastern China, [
9] the infection rate of this virus ranges 1% to 3%, with a fatality rate varying between 6% to 30% across different studies, averaging around 10%. [
1,
3,
7,
10,
11] Currently, SFTS has emerged as a significant public health concern. In 2017, the World Health Organization (WHO) listed SFTS among the global priority infectious diseases.
Early diagnosis of SFTS is crucial for improving patient outcomes and preventing disease transmission. Despite the availability of various PCR techniques for rapid diagnosis, [
12,
13] there are currently no specific drugs or effective vaccines targeting SFTSV. The primary treatment approach for SFTSV-infected patients remains symptomatic supportive care and broad-spectrum antiviral therapy. [
14,
15] Therefore, the treatment of SFTS patients remains challenging. Timely intervention before the disease progresses to its acute phase can effectively control its progression. Therefore, early diagnosis of severe patients is essential, enabling clinical teams to respond quickly, intervene, seize the optimal treatment window, enhance patient outcomes, and reduce mortality. Additionally, the incomplete understanding of SFTS pathogenesis significantly hinders the development of effective treatments and preventive measures.
Viral infections possess the ability to reprogram host metabolism, creating an environment that facilitates their replication and survival. [
16,
17] Changes in serum metabolites can serve as indicator of systemic metabolic alterations driven by persistent viral replication. Metabolomics, a technique that captures comprehensive variations in small molecule metabolites within biological fluids, cells, and tissues, is regarded as the omics approach most directly linked to disease phenotypes. [
18] In recent years, the analysis of host serum metabolomics has emerged as a promising tool for elucidating host-virus interactions in vivo and identifying diagnostic biomarkers. This methodology has already yielded significant insights into the pathogenesis of infections such as SARS-CoV-2 and Dengue virus (DENV). [
19,
20,
21] Several previous studies have investigated metabolite changes in hosts following SFTSV infection using metabolomics techniques. For example, Li et al. identified that disruptions in the arginine catabolism pathway were linked to platelet homeostasis and T-cell dysregulation following SFTSV infection. [
22] Zhang and colleagues observed disturbances in tryptophan and phenylalanine metabolism in the urine of SFTSV-infected patient. [
23] However, research on metabolic alterations in SFTS patients is still limited. Moreover, metabolic disorders during disease progression form a dynamically evolving network, and studies examining the metabolic status throughout the course of SFTS are particularly scarce. Consequently, further investigation into the metabolic changes in SFTS patients, including the precise characterization of the subtle differences and dynamic trajectories, is essential for elucidating disease mechanisms and developing potential therapeutic strategies.
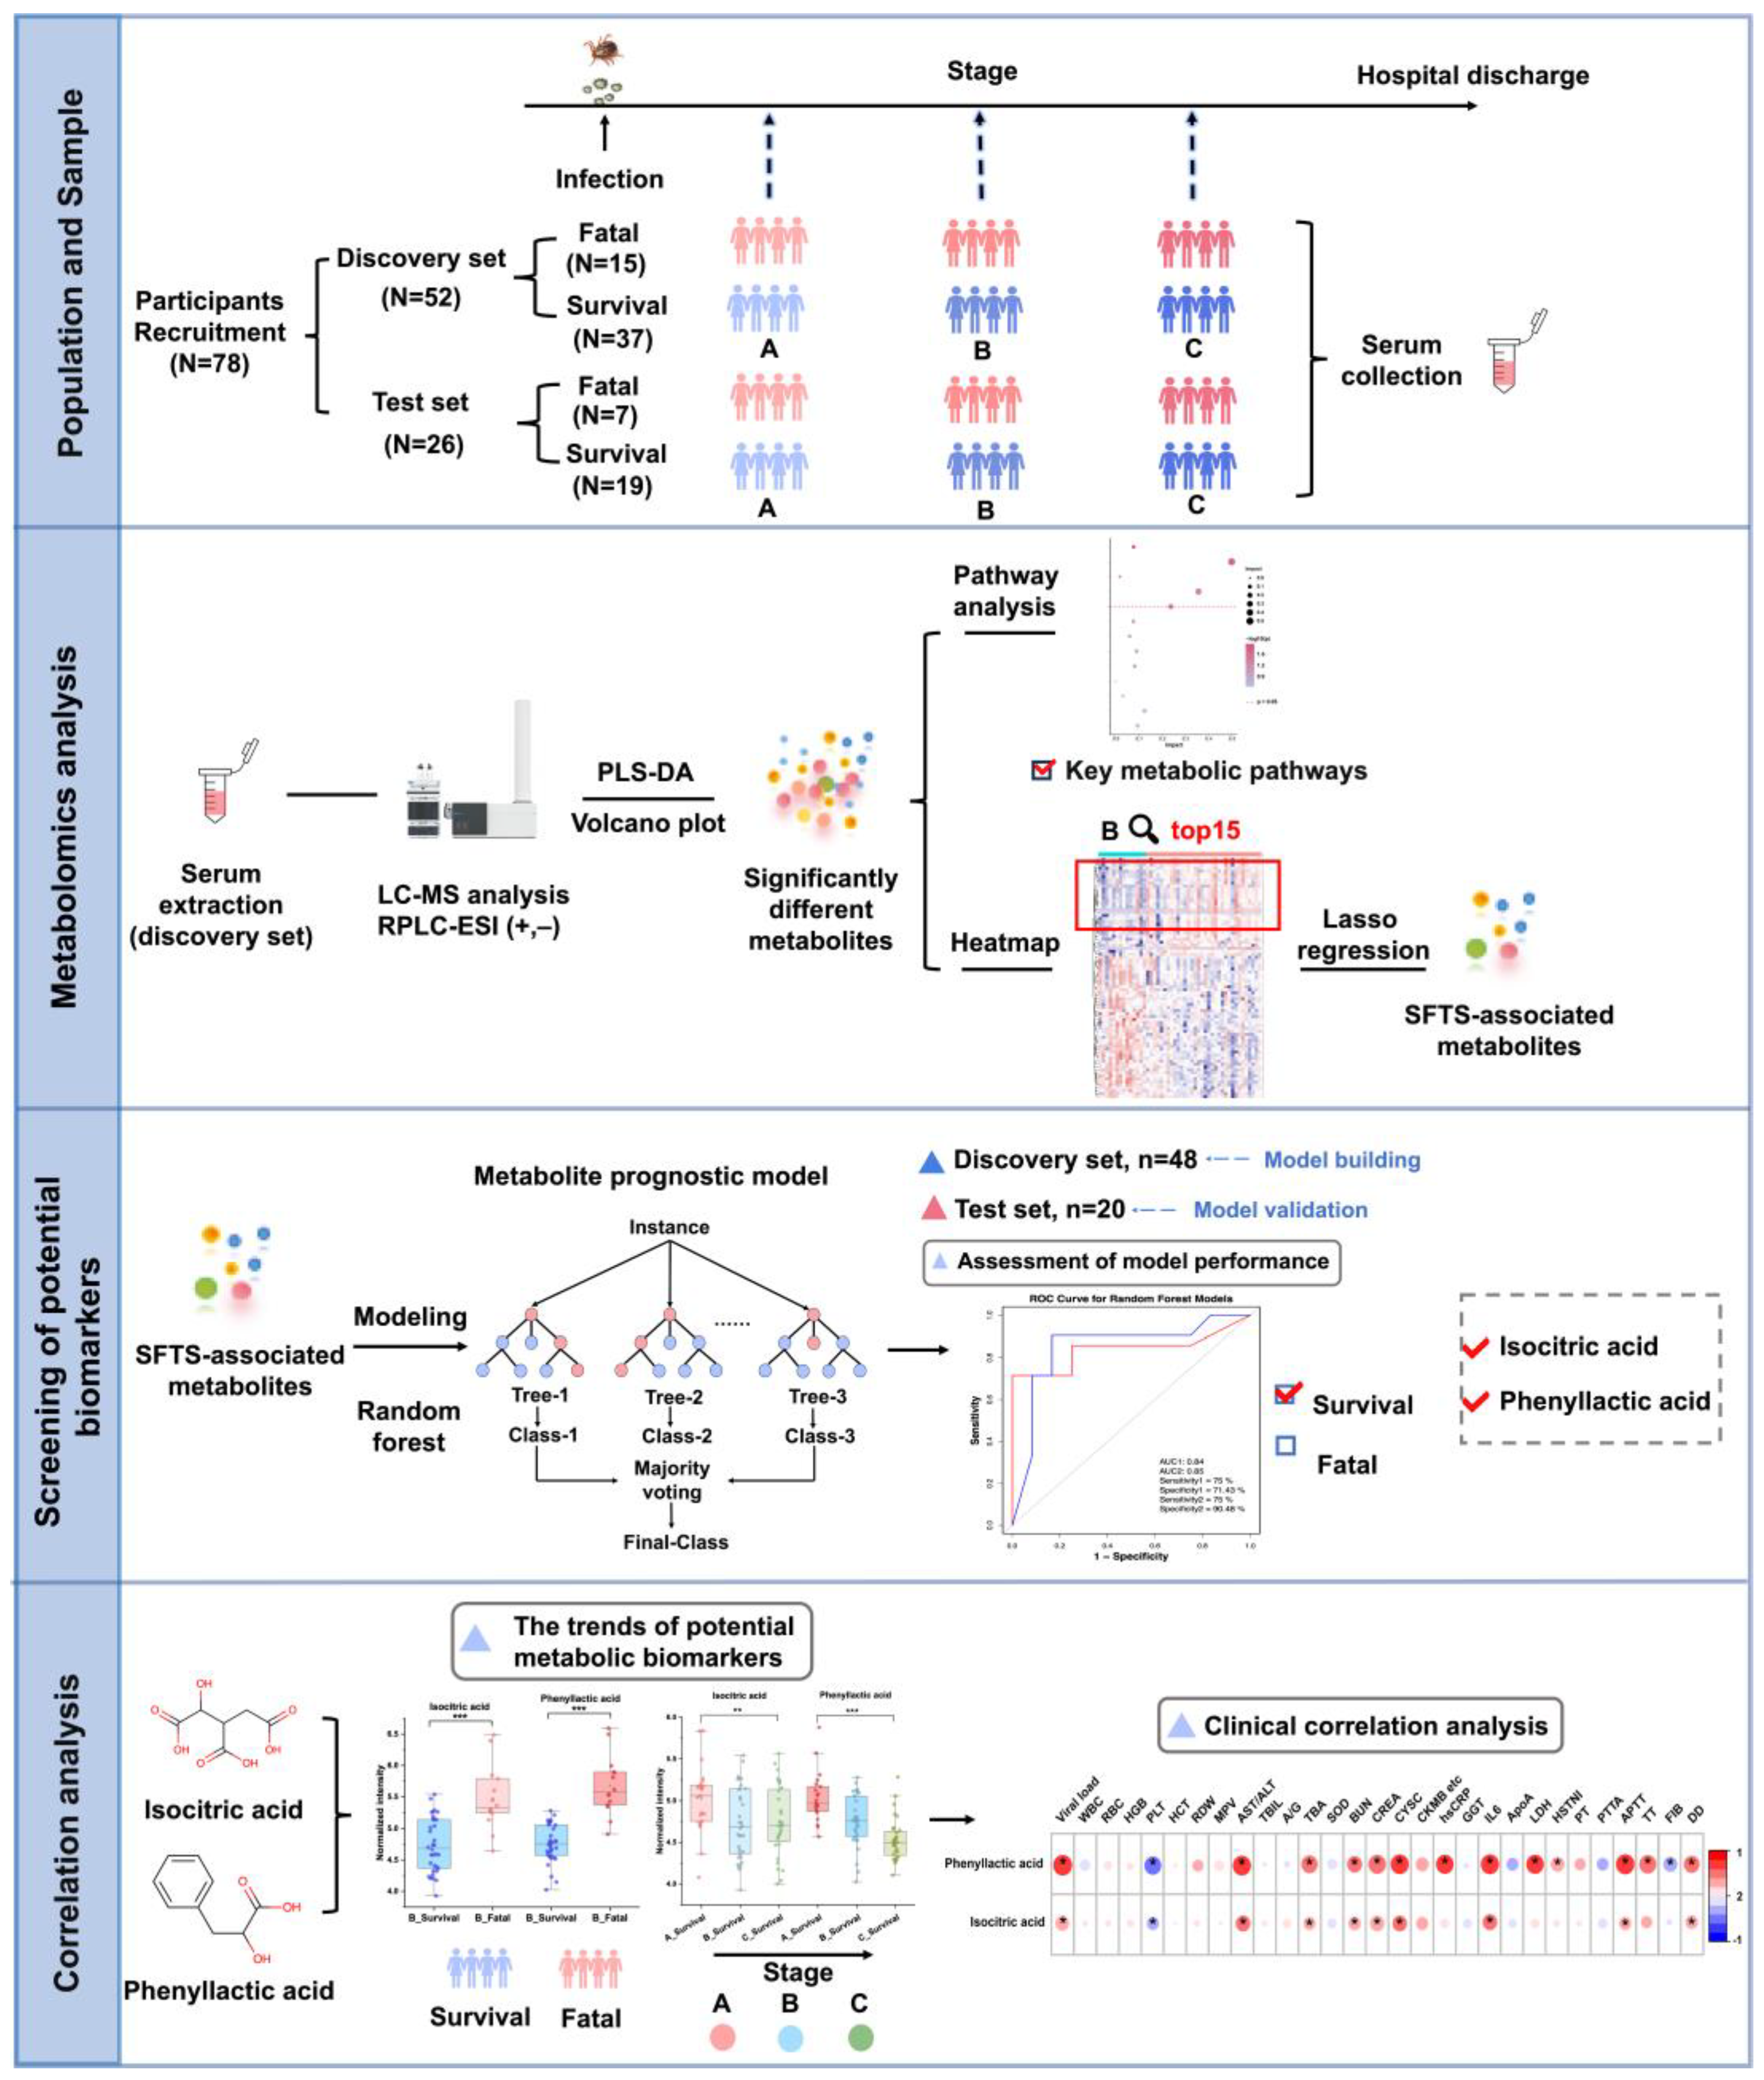
In this study, we utilized a liquid chromatography-mass spectrometry (LC-MS)-based untargeted metabolomics approach to analyze serum samples from 78 SFTS patients (discovery set: 52 patients, test set: 26 patients) at multiple time points from admission to discharge, as depicted in
Figure 1. Our primary objective was to comprehensively characterize the metabolic alterations in SFTSV-infected patients throughout the entire disease course. To achieve this, we applied tow grouping strategies. First, we categorized the patients into survival and fatal groups based on their final outcomes. By comparing the serum metabolite profiles between these groups, we aimed to unveil the impact of SFTSV on host metabolism, identify abnormal metabolic pathways and significantly altered metabolites, and explore the potential pathogenic mechanisms of the virus. These findings were used to develop a metabolic prognostic model to aid clinicians in the early diagnosis of severe cases and improve patient outcomes. Second, we divided the population into three stages (stage A, B, C) based on three critical time points in disease progression, focusing on the temporal changes in metabolites. From a metabolomics standpoint, we delineated the metabolic features of SFTSV-infected patients as their condition evolved, examined the pathogenic characteristics of the virus, and offered novel insights into the infection process and pathogenic mechanisms of SFTSV.
2. Materials and Methods
2.1. Study Population Information
A total of 78 patients diagnosed with SFTS were enrolled at the Zhongnan Hospital of Wuhan University between June 2021 and October 2023. This cohort included 52 patients in the discovery set (17 fatal and 37 survival cases) and 26 patients in the test set (7 fatal and 19 survival cases). All patients met the diagnostic criteria for SFTS and were confirmed by RT-qPCR detection of SFTSV RNA.1 Clinical data were retrospectively collected from medical records, following a standardized protocol. Clinical outcomes were followed up until February 28, 2024. The study received approval from the Medical Ehtics Commitee of Zhongnan Hospital of Wuhan University (approval number:2024046K). All procedures involving human participants adhered to the principles outlined in the Declaration of Helsinki.
2.2. Chemicals and Reagents
Metabolite standards were purchased from Aladdin (Shanghai, China), Meryer (Shanghai, China), Energy Chemical Co. (Shanghai, China), J&K (Beijing, China). LC-MS grade formic acid was obtained from Aladdin (Shanghai, China). LC-MS grade methanol (MeOH) and acetonitrile (ACN) were acquired from Merck (Darmstadt, Germany). Ultrapure water (H2O) was generated using a Milli-Q system (Millipore, Bedford, MA, USA).
2.3. Criteria for Staging Bunyavirus Patients
In accordance with the Diagnosis and Treatment Guidelines for Severe Fever with Thrombocytopenia Syndrome (2023 Edition) issued by the National Health Commission of the People’s Republic of China and the National Administration of Traditional Chinese Medicine, [
24] patients were classified to three clinical stages: the fever stage (A), the organ dysfunction stage (B) and convalescence stage (C). A total of 177 specimens were collected from 78 patients across these different clinic stages.
During the fever state (A), characterized by an acute onset, patients typically present with fever (body temperature ranging from 38 to 40°C), accompanied by symptoms such as fatigue, loss of appetite, nausea, vomiting. Some cases may also exhibit muscle pain and diarrhea, while a few individuals may display apathy. Physical examination often reveals enlarged, tender superficial lymph node, particularly in the unilateral groin, neck, and armpit area. In more severe cases, these lymph nodes may show marked local redness, swelling, warmth, and pain.
In the stage of multiple organ dysfunction (B), patients may exhibit persistent fever, multiple organ dysfunction, extreme fatigue, and worsening gastrointestinal symptoms. In some instances, this stage may also be characterized by involuntary shaking of the jaw and limbs along with increased muscle tone. Severe cases may manifest as skin ecchymosis, gastrointestinal bleeding, pulmonary hemorrhage, irritability, delirium, convulsions, and coma. Some patients may succumb to complications such as circulatory failure, respiratory failure, or hemorrhage.
During the convalescence stage (C), patients’ body temperature returns to normal, clinical symptoms gradually subside, and recovery typically occurs with approximately 2 weeks. However, the course of the course of SFTS may be prolonged in patients with complications.
2.4. Serum Sample Collection and Preparation
The leftover blood samples were collected from patients at admission, during treatment, and before discharge. Serum samples were obtained after centrifugation at 1600×g for 10 minutes. The serum samples were divided into aliquoted and preserved at −80 °C for subsequent analysis.
Each serum sample (100 µL) was mixed with 400 µL of pre-chilled methanol (MeOH) for extraction and protein precipitation. The mixture was vortexed for 60 seconds, followed by incubation at −20 °C for 20 minutes. Subsequently, the samples were centrifuged at 10,000×g for 20 minutes at −4 °C. The supernatant was collected, dried under nitrogen, and dissolved in a mixture of 20 µL of internal standard (N-acyl glycine (C2–C23) standards), [
25] and 130 µL of H2O. The mixture was vortexed for 3 minutes, and then centrifuged at 10000×g for 10 minutes for LC-MS analysis. Blank samples were also processed, replacing serum with 100 µL of H2O and following the same procedure.
To evaluate analytical precision, quality control (QC) samples were generated by combining equal volumes (30 µL) from each serum sample. Serum samples were analyzed in a randomized sequence, with QC samples injected every 10 runs throughout the experiment to monitor and ensure data accuracy and consistency.
2.5. LC-MS Analysis
Serum samples were analyzed using an ultra-high performance liquid chromatography-quadrupole time-of-flight (UHPLC-Q-TOF) mass spectrometry system. The system consisted of an Agilent 1290 Infinity II liquid chromatography system, coupled with an Agilent 6546 Q-TOF mass spectrometer (Agilent Technologies, Palo Alto, CA, USA), equipped with an Agilent Jet Stream electrospray ionization (ESI, Turbo Ionspray) source. For liquid chromatography separation, an ACQUITY UPLCⓇ HSS T3 column (2.1 × 100 mm, 1.8 μm) was employed. The flow rate of mobile phase was maintained at 0.4 mL/min, and the column temperature was set at 40°C. The mobile phase included 0.1% formic acid in water (v/v, solvent A) and 0.1% formic acid in ACN (v/v, solvent B) for both positive and negative ion mode analyses. The gradient program was as follows: 0-1 min, 2% B; 1-23 min, 2-98% B; 23-25 min, 98% B; 25-25.1 min, 98-2% B; 25.1-30 min, 2% B.
Mass spectrometry analysis was performed in full scan mode, with the mass-to-charge ratio (m/z) range set from 50 to 1000. The acquisition rate was 2.5 spectra per second. The electrospray ionization (ESI) parameters were configured as follows: ion transfer tube temperature, 320°C; declustering potential, 120 V; spray voltage, 3500 V for positive ion mode and 3000 V for negative ion mode; sheath gas flow rate, 11 L/min; sheath gas temperature, 350°C; drying gas flow rate, 8 L/min; and nebulizer pressure, 35 psi.
For MS2 analysis, spectra of different metabolites were acquired using the auto-MS/MS mode. The MS scan rate was set at 3 spectra per second, while the MS/MS scan rate was 8 spectra per second. MS2 fragment ions were generated through collision-induced dissociation (CID), with collision energies of 10, 20, 30, and 45 eV. The intensity threshold was set to 10,000, with a maximum of 6 precursors analyzed per cycle. Dynamic exclusion was applied with a time of 0.2 minutes.
2.6. Data Processing
Raw data were acquired using Agilent 6546 MassHunter Workstation software (version 10.1, Agilent Technologies). And the resulting raw files (.d format) were converted to abf format using the ABF_Converter tool. Peak detection, deconvolution, alignment, blank subtraction, normalization, and additional processing were conducted with MS-DIAL software (version 4.70) to generate comprehensive feature lists. To refine the data, redundant ions, such as isotope peaks, adduct ions, duplicate peaks, and contaminant ions, were removed using the web-based MS-FLO tool. [
26]
To eliminate metabolites with a high proportion of missing values, the 80% rule was applied, retaining only metabolites present in at least 80% of the samples. Missing values were imputed using 1/5 of the minimum value observed among the remaining metabolites. [
27] For metabolites detected on multiple platforms, the one with the smallest relative standard deviation (RSD) in QC samples was retained. Additionally, only metabolites with an RSD below 30% in QC samples were considered for further analysis. To approximate a normal distribution, logarithmic transformation was applied to the data prior to statistical analysis
Metabolite annotation was performed using MS2 spectra acquired in auto-MS/MS mode. The annotation process utilized the Global Natural Products Social Molecular Networking (GNPS,
https://gnps.ucsd.edu/ProteoSAFe/static/gnps-splash.jsp) and SIRIUS 4.9.15 (
https://bio.informatik.uni-jena.de/sirius/). Significantly altered metabolites were annotated through standard confirmation, matching against public MS2 database, and MS/MS interpretation. Annotation levels were classified according to the Metabolomics Standards Initiative (MSI) guidelines. [
28,
29]
2.7. Statistical Analysis
Descriptive statistics were performed to analyze the demographic and clinical characteristics of the study population. Comparisons between the survival and fatal groups were conducted using chi-square tests for categorical variables and Wilcoxon rank-sum tests for continuous variables.
Multivariate statistical analyses, including principal component analysis (PCA) and partial least squares discriminant analysis (PLS-DA), were performed using SIMCA 14.1 (Umea, Sweden). Key classification variables were identified based on variable importance in projection (VIP) scores derived from the PLS-DA model. The reliability and accuracy of the PLS-DA model were assessed through 200 permutation tests.
Metabolic pathway analysis, single-factor analysis, and correlation analysis were performed using MetaboAnalyst 5.0 and IBM SPSS 20.0. Volcano plots and box plots were visualized using Origin software. Hierarchical clustering heatmaps, pathway analysis plots, and enrichment analysis plots were generated using R version 4.1.2 (R Foundation for Statistical Computing, Vienna, Austria). Lasso regression analysis was conducted in R to select metabolites for constructing a metabolic prognostic model, and model performance was assessed through receiver operating characteristic (ROC) curves plotted using the random forest algorithm.
The random forest model was developed using 20-fold cross-validation on the training set. To enhance interpretability and based on prior research, we selected five different machine learning models: logistic regression, ElasticNet linear regression, partial least squares discriminant analysis (PLS-DA), support vector machine (SVM), and random forest.21 Hyperparameter tuning and feature selection for each model were optimized using 20-fold cross-validation combined with a grid search approach. Model performance was measured by the area under the receiver operating characteristic curve (AUC). Upon optimization, the random forest model demonstrated the highest AUC within the cross-validated training dataset.
4. Discussion
Our study aims to analyze the impact of SFTSV on host metabolism from a metabolomics perspective, focusing on clinical outcomes and the progression of the disease. By comparing patients who succumbed to the disease with those who improved, we identified potential abnormal metabolic pathways. These pathways provide insights into the pathophysiological changes and mechanisms of SFTS, which could lead to the identification of potential therapeutic targets. Metabolites that exhibit significant changes during disease progression may reflect patient status and could be used to construct metabolic prognostic models for disease outcomes.
Metabolomics analysis of 52 SFTS patients revealed significant differences between the survival and fatal groups, identifying four key differential metabolic pathways: sphingolipid metabolism; the biosynthesis of phenylalanine, tyrosine, and tryptophan; primary bile acid biosynthesis; and phenylalanine metabolism, all of which experience severe metabolic disruptions.
Sphingolipid metabolism emerges as an important pathway in distinguishing between survival and fatal SFTS patients, especially given the significant decrease in sphingosine-1-phosphate (S1P) and notable increase in D-sphingosine observed in fatal cases. S1P is essential for regulating of vascular function,[
37] and its decreased levels may indicate a disruption in the balance of vascular homeostasis. Endothelial dysfunction induced by viral infection has been strongly linked to a higher risk of mortality, especially in patients experiencing severe hemorrhagic complications.[
38] The reduction of S1P in fatal cases suggests its involvement in a vicious cycle of endothelial dysfunction, a phenomenon also observed in diseases like sepsis and dengue fever.[
39] Additionally, the strong positive correlation (r = 0.68) between S1P and high-density lipoprotein (HDL) suggests that HDL levels may partially reflect S1P levels and disease status. Furthermore, in patients who eventually recovered, we observed a gradual rebound in S1P levels. Therefore, therapeutic strategies aimed at increasing circulating S1P levels or enhancing its signaling may represent new options for stabilizing patient conditions.
Phenylalanine metabolism is a critical metabolic pathway in SFTS disease. [
23] Our data indicate that levels of phenylalanine, phenylacetic acid, and hydroxyphenylacetic acid are significantly elevated in fatal cases, while they gradually decline in those who recover. Phenylalanine is primarily metabolized in the liver, and inflammation or liver dysfunction may reduce its metabolic rate, leading to elevated phenylalanine levels in the body. Clinical data support this hypothesis, as liver function in fatal cases was significantly worse than in those who recovered, and metabolites of phenylalanine showed significant correlations with liver function. Additionally, impaired liver function could hinder the conversion of phenylalanine to tyrosine, [
40] resulting in the accumulation of phenylacetic acid and hydroxyphenylacetic acid. Similar phenomena have been observed in other infectious diseases, such as COVID-19 and sepsis, where elevated phenylalanine levels are closely related to disease severity. [
41,
42] Thus, the phenylalanine metabolic pathway may be involved in SFTSV invasion and lethal mechanisms.
Bile acid metabolism pathways exhibit significant dysregulation in SFTS patients. Bile acids, essential steroid compounds synthesized by the liver, were found at higher concentrations in fatal cases compared to those who recovered (
Figure S2), with levels gradually decreasing as patients improved. The liver, as one of the primary sites for SFTSV replication, [
43] becomes impaired, leading to disruptions in bile secretion and excretion. Concurrently, systemic inflammation might damage the biliary system, causing cholestasis and elevated serum bile acid levels. The higher bile acid levels in fatal cases compared to those who recovered are associated with worsening liver dysfunction, supporting this hypothesis.
Previous literature has suggested that certain bile acids, such as chenodeoxycholic acid (CDCA), glycochenodeoxycholic acid (GCDCA), taurochendeoxycholic acid (TCDCA), and taurodeoxycholic acid (TDCA), are significantly elevated in survival cases and may exert protective effects by inhibiting inflammatory responses. [
44] However, our data differ from some studies, [
45,
46] showing that bile acids continue to increase in fatal cases, a phenomenon also observed in severe COVID-19 cases where elevated bile acids correlate with disease severity. We speculate that bile acids may have anti-inflammatory effects in the early stages of the disease, but as the disease progresses, damage to the liver and biliary system impedes normal bile metabolism, leading to bile acid accumulation in the blood and further exacerbating hepatocellular damage.
Receptors for bile acids, namely FXR and TGR5, have recently gained considerable attention in the scientific community. [
47,
48] FXR not only regulates metabolic balance and maintains gut barrier integrity but also directly modulates the immune system. [
49] Clinically, drugs like obeticholic acid (OCA) have been used to activate FXR, reducing bile acid synthesis and mitigating excessive immune responses. [
50] Controlling the abnormal elevation of bile acids might aid in the recovery of SFTS patients. The significant differences in bile acid levels among patients with different outcomes suggest that studying bile acid-related signaling pathways could provide new therapeutic targets for SFTS.
Lipid metabolism plays a crucial role in the progression of SFTS. Studies show that various lysophosphatidylcholines (LPCs) tend to decrease in fatal cases while gradually increasing in recovering patients; conversely, lysophosphatidylethanolamines (LPEs) rise in fatal cases and decrease in those who recover (
Figure S2). LPC, an important phospholipid derivative, is associated with the progression of various diseases, including sepsis and liver cirrhosis, and is closely linked to increased mortality risk. [
51,
52] LPE, on the other hand, tends to elevate in inflammatory, metabolic, and infectious diseases; LPC is primarily derived from phosphatidylcholine (PC), while PC derives from phosphatidylethanolamine (PE). [
53] Therefore, it is hypothesized that more PE is converted to LPE, resulting in decreased PC and consequently reduced LPC and increased LPE levels.
LPC plays a crucial role in combating viral infections by activating macrophages, promoting the phagocytosis of viral particles and infected cells, [
54] and exhibiting anti-platelet aggregation properties. Studies have shown that LPC regulates platelet aggregation via serum phospholipase and exhibits a dose-dependent inhibitory effect. [
55] This anti-platelet aggregation function is particularly important in SFTS patients. Previous literature has suggested that SFTS patients suffer from arginine deficiency, which affects the L-arginine/nitric oxide synthase/nitric oxide pathway in platelets, leading to their excessive activation and reduction. [
22] As LPC levels decrease, its anti-platelet aggregation effect weakens, making patients more susceptible to abnormal platelet activation due to arginine deficiency, potentially leading to adverse outcomes. In patients who show improvement, the rise in LPC levels may help restore this anti-platelet function. Therefore, supplementing LPC might represent a novel therapeutic strategy to improve the prognosis of SFTS patients.
The tryptophan metabolism pathway is closely implicated in the pathophysiology of SFTS. Prior studies have highlighted a significant elevation of kynurenine, a critical metabolite derived from tryptophan, in the urine of SFTS patients compared to healthy controls, with markedly higher concentrations observed in fatal cases relative to survivors. [
23] These changes may lead to excessive cytokine levels, potentially initiating a cytokine storm that increases the risk of mortality in patients. Our findings also demonstrate that serum kynurenine levels are significantly higher in fatal cases compared to those who recover, and longitudinal analysis shows that kynurenine levels gradually decrease in improving patients, consistent with disease stabilization. The variation in kynurenine levels may provide a potential biomarker for prognostic assessment in SFTS and further supports the critical role of the tryptophan metabolism pathway in disease progression and lethal mechanisms.
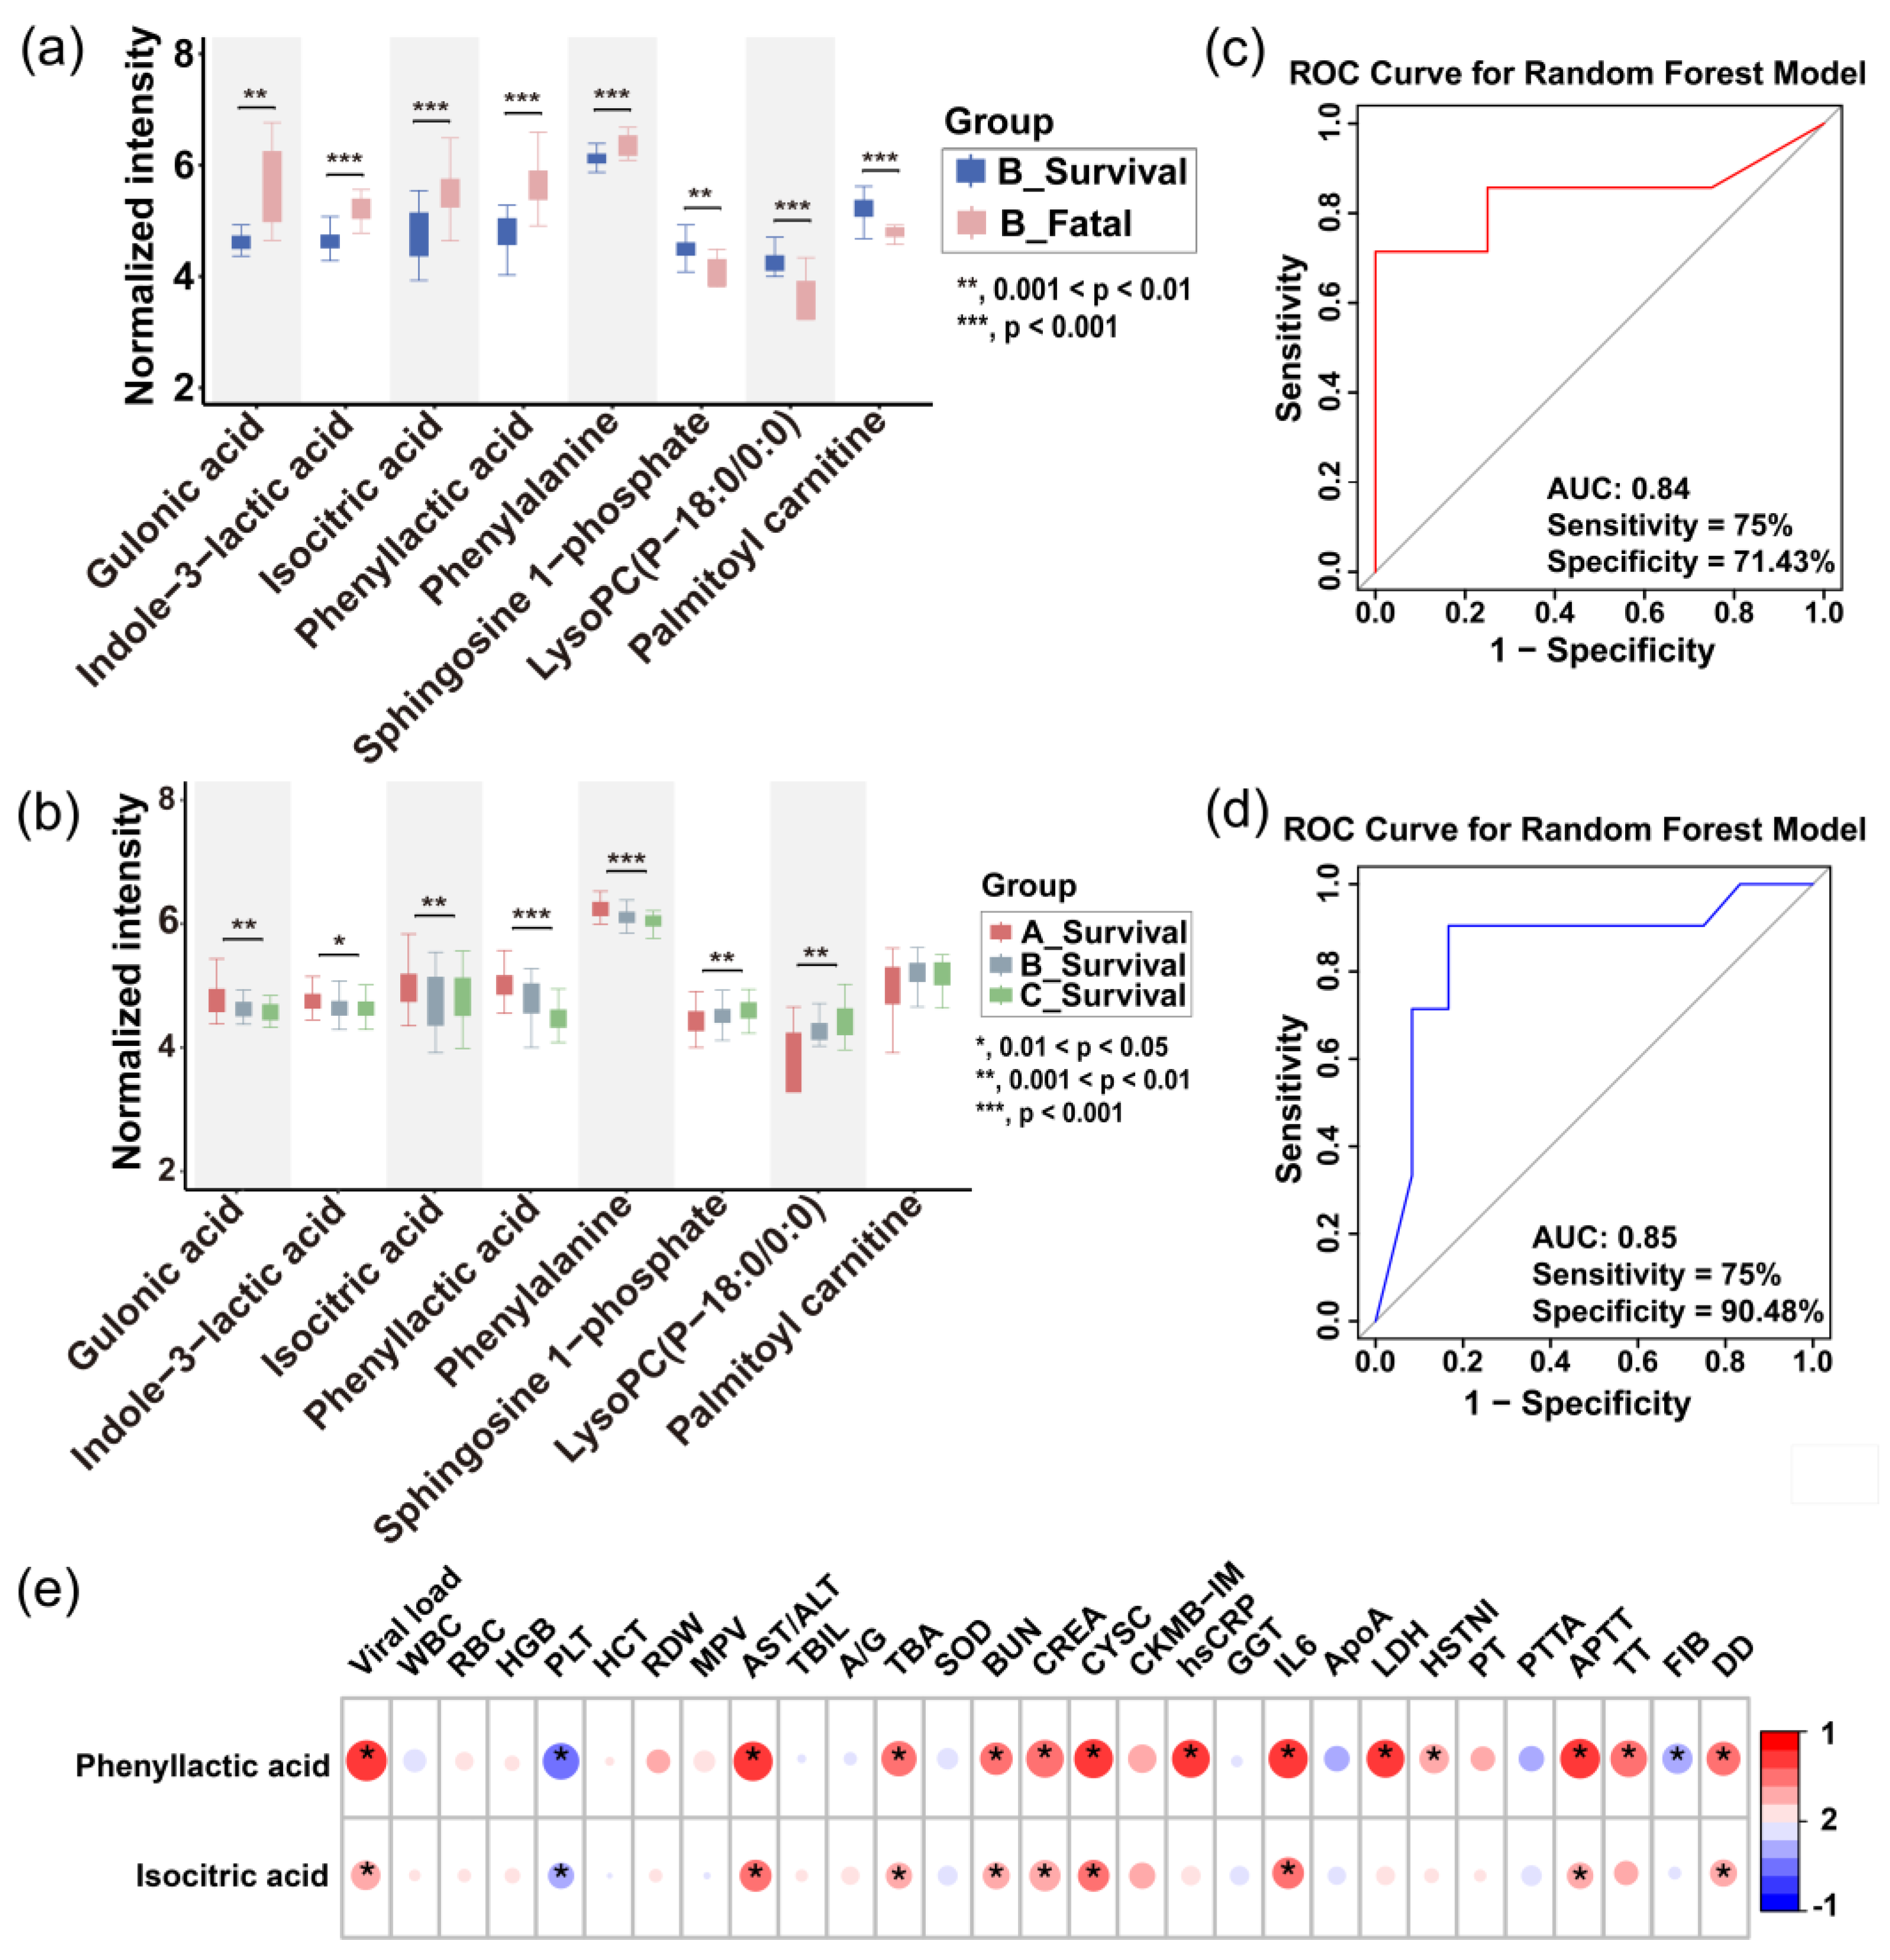
Based on significant differences in metabolite profiles, we developed a prognostic model for the severity of SFTS. Through rigorous screening, phenyllactic acid and isocitric acid were identified as key predictor metabolites, demonstrating an impressive area under the curve (AUC) of 0.85 in a random forest model applied to the test set. This model exhibited a sensitivity of 75% and specificity of 90% (
Figure 6c), surpassing other combination of metabolites. These two metabolites were found to exhibit abnormal elevation in SFTS patients, with a more pronounced effect observed in those who succumbed (
Figure 6a), indicating a close association with the metabolic state following viral infection. Due to their ease of detection and strong potential for clinical application, phenyllactic acid and isocitric acid serve as valuable references for early intervention and prognostic evaluation.
Figure 1.
Schematic overview of the study design. The study encompassed a total of 78 participants, divided into a discovery set of 52 individuals and a test set of 26 individuals. Patients were classified into three clinical stages (A, B, and C) according to disease progression, and non-targeted metabolomics analysis was performed on their serum samples. Metabolic profiles were compared between patients with survival and fatal outcomes to elucidate metabolic reprogramming in severe disease states and identify altered metabolic pathways. A metabolic prognostic model, incorporating phenyllactic acid and isocitric acid, was developed using machine learning techniques based on the discovery cohort data and subsequently validated in the test set. Longitudinal and cross-sectional trends of the prognostic metabolites were analyzed and correlated with clinical data.
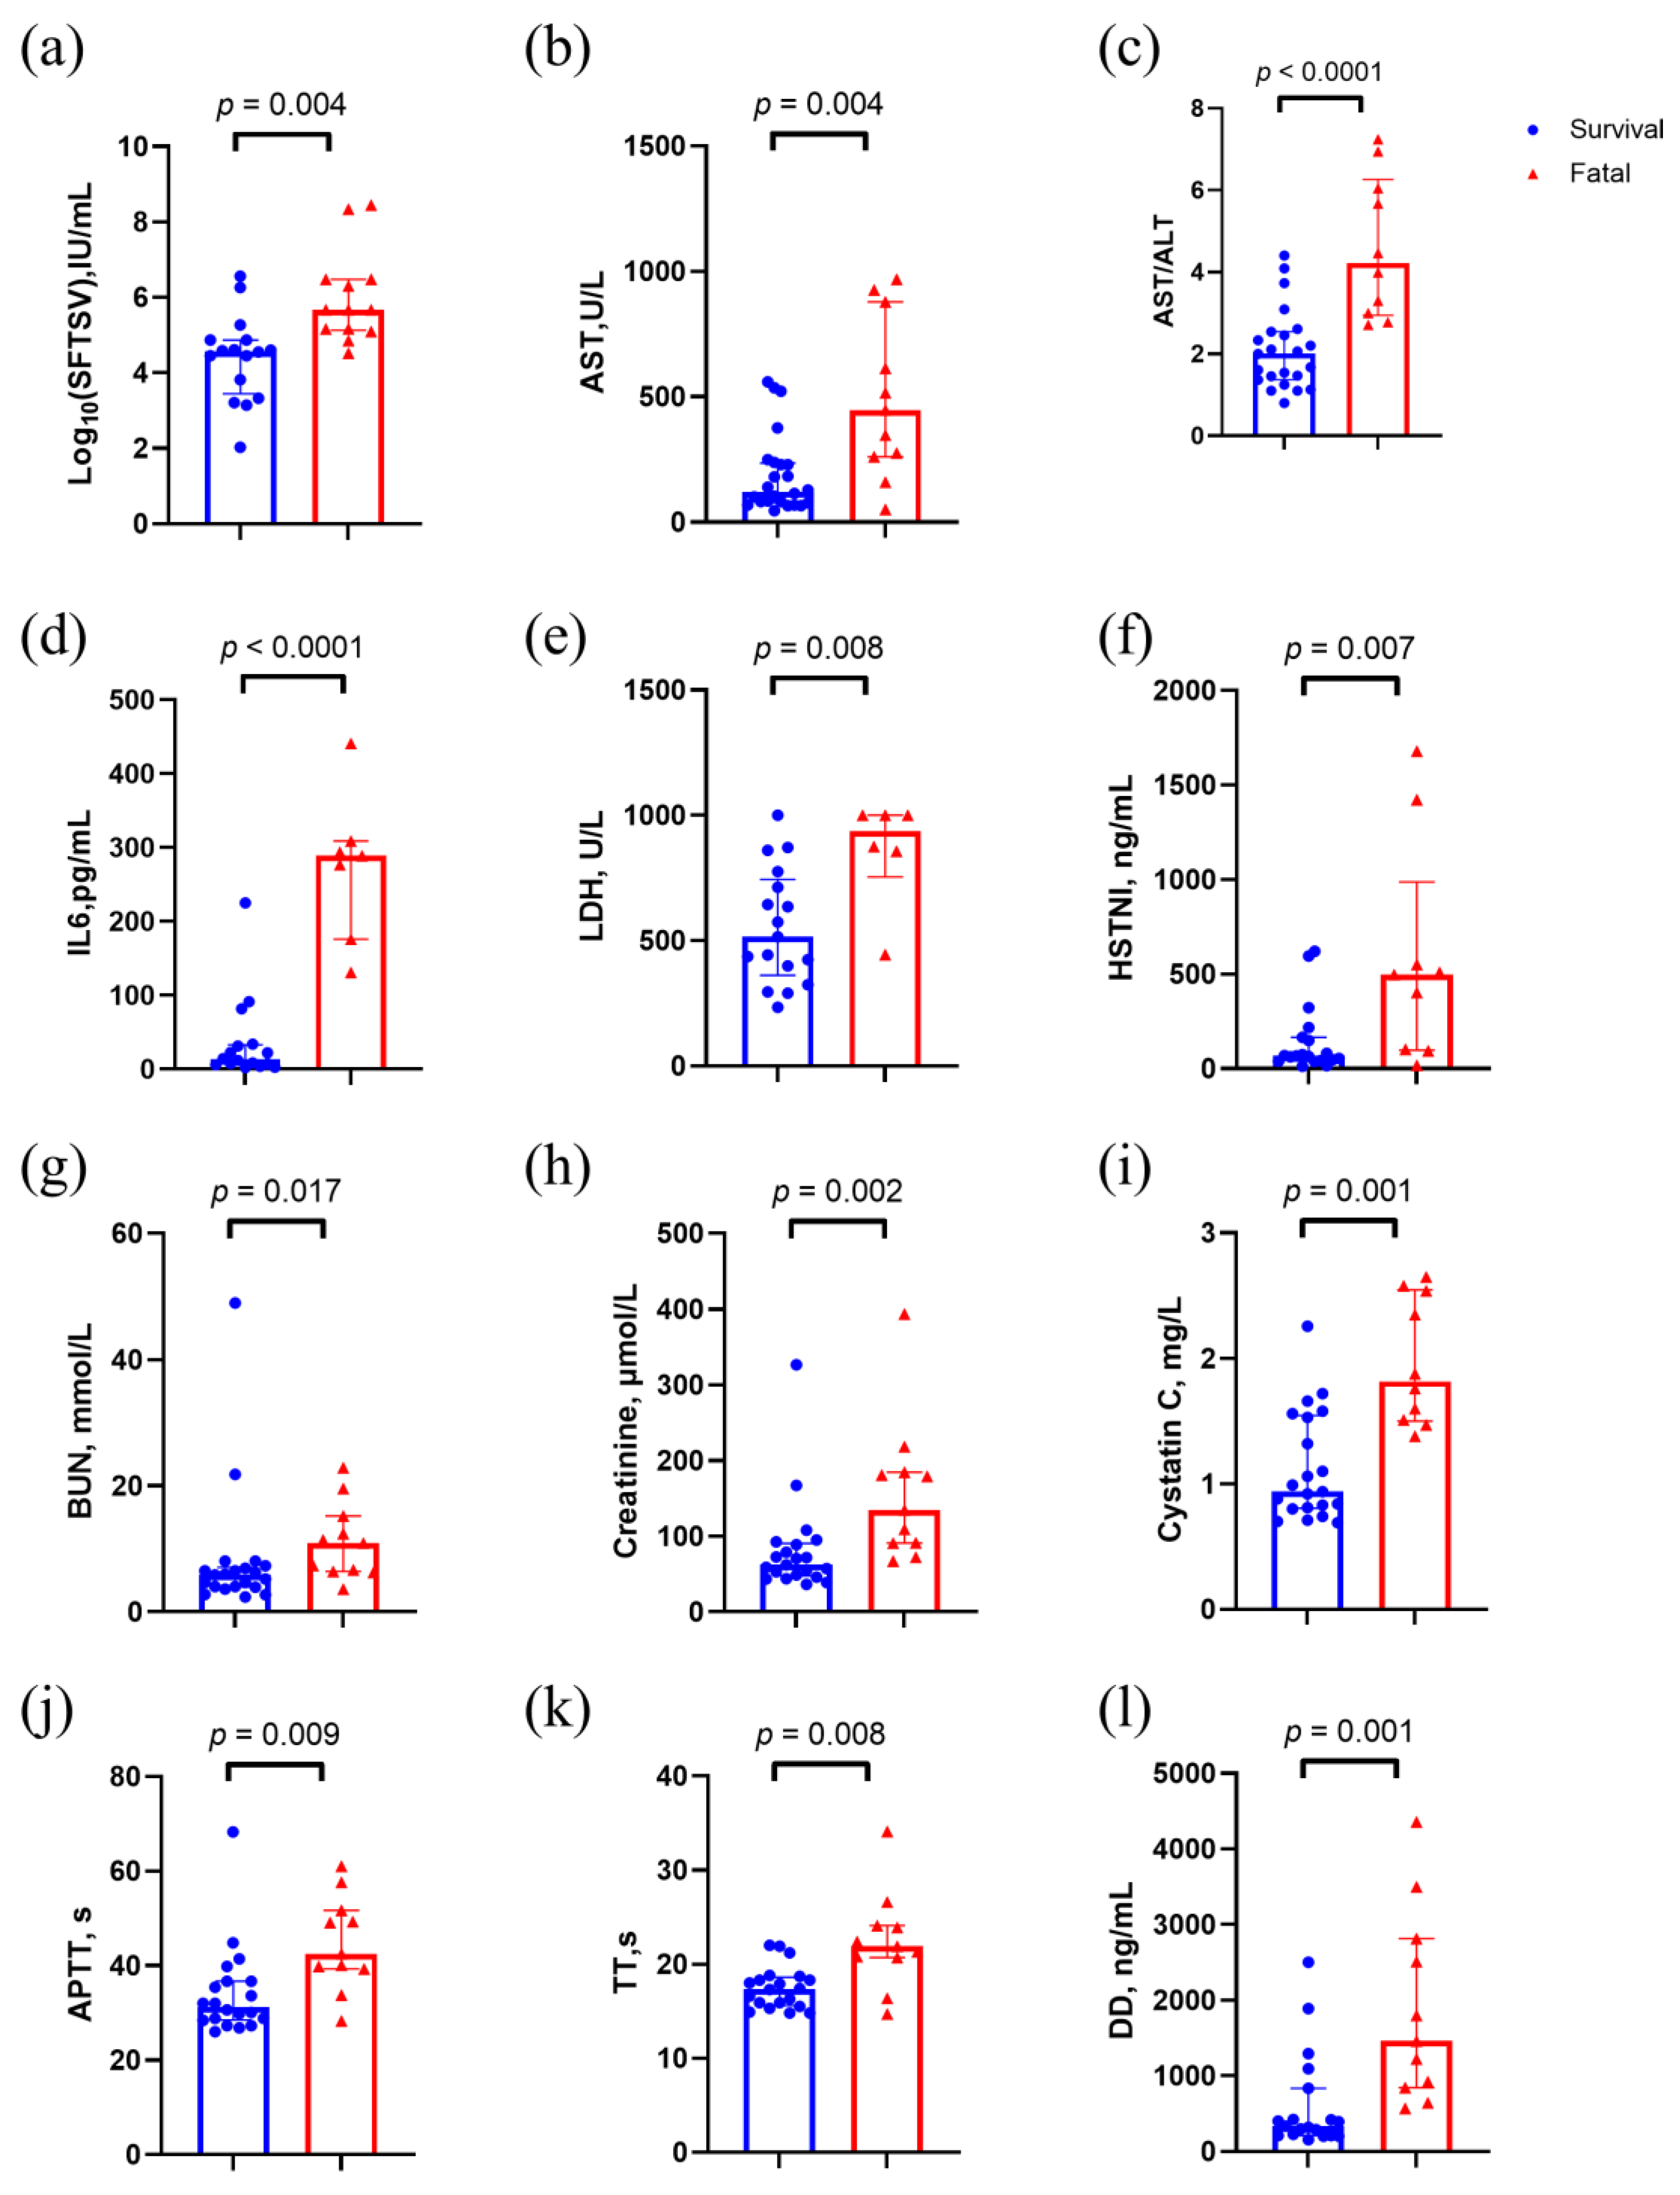
Figure 2.
Clinical characteristics of stage B patients in the discovery set. p values were calculated using two-sided Mann–Whitney U test. Abbreviations: AST, aspartate aminotransferase; ALT/AST, aspartate transaminase / alanine transaminase; APTT, activated partial thromboplastin time; BUN, Blood urea nitrogen; HSTNI, high-sensitivity troponin I; IL6, Interleukin-6; LDH, creatinine, lactate dehydrogenase; TT, thrombin time.
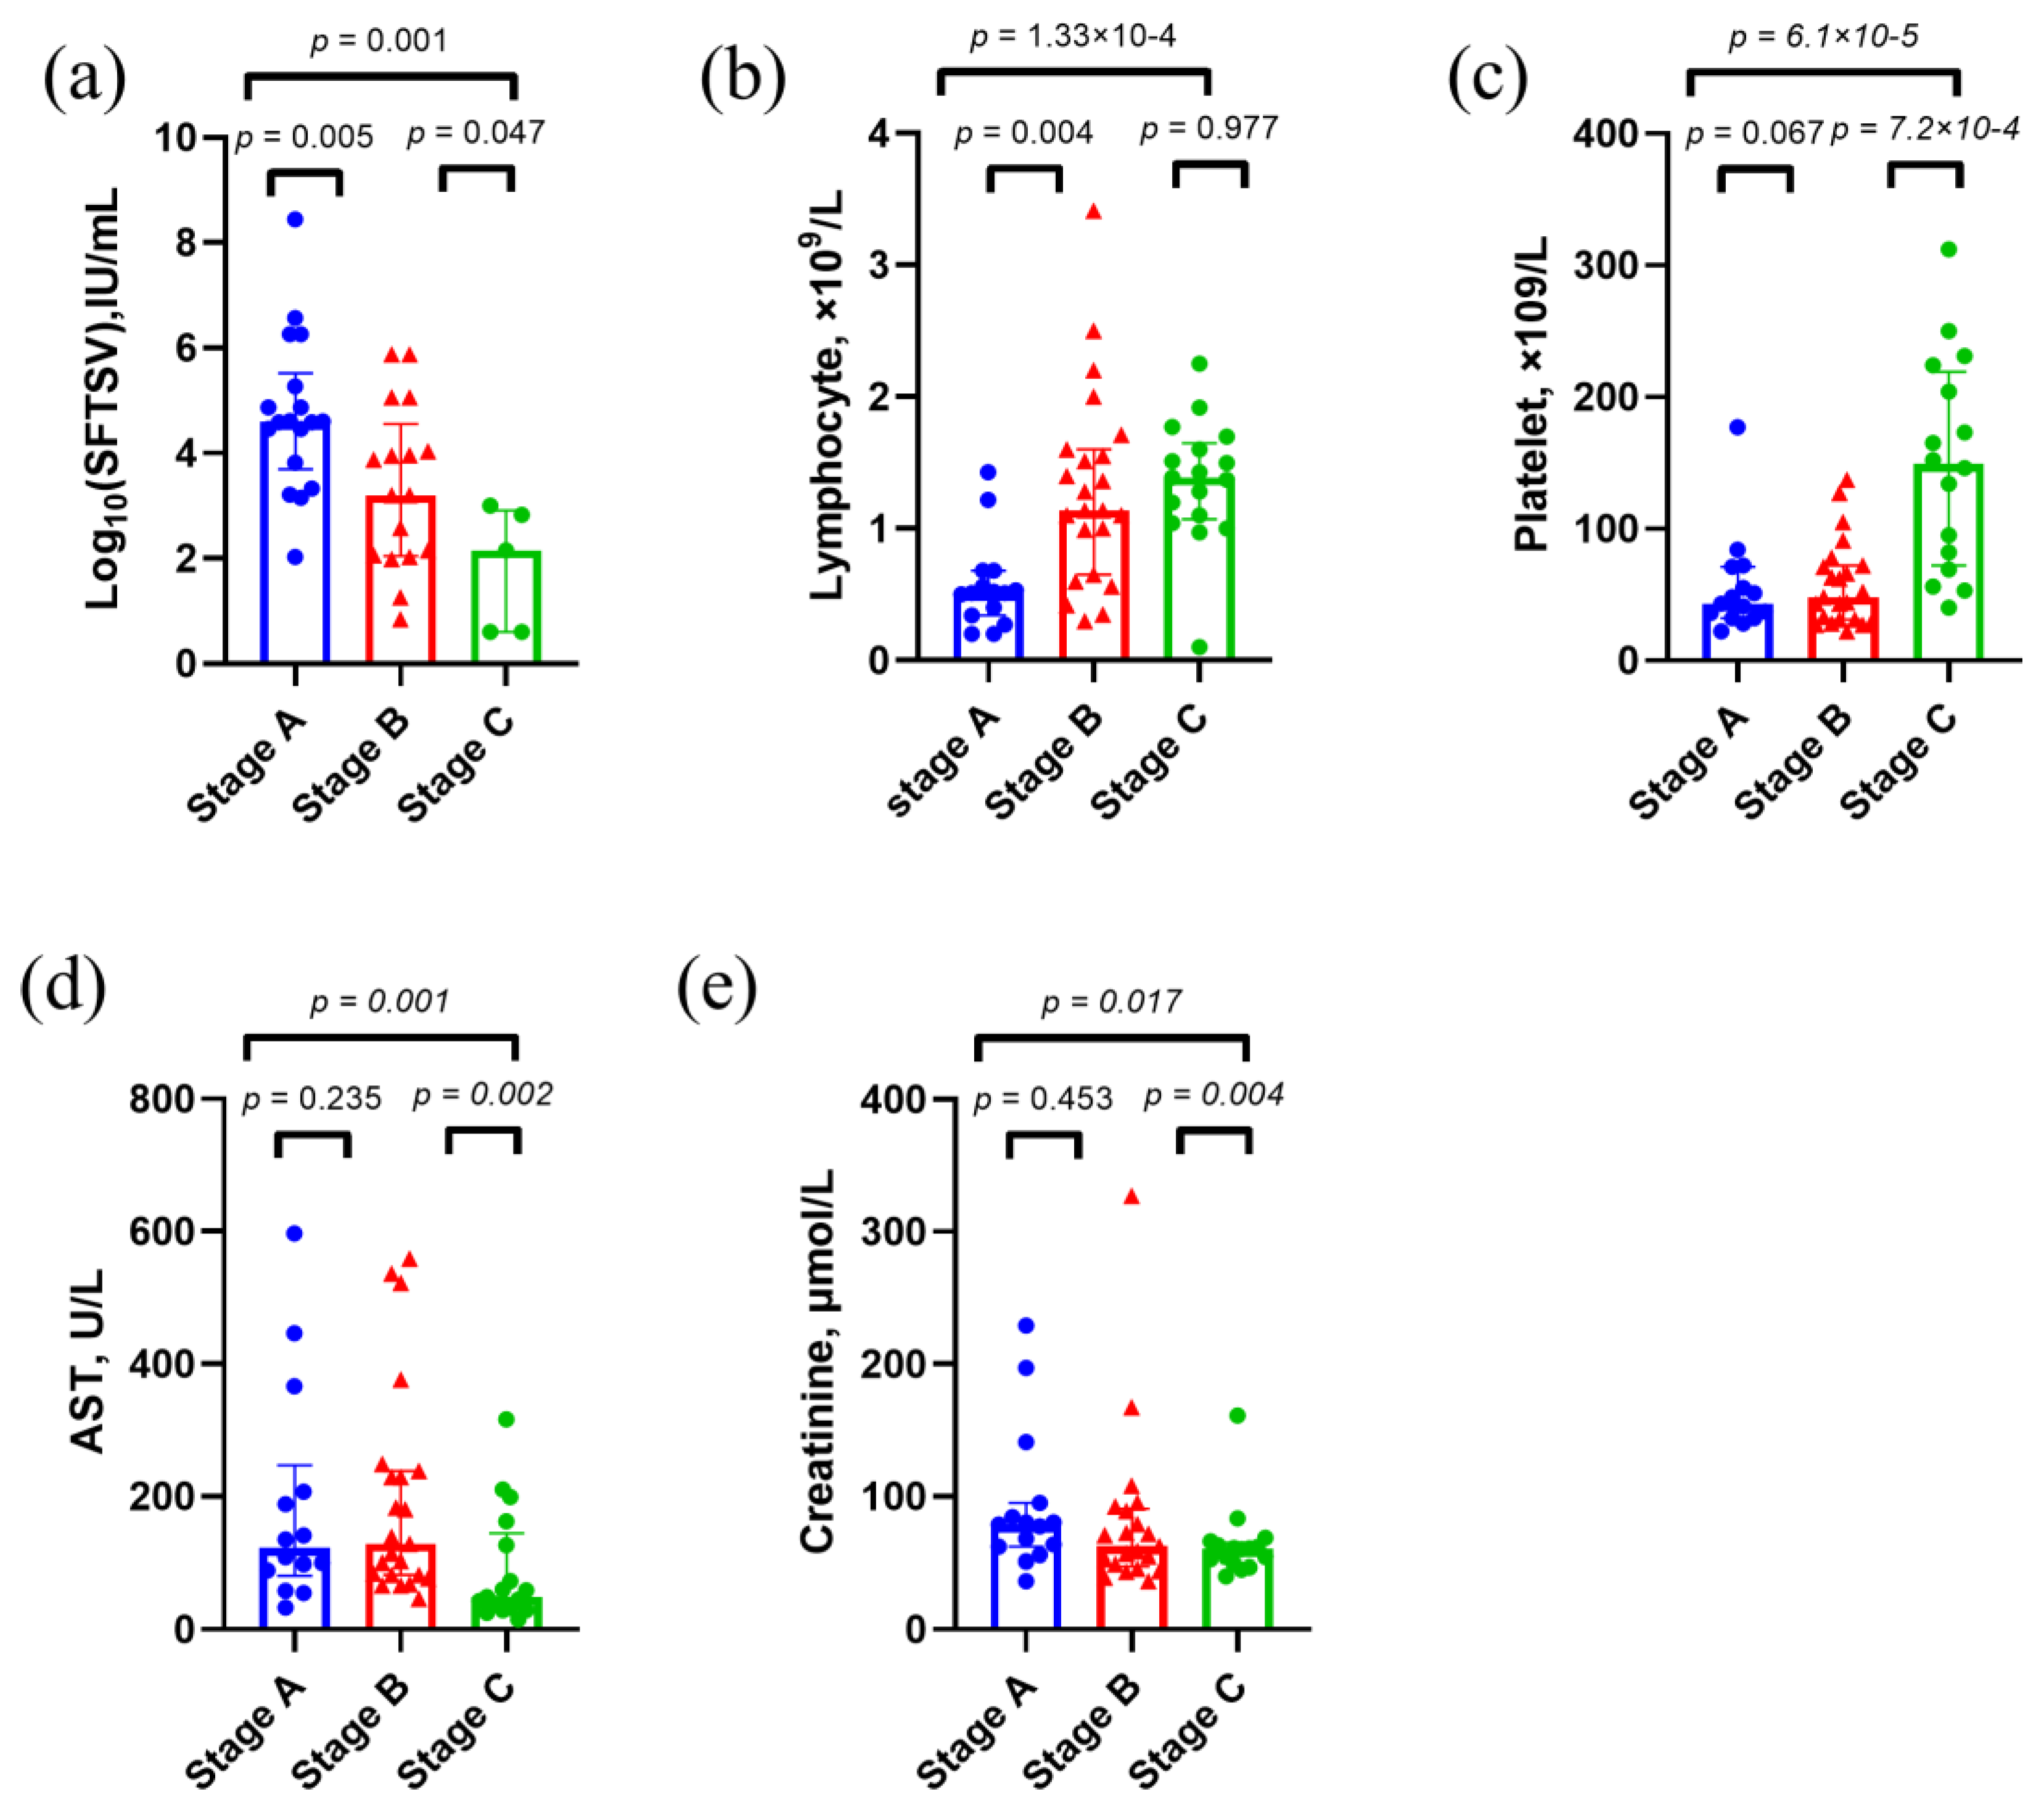
Figure 3.
Clinical characteristics of survival cases in the discovery set. p values were calculated using two-sided Mann–Whitney U test. Abbreviations: AST, aspartate aminotransferase.
Figure 3.
Clinical characteristics of survival cases in the discovery set. p values were calculated using two-sided Mann–Whitney U test. Abbreviations: AST, aspartate aminotransferase.
Figure 4.
Reprogrammed serum metabolic landscape of SFTS patients. Identification of differential serum metabolomic profiles in SFTS patients at stage A (blue), B (pink), and C (green) in the discovery set. PCA (a) and PLS-DA (b) analyses indicate grouping patterns. The tight clustering of QC samples (gray points) in both positive and negative ion modes confirm the accuracy and reliability of the data. (c) Heatmap of serum metabolites in the fatal and survival groups at stage A, B, and C. Red denotes higher concentrations, while purple signifies lower concentrations, with more pronounced metabolite differences evident at stage B compared to stage A, as highlighted by the red box. (d) The PLS-DA model of serum metabolomics data distinguishes between the fatal (teal) and survival (purple) groups at stage B. (e) A volcano plot of metabolites detected in the fatal and survival groups at stage B shows significantly different metabolites in red (upregulated) and blue (downregulated), while others are shown in gray.
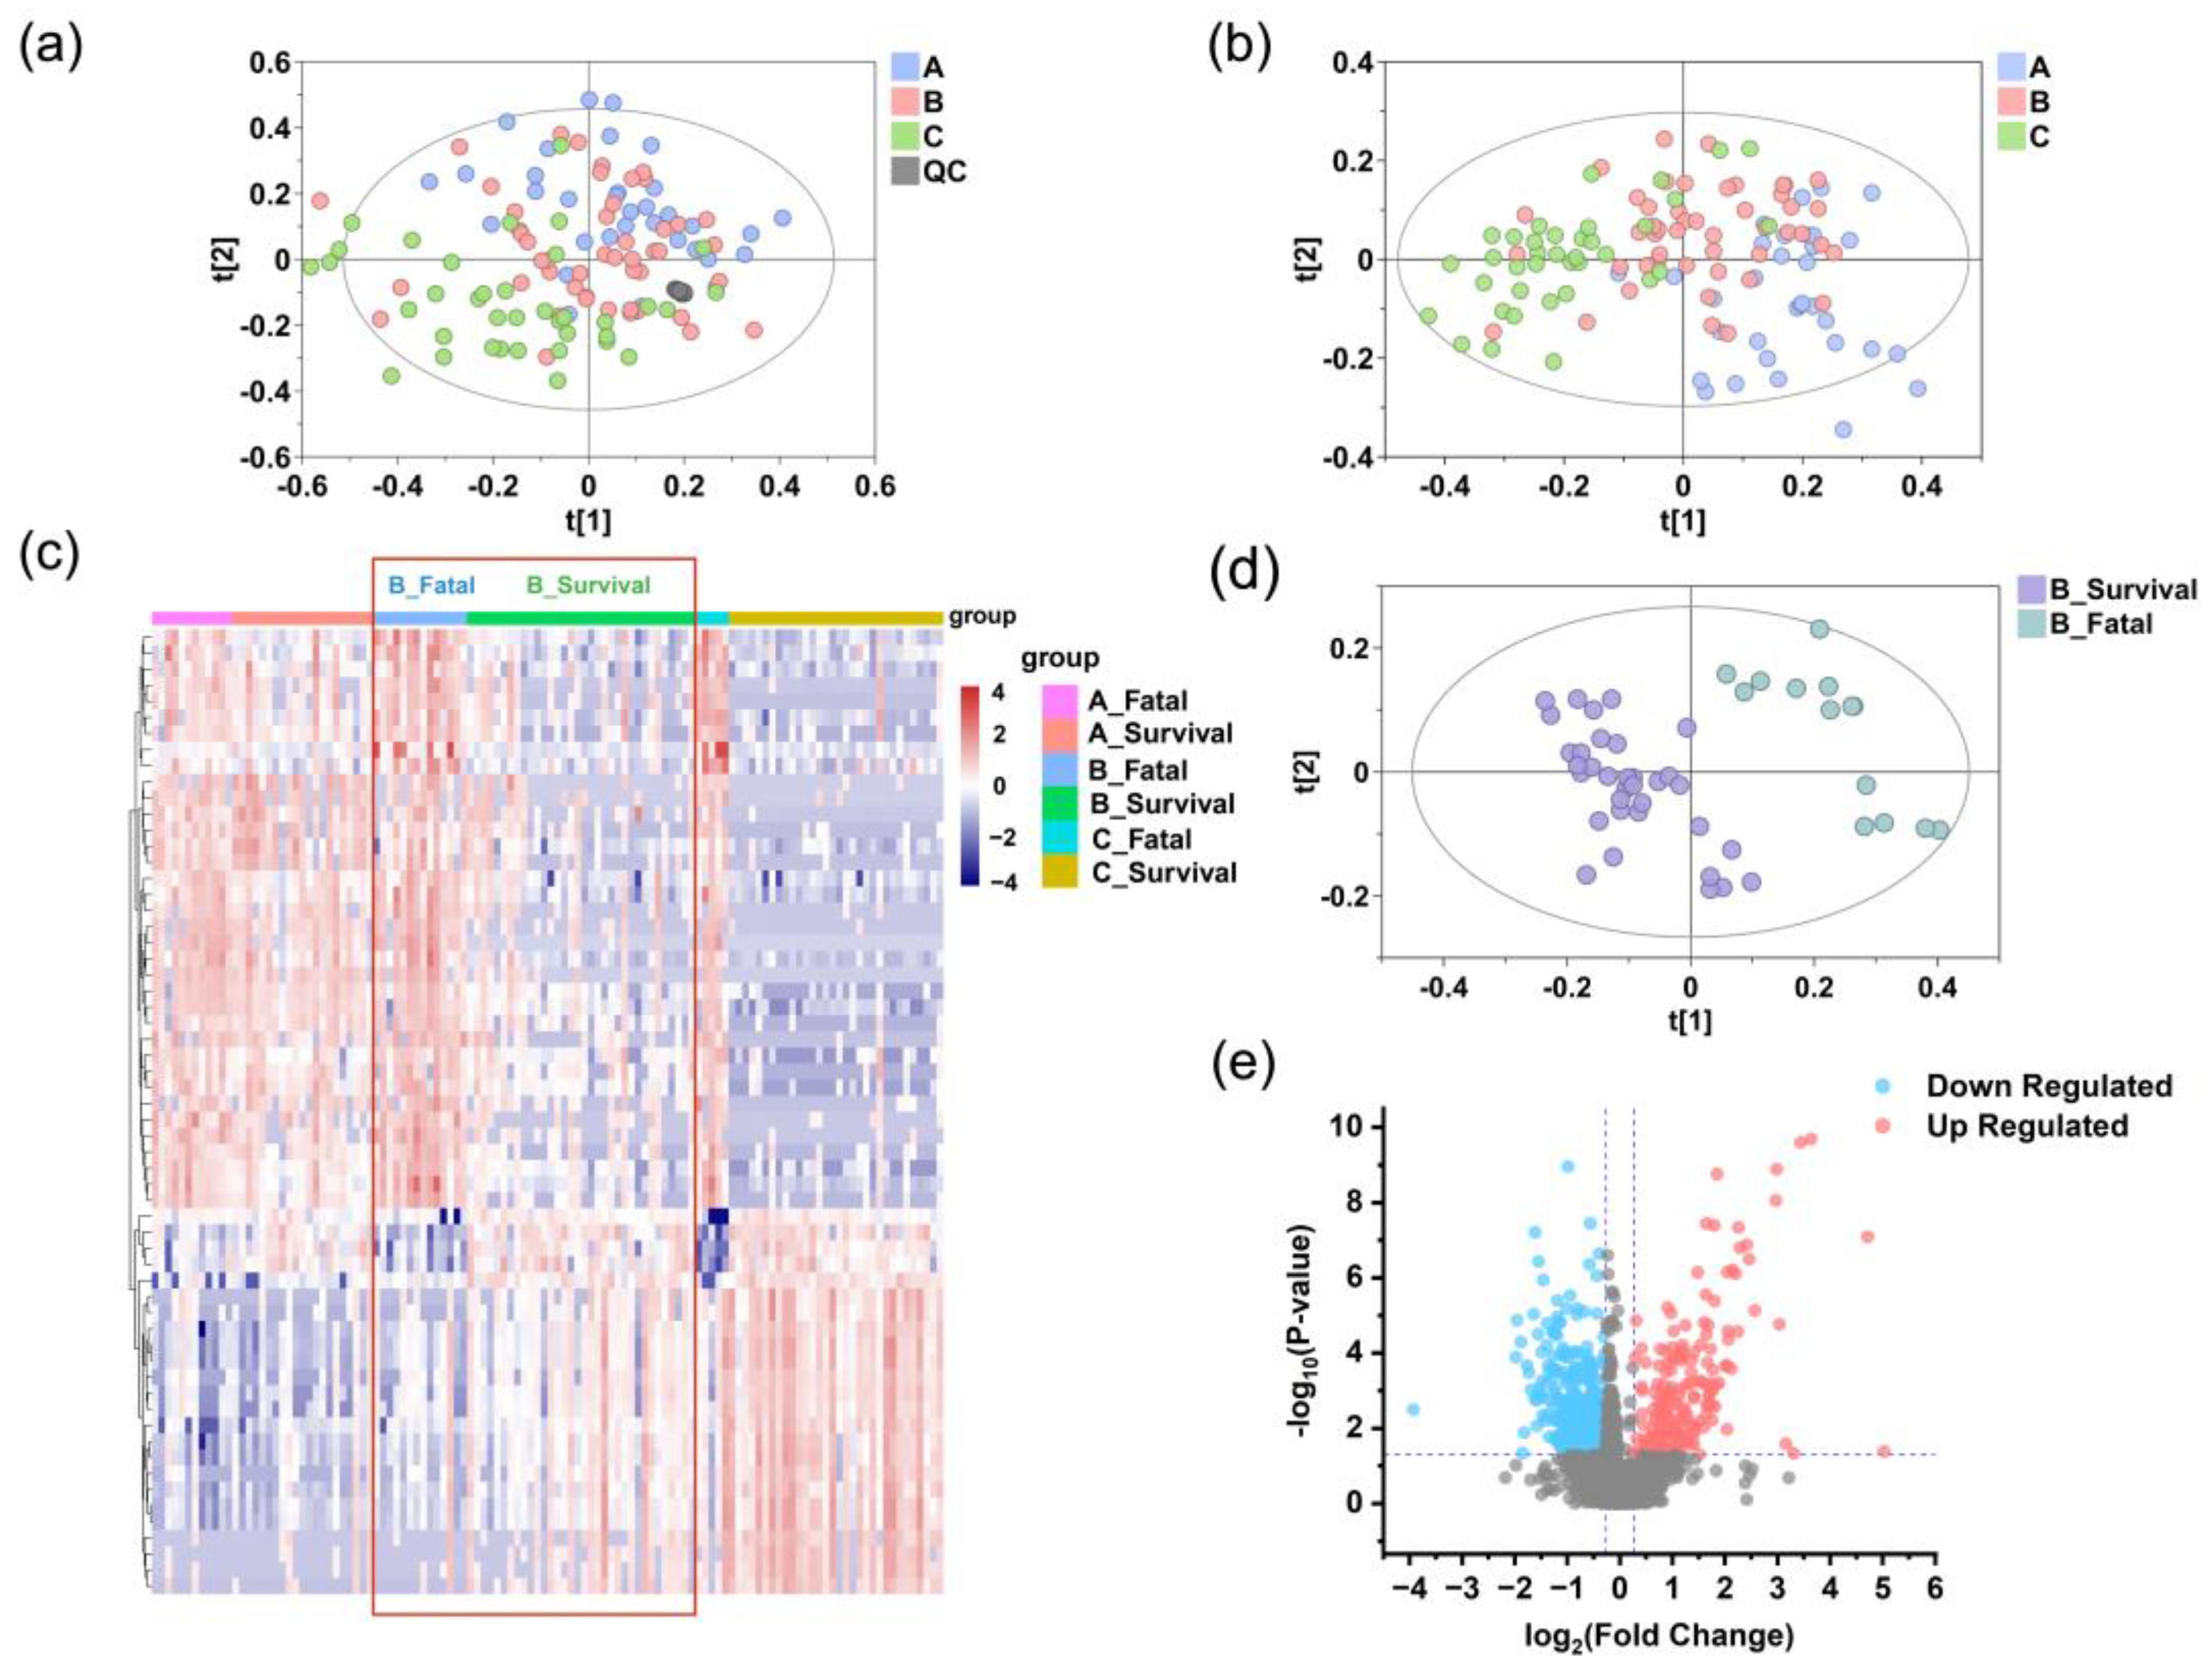
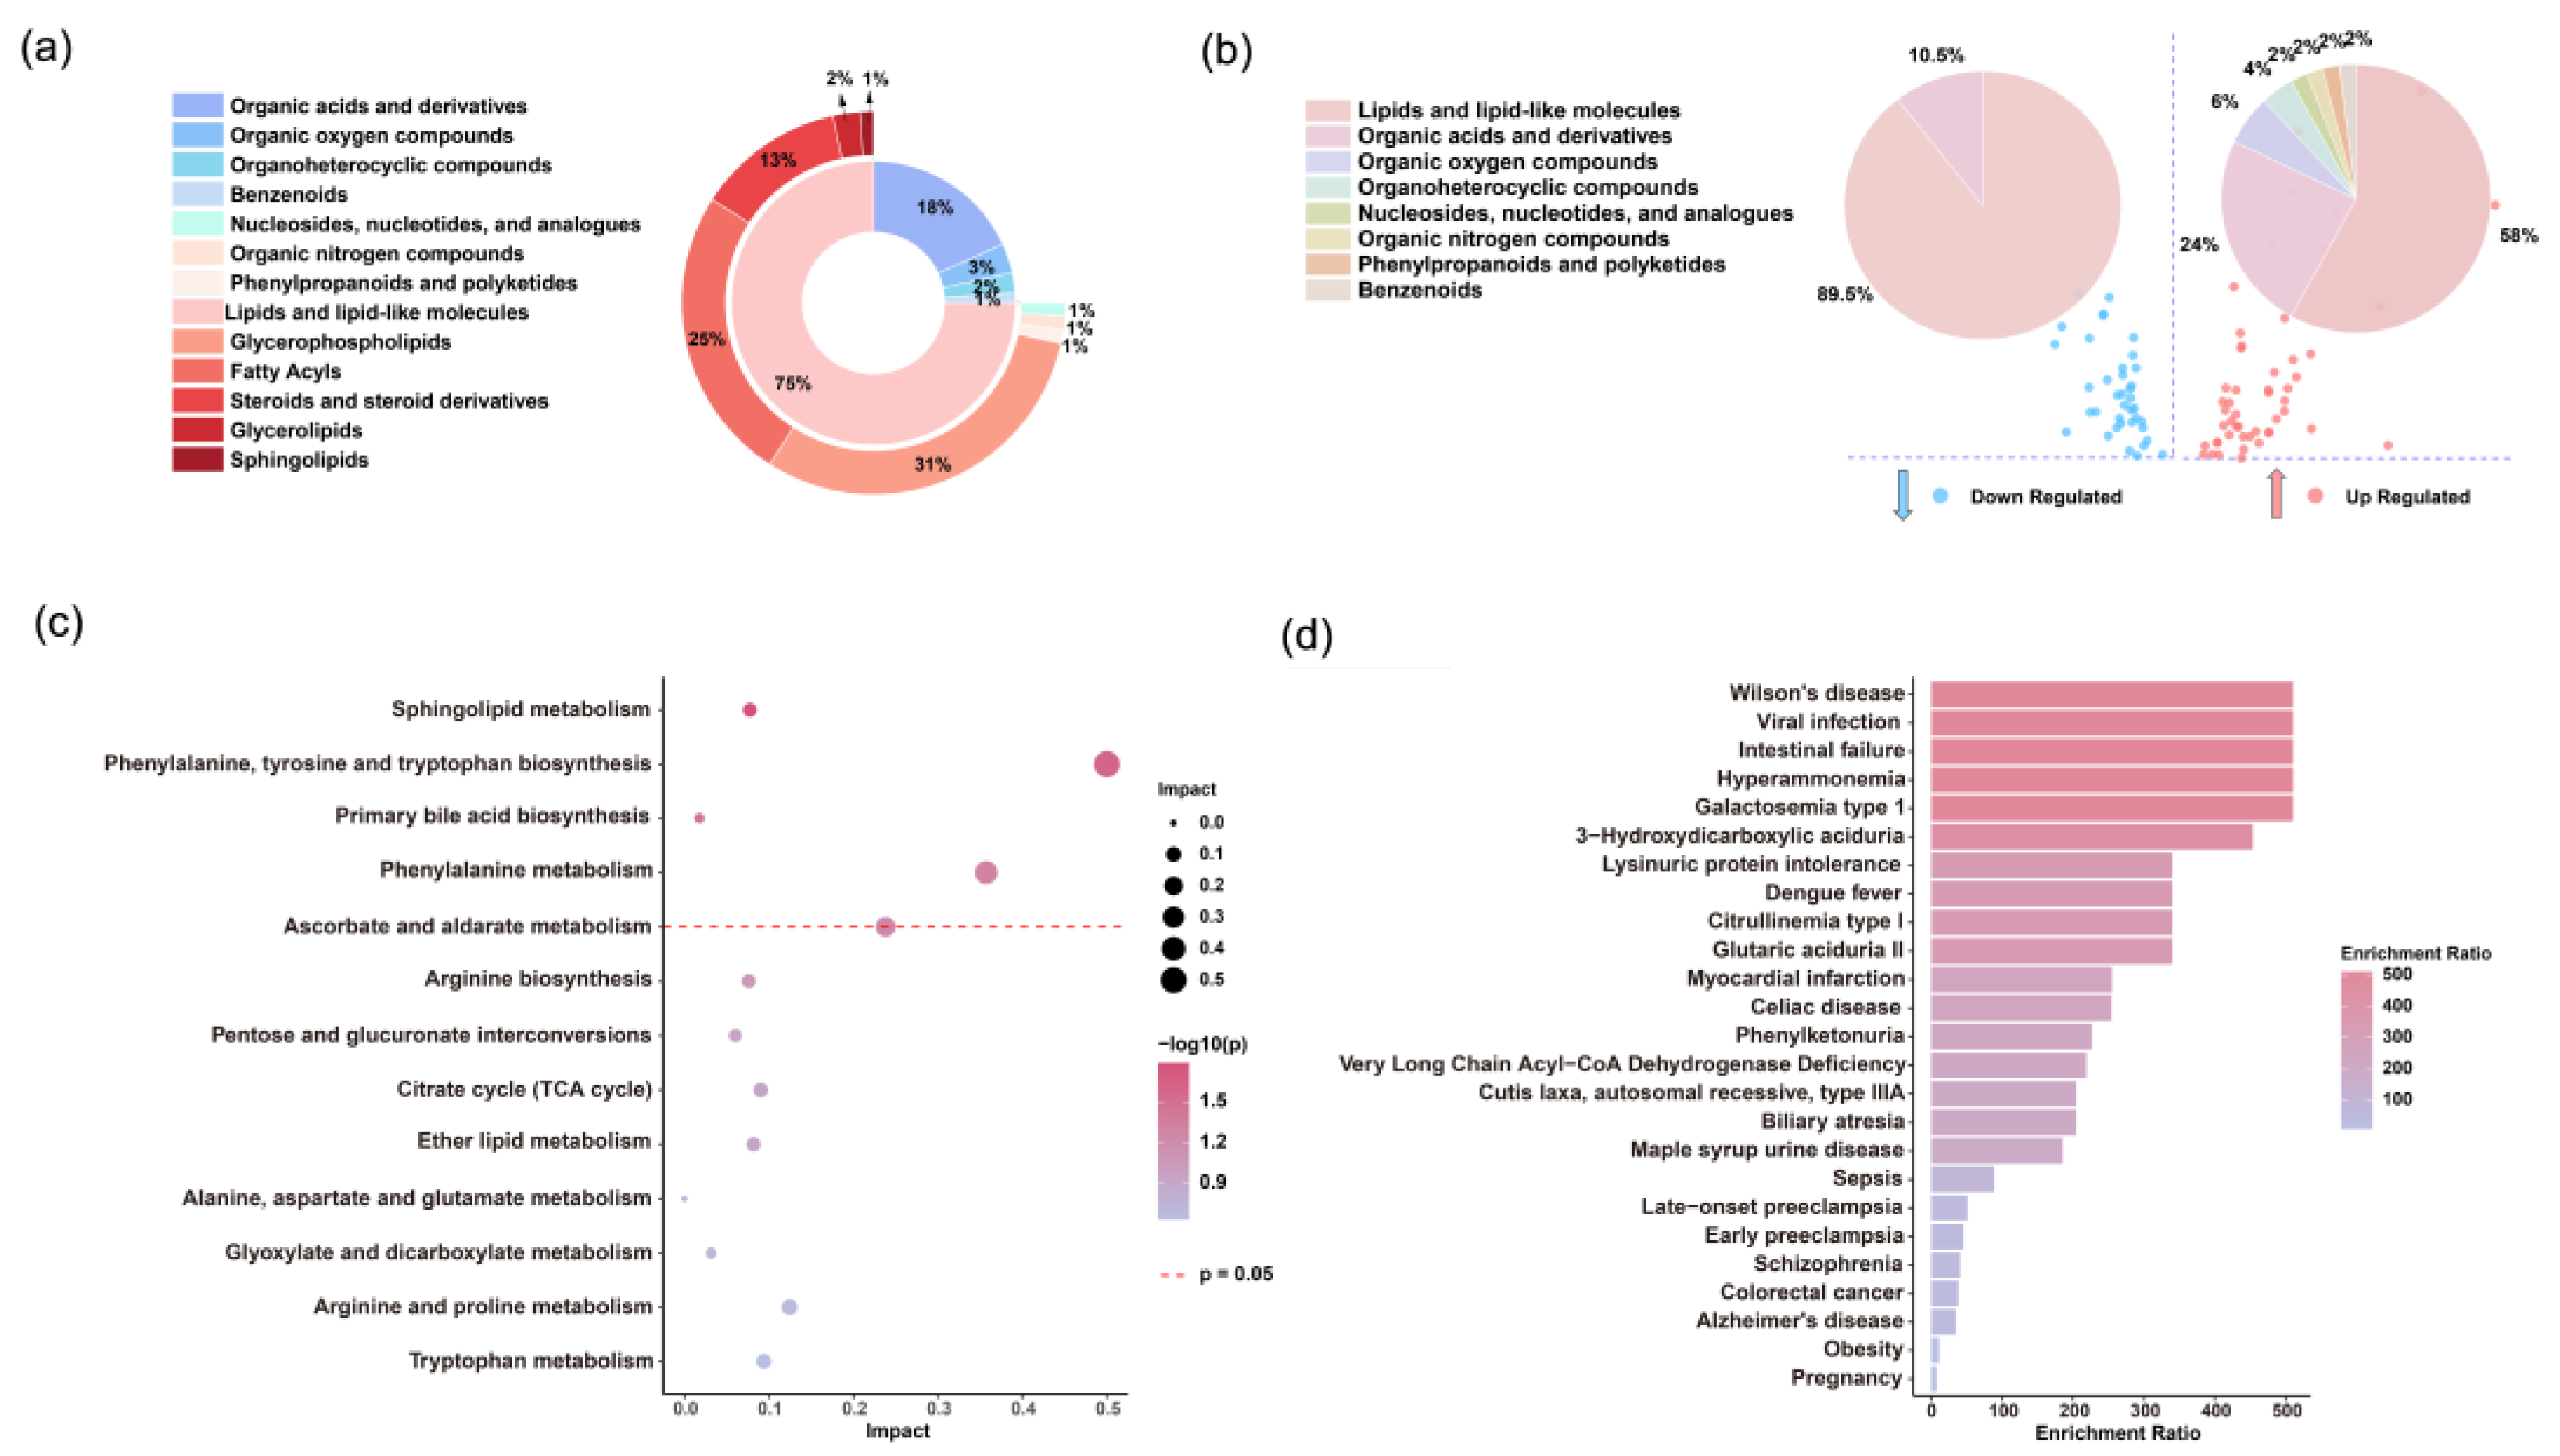
Figure 5.
Analysis of differential serum metabolites. (a) Distribution of serum metabolites across super- and sub-classes in the discovery set. (b) Super classes of metabolites significantly upregulated (red) and downregulated (blue) in the fatal group compared to the survival group. (c) Pathway analysis of significantly different metabolites between the fatal and survival groups according to the KEGG pathways. (d) Human disease states associated with SFTS-related metabolites based on previously published metabolomics data.
Figure 6.
Prediction of disease severity in SFTS patients using machine learning. (a) Boxplots showing the intensities of potential biomarkers in the fatal and survival groups of SFTS patients (time point B). The inset highlights the intensities of the final selected prognostic biomarkers in both groups. (b) Boxplots illustrating the longitudinal progression of potential biomarkers across disease stages (A, B, C). The inset highlights the intensities of the final selected prognostic biomarkers at each stage. Box limits represent the quartiles of each sample group. Receiver operating characteristic (ROC) curves of the metabolic prognostic model on the training (c) and testing (d) set. (e) Heatmap of correlation coefficients between prognostic biomarkers and clinical parameters. The colors in the heatmap represent the positive (represented by red) or negative correlation (represented by blue). Abbreviations: WBC: white blood cell; RBC: red blood cell; HGB: hemoglobin; PLT: platelet; HCT: hematocrit; RDW: red cell distribution width; MPV: mean platelet volume; AST/ALT: aspartate transaminase / alanine transaminase; TBIL: total bilirubin; A/G: albumin/globulin ratio; TBA: total bile acid; SOD: superoxide dismutase; BUN: blood urea nitrogen; CREA: creatinine; CYSC: cystatin C; CKMB-IM: creatine kinase-MB Isoenzyme; hsCRP: high-sensitivity C-reactive protein; GGT: gamma-glutamyl transferase; IL6: interleukin; ApoA: apolipoprotein A; LDH: lactate dehydrogenase; HSTNI: high-sensitivity troponin I; PT: prothrombin time; PTTA: partial thromboplastin time activated; APTT: activated partial thromboplastin time; TT: thrombin Time; FIB: fibrinogen; DD: D-dimer.