
Submitted:
01 March 2024
Posted:
01 March 2024
You are already at the latest version
Abstract
The forest regeneration phase in Sweden commonly involves mechanical soil preparation followed by planting of Scots pine or Norway spruce seedlings. The prepared soil offers planting positions with different properties, including decreased damage by pine weevil (Hylobius abietis L.). Nitrogen fertilization can be applied at the time of planting to aid establishment of the seedlings. In this study we compared the effect of organic nitrogen-fertilization for different planting positions, and seedling sizes on early survival and growth of Scots pine and Norway spruce seedlings. The main planting positions were capped mound, hinge, and mineral soil. Seedlings planted close to organic material were categorized as “low quality positions”, since proximity to organic material increase pine weevil attraction. Higher mortality rates related to pine weevil damage were recorded for seedlings planted in the low-quality positions, regardless of seedling size or N-fertilization. Pine weevil attack rates increased with increasing seedling size. Growth was in general lowest in mineral soil positions. The effect of organic N-fertilization on growth was positive for spruce regardless of planting positions and seedling size, while depending on planting position and seedling size for pine, indicating that effects of organic N-fertilization depend on seedling species, -size and planting position.
Keywords:
Norway spruce
; Scots pine
; forest regeneration
; organic N-fertilization
; seedling size
; planting position
; pine weevil.
1. Introduction
Planting of Scots pine and Norway spruce seedlings is currently the most common regeneration practice method in Swedish production-forests [1]. The majority of planted conifer seedlings are grown in nurseries in container systems of different sizes and types. The choice of seedling size depends on different priorities. A newly planted seedling is vulnerable to water- and nutrient deficiency since root contact with the surrounding soil is very limited [2]. Regardless of size, a seedling with an initially lower shoot:root ratio may establish faster and tolerate drought stress better than a seedling with a higher shoot:root ratio, due to the increased chance for the roots to supply the needs of the shoot [3,4]. Small seedlings are cheaper to produce and may have a lower initial shoot:root ratio than larger seedlings but can be more sensitive to competition from other vegetation and to damage compared to larger seedlings [5,6]. On fertile sites with relatively high competition from ground vegetation, larger seedlings are at an advantage [5]. Regeneration success of seedlings of all sizes is, in general, greatly improved by mechanical soil preparation, which is performed on approximately 85 % of regeneration areas prior to planting [7]. Mechanical soil preparation includes removal of the organic top layer, which provides a temporary decrease in competition from ground vegetation, as well as exposure and loosening of the mineral soil beneath. The exposed mineral soil warms faster when the organic layer is removed and loosening increases soil permeability [8,9,10]. Increased soil permeability enhances seedling establishment both by reducing the physical resistance to root penetration, allowing an additional increase in temperature which is beneficial for root growth and increases nitrogen mineralization [8,9,10,11]. Furthermore, pine weevil (Hylobius abietis L.), which is a major threat to planted seedlings in large parts of Sweden [12,13], tend to move faster and in straighter lines across exposed areas of flat mineral soil [14]. Hence, mineral soil cover in the area immediately surrounding the seedling decreases susceptibility to damage by pine weevil [13,15,16,17,18,19,20,21,22]. Studies have also revealed that the threat of lethal pine weevil damage is highest before the seedling reaches a stem basal diameter of 10-12 mm [18,19].
The most common mechanical soil preparation methods are disc-trenching (60 %), followed by mounding (30 %) and patch scarification (10 %) [23]. Disc-trenching results in continuous furrows where mineral soil is exposed, with an adjacent ridge of the removed soil. The ridges have similar attributes to the capped mounds created during mounding: turning the soil results in a double layer of organic material covered by mineral soil. These methods offer different choices of planting positions, in general with trade-offs between nutrient and water availability. Furrows, patches, and the patch/depression adjacent to mounds present exposed mineral soil positions that have continuous connection to soil moisture by capillary water flow, but the mineral soil in Nordic conditions is generally very nutrient poor. The organic material within the capped mounds provides a source of nutrients for the planted seedling and the elevated position results in an increase in soil temperature, increasing decomposition of organic material and giving a growth advantage over seedlings planted in the exposed mineral soil positions [8,9,10,15,24]. On moist sites, the elevated spots provided by the capped mounds also provide better soil aeration and, thus, decreased risk of oxygen deficiency in the roots [9,11]. However, capped mounds are susceptible to drought because the capillary flow of moisture from below is interrupted by the organic material within [9]. It is, therefore, important to consider the site conditions carefully before choosing the preferred planting position.
Mounds should ideally be capped by mineral soil, both for the purpose of weighing the organic material down to ensure good contact with the underlying ground and to decrease the risk of attack by pine weevil. However, there is high variability in the quality of capped mounds depending on site conditions and the way the soil preparation is performed. Even within a single site there is a great variability in the occurrence of obstacles such as rocks, stumps, residual logs, ground vegetation density etc. This heterogeneity prevents any mechanical soil preparation method from creating homogenous planting positions [10,25]. With respect to mineral soil positions, the deepest parts of patches/depressions should be avoided since these can become water filled as a result of precipitation and snow melt. Planting in depressions can, thus, increase the risk of oxygen deficiency for the seedling roots, especially on flat areas and in fine-textured soil with low permeability. However, on slopes with permeable soil, such as gravel and sand, the risk of waterlogging is minimal. An intermediate choice is to plant in the mineral soil close to the capped mound, i.e., the “hinge” of the capped mound, where the seedling will have ready access to nutrients from the decomposing material in the adjacent mound and simultaneously access to mineral soil capillary water. An additional option is to plant on high mineral soil positions and add slow-release fertilizer at the time of planting, to compensate for the low nutrient status, while the position in mineral soil simultaneously ensures water availability from below. An organic slow-release nitrogen fertilizer composed of arginine-phosphate (AP) is available and used commercially for this purpose.
In this case study, we examined the effects of planting position, seedling size and addition of AP as well as the potential interactions between these factors on establishment and early growth of Scots pine and Norway spruce seedlings. We hypothesized that 1) survival would be affected by planting position; 2) larger seedlings would attract a higher frequency of pine weevil damage; 4) seedlings of all sizes would grow best in the capped mound positions, followed by hinge positions and lastly mineral soil positions and 5) the addition of AP would improve growth so that seedlings planted in mineral soil and hinge positions would achieve similar growth to seedlings planted in mound positions.
2. Materials and Methods
The study site is 100 × 100 m and situated on a clear-cut area with a total size of 12.3 ha in northern Sweden at 63.720954 °N, 19.927771°E, ~50 m.a.s.l. (Figure 1A). The trial area slopes gently towards the east-northeast. The ground vegetation is dominated by bilberry (Vaccinium myrtillus L.) upslope, where the harvested stand was dominated by pine, grading to grass downslope where the harvested stand was dominated by spruce. The soil comprises a thin podzol with underlying mineral soil fractions grading from coarse wave-washed gravel upslope to fine sand downslope, with intermediate mixtures in between. The stand was harvested in June 2018 and mechanical soil preparation by mounding was undertaken in October 2019. The coarser grained and relatively drier upper part was planted with Scots pine (yellow in Figure 1) and the lower more fine-grained mesic part with Norway spruce (green in Figure 1) during May 2020. The mechanical soil preparation method was mounding. The trial area comprises 14 adjacent plots for each species (Figure 1B). Each plot comprises three rows with one seedling size in each row (Figure 1C), the seedlings having been grown in containers with cell size of 30, 50 and 90 cc (hereafter referred to by these volumes). For every mound, a group of three seedlings was planted, one on the mound, one in the hinge and one in the mineral soil, i.e., the exposed patch resulting from the removal of the material making up the mound (Figure 2).
Mounds of insufficient quality i.e., with insufficient contact with the underlying ground and/or without soil cover, and their accompanying hinge and mineral soil positions were not used in the trial. The variation in numbers of suitable mounds per row resulted in different numbers of seedling groups being planted in each row (7-24 seedling per row). Every second group of seedlings was given a dose of arginine phosphate (AP) i.e., arGrow® Granulat (Arevo AB, Umeå, Sweden) at planting. One dose of arGrow® Granulat contains 40 mg N and 22 mg P, in the form of L-arginine phosphate (C6H17N4O6P). All seedlings were marked with numbered plastic sticks to facilitate individual identification, with different colors for each seedling size and with red sticks marking the AP-treated groups. All seedlings were planted with commercial Pottiputki planting pipes by experienced workers, deep enough for the substrate to be covered by soil that was gently compacted by pushing the soil next to the seedling with one foot (i.e., according to common commercial practice). For the AP-treatment, a Pottiputki with an attached arGrow® dispenser (designed for this purpose and used in commercial applications) was used. One dose is dropped into the pipe when it is inserted into the ground and prior to putting the plant in the pipe, so that the dose ends up directly below the seedlings’ roots. The seedlings were planted during the period 18–29 May 2020.
All seedlings were sown in 2019 and grown in the nursery at Skogforsk, Sävar. Seedlings were grown in containers with cell sizes of 30, 50 and 90 cc for both Scots pine and Norway spruce, then stored frozen during the winter, according to common practice. Forty seedlings of each species and size were randomly chosen for initial size measurements: root and shoot were separated and dried at 70°C for ~60 hours and then weighed separately (Table 1). For Scots pine, the percentage of seedlings with primary needles, i.e., only one needle per bundle, was recorded in a control inventory conducted immediately after planting (Table 1).
After planting, a control inventory was compiled with a more detailed quality classification assessment of the planting positions (Table 2). Positions close to organic material represent an increased risk of pine weevil damage by offering shelter to the weevils (classes 1, 3, 5, 7) and can be considered low quality positions at sites where pine weevil are common. Class 8 had humus mixed with the mineral soil and could, in this context, potentially be considered of lower quality than the positions with pure mineral soil surrounding the seedling. Note: the position at the bottom of a patch (class 2) could potentially be at risk of waterlogging on sites with less permeable soil and flat areas and should, at such sites, also be considered low quality. Since high quality positions were prioritized during planting, they outnumber the lower quality positions for each main position (Table 3).
Seedling development inventories were compiled at the end of each of the first three growing seasons following planting: on 24-26 August 2020, 6-10 September 2021, and 2-8 September 2022. Inventories included recording scores for vitality (all years, 0 = dead or dying, 1 = severely low vitality, 2 = moderate decrease in vitality from damage and/or damaged top-shoot, 3 = none or minor decrease in vitality, undamaged leading shoot); height (all years, measured from ground level to top bud in cm); top-shoot length (all years, in cm); stem basal diameter (in 2022, measured close to ground level in mm), needle color (in 2020, 1 = light green/yellow-green, 2 = green, 3 = dark blue-green); needle length and number of needles per bundle (in 2020, pine only, needle length of longest needle directly under top bud in cm), level of pine weevil damage (all years, not including healed damage from previous years, 1 = minor, <25 % of the stem circumference damaged, 2= moderate, 25-50 % of the stem circumference damaged, 3 = severe, >50 % stem of the circumference damaged, 4 = seedling killed by pine weevil); leading shoot variation (in 2022, pine only, 0 = one leading shoot, i.e., normal, 1= 2-3 leading shoots, 2 = more than three leading shoots); occurrence of adventitious buds near the top of the seedlings and proleptic shoots (pine only); other damage and, when applicable, cause of other damage and mortality.
In addition, a subset of three blocks per tree species was assessed for mineral soil texture (sand or coarse), moisture level and thickness of slash and slash occurrence within mounds in early June 2020. Blocks 2 and 13 for all seedling sizes, block 8 for 30 cc and 50 cc seedlings and block 10 for 90 cc seedlings (shift of block 8 to 10 was made due to coarseness of block 8 making it difficult to measure moisture).
A subset of seedlings was harvested (starting from plot 1, seedling group 1 and 2 and then every second pair of AP-treated and untreated seedling groups in every second plot for each species up to plot 11), including roots, in the period 10-12 October in 2022. In total, 524 pine and 510 spruce seedlings were harvested. For these seedlings, stem base, shoot and top-shoot height were measured. The number and direction of roots were recorded, i.e., how many main roots in each of four directions. The root and shoot were separated at the base of the stem, the roots were rinsed to remove soil and other foreign material under running water. The roots and shoots were dried at 70° C for ~60 hours and weighed. Comparisons of dry weights to field measurements are used as the basis for choosing which growth parameter to use in the analysis of field data for each tree species.
Scots pine and Norway spruce were analyzed separately. All analyses were conducted using R-studio software [26]. We applied generalized mixed effect models using the glmer function in the [lme4] package [27] with a binomial distribution for the response variables for survival, mortality and damage by pine weevil, as well as occurrence of multiple leading shoots in pine from the field inventory data. As a first step, to identify any trends in planting position classes for survival, AP- treatment, planting position classes (1-9) and seedling size were used as fixed factors and plot was set as a random factor to account for the varying number of seedlings in each row as well as other potential within-site variability. The analysis of variance (ANOVA) type II function in the [car] package [28] was used to test each model. The first step was undertaken to enable grouping of planting positions, since the low number of seedlings in each separate low quality position class would become even smaller when analyzing seedling sizes separately (sometimes as low as 0) which would compromise analyses of these position classes. As a second step, for each model, classes were divided into planting position groups based on the patterns revealed in step 1, where there was a clear trend towards increased damage and mortality caused by pine weevil in low quality positions, in which the seedling was not surrounded by mineral soil, i.e., classes 1, 3, 5 and 7 for both pine and spruce. For spruce, position 8 was considered low quality as well, while for pine class 8 was not significantly different from class 9. The remaining classes were grouped according to their planting positions: 2 and 4 as high-quality mineral positions, 6 as a high-quality hinge position, 8-9 as capped mound for pine and 9 as high-quality capped mound for spruce. The grouping of all low-quality classes together allowed us to conduct statistical analyses and provides a clearer definition of the main planting position characteristics. The analysis procedure was then repeated with the position groups replacing the planting position classes to reveal any effect of seedling size. The ANOVA tables from the second step analysis are presented in the results for survival, damage and mortality caused by pine weevil as well as for multiple leading shoot occurrence in pine. Occurrence of multiple pine leading shoots was analyzed directly by the second step analysis, with the additional factor’s occurrence of proleptic shoots in the previous year, and occurrence of adventitious buds in the previous year. As the third and last step, the seedling sizes were analyzed separately to enable interpretable visualizations of the results; we followed the same procedure as in the second step but omitted the size factor. The analysis of variance (ANOVA) type III function in the [car] package [28] was used to test each model for interactions. Where no significant interactions were found, the model was reduced to include the main effects only and was tested again with ANOVA type II in the [car] package. From these third step analyses, estimated marginal means were calculated using the [emmeans] package [29] and presented graphically using the [ggplot2] package [30].
For measured values, i.e., diameter for pine and height for spruce from the field measurements and total dry weight and shoot:root ratio for harvested seedlings, we applied linear mixed models using the lmer function in the [lmerTest] package [31], with AP-treatment and position groups as fixed factors and plot as a random factor. We used the same position groups as defined in the analyses for survival to allow comparisons in the discussion. Each seedling size was analyzed separately without first analyzing them together, since effect of seedling size on seedling size would be superfluous. The analysis of variance (ANOVA) type III function in the [car] package [28] was used to test each model for interactions. Where no significant interaction was found, the model was reduced to include the main effects only and was tested again with ANOVA type II in the [car] package The ANOVA tables from these analyses are presented in the results for growth. From these analyses, estimated marginal means were calculated using the [emmeans] package [29] and are presented graphically using the [ggplot2] package [30].
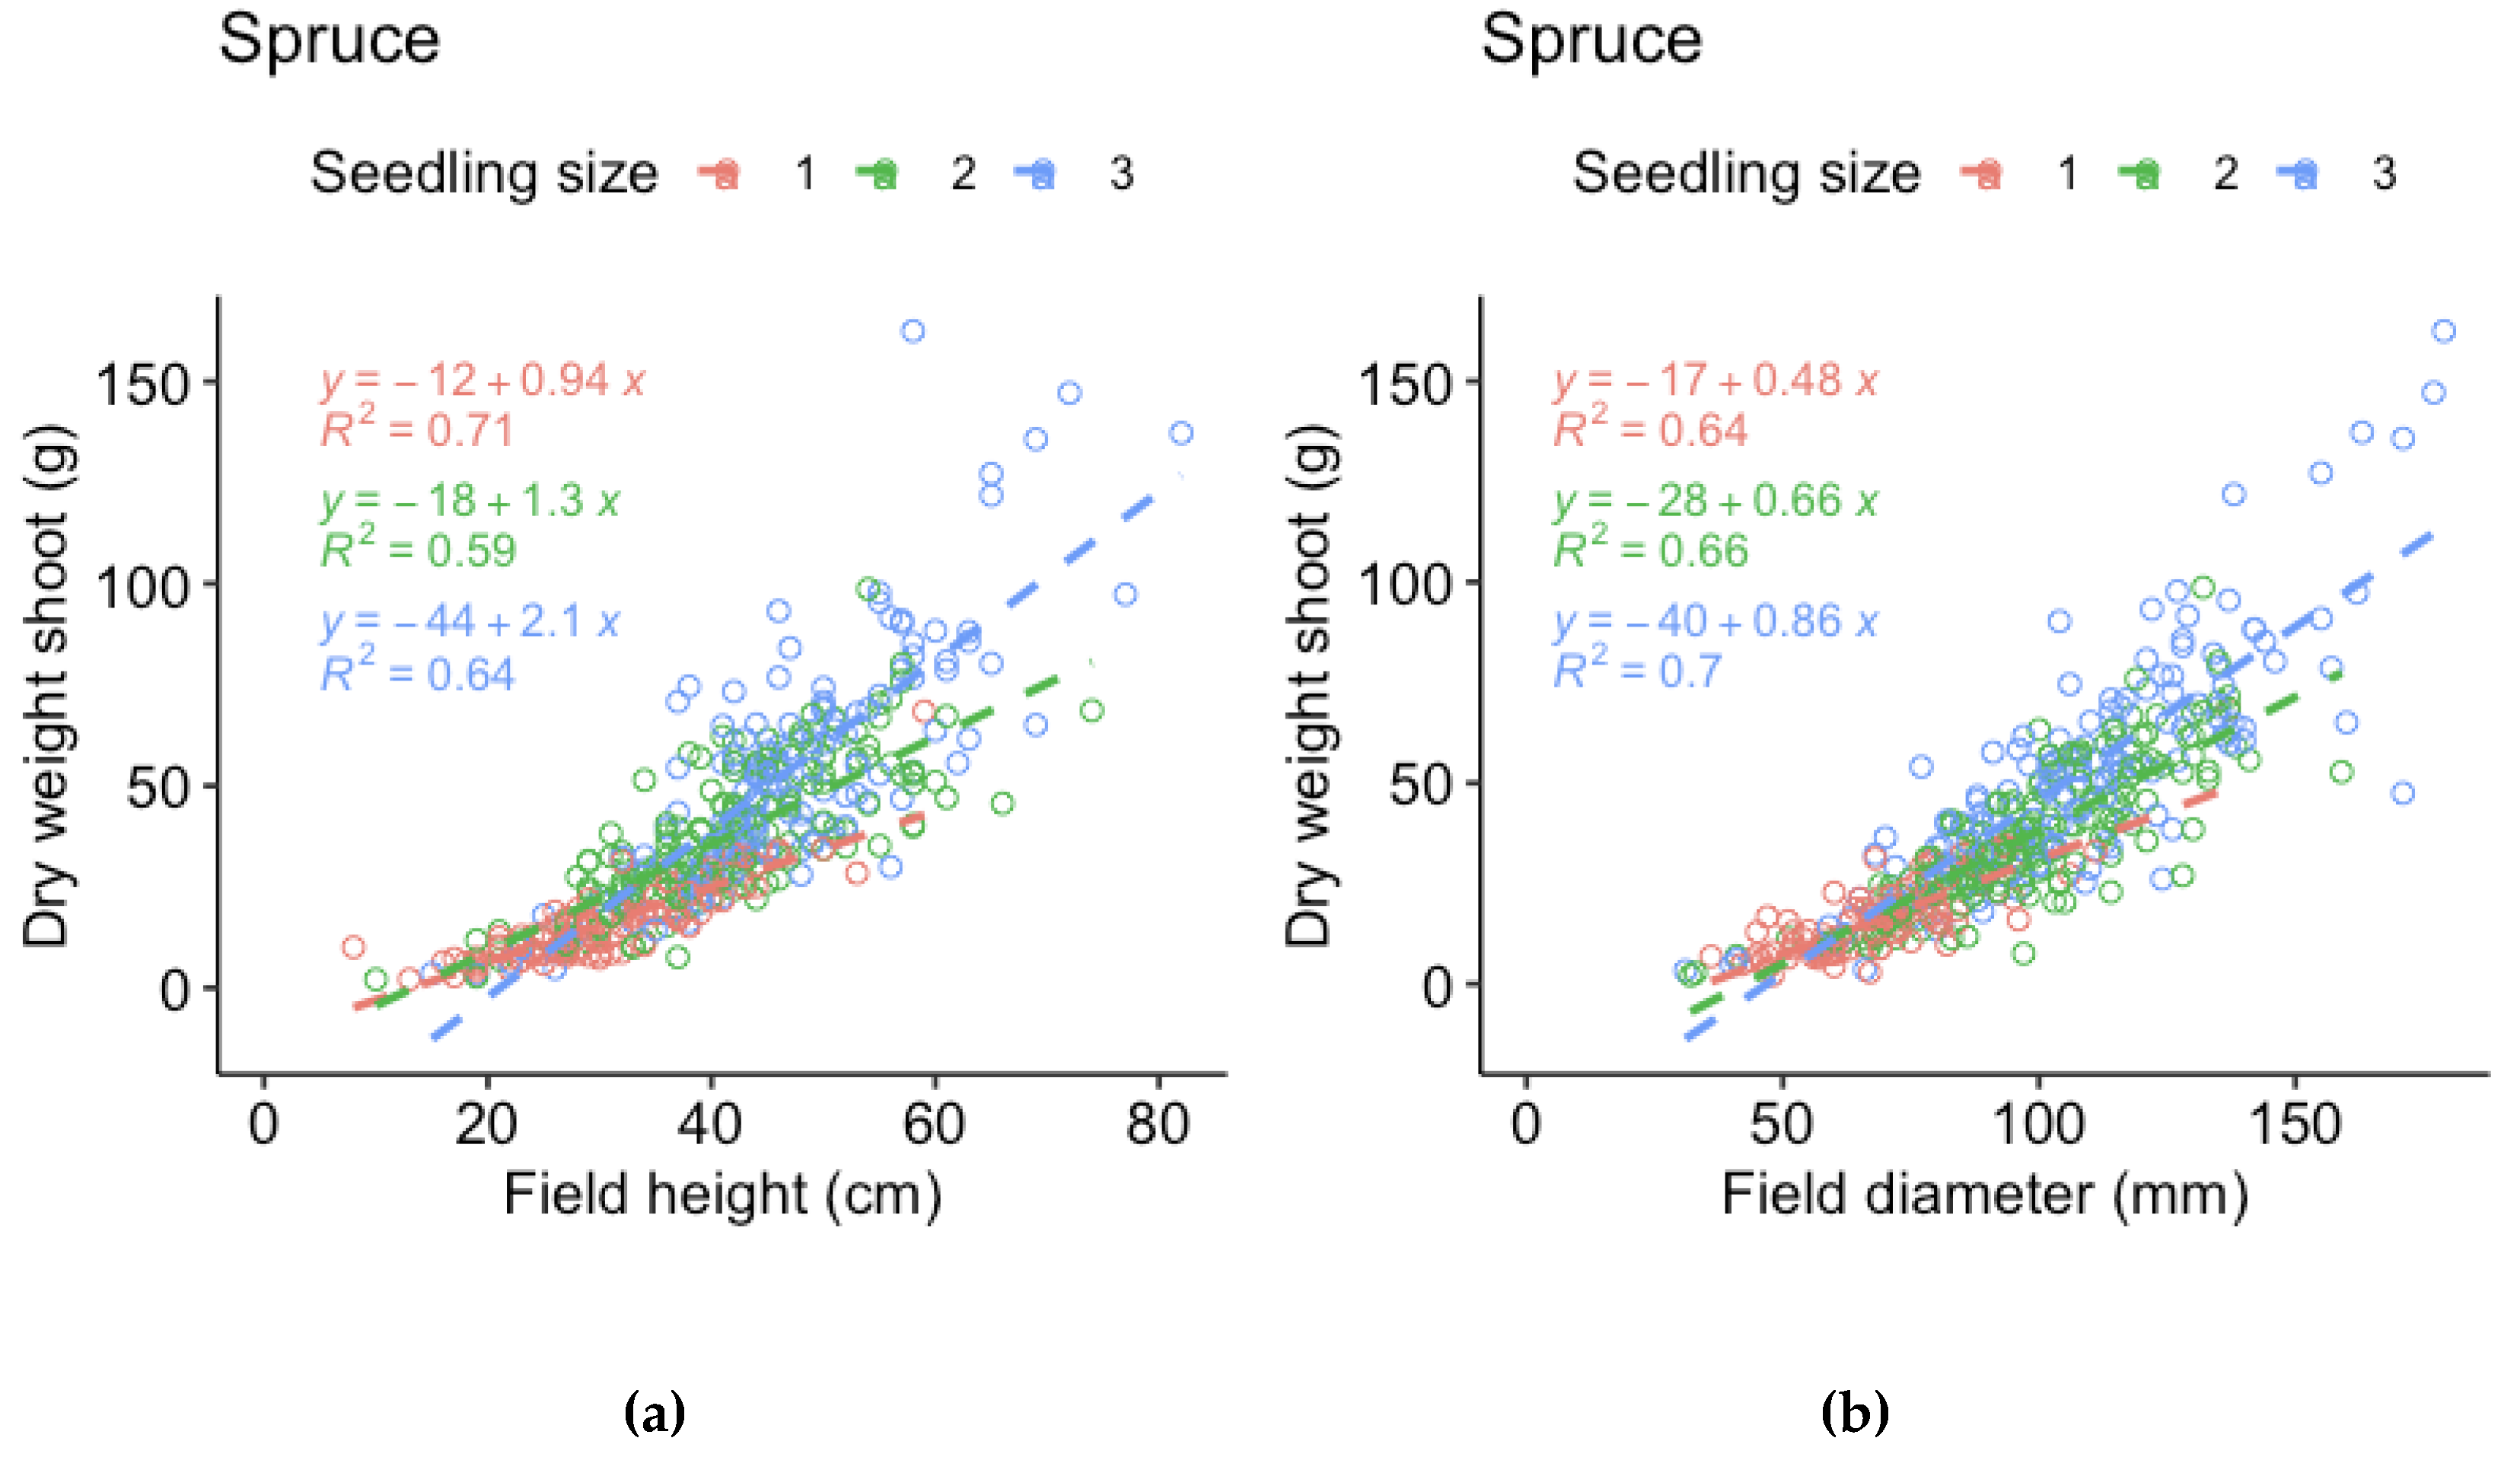
Comparisons of dry weight data from harvested seedlings to field measurements of the same seedlings were made to determine which of the measured parameters best represented the seedling mass (Appendix A). Stem basal diameter correlated best with dry weight of pine root (Figure A1) and shoots (Figure A2) and was used as the response variable for pine, while height corresponded almost as well or better compared to stem basal diameter (depending on seedling size) for spruce root (Figure A3) and shoots (Figure A4). In addition, field measurements of spruce stem basal diameter were missing for half of the plots and height was therefore used as the response variable for spruce growth to include as much of the available data as possible. The data on dry weight of shoot and roots from harvested seedlings were analyzed following a similar procedure as for the field measurements.
To assess whether pine weevil damage had any effect on growth, we added the recorded damage level score from each year and constructed linear mixed models, with damage score as a fixed factor and plot as a random factor, in order to detect potential patterns. Scores of 1 and 2 were not associated with lower growth. There were trends of decreasing growth with increasing scores of 3 and above, however there were, in general, very few surviving seedlings with a score higher than 3 that were still alive and a very large variation in growth in each score group. The results from this analysis are not presented due to lack of significance.
3. Results
Only mounds with sufficient contact with the underlying ground and their accompanying hinge and mineral soil positions were used in the trial, and there were relatively few low-quality positions because they were actively avoided during planting. In a commercial regeneration situation, the planters are generally paid per planted seedling and cannot afford the time to consider every planting position as carefully. Hence, the results are probably biased towards a better outcome than in a commercial situation.
3.1. Survival
Planting position had a significant effect on probability of survival for both pine and spruce, while no effect of seedling size and AP-treatment on survival was recorded (Table 4).
Analysis of the effect of planting position for the three pine sizes separately revealed that the highest probability of survival was on the capped mound and in high quality mineral soil positions. The probability of survival in high quality hinge positions was lower than capped mounds but not significantly lower than in mineral soil positions. The lowest probability of survival was for seedlings planted in low-quality positions (Figure 3). Analysis of the effect of planting position for the three spruce sizes separately revealed that the probability of survival was highest in high quality mineral soil positions and high-quality hinge positions for 30 cc seedlings, in high quality mineral soil and high-quality mound positions for 50 cc seedlings and in high quality hinge and high quality mound positions for 50 cc seedlings. The lowest probability of survival for spruce seedlings was in low quality mound positions (Figure 4).
3.2. Pine Weevil Damage and Associated Mortality
The main cause of seedling mortality was pine weevil damage: 82% of the dead pine seedlings and 72% of the dead spruce seedlings had pine weevil damage recorded as the cause of death.
Planting position and seedling size had a significant effect on probability of pine weevil attack for both pine and spruce, while there was no effect of AP-treatment (Table 5). The risk of pine weevil attack increased with increasing seedling size and was highest in low quality positions for both species and in general lower for spruce than for pine (Figure 5 and Figure 6).
Planting position had a significant effect on the probability of mortal outcome from pine weevil attack for both pine and spruce, while there was no effect of seedling size and AP-treatment on survival (Table 6). The risk of mortality as a result of pine weevil damage was highest in low quality positions and also the high-quality hinge position for pine (Figure 7).
3.3. Growth
3.3.1. Pine
For pine, planting position had a significant effect on stem basal diameter growth (Table 7). For 30 and 50 cc pine seedlings, there was an interaction between AP-treatment and position, with a different AP-treatment effect in different positions: positive in HQ mineral and hinge positions, neutral (30 cc) or positive (50 cc) in LQ positions, but negative in capped mound positions. The effect was not significant within each planting position, but shifted the difference between planting positions so that AP-treated seedlings no longer grew significantly less in mineral soil positions compared to untreated seedlings in the hinge position (30 and 50 cc), in HQ hinge compared to untreated HQ capped mound positions (30 cc) or in LQ positions compared to untreated in HQ capped mound positions (50 cc). The lowest stem basal diameter of 30 cc pine seedlings was found among control seedlings in the HQ mineral soil positions and seedlings in the highest yielding position group (control capped mound position) had ~40 % wider stem base (Figure 8). The lowest stem basal diameter of 50 cc pine seedlings was found among control seedlings in the HQ mineral soil positions, and seedlings in the highest yielding position group (AP-treated HQ hinge position) had ~27 % wider stem base (Figure 8B). For 90 cc pine seedlings, AP-treatment had no significant effect. The lowest stem basal diameter of 90 cc pine seedlings was found among seedlings in the HQ mineral soil positions and seedlings in the highest yielding position group (capped mound position) had ~21 % wider stem base (Figure 8).
For the harvested seedlings, planting position had a significant effect on total dry weight (shoot+root) and shoot:root ratio (Table 7, Figure 9 and Figure 10). Dry weight was significantly lower in HQ mineral soil positions than in HQ hinge and capped mound positions. For 50 cc pine seedlings, the interaction between AP-treatment and position meant that total dry weight in the HQ hinge position was significantly higher, but this was not the case in the other positions (Table 7 Figure 9). For shoot and root dry weight analyzed separately, see Appendix B, for pine Table A1 and Figure A5 and for spruce Table A2 and Figure A6. Shoot:root ratio was significantly higher in HQ hinge positions than in HQ capped mound positions for all seedling sizes, for 30cc seedlings also being higher than in mineral soil positions and for 50cc pine seedlings higher than in LQ positions. AP treatment had no significant effect on shoot:root ratio.
The percentage growth increase from the original seedlings’ stem basal diameter following three seasons in field was highest for 30 cc pine seedlings in all position groups and treatment combinations and lowest for 90 cc seedlings (Table 9).
3.3.2. Spruce
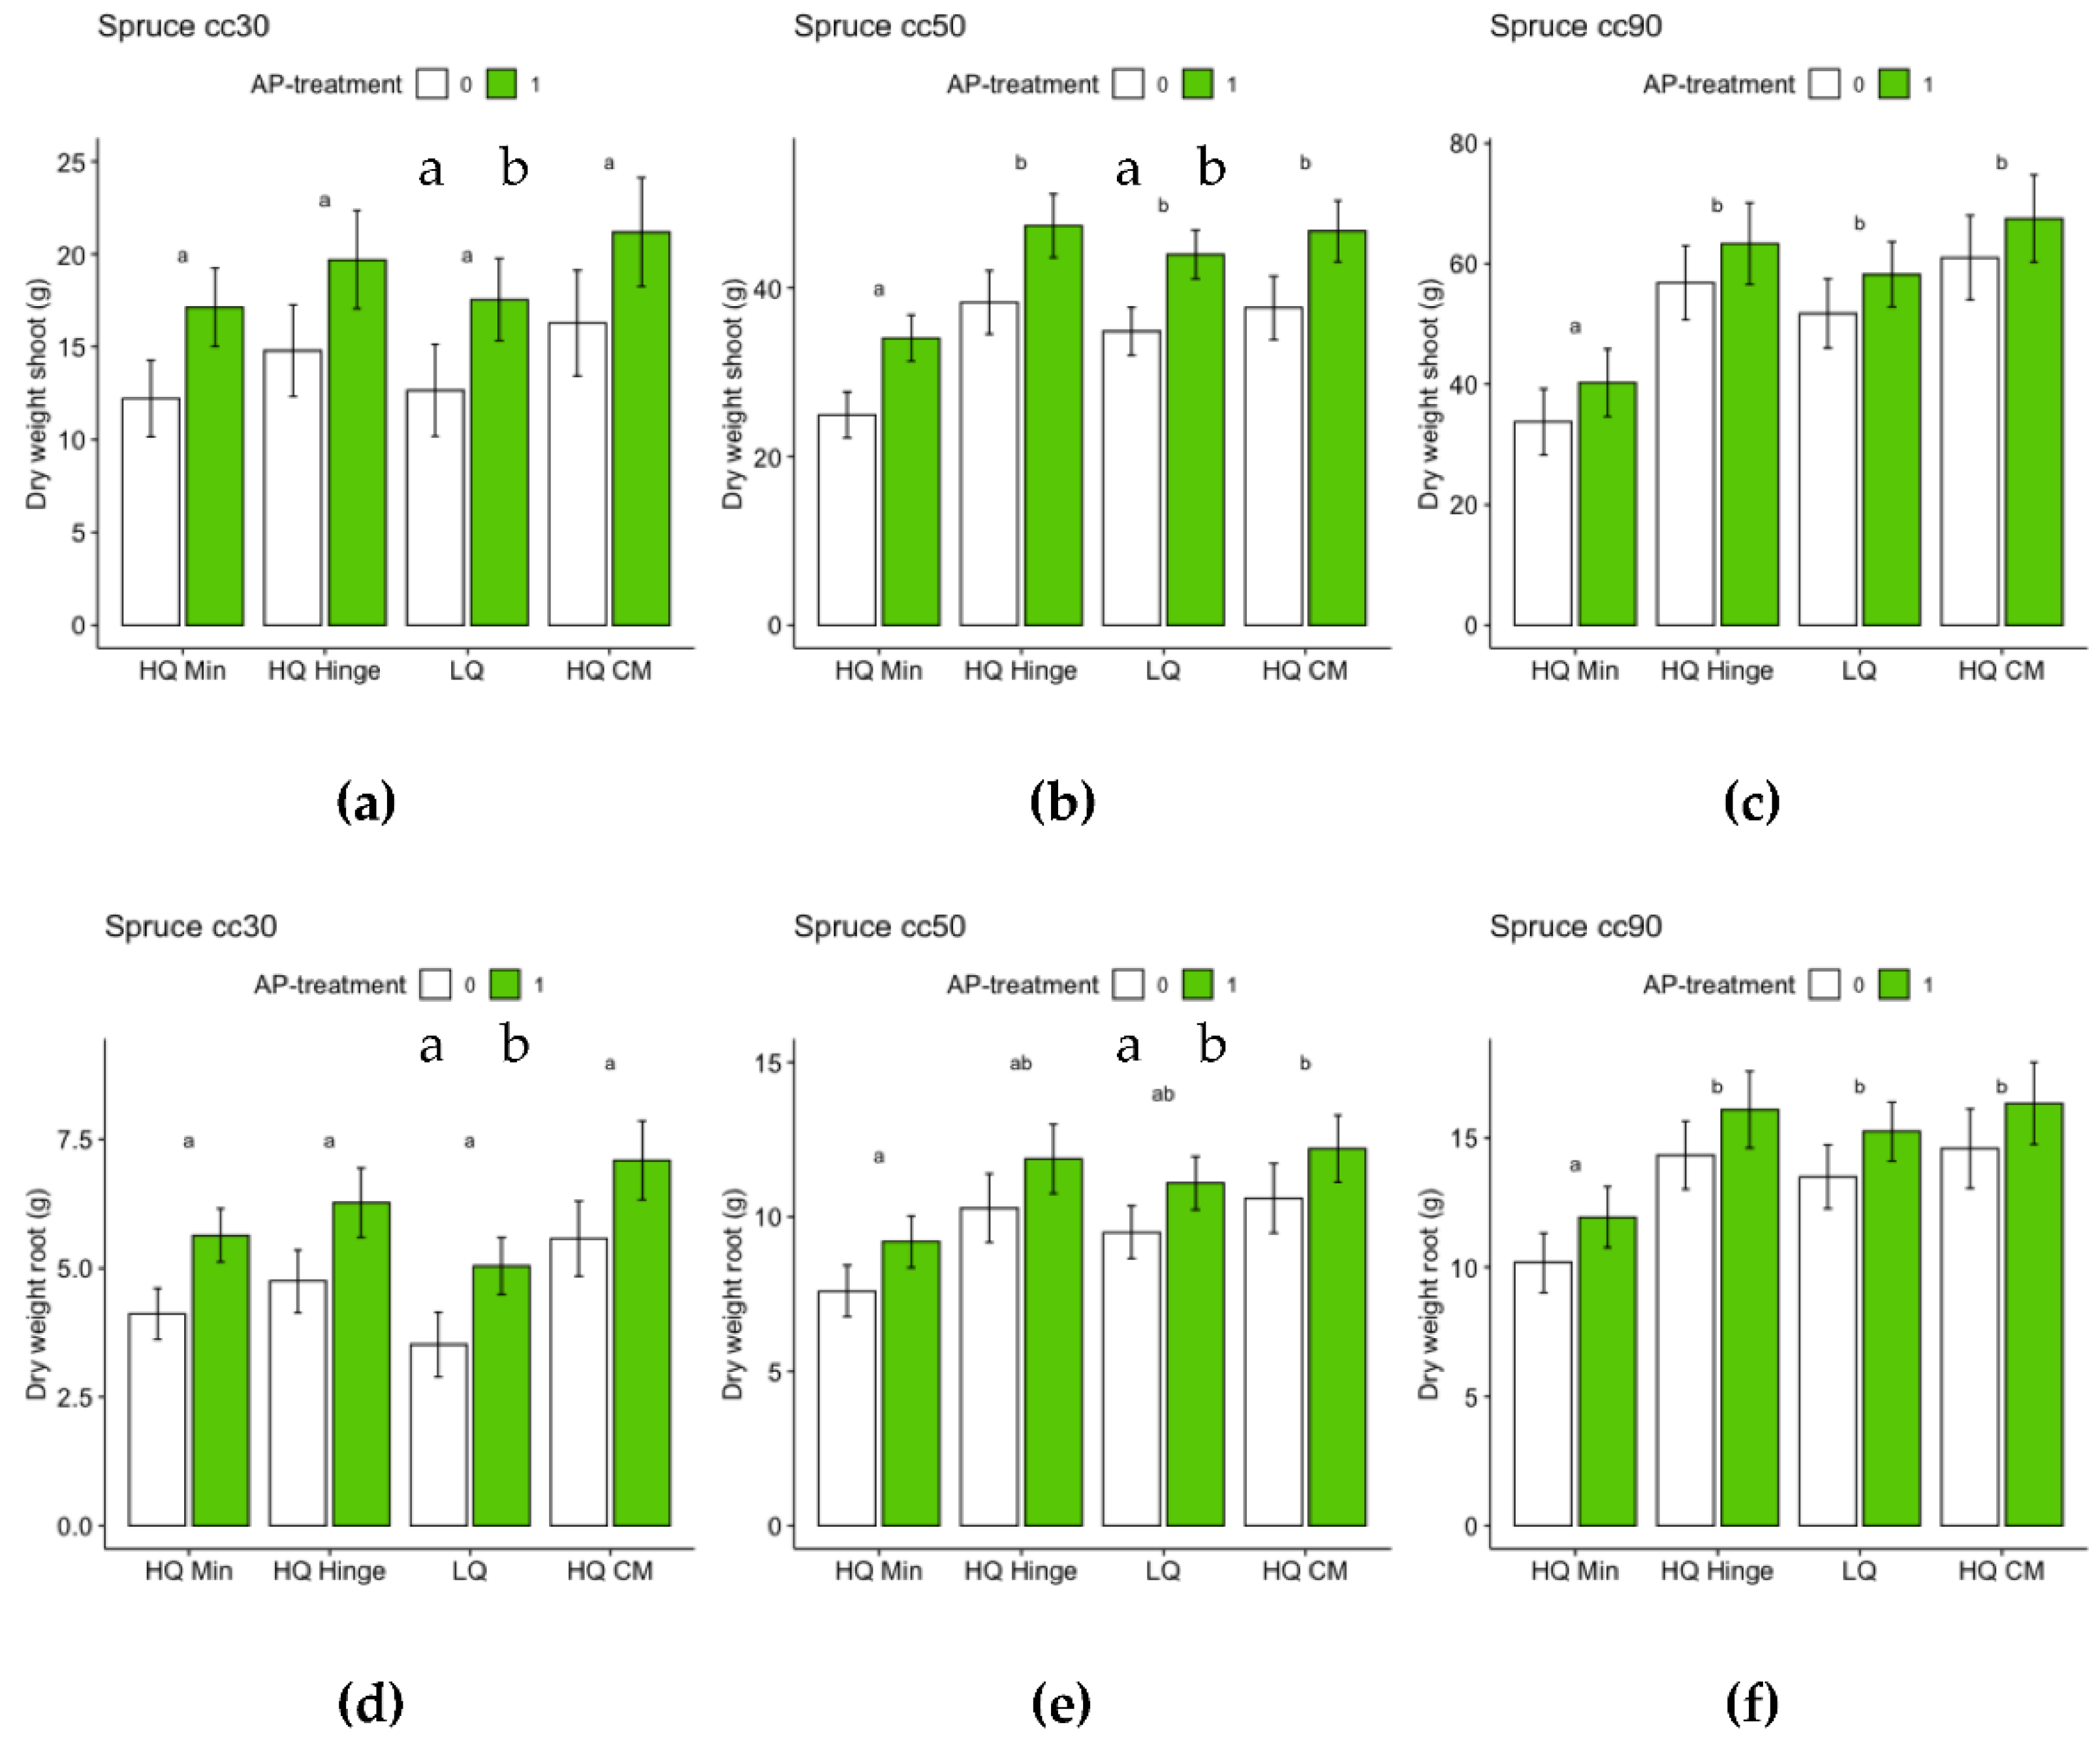
For spruce, both position and AP-treatment had independent significant effects on height growth for all three seedling sizes (Table 8). For 30 cc spruce seedlings, height growth increased by 11 % from the lowest (HQ mineral soil positions) to the highest yielding positions (HQ mound positions) (Figure 11A). For 50 cc spruce seedlings, height growth increased by 16 % from the lowest (HQ mineral soil positions) to the highest yielding position group (HQ hinge positions) (Figure 11B). For 90 cc spruce seedlings, height growth increased by 15 % from the lowest (HQ mineral soil positions) to the highest yielding position group (HQ mound positions) (Figure 11B). The increase in height growth associated with AP-treatment was 7 % for 30 cc, 6 % for 50 cc and 4 % for 90 cc spruce seedlings (Figure 11).
For the harvested seedlings, planting position had a significant effect on total dry weight (shoot+root) of 50 and 90 cc seedlings (Table 8, Figure 12), with dry weight significantly lower in HQ mineral soil positions than in the other positions. AP-treated 30 and 50 cc seedlings had significantly higher total dry weight than untreated seedlings, while this effect was not significant for 90 cc seedlings (Table 8 Figure 12). Planting position had a significant effect on shoot:root ratio for 90 cc seedlings: seedlings in mineral soil positions had a significantly lower shoot:root ratio than seedlings in the other positions (Table 8, Figure 13). AP treatment had no significant effect on shoot:root ratio.
The percentage growth increase from original height following three seasons in the field was greater for 30 cc seedlings in all positions except HQ hinge, while it was always lower for 90 cc seedlings (Table 9).
3.3.3. Multiple Leading Shoots on Pine
Planting position, seedling size and occurrence of adventitious buds the previous year had a significant effect on the occurrence of multiple leading shoots in pine (Table 10).
The probability of there being multiple leading shoots increased with increasing seedling size. Multiple leading shoots tended to occur on fewer seedlings in mineral soil positions than in capped mound positions, albeit only significantly so for 30 cc seedlings. The occurrence of multiple leading shoots tended to be more common among seedlings when there were adventitious buds from the previous year for 30 and 90 cc seedlings, while for 50 cc seedlings multiple leading shoots were found more often among seedlings in hinge and capped mound positions with adventitious buds from the previous year, although the opposite was the case in HQ mineral soil and LQ positions.
4. Discussion
The risk of seedling mortality was in general low in this case study experiment. Three years after planting, seedling survival was in the range of 74-96 % for pine and 83-98 % for spruce.
Overall, on this study site, the main cause of mortality was pine weevil damage. Even though we avoided positions related to low quality of capped mounds in our experiment, there was still variability in the quality of planting positions related to the occurrence of organic material close to the seedling, which may increase the risk of pine weevil damage. Therefore, we made a detailed classification of planting positions and found a pattern of higher mortality of seedlings planted close to organic material regardless of which main position they were planted in. Hence, such positions were grouped separately as low-quality positions. This presented an opportunity to compare the main positions without interference from low quality positions.
For pine, there was no significant difference in survival between the high-quality mineral soil and capped mound positions, while survival in the high-quality hinge positions was lower than in the capped mounds. Hence, the choice of main position affected the outcome regarding survival of pine, in accordance with our first hypothesis. However, for spruce there was no significant difference in survival between any of the three main positions as long as they were of high quality, in contrast to our first hypothesis. Mortality was highest in low quality planting positions for both pine and spruce, albeit not significantly lower than in high quality hinge positions for pine, nor for 50 cc spruce. For both species, the main cause of mortality was pine weevil damage, and the survival pattern was reflected by a higher attack rate and mortality for seedlings planted in low quality positions. This was expected since the definition of low-quality positions was based on the occurrence of organic material (i.e., humus and vegetation) in the vicinity of the seedling, which has been found to increase the frequency and level of damage by pine weevil compared seedlings surrounded by mineral soil [15,16,17,18,19,20,21]. Most deaths caused by pine weevil occurred in 2020 (the year of planting), which is to be expected due to the high risk of thin-stemmed seedlings being girdled [18,19,20]. For pine, mortality due to pine weevil damage was almost as high in the high-quality hinge position as in the low-quality positions but this was not the case for spruce. This phenomenon could have multiple explanations.
Attack frequency of pine weevil increased with seedling size for both species in accordance with our second hypothesis. Despite a higher attack frequency, the larger seedlings did not exhibit any higher mortality rates compared to the smaller seedlings, indicating that they were able to cope with pine weevil attack better than the smaller seedlings. This result is in line with previous research in which larger seedlings attracted more pine weevil damage but with no increase in mortality compared to smaller seedlings [5]. Pine weevil pressure increases with temperature sum, and in general the harsher northern inland part of Sweden has less problems with pine weevil damage [5,32]. However, climate change is increasing the length of growing season over the whole country, so pine weevil pressure could potentially increase in more areas.
There was an overall higher attack frequency and mortality due to pine weevil for pine than for spruce, which might potentially alter trends associated with the positions in which the seedlings are more vulnerable (e.g., the number of pine weevils competing for the available seedlings may increase attraction to otherwise less attractive feed sources). The difference in attack rate between tree species may, in part, be explained by the larger size of pine, since the 30 cc pine seedlings were approximately equal in dry weight to the 90 cc spruce seedlings. It could also be an effect of species preferences, since pine weevil prefer pine over spruce if both conifers are present [12,18]. However, there were also differences in environment between the pine and spruce areas that may have had a direct or indirect effect on pine weevil attack frequency in different planting positions; these differences included ground vegetation composition, mineral soil texture, amount of slash (i.e., harvest residues) within or near planting positions, moisture level, and distance to the forest edge. Soil microtopography has previously been found to affect pine weevil feeding behavior [33], and occurrence of pine weevil has been found to correlate positively with amount of slash (harvest residues) [34]. For the blocks where mineral soil texture was assessed, ~70 % of the pine and ~40 % of the spruce planting positions were on coarse soil (i.e., fractions larger than sand, including pebbles and stone of various sizes), the number of planting groups for which the mound did not contain slash was 9 % in the pine area and 23 % in spruce area and there was a slightly higher soil moisture level in the spruce area. We did not find any correlation between mortality due to pine weevil and soil coarseness, slash occurrence or moisture level that could explain the higher mortality in the high-quality hinge position for pine within the subset of plots for which these factors were assessed. However, this does not exclude the possibility that there could have been such correlations if all plots had been assessed, since pine weevil attacks were heterogeneously distributed and relatively few seedlings in the subset were killed by pine weevil. Other biotic agents, such as red ants can, also decrease pine weevil damage [35]. Consequently, factors that affect red ants can have an extended effect on pine weevil damage. The spruce area had, overall, more edge closer to forest than the pine area, which may have effects both on pine weevil feeding behavior and red ant presence. Ant presence was not recorded in our inventories but could be of interest in further studies.
Other damage agents recorded for pine in 2020 were Tomicus piniperda (L) < 2 %, drought ~2 %; in 2021 they were stem break or leaning (not caused by animal or fungi) 1 % and drought < 2 %; and in 2022 Acantholyda hieroglyphica (Christ) 2 %. Browsing by ungulates amounted to < 1 % for all three years. The other damage agent recorded for spruce was drought 3.5 % (of which approximately a third was lethal) in 2020, while there was almost no other damage recorded the following years. Overall, pine appeared more vulnerable to various sources of damage for a longer time than spruce, as found in previous research [5].
Seedlings in general grew less well in the mineral soil position than in the capped mound position, except for spruce 50 cc seedlings, in part corroborating our third hypothesis. However, growth in the high-quality hinge position was, in general, similar to growth in capped mounds, except for untreated 30 cc pine seedlings. Growth in the low-quality positions was, in general, lower than in mound positions but only significantly so for the 90 cc seedlings of both tree species and untreated 50 cc pine. The effect of planting position on growth was greater for pine (up to 40 % greater stem basal diameter for the smallest seedling size) than for spruce (up to 16 % taller seedlings).
The increase in growth resulting from the AP-treatment was marginal and depended on planting position for 30 and 50 cc pine but was not significant for 90 cc pine. It was, however, significant irrespective of position, but relatively small, for spruce. The addition of AP improved growth so that seedlings planted in mineral soil achieved similar growth to those on the hinge position for 30 and 50 cc pine and 30 cc spruce seedlings, but growth was not equivalent to that of seedlings in the capped mound positions, contrary to our fourth hypothesis. The small effect of AP-treatment on growth did not fully compensate for the growth loss in mineral soil compared to planting in capped mounds, perhaps representing an insufficient increase in growth compared to the cost and extra effort in the planting process. However, our results are only short-term, and this study does not show how the effect develops over subsequent years. Considering the potentially lower cost and ecological impact of mechanical soil preparation when patch scarification is used instead of mounding on dry sites, AP-treatment could also be seen as tool to achieve sufficient growth to make planting in mineral soil in dry conditions worthwhile. Whether this would be economically beneficial or not is a topic for further studies.
It is also important to remember that, regardless of AP-treatment, the option to plant in mineral soil in dry conditions would decrease the risk of desiccation of seedlings. This would be true for the hinge position as well, where the seedlings, in general, also grew better than in mineral soil and equally well as in capped mounds (with the exception of 30 cc pine). The relatively high risk of pine weevil damage in the hinge position for pine as found in this study may be different with other site conditions, but should also be considered if the site is within a pine weevil dense area. However, if the choice would be a mechanical soil preparation method that does not aim to make capped mounds, hinges will not be present either.
Regarding the analyses of total dry weight and shoot:root ratios based on the dry weights, it should be noted that the root weights of the harvested seedlings are underestimated, since roots that grew far away from the seedlings were too difficult to dig up. Therefore, the difference between pine and spruce could, in part, be due to different root morphologies. Nevertheless, the analyses give an indication of total biomass growth which is seldom assessed in field studies. The trends with respect to total (root and shoot) dry weights of harvested seedlings were similar to those for stem basal diameter for pine. There was an extreme increase in dry weight for 50 cc pine seedlings in the hinge position from AP-treatment. We found that it this was related to the high number of seedlings with multiple leader shoots in the hinge position among the 50 cc pine seedlings. Naturally, a higher number of leader shoots will lead to a greater dry weight. For the harvested seedlings the number of multiple leaders were counted, and there were many seedlings with more than four leader shoots. Due to the large variations in the data, the pattern of AP treated seedlings having more multiple shoots was not significant. Nevertheless, there was a clear trend for AP-treated seedlings to have higher numbers of multiple shoots both in the hinge and capped mound positions. For spruce, the trends associated with the planting position in which the seedlings had higher total dry weight differed from the height trends. Nevertheless, total dry weight was, in general, lower in mineral soil for both tree species, with the exception of 30 cc spruce, for which there was no difference in total dry weight between planting positions. For spruce, the difference between seedling sizes was more exaggerated for dry weight than for height. Harvested spruce seedlings had lower shoot:root ratio than pine, suggesting that spruce grew relatively more belowground compared to pine, as shown by the shoot:root ratio of pine increasing by approximately three times the original ratio, while for spruce the ratio had only almost doubled. The shoot:root ratio of pine was highest in hinge positions for all three sizes.
The relative increase in growth from the original size clearly decreased with seedling size for pine, while for spruce there was less difference between the two smaller sizes. This may be related to the initial shoot:root ratio, which clearly increased with increasing size for pine; this pattern was less pronounced for spruce. One reason behind this pattern for pine is that there was a very high proportion of seedlings with only one needle per bundle for the 30 cc seedlings, which naturally had a lower the shoot weight compared to seedlings with two needles per bundle. This also means that the smaller seedlings had an initially lower photosynthetic capacity. However, this did not seem to affect their ability to produce biomass after three years in the field, since the total dry weight after this time was similar to the 50 cc seedlings.
In addition to the results related to our hypotheses, we found a large number of pine seedlings with multiple leading shoots. This affects height growth and is probably the main reason why height measurements did not correspond well to dry weight for pine when we compared these values for the harvested seedlings (Supplementary File S1). The number of seedlings with multiple leading shoots was, overall, lower in the mineral soil positions. This lower number may potentially compensate for the lower growth in mineral soil positions in the long run, since trees with multiple stems are not desirable in forestry. However, even in mineral soil, there were very high numbers compared to other reports, in which approximately 10-20 % of seedlings displayed multiple leading shoots [36,37]. Browsing was not the cause, since browsing damage affected <1 % of the seedlings. It has recently been reported that there is an overall increase in occurrence of multiple leading shoots in Sweden [37]. The exact cause has not been identified yet. However, it has been found that the occurrence of proleptic shoots, i.e., shoots that grow from the current year´s lateral buds at the base of the terminal bud, disturbs apical dominance and can develop into multiple leading shoots [38]. We did not find any significant trends associated with the proleptic shoots from the previous year leading to multiple shoots in this study. However, there were trends for the occurrence of adventitious buds in the previous year correlating with multiple leading shoots, albeit with differing effects in different planting positions for 50 cc pine seedlings. We do not consider adventitious buds in the previous year to be a direct cause of multiple leading shoots, but the correlation may indicate that these growth anomalies could have a common cause. Adventitious bud formation can be a response to stress, such as damage and changes in environmental conditions [39,40]. Adventitious bud formation is deliberately promoted by top-pruning of young seedlings when propagating trees from cuttings [41,42], i.e., one known pre-requisite condition for adventitious buds to develop is disturbing apical dominance. As the seedlings in the trial were not pruned (other than very low occurrence of damage by browsing and other insect activity) there must be another explanation behind the growth anomalies. There are some correlations in previous research that indicate that environmental change, such as increasing CO2 and temperature, could be the cause of increasing occurrence of prolepsis and multiple leading shoots; positive responses to increased CO2 and changes in nutrient conditions have been detected in early nursery trials [38], and insufficient chilling time during winter dormancy can delay budburst and cause growth anomalies [43,44,45,46]. The timing of bud set may also have been earlier than optimal, since the study site is in the southern region of that considered appropriate for the pine seed material provenance. Moving northern material further south results in earlier height growth cessation due to adaption to the photoperiod [47]. Dormancy has been found to be induced faster in apical buds than in lateral buds and not induced at all in adventitious buds in Betula [48]. If this is also the case for the adventitious buds of pine, these buds may have an advantage if bud break is delayed. However, this is a hypothesis that is beyond the scope of this study but could be a topic for further research. Furthermore, disturbance of apical dominance can be an expression of boron deficiency [49,50,51,52]. Boron deficiency in the Nordic countries has previously been found mainly in stands that have been fertilized, limed, burnt, or previously used as farmland [50,52]. However, there may be a correlation with the increased CO2 level as well, since increased CO2 levels have been found to decrease B levels in plants [53]. To determine whether boron deficiency is a cause of the multiple leading shoots, nutrient analysis of needles is required. Levels of 5-20 ppm are reported as normal, while levels <5 ppm could indicate deficiency, and levels of 2-3 ppm could cause visible damage [52].
Based on the results in this and other studies in which seedlings performed well in capped mounds, it may seem like this is the optimal planting position. In the current study, the seedlings planted in capped mounds did, indeed, display both high survival and growth. However, the occurrence of multiple leading shoots tended to be higher than in mineral soil. It is also important to remember that we actively avoided planting positions where the mounds were of insufficient quality (e.g. not compacted due to interference of branches, logs or other obstacles). The maximum potential number of planting positions for each tree species, in theory, would be 24 (maximum number of seedlings in a row) times 3 (the three different sizes of seedlings) times 14 (number of blocks/replicates) = 1008. In reality, 633 triplets of pine and 643 of spruce were planted, i.e., only 60 % in the pine area and 64 % in the spruce area of potential planting positions were used in this trial. The remaining potential planting positions were either of poor quality (e.g. not compacted due to interference of branches, logs or other obstacles), or absent (e.g. where the mechanical soil preparation failed due to obstacles). Of these mounds, only 50 % in the pine area and 49 % in the spruce area were capped mounds covered by mineral soil, i.e., of class 9. For the hinge positions, 80 % in the pine area and 64 % in the in the spruce area were classified as high quality (class 6). It has been found in other studies that within site variation, including the number of suitable planting spots and water availability, affects survival of spruce seedlings [54]. It should, in this context, also be noted that the precipitation sum during the first month following planting was ~39 mm at the closest SMHI weather station, Torrböle D, ~20 km to the study site (SMHI 2023), which is sufficient for water supply from above. If, instead, there had been a dry month, mortality would probably have been higher for the capped mound positions, since the seedlings planted in mounds are more dependent on precipitation [9,55].
Mounding is a method that is most appropriate for moist and/or flat sites with fine soil where the seedlings have the advantage of elevation, especially to improve soil aeration; at such sites, the lower elevation planting positions would be at risk of oxygen deficiency for the roots [8,9]. It is also important to remember that the ideal position of the seedling root substrate as presented in Figure 2 is rarely achieved. In reality, capped mounds are highly heterogenous due to the high variation in site conditions. In practice it is often difficult to plant the seedling deep enough due to stoniness or other obstacles. Furthermore, it not possible to assess the interior of each capped mound to ensure the seedling root substrate position. On dry to mesic sites with permeable soil, patch scarification may be sufficient, considering that the effort expended in making capped mounds does not always result in sufficient suitable planting spots in the actual mounds. In addition, the risk of capped mounds being too dry when there is limited precipitation during the establishment phase would be avoided.
Furthermore, instructing planters not to prioritize capped mounds on dry sites would logically decrease the risk of planting in low quality positions, considering our results in which there was a lower risk of choosing low quality positions in mineral soil than in hinge and capped mound positions. The proportion of low-quality positions based on the total percentage for each main planting position in our study was approximately 15 % for mineral soil positions, 28 % for hinge and 31 % for capped mound positions (averaged over the classifications for pine and spruce, based on class 8 being counted as low quality for spruce but not for pine).
As a final remark, the results in our study, as well as other trial case studies, are likely to be biased towards a better outcome than in a commercial regeneration situation where the variability of planting position quality might be higher. Where a seedling ends up being planted depend on planting performance as well as availability of high-quality planting positions. The planters are generally paid per planted seedling and to consider planting position as carefully as in a trial would be too time consuming, and the availability of high-quality positions depend on MSP method and performance which in turn is highly dependent site conditions.
5. Conclusion
This study represents a situation where pine weevil was the main agent of damage and mortality and sufficient rainfall fell during the first month after planting. Here, the quality of planting position affected the outcome of survival more than the choice of mineral, hinge or capped mound positions for pine and spruce seedlings, following three growing seasons after planting, On this particular site, planting larger seedlings conferred no great advantage. Although not affecting mortality, larger seedlings attracted more pine weevil damage than smaller seedlings, multiple leading shoots were more common on larger pine seedlings, and the largest seedling size had the lowest relative growth increase from the time of planting to the time of inventory. The choice of planting position affected growth in different ways. There were, in general, fewer seedlings with multiple leading shoots in mineral soil positions, albeit only significantly so for the smallest pine seedlings. Seedlings grew more in hinge and capped mound positions than in mineral soil, except for spruce 50 cc which grew more in hinge than in capped mound and mineral soil positions. Addition of arginine phosphate had a small but significant effect on all seedling sizes for spruce, while there was an interaction with planting position for the smaller pine sizes and no effect for the 90 cc pine seedlings. The effect compensated for some, but not all of the differences in nutrient availability between mineral soil positions and capped mounds on this site. On other sites there might be other conditions that would give different results, hence more studies of the effects of arginine phosphate in different planting positions and with different seedling material over varying site conditions would be needed to expand on the applicability of the results.
Supplementary Materials
The following supporting information can be downloaded at the website of this paper posted on Preprints.org. Table S1: title; Field inventory data, Table S2: title; Harvested seedling data.
Author Contributions
Conceptualization, J.H., J.Ö., A.N. and B.H.; methodology, B.H..; validation, J.H., J.Ö., A.N. and B.H..; formal analysis, B.H.; investigation, , J.H., J.Ö., and B.H.; resources, J.H. and J.Ö.; data curation, B.H.; writing—original draft preparation, B.H.; writing—review and editing, A.N., J.Ö., J.H.; visualization, B.H.; supervision, A.N., J.H. and J.Ö.; project administration, J.H., J.Ö., B.H.; funding acquisition, A.N. and J.Ö. All authors have read and agreed to the published version of the manuscript.
Funding
The project was funded by the Kempe foundation, the Knut and Alice Wallenberg Foundation under Grant number KAW 2016.0341, KAW 2018.0259, the Swedish Governmental Agency for Innovation Systems under Grant number 2016-00504. The funding of BH’s PhD position was provided by from the Research School in Forest Genetics, Biotechnology and Breeding at the Umeå Plant Science Centre, UPSC, at the Swedish University of Agricultural Sci ences (SLU) being part of the Competence Centre program of the Swedish Governmental Agency for Innovation Systems (VINNOVA).
Data Availability Statement
The original contributions presented in the study are included in the supplementary material, further inquiries can be directed to the corresponding author.
Acknowledgments
We thank the field staff at Skogforsk for performing the planting, inventories, and harvest of seedlings, as well as preparation of the harvested seedlings at the Skogforsk station in Sävar. We thank the landowner, Holmen, for allowance to use their land for our experiment.
Conflicts of Interest
AN is besides her affiliation to the Swedish University of Agricutural Sciences employed at Stora Enso, a forest industry company. JÖ, JH and BH declare no conflict of interest. The funders had no role in the design of the study; in the collection, analyses, or interpretation of data; in the writing of the manuscript; or in the decision to publish the results.
Appendix A
For the harvested seedlings, we compared the field measurements of height and stem base diameter made before harvest to dry weight by linear regression models. The relationship is not truly linear, but the purpose of the models is to evaluate which measurement that best represent the mass of the seedlings. For spruce, height represented shoot and root dry weight better for the smallest seedlings and root dry weight of the largest seedlings, while stem base diameter better represented shoot and root dry weight for the medium sized seedlings and shoot dry weight of the larger seedlings. However, stem base diameter measurements were missing for half of the spruce seedlings. As the relations to dry weight was similar for spruce height and diameter, we therefore chose to use spruce height in the analyses. For pine, the relation between height and dry weight was much weaker than the relation between stem base diameter and dry weight for all three sizes. We therefore chose to use pine stem base diameter in the analyses.
Figure A1.
Regression models for root dry weight of pine of the three sizes (1=30cc,2=50cc,3=90cc) respec3vely, vs (a) height measured in field and (b) stem base diameter measured in field (i.e., measurements made before harvest).
Figure A1.
Regression models for root dry weight of pine of the three sizes (1=30cc,2=50cc,3=90cc) respec3vely, vs (a) height measured in field and (b) stem base diameter measured in field (i.e., measurements made before harvest).
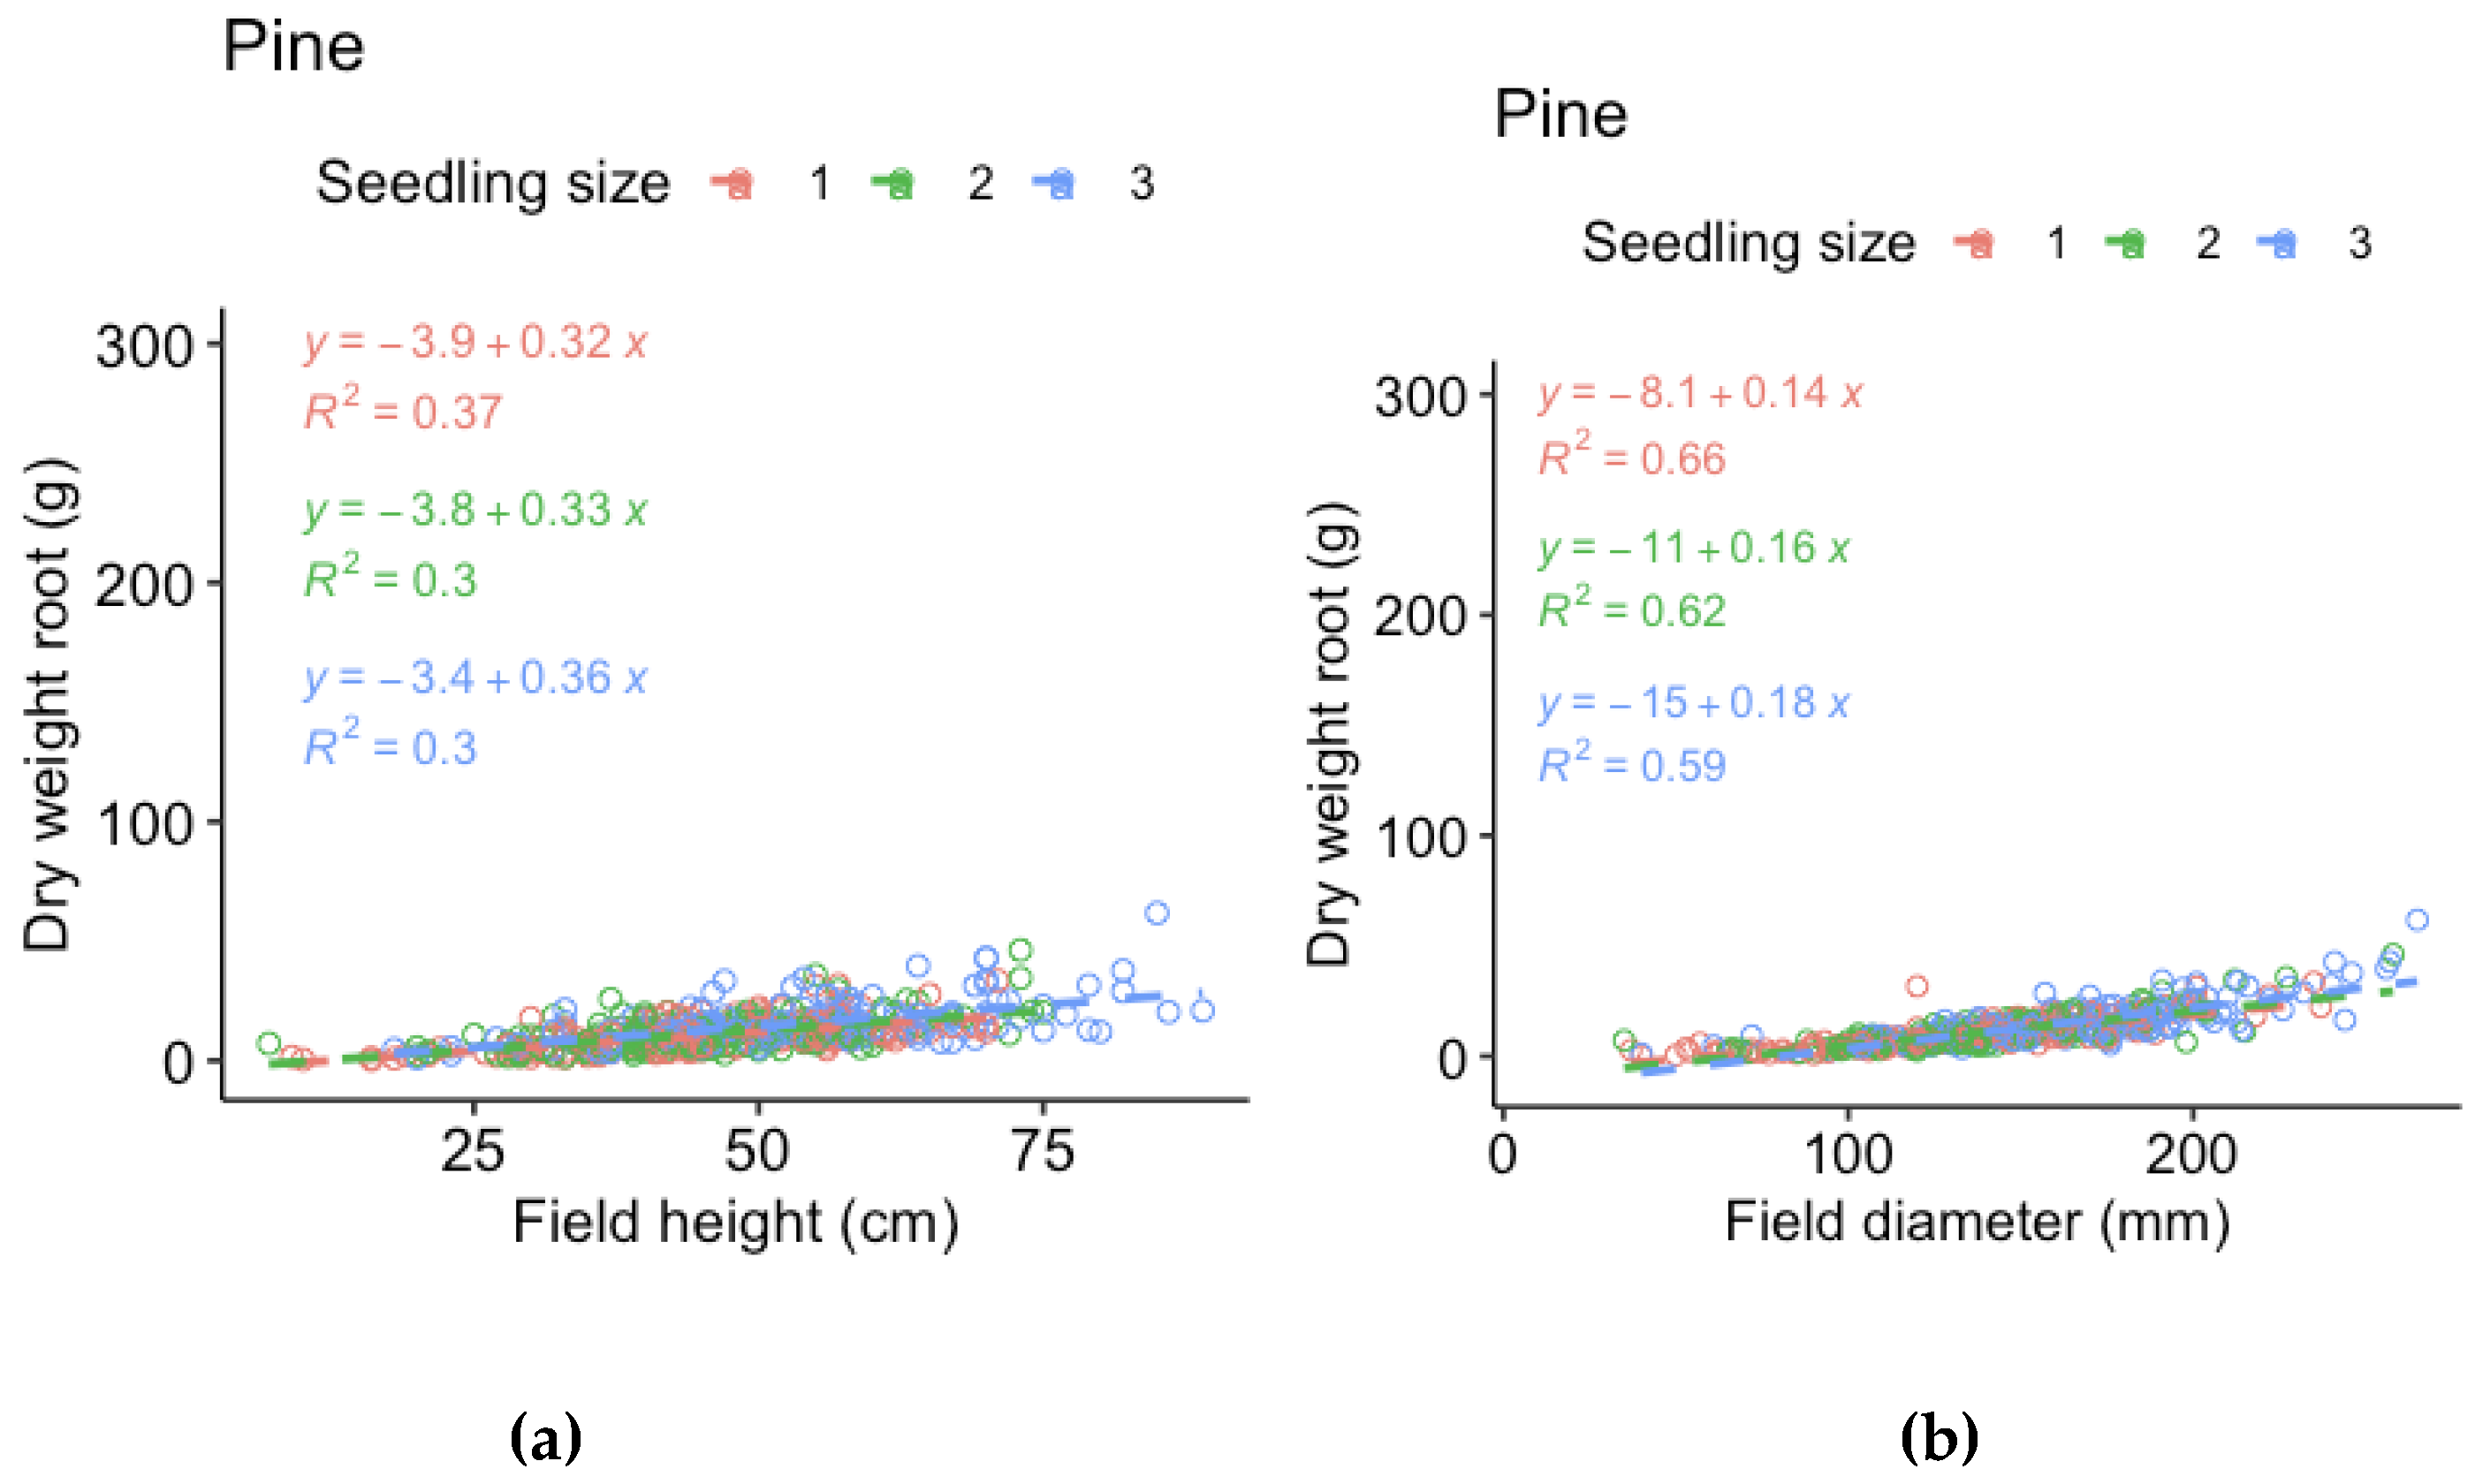
Figure A2.
Regression models for shoot dry weight of pine of the three sizes (1 = 30 cc, 2 = 50 cc, 3 = 90 cc) respec3vely, vs (a) height measured in field and (b) stem base diameter measured in field (i.e., measurements made before harvest).
Figure A2.
Regression models for shoot dry weight of pine of the three sizes (1 = 30 cc, 2 = 50 cc, 3 = 90 cc) respec3vely, vs (a) height measured in field and (b) stem base diameter measured in field (i.e., measurements made before harvest).
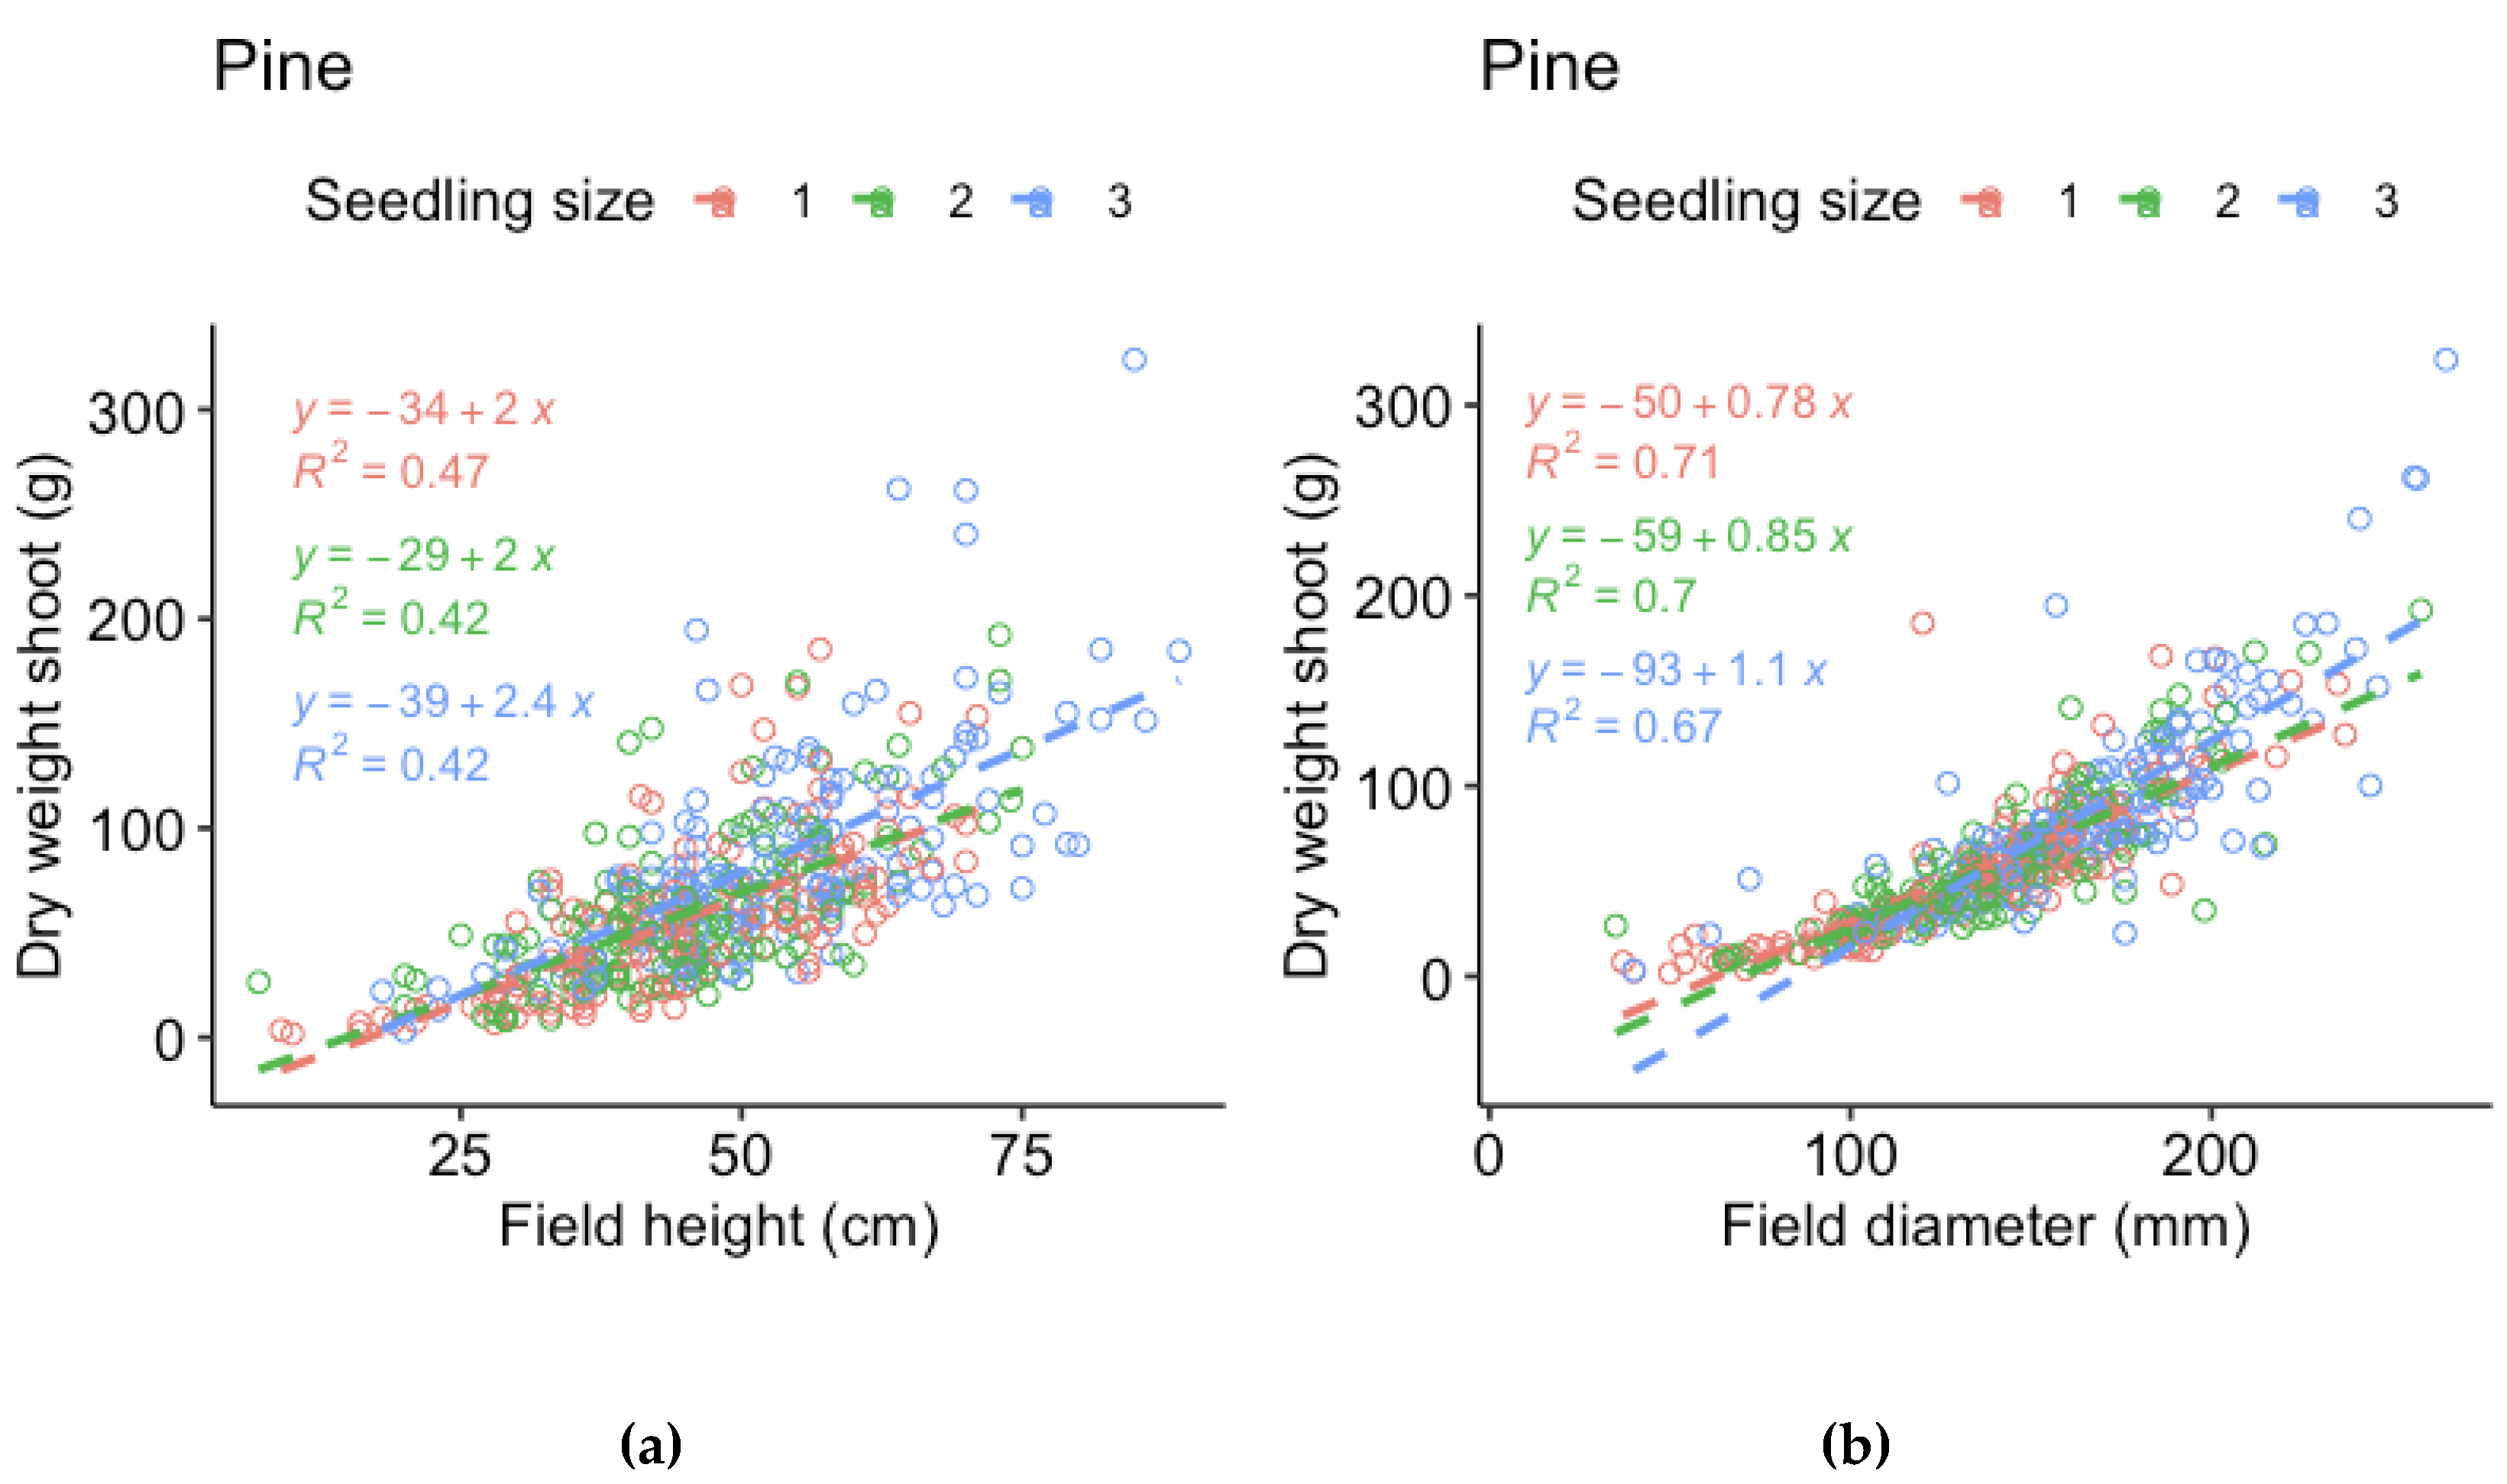
Figure A3.
Regression models for root dry weight of spruce of the three sizes (1 = 30 cc, 2 = 50 cc, 3 = 90 cc) respec3vely, vs (a) height measured in field and (b) stem base diameter measured in field (i.e., measurements made before harvest).
Figure A3.
Regression models for root dry weight of spruce of the three sizes (1 = 30 cc, 2 = 50 cc, 3 = 90 cc) respec3vely, vs (a) height measured in field and (b) stem base diameter measured in field (i.e., measurements made before harvest).
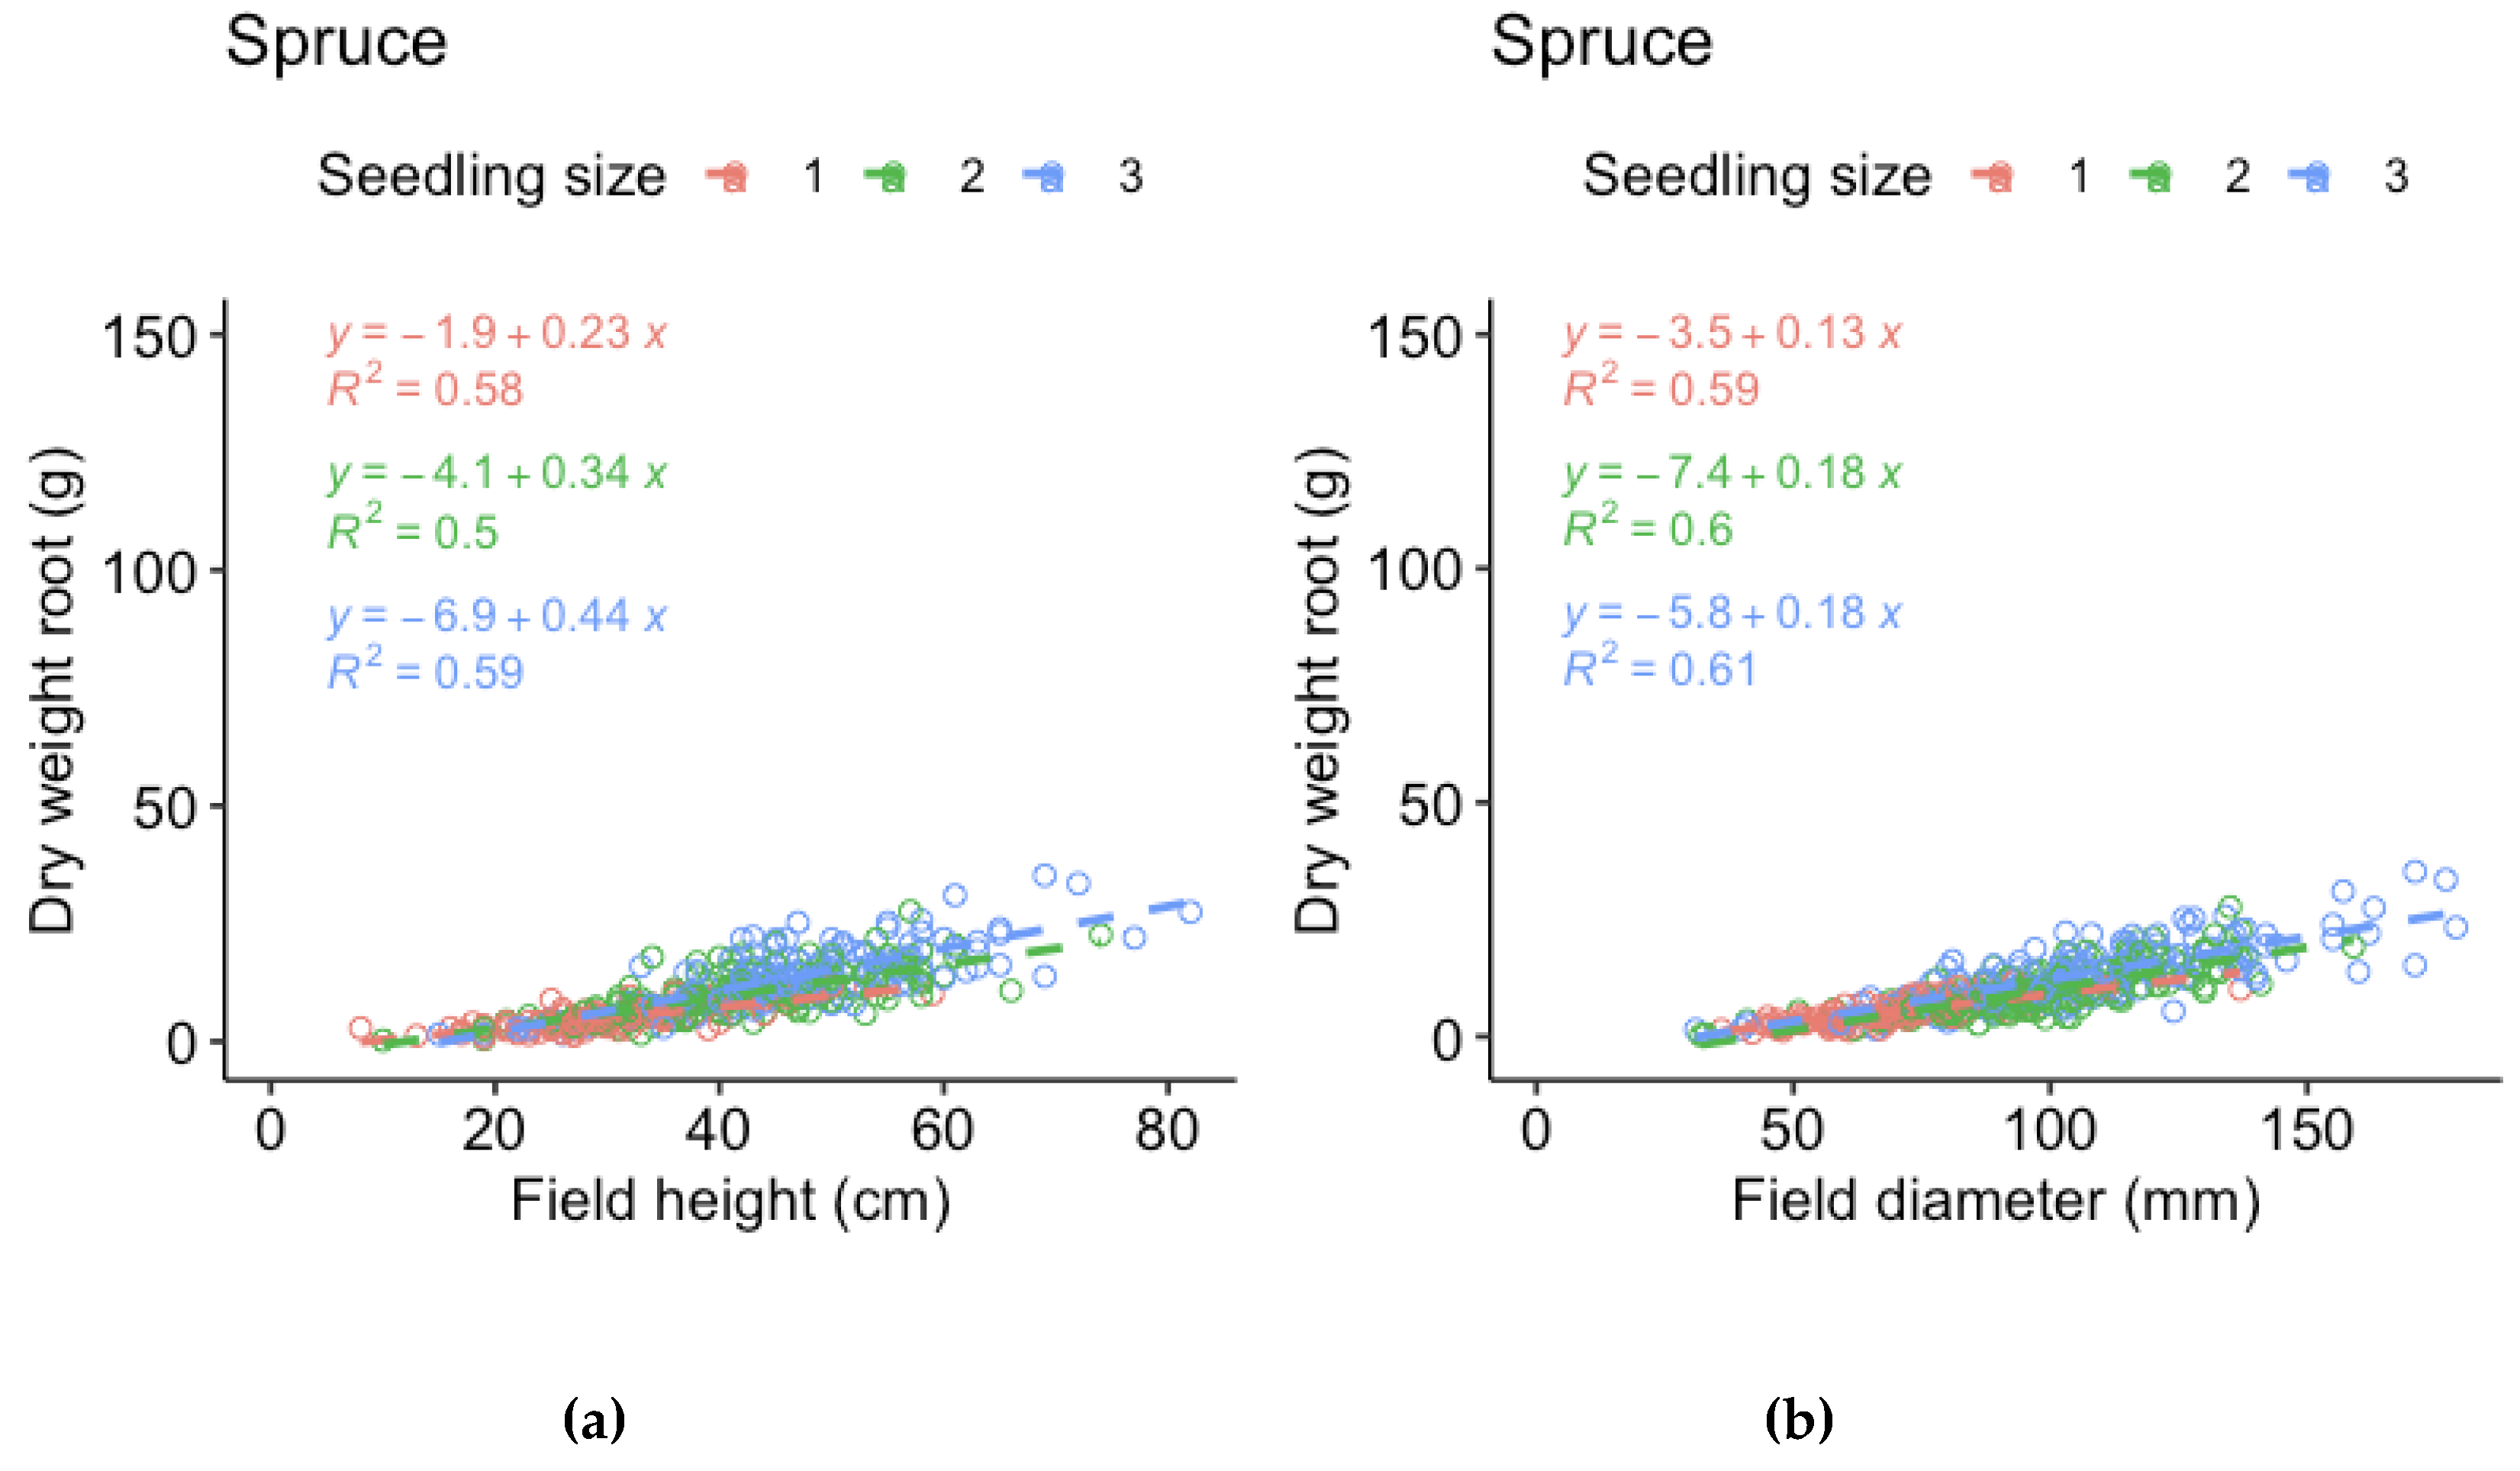
Figure A4.
Regression models for shoot dry weight of spruce of the three sizes (1 = 30 cc, 2 = 50 cc, 3 = 90 cc) respec3vely, vs (a) height measured in field and (a) stem base diameter measured in field (i.e., measurements made before harvest).
Figure A4.
Regression models for shoot dry weight of spruce of the three sizes (1 = 30 cc, 2 = 50 cc, 3 = 90 cc) respec3vely, vs (a) height measured in field and (a) stem base diameter measured in field (i.e., measurements made before harvest).
Appendix B
For the dry weights, only total dry weight (root + shoot) is presented in the main results. Shoot and root dry weights are presented separately along with ANOVA tables from the separate analyses. As pointed out in the main text, the shoot weights do not include the entire root system as it was increasingly difficult to dig out roots the further away from the seedling they grew. For pine, the effect of AP addition was only significant for the 50 cc seedlings, including interaction for shoot dry weight while significant on its own for root dry weight. For spruce, AP addition had a significant effect on both shoot and root dry weight of the two smaller seedling sizes.
Figure A5.
Results from ANOVA for harvested pine seedling shoot and root dry weight, for seedlings of size (a), (d) 30 cc, (b ), (e) 50 cc and (c), (f) 90 cc for each planting position group, respectively, following the third field season. Columns indicate dry weight in g and error bars indicate standard error. Different letters indicate significant differences. When there was an interaction between the factors, letters are displayed above each column, when there was no interaction, the letters are displayed above each planting position group. HQ Min = high quality mineral soil position (classes 2 and 4); HQ Hinge = high quality hinge positions (class 6); LQ = low-quality positions (classes 1, 3, 5, and 7); and CM = high quality capped mound (classes 8 and 9).
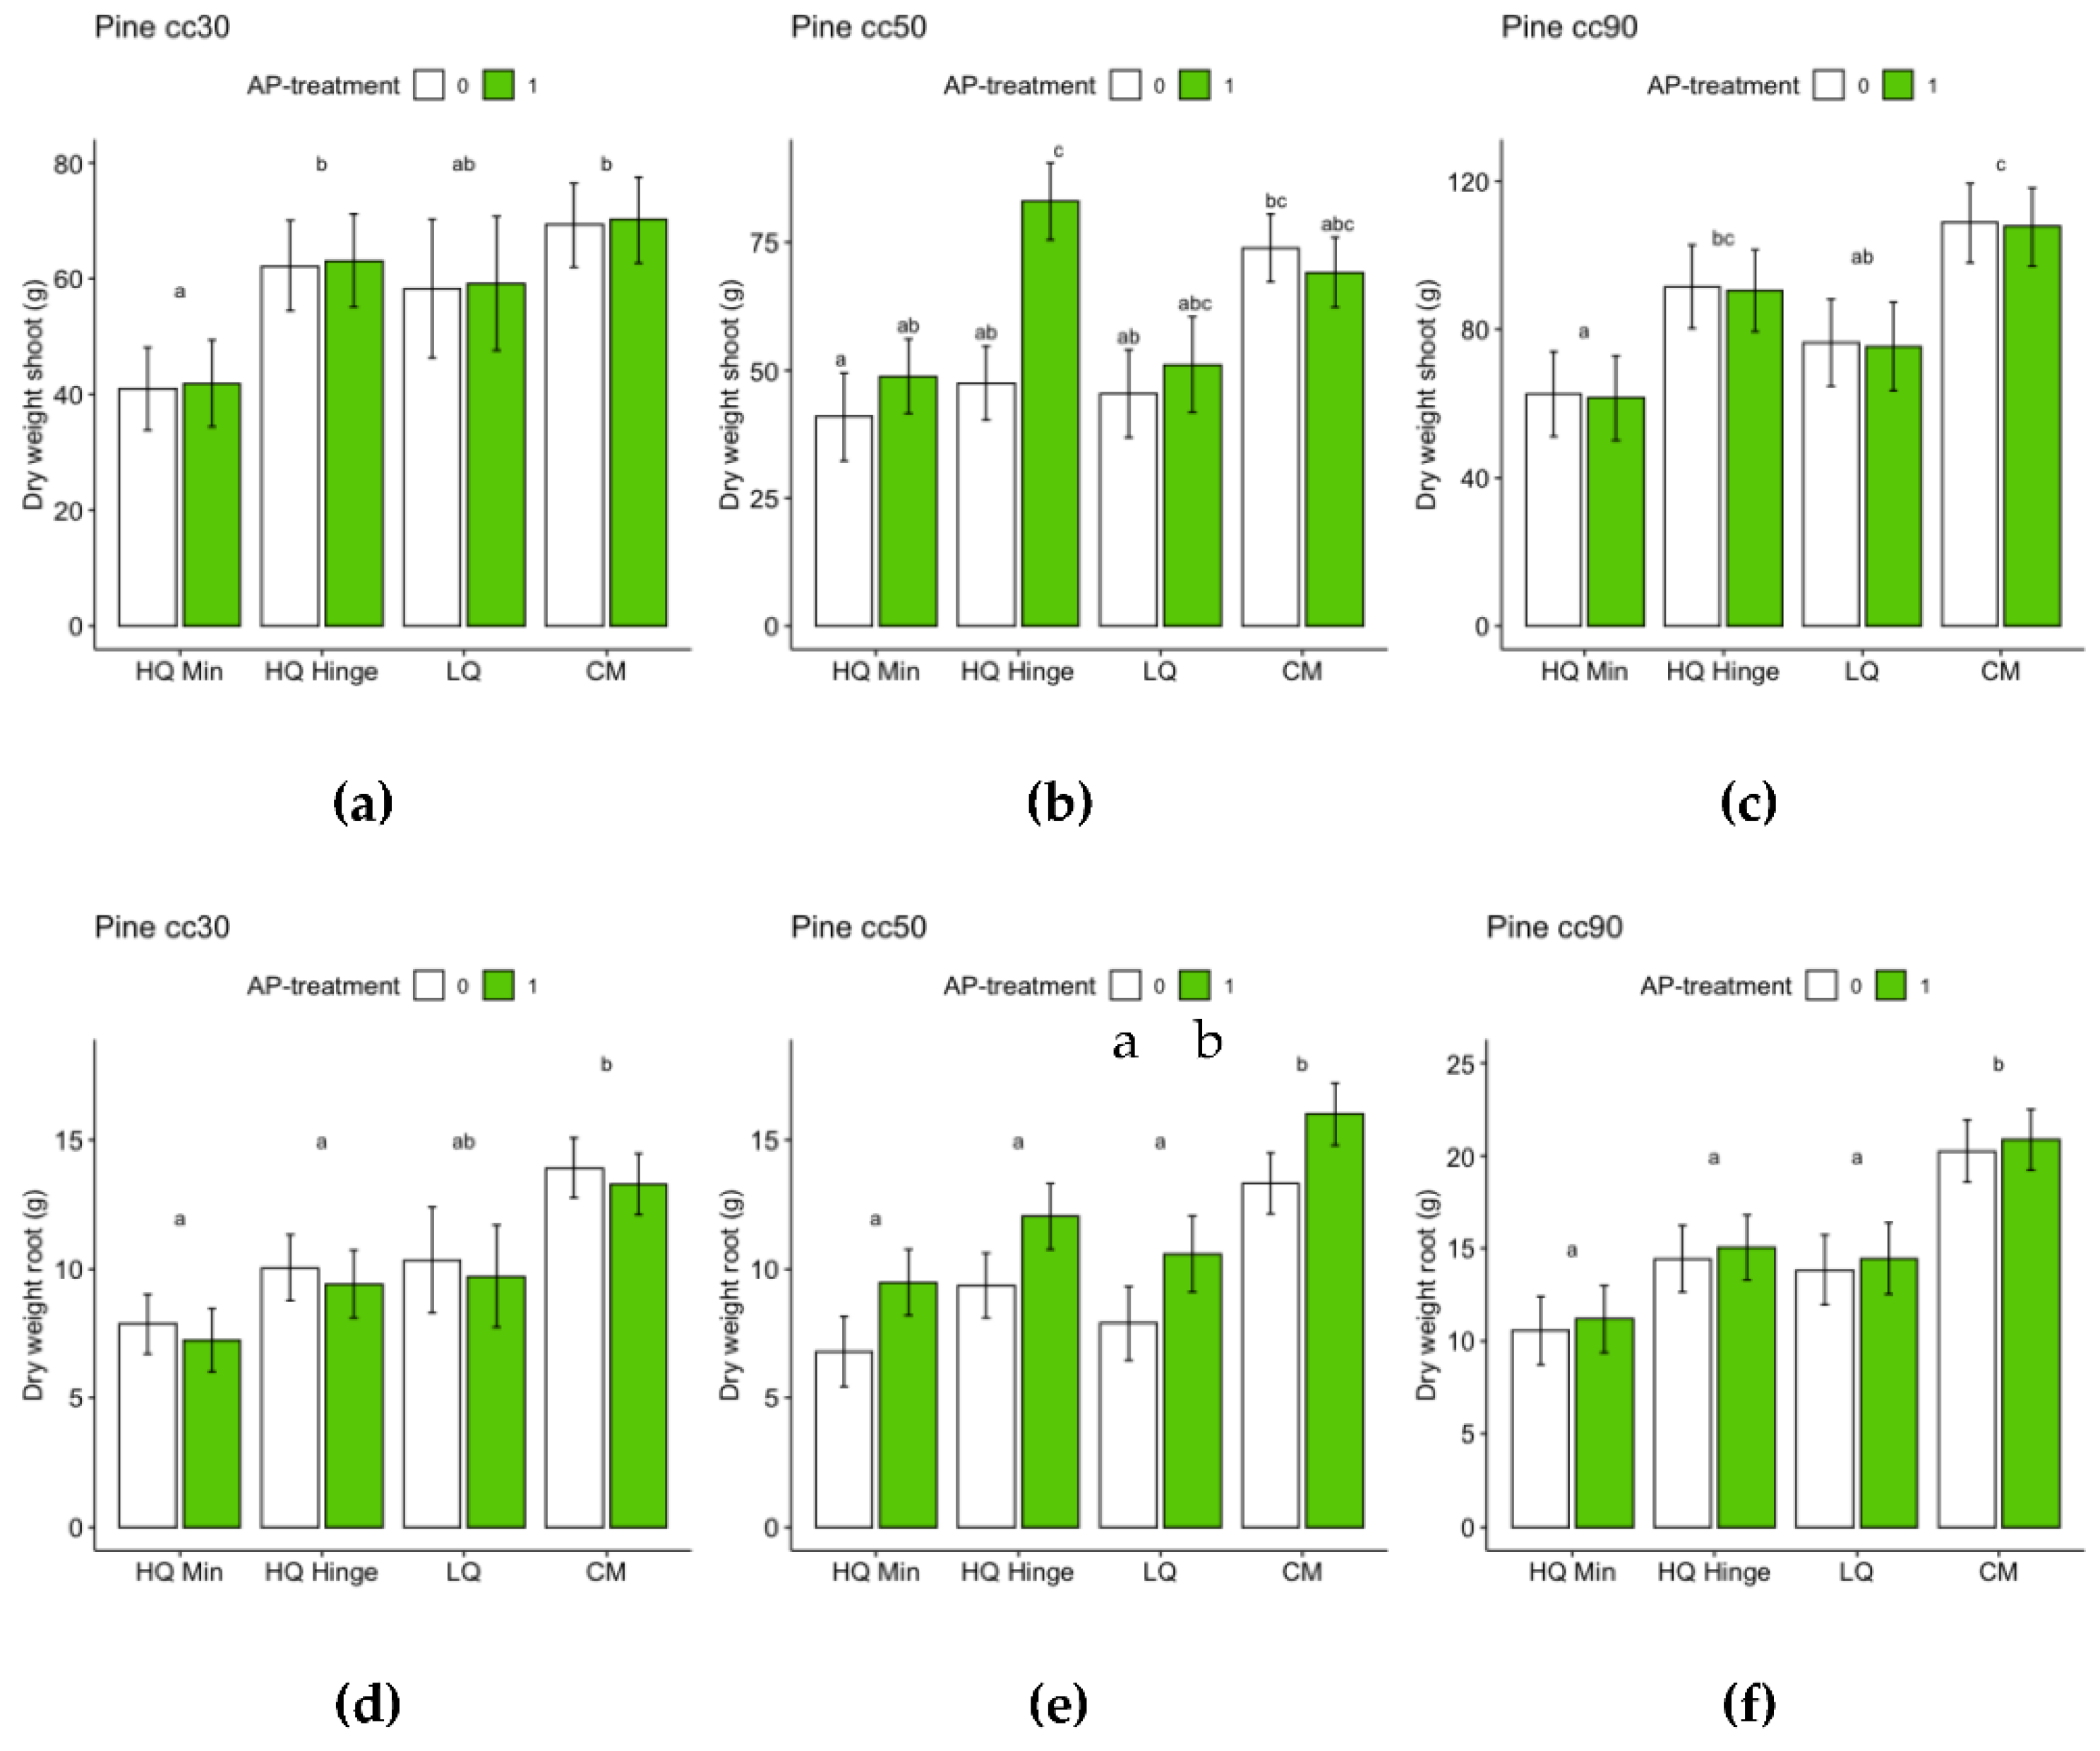

Table S11.
Results from ANOVA (type II/III Wald F tests with Kenward-Roger df) on linear mixed models for root and shoot dry weight respectively of pine seedlings following the third growing season in the field. Significant results are highlighted in bold text. Positions for pine are high quality mineral soil (classes 2 and 4), high quality hinge (class 6), low quality positions (classes 1, 3, 5 and 7) and capped mound (classes 8 and 9).
| Pine (shoot dry weight) | Pine (root dry weight) | |||||||
| Size | Factor | Df | F | Df.res | Pr(>F) | F | Df.res | Pr(>F) |
| 30 cc | Position | 3 | 6.15 | 138.36 | < 0.001 | 8.59 | 139.84 | < 0.001 |
| AP | 1 | 0.03 | 137.88 | 0.87 | 0.39 | 138.2 | 0.53 | |
| Position:AP | 3 | - | - | - | - | - | - | |
| 50 cc | Position | 3 | 6.22 | 144.05 | < 0.001 | 9.32 | 146.04 | < 0.001 |
| AP | 1 | 4.30 | 142.33 | 0.04 | 7.32 | 144.18 | 0.007 | |
| Position:AP | 3 | 3.02 | 144.03 | 0.03 | - | - | - | |
| 90 cc | Position | 3 | 7.99 | 140.9 | < 0.001 | 10.48 | 141.79 | < 0.001 |
| AP | 1 | 0.02 | 139.3 | 0.89 | 0.22 | 139.52 | 0.64 | |
| Position:AP | 3 | - | - | - | - | - | - | |
Figure A6.
Results from ANOVA for harvested spruce seedling shoot and root dry weight, for seedlings of size (a), (d) 30 cc, (b), (e) 50 cc and (c), (f) 90 cc for each planting position group, respectively, following the third field season. Columns indicate dry weight in g and error bars indicate standard error. The different letters displayed above each planting position group indicate significant differences between these groups averaged over the values of treatment, while letters under the treatment legend indicate significant effect of treatment averaged over the levels of planting position group. HQ Min = high quality mineral soil position (classes 2 and 4); HQ Hinge = high quality hinge positions (class 6); LQ = low quality positions (classes 1, 3, 5, 7 and 8); and HQ CM = high quality capped mound (class 9).
References
- SLU. Skogsdata 2023 SLU Institutionen för skoglig resurshushållning: Uppsala, 2023.
- Burdett, A.; Simpson, D.; Thompson, C. Root development and plantation establishment success. Plant Soil 1983, 71, 103–110. [Google Scholar] [CrossRef]
- Grossnickle, S.C. Why seedlings survive: influence of plant attributes. New Forest 2012, 43, 711–738. [Google Scholar] [CrossRef]
- Burdett, A.N. Physiological Processes in Plantation Establishment and the Development of Specifications for Forest Planting Stock. Can J Forest Res 1990, 20, 415–427. [Google Scholar] [CrossRef]
- Johansson, K.; Hajek, J.; Sjölin, O.; Normark, E. Early performance of Pinus sylvestris and Picea abies – a comparison between seedling size, species, and geographic location of the planting site. Scandinavian Journal of Forest Research 2015, 30, 388–400. [Google Scholar] [CrossRef]
- Jobidon, R.; Roy, V.; Cyr, G. Net effect of competing vegetation on selected environmental conditions and performance of four spruce seedling stock sizes after eight years in Québec (Canada). Ann Forest Sci 2003, 60, 691–699. [Google Scholar] [CrossRef]
- Skogsstyrelsen. Statistical Reports: Silvicultural activites. Available online: (accessed on June 12).
- Sutton, R. Mounding site preparation: a review of European and North American experience. New Forest 1993, 7, 151–192. [Google Scholar] [CrossRef]
- Örlander, G.; Gemmel, P.; Hunt, J. Site preparation: A Swedish overview. 1990, No. 105.
- Löf, M.; Dey, D.C.; Navarro, R.M.; Jacobs, D.F. Mechanical site preparation for forest restoration. New Forest 2012, 43, 825–848. [Google Scholar] [CrossRef]
- Stathers, R.J.; Spittlehouse, D.L. Forest soil temperature manual; FRDA Research Program, Research Branch, BC Ministry of Forests and Lands: 1990.
- Day, K.; Nordlander, G.; Kenis, M.; Halldorson, G. General biology and life cycles of bark weevils. Bark and wood boring insects in living trees in Europe, a synthesis 2004, 331-349.
- Nilsson, U.; Luoranen, J.; Kolstrom, T.; Orlander, G.; Puttonen, P. Reforestation with planting in northern Europe. Scandinavian Journal of Forest Research 2010, 25, 283–294. [Google Scholar] [CrossRef]
- Kindvall, O.; Nordlander, G.; Nordenhem, H. Movement behaviour of the pine weevil Hylobius abietis in relation to soil type: an arena experiment. Entomologia Experimentalis et Applicata 2000, 95, 53–61. [Google Scholar] [CrossRef]
- Petersson, M.; Orlander, G.; Nordlander, G. Soil features affecting damage to conifer seedlings by the pine weevil Hylobius abietis. Forestry 2005, 78, 83–92. [Google Scholar] [CrossRef]
- Wallertz, K.; Bjorklund, N.; Hjelm, K.; Petersson, M.; Sundblad, L.G. Comparison of different site preparation techniques: quality of planting spots, seedling growth and pine weevil damage. New Forest 2018, 49, 705–722. [Google Scholar] [CrossRef]
- Petersson, M.; Örlander, G. Effectiveness of combinations of shelterwood, scarification, and feeding barriers to reduce pine weevil damage. Canadian Journal of Forest Research-Revue Canadienne De Recherche Forestiere 2003, 33, 64–73. [Google Scholar] [CrossRef]
- Wallertz, K.; Orlander, G.; Luoranen, J. Damage by pine weevil Hylobius abietis to conifer seedlings after shelterwood removal. Scandinavian Journal of Forest Research 2005, 20, 412–420. [Google Scholar] [CrossRef]
- Thorsen, Å.A.; Mattsson, S.; Weslien, J. Influence of stem diameter on the survival and growth of containerized Norway spruce seedlings attacked by pine weevils (Hylobius spp.). Scandinavian Journal of Forest Research 2001, 16, 54–66. [Google Scholar] [CrossRef]
- Örlander, G.; Nilsson, U. Effect of reforestation methods on pine weevil (Hylobius abietis) damage and seedling survival. Scandinavian Journal of Forest Research 1999, 14, 341–354. [Google Scholar] [CrossRef]
- Björklund, N.; Nordlander, G.; Bylund, H. Host-plant acceptance on mineral soil and humus by the pine weevil Hylobius abietis (L.). Agr Forest Entomol 2003, 5. [Google Scholar] [CrossRef]
- Luoranen, J.; Viiri, H.; Sianoja, M.; Poteri, M.; Lappi, J. Predicting pine weevil risk: Effects of site, planting spot and seedling level factors on weevil feeding and mortality of Norway spruce seedlings. Forest Ecology and Management 2017, 389, 260–271. [Google Scholar] [CrossRef]
- Skogsstyrelsen. Föreskrifter för anläggning av skog - regeringsuppdrag; Jönköping, 2018.
- Örlander, G.; Egnell, G.; Albrektson, A. Long-term effects of site preparation on growth in Scots pine. Forest Ecology and Management 1996, 86, 27–37. [Google Scholar] [CrossRef]
- Johansson, K.; Nilsson, U.; Orlander, G. A comparison of long-term effects of scarification methods on the establishment of Norway spruce. Forestry (London) 2012, 86, 91–98. [Google Scholar] [CrossRef]
- R Core Team. R: A language and environment for statistical computing. Available online: https://www.R-project.org/ (accessed on.
- Bates, D.; Machler, M.; Bolker, B.M.; Walker, S.C. Fitting Linear Mixed-Effects Models Using lme4. J Stat Softw 2015, 67, 1–48. [Google Scholar] [CrossRef]
- Fox, J.; Weisberg, S. An R companion to applied regression; Sage publications: 2018.
- Lenth, R. Emmeans: Estimated marginal means, aka least-squares means. R package version 2021, 1.7.1-1.
- Wickham, H. ggplot2: Elegant Graphics for Data Analysis; Springer-Verlag New York: 2016.
- Kuznetsova, A.; Brockhoff, P.B.; Christensen, R.H.B. lmerTest Package: Tests in Linear Mixed Effects Models. J Stat Softw 2017, 82, 1–26. [Google Scholar] [CrossRef]
- Nordlander, G.; Hellqvist, C.; Johansson, K.; Nordenhem, H. Regeneration of European boreal forests: Effectiveness of measures against seedling mortality caused by the pine weevil Hylobius abietis. Forest Ecology and Management 2011, 262, 2354–2363. [Google Scholar] [CrossRef]
- Nordlander, G.; Bylund, H.; Björklund, N. Soil type and microtopography influencing feeding above and below ground by the pine weevil Hylobius abietis. Agr Forest Entomol 2005, 7, 107–113. [Google Scholar] [CrossRef]
- López-Villamor, A.; Carreño, S.; Goldar, X.; Suárez-Vidal, E.; Sampedro, L.; Nordlander, G.; Björklund, N.; Zas, R. Risk of damage by the pine weevil Hylobius abietis in southern Europe: Effects of silvicultural and landscape factors. Forest Ecology and Management 2019, 444, 2090–2298. [Google Scholar] [CrossRef]
- Maňák, V.; Nordenhem, H.; Björklund, N.; Lenoir, L.; Nordlander, G. Ants protect conifer seedlings from feeding damage by the pine weevil Hylobius abietis. Agr Forest Entomol 2013, 15. [Google Scholar] [CrossRef]
- Häggström, B.; Lutter, R.; Lundmark, T.; Sjödin, F.; Nordin, A. Effect of arginine-phosphate addition on early survival and growth of Scots pine, Norway spruce and silver birch. Silva Fenn 2023, 57. [Google Scholar] [CrossRef]
- Högberg, K.-A.; Nilsson, O.; Palmér, S. Tillväxtstörningar på tallplantor. 2021.
- Aldén, T. Influence of CO2, moisture and nutrients on the formation of Lammas growth and prolepsis in seedlings of Pinus silvestris L. Studia forestalia Suecica 1971, 93. [Google Scholar]
- Del Tredici, P. Sprouting in temperate trees: A morphological and ecological review. The Botanical Review 2001, 67, 121–140. [Google Scholar] [CrossRef]
- Jimenez-Casas, M.; Zwiazek, J.J. Adventitious sprouting of Pinus leiophylla in response to salt stress. Ann Forest Sci 2014, 71, 811–819. [Google Scholar] [CrossRef]
- Högberg, K.-A. Rooting response of late summer cuttings taken from Pinus sylvestris half-sib families. Scandinavian Journal of Forest Research 2005, 20, 313–317. [Google Scholar] [CrossRef]
- Whitehill, S.; Schwabe, W. Vegetative Propagation of Pinus sylvestris. Physiologia Plantarum 2006, 35, 66–71. [Google Scholar] [CrossRef]
- Laube, J.; Sparks, T.H.; Estrella, N.; Hofler, J.; Ankerst, D.P.; Menzel, A. Chilling outweighs photoperiod in preventing precocious spring development. Global Change Biol 2014, 20, 170–182. [Google Scholar] [CrossRef] [PubMed]
- Harrington, C.A.; Gould, P.J. Tradeoffs between chilling and forcing in satisfying dormancy requirements for Pacific Northwest tree species. Front Plant Sci 2015, 6. [Google Scholar] [CrossRef] [PubMed]
- Devine, W.D.; Harrington, T.B. Belowground competition influences growth of natural regeneration in thinned Douglas-fir stands. Can J Forest Res 2008, 38, 3085–3097. [Google Scholar] [CrossRef]
- Cooke, J.E.K.; Eriksson, M.E.; Junttila, O. The dynamic nature of bud dormancy in trees: environmental control and molecular mechanisms. Plant, Cell & Environment 2012, 35, 1707–1728. [Google Scholar] [CrossRef]
- Dougherty, P.M.; Whitehead, D.; Vose, J.M. Environmental Influences on the Phenology of Pine. Ecological Bulletins 1994, 64–75. [Google Scholar]
- Junttila, O.; Nilsen, J.; Igeland, B. Effect of Temperature on the Induction of Bud Dormancy in Ecotypes of Betula pubescens and Betula pendula. Scandinavian Journal of Forest Research 2003, 18, 208–217. [Google Scholar] [CrossRef]
- Stone, E.L. Boron deficiency and excess in forest trees: A review. Forest Ecology and Management 1990, 37, 49–75. [Google Scholar] [CrossRef]
- Lehto, T.; Ruuhola, T.; Dell, B. Boron in forest trees and forest ecosystems. Forest Ecology and Management 2010, 260, 2053–2069. [Google Scholar] [CrossRef]
- Riikonen, J.; Lehto, T.; Rikala, R. Effects of boron fertilization in the nursery or after planting on the performance of Norway spruce seedlings on boron-poor sites. New Forest 2013, 44. [Google Scholar] [CrossRef]
- Pettersson, F. Boron additive needed in nitrogen fertilisation of coniferous forest on mineral soil; 846–2014; Uppsala, 2014.
- Mishra, S.; Heckathorn, S.A.; Frantz, J.M. Elevated CO2 affects plant responses to variation in boron availability. Plant Soil 2012, 350, 117–130. [Google Scholar] [CrossRef]
- Holmström, E.; Gålnander, H.; Petersson, M. Within-Site Variation in Seedling Survival in Norway Spruce Plantations. Forests 2019, 10, 181. [Google Scholar] [CrossRef]
- Häggström, B.; Domevščik, M.; Öhlund, J.; Nordin, A. Survival and growth of Scots pine (Pinus sylvestris) seedlings in north Sweden: effects of planting position and arginine phosphate addition. Scandinavian Journal of Forest Research 2021, 36, 423–433. [Google Scholar] [CrossRef]
Figure 1.
Trial design schematic. A) Map overview, with the study site location marked in yellow for Scots pine and green for Norway spruce. The contours for the entire 12.3 ha clearcut area and retention tree groups are indicated on the map. B) The study area was divided in 14 adjacent plots for Scots pine (Yellow) and Norway spruce (green), respectively. C) Each plot was split into three rows, in which seedlings of three different sizes (grown in containers with cell size of 30, 50 and 90cc) were planted for each tree species. The seedlings were planted in groups of three for each soil prepared spot: one in the capped mound, one in the hinge and one in the mineral soil. Seedlings in every second group of seedlings were given a dose of arginine-phosphate at planting, marked in red.
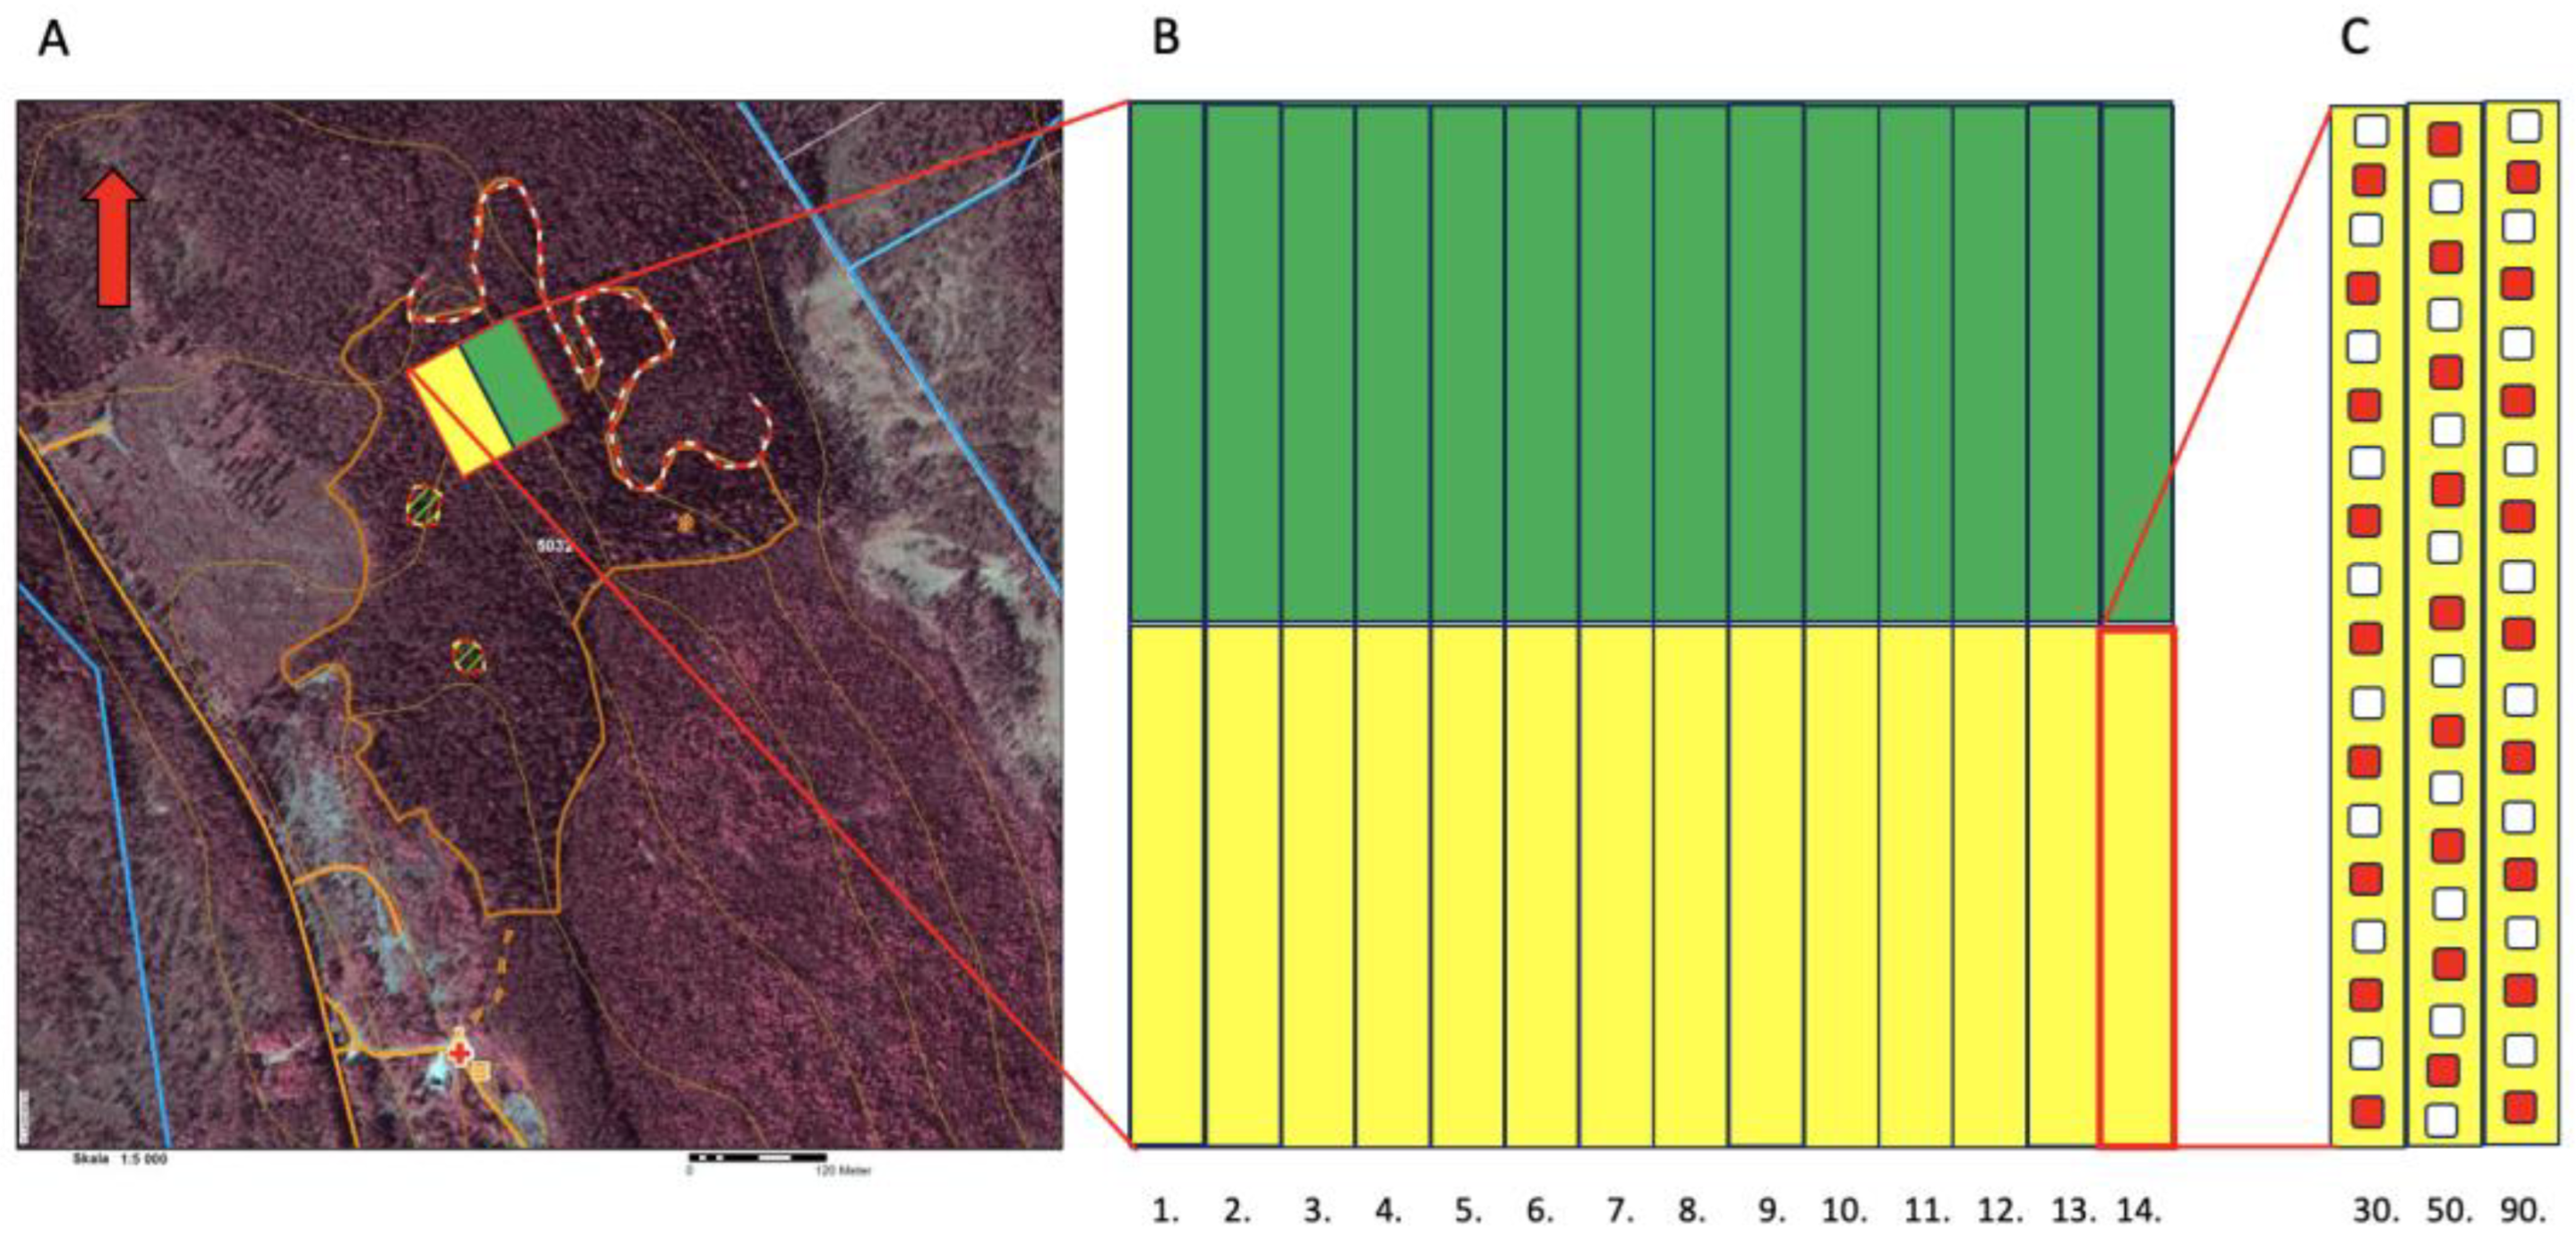
Figure 2.
Left: Illustration of planting positions, from left to right: mineral soil position, hinge position and capped mound position. The seedling should ideally be planted deep enough in the capped mound for the root substrate to penetrate the organic layers in order to ensure availability of capillary water. However, in reality, capped mounds are very heterogenous, and it is often difficult to plant the seedling deep enough and it is not possible to assess the interior of each capped mound to ensure the seedling root substrate position. Right: Excavated profile of a capped mound, in which the seedling substrate does not reach down into the organic material. From above, the capped mound looks like a class 9, but below there are a lot of branches hidden in the organic layers. The thickness of the mineral soil layer is not possible to assess just by casual observation. The background is greyed out to make it clearer where the surface of the capped mound starts.
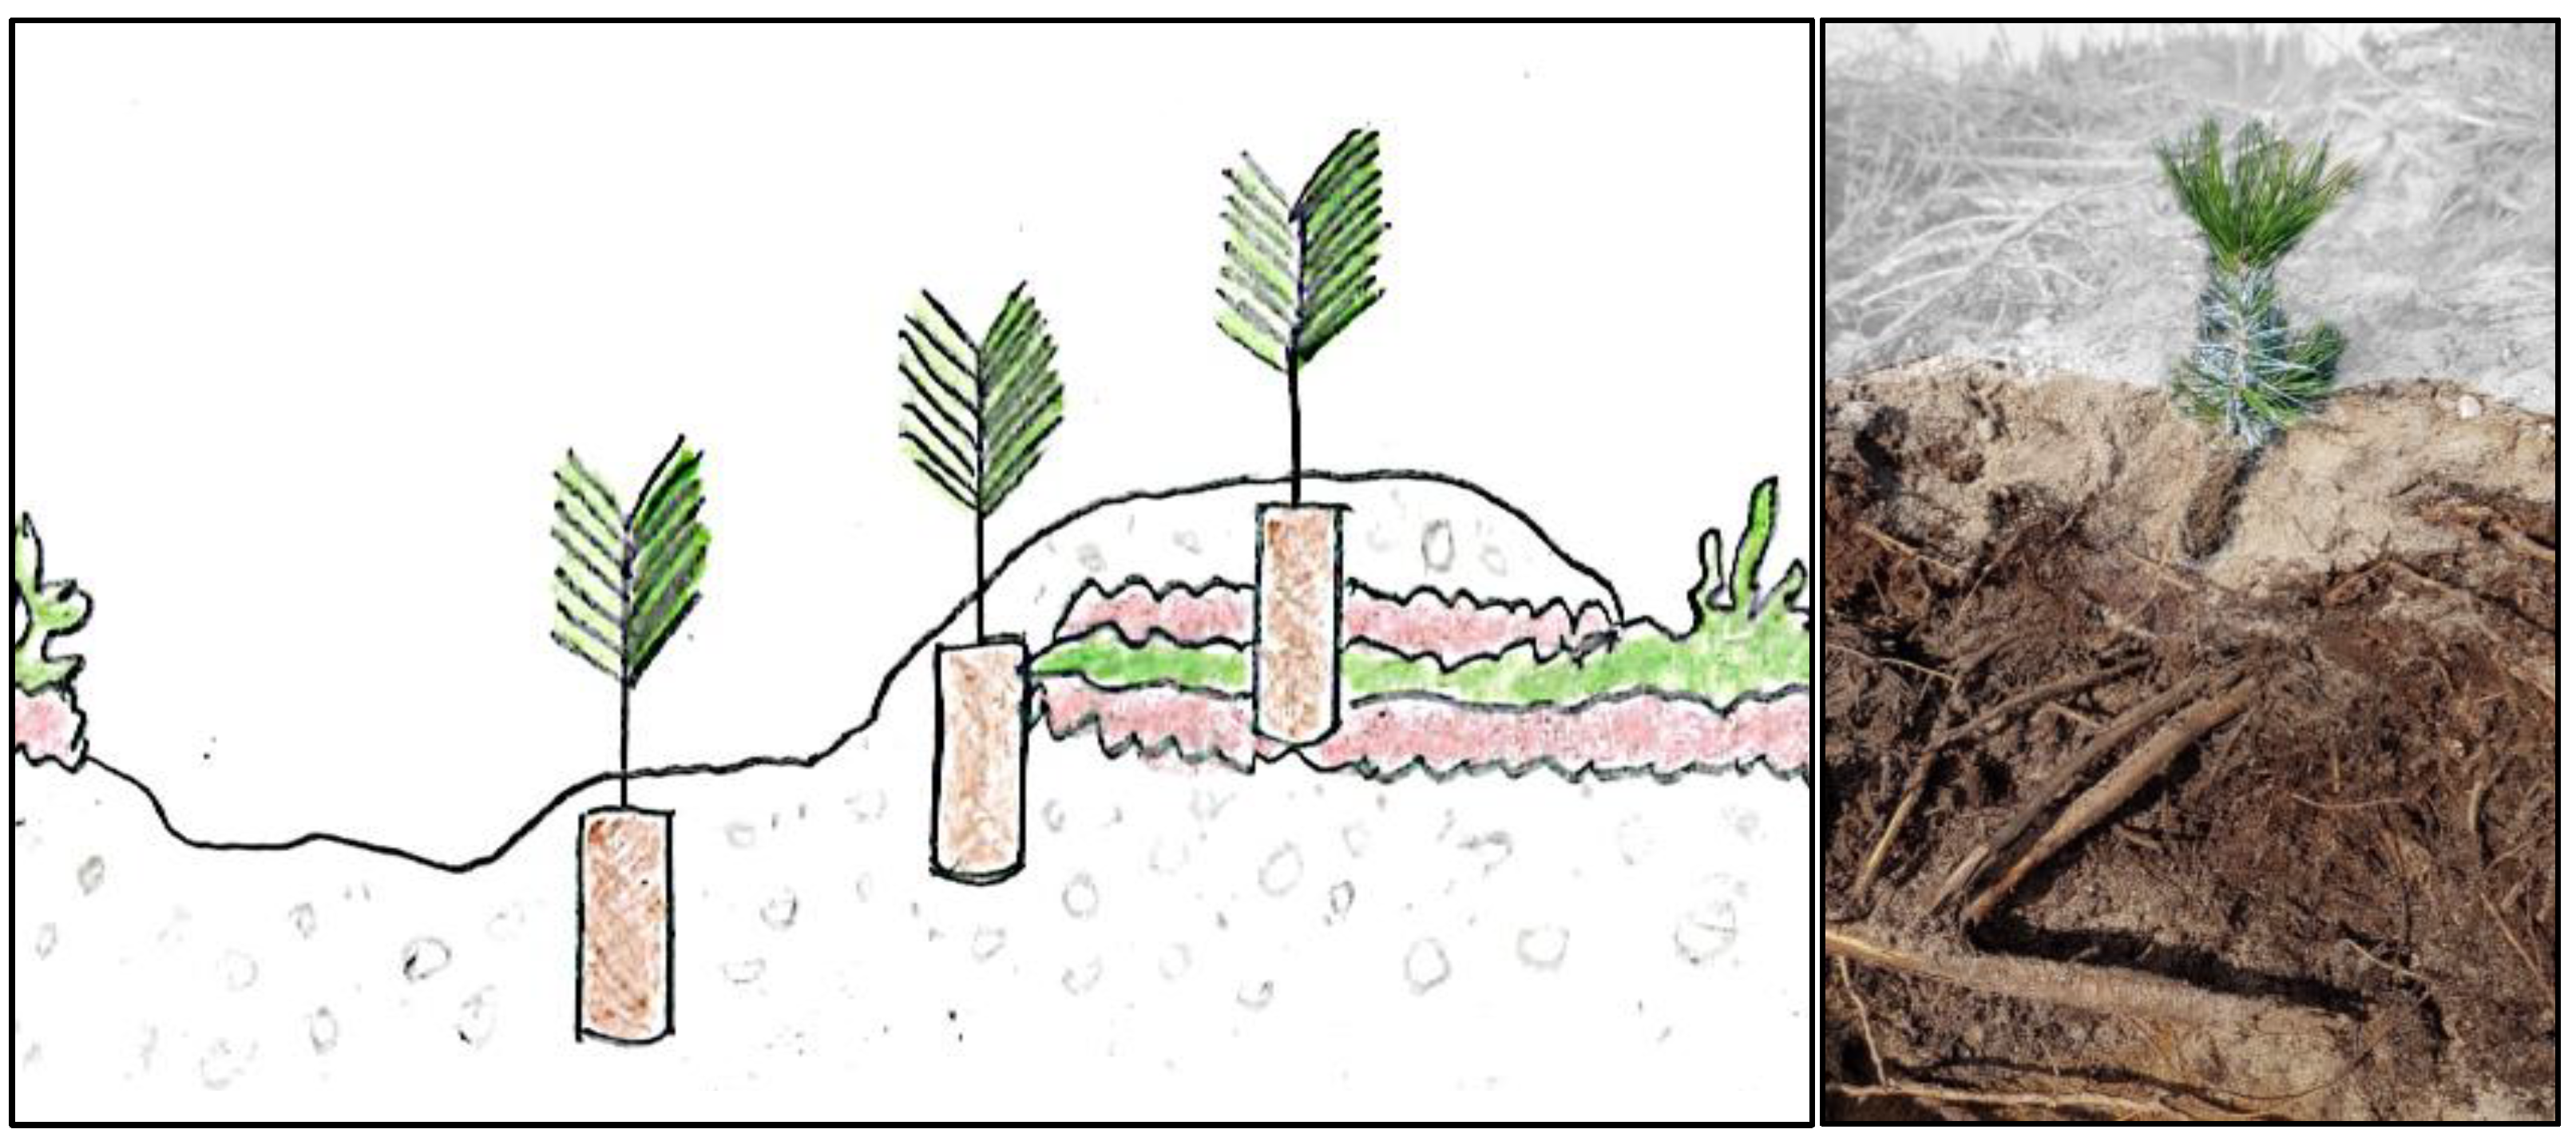
Figure 3.
Results from ANOVA for survival of pine seedlings size (a) 30 cc (b) 50 cc and (c) 90 cc for each planting position group, respectively, following the third field season. Columns indicate survival probability as a percentage and error bars indicate standard error (data back transformed from log scale in survival models). Different letters indicate significant differences. HQ Min = high quality mineral soil position (classes 2 and 4); HQ Hinge = high quality hinge positions (class 6); LQ = low quality positions (classes 1, 3, 5 and 7); and CM = capped mound (classes 8-9.).
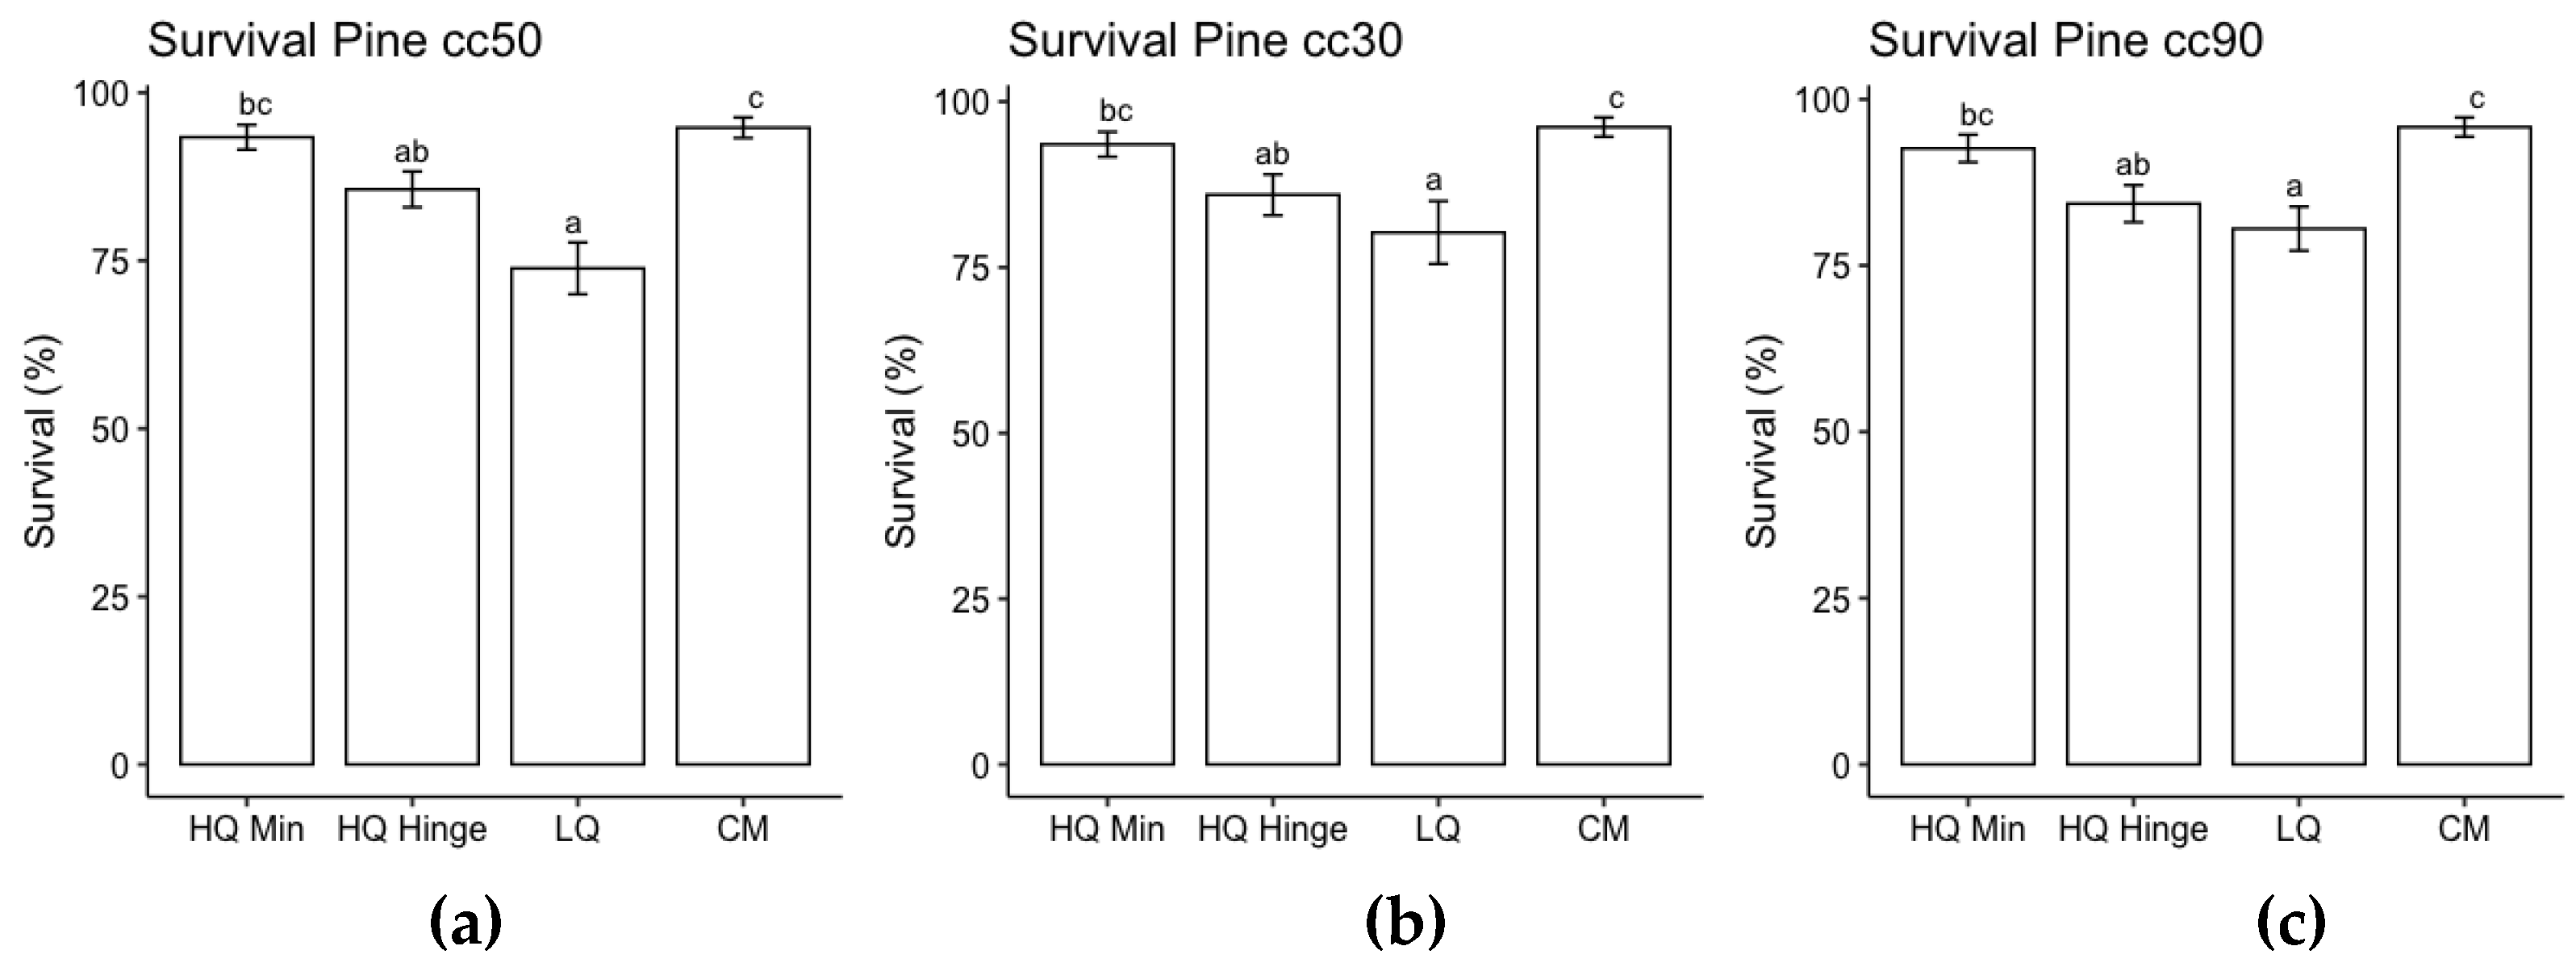
Figure 4.
Results from ANOVA for probability of survival of spruce seedlings size (a) 30 cc (b) 50 cc and (c) 90 cc for each planting position group, respectively, following the third field season. Columns indicate survival probability as a percentage and error bars indicate standard error (data back transformed from log scale in survival models). Different letters indicate significant differences. HQ Min = mineral soil position (classes 2 and 4); HQ Hinge = high quality hinge position (class 6); LQ = low quality positions (classes 1, 3, 5, 7 and 8) and HQ CM =high quality capped mound (class 9).
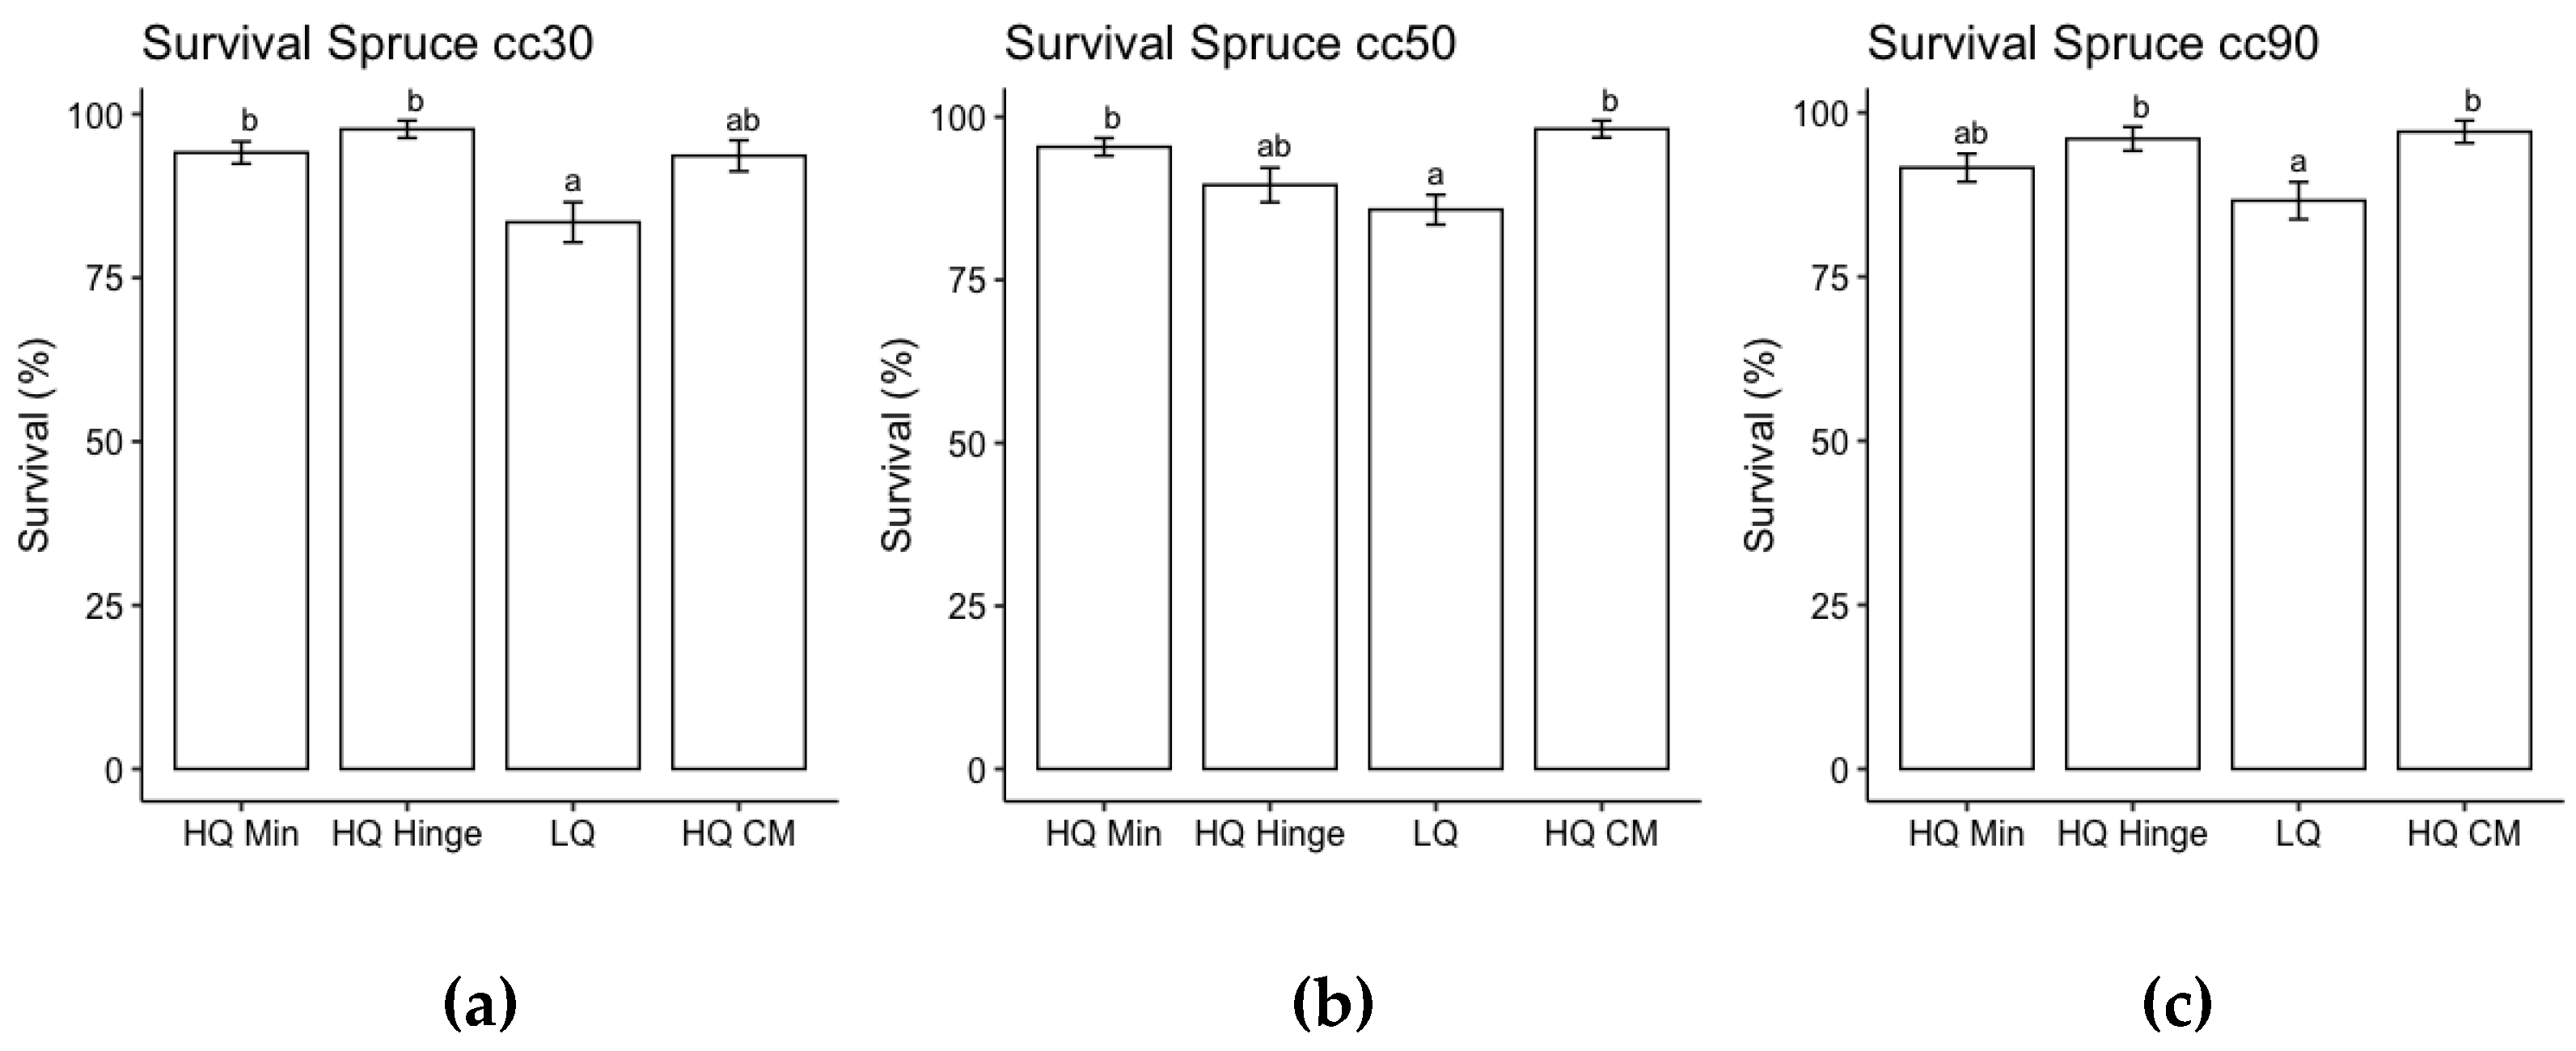
Figure 5.
Results from ANOVA for probability of pine seedlings being attacked by pine weevil for size (a) 30 cc (b) 50 cc and (c) 90 cc for each planting position group, respectively, following the third field season. Columns indicate total probability of pine weevil attack as a percentage, including both nonlethal and lethal damage, e and error bars indicate standard error (data back transformed from log scale in survival models). Different letters indicate significant differences. HQ Min = high quality mineral soil position (classes 2 and 4); HQ Hinge = high quality hinge positions (class 6); LQ = low quality positions (classes 1, 3, 5 and 7); and CM = capped mound (classes 8-9.).
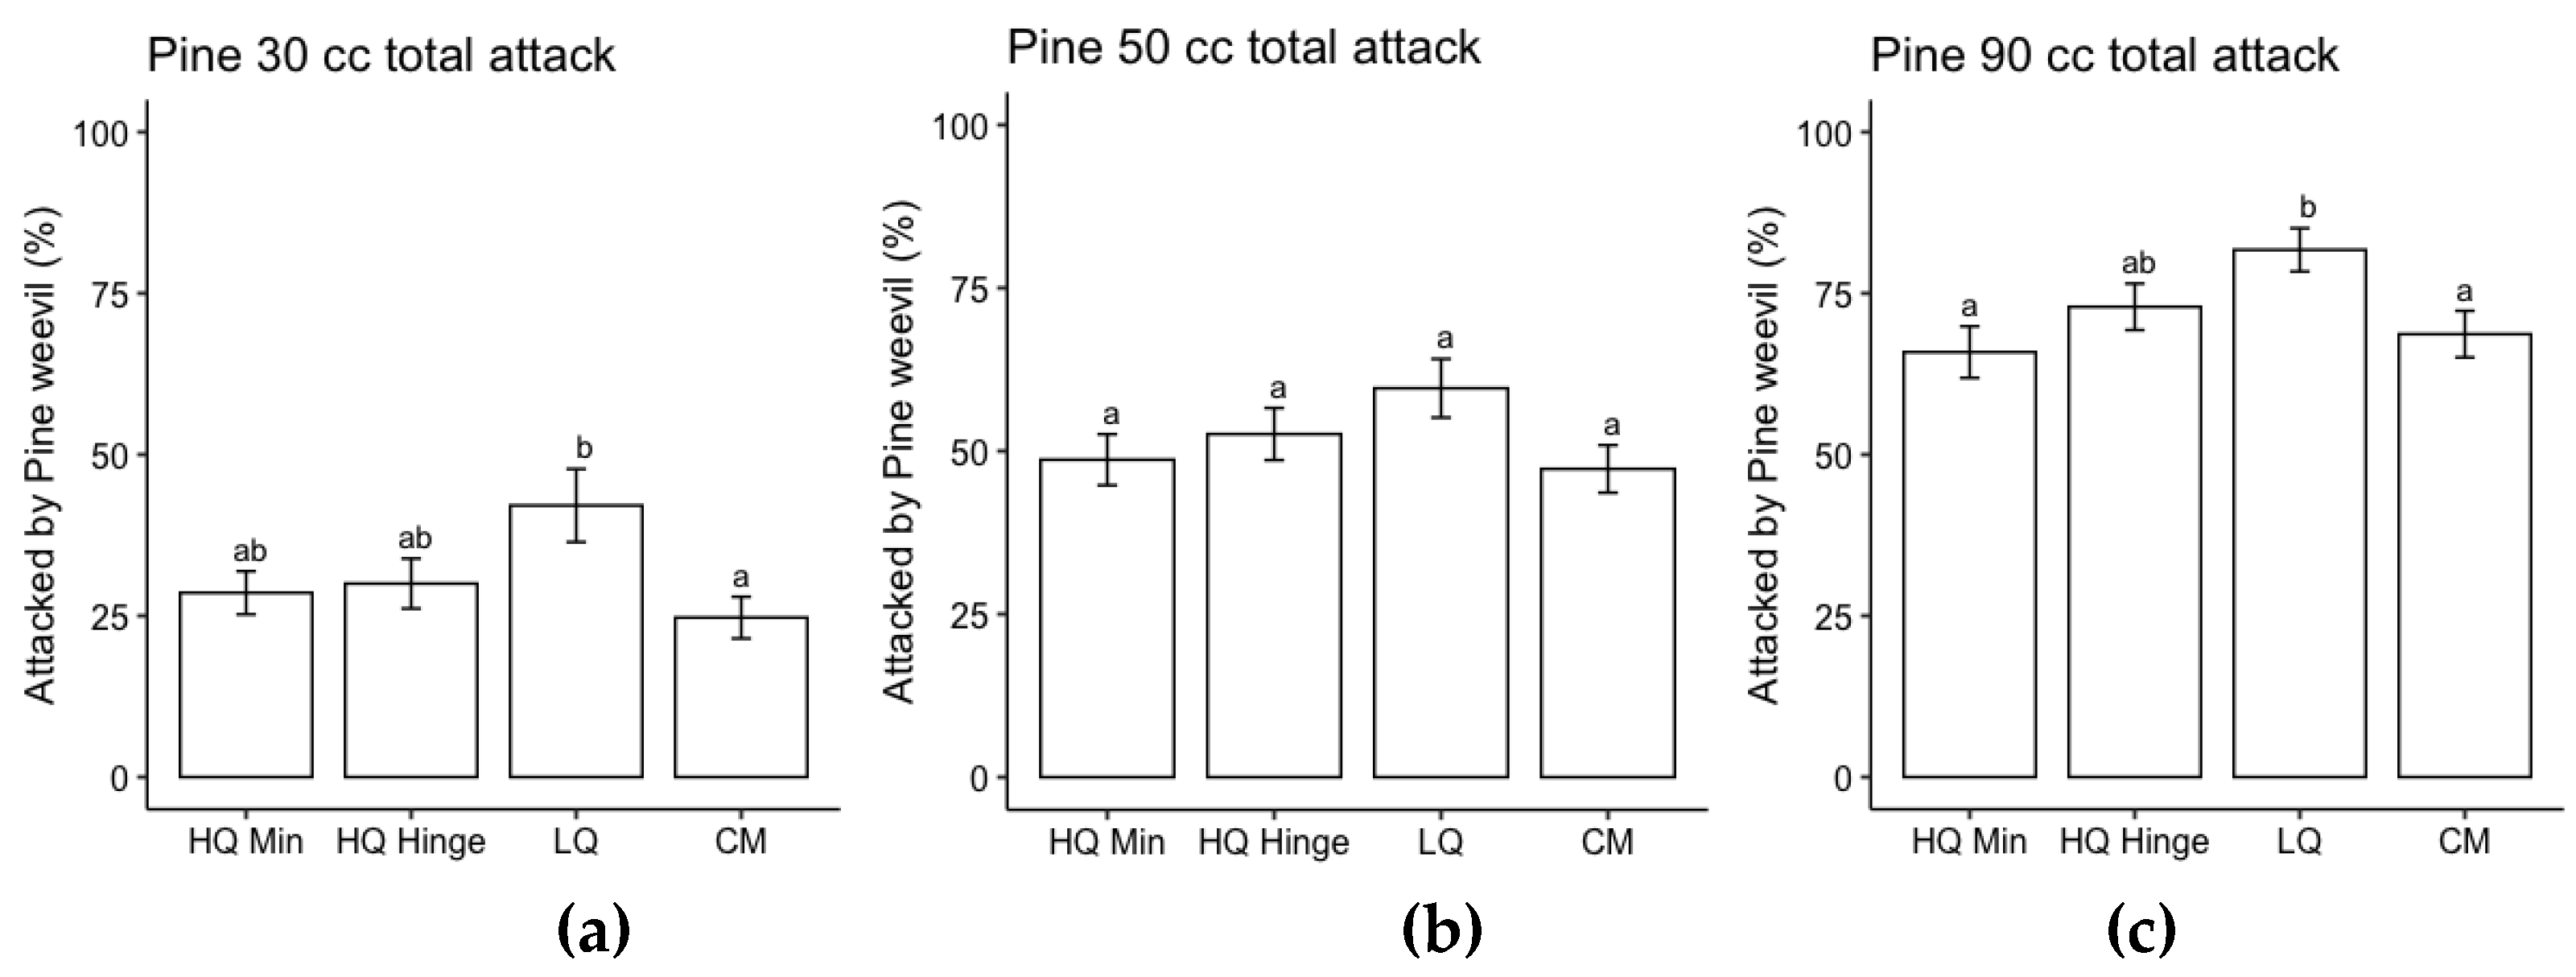
Figure 6.
Results from ANOVA for the probability of spruce seedlings being attacked by pine weevil for size (a) 30 cc (b) 50 cc and (c) 90 cc for each planting position group, respectively, following the third field season. Columns indicate probability of pine weevil attack as a percentage, including both nonlethal and lethal damage, and error bars indicate standard error (data back transformed from log scale in survival models). Different letters indicate significant differences. HQ Min = high quality mineral soil position (classes 2 and 4); HQ Hinge = high quality hinge positions (class 6); LQ = low quality positions (classes 1, 3, 5, 7 and 8); and HQ CM = high quality capped mound (class 9).
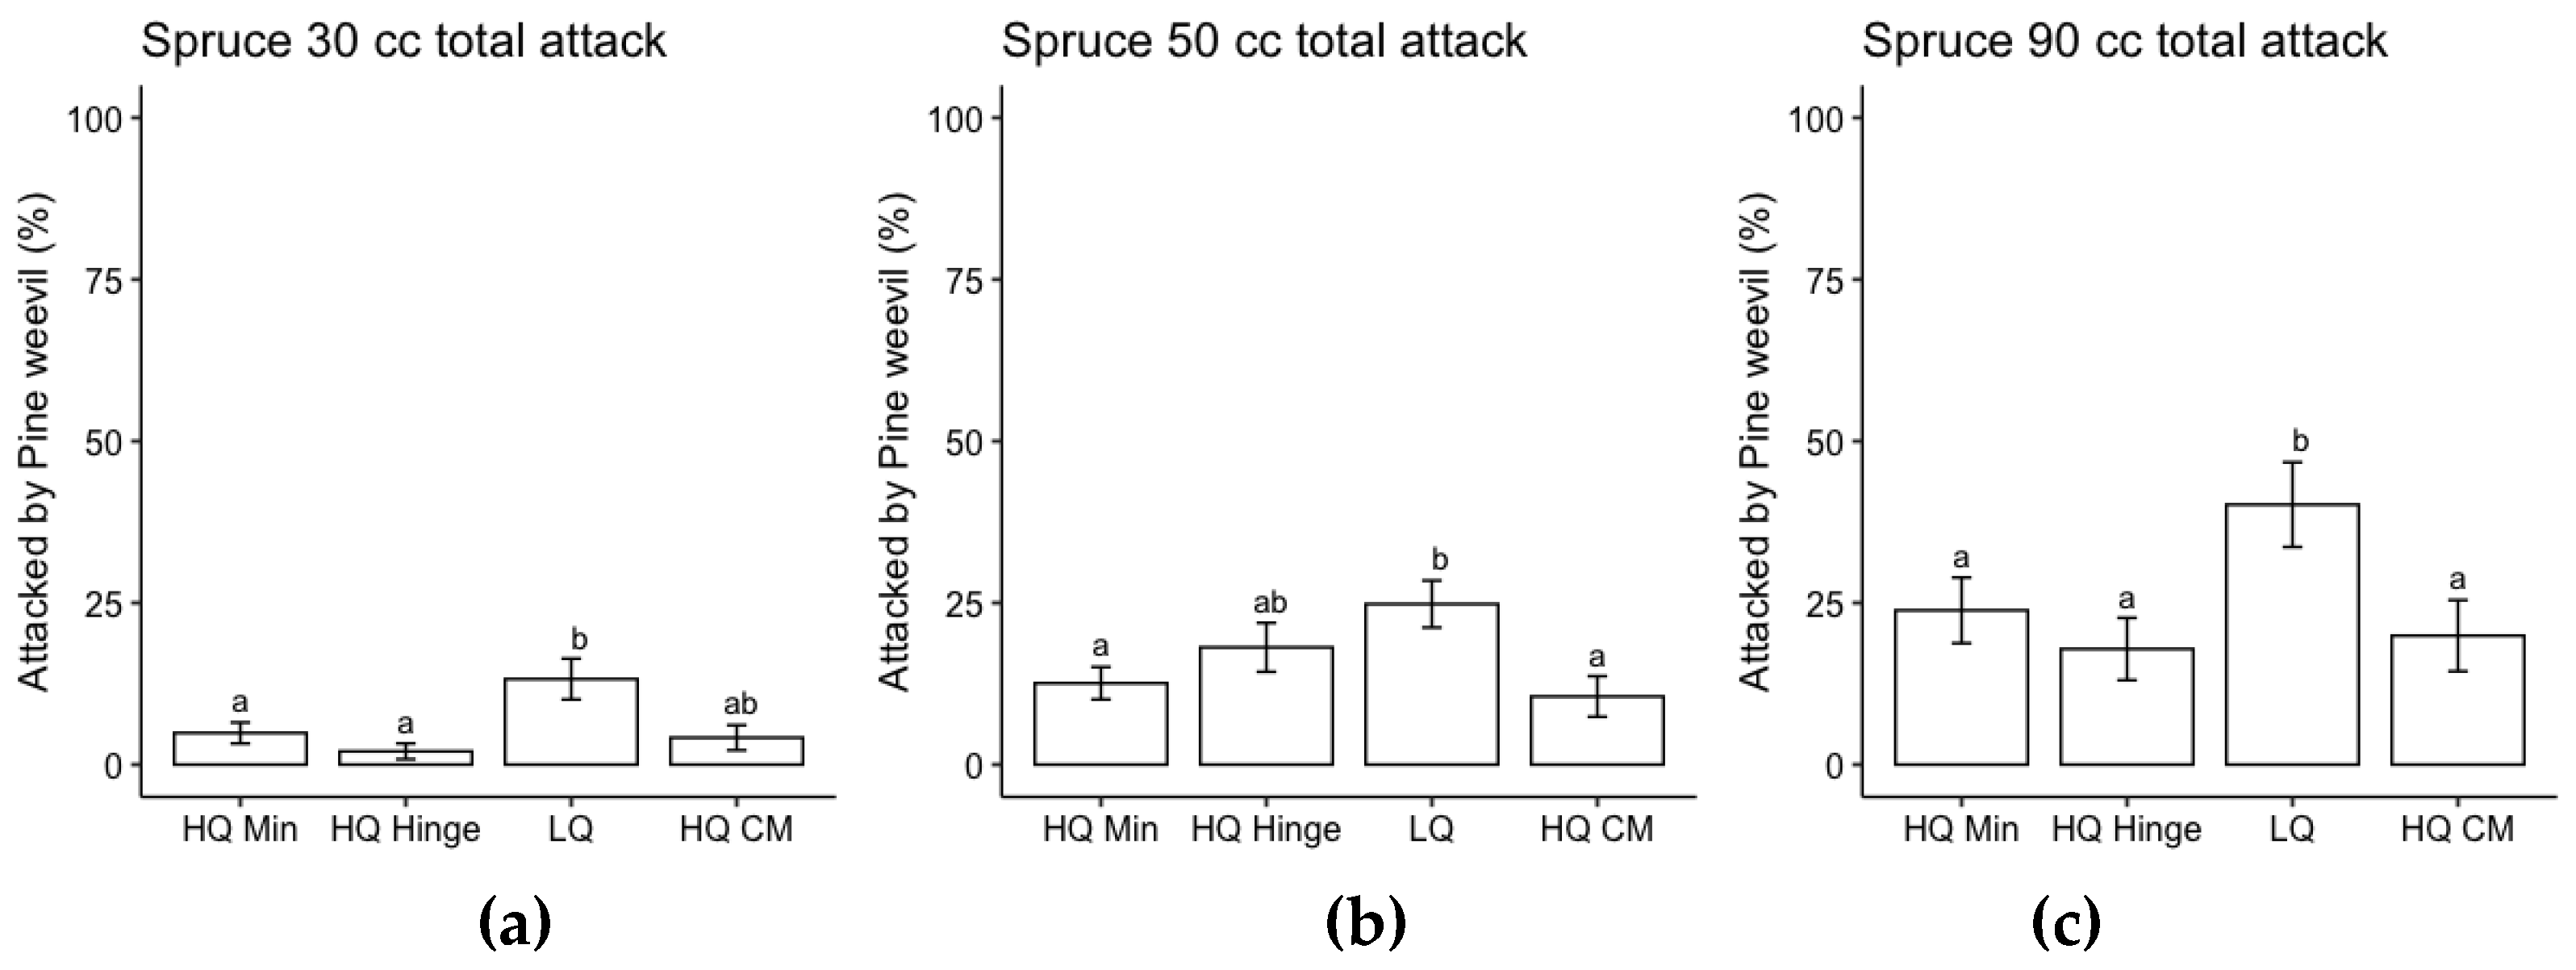
Figure 7.
Results from ANOVA for probability of mortal pine weevil damage for A) pine seedlings and B) spruce seedlings for each planting position group, respectively, following the third field season. Columns indicate probability of mortality caused by pine weevil damage as a percentage out of total number of seedlings and error bars indicate standard error (data back transformed from log scale in survival models). Different letters indicate significant differences. HQ Min = high quality mineral soil position (classes 2 and 4); HQ Hinge = high quality hinge positions (class 6); LQ = low quality positions (classes 1, 3, 5 and 7 for pine and in addition class 8 for spruce); and CM = capped mound (classes 8-9 for pine), HQ CM = high quality capped mound (class 9 for spruce).
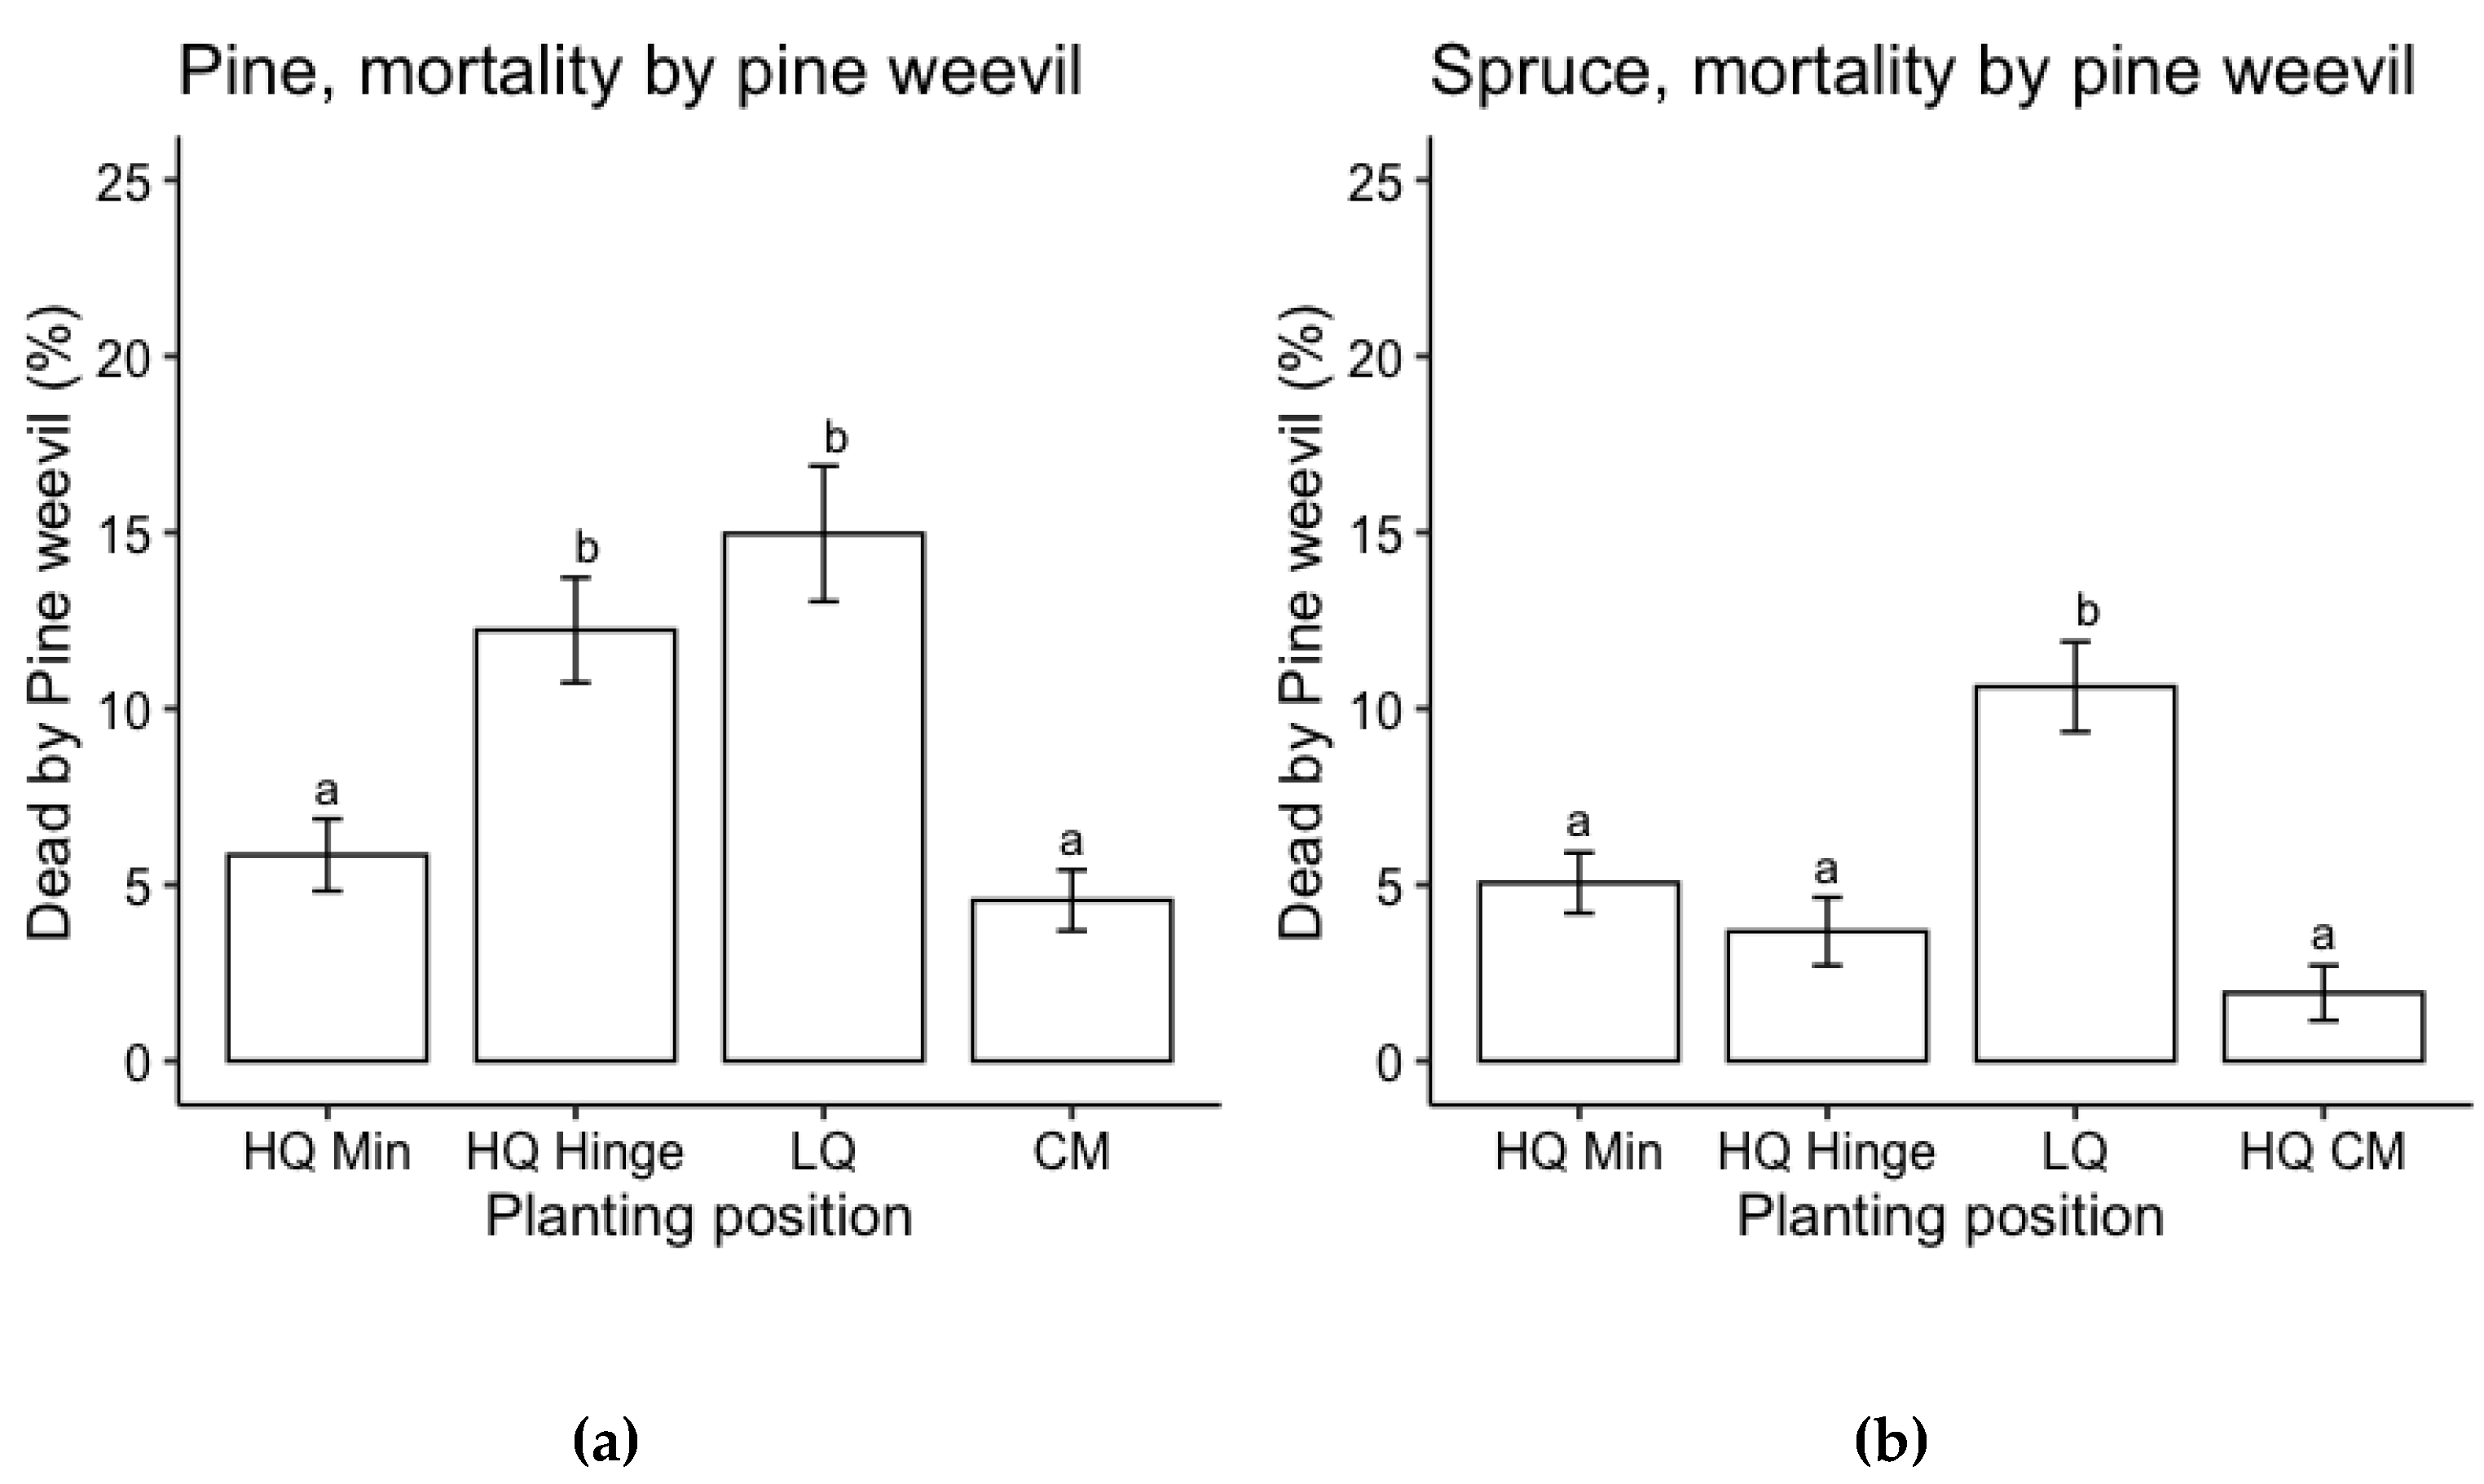
Figure 8.
Results from ANOVA for pine seedling stem basal diameter for size A) 30 cc B) 50 cc and C) 90 cc for each planting position group and treatment, respectively, following the third field season. Columns indicate stem basal diameter in mm and error bars indicate standard error. Different letters indicate significant differences. When there was an interaction between the factors, letters are displayed above each column, when there was no interaction, the letters are displayed above each planting position group. HQ Min = high quality mineral soil position (classes 2 and 4); HQ Hinge = high quality hinge positions (class 6); LQ = low quality positions (classes 1, 3, 5 and 7); and CM = capped mound (classes 8 and 9).
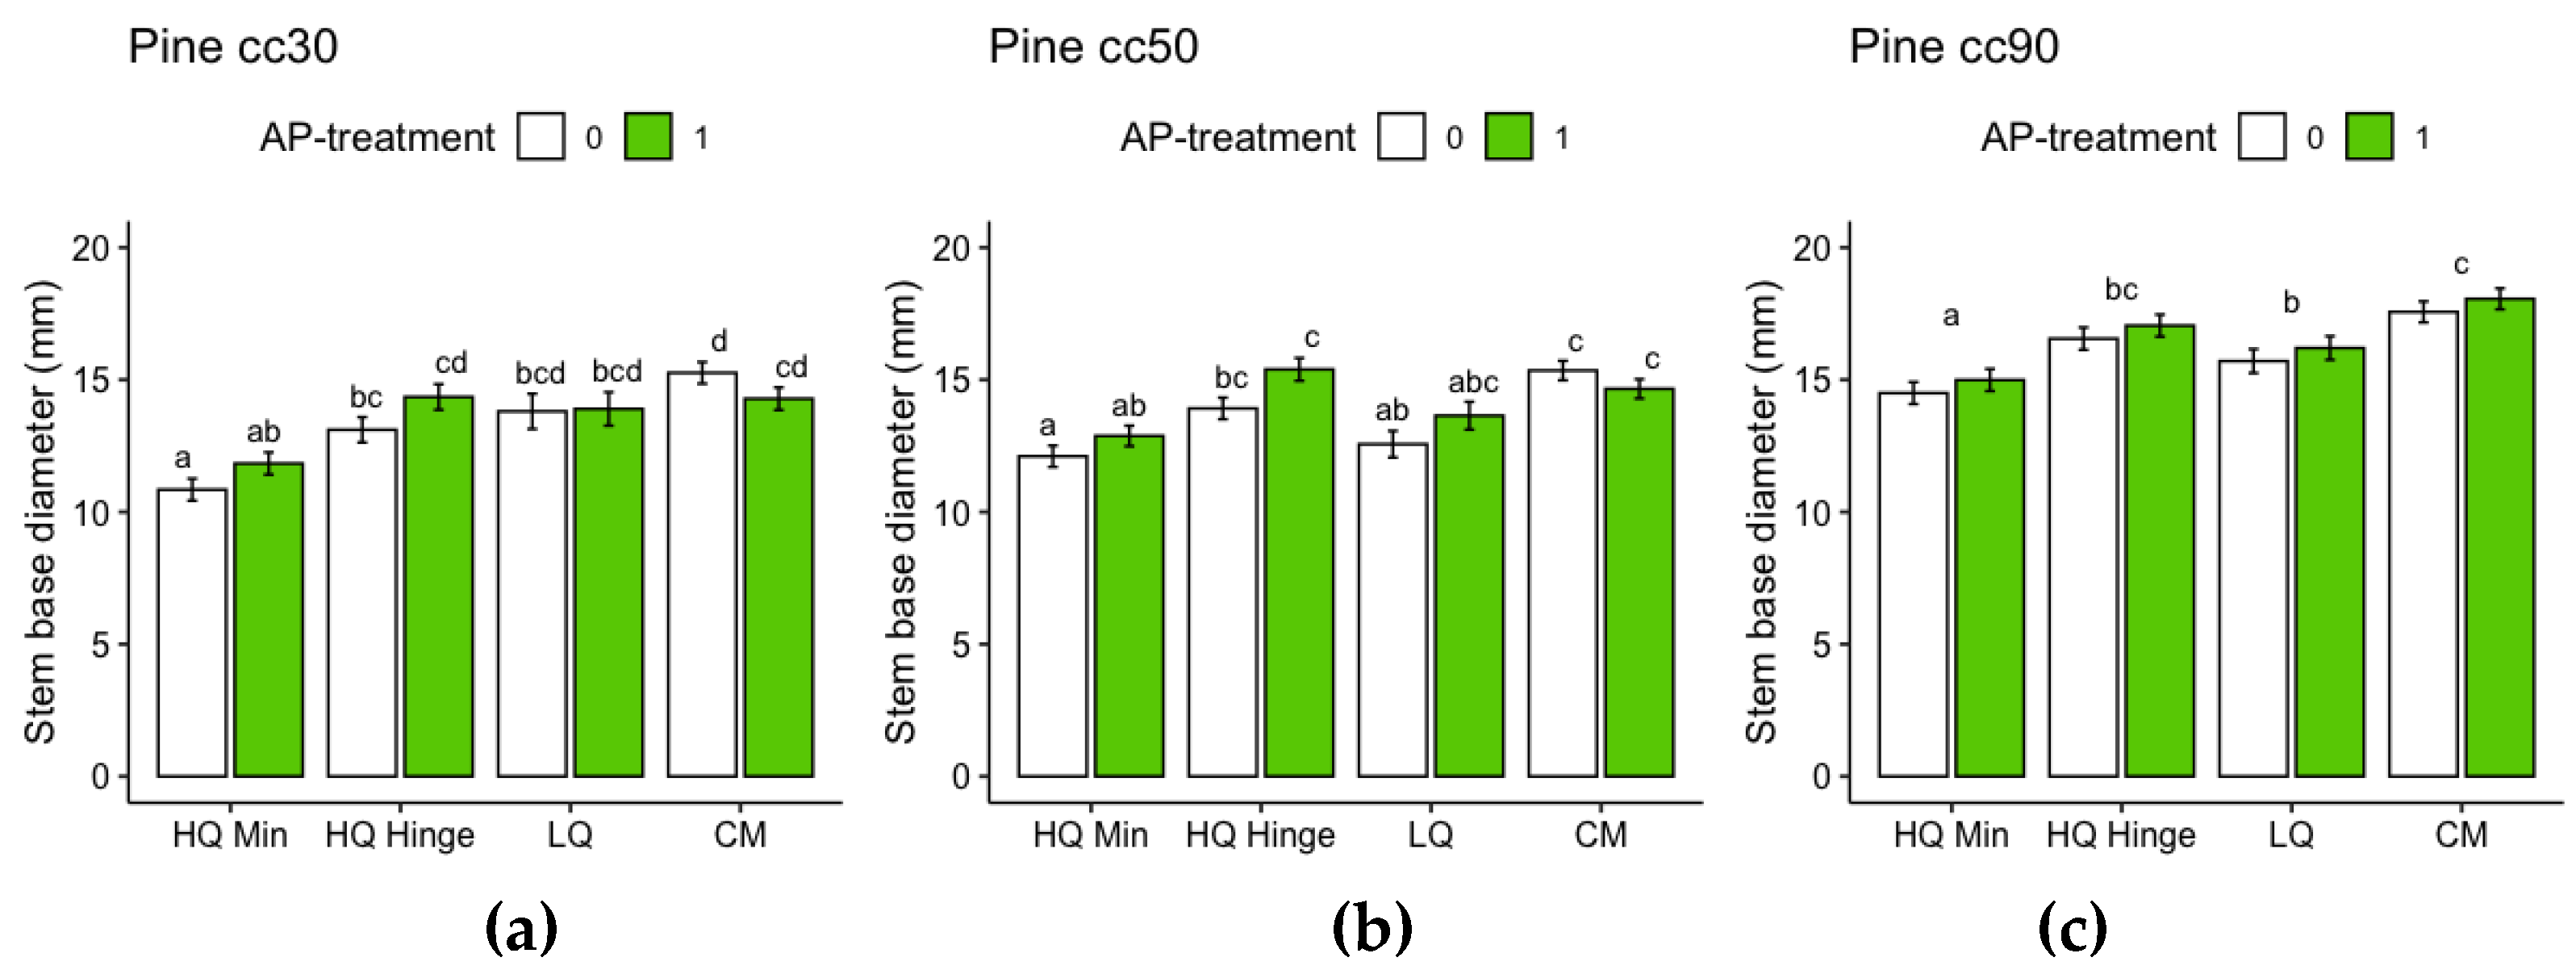
Figure 9.
Results from ANOVA for harvested pine seedling total dry weight, i.e. root + shoot, for size A) 30 cc B) 50 cc and C) 90 cc for each planting position group, respectively, following the third field season. Columns indicate dry weight in g and error bars indicate standard error. Different letters indicate significant differences. When there was an interaction between the factors, letters are displayed above each column, when there was no interaction, the letters are displayed above each planting position group. HQ Min = high quality mineral soil position (classes 2 and 4); HQ Hinge = high quality hinge positions (class 6); LQ = low quality positions (classes 1, 3, 5 and 7); and CM = capped mound (classes 8 and 9).
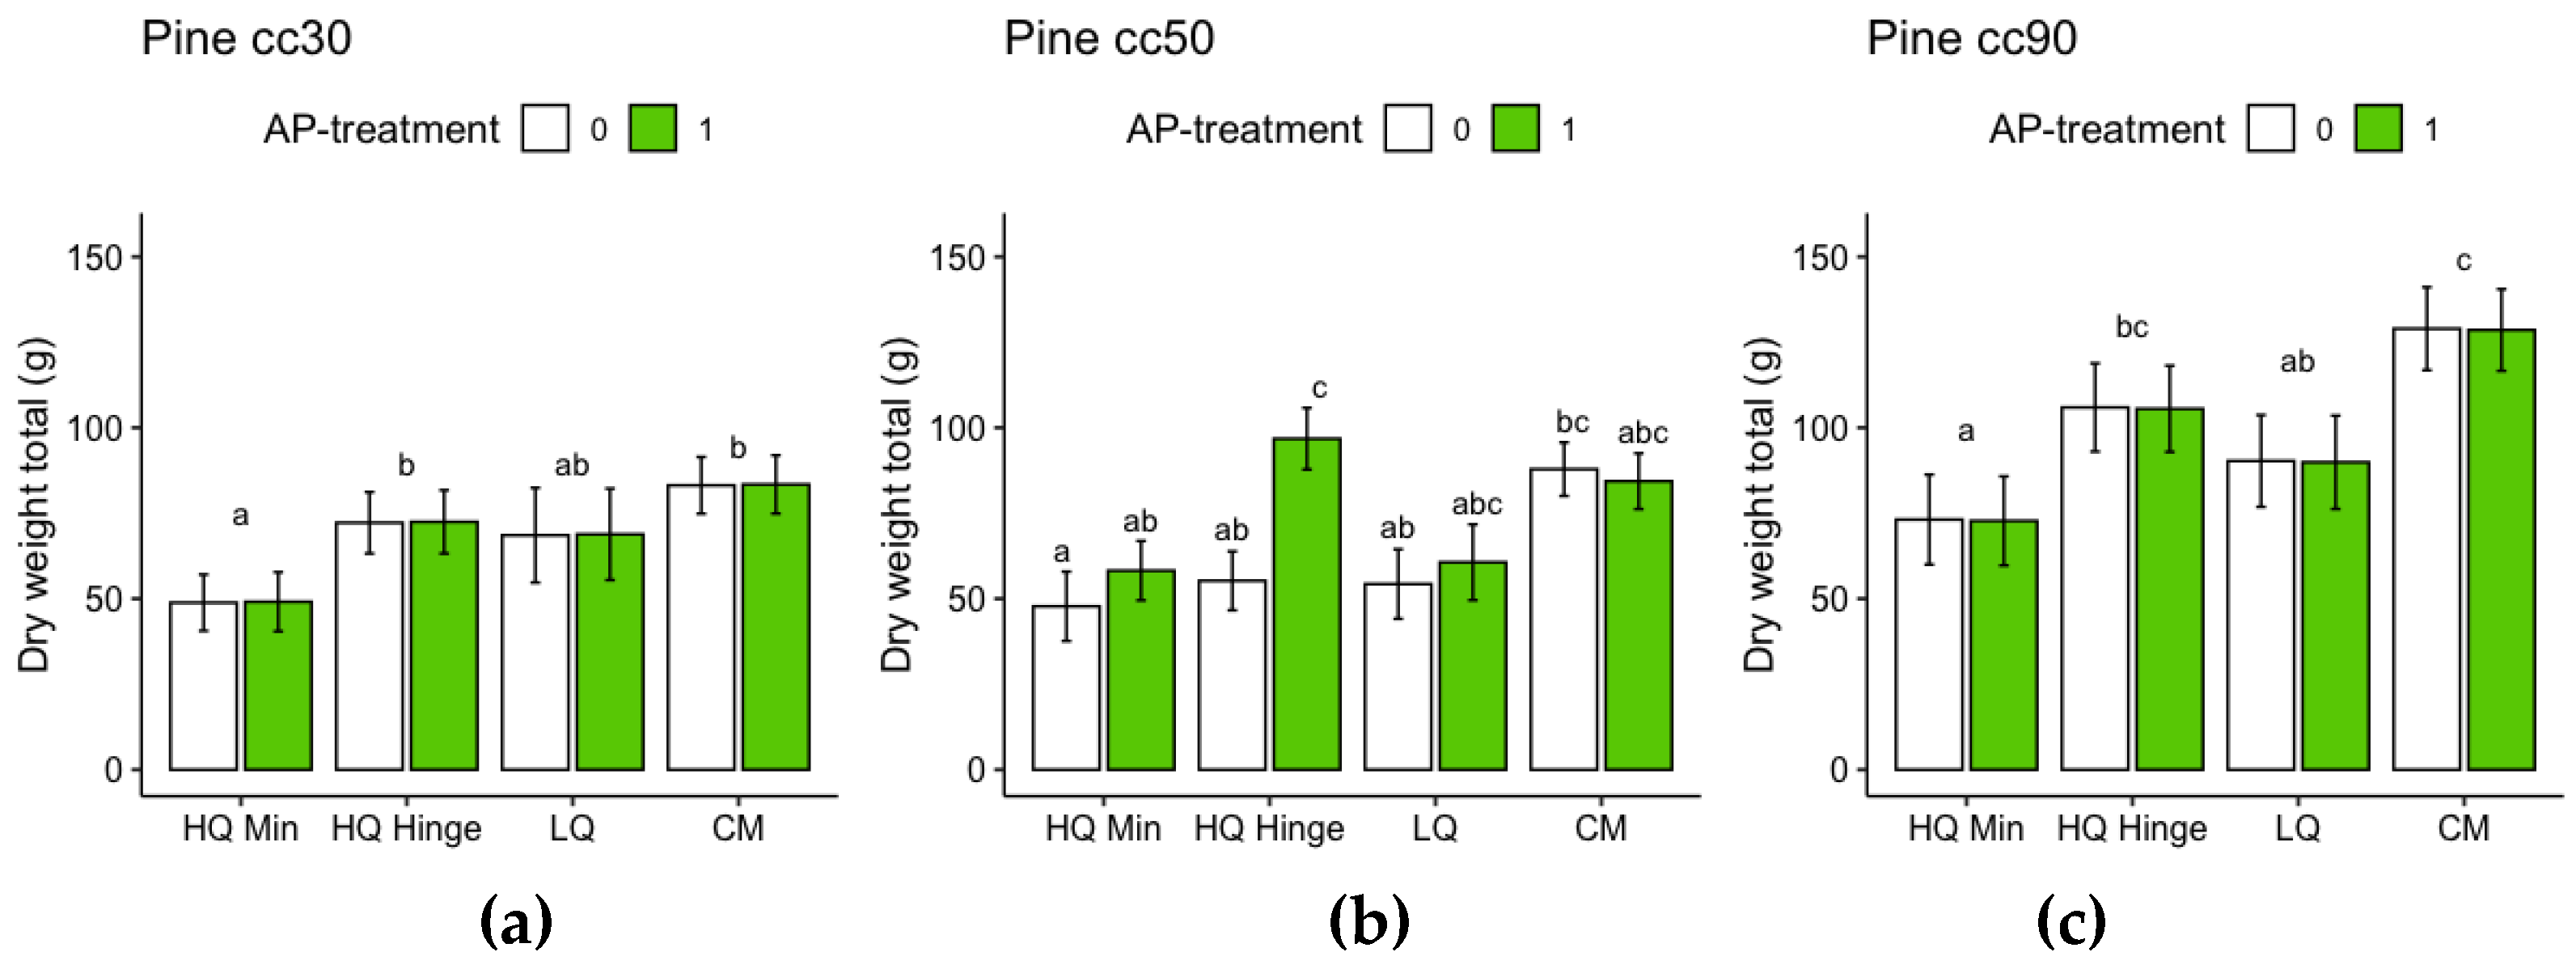
Figure 10.
Results from ANOVA for harvested pine seedling shoot:root ratio for size A) 30 cc B) 50 cc and C) 90 cc for each planting position group, respectively, following the third field season. Columns indicate shoot to root ratio and error bars indicate standard error. The different letters displayed above each planting position group indicate significant differences between these groups averaged over the values of treatment. HQ Min = high quality mineral soil position (classes 2 and 4); HQ Hinge = high quality hinge positions (class 6); LQ = low quality positions (classes 1, 3, 5 and 7); and CM = capped mound (classes 8 and 9).
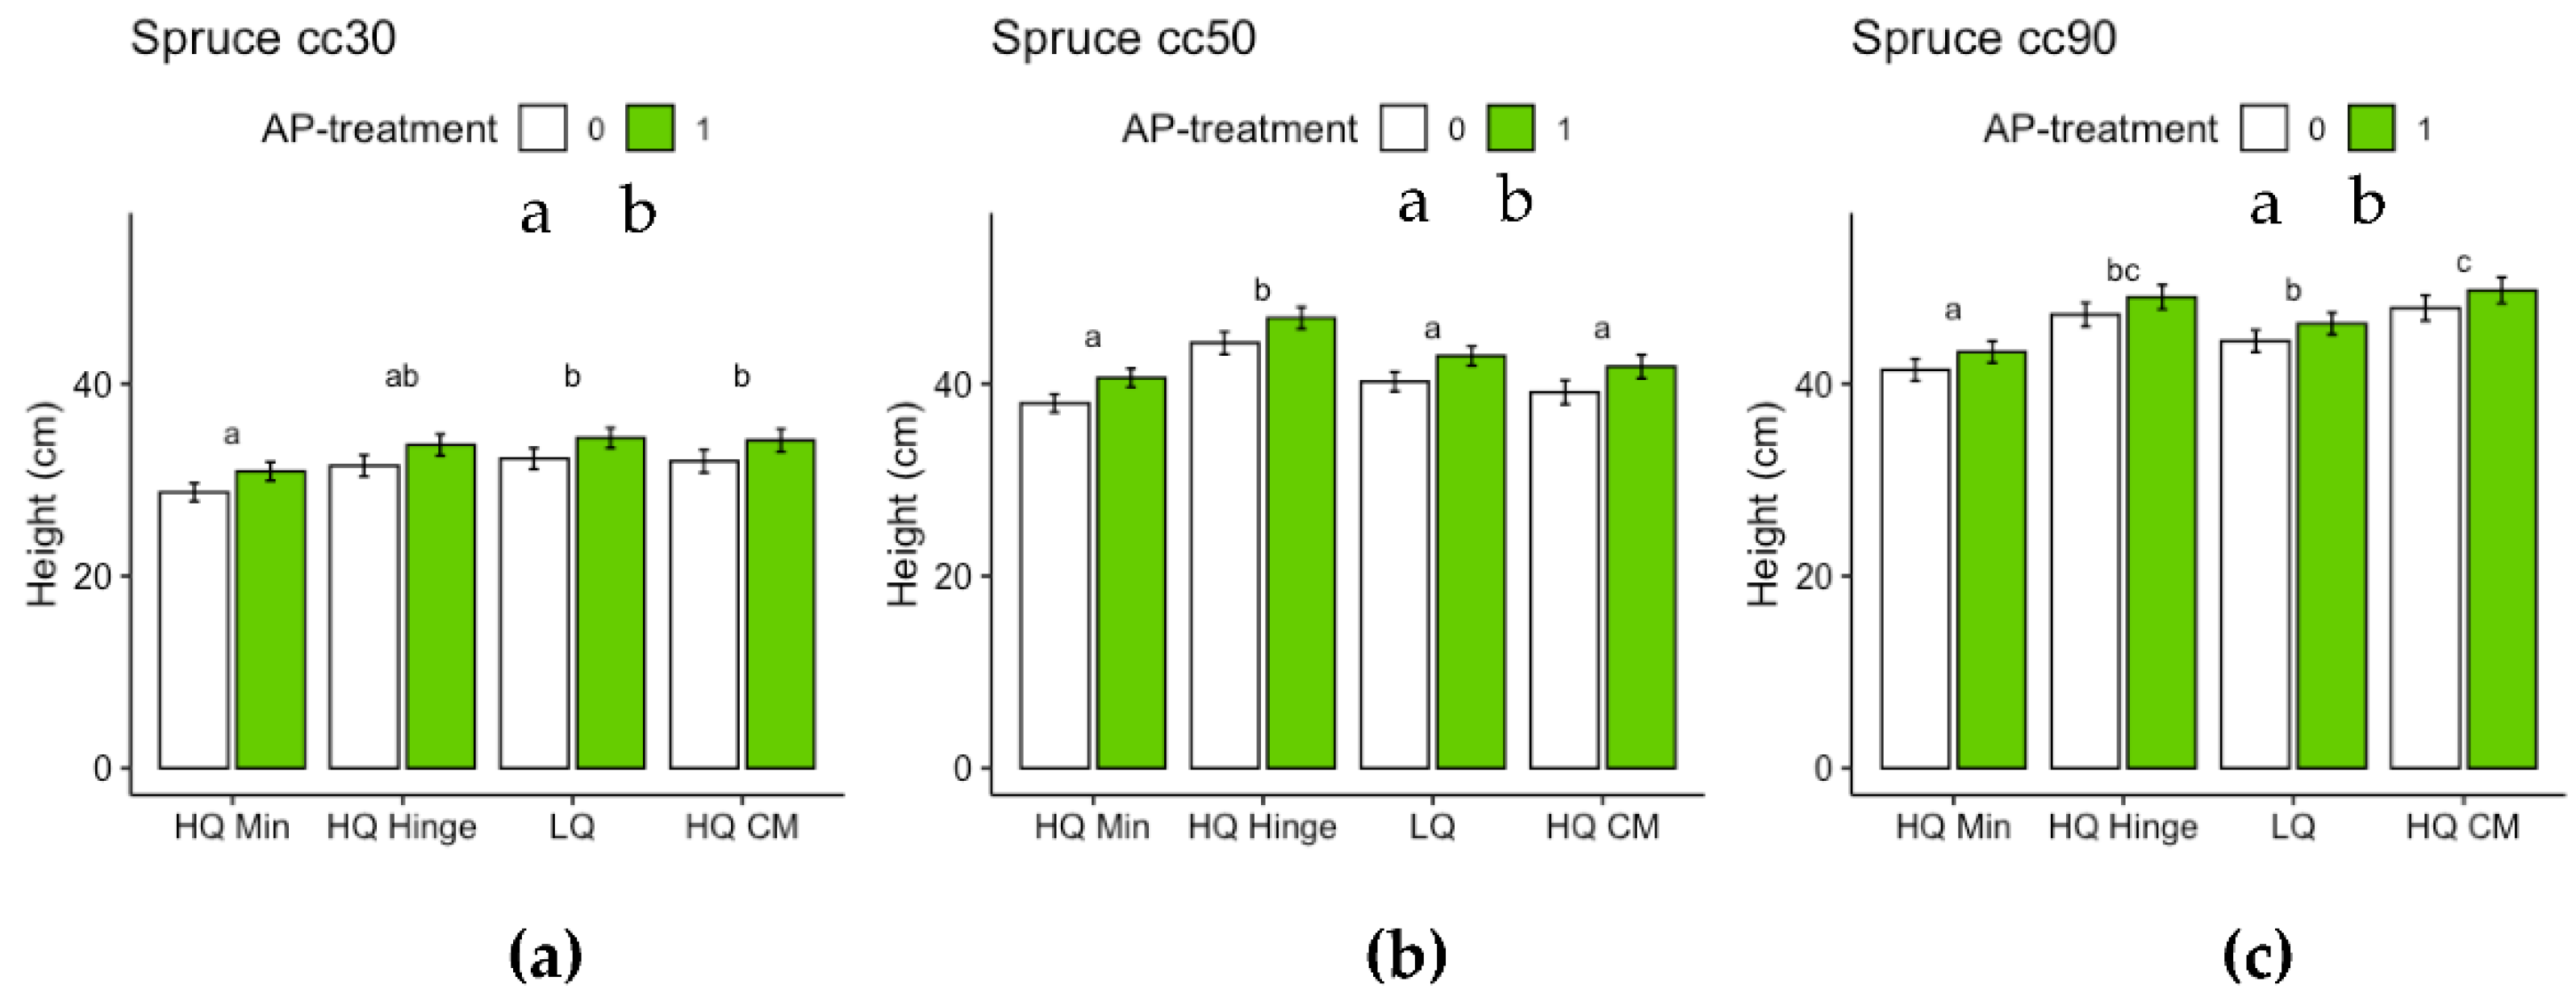
Figure 11.
Results from ANOVA for probability of spruce seedling height for size (a) 30 cc (b) 50 cc and C) 90 cc for each planting position group, respectively, following the third field season. Columns indicate seedling height in cm and error bars indicate standard error. The different letters displayed above each planting position group indicate significant differences between these groups averaged over the values of treatment, while letters under the treatment legend indicate significant effect of treatment averaged over the levels of planting position group. HQ Min = high quality mineral soil position (classes 2 and 4); HQ Hinge = high quality hinge positions (class 6); LQ = low quality positions (classes 1, 3, 5, 7 and 8); and HQ CM = high quality capped mound (class 9).
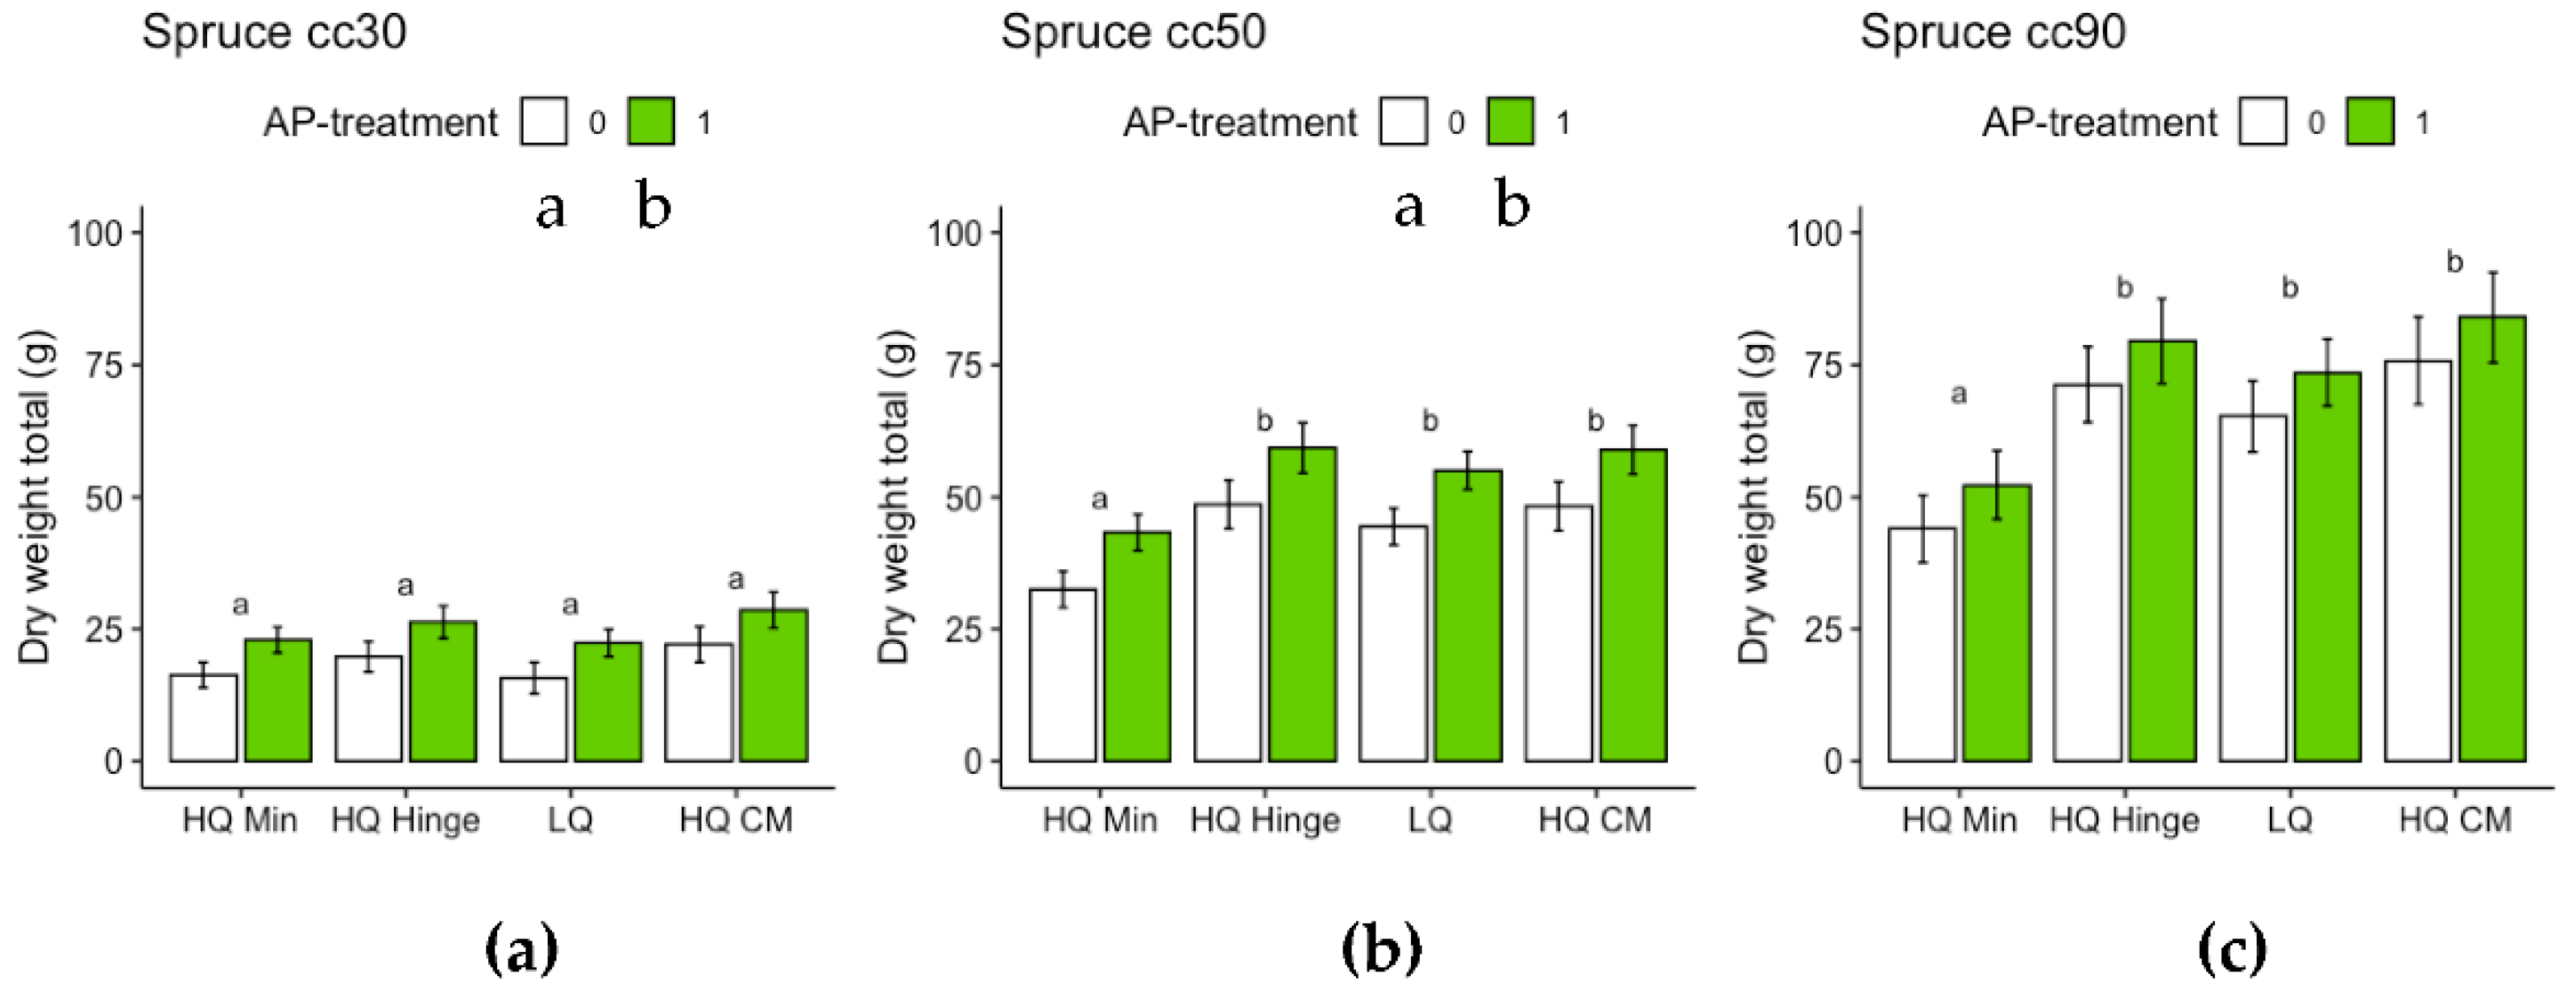
Figure 12.
Results from ANOVA for harvested spruce seedling total dry weight, i.e. root + shoot, for size (a) 30 cc (b) 50 cc and (c) 90 cc for each planting position group, respectively, following the third field season. Columns indicate dry weight in g and error bars indicate standard error. The different letters displayed above each planting position group indicate significant differences between these groups averaged over the values of treatment, while letters under the treatment legend indicate significant effect of treatment averaged over the levels of planting position group. HQ Min = high quality mineral soil position (classes 2 and 4); HQ Hinge = high quality hinge positions (class 6); LQ = low quality positions (classes 1, 3, 5, 7 and 8); and HQ CM = high quality capped mound (class 9).
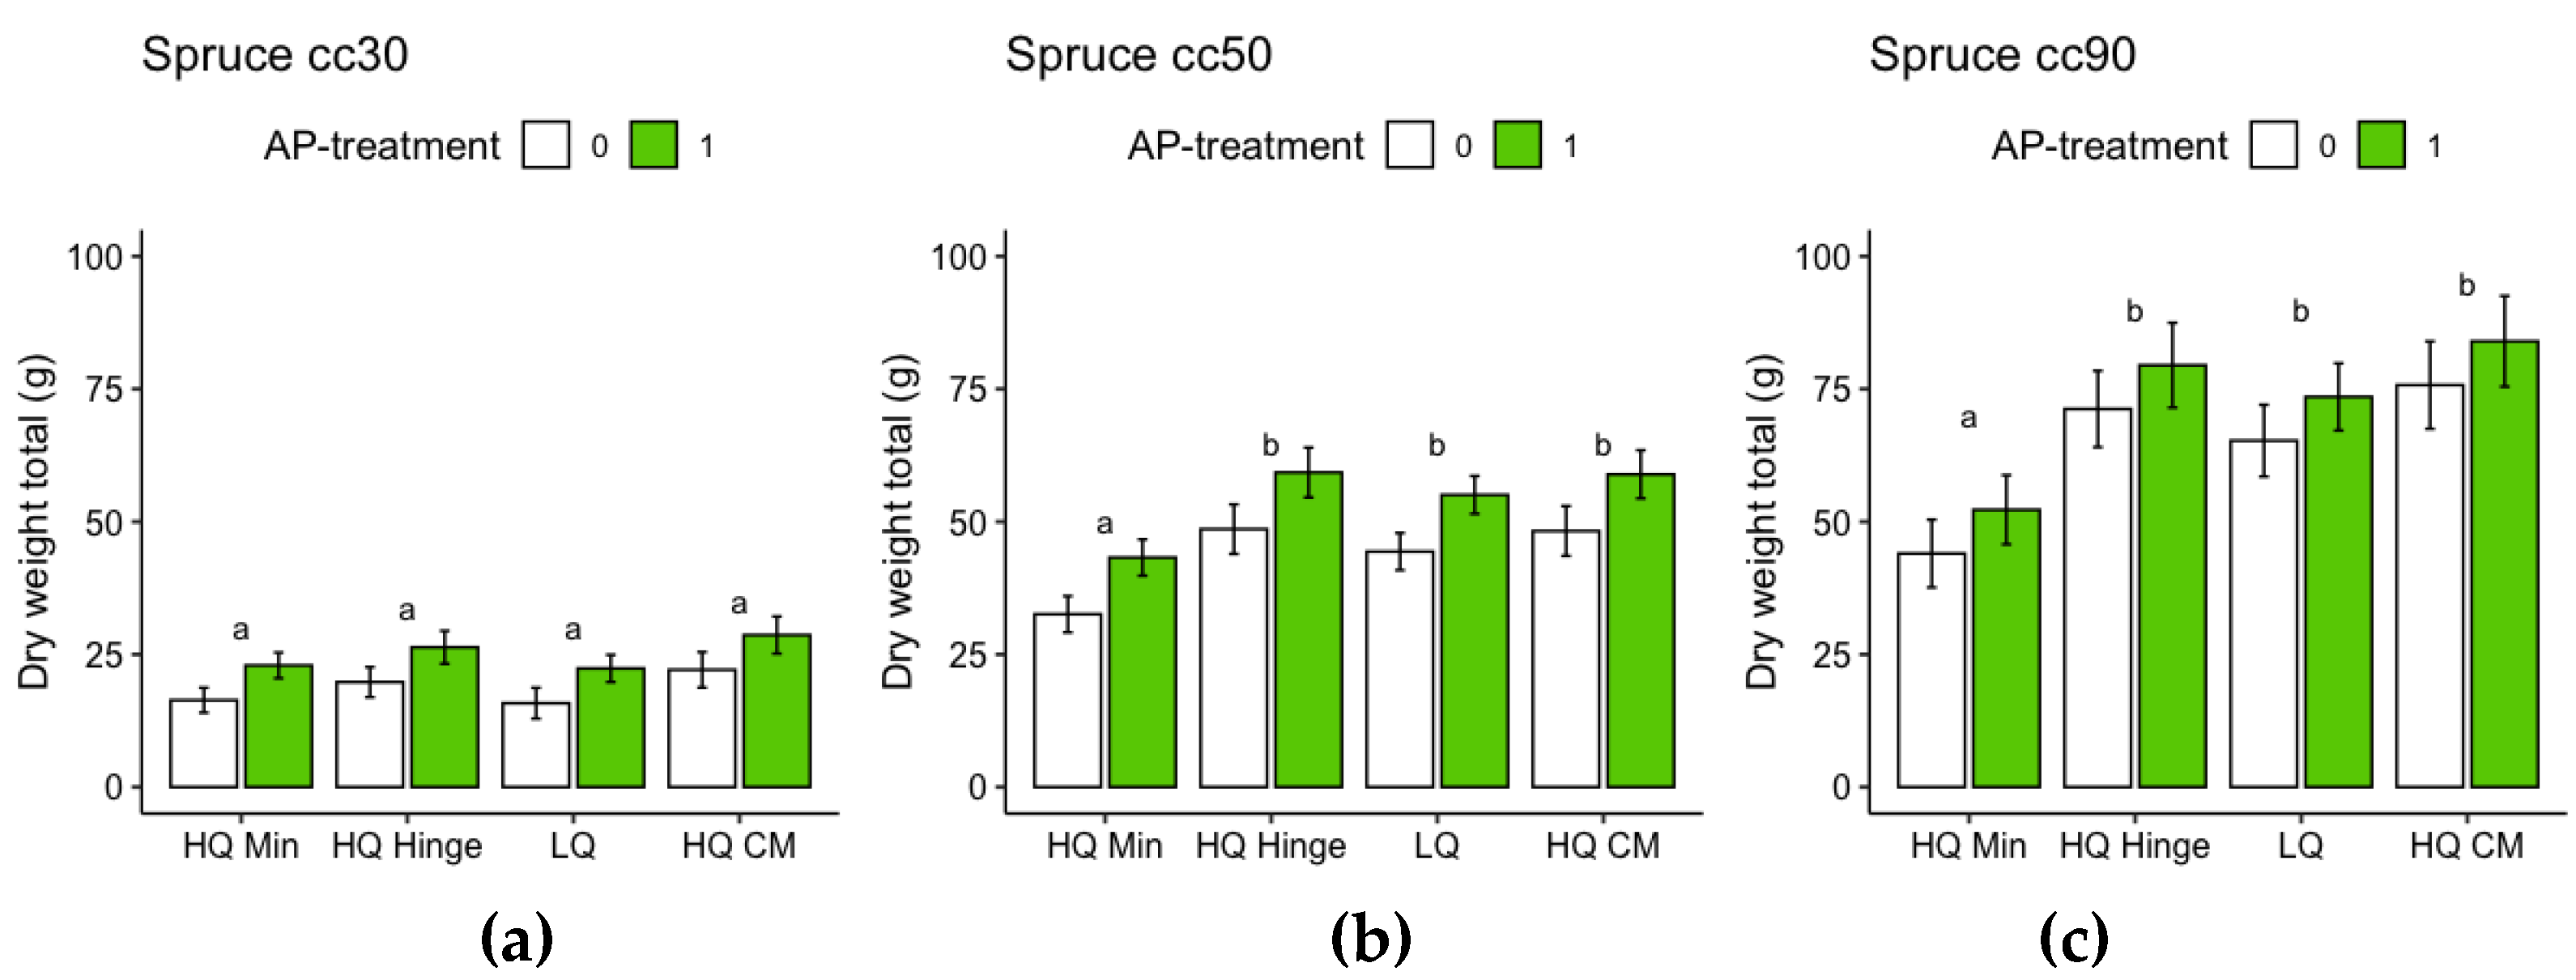
Figure 13.
Results from ANOVA for harvested spruce seedling shoot:root dry weight ratio, for size (a) 30 cc (b) 50 cc and (b) 90 cc for each planting position group, respectively, following the third field season. Columns indicate shoot to root ratio and error bars indicate standard error. The different letters displayed above each planting position group indicate significant differences between these groups averaged over the values of treatment. HQ Min = high quality mineral soil position (classes 2 and 4); HQ Hinge = high quality hinge positions (class 6); LQ = low quality positions (classes 1, 3, 5, 7 and 8); and HQ CM = high quality capped mound (class 9).
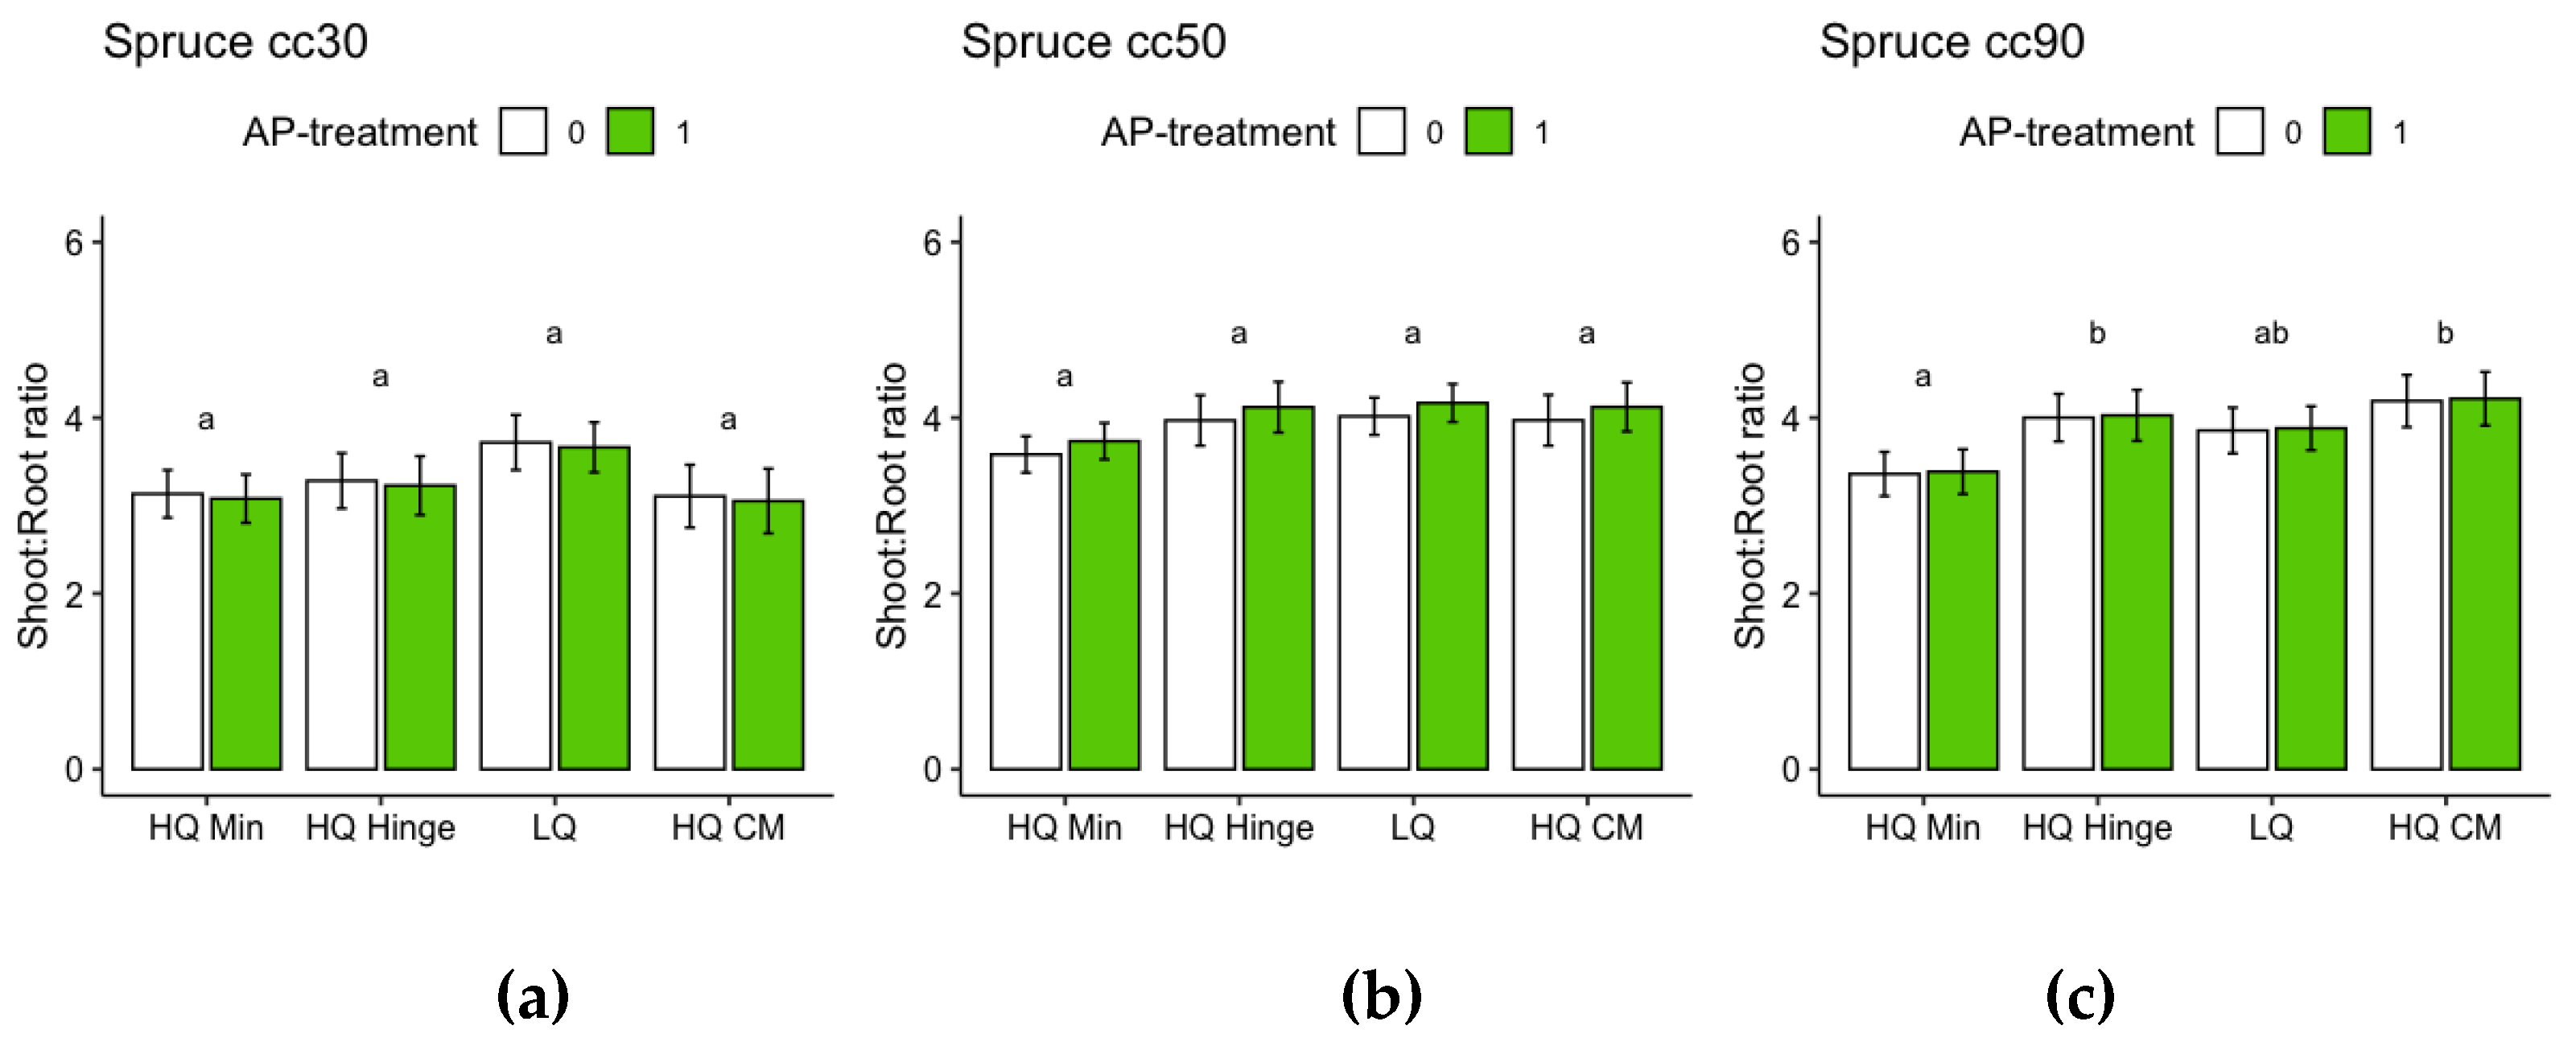
Figure 14.
Results from ANOVA for occurrence of multiple leading shoots for pine seedlings for size A) 30 cc B) 50 cc and C) 90 cc for each planting position group and treatment, respectively, following the third field season. Columns indicate multiple leading shoot occurrence probability as a percentage and error bars indicate standard error. Different letters indicate significant differences. When there was an interaction between the factors, letters are displayed above each column, when there was no interaction, the letters are displayed above each planting position group. HQ Min = high quality mineral soil position (classes 2 and 4); HQ Hinge = high quality hinge positions (class 6); LQ = low quality positions (classes 1, 3, 5 and 7); and CM = capped mound (classes 8 and 9).
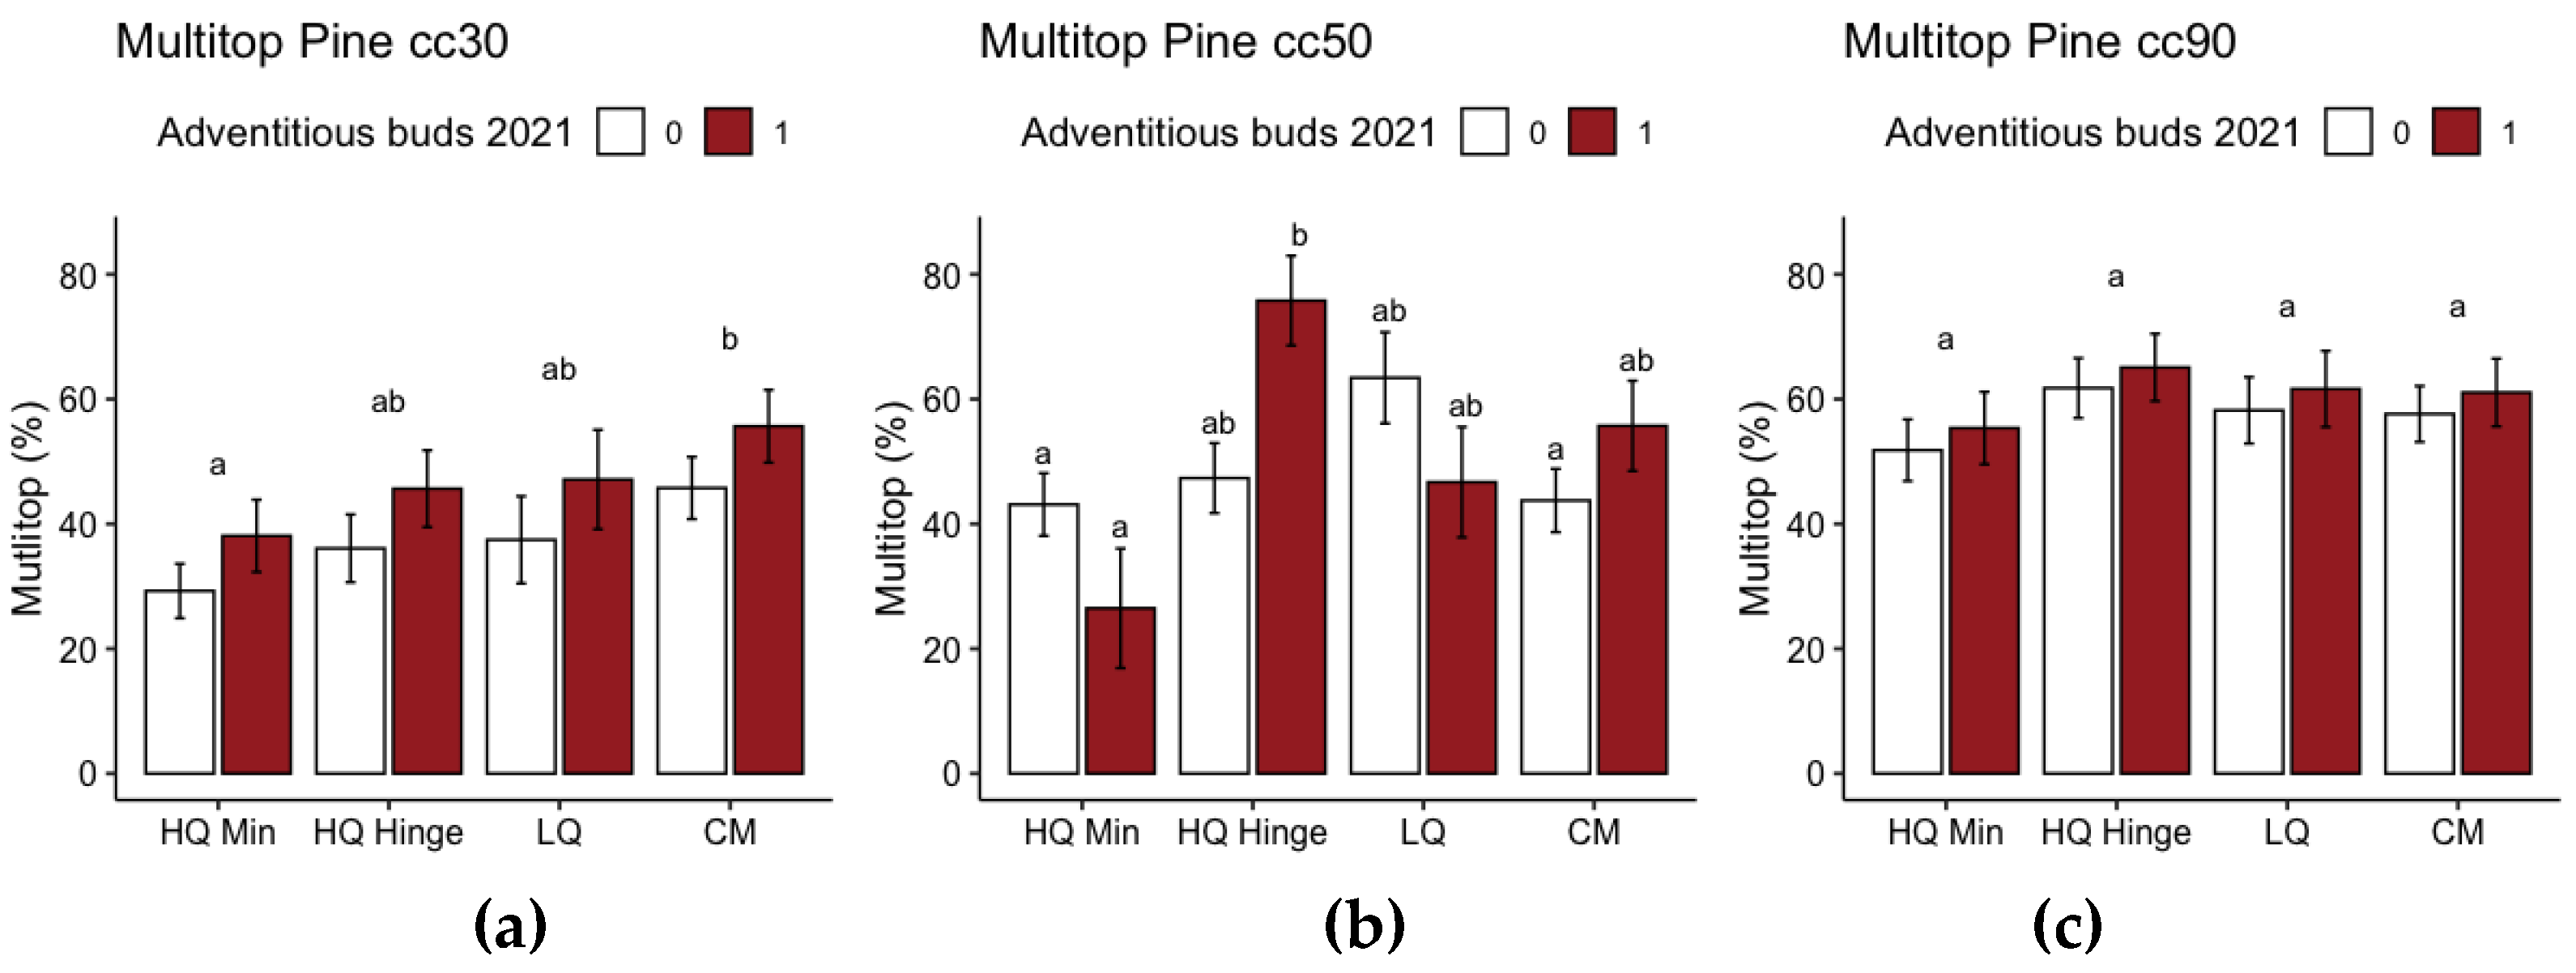
Table 1.
Mean height, stem basal diameter, root and shoot dry weight and shoot:root ratio values of ~40 seedlings per size for Scots pine and Norway spruce. For Scots pine, the mean needle length of the 40 seedlings grown in each container cell size, as well as the percentage of seedlings with primary needles, were assessed for all seedlings after planting.
| Species | Scots pine | Norway spruce | ||||
| Seed origin | T8 Dal | 130 Domsjöänget | ||||
| Cell size | 30cc | 50cc | 90cc | 30cc | 50cc | 90cc |
| Height (cm) | 10.1 | 11.8 | 13.2 | 11.3 | 15.0 | 24.4 |
| Stem base∅ (mm) | 1.9 | 2.3 | 3.1 | 1.6 | 2.1 | 3.1 |
| Needle length (cm) | 2.8 | 5.8 | 6.9 | N. A | N. A. | N. A. |
| Root dry weight (g) | 0.26 | 0.55 | 0.93 | 0.16 | 0.37 | 0.60 |
| Shoot dry weight (g) | 0.38 | 0.92 | 1.91 | 0.41 | 0.75 | 1.67 |
| Shoot:root ratio | 1.55 | 1.74 | 2.16 | 2.56 | 2.05 | 2.80 |
| Primary needles (%) | 95 | 22 | 0.6 | N. A. | N. A. | N. A. |
Table 2.
Classification scheme for detailed assessment of planting position following planting. Since each mound is heterogenous, a seedling in class 5 could be adjacent to a mound of class 7, 8 or 9 since the part of the mound adjacent to the hinge does not necessarily match the classification assessment in the position where the mound seedling was planted. Planting positions that can be considered low quality with respect to risk of pine weevil damage are italicized.
| Main position | Description | Class |
|---|---|---|
| Mineral soil | with peat or decomposing humus in the patch | 1 |
| Mineral soil | in the bottom or close to the bottom of the patch | 2 |
| Mineral soil | less than 10 cm from humus edge in the patch | 3 |
| Mineral soil | with relatively high position in the patch | 4 |
| Hinge | max 10 cm from a low quality* mound | 5 |
| Hinge | max 10 cm from a capped mound | 6 |
| Mound | without mineral soil cover | 7 |
| Mound | capped with a mineral soil mixed with humus | 8 |
| Mound | capped with coherent cover of mineral soil | 9 |
Table 3.
Number of seedlings planted per planting position and quality assessment class.
| Position | Mineral soil (patch/depression) |
Hinge | Mound | ||||||
|---|---|---|---|---|---|---|---|---|---|
| Class | 1 | 2 | 3 | 4 | 5 | 6 | 7 | 8 | 9 |
| Pine | 17 | 429 | 146 | 93 | 117 | 485 | 70 | 293 | 285 |
| Spruce | 5 | 476 | 45 | 174 | 211 | 380 | 31 | 296 | 310 |
Table 4.
Results from ANOVA (type II Wald chi-square tests) on generalized mixed linear models for probability of survival for pine and spruce seedlings following the third growing season in the field. Significant results are highlighted in bold. *Positions for pine are high quality mineral soil (classes 2 and 4), high quality hinge (class 6), low quality positions (classes 1, 3, 5 and 7) and capped mounds (classes 8 and 9), while for spruce, the low-quality positions also include class 8 and the last position, high quality capped mound, only includes class 9.
| Factor | Pine | Spruce | ||||
|---|---|---|---|---|---|---|
| Chisq | Df | Pr(>Chisq) | Chisq | Df | Pr(>Chisq) | |
| Position * | 74.16 | 3 | <0.001 | 42.13 | 3 | <0.001 |
| AP treatment | 0.74 | 1 | 0.39 | 0.14 | 1 | 0.71 |
| Size | 0.83 | 2 | 0.66 | 0.09 | 2 | 0.96 |
Table 5.
Results from ANOVA (type II Wald chi-square tests) on generalized mixed linear models for probability of pine weevil damage to pine and spruce seedlings following the third growing season in the field. Significant results are highlighted in bold. *Positions for pine are high quality mineral soil (classes 2 and 4), high quality hinge (class 6), low quality positions (classes 1, 3, 5 and 7) and capped mound (classes 8 and 9), while for spruce the low-quality positions also include class 8 and the last position, high quality capped mound, only includes class 9.
| Factor | Pine | Spruce | ||||
|---|---|---|---|---|---|---|
| Chisq | Df | Pr(>Chisq) | Chisq | Df | Pr(>Chisq) | |
| Position* | 21.78 | 3 | < 0.001 | 51.03 | 3 | < 0.001 |
| AP treatment | 1.56 | 1 | 0.21 | 0.34 | 1 | 0.56 |
| Size | 192.38 | 2 | < 0.001 | 97.49 | 2 | < 0.001 |
Table 6.
Results from ANOVA (type II Wald chi-square tests) on generalized mixed linear models for probability of mortal outcome of pine weevil damage for pine and spruce seedlings following the third growing season in the field. Significant results are highlighted in bold. *Positions for pine are high quality mineral soil (classes 2 and 4), high quality hinge (class 6), low quality positions (classes 1, 3, 5 and 7) and capped mound (classes 8 and 9), while for spruce the low-quality positions also include class 8 and the last position, high quality capped mound, only includes class 9.
| Factor | Pine | Spruce | ||||
|---|---|---|---|---|---|---|
| Chisq | Df | Pr(>Chisq) | Chisq | Df | Pr(>Chisq) | |
| Position* | 40.00 | 3 | < 0.001 | 32.13 | 3 | < 0.001 |
| AP Treatment | 2.81 | 1 | 0.09 | 0.14 | 1 | 0.71 |
| Size | 2.46 | 2 | 0.29 | 0.31 | 2 | 0.86 |
Table 7.
Results from ANOVA (type II/III Wald F tests with Kenward-Roger df) on linear mixed models for stem basal diameter, root + shoot dry weight and shoot to root ratio of pine seedlings following the third growing season in the field. Significant results are highlighted in bold.
Table 7.
Results from ANOVA (type II/III Wald F tests with Kenward-Roger df) on linear mixed models for stem basal diameter, root + shoot dry weight and shoot to root ratio of pine seedlings following the third growing season in the field. Significant results are highlighted in bold.
| Pine size | Stem basal diameter | Root + shoot dry weight 2 | Shoot:Root ratio 2 | ||||||||
| Factor | Df | F | Df.res | Pr(>F) | F | Df.res | Pr(>F) | F | Df.res | Pr(>F) | |
| 30 cc | Position 1 | 3 | 30.84 | 505.06 | < 0.001 | 6.48 | 138.41 | < 0.001 | 6.58 | 138.83 | < 0.001 |
| AP | 1 | 1.08 | 502.31 | 0.30 | 0.002 | 137.91 | 0.97 | 0.76 | 138.19 | 0.38 | |
| Position:AP | 3 | 3.40 | 507.30 | 0.02 | - | - | - | - | - | - | |
| 50 cc | Position 1 | 3 | 5.33 | 597.58 | 0.02 | 6.67 | 143.93 | < 0.001 | 7.34 | 145.84 | < 0.001 |
| AP | 1 | 3.40 | 599.81 | 0.02 | 4.79 | 142.10 | 0.03 | 2.05 | 144.08 | 0.15 | |
| Position:AP | 3 | 20.83 | 601.71 | < 0.001 | 2.78 | 143.76 | 0.04 | - | - | - | |
| 90 cc | Position 1 | 3 | 20.80 | 575.24 | < 0.001 | 8.53 | 140.99 | < 0.001 | 3.96 | 141.29 | 0.01 |
| AP | 1 | 2.78 | 569.93 | 0.10 | 0.002 | 139.32 | 0.96 | 1.19 | 139.39 | 0.28 | |
| Position:AP | 3 | - | - | - | - | - | - | - | - | - | |
1Positions for pine are high quality mineral soil (classes 2 and 4), high quality hinge (class 6), low quality positions (classes 1, 3, 5 and 7) and capped mound (classes 8 and 9), while for spruce the low-quality positions also include class 8 and the last position, high quality capped mound, only includes class 9. 2Harvested seedlings.
Table 8.
Results from ANOVA (Type II Wald F tests with Kenward-Roger df) on linear mixed models for height, root + shoot dry weight and shoot to root ratio of spruce seedlings following the third growing season in the field, for each seedling size, respectively. Significant results are highlighted in bold. For spruce, there were no significant interactions, so this component was dropped from the models.
| Spruce size | Height | Root + shoot dry weight 2 | Shoot:Root ratio 2 | ||||||||
| Factor | Df | F | Df.res | Pr(>F) | F | Df.res | Pr(>F) | F | Df.res | Pr(>F) | |
| 30 cc | Position 1 | 3 | 4.22 | 554.34 | 0.006 | 1.16 | 84.121 | 0.33 | 1.34 | 90.93 | 0.26 |
| AP | 1 | 6.37 | 549.62 | 0.01 | 7.73 | 89.79 | 0.01 | 0.06 | 88.21 | 0.81 | |
| 50 cc | Position 1 | 3 | 9.97 | 644.54 | < 0.001 | 6.94 | 160.68 | < 0.001 | 1.55 | 160.88 | 0.20 |
| AP | 1 | 10.81 | 638.63 | 0.001 | 12.72 | 159.99 | < 0.001 | 0.65 | 160.12 | 0.42 | |
| 90 cc | Position 1 | 3 | 11.69 | 547.99 | < 0.001 | 7.87 | 139.17 | < 0.001 | 5.20 | 137.80 | 0.002 |
| AP | 1 | 4.61 | 543.57 | 0.03 | 2.51 | 136.89 | 0.12 | 0.03 | 136.39 | 0.87 | |
1 Positions for spruce are high quality mineral soil (classes 2 and 4), high quality hinge (class 6), low quality positions (classes 1, 3, 5, 7 and 8) and high-quality capped mound (class 9). 2Harvested seedlings.
Table 9.
Increase in growth from original size to the estimated marginal mean size from growth models for pine and spruce for sizes 30, 50 and 90 cc, respectively, in each planting position and treatment group. HQ mineral soil = high quality mineral soil positions, class 2 and 4; HQ hinge = high quality hinge position, class 6; LQ = low quality positions, class 1, 3, 5, 7 for pine and 1, 3, 5, 7, 8 for spruce; CM =capped mound, class 8 and 9 (for pine), HQ CM = high quality capped mound, class 9 (for spruce). For each species, seedlings with the highest relative growth increase are shaded in green, intermediate growth increase in yellow and red for the lowest increase. The highest increase planting position- and treatment combination for each species is marked in darker green.
| Position | AP | Pine stem basal diameter | Spruce height | ||||
|---|---|---|---|---|---|---|---|
| 30 cc | 50 cc | 90 cc | 30 cc | 50 cc | 90 cc | ||
| HQ mineral soil |
0 | 471% | 426% | 368% | 154% | 153% | 70% |
| 1 | 523% | 460% | 384% | 173% | 171% | 77% | |
| HQ hinge |
0 | 590% | 505% | 434% | 178% | 195% | 93% |
| 1 | 655% | 569% | 450% | 197% | 212% | 101% | |
| LQ |
0 | 627% | 446% | 407% | 185% | 168% | 82% |
| 1 | 631% | 493% | 423% | 204% | 186% | 89% | |
| CM/HQ CM | 0 | 703% | 567% | 467% | 182% | 161% | 96% |
| 1 | 652% | 537% | 483% | 201% | 178% | 104% | |
Table 10.
Results from ANOVA (type II Wald chi-square tests) on generalized mixed linear models for the probability of occurrence of multiple leading shoots for pine seedlings following the third growing season in the field. Significant results are highlighted in bold.
Table 10.
Results from ANOVA (type II Wald chi-square tests) on generalized mixed linear models for the probability of occurrence of multiple leading shoots for pine seedlings following the third growing season in the field. Significant results are highlighted in bold.
| Multiple leading shoots on pine | |||
| Factor | Chisq | Df | Pr(>Chisq) |
| Position 1 | 13.17 | 3 | 0.004 |
| AP Treatment | 0.05 | 1 | 0.83 |
| Size | 31.61 | 2 | < 0.001 |
| Prolepsis in the previous year | 1.44 | 1 | 0.23 |
| Adventitious buds in the previous year | 5.99 | 1 | 0.01 |
1 Positions for pine are high quality mineral soil (classes 2 and 4), high quality hinge (class 6), low quality positions (classes 1, 3, 5 and 7) and capped mound (classes 8 and 9).
Disclaimer/Publisher’s Note: The statements, opinions and data contained in all publications are solely those of the individual author(s) and contributor(s) and not of MDPI and/or the editor(s). MDPI and/or the editor(s) disclaim responsibility for any injury to people or property resulting from any ideas, methods, instructions or products referred to in the content. |
© 2024 by the authors. Licensee MDPI, Basel, Switzerland. This article is an open access article distributed under the terms and conditions of the Creative Commons Attribution (CC BY) license (http://creativecommons.org/licenses/by/4.0/).
Copyright: This open access article is published under a Creative Commons CC BY 4.0 license, which permit the free download, distribution, and reuse, provided that the author and preprint are cited in any reuse.


