
Submitted:
21 February 2024
Posted:
21 February 2024
You are already at the latest version
Abstract
The aim of the study was to test the significance of the EPT index in the water quality assessment of three types of water bodies in hilly and mountainous region of Serbia. The aquatic macroinvertebrate community was dominated by the group of insects, of which 95 taxa represent the EPT group. We compared the obtained values of biological indices used for the assessment of water quality according to the national legislation with the overall status assessment represented by the ecological quality classes (EQC). The results of the Spearman correlation test showed a negative correlation of EQC with the EPT index, BMWP score, H', total number of taxa and number of sensitive taxa, while a positive correlation was observed for the values of SI and Tubificinae %. The values of EQC and biological indices were subjected to principal component analysis (PCA). The results showed that the parameters that contributed most to the differences were the EPT index, the BMWP score and the number of sensitive taxa. The results indicate that the EPT index is an excellent indicator of changes in water quality and an important tool for the ecological categorization of water bodies in mountain regions.
Keywords:
Aquatic insects
; EPT group
; diversity
; biological indices
; water quality assessment
; hilly and mountain streams
; Serbia
1. Introduction
The benthic macroinvertebrate fauna is an effective tool for documenting changes in overall ecological status, and also one of the most prominent biological quality elements (BQEs) used for the ecological assessment of rivers under the European Water Framework Directive (WFD) [1]. Aims of WFD are to prevent further deterioration and to protect and improve the status of aquatic ecosystems, with the explicit goal of achieving at least “good ecological status” for all surface waters by 2027 [2].
Macroinvertebrate offer numerous advantages for biomonitoring. Sampling is relatively simple and has minimal adverse effects on the resident biota [3,4,5]. Macroinvertebrate taxa generally occur in characteristic and limited habitats within their geographic range and are usually most abundant near their respective ecological optimum [6,7]. The benthic macroinvertebrates are good indicators of local conditions and are particularly suitable for assessing site-specific impacts, as many of them have restricted migration patterns or a sessile lifestyle [8]. Larval stages will respond quickly to stress. Many of these groups are relatively easy to identify to the lower taxonomic levels such as genus and species [9,10].
Many aquatic insects are intolerant to various types of pressures, therefore along with increased pollution, lower diversity can be expected. Barbour et al. [10] compared a large number of macroinvertebrate indices and found that simple species counts, especially sensitive taxa, were most effective in determining water body impairment.
Some of the macroinvertebrate based indices of river health have been proven to be particularly useful and effective, such as EPT (Ephemeroptera + Plecoptera + Trichoptera) index. This index was named after three orders of aquatic insects common in the benthic macroinvertebrate community: Ephemeroptera (mayflies), Plecoptera (stoneflies) and Trichoptera (caddisflies). It represents the sum of the taxa richness of these three orders [11].
Publications from1950s stated that species of these three orders are generally intolerant of pollution [12]. The EPT larvae are easy to sort and identify and are often used as an indicator of water quality. The EPT index has been recommended as possibly the most efficient of the macroinvertebrate indices, especially in lotic ecosystems where they are the dominant component of the representative community [13,14].
A complex river network covers most of the territory of Serbia and belongs to the catchment area of Black, Adriatic and Aegean Sea. The Serbian territory belongs to south-east Europe, covering the central part of the Balkan Peninsula and the southern part of the Pannonian Plain. It can be clearly divided into two regions – the Pannonian plain and the hilly and mountainous region south of the Danube and Sava rivers [15]. The distribution of aquatic organisms in this area is therefore a complex issue. The diversity of benthic macroinvertebrates in this area is significant and it is considered the main diversity hotspot of aquatic insects in Europe, especially the EPT groups [16]. Paunović et al. [17] used the distribution of macroinvertebrates to delineate the boundaries of ecoregions on the territory of Serbia with regard to the original concept of Illies [15], which was accepted by the WFD. According to these authors [17], the hilly and mountainous region of the country belongs to the ecoregion 5 (Dinaric Western Balkan) and ecoregion 7 (Eastern Balkan).
The aims of the study were: to assess the significance of the EPT index in the evaluation of the water quality assessment of three types of water bodies in the mountainous regions of Serbia; to test the relationship between the obtained values of biological indices used for the assessment of water quality of these types of water bodies according to the national legislation and the overall ecological status assessment represented by the ecological quality classes (EQC); to test whether the EPT index is sufficiently meaningful and self-sufficient for the assessment of water quality of hilly and mountainous streams.
2. Materials and Methods
Study area
The collection of benthic macroinvertebrate samples in spring and fall 2019 was conducted to supplement the data for the revision of the Water Management Plan for the territory of the Republic of Serbia. It included 119 watercourses that previously haven’t been part of the routine water quality monitoring led by the Environmental Protection Agency of the Republic of Serbia. The analyzed dataset in this paper included the group of hilly and mountainous small to medium sized streams with predominantly hard bottom substrate, classified according to the Serbian typology of watercourses [18]. The focus was on 44 sites located on three selected stream types (Figure 1). The selected types of watercourses were: type 3 - small and medium streams, altitude up to 500 m a.s.l., dominance of larger substrate (mesolithal, macrolithal, megalithal) (24 sites); type 4 - small and medium streams, altitude above 500 m a.s.l. and dominance of larger substrate (mesolithal, macrolithal, megalithal) (6 sites) and type 6 - small watercourses outside the area of the Pannonian Plain that do not fall under types 3 and 4 and are not covered by the regulation on the establishment of surface and groundwater bodies (combination of different types of substrate) (14 sites) [19] (Table 1). Most of the investigated sites have microhabitat substrate characterized by boulders and cobbles and fast velocity of flow. The size of the microhabitat substrates were defined according to Hering et al. [20].
Macroinvertebrate sampling and processing
Samples were collected using the kick and sweep sampling method from all microhabitat types according to European standards [21] with an FBA hand net (25x25 cm, mesh size 500 μm). According to Tubić et al. [22] the kick and sweep sampling method is more effective compared to quantitative Surber net sampling in terms of general taxa richness and taxa richness within the main components of the benthic communities in the water body type of small to medium sized streams with predominantly coarse bottom substrate.
The biological material was pooled and transferred to sample containers (250 ml) and preserved with 70% ethanol. The benthic macroinvertebrates were identified based on their morphological characteristics using stereomicroscope ZEISS Stemi 2000C (x50) and Nikon SMZ 800N (x75), ZEISS Axio Lab. A1 (x630) at the lowest possible taxonomic level using appropriate identification keys [23,24,25,26].
Biological metrics
The following biological metrics were used for the analysis and comparison: EPT index, total number of taxa per sample (No. of taxa), Saprobic Index (SI) [27], Biological Monitoring Working Party (BMWP score) [28], Diversity Index/Shannon-Wiener Index (H′) [29], number of sensitive taxa (No. of sensitive taxa), percentage participation of subfamily Tubificinae (Oligochaeta) (Tubificinae %). Average Score Per Taxon (ASPT) is a slightly modified version of BMWP score. It is calculated by dividing the BMWP values by the sum of the relative abundances of the present families. As it is based on the values of the BMWP score, it was not taken into account.
In accordance with national legislation and the established class boundaries for the metrics, the relevant parameters were used to assess ecological status of each river type based on macroinvertebrate metrics [19]. This is represented with the ecological quality classes (EQC). The ecological status assessed as high corresponds to class I, good corresponds to class II, moderate corresponds to class III, poor corresponds to class IV and bad corresponds to class V. The EQC obtained for selected types of watercourses were taken into account in order to compare them with the values of the biological indices used for the assessment of water quality according to the national legislation.
Data analyses
All metrics calculations, based on macroinvertebrate taxa lists, were performed using ASTERICS 4.04 software package [30]. This software is commonly used in similar studies [22,31] as a tool for assessing ecological quality in European streams with benthic macroinvertebrates.
The obtained metric values were tested for normality by the Kolmogorov-Smirnov test. Since the variables lacked normality of distribution, nonparametric tests were applied. Spearman’s nonparametric correlation test (p<0.05) was used to assess the relationship between the EQC and EPT index, No. of taxa, SI, BMWP score, H′ and No. of sensitive taxa and Tubificinae % for three types of watercourse. Relationship between EQC and biological indices was analyzed using principal component analysis (PCA). PCA was done for all ecological indices with respect to EQC aiming to understand the ordination. IBM SPSS Statistics for Windows Software (Version 22.0; IBM Corp, Armonk, NY, USA) was used for the data processing.
3. Results
The ecological characteristics of the community recorded at the 44 studied sites correspond to the communities typical of hilly and mountainous watercourses. Insects were the most dominant group in the community. Mayflies, stoneflies and caddisflies were recorded at all sampling sites as an important component of the community. Together they represented 28 families and 95 taxa (8/30 mayflies, 6/18 stoneflies, 14/47 caddisflies families/taxa). Species Taeniopteryx nebulosa (Linnaeus, 1758), Baetis (Baetis) pavidus Grandi, 1949 and Epeorus (Ironopsis) yougoslavicus (Samal, 1935) classified as strictly protected according national legislation were recorded) [32]. The number of recorded representatives of the EPT group and their presence or absence in the three types of analyzed water bodies is shown in the Table 2 below.
In type 3 watercourses 194 taxa of benthic macroinvertebrates were identified. Insects were the principal components of the macroinvertebrate communities with 142 taxa. The EPT groups (53 taxa) were one of the main components of macroinvertebrate communities. A significant number of recorded taxa belongs to orders Ephemeroptera (23.8% of the total community, 23 taxa), Plecoptera (1.03%, 6 taxa) and Trichoptera (7.21%, 24 taxa) (Figure 2).
In type 4 watercourses a total of 136 taxa were identified in the macroinvertebrate community at the analyzed sites. In terms of taxa richness and number of individuals, insects were the dominant group in the community (78.16%, 121 taxa). Of the identified insects, almost half of the community (57 identified taxa) belonged to the target group (EPT) organisms in terms of taxa richness and number of individuals with 89.64%/22 taxa, 7.21%/12 taxa and 3.14%/19 taxa, respectively (Figure 2).
Of the 14 sites analyzed that belonged to a type 6 watercourse, 159 benthic macroinvertebrate taxa were identified. In terms of the number of taxa, the most diverse group was the Insecta (132 taxa). The EPT groups represented an important component of the community at the sites surveyed and were represented by a total of 63 taxa. Regarding the percentage of these three taxonomic groups, Ephemeroptera were the most represented with 22.12% of the total macroinvertebrate community recorded, while Plecoptera and Trichoptera were represented with 7.61% and 5.4% of the total number of taxa recorded, respectively. Ephemeroptera with 21 taxa and Plecoptera with 15 taxa recorded, had a high diversity in the total community. Trichoptera (27 taxa) had the highest number of taxa in the total community (Figure 2).
Differences in the distribution of target groups of insects in analyzed types of watercourses were evident. The structure of the Ephemeroptera community in respect to three different types of watercourses is shown in Figure 3. The family Baetidae was present with the largest number of species (12) and the species Baetis rhodani (Pictet, 1843) was the representative of the Ephemeroptera group with a significant abundance in all three types of studied water bodies. The species Ecdyonurus (Helvetoraeticus) subalpinus Klapalek, 1907 was only found in type 4, but it was the most abundant species of the Ephemeroptera group, along with Baetis (Baetis) alpinus (Pictet, 1843).
The species Leuctra gr. hippopus Kempny, 1899 was the representative of the Plecoptera group, and was recorded with a significant abundance in all three types of studied water bodies, with type 3 showing the highest values. In water types 4 and 6, species Protonemura montana Kimmins, 1941 and Siphonoperla torrentium (Pictet, 1841), which favor watercourses at higher altitudes, with domination of larger substrate, were the most numerous among the Plecoptera. (Figure 4).
With regard to the participation of the Trichoptera group at the investigated localities, the dominant family was the Limnephilidae with 11 species recorded. Depending on the type of water body, different species were found. Psychomyia pusilla (Fabricius, 1781) in type 3, Micrasema setiferum (Pictet, 1834) in type 4 and Chaetopteryx villosa (Fabricius, 1798) in type 6 were the most abundant species (Figure 5).
Indicative status assessment was carried out according to the procedure based on the class boundaries and in accordance with current legislation [19]. Analyzed localities were classified in the ecological quality classes from I (high ecological status) to V (bad ecological status).
In the type 3 watercourses, most sites have a poor or bad ecological status, mainly due to the low values of EPT index. Good ecological status was achieved on 5 sites, while moderate ecological status was recorded on 6 sites (Table 3).
In type 4 watercourses, good ecological status was achieved at three analyzed sites. One site was characterized by poor ecological status, while moderate ecological status was recorded at the other two sites (Table 4).
Based on the values obtained, it can be concluded that, overall, good ecological status was achieved in the studied type 6 watercourses, based on most of the parameters analyzed. A moderate ecological status was found at four localities (Table 5).
Results of Spearman correlation test (p<0.05), showed correlation of EQC with all biological indices (Table 6). It showed negative correlation with BMWP score, H′, No. of taxa, EPT index and No. of sensitive taxa, while positive correlation was observed for the values of SI and Tubificinae %. Results showed strong negative correlation of EQC with EPT index, BMWP score and No. of sensitive taxa, while other obtained correlations are of medium strength.
Two principal components were extracted from the biplot and accounted for 77.14% of the total variation in the dataset (Figure 6). The first principle component (PC1) accounted for 60.51% of the variability, with EPT index, BMWP score and No. of sensitive taxa as the parameters that contributed most to the separation (Figure 6, Table 7). The second PC (PC2) explained 16.63% of the total variance, with SI, No. of taxa and Tubificinae % as the parameters that contributed most to the separation (Figure 6, Table 7).
4. Discussion
The ecological characteristics of the recorded community at the analyzed sites correspond to the communities usually found in the hilly and mountainous rivers [18,19,33]. The EPT larvae is generally prevalent in the upper reaches of rivers and the assessment of water quality based on these three insect orders is sufficiently accurate [34,35]. According to Pastuchova [36], the composition and distribution of the three orders is determined by their physiological tolerance to a wide range of environmental variables.
The largest number of taxa was found in the Trichoptera group in all three types of analyzed water bodies. Individual taxa within the Trichoptera group, which are numerous, are typical representatives of a particular water body type in which they occur in large numbers. Trichoptera are a very important component of aquatic ecosystems. Many Trichoptera species are sensitive to pollution, so their presence and relative abundance are used for biological assessment and monitoring of water quality [37].
They are followed by the Ephemeroptera group, which has slightly fewer taxa at the analyzed sites, but more abundant occurrence. A similar structure of the Ephemeroptera community can be observed in the 4 and 6 watercourse types. It’s one of the most abundant groups of aquatic macroinvertebrates in all types of freshwater habitats, but its higher species diversity is characteristic of lotic habitats, especially the upper reaches of fast-flowing streams and rivers [38,39].
It can be seen that the Plecoptera community is more diverse and abundant in sites with a higher altitude. It’s significant component of running water ecosystems. The most members from this order are known to be intolerant to variation in their environmental conditions [40,41]. The stonefly sensitivity to variation in abiotic factors may lead to the extinction of taxa. In this regard, the Plecoptera is one of the most endangered groups of aquatic insects [42].
Species Taeniopteryx nebulosa (Linnaeus, 1758), Baetis (Baetis) pavidus Grandi, 1949 and Epeorus (Ironopsis) yougoslavicus (Samal, 1935) classified as strictly protected according national legislation were important from conservational point of view [32]. These stenovalent species are considered endangered in the lotic habitats of Serbia due to the small number of populations and the relatively distant and isolated biotopes, especially with regard to the parameters of temperature, oxygen and water velocity.
The biological metrics analyzed in our research (No. of taxa, SI, BMWP score, H′ index, No. of sensitive taxa, Tubificinae %) are known to be some of the most important indicators of water quality [31,43,44]. All these indices are a measure of the occurrence of taxa that are considered bioindicators of water quality. They vary considerably with the specific type of stressor, which means that they describe changing environmental conditions very well [45].
Shannon-Wiener - H′ index measuring the diversity of species in a community, which takes into account both abundance and evenness, is used to characterize species diversity. Values may vary directly with water quality and low diversity may indicate an unstable community [29]. Results showed medium strength correlation H′ index with EQC (Table 6).
On the other hand, results showed strong negative correlation of EQC with BMWP score and EPT index. The BMWP is the sum of individual values of all families present in the sample, multiplied by their relative abundance, which are actually indicators of the sensitivity of the taxa to organic pollution. This study confirms the importance of taking into account the family level in ecological assessments and biomonitoring programs development. Indices based on the genus and species taxonomic levels, such as the EPT index among others, are needed to improve the understanding of responses on the family level and the detection of specific pollution [46]. As the EPT group is included in the calculation of the BMWP score, since they have a low tolerance to pollution, many families from these three insect groups are assigned high scores. Therefore, it was expected that the values of the BMWP score would not deviate much from the values of the EPT index [47].
Furthermore, the results showed strong negative correlation of EQC with number of sensitive taxa. The number of sensitive taxa is based on the concept of the presence or absence of indicator taxa at the sampling site. Most indicator taxa belong to the EPT group as they tend to be very sensitive to different forms of pollution [8]. The list was included as part of the Fauna Aquatica Austriaca in 2004 [48]. Taxa that are considered sensitive have a narrow range of environmental requirements (e.g. stenotopic, stenoeceous) and react intolerantly to environmental disturbances. The inventory contains taxa with a wide range of sensitivity to physical, chemical and hydromorphological degradation.
The PCA also confirms previous results, given that biological indices that contributed the most to the separation on the PC1 axis were EPT index, BMWP score and No. of sensitive taxa (Figure 6, Table 7).
On the other hand, the values of the metrics SI and the percentage participation of the subfamily Tubificinae (Oligochaeta) in the macroinvertebrate community, whose higher values reflect a higher degree of pollution, were accompanied by a decrease in the values of the EPT index at most sampling sites. The values of the SI and Tubificinae indices showed statistically positive correlation with the values of the EQC (Table 6). The results of PCA analysis are in accordance with the previous mentioned, given that the parameters that contributed the most to the separation on the PC2 axis were No. of taxa and Tubificinae % (Figure 6, Table 7).
The Saprobic Index (SI) is one of the most traditional biological metrics commonly used to assess water quality. It focuses on the tolerance of species to organic pollution and is measured by a combination of the biological oxidation demand of a water sample and the presence of certain indicator organisms in the habitat. High values in the SI indicate a high level of organic pollution and a moderate to poor ecological status [27].
The oligochaete group comprises of a large number of species that cover a broad spectrum of pollution sensitivity. Oligochaetes are usually the most dominant taxa in fine/sandy freshwater sediments. Analyzing the percentage of Tubificinae gives an indication of sediment contamination. The presence of the subfamily Tubificinae (Oligochaeta) indicates poor water quality of these sites, but also the presence of a habitat suitable for these organisms (silt, clay mud and sand) [43].
Pollution by organic matter and nutrients, as well as hydromorphological degradation, as the main factors affecting aquatic ecosystems, in Serbia are most pronounced in the lowland regions. Population density, agricultural activities and industry in the country are mainly located in the lowlands [49,50]. As the benthic community changes under the various pressure, the abundance of populations of sensitive taxa decreases and the abundance of tolerant species increases [51]. Percentage participation of subfamily Tubificinae and values of and SI describe a change of environmental conditions in this type of watercourses very well [43,52].
However, sites where higher values of BMWP score and parameters based on the number of taxa (EPT index and H′) were expected, indicated poor to bad condition as well, especially at altitudes under 500 m (Table 3 and 5). Therefore, the overall status of these sites has been categorized as poor or bad, taking into account the poorer value of the individual metrics used to assess the overall water quality class [2]. On most investigated sampling sites the value of the EPT index determined the overall EQC. Results confirmed strong negative correlation of EQC with EPT index.
The macroinvertebrate fauna of aquatic ecosystems has changed as a result of various pressures such as organic and chemical pollution, land use and hydromorphological alterations, as well as biological invasions. There is a growing need for cost and time efficient methods that can provide rapid results and assess a wide range of water quality statuses [53,54]. This has led to the use of rapid bioassay protocols [9] and the selection of appropriate biological indices that effectively and adequately reflect the state of the aquatic ecosystem.
The EPT metrics are also included in multimeric indices that have broader applications for assessing the condition of streams, such as the Benthic Macroinvertebrate Index of Biotic Integrity (B-IBI) [55] and the Invertebrate Community Index (ICI) [56]. Richness metrics including that of EPT have a direct connection to biodiversity studies conducted in a wide variety of flowing waters, which is why this index is suitable for use for water assessment outside the country of Serbia as well.
This study has shown that water quality assessments based on the EPT index are more reliable in less polluted watercourses, especially in pristine environments. The EPT index is a relatively accurate and effective tool compared to other indices we have used to detect water disturbance and classify water quality.
5. Conclusions
The representatives of the orders Ephemeroptera, Plecoptera and Trichoptera were recorded at all sampling sites, making more than half of the macroinvertebrate community at investigated hilly and mountainous ecosystems in Serbian waters. The results confirmed the sensitivity of the EPT index, represented by the sum of the taxa richness of these three orders, to changes of the macroinvertebrate communities in these types of water ecosystems. Higher values of the EPT index are found in water bodies with no or low pollution, while lower values of this index indicate an increase in pollution. In addition, these aquatic insects respond to a wide range of potential pollutants and respond to both short-term and long-term conditions that affect water quality.
This study showed strong negative correlation between EQC and EPT index, BMWP score and number of sensitive taxa. Also, results of PCA analysis are in accordance with the obtained results. As the EPT group is included in the calculation of these two metrics, results showed that the values of the BMWP score and number of sensitive taxa would not deviate much from the values of the EPT index. It can be concluded that the EPT index values effectively and adequately confirm changes in water quality in hilly and mountainous small to medium sized streams with predominantly hard bottom substrates. This index reflects the state of the aquatic ecosystem and provides accurate overall picture of water quality. It proved to be self-sufficient and reliable for water quality assessment in these types of water bodies. In addition, it proved to be an important tool for the prioritization of measures and the revision of the Water Management Plan for the territory of the Republic of Serbia. Furthermore, this index can also serve as a useful tool for early detection of pollution.
The EPT index should not be used to assess watercourses known to have low EPT taxa richness, such as lowland rivers at altitudes under 500 m, especially large rivers with fine substrate (silt, clay mud and sand) or slow flowing/stagnant water bodies (artificial channels and reservoirs - heavily modified water bodies) where the pollution tolerant groups are more significant. Moreover, this index is not suitable for the assessment of urban watercourses which are under higher anthropogenic pressure.
Having the above in mind, the overall status assessment is a complex matter. There is still a need for more intensive studies and further testing of the effectiveness of various indices used to assess water quality of different types of watercourses.
Author Contributions
Conceptualization, B.T. and M.P.; methodology, B.T. and M.P.; validation, M.P.; formal analysis, B. T. S.A., K. J., K.Z. J. Č. A. and B.V.; investigation, B.T., K. J., K.Z., B.V., J.Č.A. and S.A.; data curation, B.T. and M.P..; writing—original draft preparation, B.T., M.P., S.A.; writing—review and editing, B.T. and M.P.; supervision, M.P. All authors have read and agreed to the published version of the manuscript.
Funding
This research was funded by the MINISTRY OF SCIENCE, TECHNOLOGICAL DEVELOPMENT AND INNOVATION OF THE REPUBLIC OF SERBIA, contract No. 451-03-66/2024-03/ 200007.
Conflicts of Interest
The authors declare no conflict of interest.
References
- Vitecek, S.; Johnson, R.K.; Poikane, S. Assessing the Ecological Status of European Rivers and Lakes Using Benthic Invertebrate Communities: A Practical Catalogue of Metrics and Methods. Water 2021, 13, 346. [Google Scholar] [CrossRef]
- Directive 2000/60/EC of the European Parliament and Council of 23 October 2000 Establishing a Framework for Community Action in the Field of Water Policy. Off. J. Eur. Communities 2000, L327/1.
- Allan, J.D.; Castillo, M.M.; Capps, K.A. Stream Ecology; Springer International Publishing: Cham, 2021; ISBN 978-3-030-61285-6. [Google Scholar]
- Birk, S.; van Kouwen, L.; Willby, N. Harmonising the Bioassessment of Large Rivers in the Absence of Near-Natural Reference Conditions - a Case Study of the Danube River. Freshw. Biol. 2012, 57, 1716–1732. [Google Scholar] [CrossRef]
- Birk, S.; Bonne, W.; Borja, A.; Brucet, S.; Courrat, A.; Poikane, S.; Solimini, A.; Van De Bund, W.; Zampoukas, N.; Hering, D. Three Hundred Ways to Assess Europe’s Surface Waters: An Almost Complete Overview of Biological Methods to Implement the Water Framework Directive. Ecol. Indic. 2012, 18, 31–41. [Google Scholar] [CrossRef]
- Ter Braak, C.J.F.; Prentice, I.C. A Theory of Gradient Analysis. In Advances in Ecological Research; M. Begon, A.H.F.E.D.F., Macfadyen, A., Eds.; Academic Press, 1988; Volume 18, pp. 271–317. ISBN 0065-2504. [Google Scholar] [CrossRef]
- Dahl, J.; Johnson, R.K.; Sandin, L. Detection of Organic Pollution of Streams in Southern Sweden Using Benthic Macroinvertebrates. In Integrated Assessment of Running Waters in Europe; Springer Netherlands, 2004; pp. 161–172. [Google Scholar] [CrossRef]
- Rosenberg, D.M.; Resh, V.H. Freshwater Biomonitoring and Benthic Macroinvertebrates; Rosenberg, D.M., Resh, V.H., Eds.; Chapman & Hall: New York, 1993; ISBN 0412022516. [Google Scholar] [CrossRef]
- Barbour, M.T.; Gerritsen, J.; Snyder, B.D.; Stribling, J.B. Rapid Bioassessment Protocols for Use in Streams and Wadeable Rivers: Periphyton, Benthic Macroinvertebrates and Fish; 1999. [Google Scholar]
- Barbour, M.T.; Graves, C.G.; Plafkin, J.L.; Wisseman, R.W.; Bradley, B.P. Evaluation of EPA’s Rapid Bioassessment Benthic Metrics: Metric Redundancy and Variability among Reference Stream Sites. Environ. Toxicol. Chem. 1992, 11, 437–449. [Google Scholar] [CrossRef]
- Lenat, D.R. Water Quality Assessment of Streams Using a Qualitative Collection Method for Benthic Macroinvertebrates. J. North Am. Benthol. Soc. 1988, 7, 222–233. [Google Scholar] [CrossRef]
- GAUFIN, A.R.; TARZWELL, C.M. Aquatic Invertebrates as Indicators of Stream Pollution. Public Heal. reports (Washington, D.C. 1896) 1952, 67, 57–64. [Google Scholar] [CrossRef]
- Wallace, J.B.; Grubaugh, J.W.; Whiles, M.R. Biotic Indices and Stream Ecosystem Processes: Results from an Experimental Study. Ecol. Appl. 1996, 6, 140–151. [Google Scholar] [CrossRef]
- Herman, M.R.; Nejadhashemi, A.P. A Review of Macroinvertebrate-and Fish-Based Stream Health Indices. Ecohydrol. Hydrobiol. 2015, 15, 53–67. [Google Scholar] [CrossRef]
- Illies, J.; Andrassy, I.; Berzins, B.V.A.; Botosaneanu, L.; Brinck, P.; Brinkhurst, R.O.; Buchholz, K.F.; Dahl, R.; Dahm, A.G.; Fittkau, E.-J. LIMNOFAUNA EUROPAEA. Eine Zusammenstellung Aller Die Europäischen Binnengewässer Bewohnenden Mehrzelligen Tierarten Mit Angaben Über Ihre Verbreitung Und Ökologie. 1967. [Google Scholar] [CrossRef]
- Petrović, A.; Milošević, D.; Paunović, M.; Simić, S.; Đorđević, N.; Stojković, M.; Simić, V. New Data on the Distribution and Ecology of the Mayfly Larvae (Insecta: Ephemeroptera) of Serbia (Central Part of the Balkan Peninsula). Turkish J. Zool. 2015, 39, 195–209. [Google Scholar] [CrossRef]
- Paunović, M.; Tubić, B.; Kračun, M.; Marković, V.; Simić, V.; Zorić, K.; Atanacković, A. Ecoregions Delineation for the Territory of Serbia. Water Res. Manag. 2012, 2, 65–74. [Google Scholar]
- Regulation on Establishment of Surface and Groundwater Bodies. Off. Gaz. Repub. Serbia 2010, 96/2010.
- The Parameters of Ecological and Chemical Status of Surface Waters and Parameters of the Chemical and Quantitative Status of Groundwater. Off. Gaz. Repub. Serbia 2011, 74/2011.
- Hering, D.; Moog, O.; Sandin, L.; Verdonschot, P.F.M. Overview and Application of the AQEM Assessment System. Hydrobiologia 2004, 516, 1–20. [Google Scholar] [CrossRef]
- EN 27828:1994; Water Quality - Methods of Biological Sampling - Guidance on Handnet Sampling of Aquatic Benthic Macro-Invertebrates (ISO 7828:1985). European Committee for Standardisation: Brussels, Belgium, 1994.
- Tubić, B.P.; Popović, N.Z.; Raković, M.J.; Petrović, A.S.; Simić, V.M.; Paunović, M.M. Comparison of the Effectiveness of Kick and Sweep Hand Net and Surber Net Sampling Techniques Used for Collecting Aquatic Macroinvertebrate Samples. Arch. Biol. Sci. 2017, 69. [Google Scholar] [CrossRef]
- Lechthaler, W.; Stockinger, W. Trichoptera: Key to Larvae from Central Europe; Eutaxa Vienna, 2005; ISBN 3950183914. [Google Scholar]
- Zwick, P. Key to the West Palaearctic Genera of Stoneflies (Plecoptera) in the Larval Stage. Limnologica 2004, 34, 315–348. [Google Scholar] [CrossRef]
- Bauernfeind, E.; Lechthaler, W. Ephemeroptera–Key to Larvae from Central Europe. EUTAXA, CD-Edition, Vienna, Austria 2014, 1. [Google Scholar]
- Sivec, I.; Stark, B.P. The Species OfPerla (Plecoptera: Perlidae): Evidence from Egg Morphology. 2002. [Google Scholar]
- ZELINKA, M. Zur Prazisierung Der Biologischen Klassifikation Der Reinheid Fliessender Gewasser. Arch. Hydrobiol. 1961, 57, 389–407. [Google Scholar]
- Armitage, P.D.; Moss, D.; Wright, J.F.; Furse, M.T. The Performance of a New Biological Water Quality Score System Based on Macroinvertebrates over a Wide Range of Unpolluted Running-Water Sites. Water Res. 1983, 17, 333–347. [Google Scholar] [CrossRef]
- Shannon, C.E. A Mathematical Theory of Communication. Bell Syst. Tech. J. 1948, 27, 379–423. [Google Scholar] [CrossRef]
- AQEM Consortium. Manual for the Application of the AQEM System; Version 1.0; Contract No: EVK1-CT1999-00027; AQEM: Duisburg, Germany, 2002. [Google Scholar]
- Čanak Atlagić, J.; Anđus, S.; Đuknić, J.; Milivojević, A.; Kulić, K.; Pokrajac, J.; Tubić, B.; Paunović, M. Assessment of the Impact of Copper Mining and Related Industrial Activities on Aquatic Macroinvertebrate Communities of the Pek River (Serbia). Arch. Biol. Sci. 2021, 73, 291–301. [Google Scholar] [CrossRef]
- Regulations on Declaring and Protection of Strictly Protected and Protected Wild Species of Plants, Animals and Fungi. Off. Gaz. Repub. Serbia 2010, 5/2010.
- Bylak, A.; Kukuła, K. Impact of Fine-Grained Sediment on Mountain Stream Macroinvertebrate Communities: Forestry Activities and Beaver-Induced Sediment Management. Sci. Total Environ. 2022, 832, 155079. [Google Scholar] [CrossRef] [PubMed]
- Abdul Hamid, S.; Md Rawi, C.S. Influence of Substrate Embeddedness and Canopy Cover on the Distribution of Ephemeroptera, Plecoptera and Trichoptera (EPT) in Tropical Rivers. Aquat. insects 2011, 33, 281–292. [Google Scholar] [CrossRef]
- Ab Hamid, S.; Fakhrullah Salafusalam Mohd Affendi, M.; Aida Hashim, N.; Author, C. Role of Ephemeroptera, Plecoptera and Trichoptera (Insecta) Functional Feeding Groups in Leaf Decomposition in Tropical River. 2016, 9, 204–213. [Google Scholar]
- Pastuchová, Z. Macroinvertebrate Assemblages in Conditions of Low-Discharge Streams of the Cerová Vrchovina Highland in Slovakia. Limnologica 2006, 36, 241–250. [Google Scholar] [CrossRef]
- Holzenthal, R.W.; Blahnik, R.J.; Prather, A.L.; Kjer, K.M. Order Trichoptera Kirby, 1813 (Insecta), Caddisflies. Zootaxa 2007, 1668, 639–698. [Google Scholar] [CrossRef]
- Salles, F.F.; Da-Silva, E.R.; Hubbard, M.D.; Serrão, J.E. As Espécies de Ephemeroptera (Insecta) Registradas Para o Brasil. Biota Neotrop. 2004, 4, 1–34. [Google Scholar] [CrossRef]
- Williams, D.D. Applied Aspects of Mayfly Biology. In Advances in Ephemeroptera Biology; Springer US, 1980; pp. 1–17. [Google Scholar]
- Elliott, J.M.; Hellawell, J.M. Biological Indicators of Freshwater Pollution and Environmental Management. J. Anim. Ecol. 1987, 56, 1084. [Google Scholar] [CrossRef]
- Lazaridou-Dimitriadou, M. Seasonal Variation of the Water Quality of Rivers and Streams of Eastern Mediterranean. Web Ecol. 2002, 3, 20–32. [Google Scholar] [CrossRef]
- Fochetti, R.; De Figueroa, J.M.T. Notes on Diversity and Conservation of the European Fauna of Plecoptera (Insecta). J. Nat. Hist. 2006, 40, 2361–2369. [Google Scholar] [CrossRef]
- Atanacković, A.D.; Zorić, K.S.; Tomović, J.M.; Vasiljević, B. žica M.; Paunović, M.M. Distributional Patterns of Aquatic Oligochaeta Communities (Annelida: Clitellata) in Running Waters in Serbia. Arch. Biol. Sci. 2020, 72, 359–372. [Google Scholar] [CrossRef]
- Ofenböck, T.; Moog, O.; Gerritsen, J.; Barbour, M. A Stressor Specific Multimetric Approach for Monitoring Running Waters in Austria Using Benthic Macro-Invertebrates. In Integrated Assessment of Running Waters in Europe; Springer Netherlands, 2004; pp. 251–268. [Google Scholar] [CrossRef]
- Spyra, A.; Kubicka, J.; Strzelec, M. The Use of Biological Indices for the Assessment of the River Quality (Ruda River, Poland). Ecol. Chem. Eng. S 2017, 24, 285–298. [Google Scholar] [CrossRef]
- Tampo, L.; Kaboré, I.; Alhassan, E.H.; Ouéda, A.; Bawa, L.M.; Djaneye-Boundjou, G. Benthic Macroinvertebrates as Ecological Indicators: Their Sensitivity to the Water Quality and Human Disturbances in a Tropical River. Front Water 2021, 3, 662765. [Google Scholar] [CrossRef]
- Bylak, A.; Kukuła, K.; Ortyl, B.; Hałoń, E.; Demczyk, A.; Janora-Hołyszko, K.; Maternia, J.; Szczurowski, Ł.; Ziobro, J. Small Stream Catchments in a Developing City Context: The Importance of Land Cover Changes on the Ecological Status of Streams and the Possibilities for Providing Ecosystem Services. Sci. Total Environ. 2022, 815, 151974. [Google Scholar] [CrossRef]
- Moog, O.; Graf, W.; Janecek, B.F.U.; Ofenböck, T. Inventory of Sensitive Taxa of Austrian Rivers and Streams. 2004) Fauna Aquat. Austriaca. Katalog zur autökologischen Einstufung Aquat. Org. Österreichs. Tl. V, Ergänzungen 2003. [Google Scholar]
- Liška, I.; Wagner, F.; Sengl, M.; Deutsch, K.; Slobodník, J. Joint Danube Survey 3: A Comprehensive Analysis of Danube Water Quality. Final Sci. Report, Int. Comm. Prot. Danube River, Vienna, Austria 2015, 223. [Google Scholar]
- Liška, I.; Wagner, F.; Sengl, M.; Deutsch, K.; Slobodník, J.; Paunovic, M. Joint Danube Survey 4 Scientific Report: A Shared Analysis of the Danube River. Int. Comm. Prot. Danube River, Vienna 2021. [Google Scholar]
- Kupilas, B.; Friberg, N.; McKie, B.G.; Jochmann, M.A.; Lorenz, A.W.; Hering, D. River Restoration and the Trophic Structure of Benthic Invertebrate Communities across 16 European Restoration Projects. Hydrobiologia 2016, 769, 105–120. [Google Scholar] [CrossRef]
- Atanacković, A.; Popović, N.; Marinković, N.; Tomović, J.; Đuknić, J.; Stanković, J.; Paunović, M. Effects of Environmental Factors on the Distribution and Diversity of Aquatic Oligochaetes. Water 2023, 15, 3873. [Google Scholar] [CrossRef]
- Tockner, K.; Uehlinger, U.; Robinson, C.T. Rivers of Europe; Academic Press, 2009; ISBN 0080919081. [Google Scholar]
- Rahmani, H.; Shokri, M.; Janikhalili, K.; Abdoli, A.; Cozzoli, F.; Basset, A. Relationships among Biotic, Abiotic Parameters and Ecological Status in Shahid Rajaee Reservoir (Iran). Biologia (Bratisl). 2022, 77, 3159–3172. [Google Scholar] [CrossRef]
- Kerans, B.L.; Karr, J.R. A Benthic Index of Biotic Integrity (B-IBI) for Rivers of the Tennessee Valley. Ecol. Appl. 1994, 4, 768–785. [Google Scholar] [CrossRef]
- DeShon, J.E. Development and Application of the Invertebrate Community Index (ICI). Biol. Assess. criteria Tools water Resour. Plan. Decis. Mak. 1995, 217–243. [Google Scholar]
Figure 1.
Map of sampling localities.
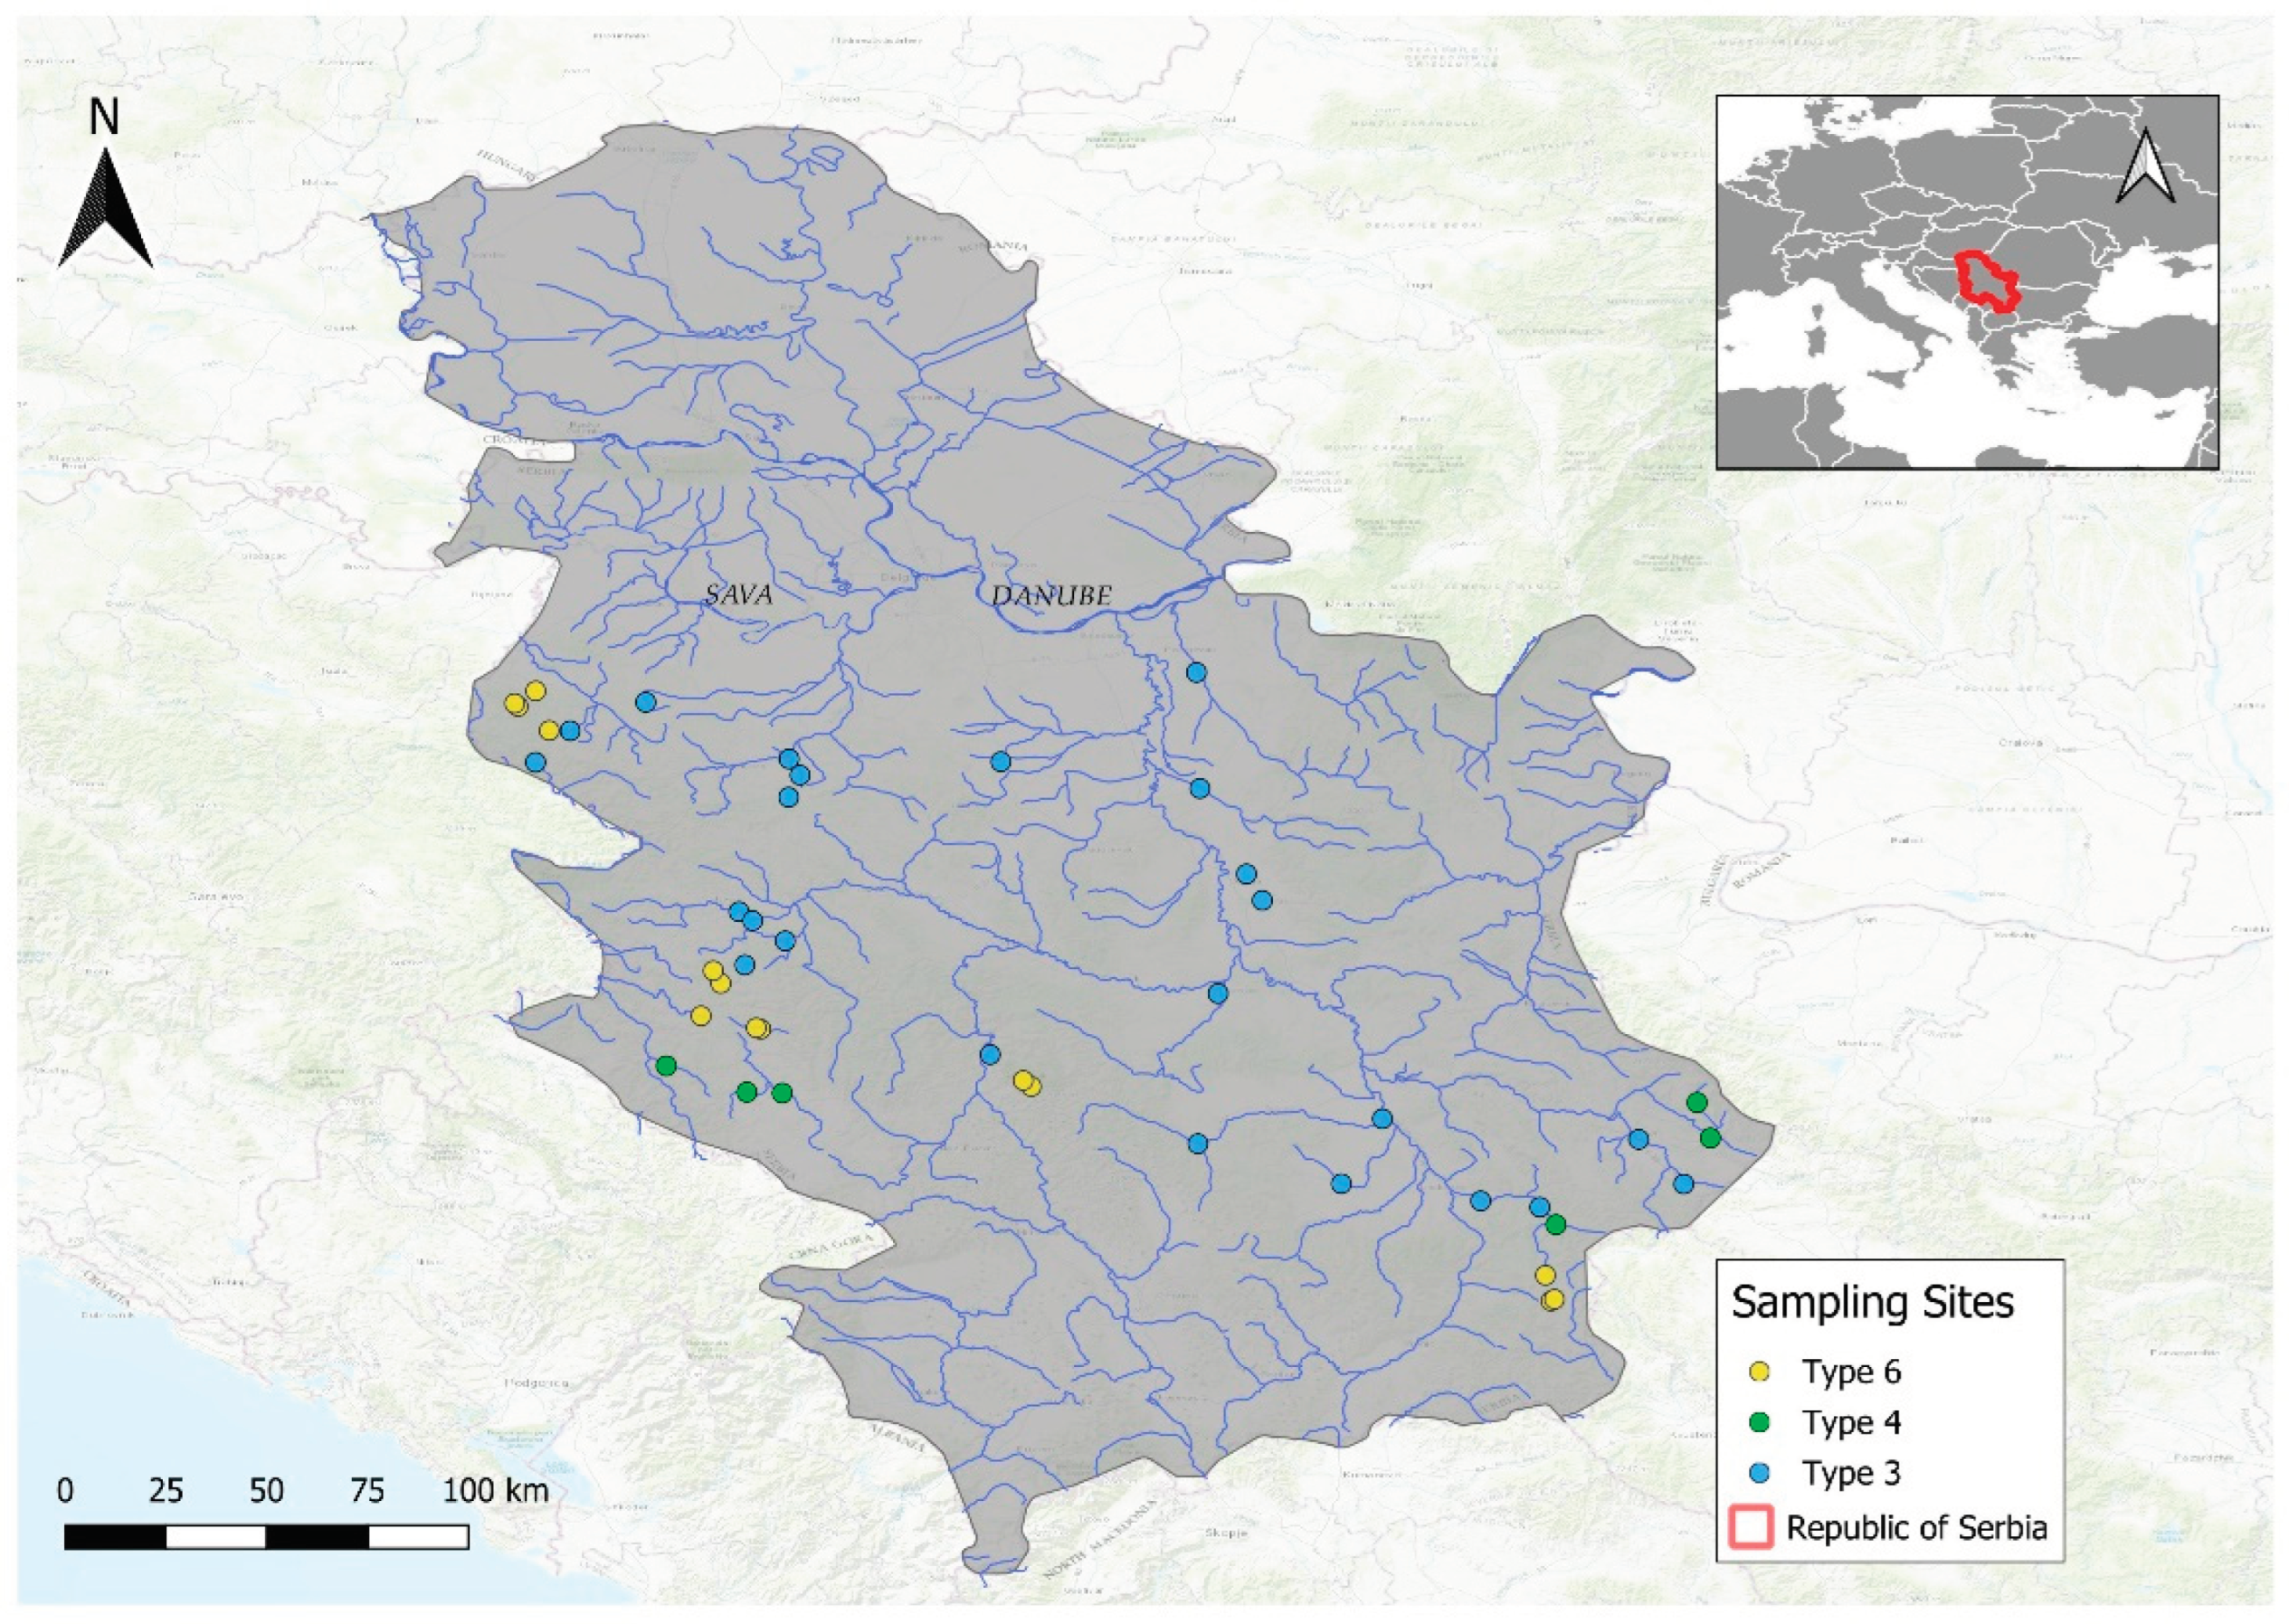
Figure 2.
(a) Total number of taxa, number of Insecta taxa, and number of EPT taxa at three types of watercourses; (b) Number of taxa of EPT orders, Ephemeroptera (E), Plecoptera (P), Trichoptera (T) at three types of watercourses.
Figure 2.
(a) Total number of taxa, number of Insecta taxa, and number of EPT taxa at three types of watercourses; (b) Number of taxa of EPT orders, Ephemeroptera (E), Plecoptera (P), Trichoptera (T) at three types of watercourses.
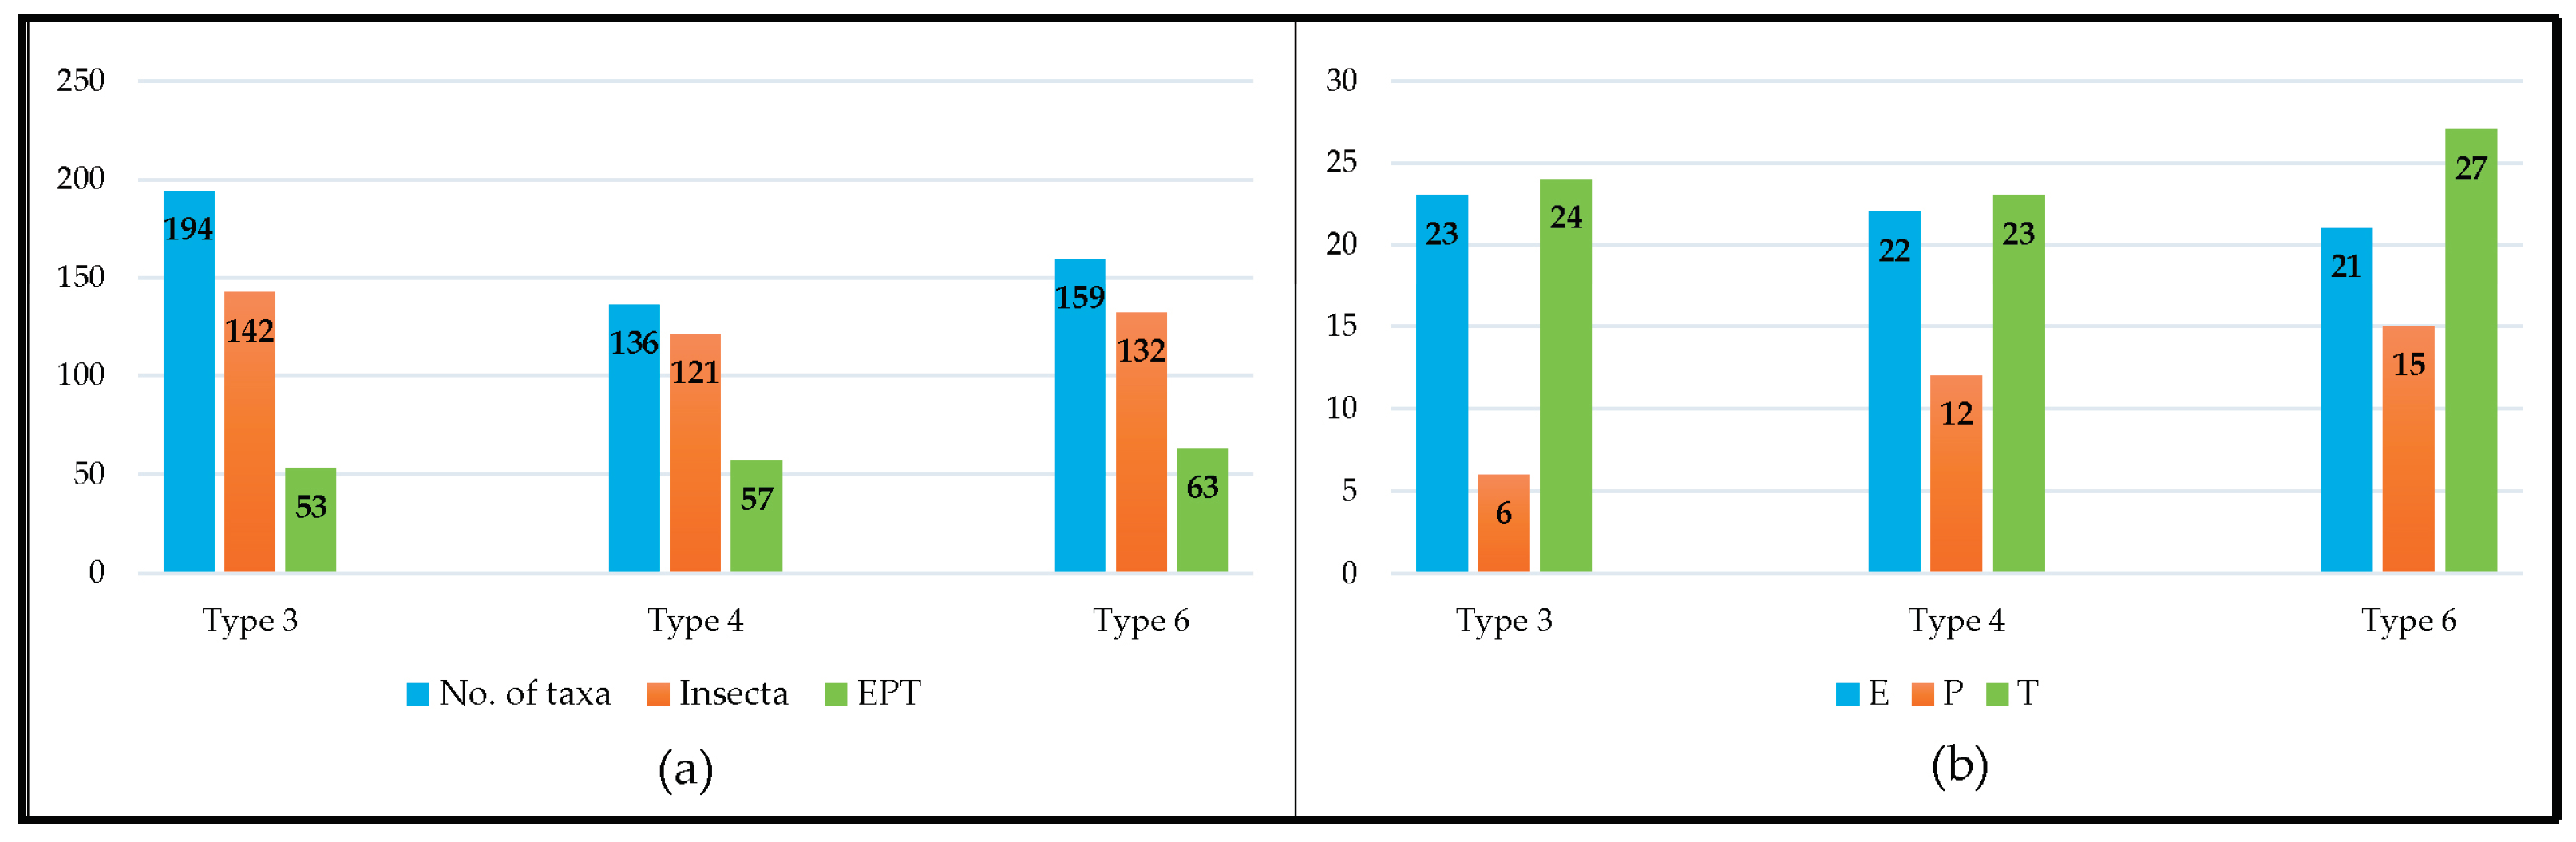
Figure 3.
Average abundance of Ephemeroptera taxa at three types of watercourses (individuals/m2).
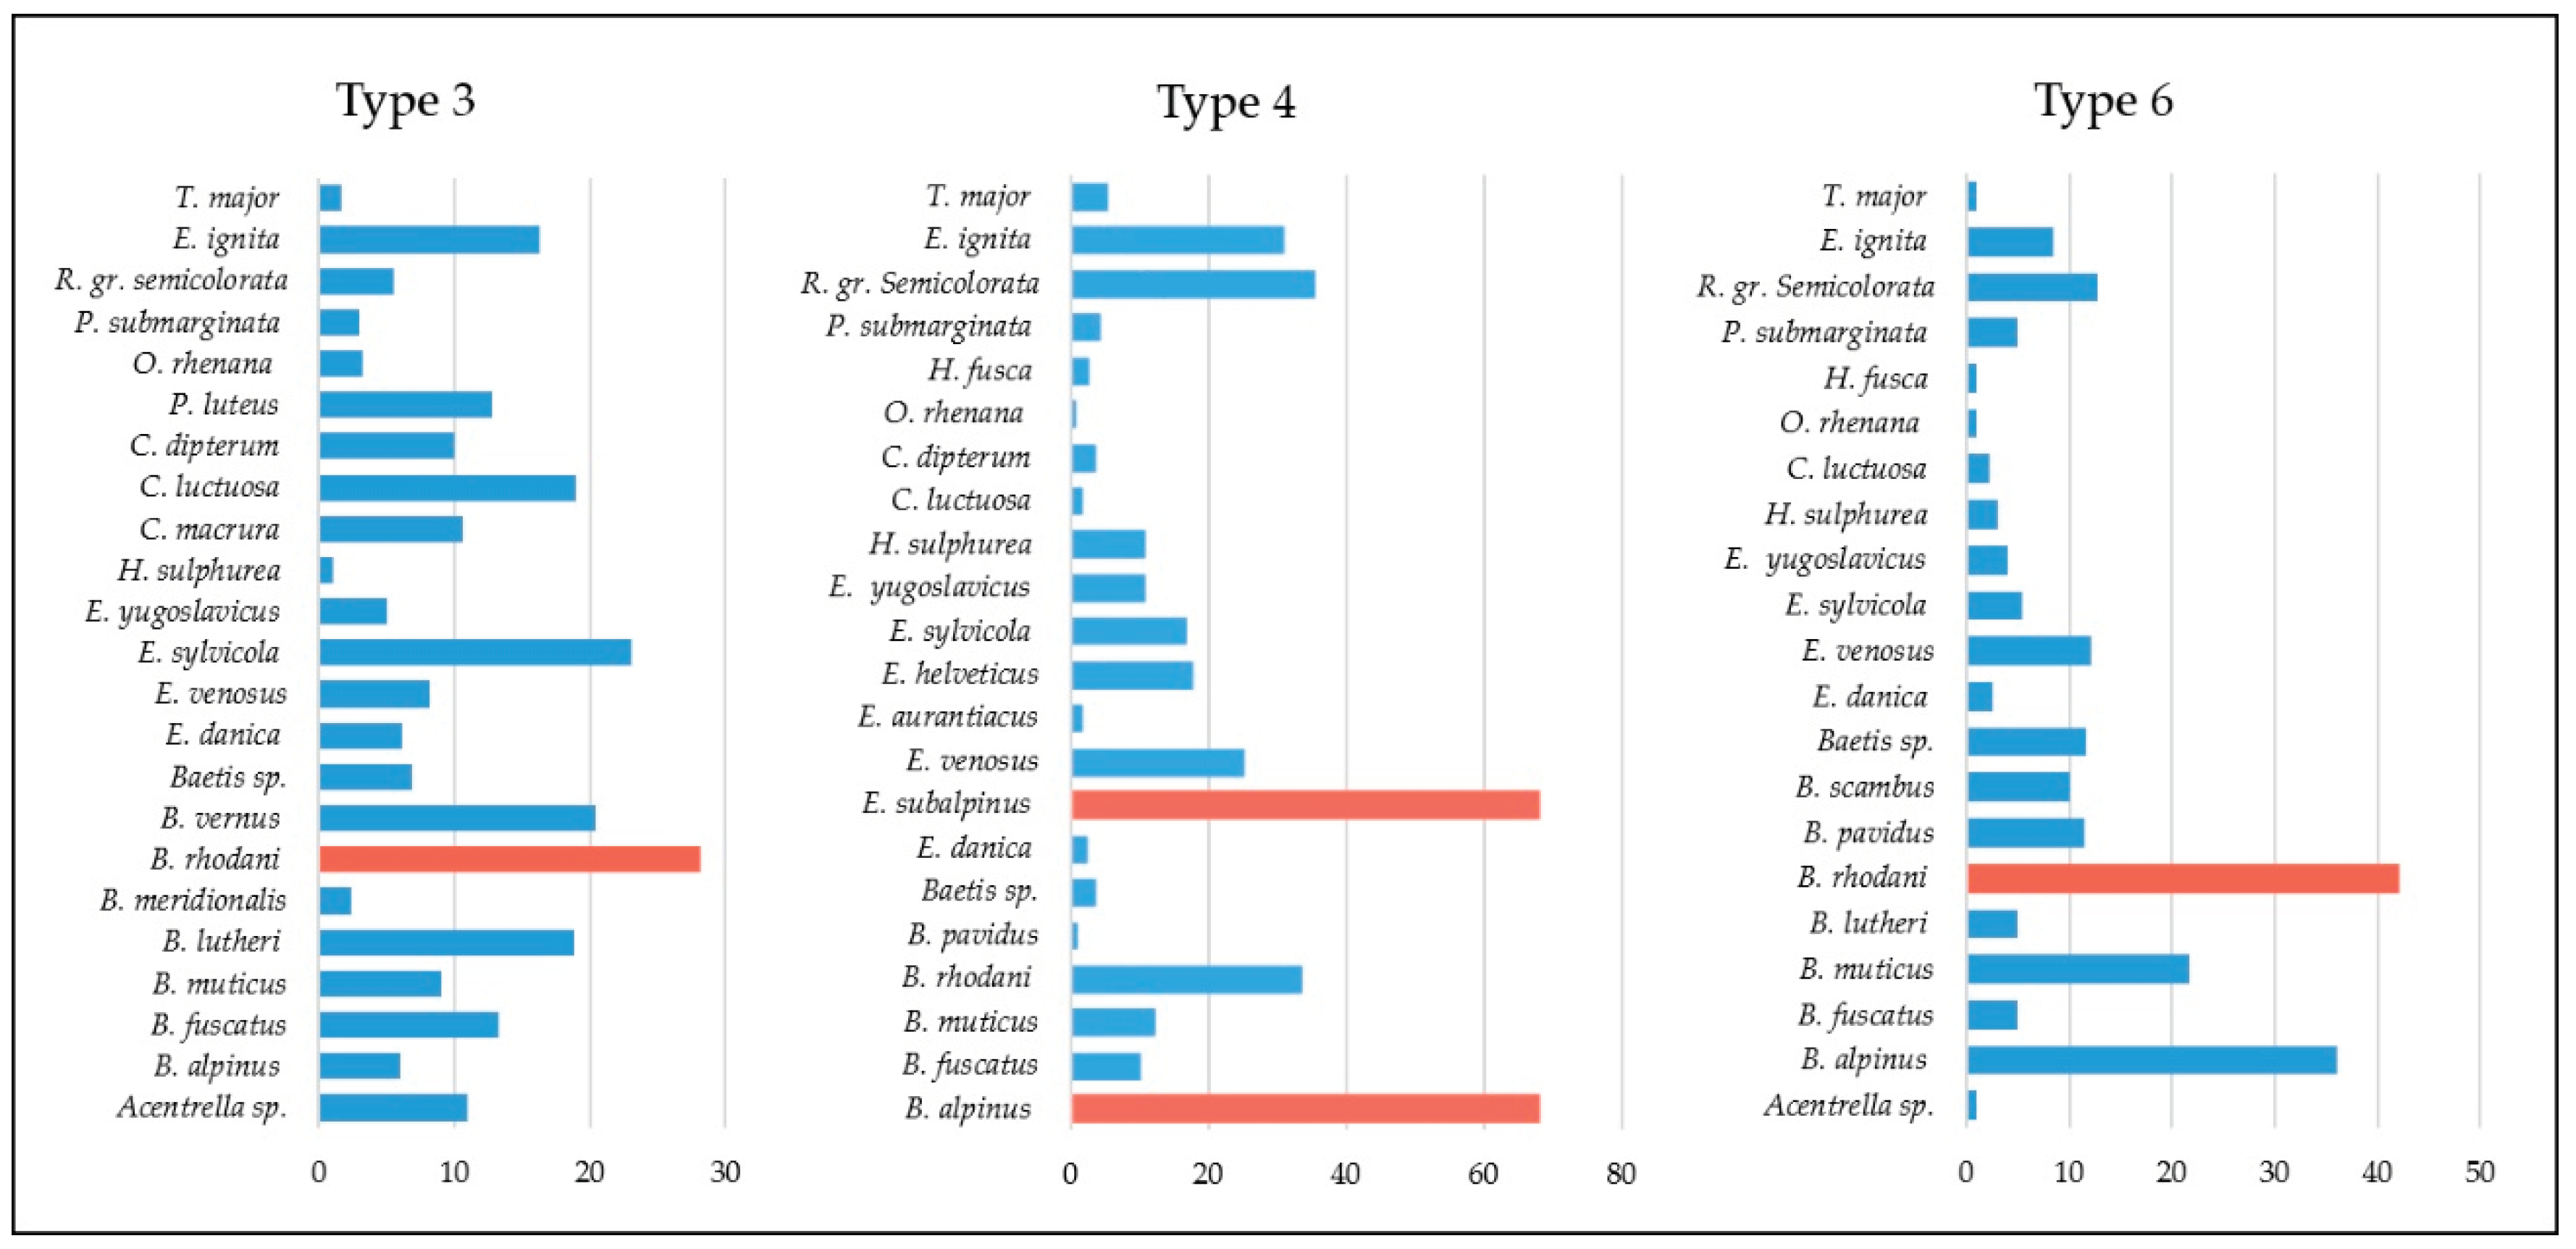
Figure 4.
Average abundance of Plecoptera taxa at three types of watercourses (individu-als/m2).
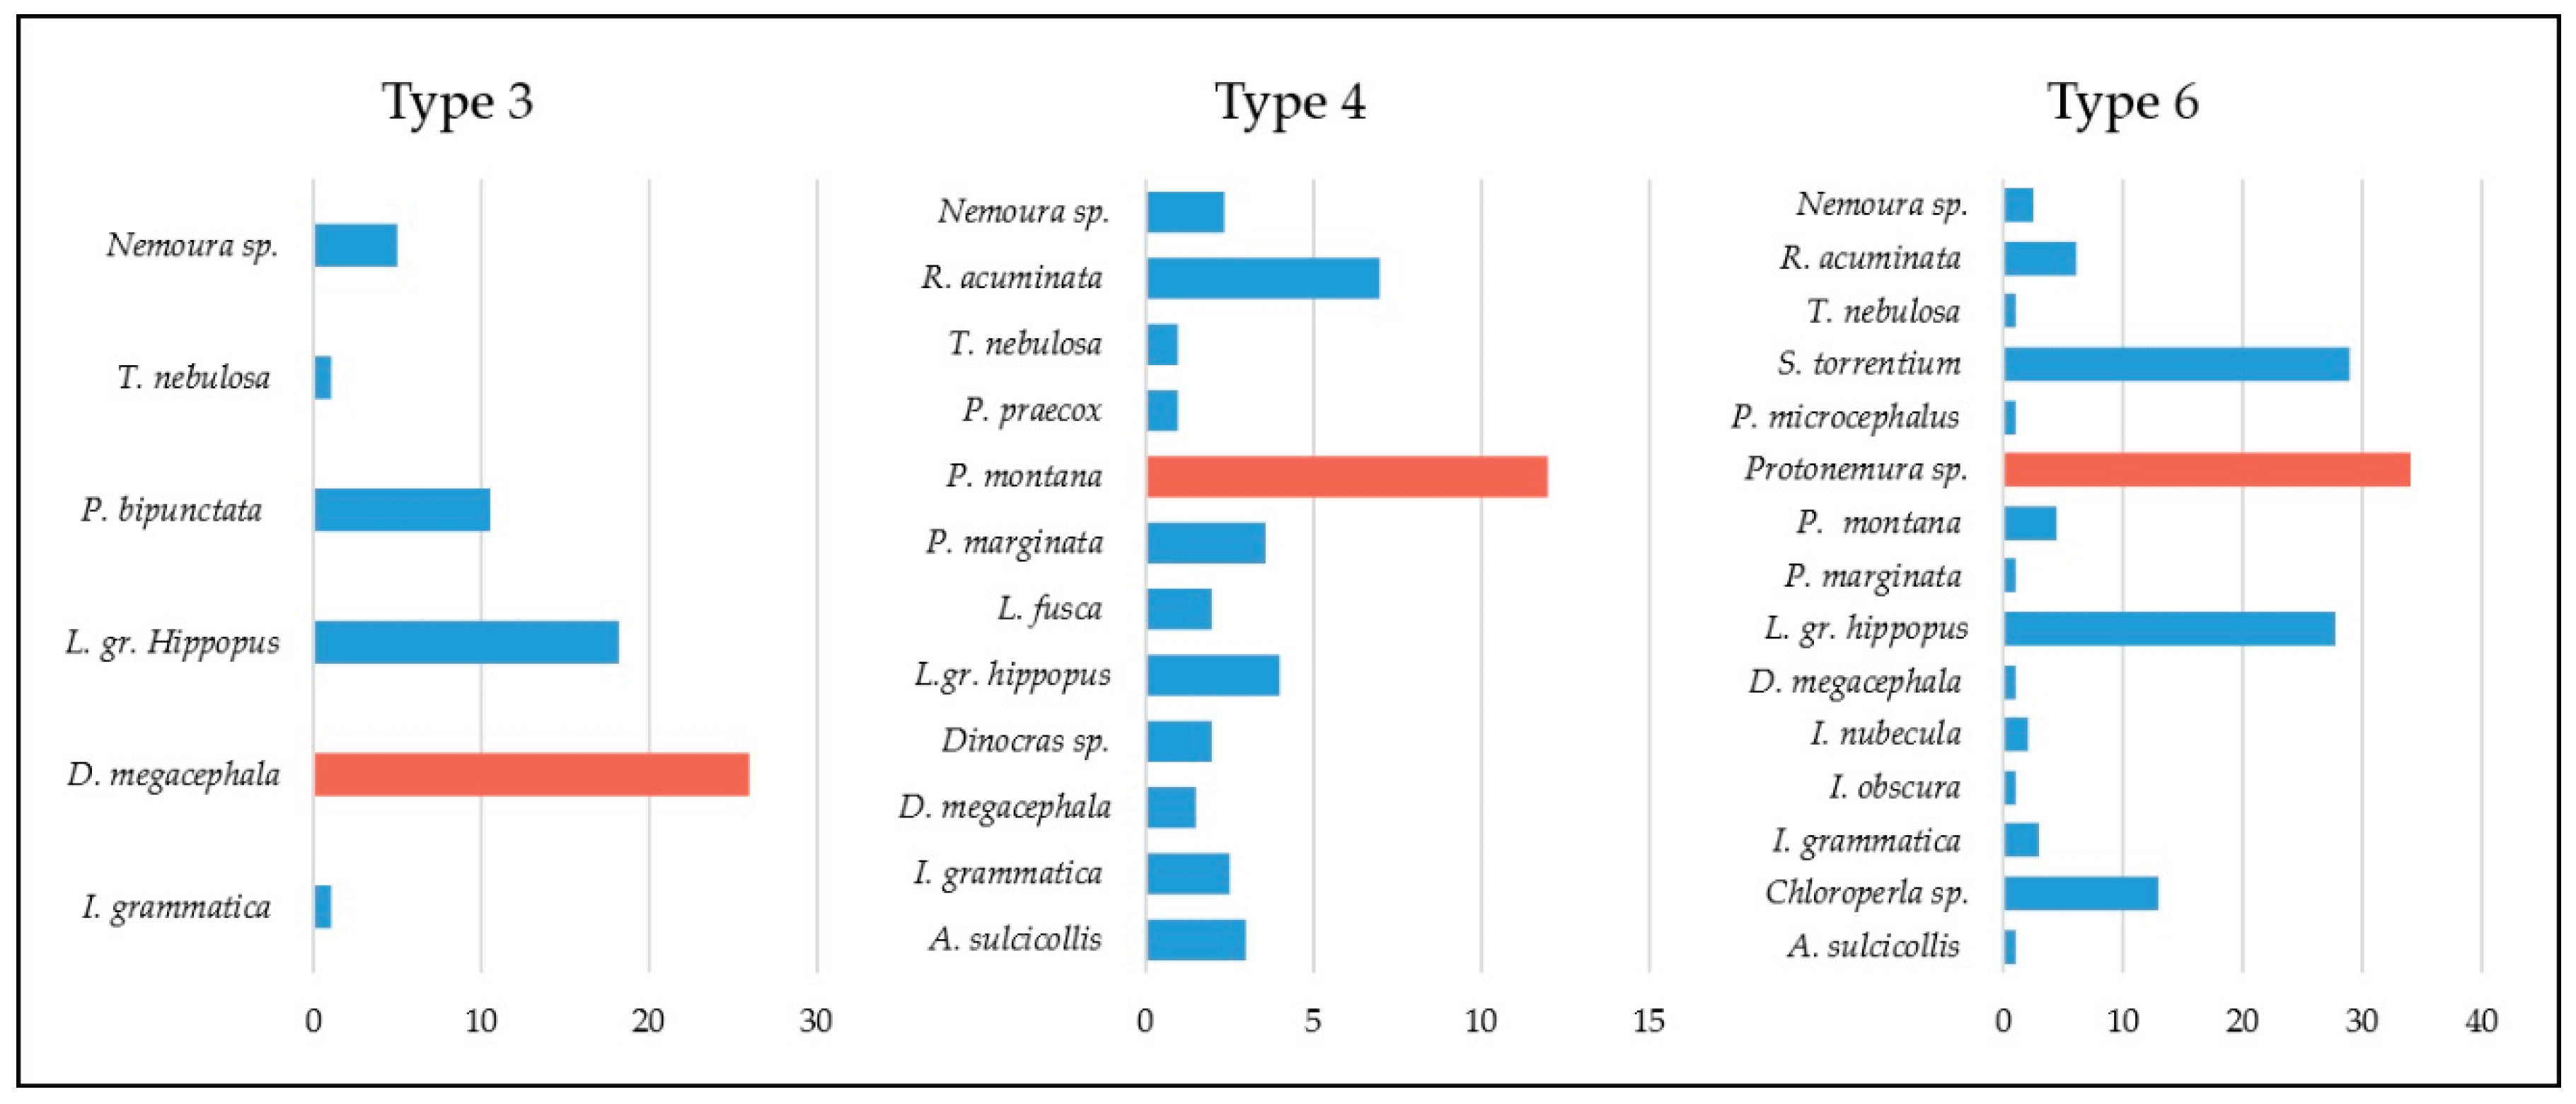
Figure 5.
Average abundance of Trichoptera taxa at three types of watercourses (individuals/m2).
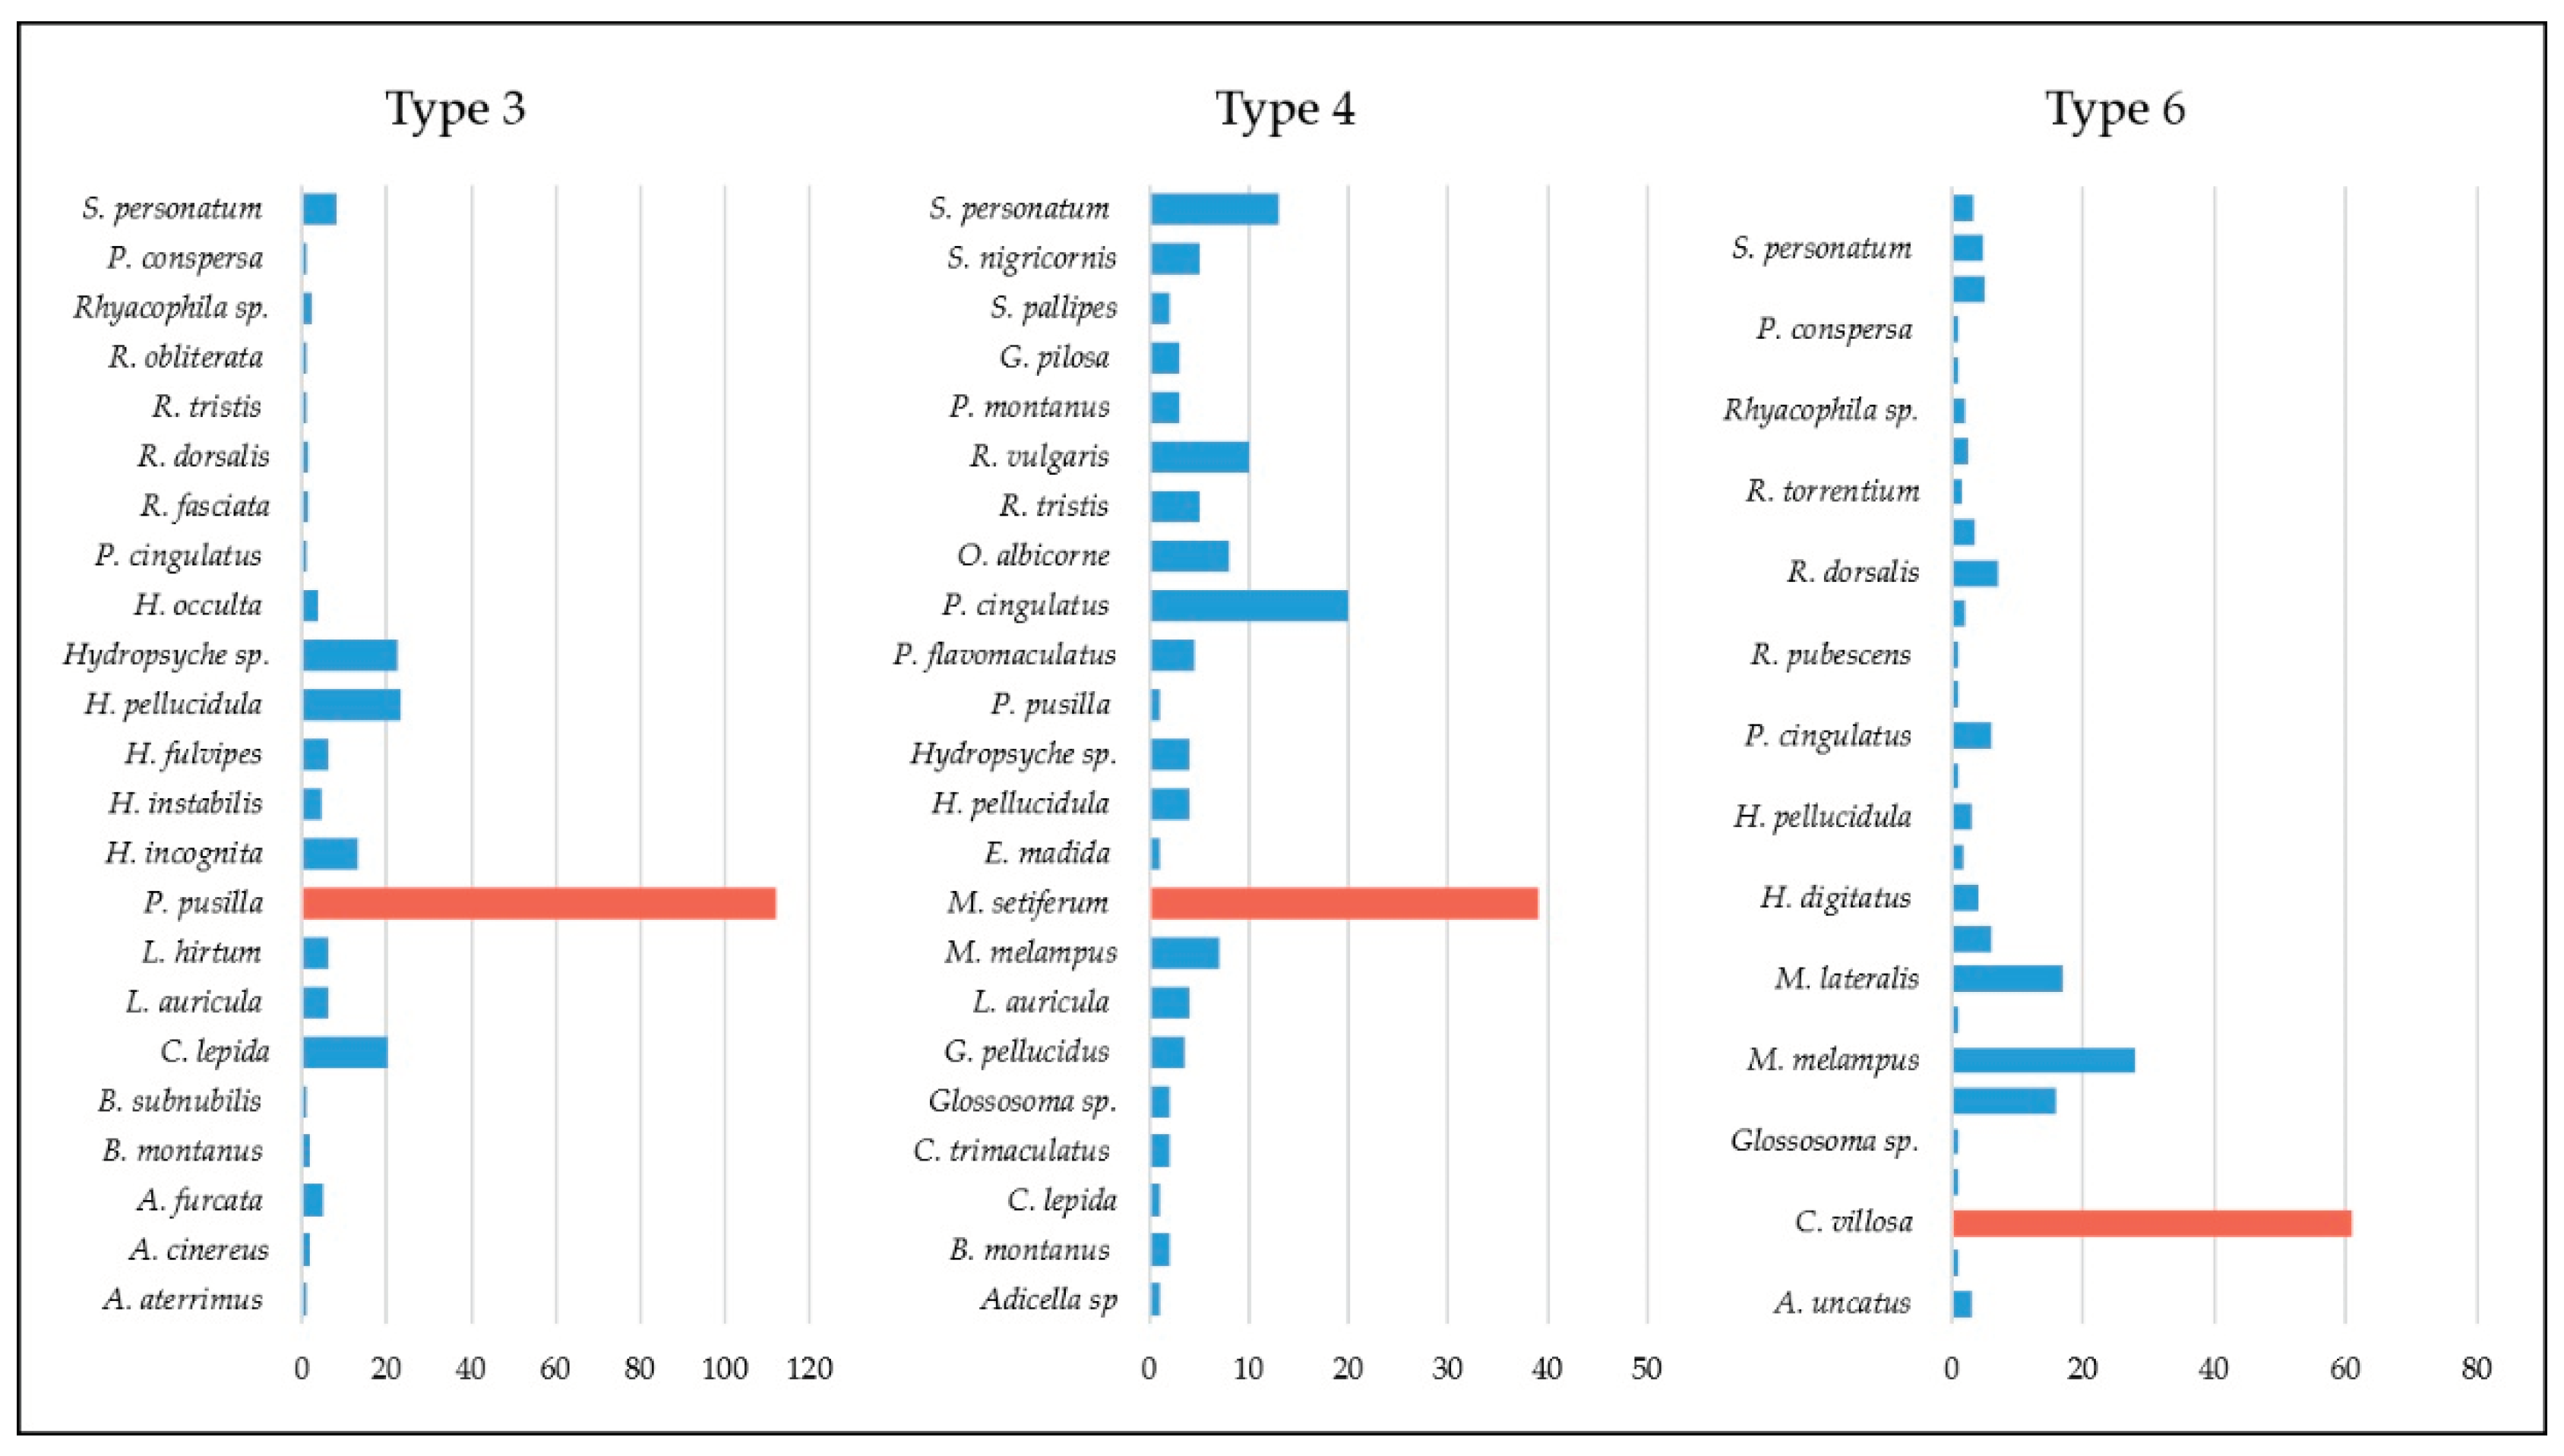
Figure 6.
Principal Component Analysis (PCA) – projection of the relative contribution of the biological indices used in the assessment of ecological status and obtained EQC.
Figure 6.
Principal Component Analysis (PCA) – projection of the relative contribution of the biological indices used in the assessment of ecological status and obtained EQC.
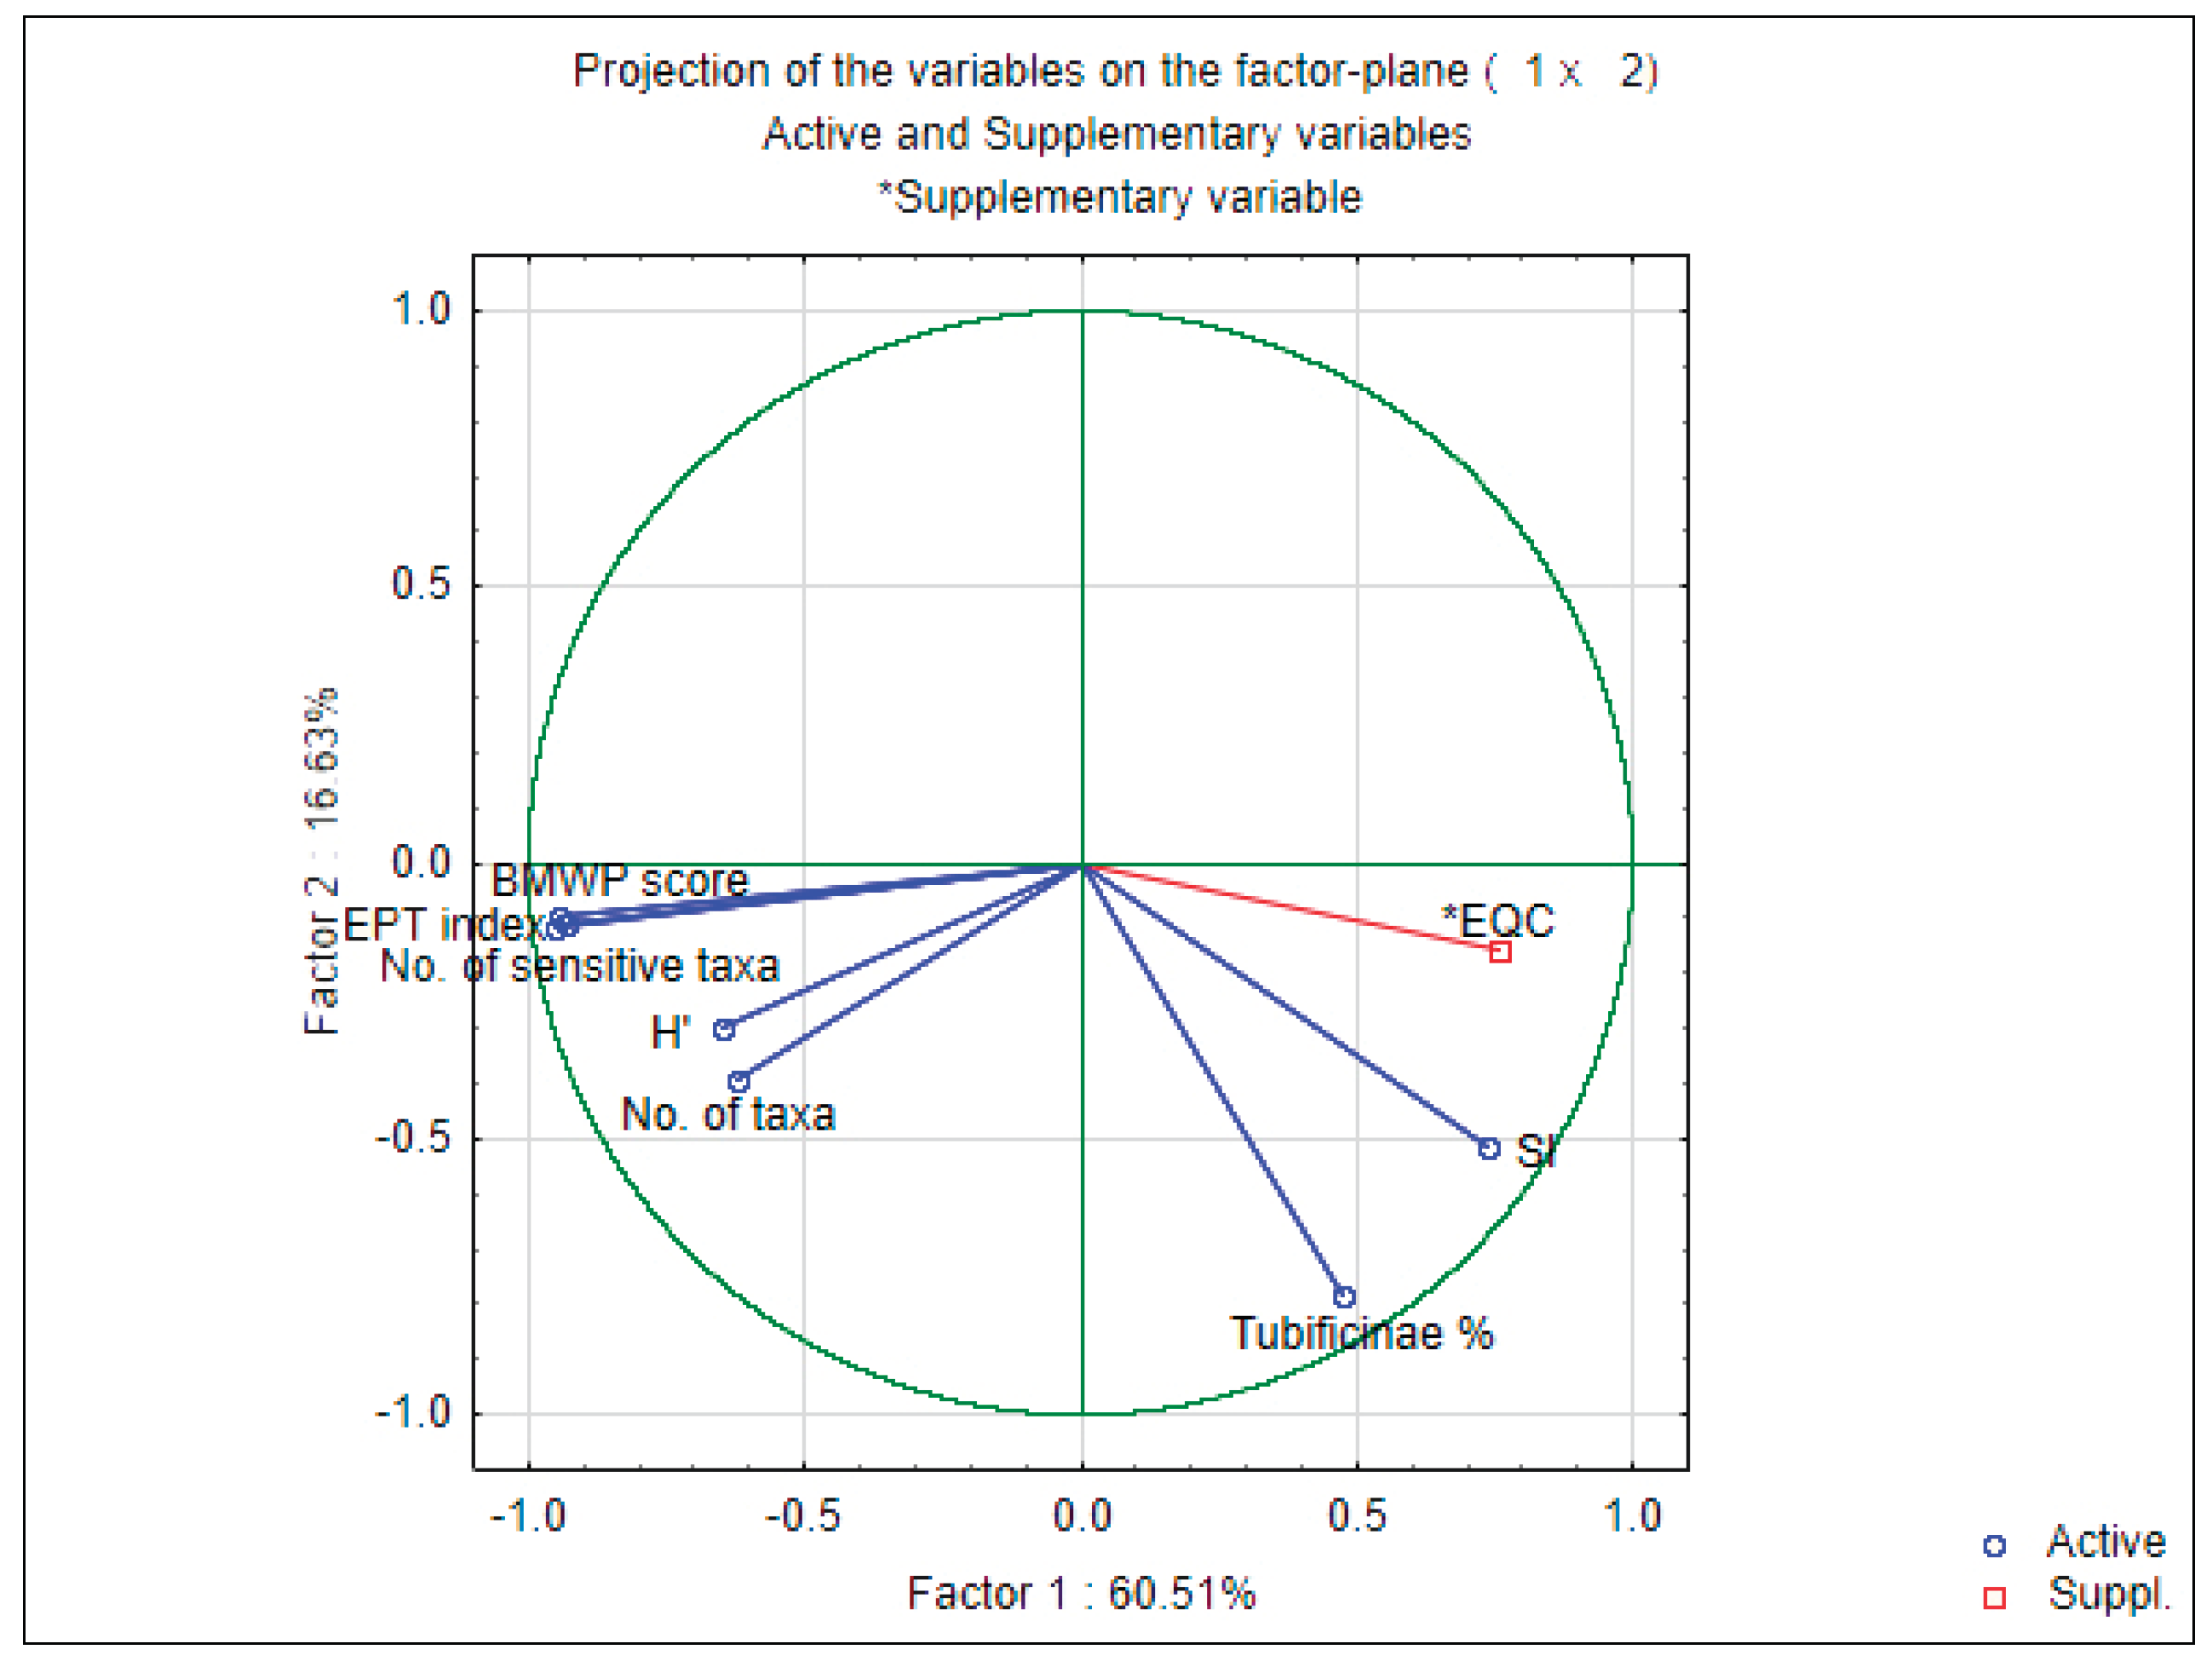

Table 1.
Sampling localities by watercourse type with GPS coordinates.
| No. | Type of watercourse | Localities | N | E | Altitude (m) |
|---|---|---|---|---|---|
| 1 | Type 3 | Kamenica | 44.27879 | 20.69594 | 203 |
| 2 | Grza | 43.86491 | 21.47602 | 210 | |
| 3 | Ravanica | 43.94375 | 21.42883 | 176 | |
| 4 | Likodra | 44.37108 | 19.41078 | 390 | |
| 5 | Krupinska reka | 44.27692 | 19.30736 | 313 | |
| 6 | Veliki Rzav 1 | 43.67234 | 19.93187 | 498 | |
| 7 | Veliki Rzav 2 | 43.74391 | 20.05248 | 480 | |
| 8 | Nišava 1 | 43.01863 | 22.73374 | 413 | |
| 9 | Nišava 2 | 43.15188 | 22.59950 | 381 | |
| 10 | Pusta reka | 43.01950 | 21.71199 | 246 | |
| 11 | Toplica 1 | 43.21316 | 21.83449 | 272 | |
| 12 | Toplica 2 | 43.13895 | 21.28398 | 425 | |
| 13 | Vlasina 1 | 42.96810 | 22.12787 | 329 | |
| 14 | Vlasina 2 | 42.94951 | 22.30421 | 410 | |
| 15 | Rasina | 43.58722 | 21.34405 | 152 | |
| 16 | Mlava | 44.54519 | 21.27974 | 93 | |
| 17 | Jošanica | 43.40491 | 20.66400 | 463 | |
| 18 | Resava | 44.19887 | 21.28998 | 148 | |
| 19 | Ribnica 1 | 44.28707 | 20.06403 | 163 | |
| 20 | Ribnica 2 | 44.23879 | 20.09669 | 260 | |
| 21 | Ribnica 3 | 44.17276 | 20.06269 | 375 | |
| 22 | Tamnava 2 | 44.45617 | 19.63632 | 236 | |
| 23 | Ðetinja 1 | 43.83131 | 19.91463 | 642 | |
| 24 | Ðetinja 2 | 43.80448 | 19.95518 | 458 | |
| 25 | Type 4 | Mileševka | 43.37128 | 19.69763 | 726 |
| 26 | Uvac | 43.29290 | 19.93810 | 1134 | |
| 27 | Vapa | 43.29000 | 20.04355 | 1023 | |
| 28 | Dojkinačka reka 1 | 43.26172 | 22.77364 | 1223 | |
| 29 | Dojkinačka reka 2 | 43.15595 | 22.81343 | 1009 | |
| 30 | Gradska reka | 42.89735 | 22.35245 | 846 | |
| 31 | Type 6 | Tisovica | 43.48065 | 19.97928 | 1167 |
| 32 | Trudovačka reka | 43.48476 | 19.96600 | 1167 | |
| 33 | Čađavica | 44.37178 | 19.34831 | 491 | |
| 34 | Korenita | 44.48985 | 19.30783 | 261 | |
| 35 | Štira 1 | 44.44366 | 19.25502 | 526 | |
| 36 | Štira 2 | 44.45272 | 19.24496 | 391 | |
| 37 | Pritoka Uvca | 43.52039 | 19.80133 | 948 | |
| 38 | Ljubišnica | 43.61730 | 19.86022 | 1018 | |
| 39 | Katušnica | 43.65501 | 19.83772 | 896 | |
| 40 | Cvetkova reka | 42.74631 | 22.32128 | 1380 | |
| 41 | Jarčev potok | 42.66968 | 22.33745 | 1258 | |
| 42 | Simonova reka | 42.67491 | 22.34782 | 1258 | |
| 43 | Samokovska reka 1 | 43.30976 | 20.78675 | 1506 | |
| 44 | Samokovska reka 2 | 43.32760 | 20.76281 | 1506 |
Table 2.
List of recorded EPT taxa in three types of watercourses [18].
Table 2.
List of recorded EPT taxa in three types of watercourses [18].
| No. | Order | Family | Taxon | Type 3 | Type 4 | Type 6 |
|---|---|---|---|---|---|---|
| 1 | Ephemeroptera | Baetidae | Baetis (Acentrella) sp. | x | x | |
| 2 | Baetis (Baetis) alpinus (Pictet, 1843) | x | x | x | ||
| 3 | Baetis (Baetis) fuscatus (Linnaeus, 1761) | x | x | x | ||
| 4 | Baetis (Nigrobaetis) muticus (Linnaeus, 1758) | x | x | x | ||
| 5 | Baetis (Baetis) lutheri Müller-Liebenau, 1967 | x | x | |||
| 6 | Baetis (Baetis) meridionalis Ikonomov, 1954 | x | ||||
| 7 | Baetis (Rhodobaetis) rhodani (Pictet, 1843) | x | x | x | ||
| 8 | Baetis (Baetis) pavidus Grandi, 1949* | x | x | |||
| 9 | Baetis (Baetis) scambus Eaton, 1870 | x | ||||
| 10 | Baetis (Baetis) vernus Curtis, 1834 | x | ||||
| 11 | Baetis sp. | x | x | x | ||
| 12 | Cloeon (Cloeon) dipterum (Linnaeus, 1761) | x | x | |||
| 13 | Ephemeridae | Ephemera (Ephemera) danica Müller, 1764 | x | x | x | |
| 14 | Heptageniidae | Ecdyonurus (Helvetoraeticus) subalpinus Klapalek, 1907. | x | |||
| 15 | Ecdyonurus (Ecdyonurus) aurantiacus (Burmeister, 1839) | x | ||||
| 16 | Ecdyonurus (Helvetoraeticus) helveticus Eaton, 1883. | x | ||||
| 17 | Epeorus (Epeorus) sylvicola (A.E Pictet, 1865) | x | x | x | ||
| 18 | Epeorus (Ironopsis) yougoslavicus (Samal, 1935)* | x | x | x | ||
| 19 | Ecdyonurus (Ecdyonurus) venosus (Fabricius, 1775) | x | x | x | ||
| 20 | Ecdyonurus sp. | |||||
| 21 | Heptagenia (Heptagenia) sulphurea (Müller, 1776) | x | x | x | ||
| 22 | Rhithrogena gr. semicolorata (Curtis, 1834) | x | x | x | ||
| 23 | Caenidae | Caenis macrura Stephens, 1835 | x | |||
| 24 | Caenis luctuosa (Burmeister, 1839) | x | x | x | ||
| 25 | Potamanthidae | Potamanthus luteus (Linnaeus, 1767) | x | |||
| 26 | Oligoneuriidae | Oligoneuriella rhenana (Imhoff, 1852) | x | x | x | |
| 27 | Leptophlebiidae | Habrophlebia fusca (Curtis, 1834) | x | x | ||
| 28 | Paraleptophlebia submarginata (Stephens, 1835) | x | x | x | ||
| 29 | Ephemerellidae | Ephemerella ignita (Poda, 1761) | x | x | x | |
| 30 | Torleya major (Klapalek, 1905) | x | x | x | ||
| 31 | Plecoptera | Chloroperlidae | Chloroperla sp. | x | ||
| 32 | Siphonoperla torrentium (Pictet, 1841) | x | ||||
| 33 | Leuctridae | Leuctra gr. hippopus Kempny, 1899 | x | x | x | |
| 34 | Leuctra fusca (Linnaeus, 1758) | x | ||||
| 35 | Nemouridae | Amphinemura sulcicollis (Stephens, 1836) | x | x | ||
| 36 | Nemoura sp. | x | x | x | ||
| 37 | Protonemura montana Kimmins, 1941 | x | x | |||
| 38 | Protonemura praecox (Morton, 1894) | x | ||||
| 39 | Protonemura sp. | x | ||||
| 40 | Perlidae | Perla marginata (Panzer, 1799) | x | x | x | |
| 41 | Dinocras megacephala (Klapálek, 1907) | x | x | x | ||
| 42 | Dinocras sp. | x | ||||
| 43 | Perlodidae | Isoperla gramatica (Poda, 1761) | x | x | x | |
| 44 | Isoperla obcura (Zetterstedt, 1840 | x | ||||
| 45 | Isogenus nubecula Newman, 1833 | x | ||||
| 46 | Perlodes microcephalus (Pictet, 1833) | x | ||||
| 47 | Taeniopterygidae | Taeniopteryx nebulosa (Linnaeus, 1758)* | x | x | x | |
| 48 | Rhabdiopteryx acuminata Klapálek, 1905. | x | x | |||
| 49 | Trichoptera | Rhyacophilidae | Rhyacophila pubescens Pictet 1834 | x | ||
| 50 | Rhyacophila fasciata Hagen, 1859 | x | x | |||
| 51 | Rhyacophila dorsalis (Curtis, 1834) | x | x | |||
| 52 | Rhyacophila tristis Pictet, 1834 | x | x | x | ||
| 53 | Rhyacophila torrentium Pictet, 1834 | x | ||||
| 54 | Rhyacophila obliterata McLachlan, 1863 | x | x | |||
| 55 | Rhyacophila vulgaris Pictet, 1834. | x | ||||
| 56 | Rhyacophila sp. | x | x | |||
| 57 | Glossosomatidae | Glossosoma sp. | x | x | ||
| 58 | Hydroptilidae | Hydroptila occulta (Eaton, 1873) | x | |||
| 59 | Philopotamidae | Philopotamus montanus (Donovan, 1813) | x | |||
| 60 | Hydropsychidae | Hydropsyche incognita Pitsch, 1993 | x | |||
| 61 | Hydropsyche instabilis (Curtis, 1834) | x | ||||
| 62 | Hydropsyche fulvipes (Curtis, 1834) | x | x | |||
| 63 | Hydropsyche pellucidula (Curtis, 1834) | x | x | x | ||
| 64 | Hydropsyche tabacarui Botosaneanu, 1960 | x | ||||
| 65 | Hydropsyche sp. | x | x | x | ||
| 66 | Cheumatopsyche lepida (Pictet, 1834) | x | x | |||
| 67 | Polycentropodidae | Plectrocnemia conspersa (Curtis, 1834) | x | x | ||
| 68 | Polycentropus flavomaculatus (Pictet, 1834) | x | ||||
| 69 | Cyrnus trimaculatus (Curtis, 1834) | x | x | |||
| 70 | Psychomydae | Psychomyia pusilla (Fabricius, 1781) | x | x | ||
| 71 | Tinodes sp. | x | ||||
| 72 | Brachycentridae | Brachycentrus montanus Klapalek, 1892. | x | x | x | |
| 73 | Brachycentrus subnubilis Curtis, 1834 | x | ||||
| 74 | Micrasema morosum (McLachlan, 1868) | x | ||||
| 75 | Micrasema setiferum (Pictet, 1834) | x | ||||
| 76 | Limnephilidae | Ecclisopteryx madida (McLachlan, 1867) | x | x | ||
| 77 | Halesus digitatus (Schrank, 1781) | x | ||||
| 78 | Micropterna lateralis (Stephens, 1837) | x | ||||
| 79 | Potamophylax cingulatus (Stephens, 1837) | x | x | x | ||
| 80 | Limnephilus auricula Curtis, 1834 | x | x | |||
| 81 | Limnephilus sparsus Curtis, 1834 | x | ||||
| 82 | Melampophylax melampus (McLachlan, 1876) | x | x | |||
| 83 | Anabolia furcata Brauer, 1857. | x | ||||
| 84 | Allogamus uncatus (Brauer, 1857) | x | ||||
| 85 | Chaetopteryx villosa (Fabricius, 1798) | x | ||||
| 86 | Glyphotaelius pellucidus (Retzius, 1783) | x | ||||
| 87 | Goeridae | Goera pilosa (Fabricius, 1775) | x | x | ||
| 88 | Silo pallipes (Fabricius, 1781) | x | ||||
| 89 | Silo nigricornis (Pictet, 1834) | x | ||||
| 90 | Lepidostomatidae | Lepidostoma hirtum (Fabricius, 1775) | x | |||
| 91 | Leptoceridae | Athripsodes aterrimus Stephens, 1836 | x | |||
| 92 | Athripsodes cinereus (Curtis, 1834) | x | ||||
| 93 | Adicella sp. | x | ||||
| 94 | Sericostomatidae | Sericostoma personatum (Kirby & Spence, 1826) | x | x | x | |
| 95 | Odontoceridae | Odontocerum albicorne (Scopoli, 1763) | x | x |
x- taxa recorded at certain type of watercourses; *strictly protected species according to Official Gazette [32].
Table 3.
Values of biological indices and assessed ecological quality class for each type 3 locality according to the national legislative of the Republic of Serbia [21].
Table 3.
Values of biological indices and assessed ecological quality class for each type 3 locality according to the national legislative of the Republic of Serbia [21].
| Metrics/Localities | 1 | 2 | 3 | 4 | 5 | 6 | 7 | 8 | 9 | 10 | 11 | 12 |
|---|---|---|---|---|---|---|---|---|---|---|---|---|
| No. of taxa | 28 | 35 | 26 | 12 | 17 | 19 | 40 | 16 | 29 | 17 | 11 | 6 |
| I | I | I | III | II | II | I | II | I | II | III | IV | |
| SI | 2.389 | 1.769 | 1.99 | 2.196 | 2.589 | 1.919 | 1.759 | 2.433 | 1.818 | 2.256 | 1.947 | 2.179 |
| III | II | II | II | III | II | II | III | II | III | II | II | |
| BMWP Score | 93 | 88 | 76 | 49 | 30 | 75 | 136 | 41 | 113 | 42 | 50 | 20 |
| I | II | II | IV | IV | II | I | IV | I | IV | III | V | |
| ASPT | 5.812 | 5.867 | 6.333 | 6.125 | 4.286 | 6.25 | 6.182 | 4.1 | 6.278 | 5.25 | 5.556 | 5 |
| II | II | II | II | III | II | II | III | II | II | II | II | |
| H′ | 2.211 | 1.819 | 1.791 | 1.441 | 2.369 | 1.829 | 2.002 | 1.046 | 1.059 | 2.428 | 2.159 | 0.703 |
| I | II | II | III | I | II | II | IV | IV | I | II | IV | |
| EPT index | 10 | 11 | 10 | 3 | 2 | 9 | 17 | 1 | 12 | 4 | 5 | 2 |
| III | III | III | V | V | III | I | V | II | IV | IV | V | |
| No. of Families | 19 | 20 | 15 | 11 | 11 | 13 | 32 | 13 | 21 | 9 | 9 | 4 |
| I | I | I | II | II | I | I | I | I | III | III | IV | |
| Tubificinae % | 2.78 | 0.00 | 0.34 | 2.13 | 0.00 | 0.00 | 0.14 | 1.65 | 0.00 | 4.27 | 0.00 | 0.00 |
| * | * | * | * | * | * | * | * | * | * | * | * | |
| EQC | III | III | III | IV | V | III | II | V | IV | IV | IV | V |
| Metrics/Localities | 13 | 14 | 15 | 16 | 17 | 18 | 19 | 20 | 21 | 22 | 23 | 24 |
| No. of taxa | 15 | 16 | 51 | 19 | 32 | 30 | 28 | 19 | 26 | 5 | 9 | 20 |
| II | II | I | II | I | I | I | II | I | IV | IV | I | |
| SI | 1.949 | 1.97 | 2.198 | 2.078 | 1.096 | 1.939 | 1.98 | 2.213 | 1.956 | 2.98 | 2.705 | 2.493 |
| II | II | II | II | I | II | II | III | II | IV | III | III | |
| BMWP Score | 32 | 36 | 128 | 33 | 121 | 138 | 87 | 82 | 122 | 21 | 11 | 31 |
| IV | IV | I | IV | I | I | II | II | I | V | V | IV | |
| ASPT | 4 | 6 | 5.333 | 4.714 | 6.722 | 6.9 | 6.214 | 6.308 | 7.625 | 5.25 | 2.75 | 3.875 |
| III | II | II | III | II | II | II | II | I | II | V | IV | |
| H′ | 2.46 | 2.473 | 3.103 | 2.328 | 2.627 | 2.943 | 2.506 | 1.74 | 2.42 | 1.427 | 1.665 | 2.634 |
| I | I | I | I | I | I | I | II | I | III | II | I | |
| EPT index | 3 | 3 | 11 | 6 | 20 | 13 | 14 | 8 | 15 | 2 | 1 | 3 |
| V | V | III | IV | I | II | II | III | II | V | V | V | |
| No. of Families | 9 | 7 | 29 | 13 | 22 | 22 | 19 | 17 | 21 | 5 | 6 | 11 |
| III | III | I | I | I | I | I | I | I | III | III | II | |
| Tubificinae % | 2.13 | 0.00 | 1.47 | 5.11 | 0.00 | 0.00 | 3.35 | 0.41 | 0.00 | 44.44 | 23.91 | 5.88 |
| * | * | * | / | * | * | * | * | * | / | / | / | |
| EQC | V | V | III | IV | II | II | II | III | II | V | V | V |
* Good status; / Good was achieved
Table 4.
Values of biological indices and assessed ecological quality class for each type 4 locality according to the national legislative of the Republic of Serbia [21].
Table 4.
Values of biological indices and assessed ecological quality class for each type 4 locality according to the national legislative of the Republic of Serbia [21].
| Metrics/Localities | 1 | 2 | 3 | 4 | 5 | 6 |
|---|---|---|---|---|---|---|
| No. of Taxa | 39 | 22 | 45 | 44 | 26 | 26 |
| I | I | I | I | I | I | |
| SI | 1.409 | 1.701 | 2.177 | 1.413 | 1.396 | 2.019 |
| I | II | III | I | I | II | |
| BMWP Score | 151 | 106 | 130 | 184 | 118 | 70 |
| I | I | I | I | I | II | |
| ASPT | 7.55 | 7.067 | 6.842 | 6.815 | 6.556 | 7.778 |
| I | I | II | II | II | I | |
| H′ | 2.127 | 1.402 | 2.715 | 2.697 | 1.861 | 2.585 |
| II | III | I | I | II | I | |
| No. of sensitive taxa | 13 | 8 | 13 | 13 | 6 | 3 |
| I | I | I | I | I | III | |
| EPT index | 23 | 17 | 19 | 27 | 15 | 9 |
| I | II | I | I | II | IV | |
| Tubificinae % | 0.00 | 0.00 | 2.59 | 0.00 | 0.00 | 0.00 |
| * | * | * | * | * | * | |
| EQC | II | III | III | II | II | IV |
* Good status; / Good status was achieved
Table 5.
Values of biological indices and assessed ecological quality class for each type 6 locality according to the national legislative of the Republic of Serbia [21].
Table 5.
Values of biological indices and assessed ecological quality class for each type 6 locality according to the national legislative of the Republic of Serbia [21].
| Metrics/Localities | 1 | 2 | 3 | 4 | 5 | 6 | 7 | 8 | 9 | 10 | 11 | 12 | 13 | 14 |
|---|---|---|---|---|---|---|---|---|---|---|---|---|---|---|
| No. of Taxa | 34 | 26 | 19 | 28 | 27 | 23 | 26 | 38 | 48 | 20 | 7 | 4 | 16 | 32 |
| I | I | I | I | I | I | I | I | I | I | I | II | I | I | |
| SI | 1.391 | 1.784 | 2.084 | 1.898 | 1.717 | 2.05 | 1.686 | 1.444 | 1.657 | 1.257 | 1.967 | 1.686 | 2.116 | 1.828 |
| I | II | III | II | II | III | II | I | II | I | II | II | III | II | |
| EPT index | 16 | 13 | 8 | 12 | 12 | 7 | 11 | 23 | 21 | 9 | 5 | 2 | 4 | 13 |
| * | * | * | * | * | * | * | * | * | * | * | * | * | * | |
| No. of sensitive taxa | 11 | 5 | 3 | 7 | 9 | 2 | 8 | 8 | 10 | 6 | 3 | 1 | 2 | 4 |
| * | * | * | * | * | * | * | * | * | * | * | / | * | * | |
| Tubificidnae % | 0.00 | 0.00 | 0.00 | 0.00 | 0.00 | 0.17 | 2.27 | 0.00 | 0.00 | 0.00 | 0.00 | 0.00 | 4.57 | 0.00 |
| * | * | * | * | * | * | * | * | * | * | * | * | * | * | |
| EQC | II | II | III | II | II | III | II | II | II | II | II | III | III | II |
* Good status; / Good status was achieved
Table 6.
Statistically significant values of Spearman correlation coefficient among values of EQC and SI, BMWP score, H′, No. of taxa, Tubificinae %, EPT index, and No. of sensitive taxa in analyzed watercourses.
Table 6.
Statistically significant values of Spearman correlation coefficient among values of EQC and SI, BMWP score, H′, No. of taxa, Tubificinae %, EPT index, and No. of sensitive taxa in analyzed watercourses.
| Metrics | EQC |
|---|---|
| SI | 0.6818 |
| BMWP score | -0.7356 |
| H′ | -0.5239 |
| No. of taxa | -0.6879 |
| Tubificinae % | 0.4379 |
| EPT Index | -0.8165 |
| No. sensitive taxa | -0.7625 |
Table 7.
Loadings of the variables on the principal components (PC). The parameters that contributed most to the separation are marked in bold.
Table 7.
Loadings of the variables on the principal components (PC). The parameters that contributed most to the separation are marked in bold.
| Metrics | PC 1 | PC 2 | PC 3 | PC 4 | PC 5 | PC 6 | PC 7 |
|---|---|---|---|---|---|---|---|
| SI | 0.12873 | 0.22732 | 0.00423 | 0.11183 | 0.49766 | 0.01228 | 0.01795 |
| BMWP score | 0.21024 | 0.00821 | 0.00007 | 0.06461 | 0.12799 | 0.14680 | 0.44208 |
| H′ | 0.09873 | 0.07702 | 0.53114 | 0.19859 | 0.09095 | 0.00101 | 0.00257 |
| No. of taxa | 0.09158 | 0.13495 | 0.46399 | 0.23881 | 0.06641 | 0.00108 | 0.00317 |
| Tubificinae % | 0.05256 | 0.52954 | 0.00047 | 0.29940 | 0.10380 | 0.00847 | 0.00575 |
| EPT Index | 0.21460 | 0.01177 | 0.00003 | 0.07411 | 0.00810 | 0.16843 | 0.52297 |
| No. of sensitive taxa | 0.20356 | 0.01118 | 0.00008 | 0.01264 | 0.10510 | 0.66194 | 0.00551 |
Disclaimer/Publisher’s Note: The statements, opinions and data contained in all publications are solely those of the individual author(s) and contributor(s) and not of MDPI and/or the editor(s). MDPI and/or the editor(s) disclaim responsibility for any injury to people or property resulting from any ideas, methods, instructions or products referred to in the content. |
© 2024 by the authors. Licensee MDPI, Basel, Switzerland. This article is an open access article distributed under the terms and conditions of the Creative Commons Attribution (CC BY) license (http://creativecommons.org/licenses/by/4.0/).
Copyright: This open access article is published under a Creative Commons CC BY 4.0 license, which permit the free download, distribution, and reuse, provided that the author and preprint are cited in any reuse.


