
Submitted:
15 February 2024
Posted:
19 February 2024
You are already at the latest version
Abstract
Grain quality, cooking quality and nutritional quality traits are some of the major attributes that enhance uptake and utilisation of improved cowpea varieties. Therefore, there is need for a better understanding of the genetic variation and inter-relationships among these quality traits in cowpea to integrate them in cowpea breeding programs. The study was conducted to determine genetic variability among 306 cowpea genotypes for grain quality, cooking quality and nutritional quality traits and to understand the interrelationships among these traits for exploitation in breeding programs. The results showed highly significant differences (P
Keywords:
Consumer-preferred traits
; cowpea
; genetic variability
; interrelationships
; quality traits
1. Introduction
Cowpea (Vigna unguiculata (L.) Walp.) is an important legume crop produced and consumed in Sub-Saharan Africa by the majority of smallholder farmers, especially women. It is a crucial food crop for meeting dietary protein needs and preventing micronutrient deficiencies (Dakora and Belane 2019) especially among women and children (Boukar et al. 2011).
Cowpea whole grains contain 23–32% protein, 50–60% carbohydrates, and 1% fat (Kirse & Karklina 2015), and considerable amounts of phytochemicals, dietary fibre, minerals (calcium, iron and zinc) and vitamins. Iron and zinc are essential for human well-being. Their adequate supply helps prevent anaemia and boost the immune system, two common problems in developing countries (Blair et al. 2009). The composition of nutrients can vary due to several factors including varietal differences, climatic conditions, and agronomic practices (Affrifah et al. 2022). Some studies have reported mature grains to contain lower concentrations of most minerals (Belane and Dakora, 2012) than immature green pods (Gerrano et al. 2017) and leaves (Gerrano et al. 2015).
Despite its enormous economic potential, the productivity of the crop is considerably very low in Malawi which is estimated at an average of 494 kg/ha among smallholder farmers (FAOSTAT 2023). This low productivity is attributed to low adoption levels of improved varieties (currently at 10%) and continued use of landraces which tend to be low yielding and highly susceptible to biotic and abiotic stress. Improved varieties, however, have been blamed for lacking important quality traits such as grain size, cooking time and broth thickness. Low adoption of improved varieties and lack of farmer and consumer-preferred varieties have been attributed to the failure of national breeding programs to involve farmers in the process of designing and developing varieties to meet their priorities and preferences (Coulibaly et al. 2010).
Although cowpea is nutritionally rich, the longer cooking time makes the legume unacceptable to some consumers. In a trait preference study conducted in Malawi in 2021 (unpublished data), short cooking time and broth thickness were the priority traits for consumers to adopt and utilise a particular cowpea variety. It has also been reported that broth thickness is an important trait in the determination of cooking quality (Nkongolo et al. 2009). Traore et al. (2022) stated that cooking qualities must be combined with other consumer preferences to encourage cowpea utilization. Other traits that influence cowpea marketing and utilization include seed coat colour, seed shape and grain size (Egbadzor et al. 2013, 2014; Gondwe et al. 2019; Hella et al, 2013; Herniter et al. 2019).
Considerable genetic variability has been reported for cowpea’s physical, cooking and nutritional quality traits (Egbadzor et al. 2014; Gondwe et al. 2019; Kuldeep Tripathi et al. 2019; Moses and Zibokere 2011; Moura et al. 2012; Nalawade et al. 2020). In Malawi, reports on the genetic variability for grain quality (grain colour, seed size, seed shape), cooking quality (cooking time, broth thickness) and nutritional quality (protein, zinc, iron) traits on a diverse panel of cowpea genotypes are rare and non-existent. The degree of association among these quality traits has neither been fully dissected nor exploited to inform cowpea breeding programs. The present study was therefore conducted to evaluate the genetic variability of cowpea genotypes for grain, cooking and nutritional quality traits of cowpea genotypes. Further, the study was conducted to understand the degree of associations among the cowpea quality traits, so that they can be exploited in a breeding program to develop cowpea varieties with consumer-preferred, market-driven, and resilient inclusive traits to enhance food, income and nutrition security of smallholder farmers in East and Southern Africa.
2. Materials and methods
2.1. Study area description
A field experiment was conducted at Lilongwe University of Agriculture and Natural Resources (LUANAR), Bunda College of Agriculture in the 2021/22 growing season. The site receives a mean annual rainfall of about 930 mm (Figure 1) with a temperature range of 17.2˚C to 19.1˚C with predominantly clay-loam soils.
2.2. Plant Materials
A diversity panel constituting 306 genotypes (advanced breeding lines, released varieties and landraces) was used for this study (Supplementary Table 1). These genotypes were sourced from the International Institute of Tropical Agriculture-Nigeria genebank (IITA- 44), India (61), Mozambique (24), the United States of America (22), Tanzania (16), Nigeria (13), South Africa (9), Uganda (4), Zambia (4), Hungary (2), Ghana (2), Cameroon (2), Botswana (2), Senegal (2), Russia (2), Argentina (1), Benin (1), Italy (1), Niger (1), Zimbabwe (1), Malawi (77) and 14 genotypes had unknown origins. These genotypes represent a subsample of the Centre of Innovation for Crop Improvement for East and Southern African (CICI-ESA) cowpea germplasm at LUANAR.
2.3. Experimental design and field layout
An alpha lattice design with three replications generated using Breeding Management System (BMS) was used for field establishment on 18th January 2022. The plot size was 2 ridges, 2 m long each spaced at 75 cm apart. Two seeds were planted per station at the depth of 3 cm spaced at 20 cm apart. Weeds were controlled by manual hoeing and uprooting to ensure weed-free conditions throughout the season. The infestation of insect pests such as aphids was controlled by the weekly application of Snowcron 500EC, a broad-spectrum emulsifiable concentrate insecticide from three weeks after germination. Data on grain quality traits were collected using Field Book App (Rife & Poland 2014) installed on mobile tablets. For laboratory analysis, graded and clean grains of each genotype were sampled from the three replications from the field.
2.4. Determination of grain quality traits
Data for qualitative (seed shape, seed coat colour) and quantitative traits (100 seed weight, seed length, seed width) of grain quality were collected following the cowpea descriptor (IPGRI 1983). Seed length and width were measured in millimetres on five randomly selected seeds using a ruler and 100 seed weight was determined as the weight in grams for 100 randomly selected seeds using an electronic balance.
2.5. Determination of cooking quality traits
2.5.1. Cooking time
The cooking time of each dry cowpea genotype was determined according to the method of Akinyele et al. (1986). Briefly, 20g of dry cowpea grains were added to 450 ml of boiling water (tap water) in an aluminium cooking pot (without a top cover) on an electric hotplate. The water level was maintained by adding more boiled water intermittently. An electric kettle was used to heat the extra water, which was used for re-filling the pots during cooking. Cooking heat intensity was also maintained by using the maximum heating level of the hotplate for all cooking trials. Cooking time logging began when the water returned to the boiling point, after immersing the grains into the boiling water. The cowpeas were left to cook for 30 minutes, thereafter doneness test was done every 5 minutes using the tactile method by pressing the cooked seeds between two fingers until they were mushy, i.e., no hard material was found, just as also done by Munthali et al. (2022) for common beans.
2.5.2. Broth Viscosity
The cooked cowpeas were removed from the pot, and then, all broth and residual solids were transferred into a jar and mixed with boiling water to a total volume of 365 ml. The viscosity (cP or mPa) of 365 ml samples, at 25 ºC, was measured using a programmable Brookfield digital viscometer (Model LV DV-I, Brookfield Engineering Laboratories, Inc., Stoughton, MA, USA) fitted with an LV spindle No. 1 as recommended in the Brookfield labs Inc. guide (Brookfield Manual No. M14-023). A 400 ml open jar was used as a sample holder. Viscosity readings were taken after one minute, at a spindle speed of 60 rpm (Gama et al. 2019). All samples were thoroughly mixed just before taking viscosity measurements.
2.6. Determination of nutritional quality traits
2.6.1. Digestion procedure
Sample digestion was done according to the method proposed by Sahrawat et al., (2002) with modifications. Approximately 0.2 g of finely ground cowpea samples were transferred to 50 ml digestion tubes and 6 blanks were prepared to be used for standards. Thereafter, 2.5 ml of sulphuric acid/selenium mixture was added to each digestion tube and blanks. The sulphuric acid/selenium mixture was prepared by dissolving 3.5 g of selenium powder in 1 litre of sulphuric acid and heating the mixture on a hot plate at high temperature with occasional stirring using a glass rod until the mixture turned clear and was cooled. The digestion tubes containing samples and sulphuric acid/selenium mixture were placed in an aluminium block on a hotplate, and heated to 200 ºC until sample fumes were seen. The tubes were then removed from the hotplate and allowed to cool for 10 minutes. Then, 1 ml and 2 ml of 30% hydrogen peroxide were added to the samples and standards. The samples were replaced on the hotplate with a heavy glass vial on top of each tube, and heated to 330 ºC until the mixture turned clear and colourless indicating completion of digestion. The mixture was then allowed to cool.
N stock solution (0, 0.2, 0.4, 0.6, 0.8 and 1 ml, respectively) was added to the standards. The N stock solution was prepared by diluting 4.714 g of oven-dried ammonium sulphate in a 100 ml volumetric flask to make 10,000 ppm N. The standards are equivalent to 0, 1, 2, 3, 4 and 5 % N in the plant digests.
2.6.2. Determination of Protein
Colorimetry method was used for the determination of nitrogen (Okalebo et al., 2002). N1 reagent was prepared by dissolving 68 g sodium salicylate, 50 g sodium citrate (Tri-Sodium Citrate) and 50 g sodium tartrate in 500 ml deionised water. This solution dissolved 0.24 g of sodium nitroprusside and was diluted to 2000 ml. N2 reagent was prepared by dissolving 60 g sodium hydroxide in about 1500 ml deionized water. The solution was then mixed with 28.5 ml of 3.5 % sodium hypochlorite solution and diluted to 2000 ml.
To determine the total nitrogen in samples, 0.750 ml extracts from the digestion above were put into 25 ml glass vials and to each of the vials containing the extracts and standards, 5 ml of N1 solution was added. After 5 minutes, 5 ml of the N2 solution was added. The vials were allowed to stand until the colour developed (about 1 hour) and then the absorbance of the samples and standards was read on a spectrophotometer at 655 nm. To get the protein percentage, the percentage of nitrogen was multiplied by 6.25.
2.6.3. Determination of iron and zinc
The nitrogen digestion method was used to determine iron and zinc contents. To prepare stock solutions, 0.498 g dried ferrous sulphate septahydrate (FeSO4.7H2O) and 0.440g dried zinc sulphate septahydrate (ZnSO4.7H2O) were weighed for iron and zinc determination, respectively. These were then dissolved in about 200 ml dilute HCl (0.1N) and made up to the mark with distilled water in a 1-litre volumetric flask to contain 100 ppm Fe and 100 ppm Zn stock solutions, respectively. The original samples of the digestion extract were passed on the Atomic Absorption Spectrophotometer (AAS).
2.7. Data Analysis
An exploratory analysis using density plots was done on quantitative data to check for ANOVA assumptions. Thereafter, all the analysis was done in the R software environment (R Core Team 2021). All laboratory analyses were done in duplicate. ANOVA was done by fitting the models with the aov function of the agricolae package (Mendiburu 2010) in R and Duncan’s multiple range test was used to separate means at a 0.05 significance level. Principal component analysis (PCA) was done using the FactoMineR package (Lê, Josse, and Husson et al. 2008) and Pearson correlation was performed using the corr. function of the stats package in R. The Euclidean distance metric was used in hierarchical cluster analysis and the associations between groups were done using the ward D2 method in a cluster R package (Maechler et al. 2012).
3. Results
3.1. Frequency distribution of quantitative traits
The exploratory analysis showed that all the traits except cooking time, iron content and zinc content exhibited a nearly normal distribution pattern (Figure 2).
3.2. Genetic variability and mean performance for grain quality traits
Highly significant differences (p< 0.001) were observed among the genotypes for all grain quality traits (Table 1 and Supplementary Table 1). The seed length ranged from 3.73 mm (TVu-322) to 10.33 mm (MWcp03). The highest seed width was recorded on genotype MWcp44 (7.13 mm) while genotype TVu-322 (2.93 mm) registered the lowest seed width. The 100 seed weight ranged from 6.0 g to 26.13 g. Genotype MWcp36 had largest seed size while genotype TVu-10169 had the smallest seed size. In terms of seed coat colour, genotypes were assorted into brown (43.14%), white (19.28%), reddish-brown (13.40 %), purple (11.76%), purplish-brown (4.25%), black (1.63%) and red (1.31%). Some of the genotypes (5.23%) were either mottled or had other mixed colours. For seed shape, the ovoid shape was dominant with about (60.78%) followed by rhomboid shape (32.03%) and kidney shape (6.54%). Globose and crowder shapes were observed in 0.66% of the genotypes.
3.3. Genetic Variability and mean performance for cooking quality traits
Highly significant differences (p< 0.001) were observed among genotypes for cooking quality traits; cooking time and broth viscosity (Table 3). Genotype TVu-15631 recorded shortest cooking time (39 minutes) while genotype MWcp07 reported longest cooking time (191 minutes) (Table 4 and Supplementary Table 1). The minimum broth viscosity at 25 ºC was 1.6 cP recorded for IT10K-834-3 whereas the maximum was observed for TVu-3252 (5.5 cP).
3.4. Genetic variability and mean performance for nutritional quality traits
The genotypes exhibited highly significant differences (P<0.001) for both protein (%) and minerals (iron and zinc) contents (mg/kg) (Table 5). The highest average protein content was recorded on genotype TVu-3243 (22.92%) while the lowest protein content was reported on genotype TVu-3263 (3.6%) (Table 5 and Supplementary Table 1). The highest iron content (21.44mg/kg) was recorded on genotype TVu-3533 whereas the lowest level (0.12 mg/kg) was reported on genotype MWcp26. Genotype MWcp37 had the highest zinc level (2.63 mg/kg) while Raha 1 and TVu-1472 had the lowest zinc level (0.08 mg/kg).
3.5. Correlation coefficients among grain, cooking and nutritional quality traits of cowpea genotypes
The relationships among the grain quality, cooking quality and nutritional quality traits are presented in Table 7. Protein content was significantly positively correlated with iron content (r= 0.28, p<.001) and zinc content (r= 0.21, p<.001). Iron content was positively correlated with zinc content (r= 0.24, p<.001). Cooking time was significantly and positively correlated with seed length (r= 0.21, p<.001), seed width (r= 0.26, p<.001) and 100 seed weight (r= 0.19, p<.001). Highly significant positive correlations were also observed for seed length and seed width with 100 seed weight (r= 0.71 and r= 0.75 at p<.001, respectively).
3.6. Genetic diversity among the cowpea genotypes
3.6.1. Principal Component Analysis for grain quality, cooking quality and nutritional quality traits
Table 8 shows principal component analyses (PCA) for the quantitative quality traits among the genotypes. The genotypes were plotted on two dimensions based on the PCA results (Figure 3). All the traits were grouped into three principal components (PC) (Eigenvalues ≥ 1) which accounted for 65.17% variability. The first PC explained about 33.36% of the total variability present and was mainly associated with seed width, seed length and 100 seed weight. The second PC accounted for 18.81% of the total variability which was correlated with iron, zinc and protein contents. The third PC explained nearly 12.98% of the total variation and was mainly associated with broth viscosity.
3.6.2. Hierarchical clustering of genotypes based on grain quality, cooking quality and nutritional quality traits
As shown in the dendrogram (Figure 4), cluster analysis grouped the genotypes into two major clusters based on the quality traits. Cluster I comprised of 234 genotypes while Cluster II comprised of 72 genotypes. The genotypes in cluster I were relatively small-seeded with shorter cooking time while those in cluster II were generally large-seeded with longer cooking time, and higher protein and iron content (Table 9).
Most resource-constrained smallholder farmers in sub-Saharan Africa especially women rely on cowpea as their major source of protein and other mineral elements such as iron and zinc, thereby contributing to their improved nutritional status and health well-being. In dryland areas, cowpea is a major source of income to support their daily livelihoods at the same time cowpea is one of the crops used to adapt to climate-related changes due its resilience in these areas. Current cowpea breeding strategies in the region must therefore take into consideration its grain, nutritional and cooking quality, which influence farmers/consumers’ choices and consumption.
The study observed significant variations in the genotypes for grain quality, cooking quality and nutritional quality traits (Table 1, Table 3 and Table 5). This suggests that genetic variability exists in the current set of cowpea germplasm in Malawi which could be exploited in breeding programs aimed at developing high-performing varieties for the said traits. Assessment of genetic variability for different traits is an important pre-breeding step as it provides an opportunity for plant breeders to develop new and improved varieties with desirable characteristics that are both farmer and consumer preferred. Earlier studies (Boukar et al. 2011, 2012; Muranaka et al. 2015) reported wide genetic variation in grain quality, crude protein and micronutrient contents in cowpea suggesting that the nutritional value of varieties could be improved.
In the study, seed coat colour among the genotypes was quite variable, predominated with brown colour (43.14%) followed by white (16.39%) and reddish-brown (13.40%). In cowpea, seed coat colour is an important aspect of consumer preference in cowpea which directly influences the marketability of the grain. This implies that variety development programs need to respond to specific and unique preferences of the market for improved uptake of the varieties. Trait preference studies in different regions and countries reported these unique preferences (Ishikawa et al. 2020; Quaye et al. 2011; Egbadzor et al. 2014; Herniter et al. 2019; Hella et al. 2013). For instance, in Malawi, Mozambique and Tanzania, through a trait preference survey (unpublished) among farmers, consumers, traders and processors, white seed coat colour was the most preferred colour.
The genotypes in the study also varied for seed shape with over 51.67% being ovoid, and 32.03% rhomboid. This finding is similar to Kim et al. (2013) who reported that out of the 245 cowpea genotypes in the study, 66.9% were egg-shaped (ovoid) and 24.9% were rectangular (rhomboid). This suggests that the ovoid shape is a dominant seed shape in cowpea.
The other important trait in cowpea breeding is grain size. Seed size is directly correlated with grain yield and as such it is considered an essential market trait (Egbadzor et al., 2013). Seed size is measured as grams per 100 seeds and Moses and Zibokere (2011) grouped seed size into small (10-15g), medium (15.1-20g), large (20.1-25) and very large (greater than 25g). In the present study, genotypes exhibited wide genetic variability for seed size which ranged from 6 to 26.13g. This range is within most of the reported seed sizes (Nalawade et al. 2020; Kuldeep Tripathi et al. 2019). It was noted that most of the landraces were larger seeded than the improved varieties. As noted before, most farmers prefer large-seeded varieties, this might explain the reasons behind the low adoption levels of improved varieties in Malawi since all the improved varieties have small grain size.
Cowpea being an important source of protein and other elements for many smallholder farmers, breeding programs must continue to develop and release more nutritious varieties. The genetic variability for nutritional quality properties such as protein, zinc and iron exhibited in the study is a sure way to the trajectory towards sustainable improved variety development that meets the nutritional needs of the farmers, especially women and children. Genetic variability for nutritional quality in cowpea is a common phenomenon (Boukar et al. 2011, 2012; Muranaka et al. 2015; Gondwe et al. 2019; Gerrano et al. 2015), which means that selection for these traits in cowpea can increase the genetic gain.
Cooking time is usually associated with energy sources. In sub-Saharan Africa where the predominant energy source is fuel wood, most households struggle to prepare meals that require more energy. Shorter cooking varieties are usually a strategy for energy saving. The findings of the study established some considerable genetic variation among genotypes with some taking a minimum of 39 minutes to cook. Some studies have reported a minimum of 35 minutes (Olapade et al. 2002) to cook. Contrastingly, some genotypes in the study took 191 minutes which suggests that they are less economical in terms of energy consumption. Related to cooking quality is broth viscosity, which very few studies have looked at in cowpea as a genetically controlled trait. This study suggests that the variability recorded is genetically controlled as considerable variation was observed in the genotypes which ranged from 1.6 to 5.5 cP. In Malawi, it has been reported that broth thickness is one of the key determinants of the cooking quality of the legume (Nkongolo et al. 2009), and if a variety lacks this trait, it can rarely be taken up by farmers/consumers.
Significant positive correlations were detected among the 306 genotypes for protein content with iron and zinc (Table 7). This is in agreement with the positive correlation between crude protein and Fe contents in 11 genotypes reported by Moura et al. (2012) and Boukar et al. (2012, 2011). Since the presence of genetic variability has already been elucidated for these traits, it is, therefore, possible to improve protein, iron and zinc contents without adverse interactions as also espoused by (Nielsen et al. 1993) and (Jean Baptiste et al. 2011) who indicated some heritability for crude protein content in cowpea.
On the other hand, nutritional quality traits did not exhibit any association with grain quality and cooking quality traits. The non-significant associations between grain quality and nutritional quality traits suggest that desirable traits can be incorporated through trait introgression techniques. This is in agreement with several reported (Moura et al. 2012; Muranaka et al. 2015; Sanni et al. 2006) results where cooking time was not associated with protein content in their study. However, cooking quality traits were shown to be significantly and positively correlated with grain quality traits. For example, cooking time correlated with seed length, seed width and 100 seed weight (cooking time increased with seed size). The implication is that as breeding programs strive to develop varieties that are large-seeded with short cooking times to meet market demands, there will be a trade-off between these two traits. There is a need to devise breeding strategies that maximise both of these traits as well as careful selection of parental materials. In addition to this, there is a need to dissect the genetic mechanisms of these traits and whether any of them can be amenable to trait integration techniques.
A genotype by trait biplot was produced using the first two PCs that explained 52.19% of the variability (Figure 3). This was used to identify best performing and genetically dissimilar genotypes that could be further explored for breeding. The random scattering of the cowpea genotypes across the quadrant as seen in the biplot, suggests that the genotypes were genetically different. The genotypes clustered based on their performance for the traits thus those genotypes located close together had relatively similar values for specific traits. The biplot shows that many genotypes clustered near the origin, so they are likely derived from the same parents. Genotypes located further from the biplot origin had more extreme values for a specific trait than genotypes closer to the origin. For example, genotypes MWcp03 and MWcp36 showed extreme values for seed length, width and 100 seed weight whereas TVu-3533 showed higher values for protein, iron and zinc concentrations. On the other hand, TVu-322 had the highest broth viscosity and MWcp46 had the longest cooking time. Furthermore, MWcp37 was distant from the rest of the genotypes indicating that the genotype is genetically dissimilar from most of the genotypes. Concentrations of protein, iron and zinc were independent of broth viscosity, cooking time, seed length, width, and 100 seed weight. This suggests that protein, iron and zinc can be improved without altering the rest of the traits. Noticeably, broth viscosity was not associated with cooking time and the quantitative grain quality traits. However, cooking time was positively related to the quantitative grain quality traits. This result further suggests that increasing the seed size in cowpea may increase the cooking time but not broth viscosity. As already elucidated, the landraces from Malawi were generally large seeded with longer cooking times but these tend to be common among smallholder farmers. This was further confirmed through cluster analysis which clustered the majority of the landraces from Malawi into Cluster II which had large-seeded genotypes with relatively higher protein and iron content. Nevertheless, genotypes in Cluster I were small-seeded and within the cluster were most of the improved varieties and advanced lines from the IITA which is an indication that they were selected for similar traits mostly small seed size which is contrary to farmer preferences.
4. Conclusion
This study has identified genetic variability in grain quality traits, cooking quality traits and nutritional quality traits among the cowpea genotypes that constitute breeding lines and landraces. The study has further identified relationships among the quality traits. Significant and positive correlations among protein, iron and zinc contents suggest the possibility of improving the concentrations of these nutrients simultaneously. Non-significant associations between grain quality and nutritional quality traits suggest that desirable traits can be incorporated through trait introgression techniques. The study has also identified several potential genotypes with desirable quality-related traits which could be used in crossing programs to generate improved varieties with consumer-preferred traits to improve the food, income and nutritional status of many smallholder farmers that largely depend on cowpea.
Author Contributions
Conceptualization, Michael Chipeta and Jessica Kampanje-Phiri; Data curation, John Kafwambira; Formal analysis, John Kafwambira; Funding acquisition, Michael Chipeta; Investigation, Michael Chipeta and Esnart Yohane; Methodology, Michael Chipeta and John Kafwambira; Project administration, John Kafwambira; Resources, Michael Chipeta; Supervision, Michael Chipeta, Esnart Yohane and Jessica Kampanje-Phiri; Writing – original draft, John Kafwambira; Writing – review & editing, Michael Chipeta, Esnart Yohane and Jessica Kampanje-Phiri.
Funding
This study was made possible by the generous support of the American people through the United States Agency of International Development (USAID) under the Feed the Future Initiative. The contents are the responsibility of the authors and do not necessarily reflect the views of USAID or the United States Government. Program activities are funded by the United States Agency for International Development (USAID) under Cooperative Agreement no. 7200AA-19LE-00005.
Acknowledgement
We thank the Centre of Innovation for Crop Improvement for East and Southern Africa (CICI-ESA) research team and Lilongwe University of Agriculture and Natural Resources for smooth implementation of project activities. Department of Agriculture Research Services (DARS) through Chitedze Research Station, Instituto de Investigação Agrária de Moçambique (IIAM) and Tanzania Agricultural Research Institute (TARI) for sharing with us their cowpea germplasm.
Conflicts of Interest
“The authors declare no conflicts of interest.” “The funders had no role in the design of the study; in the collection, analyses, or interpretation of data; in the writing of the manuscript; or in the decision to publish the results”.
References
- Affrifah, N.S.; Phillips, R.D.; Saalia, F.K. Cowpeas: Nutritional profile, processing methods and products—A review. Legum. Sci. 2022, 4, e131. [Google Scholar] [CrossRef]
- Akinyele, I.O.; Onigbinde, A.O.; Hussain, M.A.; Omololu, A. Physicochemical Characteristics of 18 Cultivars of Nigerian Cowpeas (V. uniguiculafa) and Their Cooking Properties. J. Food Sci. 1986, 51, 1483–1485. [Google Scholar] [CrossRef]
- Belane, A.K.; Dakora, F.D. Elevated Concentrations of Dietarily-Important Trace Elements and Macronutrients in Edible Leaves and Grain of 27 Cowpea (Vigna unguiculata L. Walp.) Genotypes: Implications for Human Nutrition and Health. Food Nutr. Sci. 2012, 03, 377–386. [Google Scholar] [CrossRef]
- Blair, M.W.; Astudillo, C.; Grusak, M.A.; Graham, R.; Beebe, S.E. Inheritance of seed iron and zinc concentrations in common bean (Phaseolus vulgaris L.). Mol. Breed. 2009, 23, 197–207. [Google Scholar] [CrossRef]
- Boukar, O.; Massawe, F.; Muranaka, S.; Franco, J.; Maziya-Dixon, B.; Singh, B.; Fatokun, C. Evaluation of cowpea germplasm lines for protein and mineral concentrations in grains. Plant Genet. Resour. Charact. Util. 2011, 9, 515–522. [Google Scholar] [CrossRef]
- Boukar, O., S. Muranaka, J. Franco, and C. Fatokun C. 2012. Protein and mineral composition in grains of elite cowpea lines." In: Boukar, O., O. Coulibaly, C.A Fatokun, K. Lopez, and M. Tamo (eds)." Proceedings, fifth world cowpea conference, improving livelihoods in the cowpea value chain through Advancement in Science." Ibadan: IITA, pp. 88–100.
- Coulibaly, O., A.D. Alene, T. Abdoulaye, C. Chianu, V. Manyong, C. Aitchedji, D. Fatokun, A. Kamara, B. Ousmane, and H. Tefera. 2010. "Baseline assessment of cowpea breeding and seed delivery efforts to enhance poverty impacts in sub-Saharan Africa." Collaboration with NARS from Mali, Niger, Nigeria, Tanzania, Malawi, Kenya and Mozambique. Tropical Legumes II Project Report at Http://Www. Icrisat. Org/What-We-Do/Impi/Projects/Tl2-Publications/Research-Reports/Rr-Cwpsbean. Pdf CRP, 3.
- Dakora, F.D.; Belane, A.K. Evaluation of Protein and Micronutrient Levels in Edible Cowpea (Vigna Unguiculata L. Walp.) Leaves and Seeds. Front. Sustain. Food Syst. 2019, 3. [Google Scholar] [CrossRef]
- Egbadzor, K.; Danquah, E.; Ofori, K.; Yeboah, M.; Offei, S. Diversity in 118 Cowpea [Vigna unguiculate (L.) Walp] Accessions Assessed with 16 Morphological Traits. Int. J. Plant Breed. Genet. 2014, 8, 13–24. [Google Scholar] [CrossRef]
- Kf, E.; M, D.; Ey, D.; M, Y.; Sk, O.; K, O. GENETIC CONTROL OF SEED SIZE IN COWPEA (Vigna unguiculata (L.) Walp). Int. J. Agric. Sci. 2013, 5. [Google Scholar] [CrossRef]
- FAOSTAT. 2023. Statistical Database. Food and Agriculture Organization of the United Nations. https://www.fao.org/faostat/en/#data/QCL.
- Gama, A.P.; Hung, Y.-C.; Adhikari, K. Optimization of Emulsifier and Stabilizer Concentrations in a Model Peanut-Based Beverage System: A Mixture Design Approach. Foods 2019, 8, 116. [Google Scholar] [CrossRef] [PubMed]
- Gerrano, A.S.; Adebola, P.O.; van Rensburg, W.S.J.; Venter, S.L. Genetic Variability and Heritability Estimates of Nutritional Composition in the Leaves of Selected Cowpea Genotypes [Vigna unguiculata (L.) Walp.]. HortScience 2015, 50, 1435–1440. [Google Scholar] [CrossRef]
- Gerrano, A.S., W. S. J. van Rensburg, and P.O. Adebola. 2017. "Nutritional composition of immature pods in selected cowpea (Vigna unguiculata’(L.) Walp.) genotypes in South Africa. Australian Journal of Crop Science 11(2): 134–141.
- Gondwe, T.M.; Alamu, E.O.; Mdziniso, P.; Maziya-Dixon, B. Cowpea (Vigna unguiculata (L.) Walp) for food security: an evaluation of end-user traits of improved varieties in Swaziland. Sci. Rep. 2019, 9, 1–6. [Google Scholar] [CrossRef]
- Hella, J.P., T. Chilongo, A.M. Mbwag, J. Bokosi, V. Kabambe, C. Riches, C., and C.L Massawe. 2013. Participatory market-led cowpea breeding in Sub- Saharan Africa: Evidence pathway from Malawi and Tanzania." Merit Research Journal of Agricultural Science and Soil Science 1: 11-18. http://www.suaire.sua.ac.tz/handle/123456789/3765.
- Herniter, I.A.; Lo, R.; Muñoz-Amatriaín, M.; Lo, S.; Guo, Y.-N.; Huynh, B.-L.; Lucas, M.; Jia, Z.; Roberts, P.A.; Lonardi, S.; et al. Seed Coat Pattern QTL and Development in Cowpea (Vigna unguiculata [L.] Walp.). Front. Plant Sci. 2019, 10, 1346. [Google Scholar] [CrossRef]
- IPGRI. 1983. "Cowpea Descriptors." International Board for Plant Genetic Resources. FAO, Rome.
- Ishikawa, H.; Drabo, I.; Joseph, B.B.; Muranaka, S.; Fatokun, C.; Boukar, O. Characteristics of farmers’ selection criteria for cowpea (Vigna unguiculata) varieties differ between north and south regions of Burkina Faso. Exp. Agric. 2019, 56, 94–103. [Google Scholar] [CrossRef]
- Baptiste, N.T.J.; Joseph, M.B.; Antoine, M.N.; Nicolas, Y.N.; Emmanuel, Y. Genetic analysis of seed proteins contents in cowpea (Vigna unguiculata L. Walp.). Afr. J. Biotechnol. 2020, 10, 3077–3086. [Google Scholar] [CrossRef]
- Kim, D.-K.; Son, D.-M.; Choi, J.-G.; Shin, H.-R.; Choi, K.-J.; Lee, J.; Lee, K.-D.; Rim, Y.-S. Agronomic Characteristics and Seed Quality of Cowpea (Vigna unguiculata L.) Germplasm. Korean J. Crop. Sci. 2013, 58, 1–7. [Google Scholar] [CrossRef]
- Kirse, A.; Karklina, D. Integrated evaluation of cowpea (Vigna unguiculata (L.) Walp.) and maple pea (Pisum sativum var. Arvense L.) spreads. Agronomy Research 2015, 13, 956–968. [Google Scholar]
- Tripathi, K.; Gore, P.G.; Ahlawat, S.P.; Semwal, D.P.; Gautam, N.K.; Kumar, A.; Tyagi, V.; Rana, J. Cowpea genetic resources and its utilization: Indian perspective – A review. Legum. Res. - Int. J. 2019, 42, 437–446. [Google Scholar] [CrossRef]
- Lê, S.; Josse, J.; Husson, F. FactoMineR: an R package for multivariate analysis. Journal of statistical software 2008, 25, 1–18. [Google Scholar] [CrossRef]
- Maechler, M., P. Rousseeuw, A. Struyf, M. Hubert, and K. Hornik. 2012. "cluster: Cluster Analysis Basics and Extensions." https://lirias.kuleuven.be/3999459.
- Mendiburu, F. 2010. "Agricolae: Statistical Procedures for Agricultural Research." R Package Version 1: 1–8.
- Moses, D.R.; Zibokere, D.S. Effect of moisture content on some physical and mechanical properties of three varieties of cowpea (Vigna Unguiculata (L)Walp). Agricultural Engineering International: CIGR Journal 2011, 13, 1. Available online: https://cigrjournal.org/index.php/Ejounral/article/view/1700.
- Moura, J.d.O.; Rocha, M.d.M.; Gomes, R.L.F.; Filho, F.R.F.; e Silva, K.J.D.; Ribeiro, V.Q. Path analysis of iron and zinc contents and others traits in cowpea. Crop. Breed. Appl. Biotechnol. 2012, 12, 245–252. [Google Scholar] [CrossRef]
- Munthali, J.; Nkhata, S.G.; Masamba, K.; Mguntha, T.; Fungo, R.; Chirwa, R. Soaking beans for 12 h reduces split percent and cooking time regardless of type of water used for cooking. Heliyon 2022, 8, e10561. [Google Scholar] [CrossRef]
- Muranaka, S.; Shono, M.; Myoda, T.; Takeuchi, J.; Franco, J.; Nakazawa, Y.; Boukar, O.; Takagi, H. Genetic diversity of physical, nutritional and functional properties of cowpea grain and relationships among the traits. Plant Genet. Resour. Charact. Util. 2015, 14, 67–76. [Google Scholar] [CrossRef]
- Nalawade, A.; Patil, S.; Rajwade, P.; Kauthale, V. Evaluation of Cowpea Germplasm by using Agro-Morphological Characters. Indian J. Agric. Res. 2020, 55, 364–368. [Google Scholar] [CrossRef]
- Nielsen, S.S.; Brandt, W.E.; Singh, B.B. Genetic Variability for Nutritional Composition and Cooking Time of Improved Cowpea Lines. Crop. Sci. 1993, 33, 469–472. [Google Scholar] [CrossRef]
- Nkongolo, K.; Bokosi, J.; Malusi, M.; Vokhiwa, Z.; Mphepo, M. Agronomic, culinary, and genetic characterization of selected cowpea elite lines using farmers’ and breeder’s knowledge: A case study from Malawi. African Journal of Plant Science 2009, 3 156, 147. [Google Scholar]
- Okalebo, J.R.; Gathua, K.W.; Woomer, P.L. Laboratory methods of soil and plant analysis. A Working Manual 2002, 2, 29–68. [Google Scholar]
- Olapade, A.; Okafor, G.; Ozumba, A.; Olatunji, O. Characterization of common Nigerian cowpea (Vigna unguiculata L. Walp) varieties. J. Food Eng. 2002, 55, 101–105. [Google Scholar] [CrossRef]
- Quaye, W.; Adofo, K.; Buckman, E.S.; Frempong, G.; Jongerden, J.; Ruivenkamp, G. A socio-economic assessment of cowpea diversity on the Ghanaian market: implications for breeding. Int. J. Consum. Stud. 2011, 35, 679–687. [Google Scholar] [CrossRef]
- Rife, T.W.; Poland, J.A. Field Book: An Open-Source Application for Field Data Collection on Android. Crop. Sci. 2014, 54, 1624–1627. [Google Scholar] [CrossRef]
- Sahrawat, K.L.; Kumar, G.R.; Murthy, K.V.S. SULFURIC ACID–SELENIUM DIGESTION FOR MULTI-ELEMENT ANALYSIS IN A SINGLE PLANT DIGEST. Commun. Soil Sci. Plant Anal. 2002, 33, 3757–3765. [Google Scholar] [CrossRef]
- Sanni, S.; Adebowale, A.; Yusuf, A. Physical, proximate, and cooking properties of selected Nigerian cowpea varieties. Niger. Food J. 2006, 24, 34–41. [Google Scholar] [CrossRef]
- Traore, K.; Sawadogo, P.; Batiéno, T.B.J.; Sawadogo, N.; Zongo, H.; Poda, S.L.; Tignegré, J.B.D.S.; Ouédraogo, T.J.; Sawadogo, M. Physical and Cooking Characteristics of Six Cowpea Varieties Seeds Cultivated in Burkina Faso. Am. J. Plant Sci. 2022, 13, 929–942. [Google Scholar] [CrossRef]
Figure 1.
Monthly rainfall data at Bunda from November 2021 to April 2022.
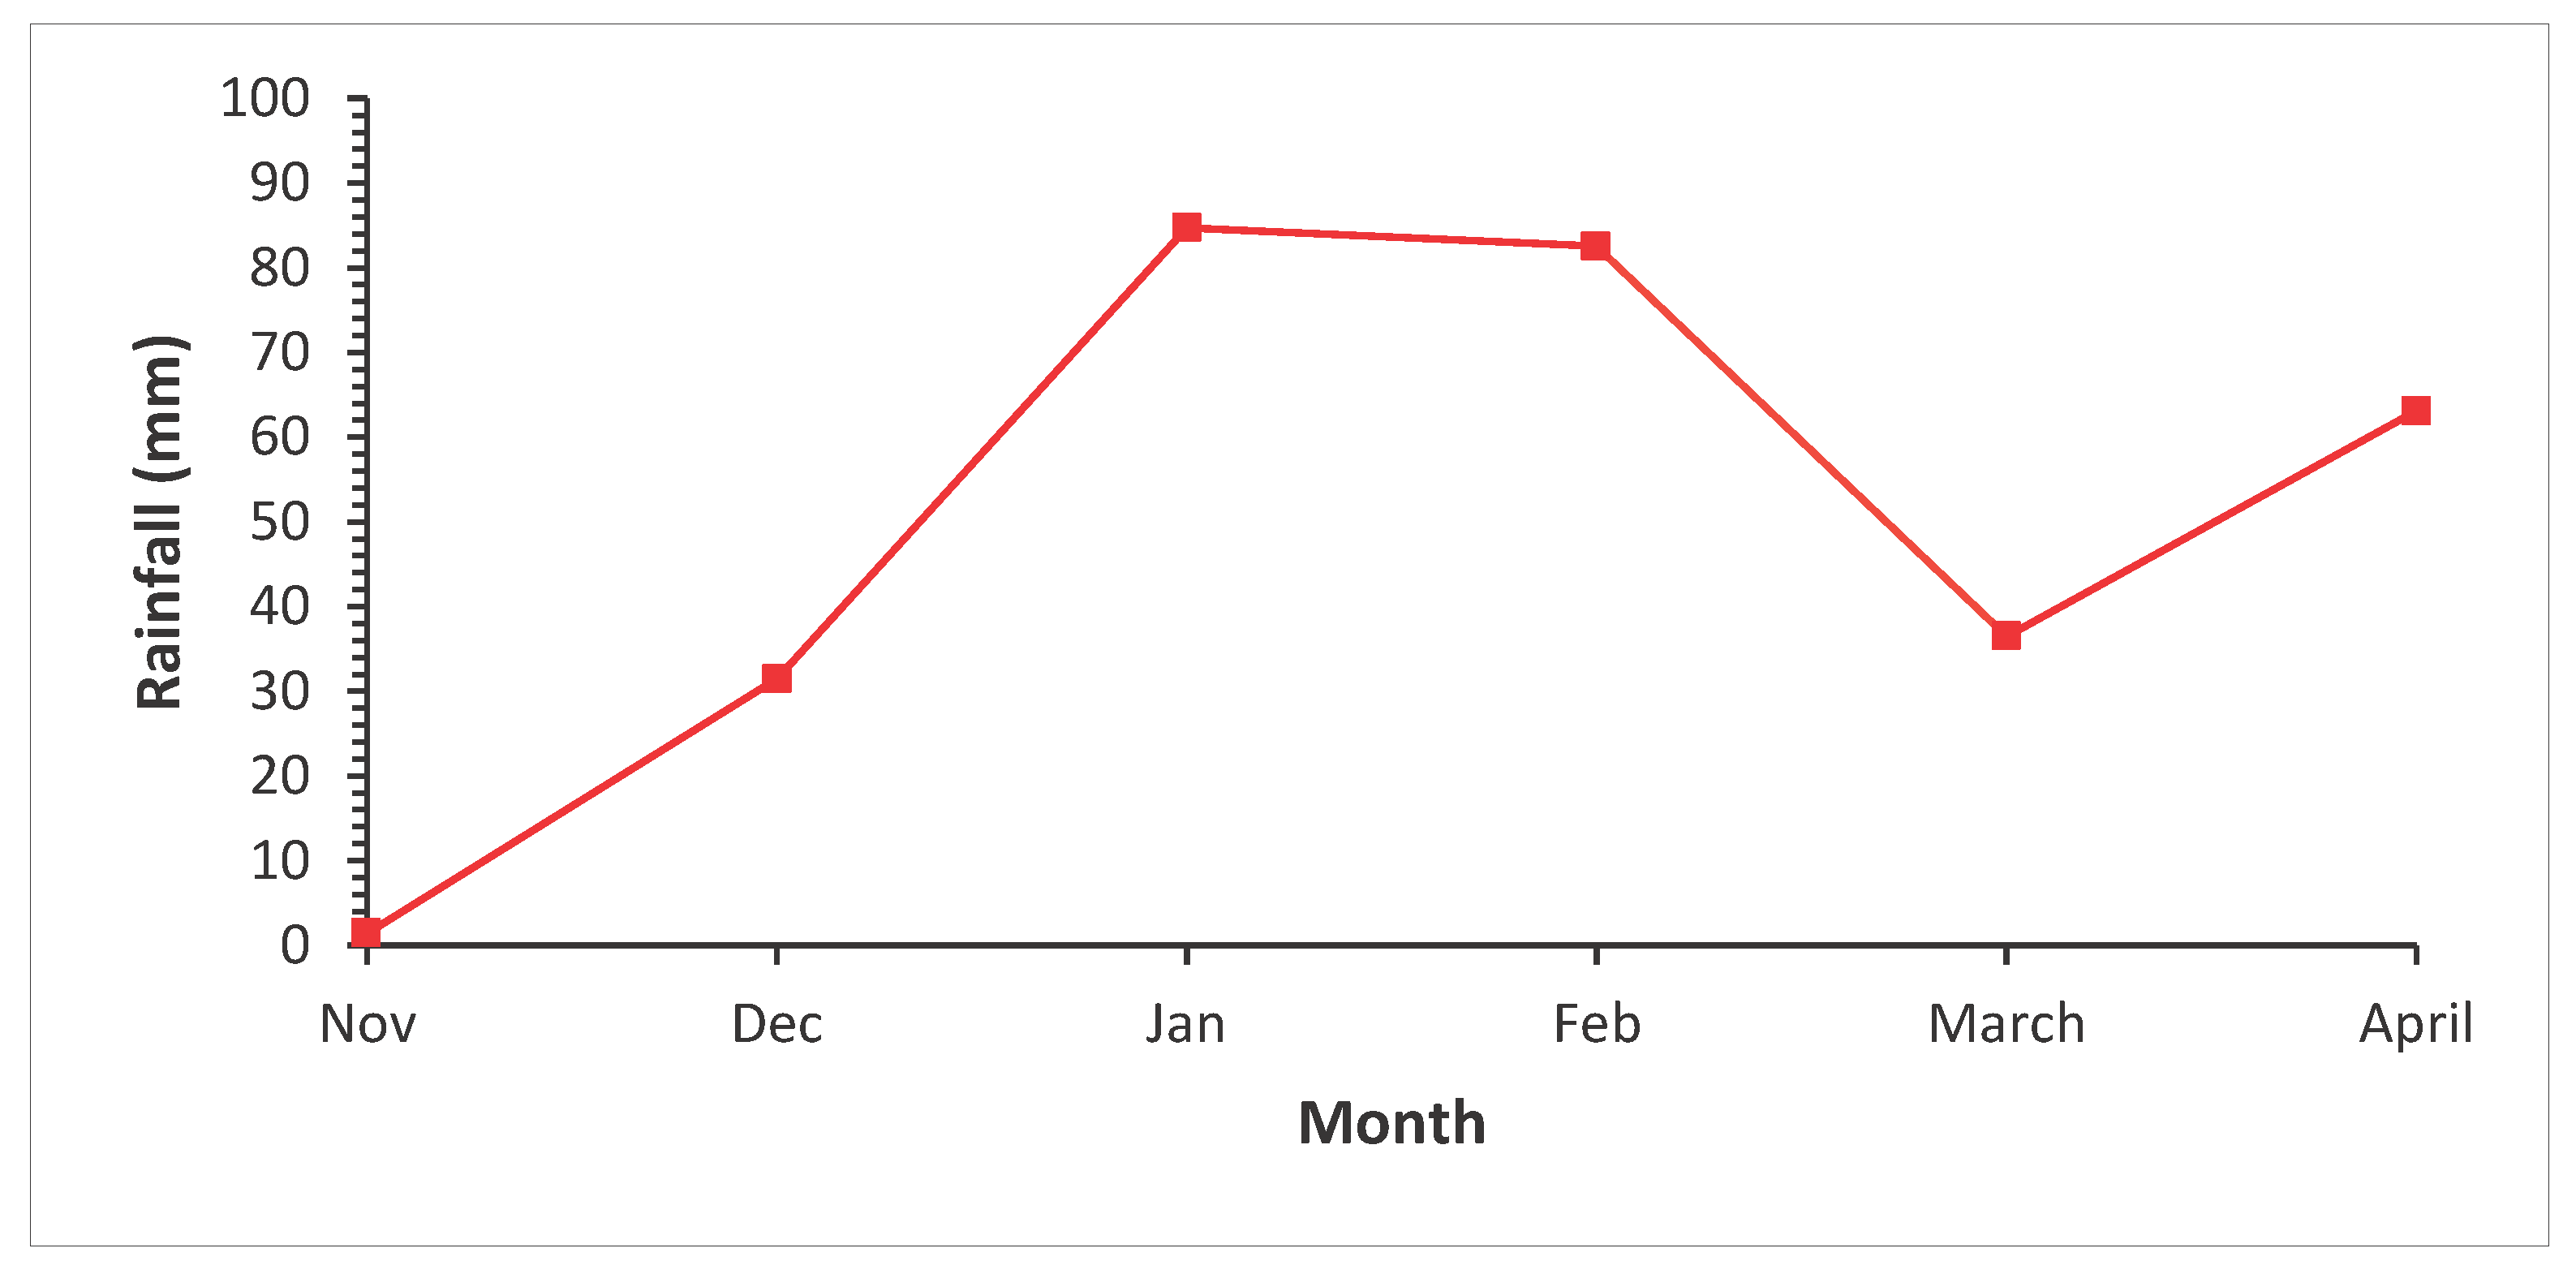
Figure 2.
Frequency distribution of traits: (a) Protein content (%), (b) Iron content (mg/kg), (c) Zinc content (mg/kg), (d) Cooking time (min), (e) Broth viscosity (cP), (f) Seed length (mm), (g) Seed width (mm), (h) 100 seed weight (g).
Figure 2.
Frequency distribution of traits: (a) Protein content (%), (b) Iron content (mg/kg), (c) Zinc content (mg/kg), (d) Cooking time (min), (e) Broth viscosity (cP), (f) Seed length (mm), (g) Seed width (mm), (h) 100 seed weight (g).
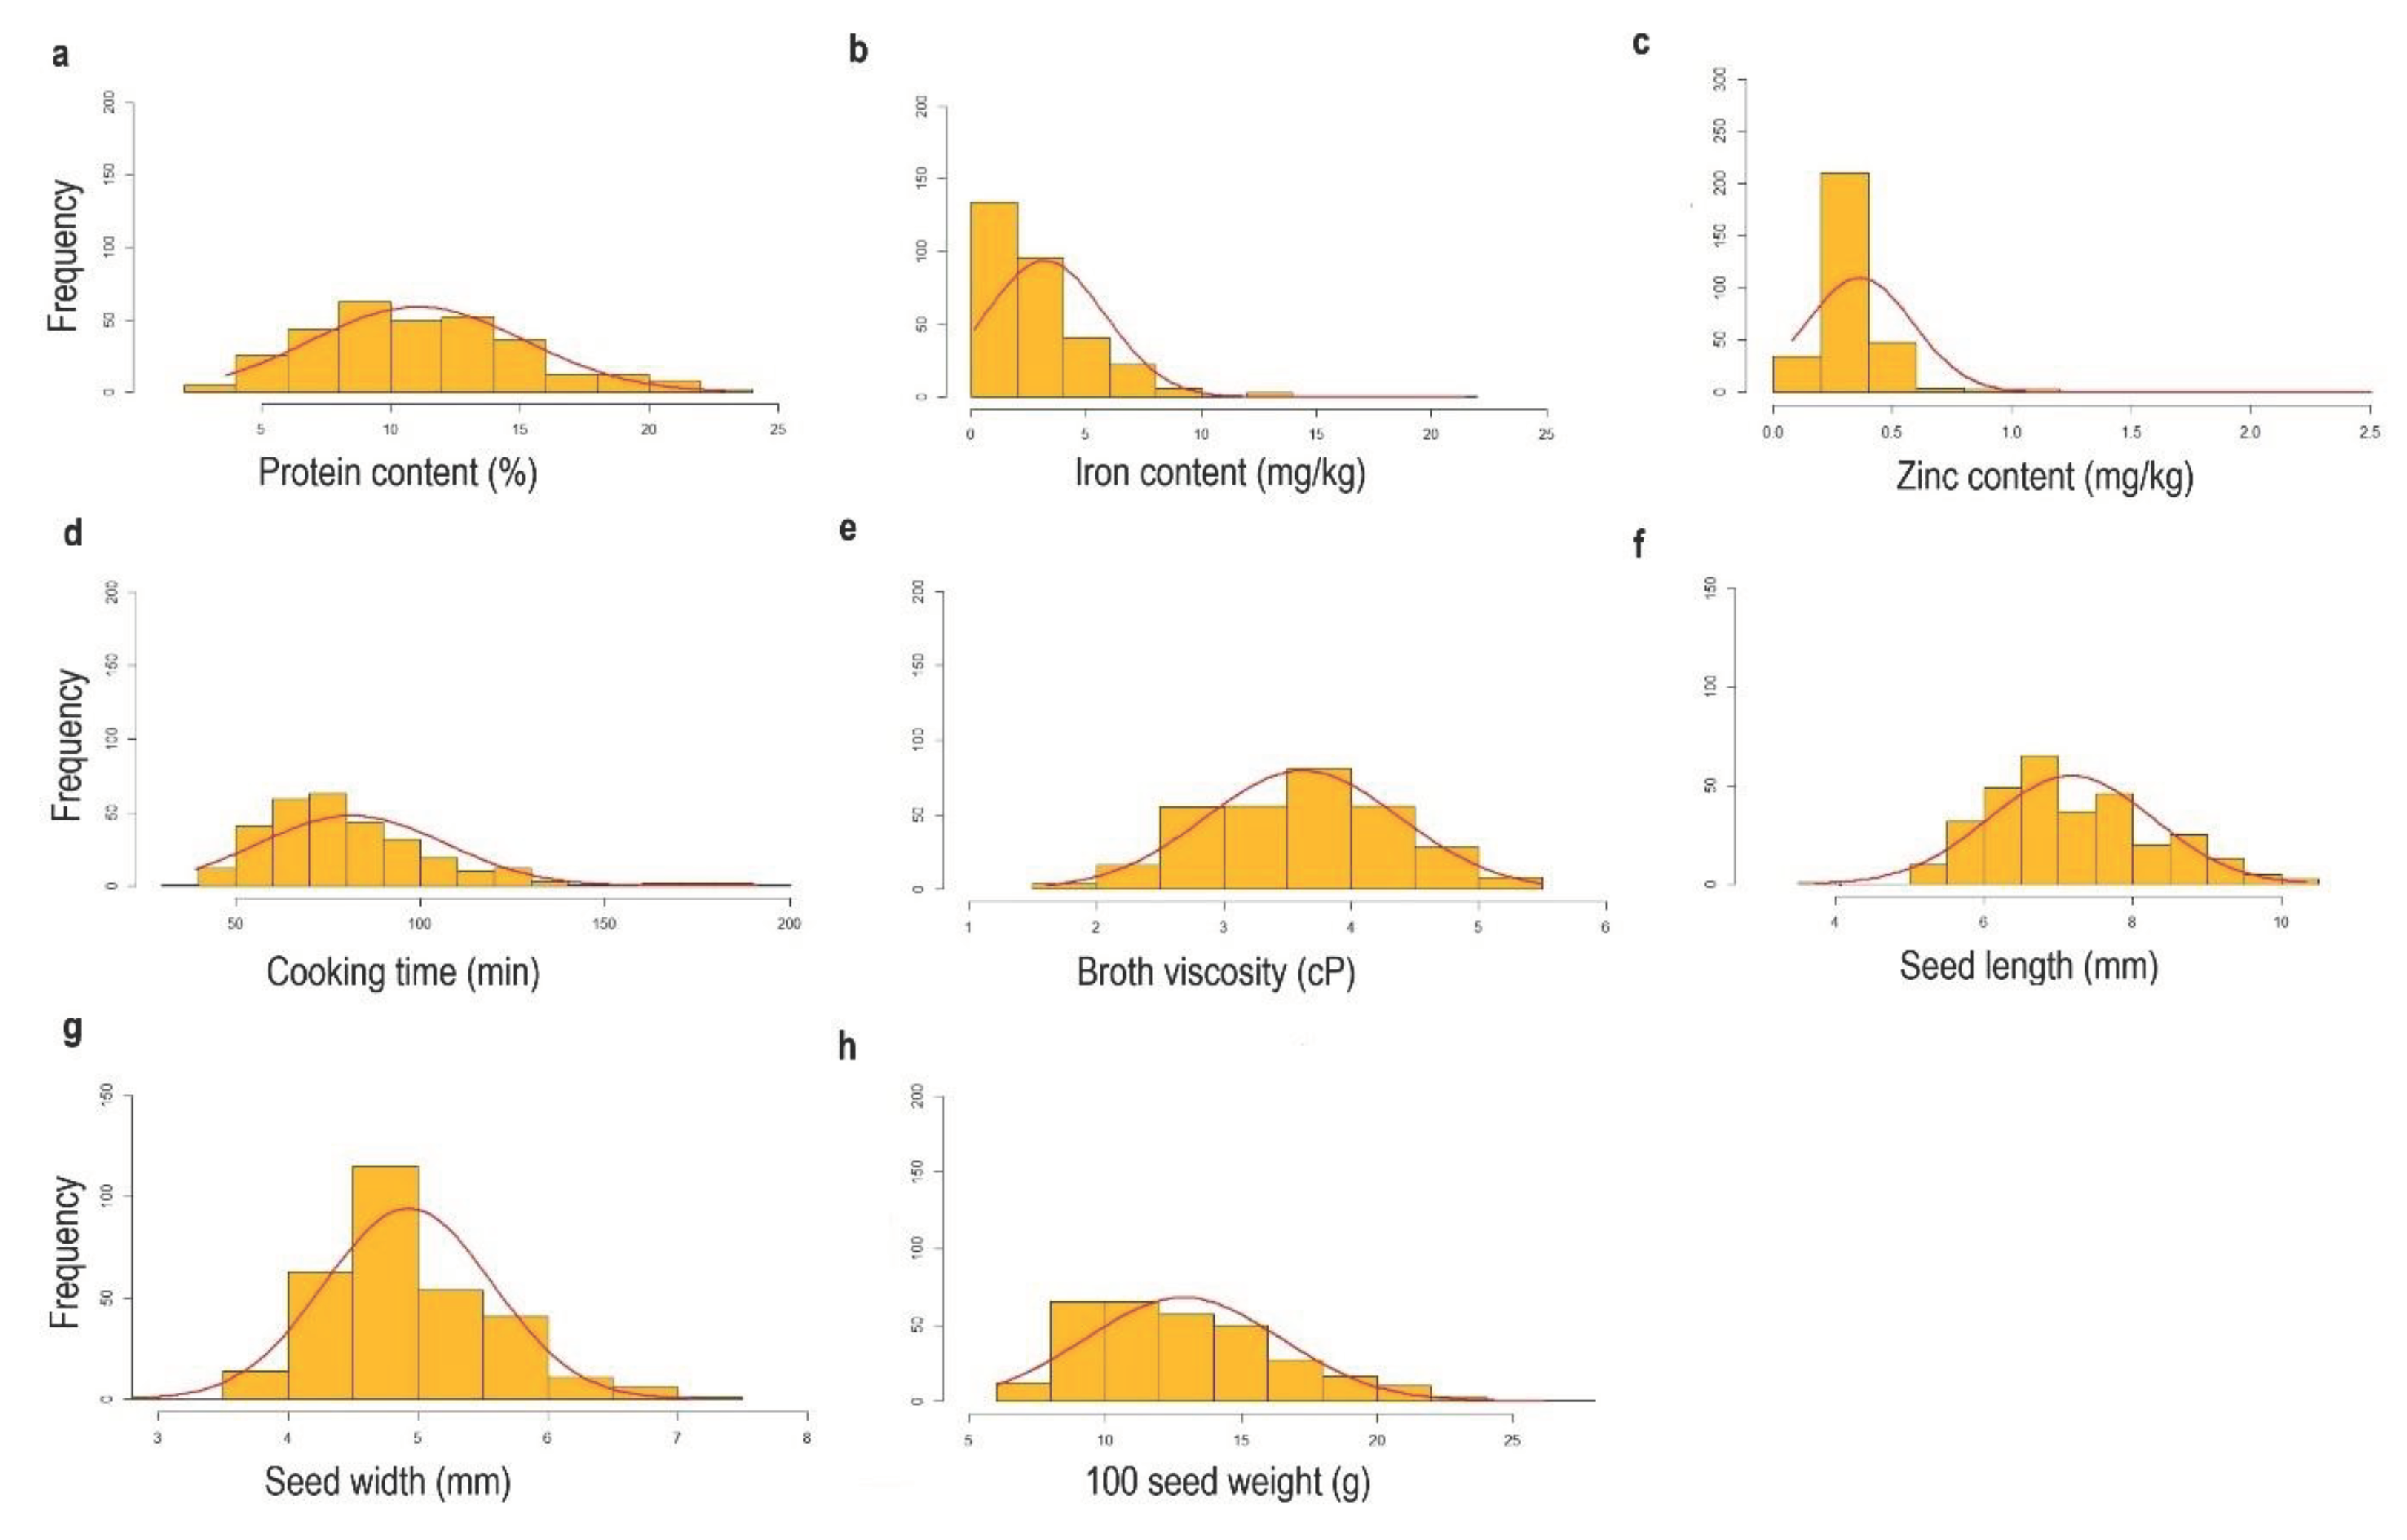
Figure 3.
Genotype by trait biplot. 306 cowpea genotypes measured for eight quality traits: Pr= Protein content, Fe= Iron content, Zn= Zinc content, CT= Cooking time, RV= Broth Viscosity, SDLEN= Seed length, SDWDT= Seed width, HSDWT= 100 seed weight.
Figure 3.
Genotype by trait biplot. 306 cowpea genotypes measured for eight quality traits: Pr= Protein content, Fe= Iron content, Zn= Zinc content, CT= Cooking time, RV= Broth Viscosity, SDLEN= Seed length, SDWDT= Seed width, HSDWT= 100 seed weight.
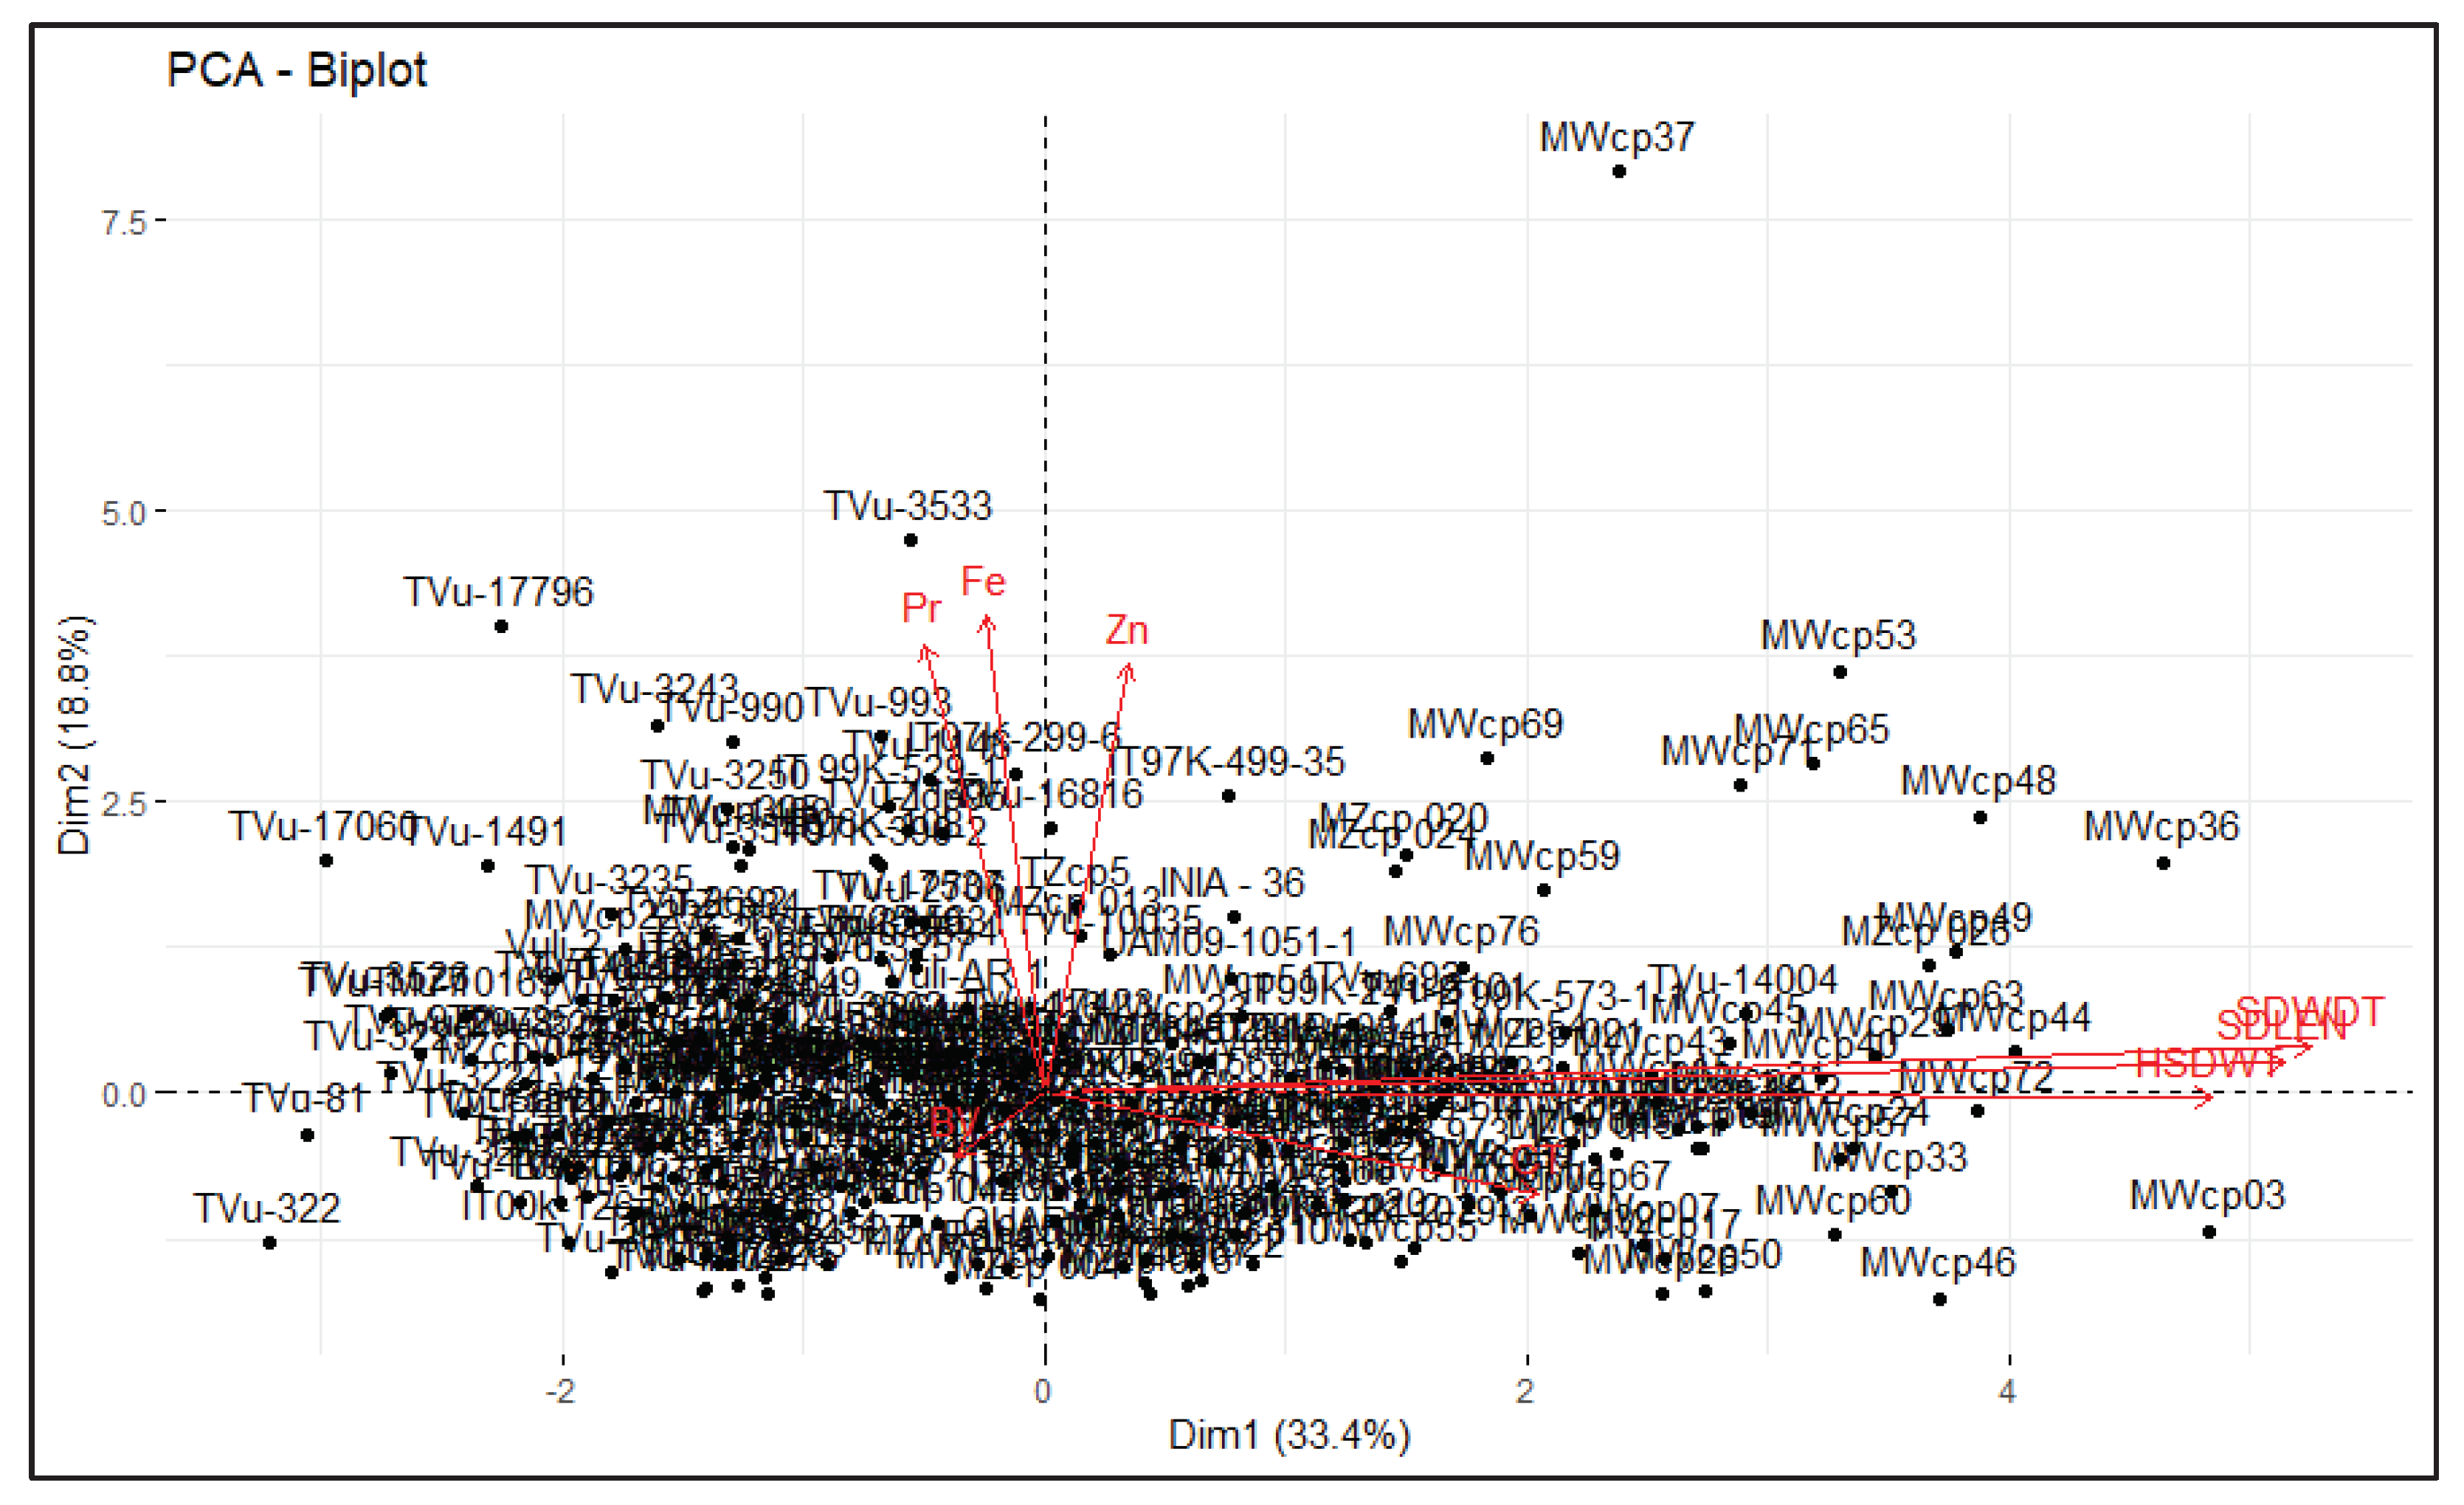
Figure 4.
Hierarchical clustering dendrogram analysis. Euclidean distance was used and the associations between groups were done by the Ward method for the quality traitsDISCUSSION.
Figure 4.
Hierarchical clustering dendrogram analysis. Euclidean distance was used and the associations between groups were done by the Ward method for the quality traitsDISCUSSION.
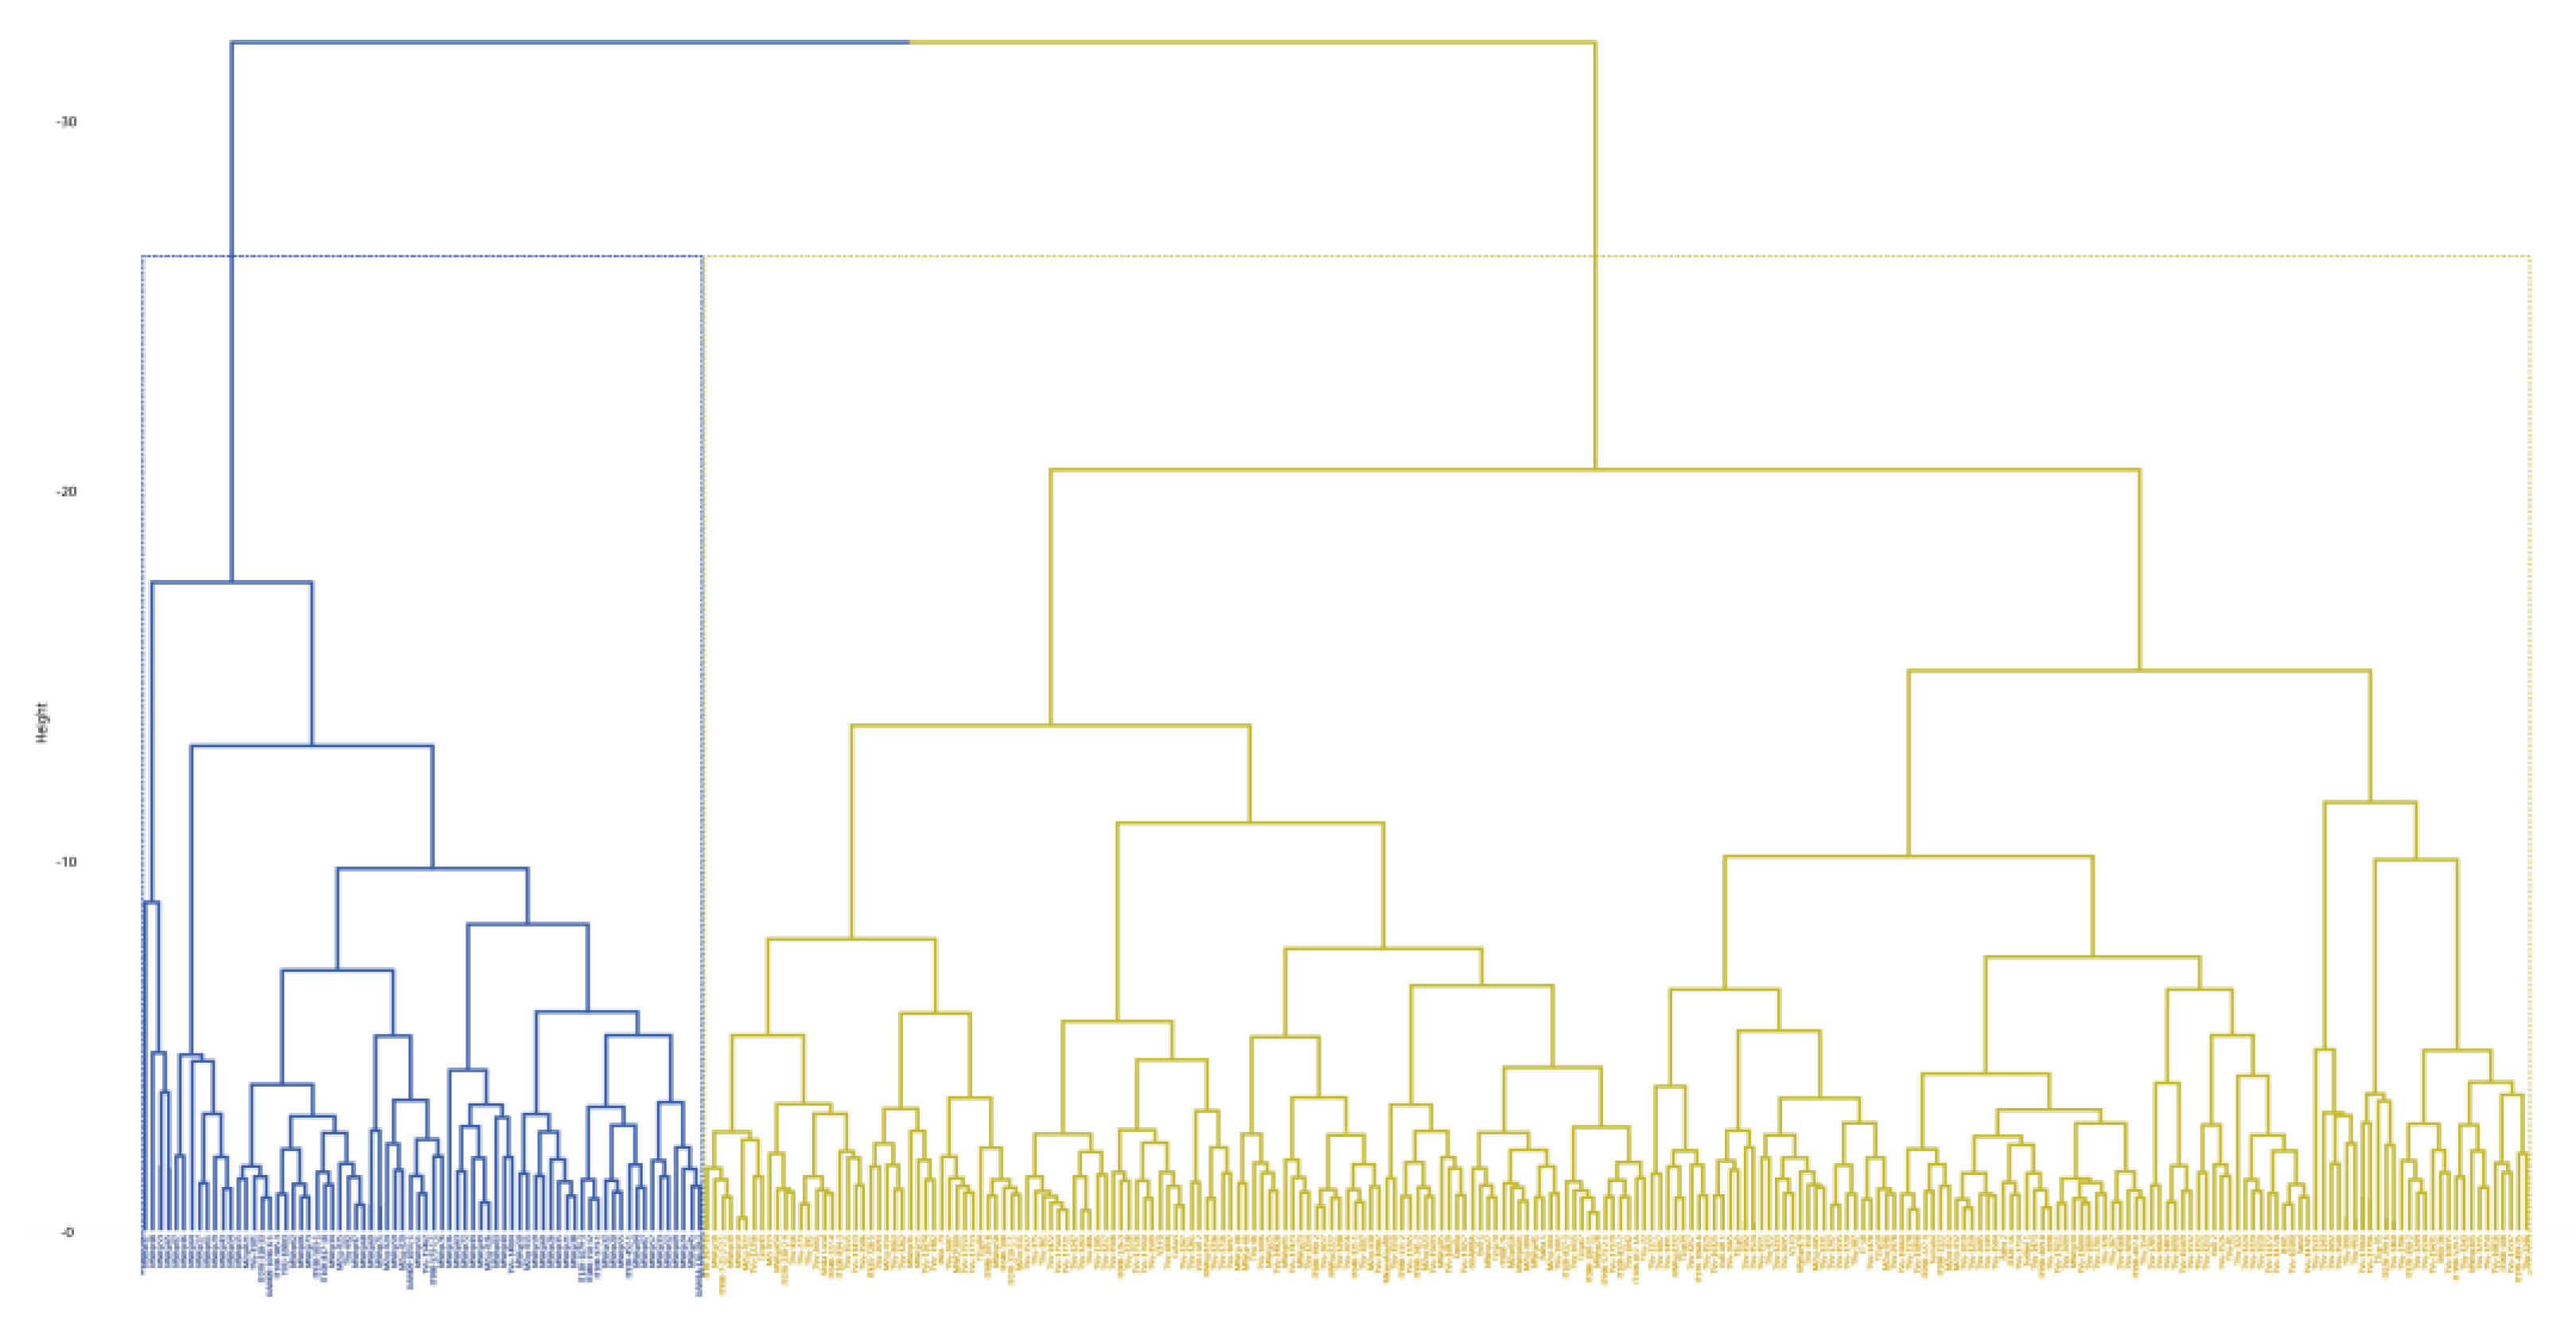

Table 1.
Mean square values for seed length, seed width and one hundred seed wight.
| Source of variation | DF | Seed length | Seed width | HSDWT |
|---|---|---|---|---|
| Rep | 2 | 124.68*** | 9.49*** | 543.50*** |
| Block:Rep | 99 | 4.67*** | 2.14*** | 10.90** |
| Genotype | 305 | 18.55*** | 6.31*** | 38.30*** |
| Residuals | 4183 | 1.18 | 0.54 | 7.00 |
DF=Degrees of freedom, HSDWT= 100 seed weight, ***highly significant at p < 0.001, **highly significant at p < 0.01.
Table 2.
Mean performance of the top ten and bottom ten genotypes ranked based on 100 seed weight.
| Genotype | Seed length (mm) |
Seed width (mm) |
HSDWT (g) |
Seed coat color | Seed shape |
|---|---|---|---|---|---|
| Top 10 genotypes | |||||
| MWcp36 | 9.33 ± 1.29 | 6.53 ± 1.06 | 26.13 ± 0.67 a | Brown | Rhomboid |
| MWcp03 | 10.33 ± 0.98 | 6.67 ± 1.05 | 23.70 ± 1.56 ab | Purple | Ovoid |
| MWcp67 | 7.80 ± 0.94 | 5.53 ± 0.52 | 22.57 ± 3.32 ab | Reddish-brown | Rhomboid |
| MWcp60 | 8.13 ± 1.13 | 6.13 ± 0.74 | 22.23 ± 1.53 ab | Reddish-brown | Rhomboid |
| UAM14-126-19-2 | 8.60 ± 1.24 | 5.80 ± 0.68 | 21.70 ± 7.01 ab | White | Rhomboid |
| MWcp45 | 8.67 ± 1.35 | 6.00 ± 1.07 | 21.30 ± 0.70 b | Reddish-brown | Rhomboid |
| MWcp24 | 8.87 ± 0.74 | 6.20 ± 0.86 | 21.03 ± 1.24 b | Reddish-brown | Rhomboid |
| MWcp53 | 8.73 ± 1.28 | 5.93 ± 0.59 | 21.00 ± 4.75 b | Reddish-brown | Ovoid |
| MWcp04 | 8.00 ± 1.77 | 5.27 ± 0.70 | 20.97 ± 2.78 b | Reddish-brown | Rhomboid |
| TVu-14004 | 9.80 ± 0.77 | 5.73 ± 0.70 | 20.93 ± 4.16 b | White | Kidney |
| Bottom 10 genotypes | |||||
| TVu-3526 | 5.40 ± 0.74 | 4.07 ± 0.70 | 7.87 ± 0.50 c | Purple | Ovoid |
| TVu-1177 | 5.67 ± 0.62 | 3.73 ± 0.46 | 7.77 ± 0.40 c | Brown | Ovoid |
| TVu-3063 | 6.87 ± 1.06 | 4.33 ± 0.90 | 7.30 ± 0.79 c | White | Ovoid |
| TVu-81 | 5.4 ± 0.63 | 3.73 ± 0.46 | 7.23 ± 0.95 c | White | Rhomboid |
| TVu-3228 | 6.27 ± 1.10 | 4.73 ± 0.70 | 7.00 ± 0.40 c | Purplish- brown | Ovoid |
| TVu-3229 | 5.20 ± 0.68 | 4.07 ± 0.46 | 7.00 ± 1.11 c | Purple | Ovoid |
| TVu-972 | 5.80 ± 0.94 | 3.87 ± 0.64 | 6.97 ± 0.32 c | Brown | Ovoid |
| TVu-17060 | 5.07 ± 0.80 | 3.87 ± 0.64 | 6.53 ± 0.65 c | Purple | Ovoid |
| TVu-3217 | 6.13 ± 0.83 | 4.27 ± 0.59 | 6.13 ± 0.70 c | Brown | Rhomboid |
| TVu-10169 | 6.27 ± 1.28 | 3.8 ± 0.56 | 6.00 ± 1.42 c | Black | Rhomboid |
| Grand mean | 7.17 | 4.93 | 12.86 | ||
| Pr(>F) | 0.00 | 0.00 | 0.00 | ||
| CV (%) | 15.14 | 14.97 | 20.51 | ||
CV= Coefficient of variation.
Table 3.
Mean square values for cooking quality traits in the study.
| Source of variation | DF | Broth viscosity | Cooking time |
|---|---|---|---|
| Genotype | 303 | 1.17*** | 1274.80*** |
| Residuals | 304 | 0.45 | 10.70 |
DF=Degrees of freedom, ***highly significant at p < 0.001.
Table 4.
Mean values of the top ten and bottom ten genotypes ranked based on cooking time.
| Entry | Cooking time (min) | Broth viscosity (cP) | SDCCOL | SDSHP |
|---|---|---|---|---|
| Top 10 genotypes | ||||
| TVu-15631 | 39.00 ± 1.41 a | 4.60 ± 0.28 | Red | Kidney |
| TVu-328 | 45.50 ± 2.12 a | 4.20 ± 0.14 | Mottled | Ovoid |
| IT98K-131-2 | 46.50 ± 4.95 a | 3.75 ± 1.34 | Brown | Rhomboid |
| TVu-22 | 47.50 ± 3.54 a | 3.90 ± 0.14 | Mottled | Kidney |
| TVu-3550 | 48.50 ± 0.71 a | 5.00 ± 0.00 | Reddish-brown | Kidney |
| IT00k-126-3 | 58.50 ± 2.12 a | 4.60 ± 0.28 | Brown | Ovoid |
| TVu-14004 | 49.50 ± 2.12 a | 3.60 ± 1.41 | White | Kidney |
| MWcp40 | 49.50 ± 2.12 a | 3.85 ± 1.34 | Purple | Ovoid |
| TVu-13265 | 49.50 ± 2.12 a | 3.85 ± 1.34 | White | Kidney |
| TVu-2661 | 49.50 ± 3.54 a | 2.75 ± 0.64 | Brown | Ovoid |
| Bottom 10 genotypes | ||||
| TVu-11674 | 137.50 ± 0.71 b | 2.95 ± 0.64 | Brown | Rhomboid |
| MWcp31 | 145.00 ± 2.83 c | 3.20 ± 0.28 | Brown | Ovoid |
| MWcp17 | 159.50 ± 0.71 d | 4.20 ± 0.14 | White | Rhomboid |
| MWcp61 | 160.50 ± 3.54 d | 4.60 ± 0.28 | Mottled | Ovoid |
| MWcp64 | 167.50 ± 0.71 e | 3.30 ± 0.28 | Brown | Ovoid |
| MWcp54 | 171.00 ± 5.66 e | 4.10 ± 0.14 | Mottled | Rhomboid |
| MWcp29 | 171.50 ± 6.36 e | 4.00 ± 0.14 | Purple | Ovoid |
| MWcp46 | 180.50 ± 0.71 f | 2.40 ± 0.0 | Mottled | Rhomboid |
| MWcp43 | 181.00 ± 10.41 f | 3.65 ± 0.21 | White | Rhomboid |
| MWcp07 | 191.00 ± 7.07 g | 2.65 ± 0.64 | Mottled | Ovoid |
| Grand mean | 81.52 | 3.62 | ||
| Pr(>F) | 0.00 | 0.00 | ||
| CV (%) | 4.01 | 18.48 | ||
CV= Coefficient of variation, SDCCOL= Seed coat colour, SDSHP= Seed shape.
Table 5.
Mean square values for cooking quality traits in the study.
| Source of variation | DF | Protein | Iron | Zinc |
|---|---|---|---|---|
| Genotype | 305 | 34.42*** | 13.58*** | 0.10*** |
| Residuals | 306 | 1.05 | 0.05 | 0.00 |
DF=Degrees of freedom, ***highly significant at p < 0.001.
Table 6.
Means of top ten and bottom ten genotypes ranked based on protein content.
| Entry | Protein (%) | Iron (mg/kg) | Zinc (mg/kg) | SDCCOL | SDSHP |
|---|---|---|---|---|---|
| Top 10 genotypes | |||||
| TVu-3243 | 22.92 ± 0.25 a | 8.39 ± 0.00 | 0.45 ± 0.00 | Brown | Ovoid |
| MWcp305 | 22.21 ± 0.85 ab | 6.56 ± 0.00 | 0.34 ± 0.00 | Brown | Ovoid |
| TVu-2706 | 21.32 ± 0.10 ab | 3.20 ± 0.00 | 0.39 ± 0.00 | Reddish-brown | Kidney |
| TVu-3094 | 21.29 ± 0.15 ab | 1.29 ± 0.00 | 0.36 ± 0.00 | White | Kidney |
| MWcp69 | 21.21 ± 0.75 ab | 8.67 ± 0.00 | 0.39 ± 0.00 | Purple | Ovoid |
| MZcp 024 | 20.97 ± 0.60 ab | 5.00 ± 0.00 | 0.34 ± 0.00 | Brown | Ovoid |
| TVu-3524 | 20.40 ± 0.10 b | 1.19 ± 0.00 | 0.29 ± 0.00 | Brown | Rhomboid |
| IT 99K-529-1 | 20.29 ± 0.15 b | 7.15 ± 0.00 | 0.45 ± 0.00 | Brown | Ovoid |
| TVu-10169 | 20.18 ± 0.70 b | 1.93 ± 0.00 | 0.33 ± 0.00 | Black | Rhomboid |
| TVu-1483 | 20.04 ± 0.20 b | 1.64 ± 0.00 | 0.43 ± 0.00 | Purplish- brown | Ovoid |
| Bottom 10 genotypes | |||||
| TVu-1015 | 4.29 ± 0.10 c | 1.58 ± 0.00 | 0.27 ± 0.00 | Brown | Ovoid |
| MWcp601 | 4.19 ± 0.03 c | 1.89 ± 0.00 | 0.22 ± 0.00 | Brown | Ovoid |
| MWcp48 | 4.17 ± 0.15 c | 1.90 ± 0.00 | 1.77 ± 0.02 | Purple | Ovoid |
| MWcp46 | 4.09 ± 0.03 c | 2.00 ± 0.00 | 0.23 ± 0.00 | Mottled | Rhomboid |
| IT90K-76 | 4.06 ± 0.10 c | 1.57 ± 0.01 | 0.31 ± 0.00 | Brown | Ovoid |
| TVx-3236 | 4.00 ± 0.03 c | 2.67 ± 0.00 | 0.27 ± 0.00 | White | Rhomboid |
| TZcp67 | 3.78 ± 0.20 c | 1.94 ± 0.00 | 0.18 ± 0.00 | Brown | Ovoid |
| MWcp50 | 3.64 ± 0.10 c | 1.67 ± 0.00 | 0.24 ± 0.00 | Purple | Ovoid |
| MZcp 004 | 3.63 ± 0.07 c | 1.98 ± 0.00 | 0.17 ± 0.00 | Brown | Ovoid |
| TVu-3263 | 3.60 ± 0.15 c | 1.24 ± 0.00 | 0.28 ± 0.00 | Purple | Rhomboid |
| Grand mean | 11.05 | 3.21 | 0.36 | ||
| Pr(>F) | 0.00 | 0.00 | 0.00 | ||
| CV% | 9.27 | 7.10 | 1.23 | ||
CV= Coefficient of variation, SDCCOL= Seed coat colour, SDSHP= Seed shape.
Table 7.
The correlation matrix among grain, cooking and nutritional quality traits of cowpea genotypes.
Table 7.
The correlation matrix among grain, cooking and nutritional quality traits of cowpea genotypes.
| Trait 1 | | | Trait 2 | | | r | | | 95% CI | | | t | | | df | | | p | |
|---|---|---|---|---|---|---|---|---|---|---|---|---|---|
| Protein | | | Iron | | | 0.28 | | | [0.17, | 0.38] | | | 5.05 | | | 304 | | | <.001*** |
| Protein | | | Zinc | | | 0.21 | | | [0.10, | 0.31] | | | 3.72 | | | 304 | | | 0.005** |
| Protein | | | Broth | | | -0.07 | | | [-0.18, | 0.04] | | | -1.23 | | | 302 | | | >0.999 |
| Protein | | | CT | | | -0.03 | | | [-0.14, | 0.08] | | | -0.53 | | | 302 | | | >0.999 |
| Protein | | | Seed.L | | | -0.06 | | | [-0.17, | 0.05] | | | -1.09 | | | 304 | | | >0.999 |
| Protein | | | Seed.W | | | -0.03 | | | [-0.15, | 0.08] | | | -0.59 | | | 304 | | | >0.999 |
| Protein | | | HSDWT | | | -0.06 | | | [-0.17, | 0.05] | | | -1.08 | | | 304 | | | >0.999 |
| Iron | | | Zinc | | | 0.24 | | | [0.13, | 0.34] | | | 4.34 | | | 304 | | | <.001*** |
| Iron | | | Broth | | | -0.04 | | | [-0.15, | 0.08] | | | -0.61 | | | 302 | | | >0.999 |
| Iron | | | CT | | | -0.08 | | | [-0.19, | 0.03] | | | -1.45 | | | 302 | | | >0.999 |
| Iron | | | Seed.L | | | -7.24E-03 | | | [-0.12, | 0.10] | | | -0.13 | | | 304 | | | >0.999 |
| Iron | | | Seed.W | | | 0.03 | | | [-0.09, | 0.14] | | | 0.47 | | | 304 | | | >0.999 |
| Iron | | | HSDWT | | | -0.06 | | | [-0.17, | 0.05] | | | -1.08 | | | 304 | | | >0.999 |
| Zinc | | | Broth | | | 0.03 | | | [-0.08, | 0.14] | | | 0.5 | | | 302 | | | >0.999 |
| Zinc | | | CT | | | -0.04 | | | [-0.15, | 0.07] | | | -0.75 | | | 302 | | | >0.999 |
| Zinc | | | Seed.L | | | 0.07 | | | [-0.04, | 0.18] | | | 1.29 | | | 304 | | | >0.999 |
| Zinc | | | Seed.W | | | 0.06 | | | [-0.05, | 0.17] | | | 1.06 | | | 304 | | | >0.999 |
| Zinc | | | HSDWT | | | 0.03 | | | [-0.09, | 0.14] | | | 0.48 | | | 304 | | | >0.999 |
| Broth | | | CT | | | -0.04 | | | [-0.16, | 0.07] | | | -0.76 | | | 302 | | | >0.999 |
| Broth | | | Seed.L | | | 6.74E-03 | | | [-0.11, | 0.12] | | | 0.12 | | | 302 | | | >0.999 |
| Broth | | | Seed.W | | | -0.03 | | | [-0.14, | 0.08] | | | -0.54 | | | 302 | | | >0.999 |
| Broth | | | HSDWT | | | -0.09 | | | [-0.20, | 0.02] | | | -1.61 | | | 302 | | | >0.999 |
| CT | | | Seed.L | | | 0.21 | | | [0.10 | 0.31] | | | 3.72 | | | 302 | | | 0.005** |
| CT | | | Seed.W | | | 0.26 | | | [0.15 | 0.36] | | | 4.67 | | | 302 | | | <.001*** |
| CT | | | HSDWT | | | 0.19 | | | [0.08 | 0.30] | | | 3.44 | | | 302 | | | 0.013* |
| Seed.L | | | Seed.W | | | 0.89 | | | [0.86 | 0.91] | | | 33.49 | | | 304 | | | <.001*** |
| Seed.L | | | HSDWT | | | 0.71 | | | [0.65 | 0.76] | | | 17.57 | | | 304 | | | <.001*** |
| Seed.W | | | HSDWT | | | 0.75 | | | [0.70 | 0.80] | | | 19.88 | | | 304 | | | <.001*** |
r= Correlation coefficient, CI= Confidence interval, t= t-value, df= Degrees of freedom, p= p-value, CT= Cooking time, Seed.L= Seed length, Seed.W= Seed width, HSDWT= 100 seed weight, Broth= Broth viscosity. (P-value adjustment method: Holm (1979).
Table 8.
Trait contributions, eigenvalues, and cumulative percentage of the components.
| Traits | Principal components | Trait contributions (%) | |||||
|---|---|---|---|---|---|---|---|
| PC1 | PC2 | PC3 | PC1 | PC2 | PC3 | ||
| Seed length | 0.57 | 0.04 | 0.11 | 32.13 | 0.16 | 1.30 | |
| Seed width | 0.58 | 0.06 | 0.05 | 33.59 | 0.34 | 0.26 | |
| 100 seed weight | 0.53 | -0.00 | -0.02 | 28.51 | 0.00 | 0.05 | |
| Cooking time | 0.22 | -0.13 | -0.29 | 5.08 | 1.62 | 8.65 | |
| Broth viscosity | -0.04 | -0.08 | 0.89 | 0.16 | 0.65 | 79.84 | |
| Protein | -0.06 | 0.56 | -0.20 | 0.31 | 31.92 | 3.84 | |
| Iron | -0.03 | 0.60 | 0.01 | 0.08 | 36.04 | 0.01 | |
| Zinc | 0.04 | 0.54 | 0.25 | 0.14 | 36.04 | 6.05 | |
| Eigenvalue | 2.67 | 1.51 | 1.04 | ||||
| % of variance | 33.36 | 18.81 | 12.98 | ||||
| Cumulative % of variance | 33.37 | 52.19 | 65.17 | ||||
Table 9.
Descriptive statistics of the clusters.
| Cluster | N | Statistic | Pr (%) | Fe (mg/kg) | Zn (mg/kg) | CT (min) | BV (cP) | Seed.L (mm) | Seed.W (mm) | HSDWT (g) |
|---|---|---|---|---|---|---|---|---|---|---|
| I | 234 | M | 10.95 | 3.26 | 0.35 | 76.98 | 3.68 | 6.74 | 4.66 | 11.43 |
| Min | 3.60 | 0.32 | 0.08 | 39.00 | 1.60 | 3.73 | 2.93 | 6.00 | ||
| Max | 22.92 | 21.44 | 1.23 | 145.00 | 5.50 | 8.93 | 5.73 | 18.80 | ||
| II | 72 | M | 11.39 | 3.06 | 0.40 | 96.03 | 3.43 | 8.57 | 5.79 | 17.58 |
| Min | 3.64 | 0.12 | 0.09 | 49.50 | 2.20 | 5.67 | 4.53 | 12.80 | ||
| Max | 21.21 | 14.64 | 2.63 | 191.00 | 4.90 | 10.33 | 7.13 | 26.13 |
Pr= Protein, Fe= Iron, Zn= Zinc, CT= Cooking time, RV= Broth Viscosity, Seed.L= Seed length, Seed.W= Seed width, HSDWT= 100 seed weight.
Disclaimer/Publisher’s Note: The statements, opinions and data contained in all publications are solely those of the individual author(s) and contributor(s) and not of MDPI and/or the editor(s). MDPI and/or the editor(s) disclaim responsibility for any injury to people or property resulting from any ideas, methods, instructions or products referred to in the content. |
© 2024 by the authors. Licensee MDPI, Basel, Switzerland. This article is an open access article distributed under the terms and conditions of the Creative Commons Attribution (CC BY) license (http://creativecommons.org/licenses/by/4.0/).
Copyright: This open access article is published under a Creative Commons CC BY 4.0 license, which permit the free download, distribution, and reuse, provided that the author and preprint are cited in any reuse.


