
Submitted:
08 February 2024
Posted:
09 February 2024
You are already at the latest version
Abstract
This work is concerned with studying the change of some Optical and Electrical Properties of BaxFe(1-x)TiO4 thin films due to the change of the nano crystal size. Simple theoretical explanation based on the string theory was developed. The empirical results obtained indicated that the absorption coefficient, electrical conductivity, and the magnetic permeability increase upon decreasing the nano crystal size. However, the transmission coefficient, and the refractive index increase upon increasing the nano crystal size. All these changes are explained using a simple string model with the aid of Newton's laws. The capability of the string theory to explain this nano quantum behavior comes from the fact that the string theory recognize both the particle and the wave nature of the nano system. This is similar of course to the quantum approach which is based mainly on the dual wave particle nature of atomic systems and entities.
Keywords:
Optical and Electrical Properties
; Perovskite Cells
; Thin Films
; String Theory
; Electrical Conductivity
; Nano Crystal Size
1. Introduction:
Physics is well known as one of the most vital branches of science that aims to make life easier. To achieve this goal new technologies were produced to that satisfy human needs. This is done by creating new technologies by changing the physical properties of matter. The wide spread of electronic devices and solar cells increased the importance of the optical and electrical properties of matter [1]. The optical properties like transmission, reflection and absorption of material are important for electronic devices as well as the solar cells. Although the electronic and the solar technologies are important, but the latter is more important and urgent. This comes from the fact that energy is the spirit that operate all devices and, equipment and instruments. One of the most preferable energy sources is the solar energy. This comes from the fact that it is almost available everywhere beside the fact that it is almost pollution free. The most popular solar energy technology is the one that converted solar energy to electricity. This comes from the fact that electric energy can be converted easily to other useful energy forms. For fabricating solar cells and light sensors [2], the optical and electric properties of matter are useful. These properties are even useful for other physical phenomena like super conductivity [3], in which properties like conductivity and electric permittivity [4] are used in fabricating magnetic trains, electrical and electronic devices. All these devices need energy to operate. Human needs to energy are recently increasing rapidly. Therefore, petroleum products are widely used to satisfy the human needs partially Scientists found that petroleum fuel causes severe biological hazards to people. This encourages researchers to try to improve the performance of the solar cells to be cheaper and more efficient [5,6]. The most commercially available one is the silicon solar cells. Unfortunately, silicon cells are expensive, having low efficiency with complex fabrication processes. This requires searching for new solar cells generations that are cheaper and more efficient. The so-called Nano solar cells are now widely paid attention of the scientists to replace silicon cells [7,8]. Different types of Nano cells are now fabricated, like polymer cells doped with dyes in addition to zinc and copper oxide cells [9]. The physical properties of these new generations depend on the so-called Nano science [10,11]. Nano science is a new branch of physics that takes care of the behavior of Nano materials. Nano materials are in the form of isolated particles having dimensions ranging from 1 up to 300 Nano meters. One Nano meter is equal to one over 1000 million meters. The laws of quantum mechanics can describe the behavior of such Nano materials [12,13]. The physical properties of Nano matter are different from that of the bulk matter.
Most promising one, which has high stability and gives a wide variety of structures and optoelectronic properties are perovskite materials. Perovskite materials are one of the promising materials that can replace silicon solar cells. Perovskite are characterized by its facilitating energy storage, and optoelectronic light electric conversion properties due to its superior photoelectric and catalytic properties.
The first generation of Perovskite is calcium titanium oxide or calcium titanate, with the chemical formula CaTiO3. All materials with the crystal structure as ABX3 structure are considered as a perovskite, where A and B are cations. A is usually an alkaline or rare earth element, B transition metals, and X is, anion may be oxide or halogen. One has two perovskite types, inorganic perovskite, and organic-inorganic hybrid perovskite.
The change of the physical properties of the perovskite materials results from the range of different energy crystal structures and chemical composition due to incorporating different alkaline earth, rare earth, and transition metal ions. among Perovskite material the one based on iron oxides look more promising due to the iron abundance in addition to their large magnetic moment. This encourages fabricating perovskite solar cells based on iron oxides by changing other elements and their concentrations to know the factors that affect the efficiency of the solar cells.
Different attempts were made to fabricate and to study the performance of perovskite solar cells. One of them was done by Yanking Zhu [14]. Recently, metal halide perovskite materials have attracted interest due to their ease fabrication processes and higher efficiency. Nowadays perovskite solar cells (PSCs) have high efficiency up to 25.7% and 31.3% for the perovskite-silicon tandem solar cells. Bilayer perovskite film composed of a thin low dimensional perovskite layer and a three-dimensional perovskite layer shows high efficiency and good stability conditions.
Anup Bist [15] in his work exhibit innovative methods such as surface passivation by precursor solutions, doping and composites increase stability. It is shown that only few materials that are used in the fabrication of perovskite can make it commercially available.
In the paper published by Sonali Mehra etal [16] he studied the behavior of halide perovskites, this work mainly focuses on synthesizing and evaluating the efficiency of methyl ammonium lead halide-based perovskite (MAPbX3; X=Cl, Br, I) solar cells. Preparation technique is based on the colloidal Hot-injection method (HIM) to synthesize MAPbX3 (X=Cl, Br, I) perovskites using the specific precursors and organic solvents under ambient conditions. The results obtained indicate that the particle size and morphology of perovskites vary with halide variation. The MAPbI3 perovskite has a low band gap and low carrier lifetime but has the highest efficiency among other halide perovskite samples. The conversion efficiency of the MAPbX3 perovskites has been evaluated through extensive device simulations. Here, the optical constants, band gap energy and carrier lifetime of MAPbX3 were used for simulating three different perovskite solar cells, namely I, Cl or Br halide-based perovskite solar cells. MAPbI3, MAPbBr3 and MAPbCl3 absorber layer-based devices showed efficiencies ~13.7 %, 6.9 % and 5.0 %.
The work done by Asma O. etal [17] is concerned with the performance of convention perovskite cells. They focused on cubic single crystals. Experimental observations using x- ray photoelectron spectroscopy results indicated that Valence band maximum values consists of states contributed by Br and Pb which agrees with simulation results based on the density functional theory. In the work done by George G. Njema [18], the deposition technique s, evaporation rate, type of solvents and temperature was shown to have significant effects on the degree of crystallization. This in turn affects the efficiency, which increases upon increasing the crystallization degree. The inorganic perovskite cells are found to be more efficient, with long stability lifetime and ease fabrication processes.
The research done by Saemi Takahashi [19] studied the effects of TiO2 interfacial morphology on perovskite solar cells by modifying micro and Nano surface roughness on the crystallinity of the perovskite layer. He found significant improvement of the crystal morphology. This increases the efficiency and reduced V-I hysterias.
Another useful work was done by Ningyu Ren etal, [20] the performance of polycrystalline perovskite was improved when adding small amounts of Cadmium Acetate (CdAc2) in the Pbl2 precursor solution. This results in Nano - hole array films and promotes crystal orientation. This suppresses the non-radiative recombination and results in long carrier lifetime and efficiency of 22.78%. It was also found that the tandem solar cells which is un encapsulate maintain 109.78% of the initial efficiency after 300 hr. at 45 C in nitrogen atmosphere.
The research of Sekai Tombe, etal [21] is concerned with the behavior of methylammonium (MA) lead halide derivatives MSPb3-xYx (Cl, Br, I). The energy band width is dependent on the halide type (Cl, Br, I) and its concentration. The r
work done by Masha Moradbeigi [22] aims to make perovskite cells commercially available. This is done by using simulation. In this work polyethylene terephthalate (PET) is used as a substrate. Plasma polymer fluorocarbon (PPFC) coating is suggested as anti-reflecting layer (ARL). The self-cleaning property was provided by PPFC. The results obtained indicated that four terminal tandem solar cells have high efficiency of 30.14%.
The work done by Nisar Ali, etal [23] is concerned with the attempts made by different researchers to improve the performance of perovskite materials in addition to also improve the stability, validity, consistency, and reproducibility. These attempts studied the effects of solvent, interface, and structure engineering leading toward increasing efficiency to exceed 25.4%. The paper also investigates the device instability and its role in limiting the practical applications of the hybrid perovskite solar cell. This review provides a summary of the developments to resolve these issues with the uses of different synthesis routes and materials to obtain a stable ABX3 type structure of the perovskite materials. This review also includes the effects of electron transport layer on hysteresis phenomenon and long-term stability. A comprehensive discussion on the crystal structure, energy level, absorption coefficient, degradation and chemical bonding in perovskite solar cell materials are also investigated.
2. Theoretical model based on the string theory:
The intensity I of the wave can be found in terms of the wave function and the imaginary part of the wave number to be
Consider small particle of mass m moving and vibrating with velocity v, and with force constant k in moving in a resistive medium having coefficient of friction . Its equation of motion is given by.
One can solve this equation by suggesting the electrons as strings. Thus, the velocity v is given to be.
According to the relation of velocity with the acceleration a and displacement , one gets.
Using Equations (5) and (6) in Equation (3) yields,
Multiplying both sides by gives,
Rearranging and using the fact that.
gives
Hence
Therefore, the velocity can be written in a complex from
The current density J is found to be related to the velocity and the conductivity according to the relationship.
The momentum p is also related to the velocity and the wave number according to the relationship.
The wave number and the conductivity can be written in a complex from to be.
Thus, according to Equations (12), (14) and (15) the imaginary part of the wave number is given to be.
Equations (12), (13) and (15) give the real conductivity to be.
For very small mass m and for the high applied frequency compared to the natural frequency
Thus, the imaginary wave number in Equation (16) reduces to be.
While the conductivity in Equation (17) becomes
Taking the nano crystal size to be equal to the atomic radius assuming the proportionality constant to be equal one for simplicity, one gets
But the velocity is related to the frequency and the atomic radius and the crystal size according to the relationship.
Hence one gets the absorption coefficient and the transmission coefficient T to be.
Where the absorption coefficient takes the form
The coefficient of friction is related to the mass m and the relaxation time to be in the form.
The relaxation time can also be expressed in terms of the distance d and the velocity to be.
Thus, the conductivity is given to be.
One can relate the electrical force of the nucleus of the atom to the centrifugal force according to the relationship.
Thus, the velocity is given to be.
Thus, the refractive index takes the form.
Where,
Using the relationship
The magnetic permeability is also given by,
3. Materials and method:
The (BaxFe 1-x TiO4) (x=1, 0.1, 0.2, 0.3, 0.5, 0.6, 0.7,08, 0.9 and 0) thin films were prepared utilizing the sol- gel method. Barium nitrate [Ba (NO3)2]], Iron (III) nitrate [Fe (NO3)3.9H2O]. Titanium oxide was dissolved in a distilled water as, where the PH was adjusted using nitric acid to less than 5 pH meters. Barium nitrate and iron nitrate were weighted separately, where each one followed by the addition of suitable quantity of distilled water to make solution, which was stirred and heated after pH was adjusted to 5.0 at 70 degrees centigrade for one hour. Then the two solutions were mixed and added to 3.0g of titanium oxide. The resulting mixture was heated and stirred at 70 degrees centigrade continuously about one hour, then deposited for one day t and filtered. The solution was slowly evaporated to form sol gel by continues heat treatment convert to convert it to gel at 150 degrees centigrade after two hours. The gel was then dried and grinded to powder. The nano structure, optical and electrical properties were determined using XRD and UV-vis spectrometer.
4. Results and Discussion:
The work done by Amira [24] has been developed and used in this work to see how some optical and electrical properties of the thin films BxFe(1-x)TiO4 can be linked and explained theoretically. According to empirical relation in Figure 11 the refractive index increases upon increasing the crystal size.
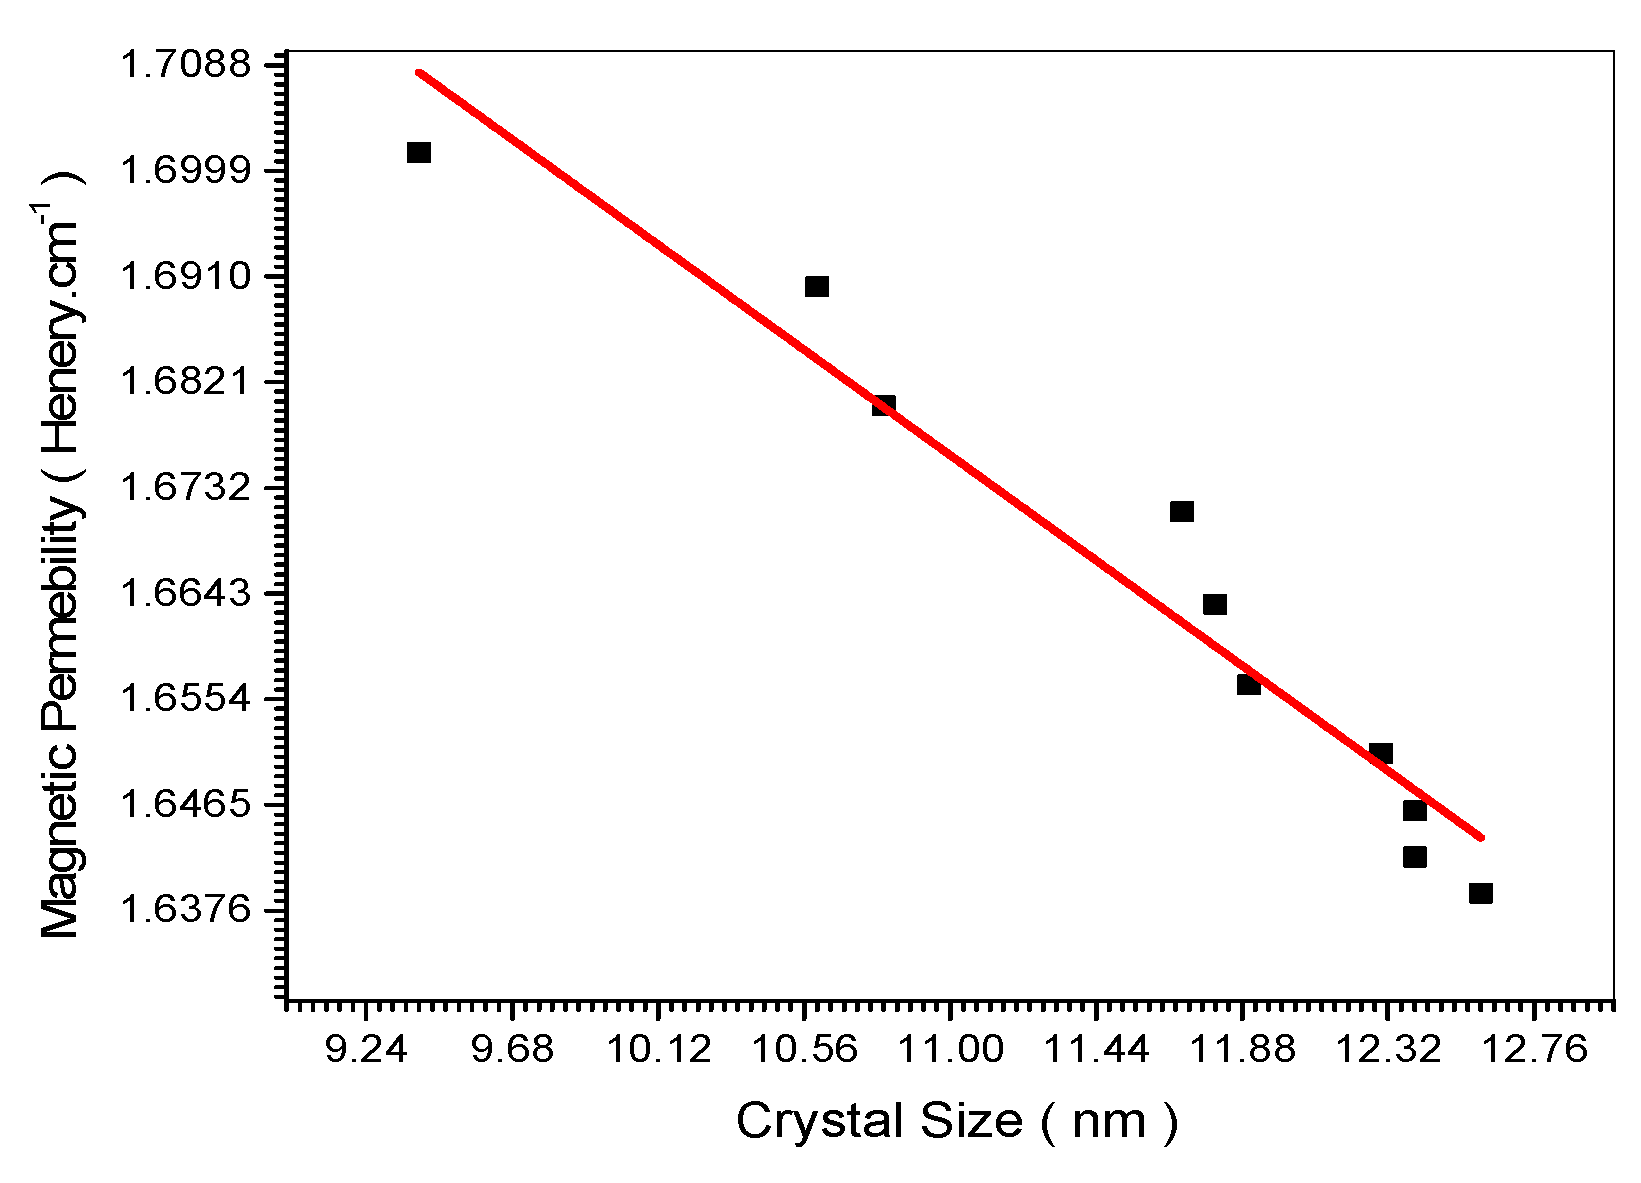
This is confirmed theoretically in Equation (32). The experimental curve in Figure 12 which shows the increase of transmission with the increase of the nano crystal size is explained theoretically in Equations (23) and (24). Figure 13 and Figure 14 indicated experimentally the decrease of the absorbance and absorption coefficient with the increase of the nano crystal size. This is confirmed theoretically in equation (24). The electrical conductivity decreases upon increasing the nano crystal size as the empirical curve indicated in Figure 17. This is confirmed theoretically in Equation (27). The empirical relation in Figure 18 showed decrease of the magnetic permeability upon increasing the nano crystal size. This is confirmed theoretically in Equation (34).
The present work showed change of absorption coefficient, transmitivity, conductivity, refractive index upon changing the nano size. This agrees with the work of Anup Bist [15] which indicated that changing nano structure like surface passivation increases stability. Mehra paper [16] confirm our results which indicated that halide variation changes the band gap which is related to the absorption coefficient. The change of halide doping (Cl, Br, I) Changes the band gap which becomes lower for I. George G.Njema [18] also obtained the same foundations, since it indicated that increasing crystallization degree increases efficiency which is related to the absorption coefficient and conductivity. The same results were found by Saemi Takahashi [19] where improving degree of crystallization increases the efficiency. Similarly, Ningya Ren [20] showed that increase of crystal orientation increases the efficiency. The paper of Sekai Tombe [21] also indicated as in our work that changing the nano structure by changing the halide doping element changes the band gap width which changes the absorption coefficient. The work of Nisar Ali [23] which exhibits researcher s attempts to improve the perovskite performance. The paper indicated that the nano size is one of the factors that affect cells efficiency.
Figure 1.
XRD spectrum of all (Ba x Fe (1-x) Ti O4) samples.
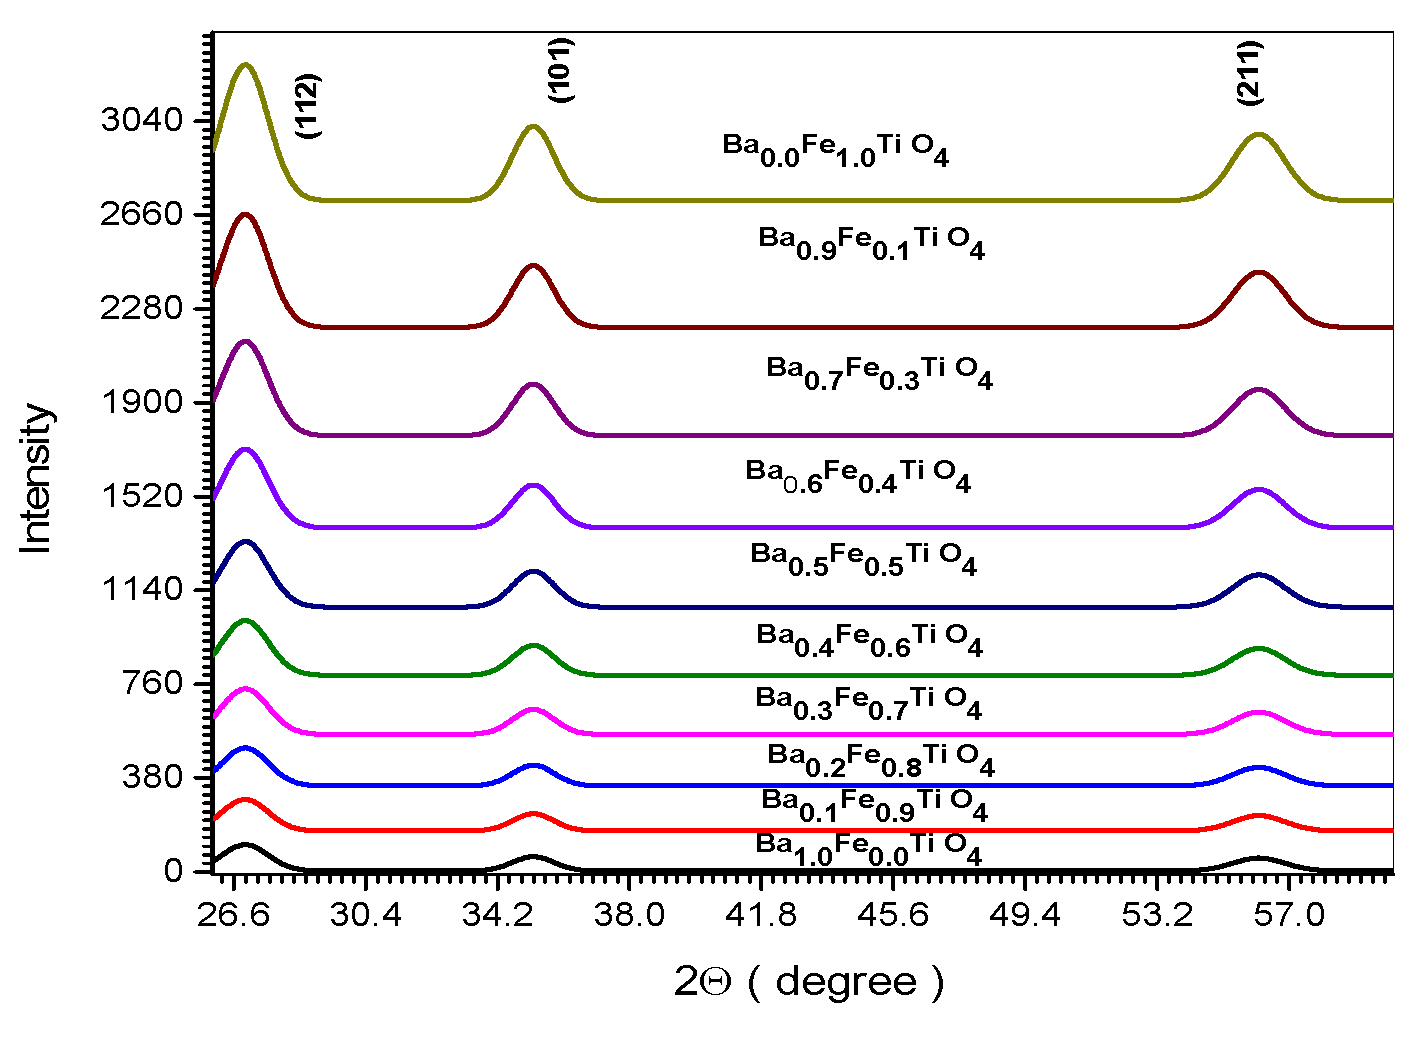
Figure 2.
Absorbance spectrum of all (Ba x Fe (1-x) Ti O4) samples.
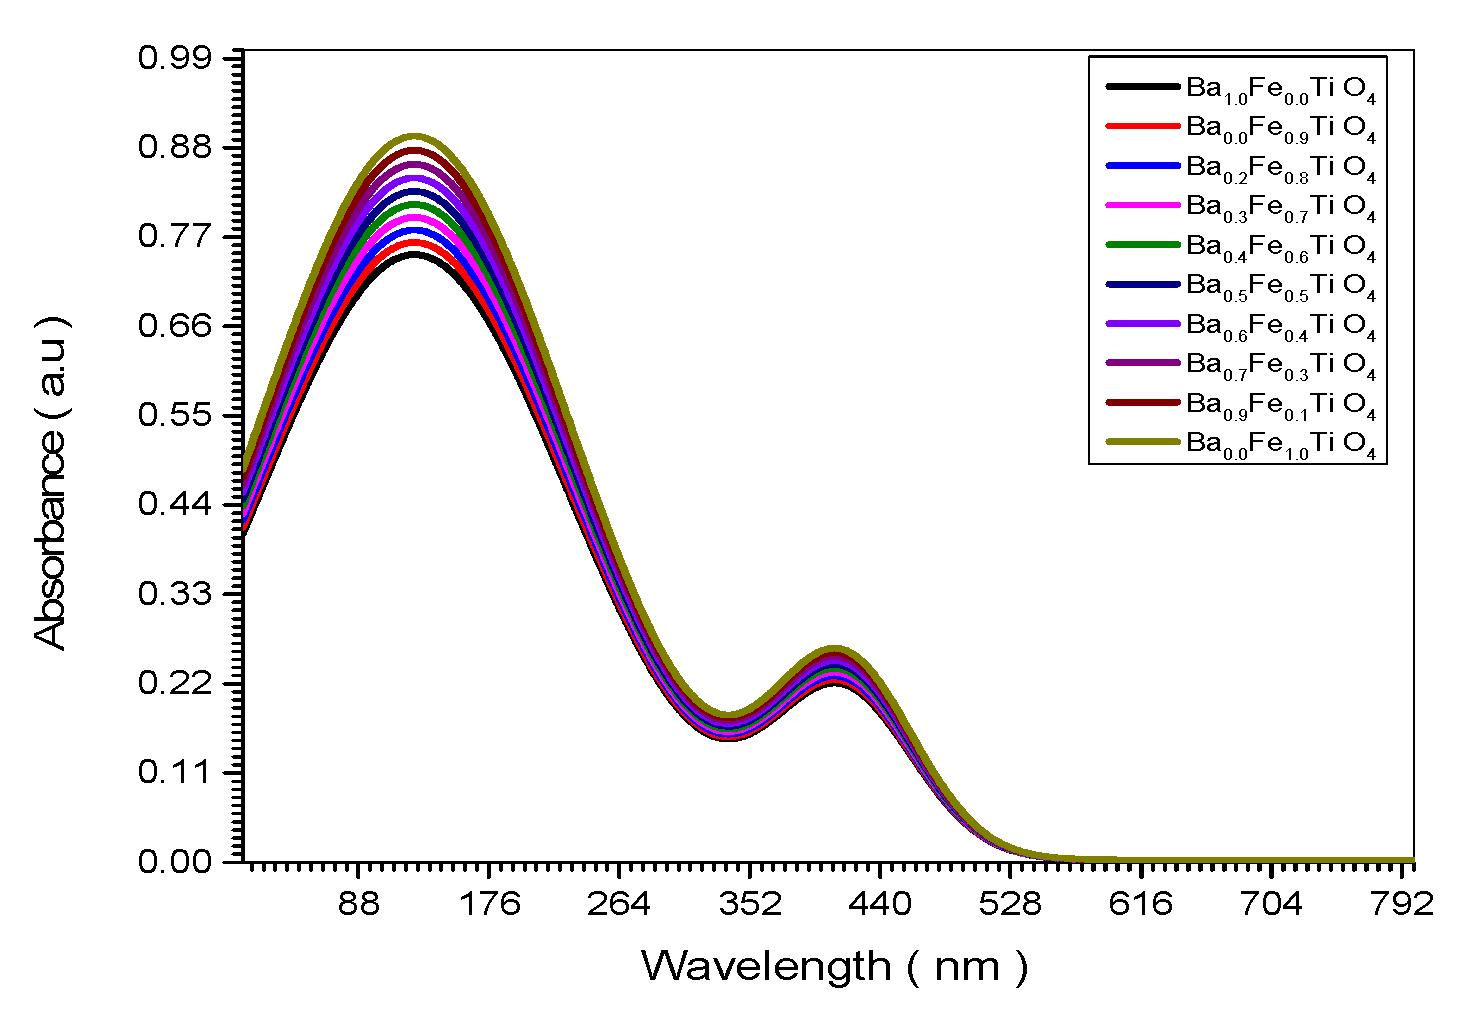
Figure 3.
Absorption Coefficient spectrum of all (Ba x Fe (1-x) Ti O4) samples.
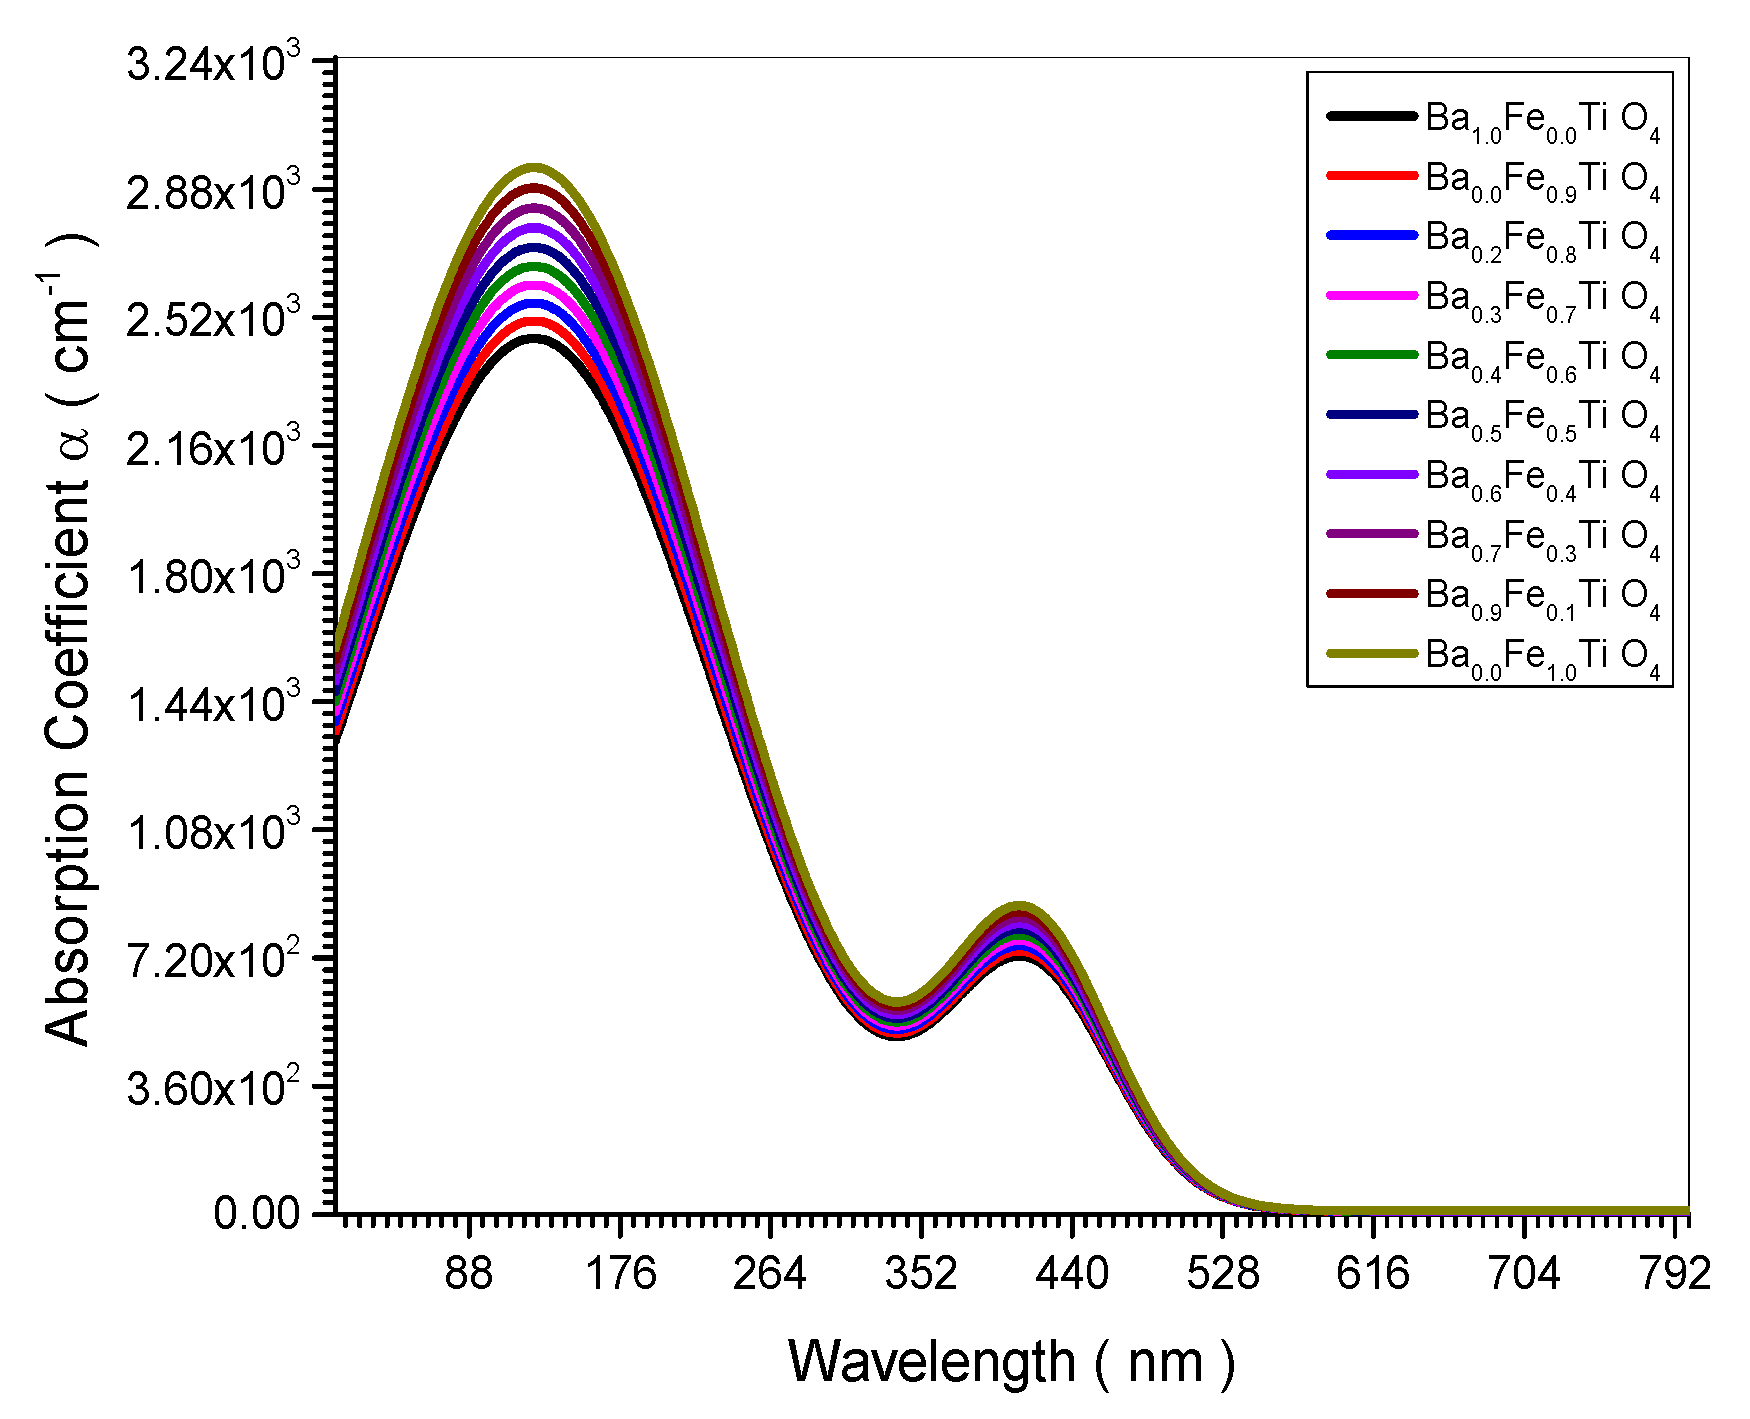
Figure 4.
Absorption Coefficient spectrum of all (Ba x Fe (1-x) Ti O4) samples.
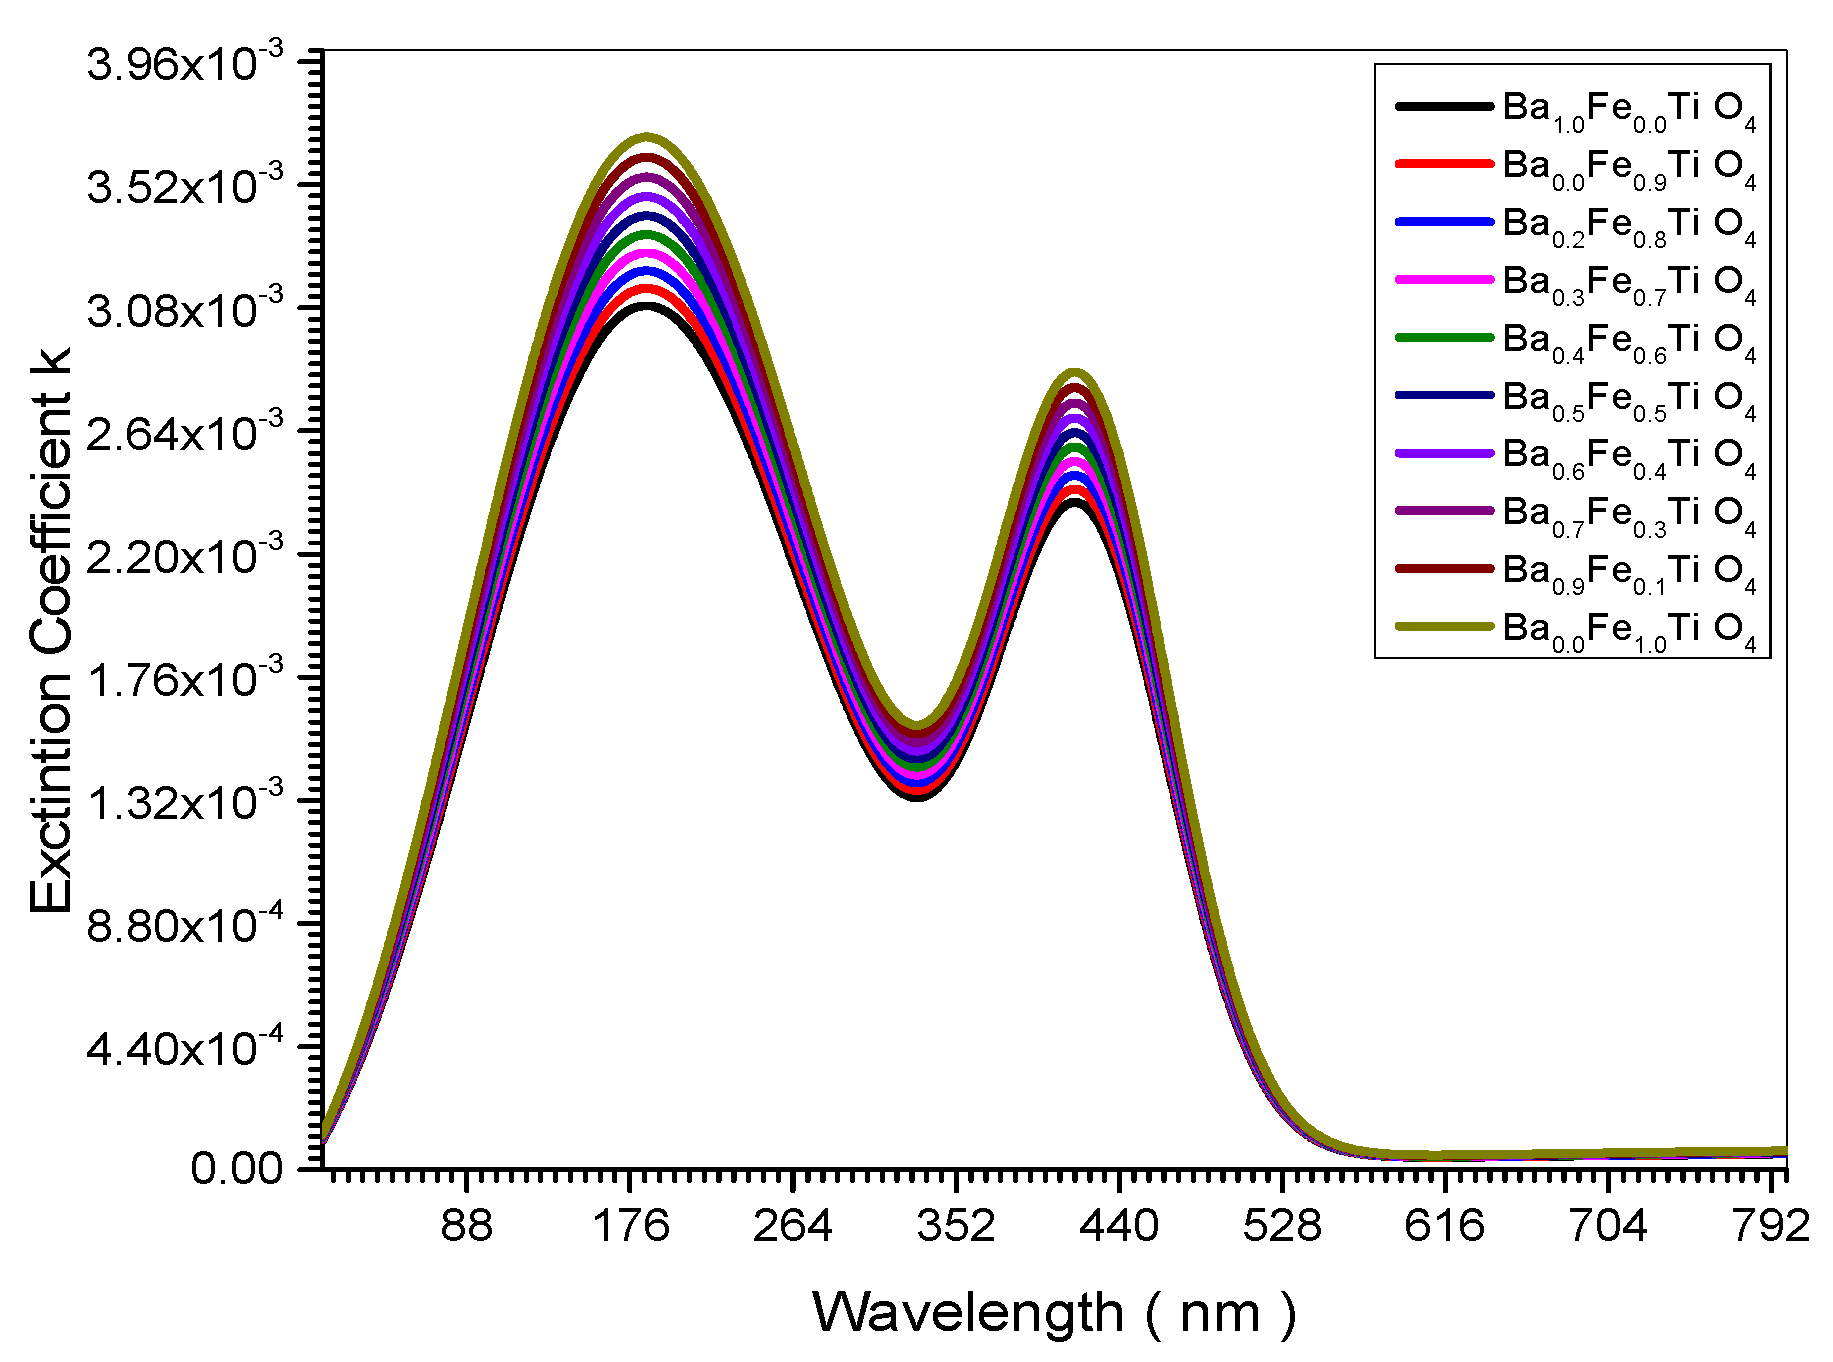
Figure 5.
Transmissions spectrum of all (Ba x Fe (1-x) Ti O4) samples.
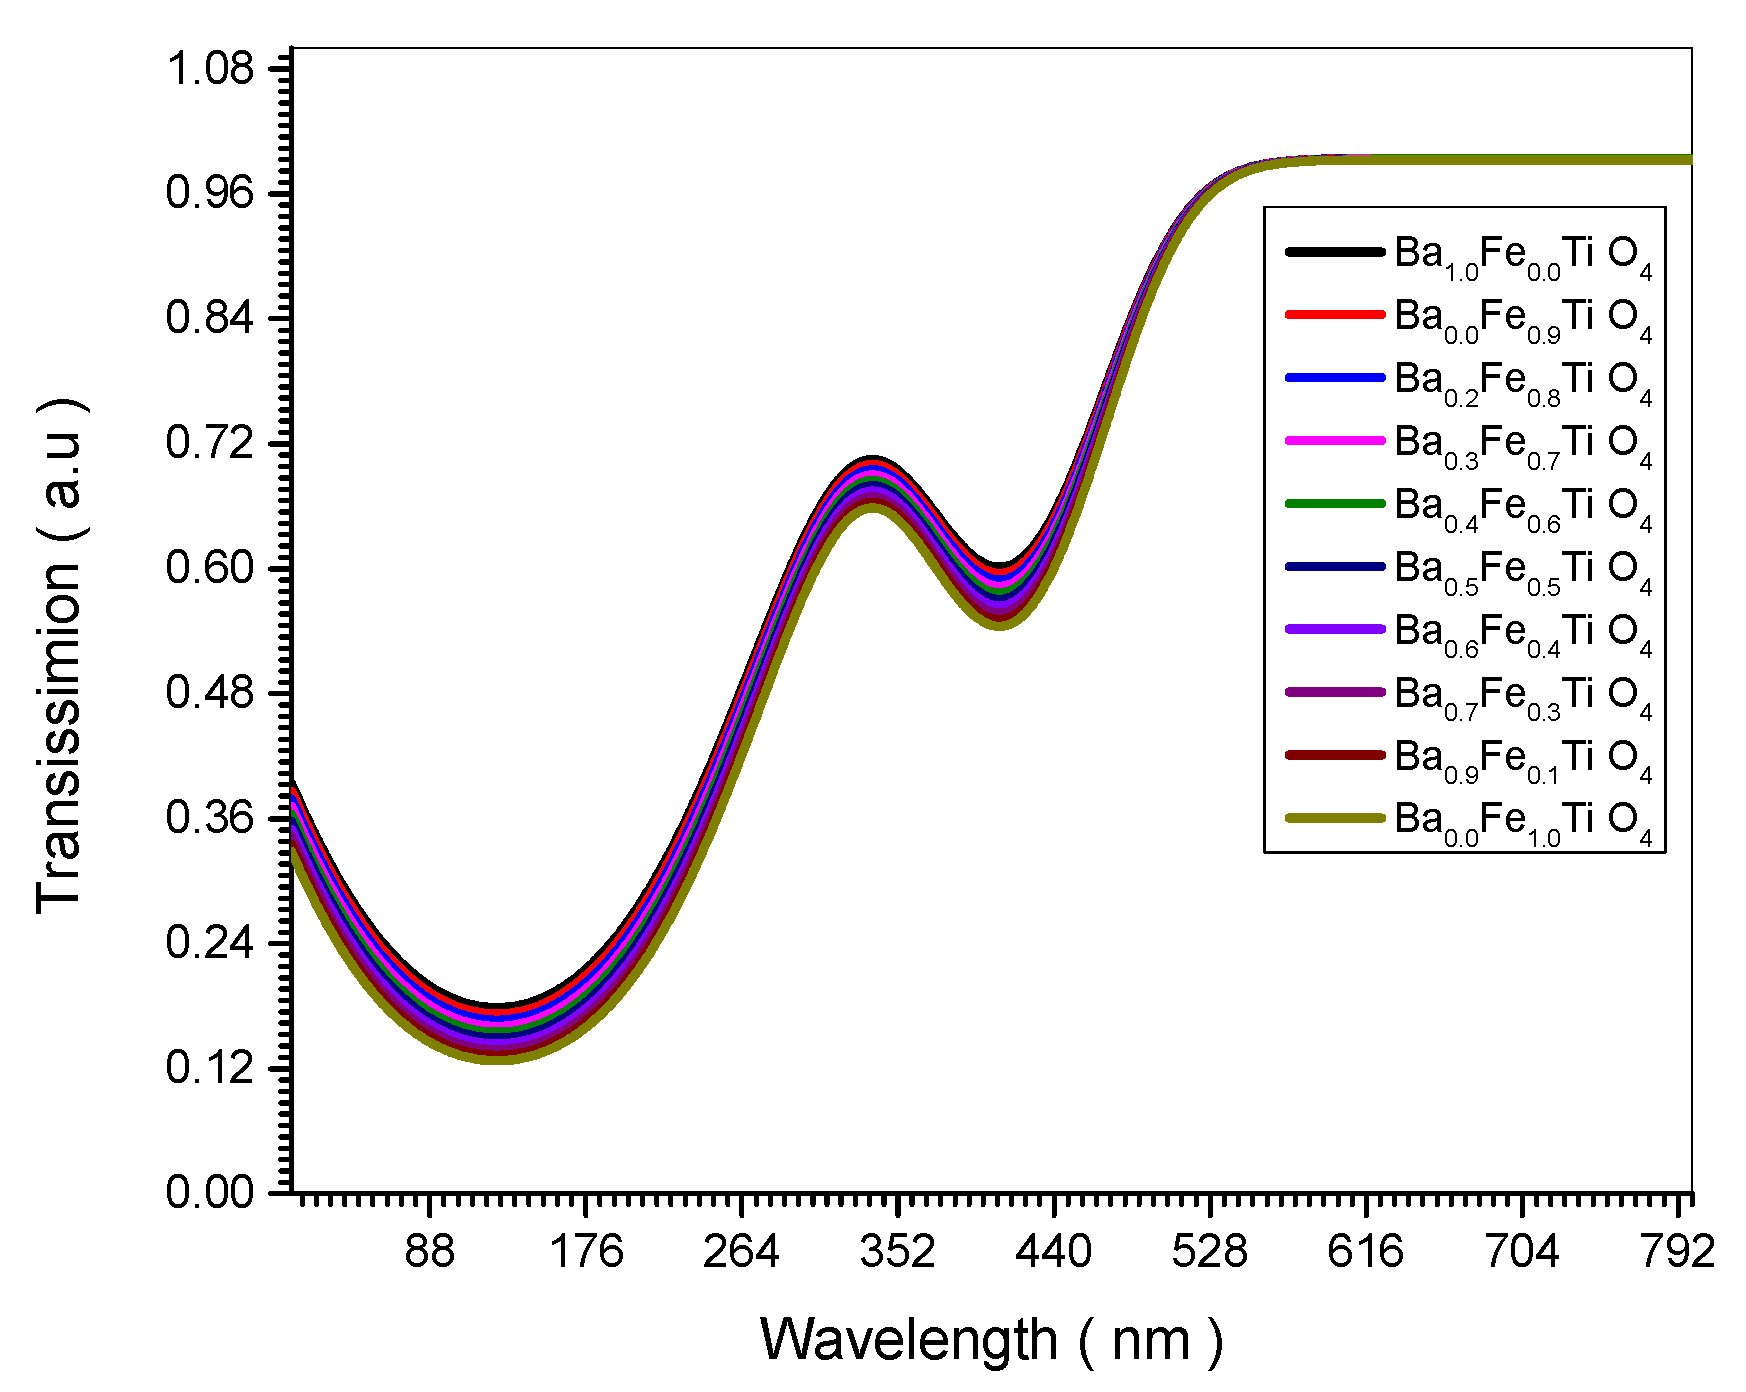
Figure 6.
Reflection spectrum of all (Ba x Fe (1-x) Ti O4) samples.
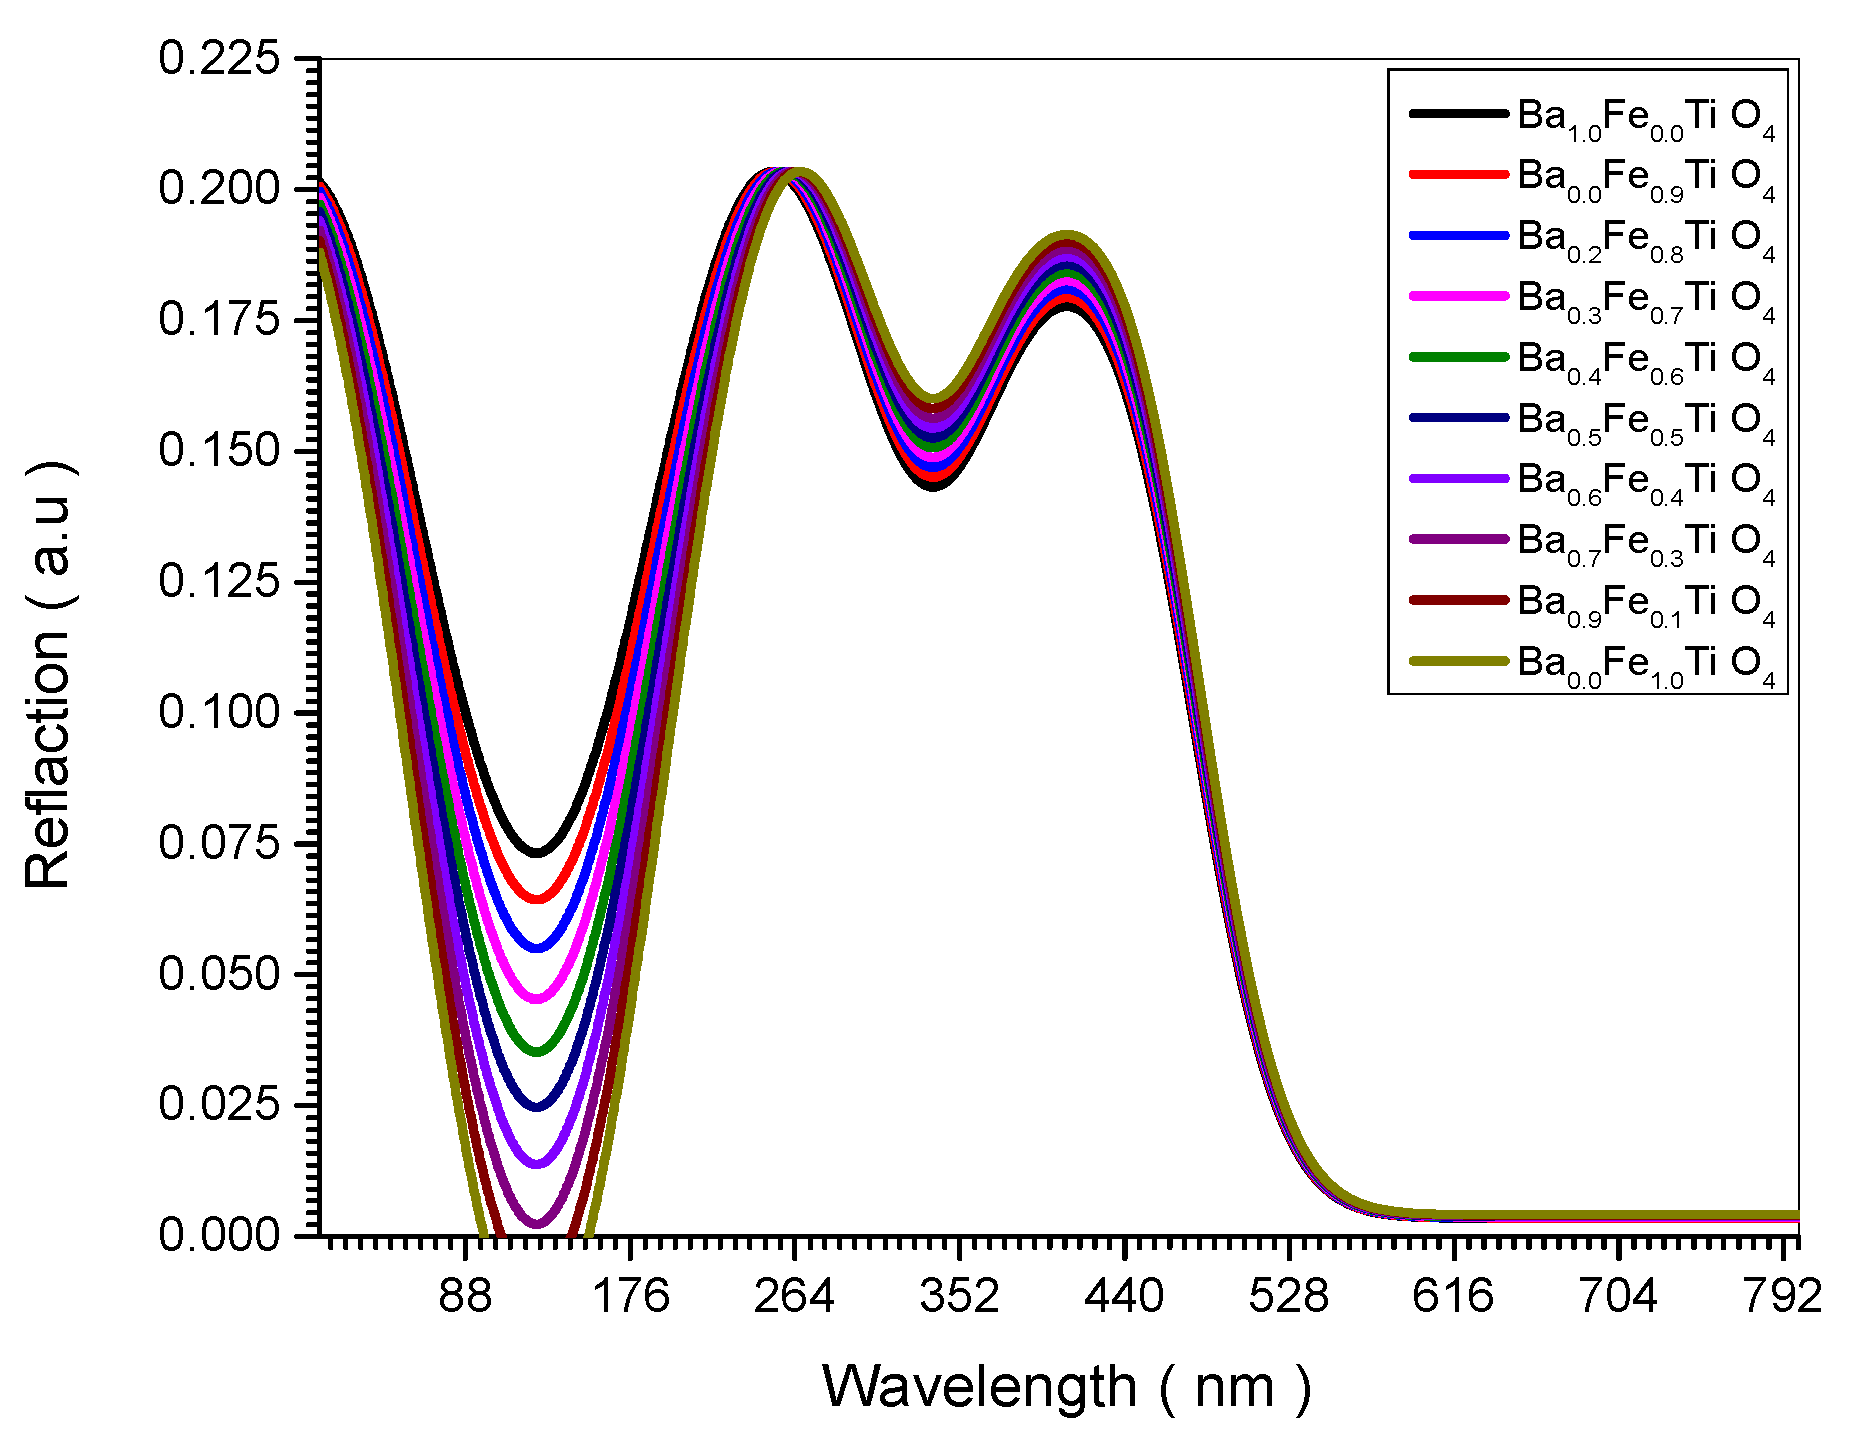
Figure 7.
Refractive Index spectrum of all (Ba x Fe (1-x) Ti O4) samples.
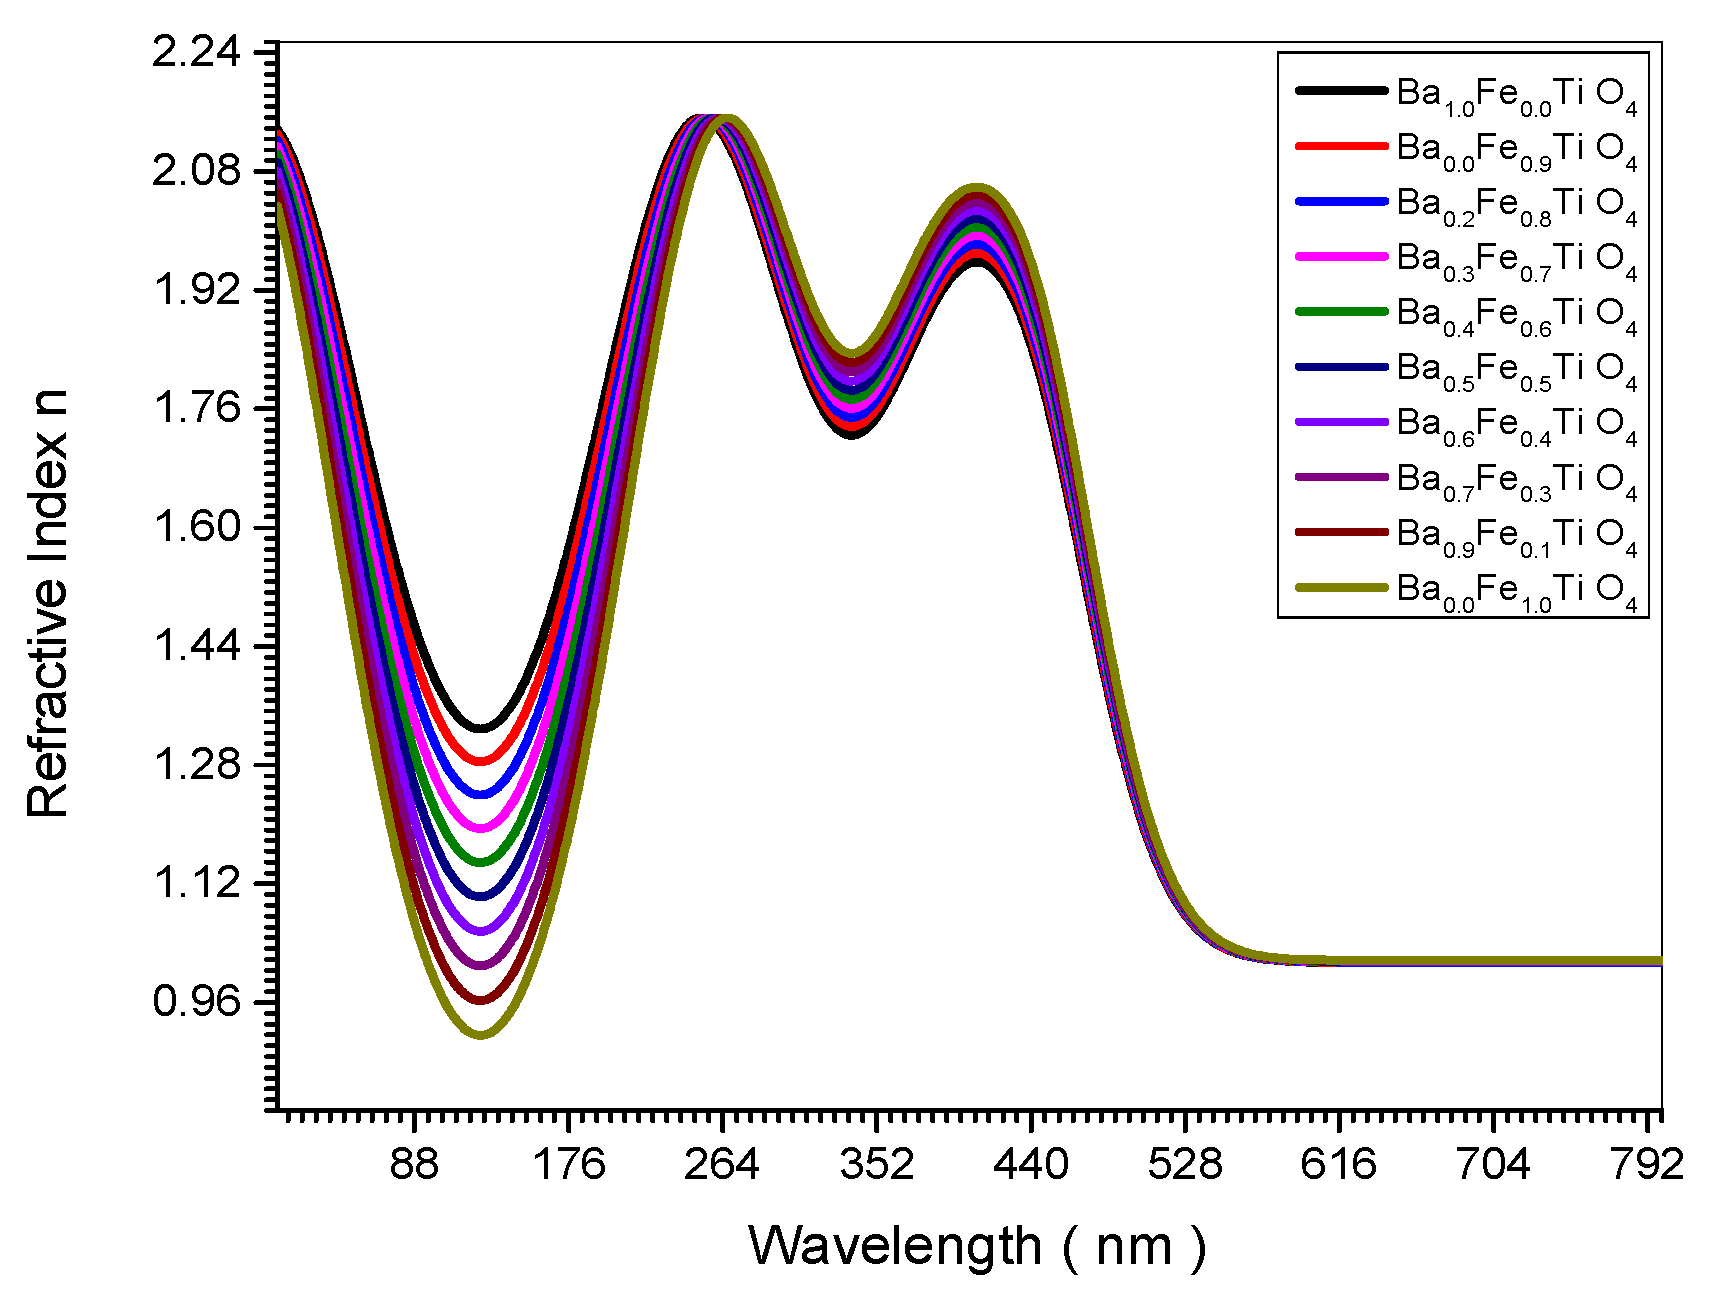
Figure 8.
Optical Conductive spectrum of all (Ba x Fe (1-x) Ti O4) samples.
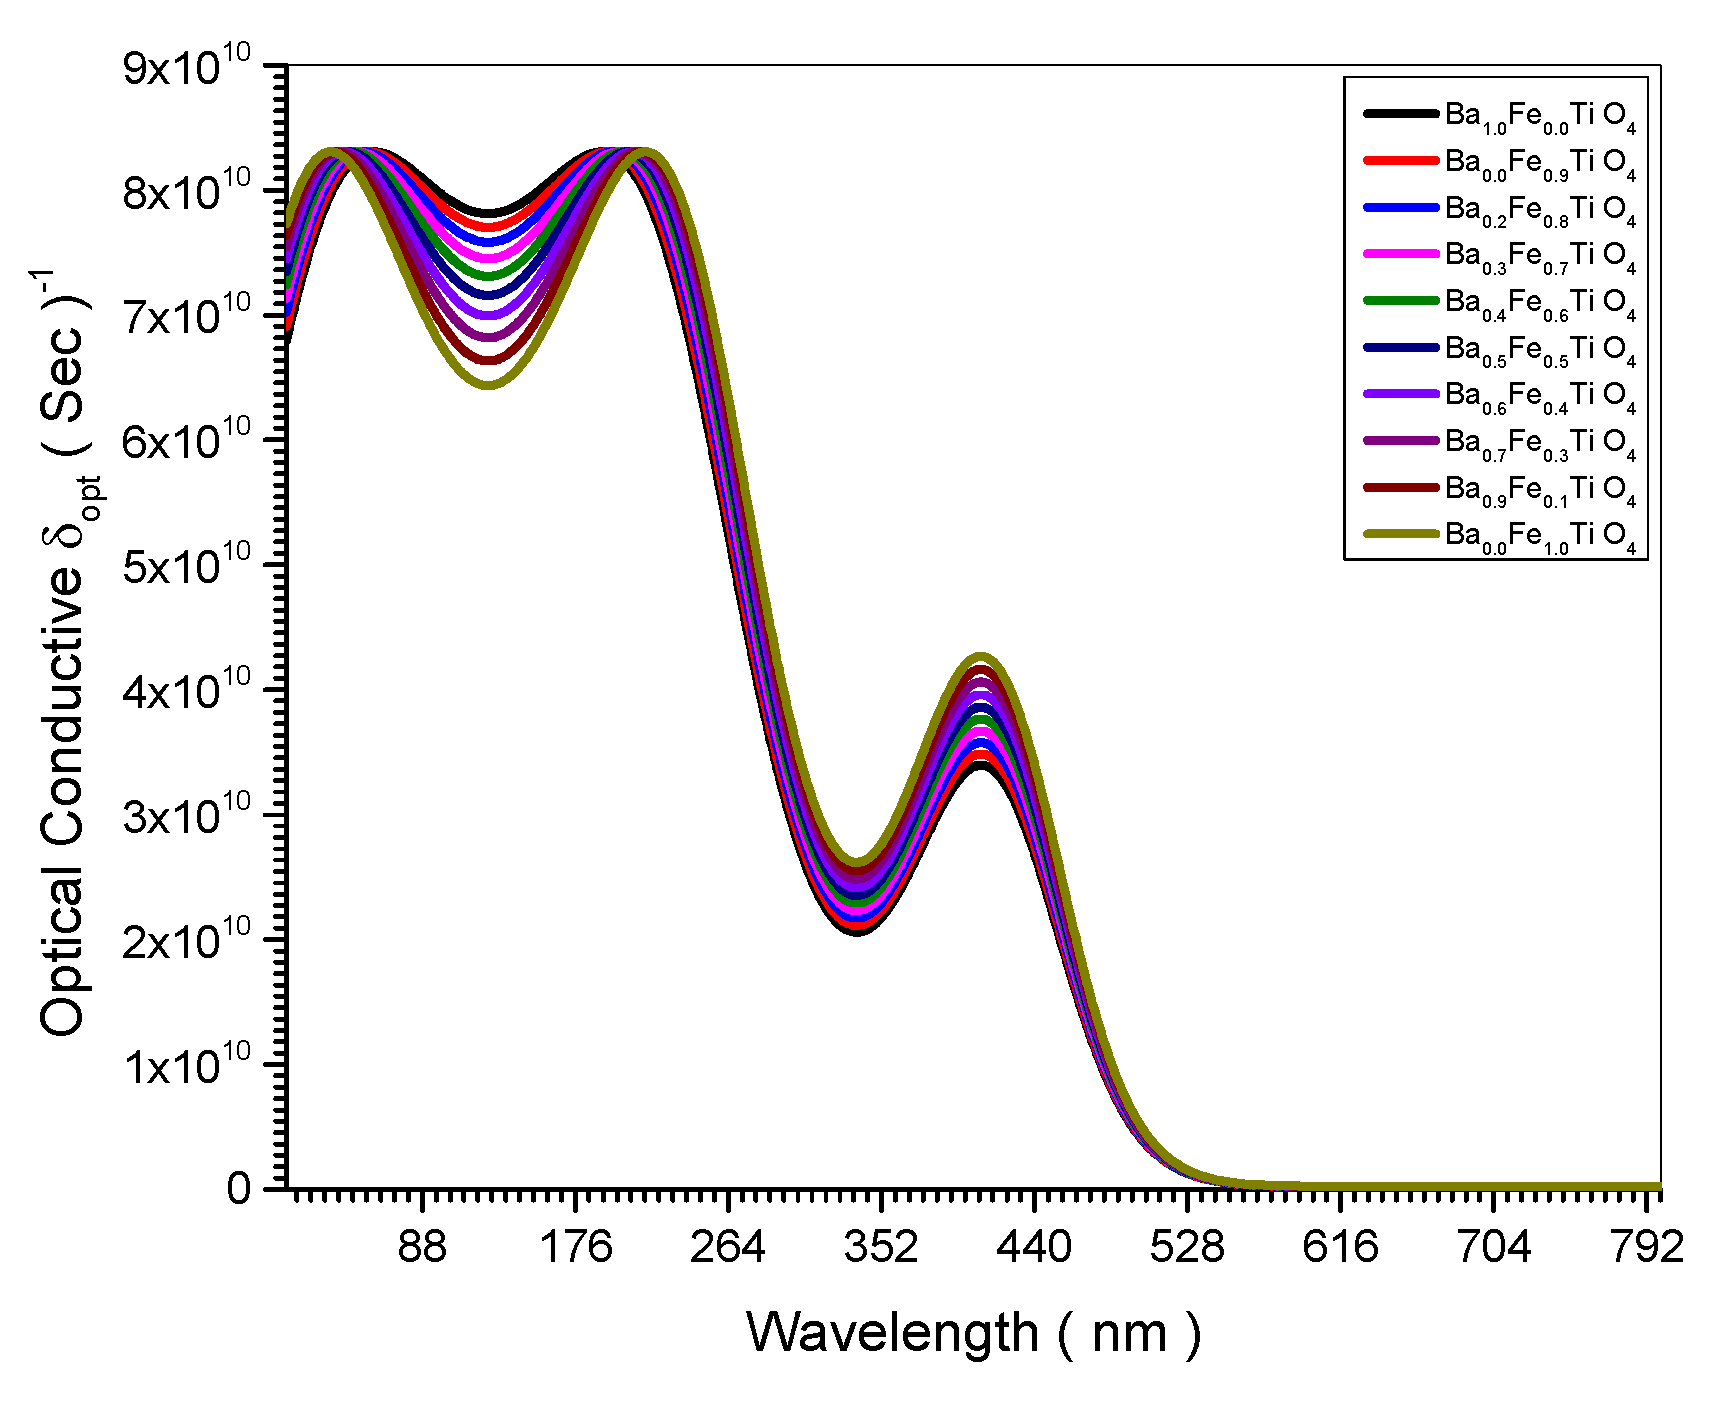
Figure 9.
Electrical Conductive spectrum of all (Ba x Fe (1-x) Ti O4) samples.
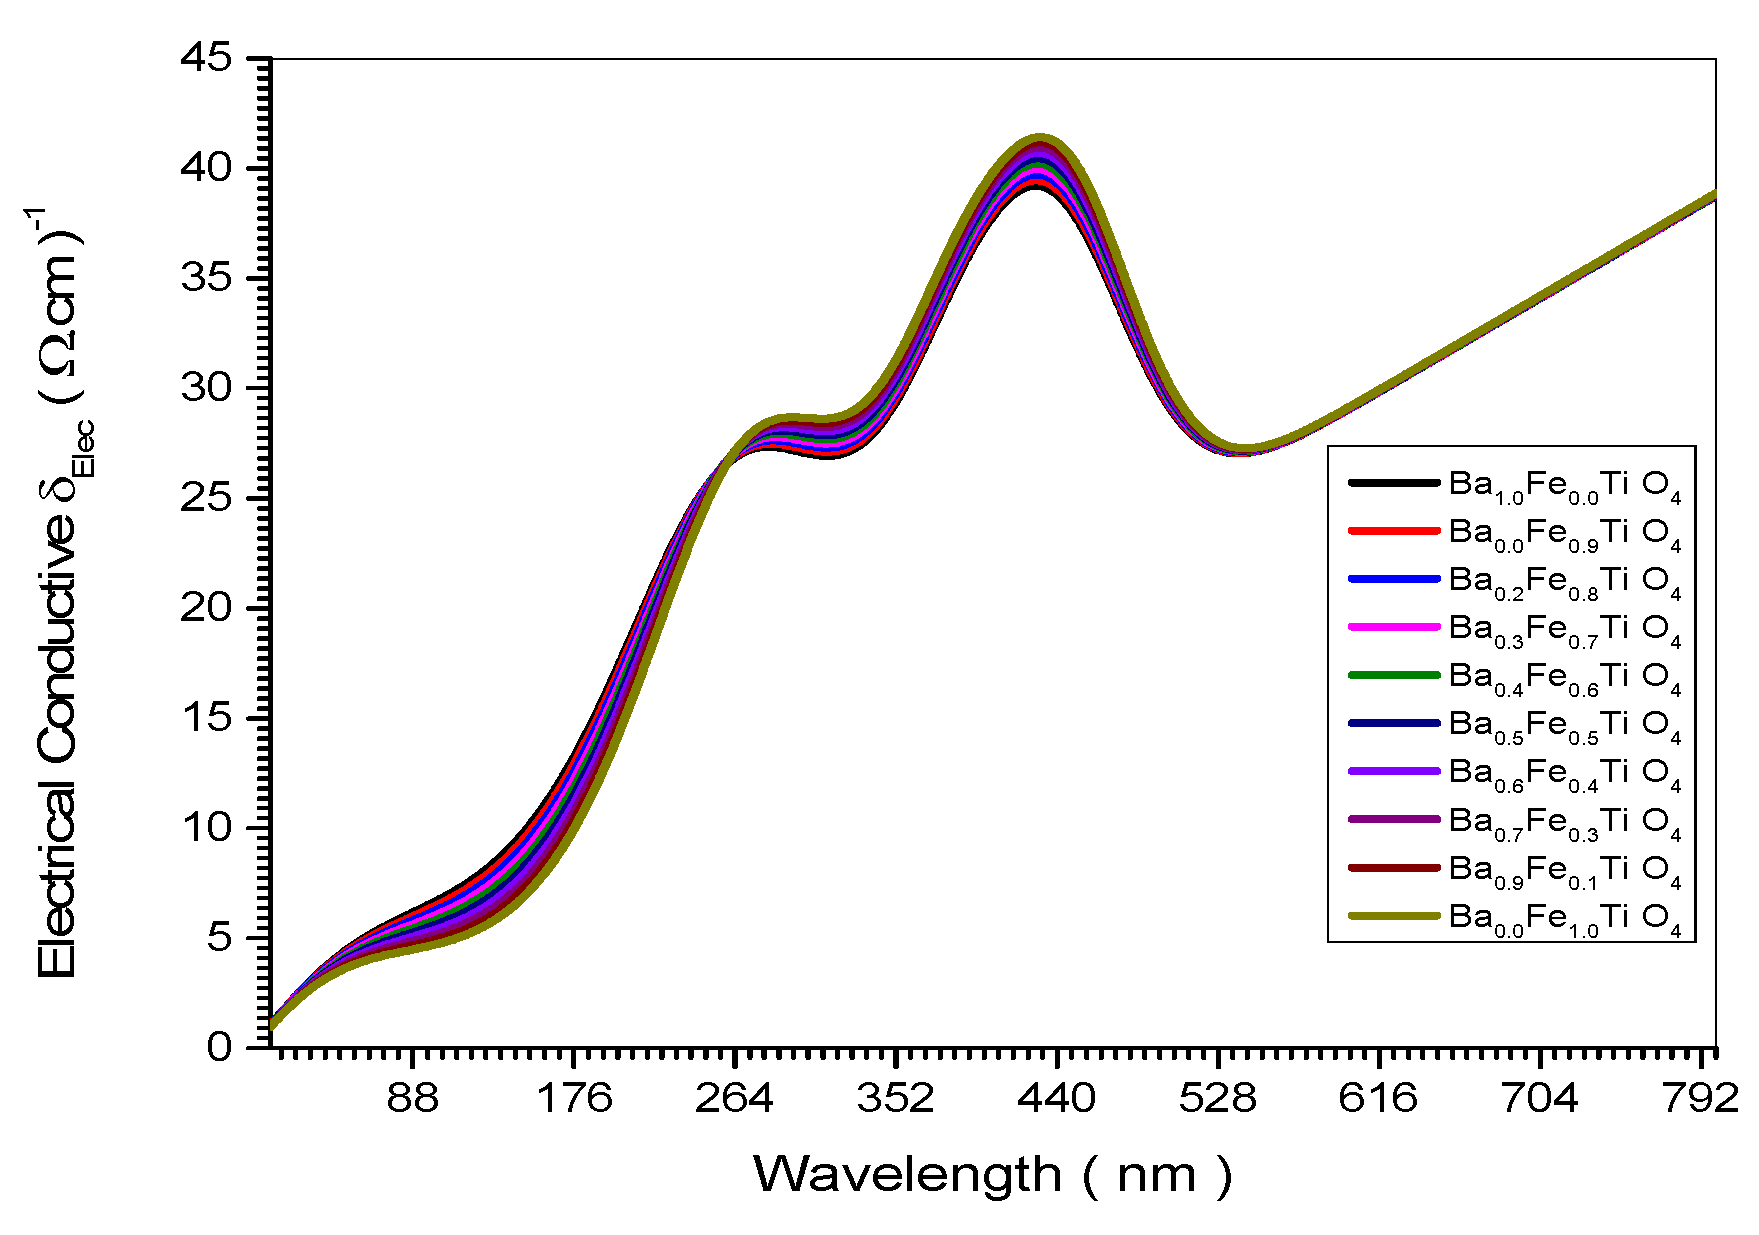
Figure 10.
Magnetic Permeability spectrum of all (Ba x Fe (1-x) Ti O4) samples.
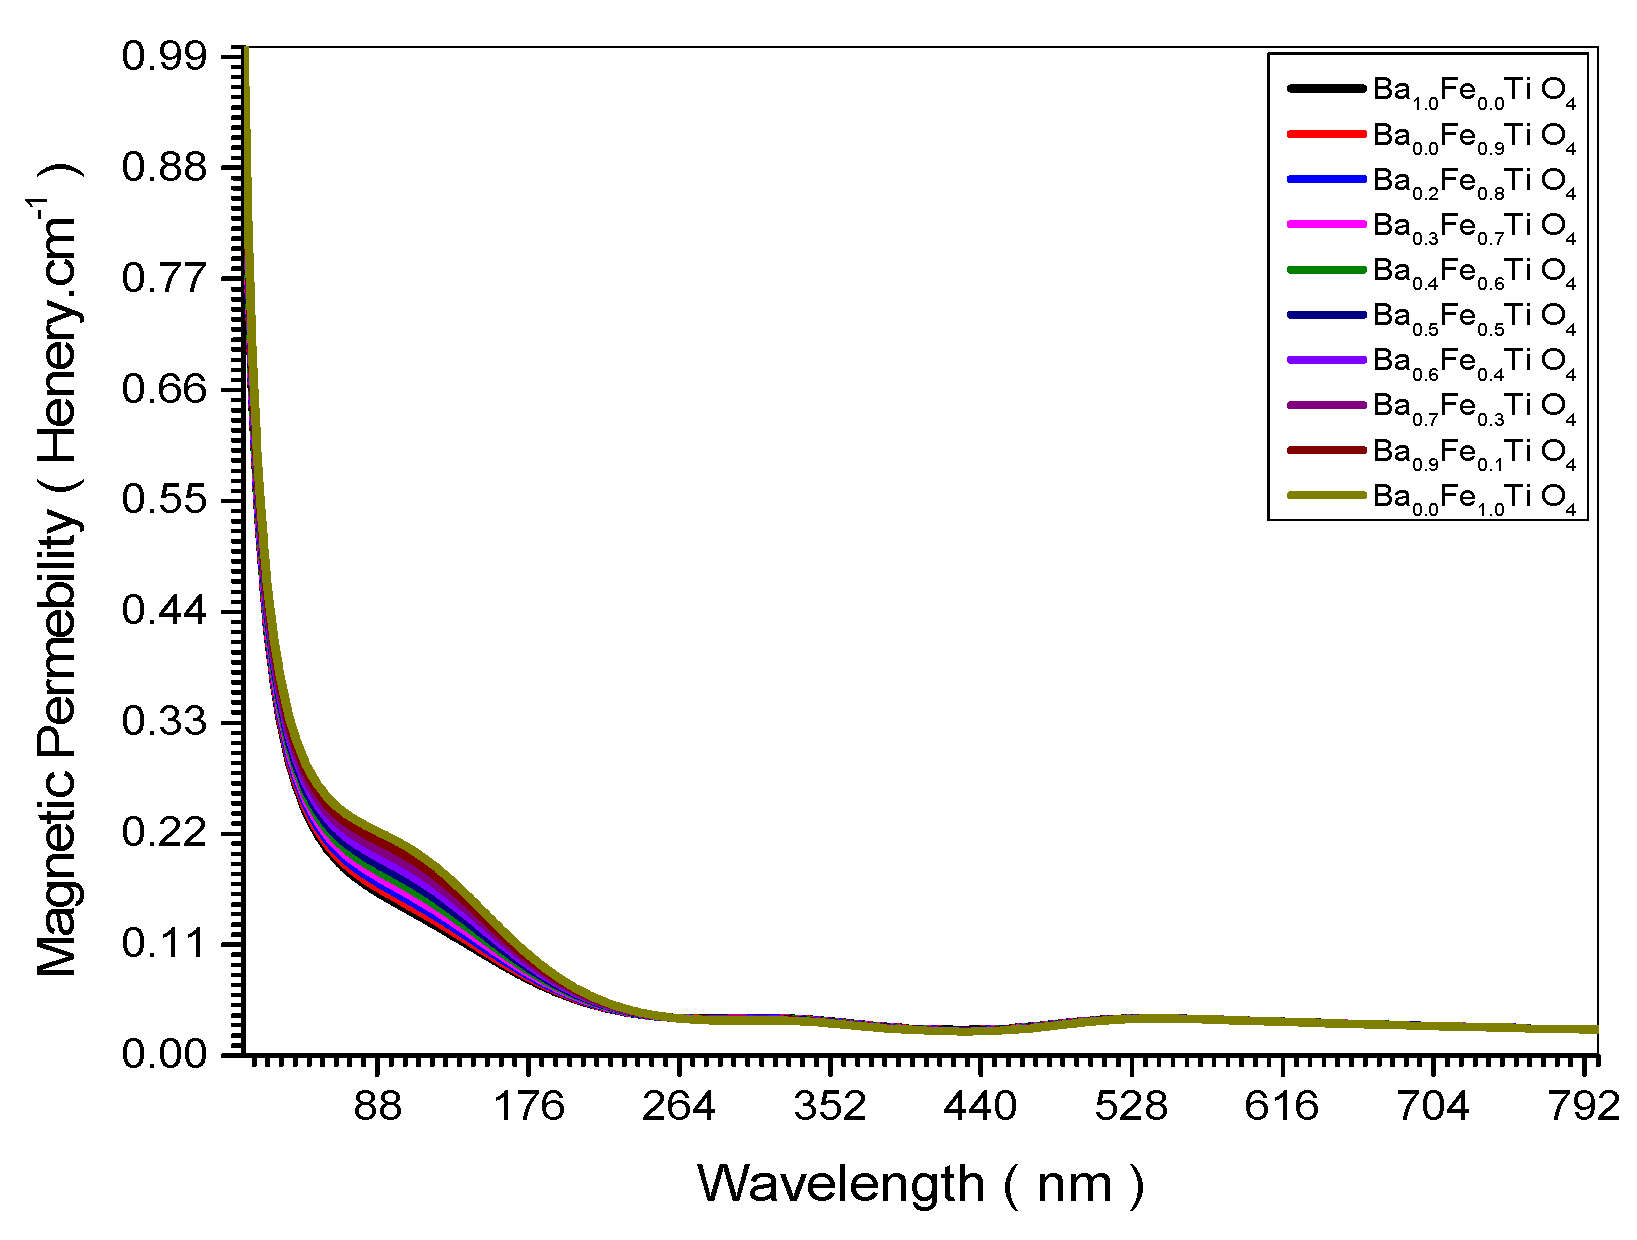

Table 1.
some crystallite lattice parameter (Xs (nm) and d – spacing) of (Ba x Fe (1-x) Ti O4) (1, 0.1, 0.2, 0.3, 0.5, 0.6, 0.7,08 and 0) Molar and Maximum optical properties value (Absorbance, Absorption Coefficient, Extinction Coefficient, Reflection, Refractive Index and Transmissions).
Table 1.
some crystallite lattice parameter (Xs (nm) and d – spacing) of (Ba x Fe (1-x) Ti O4) (1, 0.1, 0.2, 0.3, 0.5, 0.6, 0.7,08 and 0) Molar and Maximum optical properties value (Absorbance, Absorption Coefficient, Extinction Coefficient, Reflection, Refractive Index and Transmissions).
| Sample | Absorbance (a.u) | Absorption Coefficient ( cm-1) | Extinction Coefficient k | Reflection ( a.u ) | Refractive Index | Transmissions (a.u) | Xs(nm) | d-spacing |
|---|---|---|---|---|---|---|---|---|
| Ba0.0Fe1.0TiO4 | 0.74814 | 806.69706 | 0.00309 | 0.20349 | 2.15244 | 0.99378 | 12.6 | 2.5861 |
| Ba0.1Fe0.9TiO4 | 0.7631 | 2461.38143 | 0.00315 | 0.20349 | 2.15244 | 0.99365 | 12.4 | 2.5860 |
| Ba0.2Fe0.8TiO4 | 0.77837 | 2510.60905 | 0.00321 | 0.20349 | 2.15244 | 0.99352 | 12.4 | 2.5859 |
| Ba0.3Fe0.7TiO4 | 0.79393 | 2560.82124 | 0.00328 | 0.20349 | 2.15244 | 0.9934 | 12.3 | 2.5858 |
| Ba0.5Fe0.5TiO4 | 0.80981 | 2612.03766 | 0.00334 | 0.20349 | 2.15243 | 0.99326 | 11.9 | 2.5856 |
| Ba0.6Fe0.4TiO4 | 0.82601 | 2664.27841 | 0.00341 | 0.20349 | 2.15242 | 0.99313 | 11.8 | 2.5455 |
| Ba0.7Fe0.3TiO4 | 0.84253 | 2717.56398 | 0.00348 | 0.20349 | 2.15242 | 0.99299 | 11.7 | 2.5433 |
| Ba0.8Fe0.2TiO4 | 0.85938 | 2771.91526 | 0.00355 | 0.20349 | 2.15242 | 0.99285 | 10.8 | 2.5432 |
| Ba0.9Fe0.1TiO4 | 0.87657 | 2827.35357 | 0.00362 | 0.20349 | 2.15241 | 0.99271 | 10.6 | 2.5431 |
| Ba10Fe0.0TiO4 | 0.89410 | 2883.90064 | 0.00369 | 0.20349 | 2.15242 | 0.99257 | 9.4 | 2.5430 |
Table 2.
some crystallite lattice parameter (Xs (nm) and d – spacing) of (Ba x Fe (1-x) Ti O4) (1, 0.1, 0.2, 0.3, 0.5, 0.6, 0.7,08 and 0) Molar and Maximum physical properties value.
Table 2.
some crystallite lattice parameter (Xs (nm) and d – spacing) of (Ba x Fe (1-x) Ti O4) (1, 0.1, 0.2, 0.3, 0.5, 0.6, 0.7,08 and 0) Molar and Maximum physical properties value.
| Sample | Optical Conductive ( 10 10 Sec ) -1 | Electrical Conductive ( Ω.cm ) -1 | Magnetic Permeability ( Henery.cm-1) | Xs(nm) | d-spacing |
|---|---|---|---|---|---|
| Ba0.0Fe1.0TiO4 | 8.30733 | 39.21728 | 1.63904 | 12.6 | 2.5861 |
| Ba0.1Fe0.9TiO4 | 8.30733 | 39.4708 | 1.64209 | 12.4 | 2.5860 |
| Ba0.2Fe0.8TiO4 | 8.30734 | 39.72292 | 1.646 | 12.4 | 2.5859 |
| Ba0.3Fe0.7TiO4 | 8.3073 | 39.97391 | 1.65083 | 12.3 | 2.5858 |
| Ba0.5Fe0.5TiO4 | 8.30732 | 40.22262 | 1.6566 | 11.9 | 2.5856 |
| Ba0.6Fe0.4TiO4 | 8.30728 | 40.46884 | 1.66337 | 11.8 | 2.5455 |
| Ba0.7Fe0.3TiO4 | 8.30734 | 40.71322 | 1.67118 | 11.7 | 2.5433 |
| Ba0.8Fe0.2TiO4 | 8.30733 | 40.95416 | 1.68009 | 10.8 | 2.5432 |
| Ba0.9Fe0.1TiO4 | 8.30731 | 41.19251 | 1.69015 | 10.6 | 2.5431 |
| Ba10Fe0.0TiO4 | 8.3073 | 41.42708 | 1.70143 | 9.4 | 2.5430 |
Figure 11.
Relation between Refractive index and crystal size.
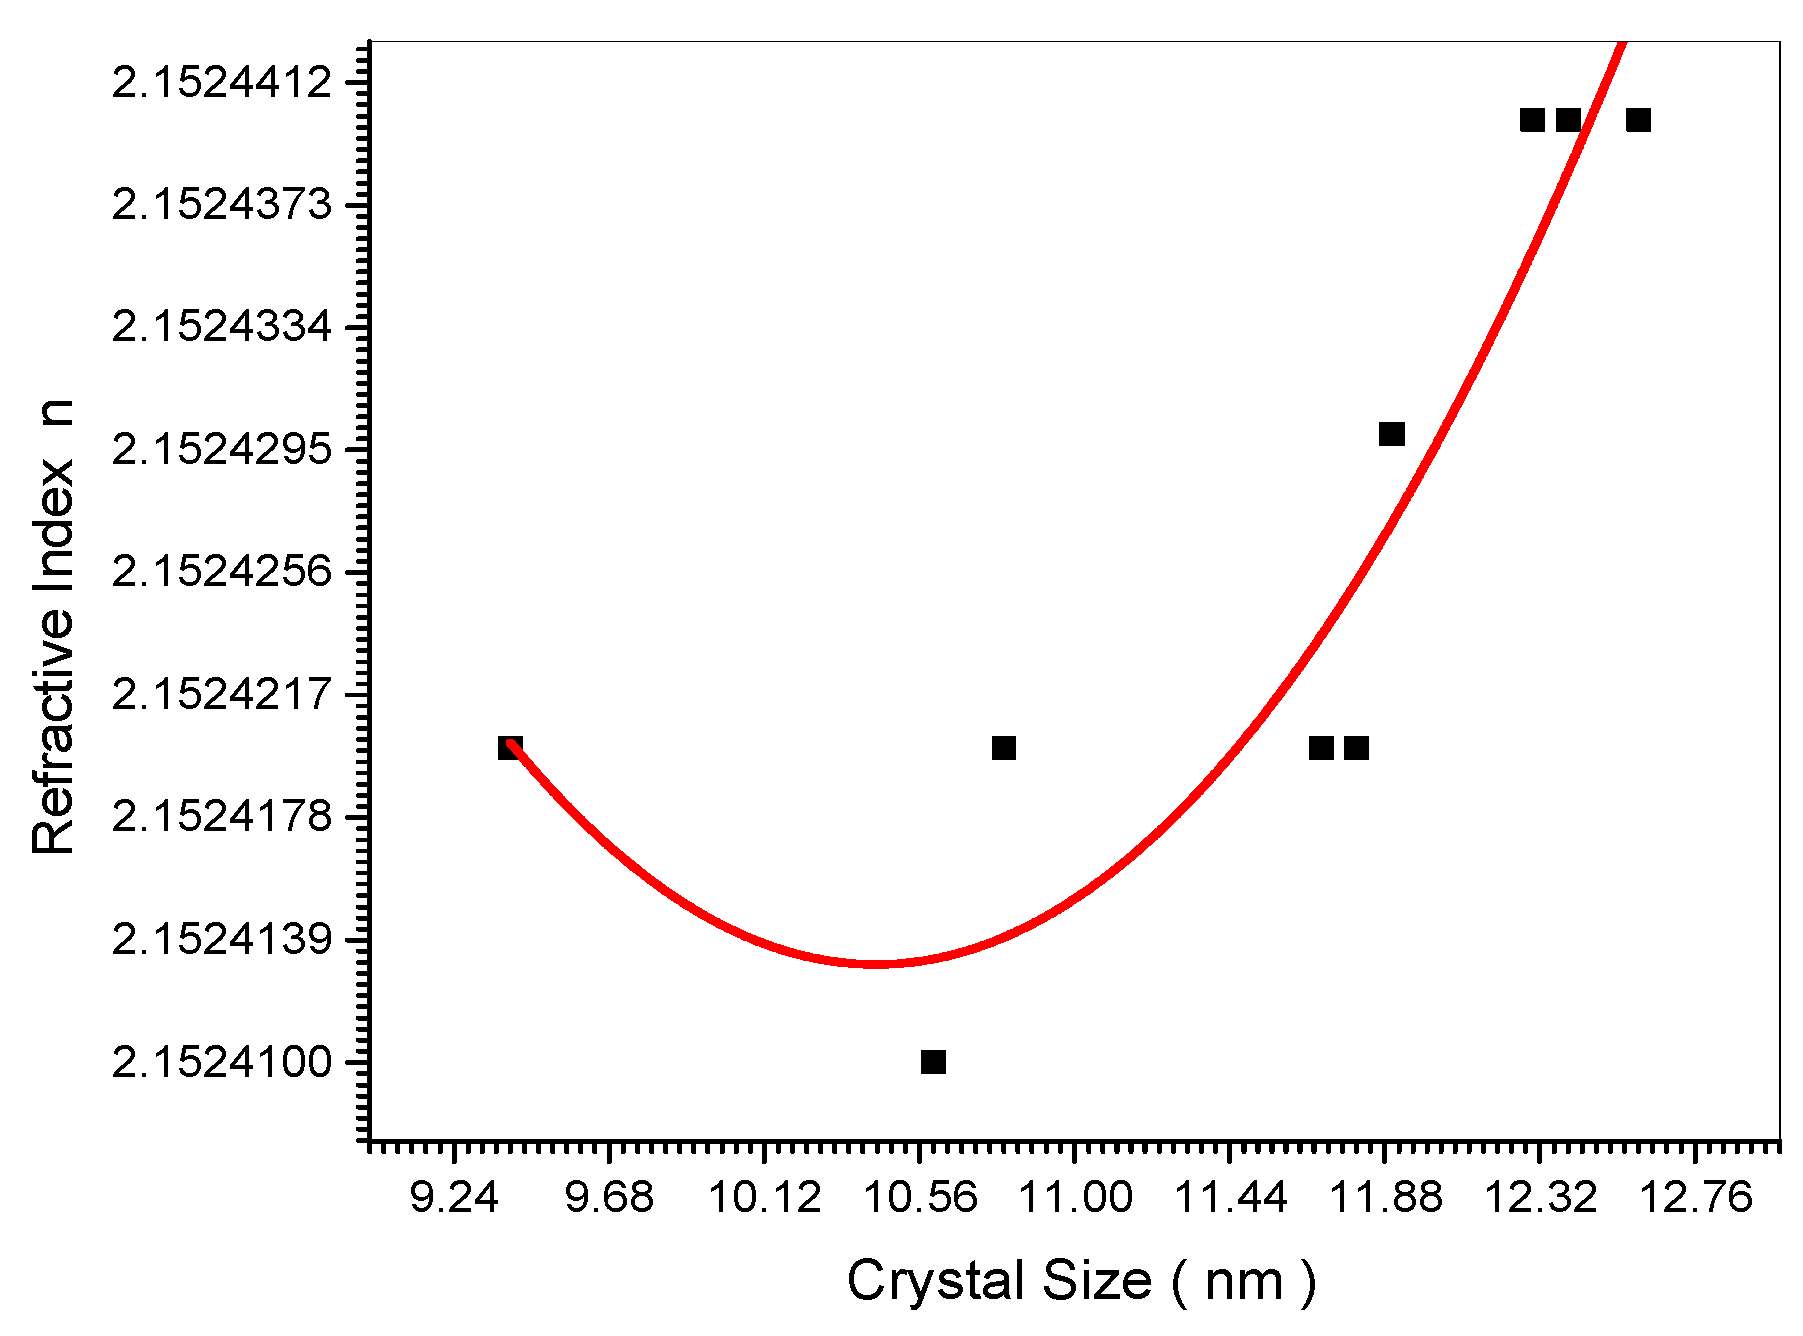
Figure 12.
Relation between Transmission and crystal size.
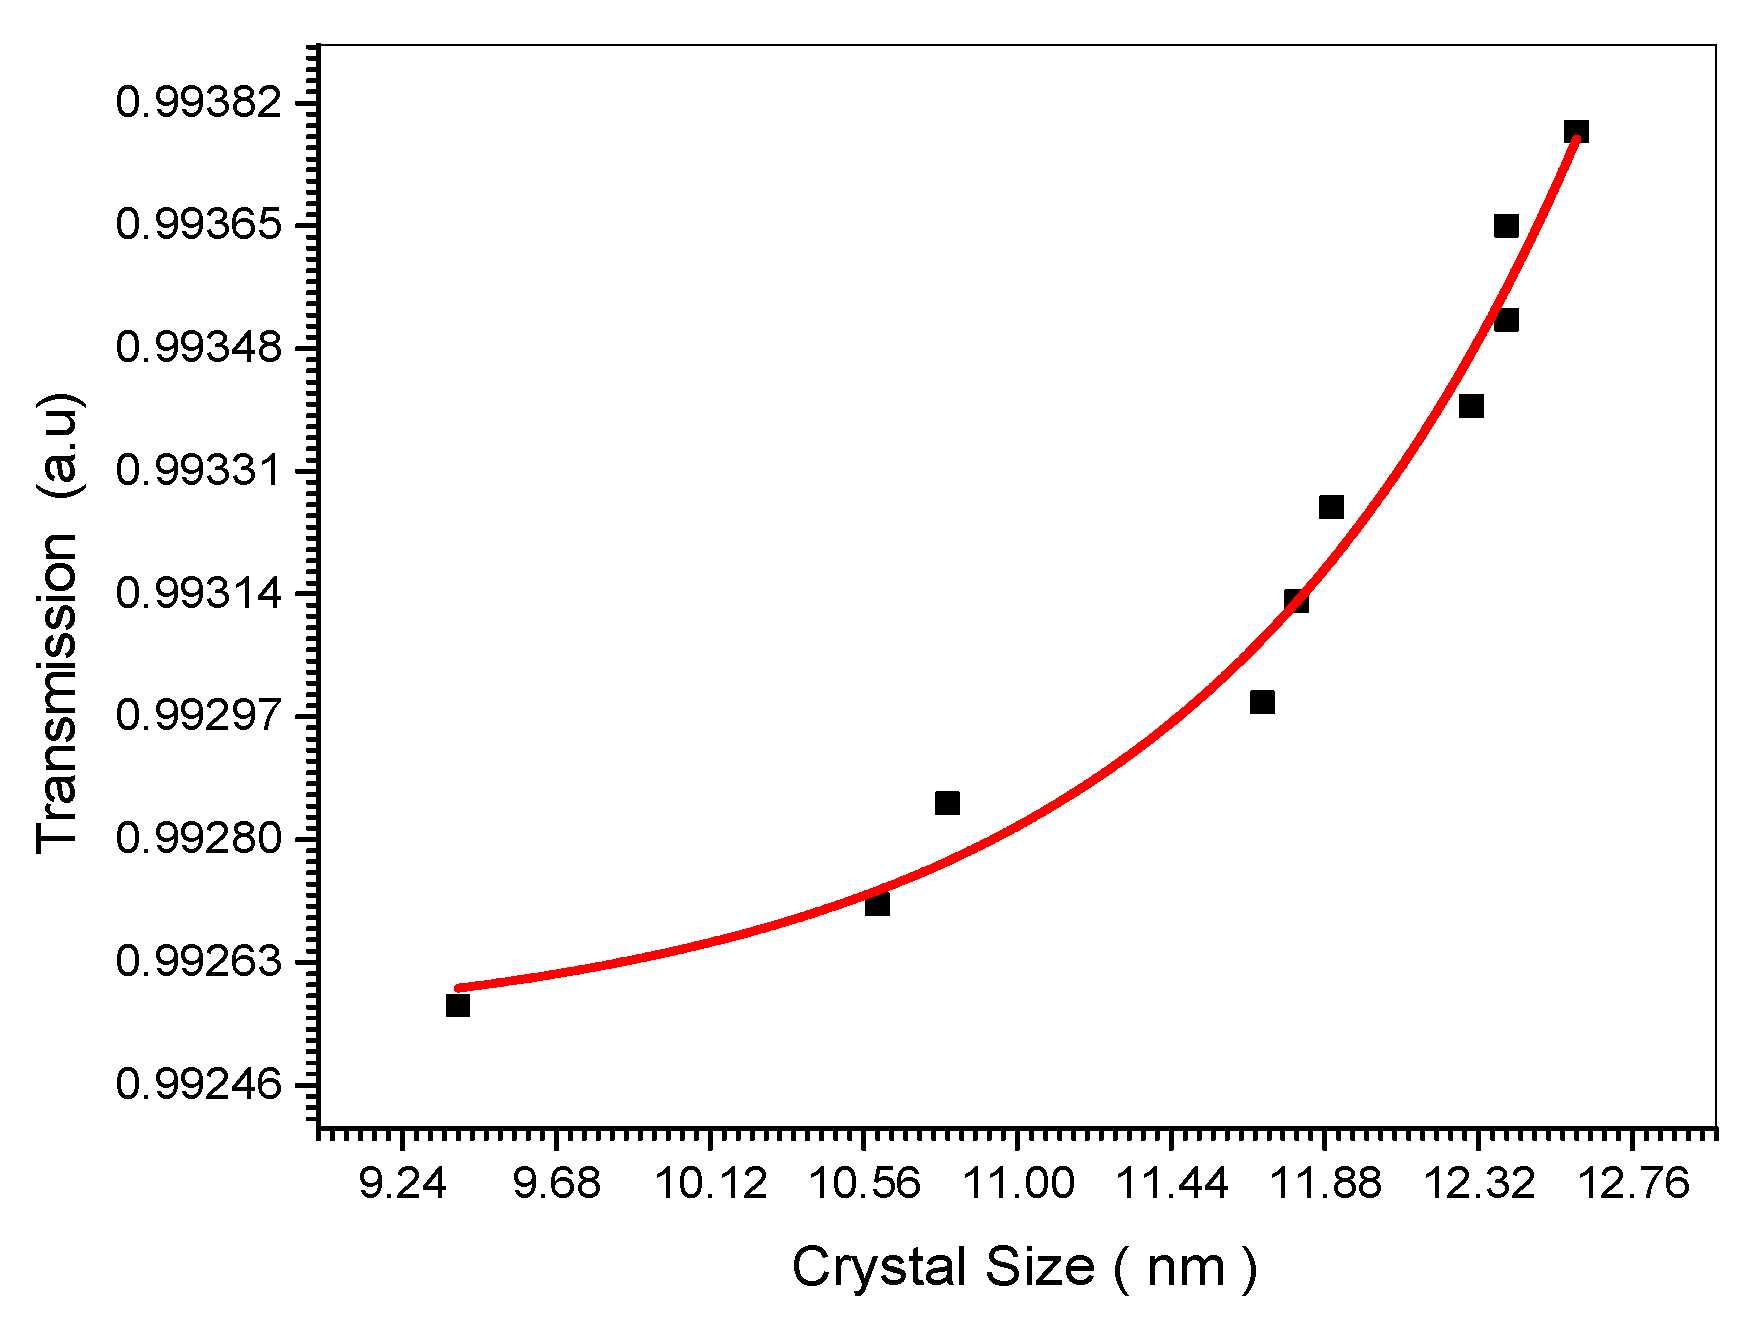
Figure 13.
Relation between Absorbance sample and crystal size.
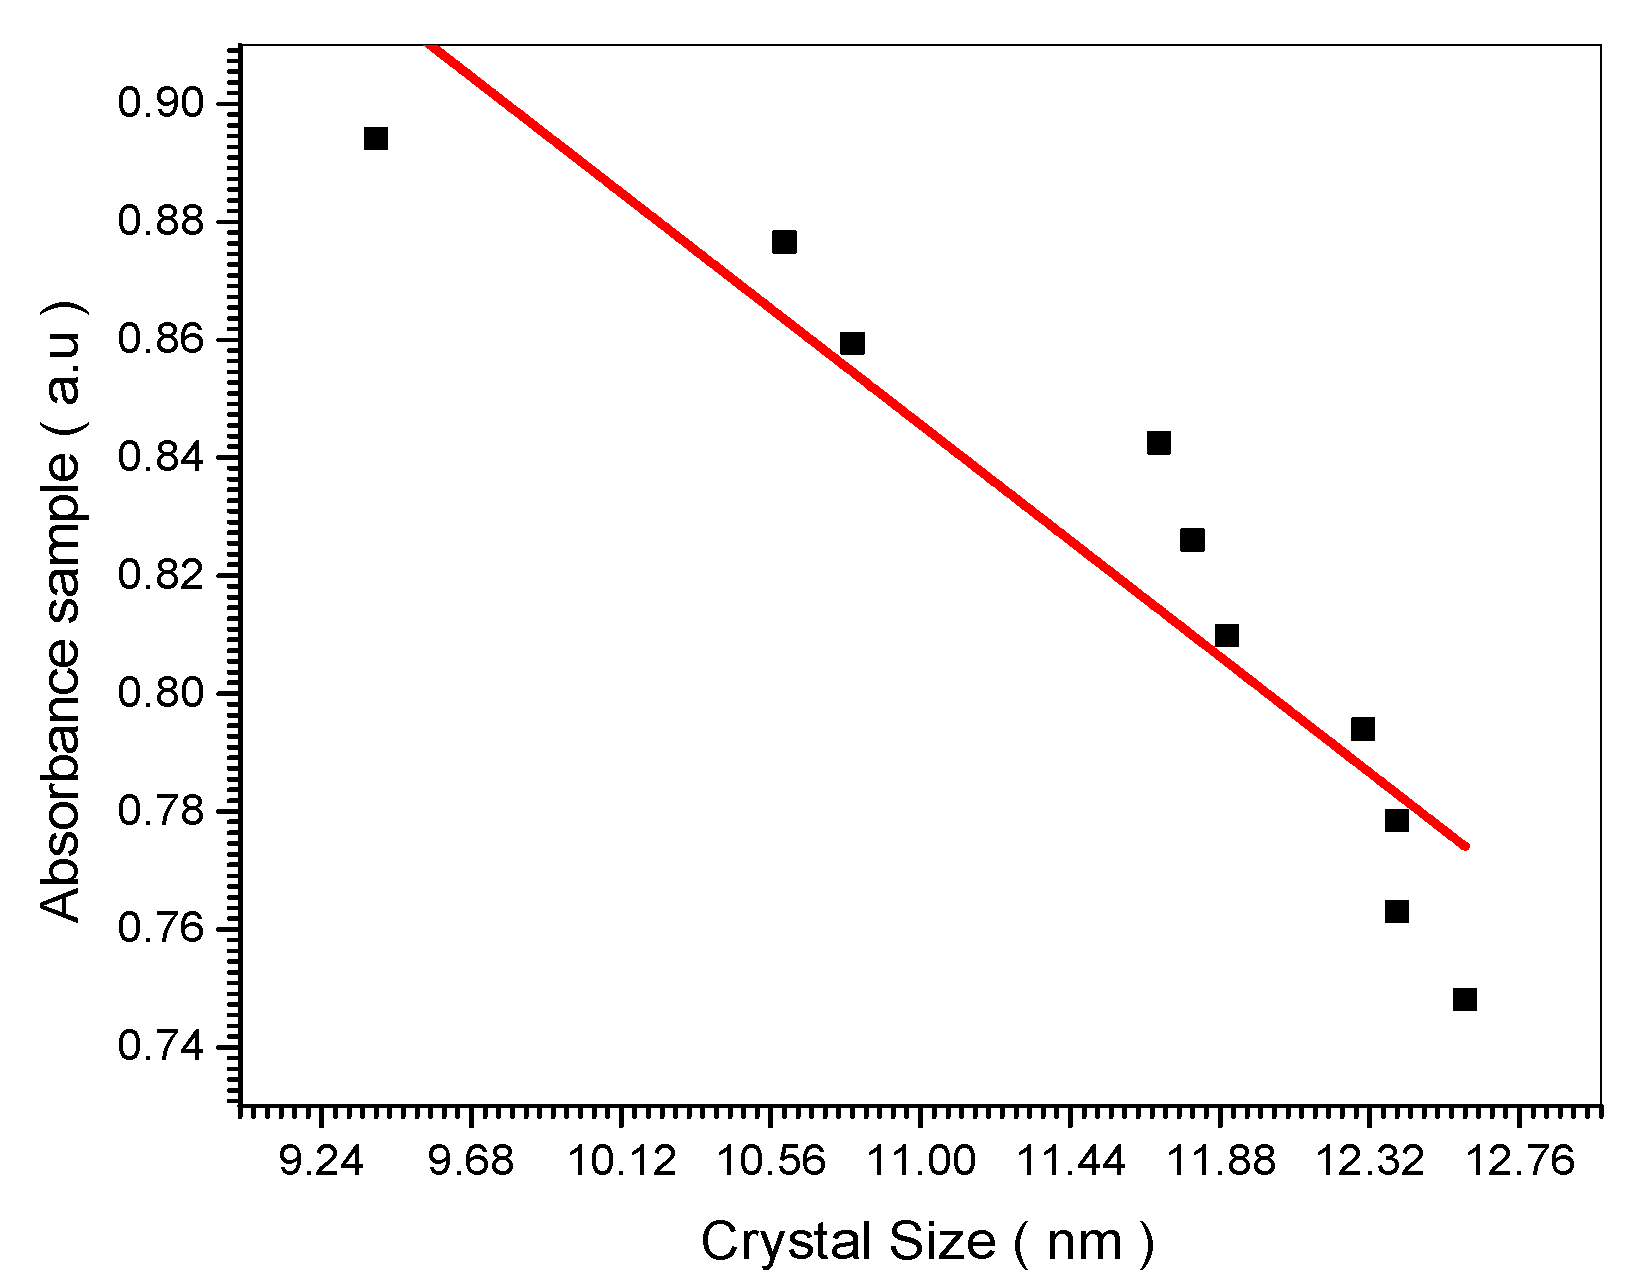
Figure 14.
Relation between Absorption coefficient and crystal size.
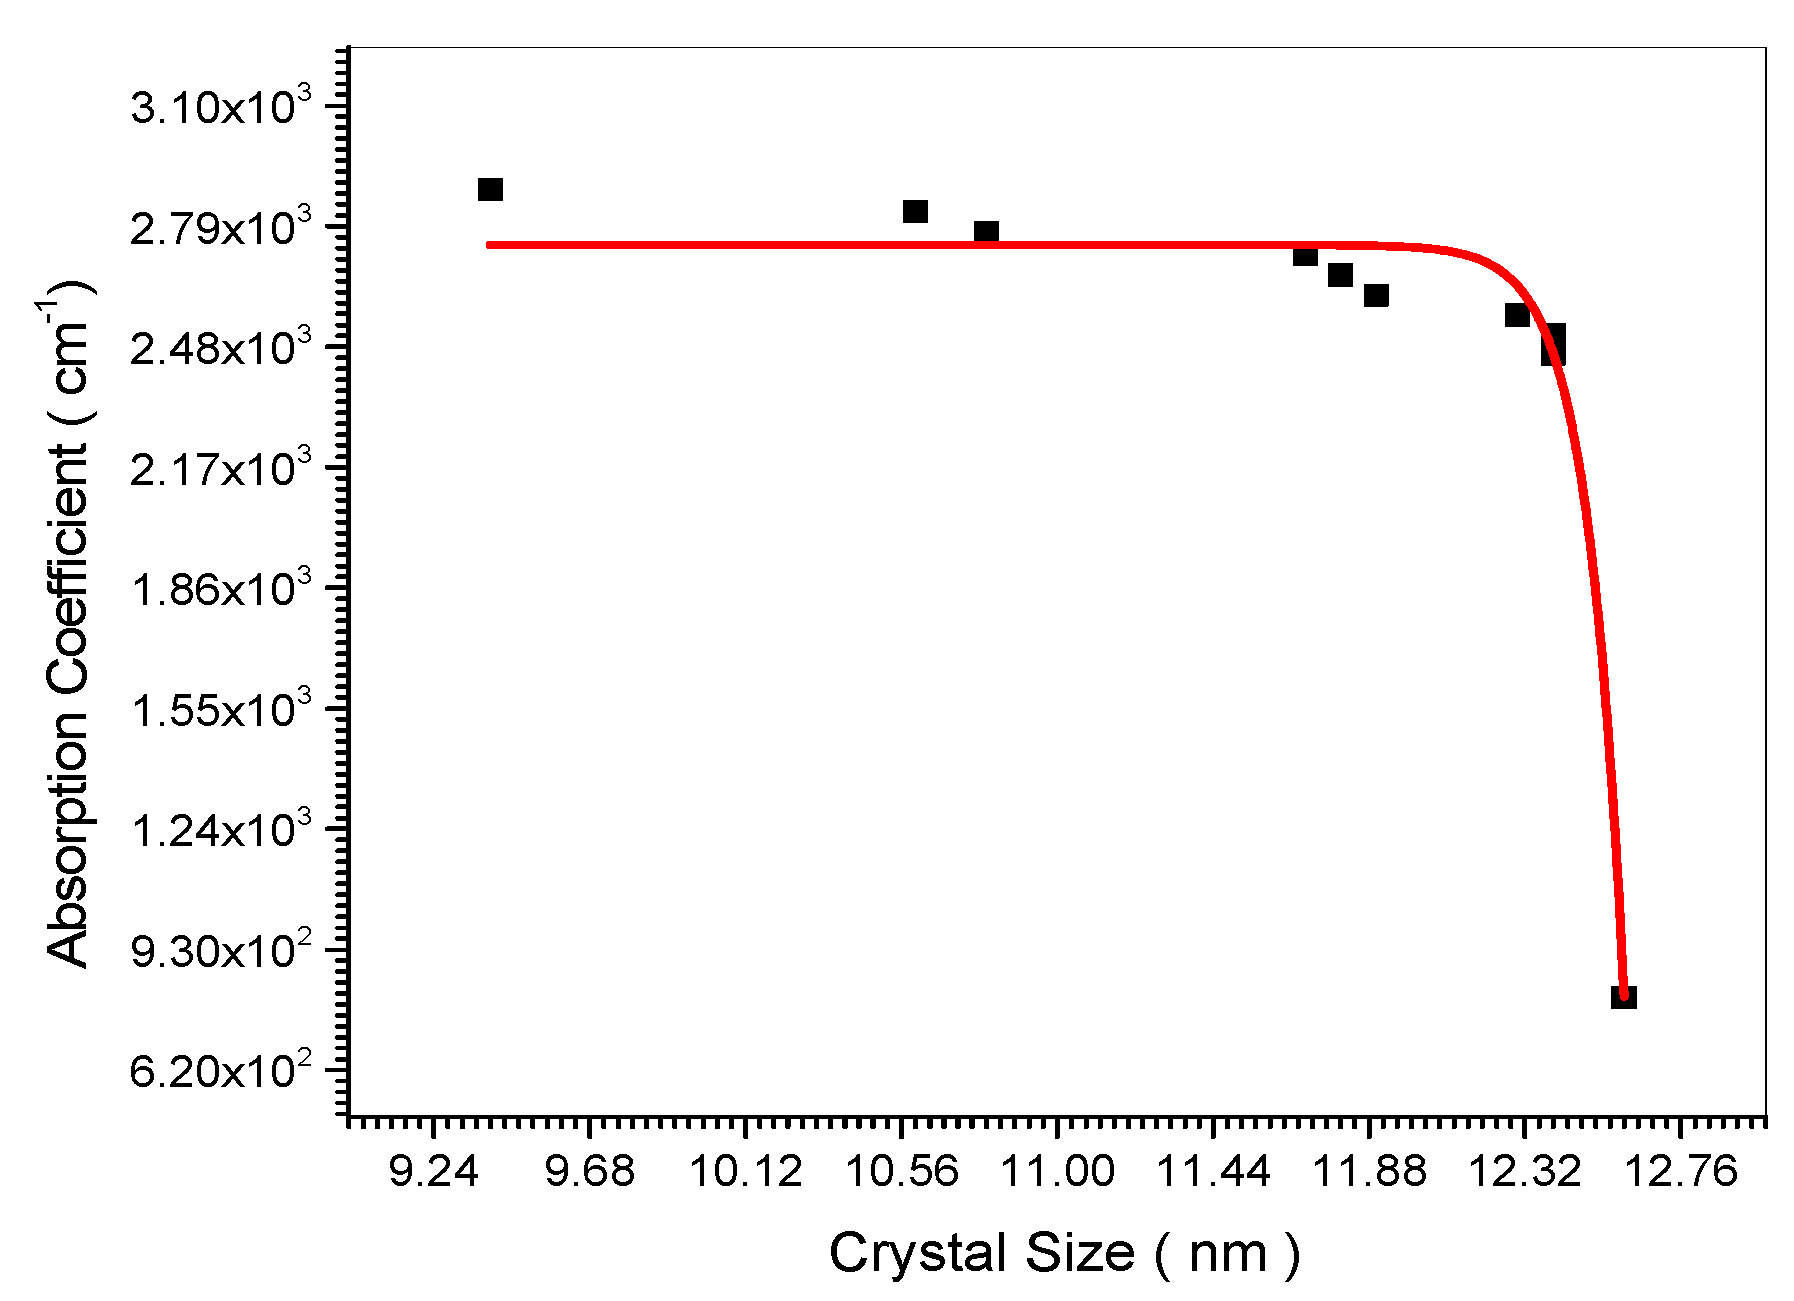
Figure 15.
Relation between Extinction Coefficient and crystal size.
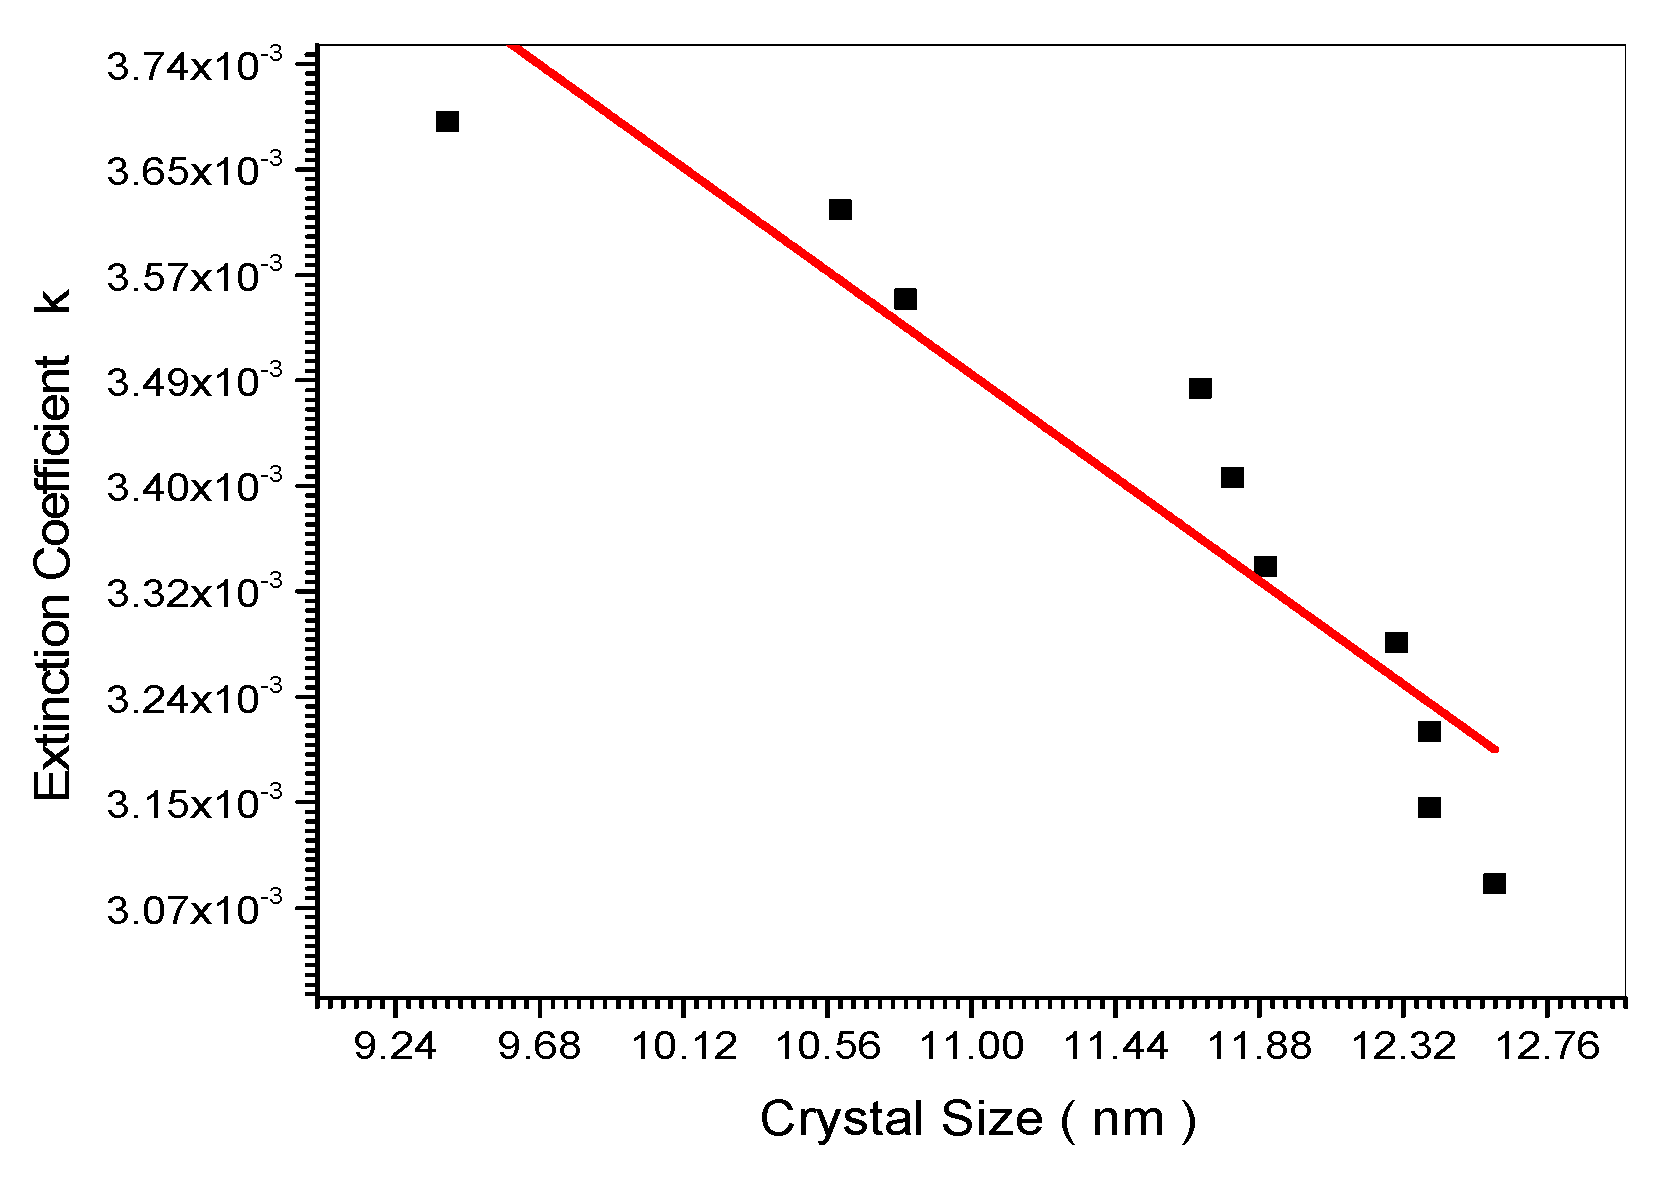
Figure 16.
Relation between Reflection and crystal size.
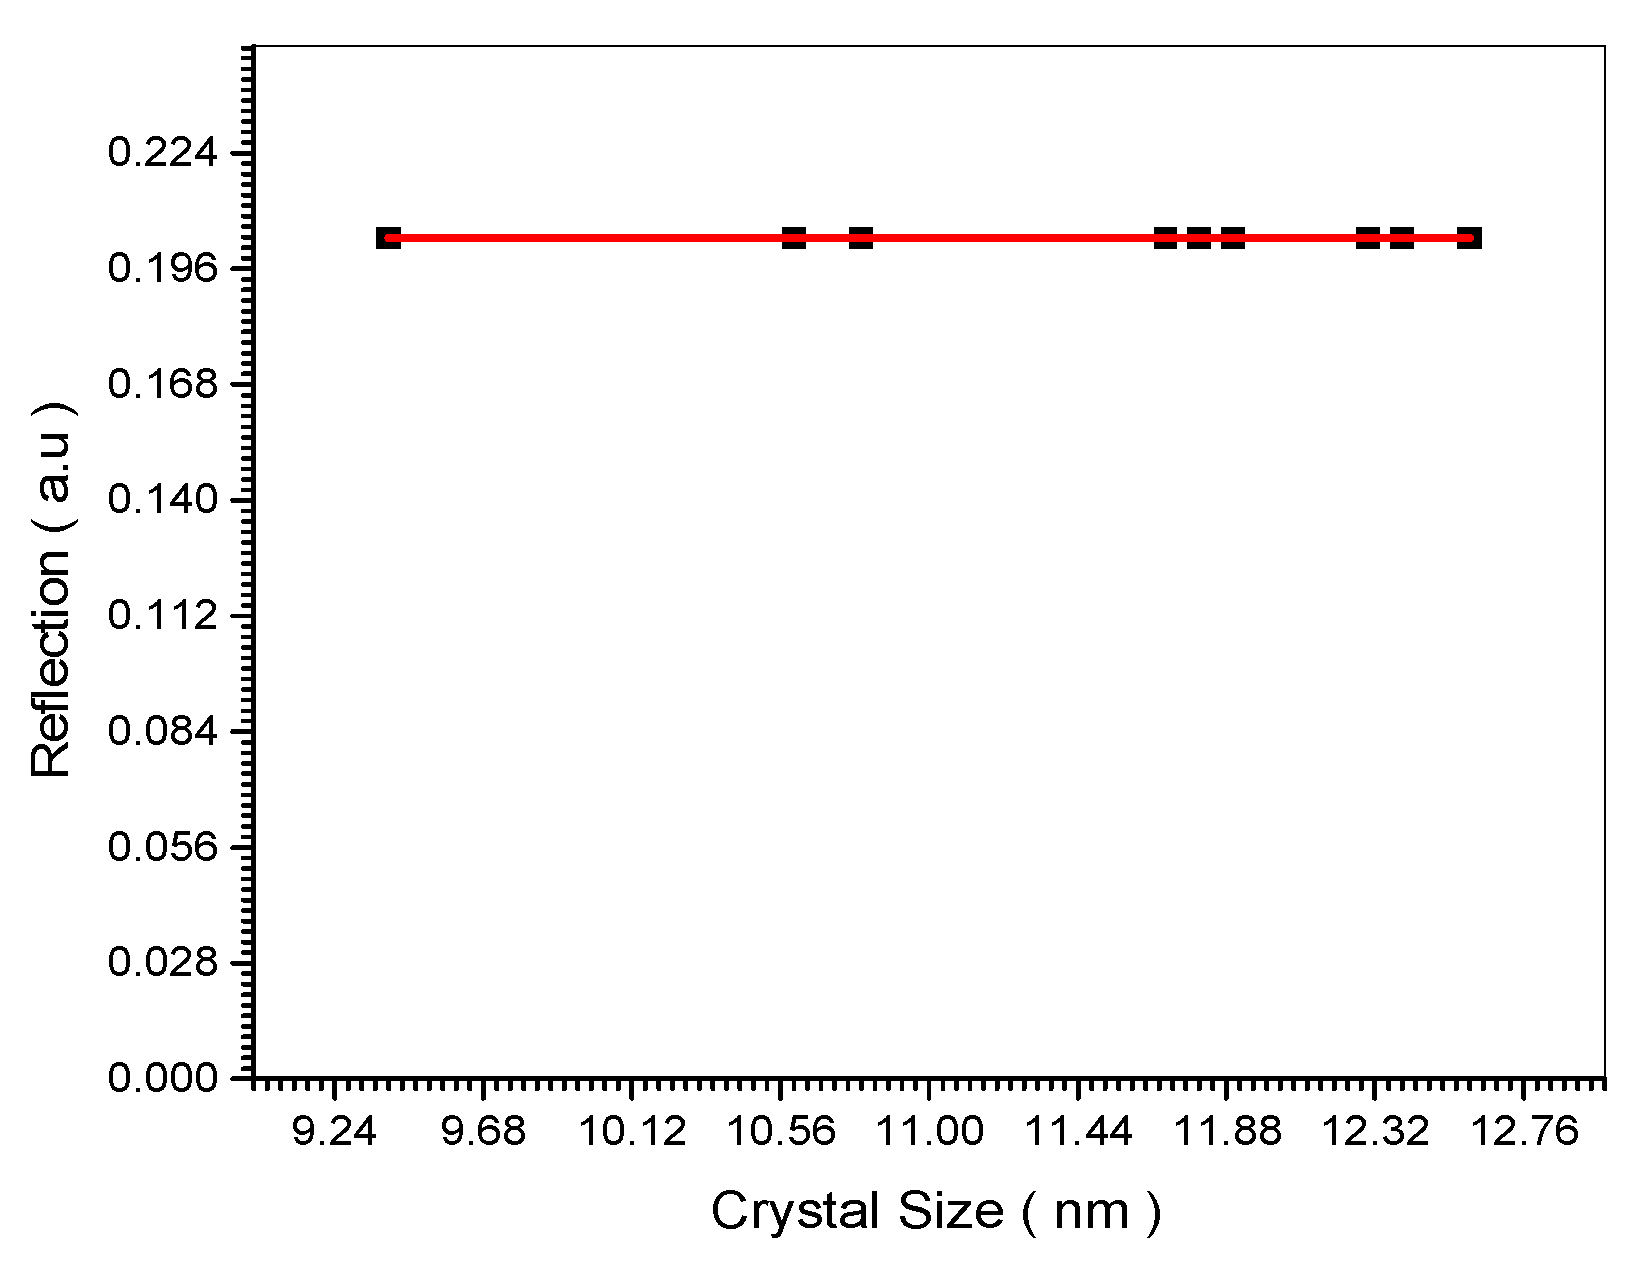
Figure 17.
Relation between Electrical Conductive and crystal size.
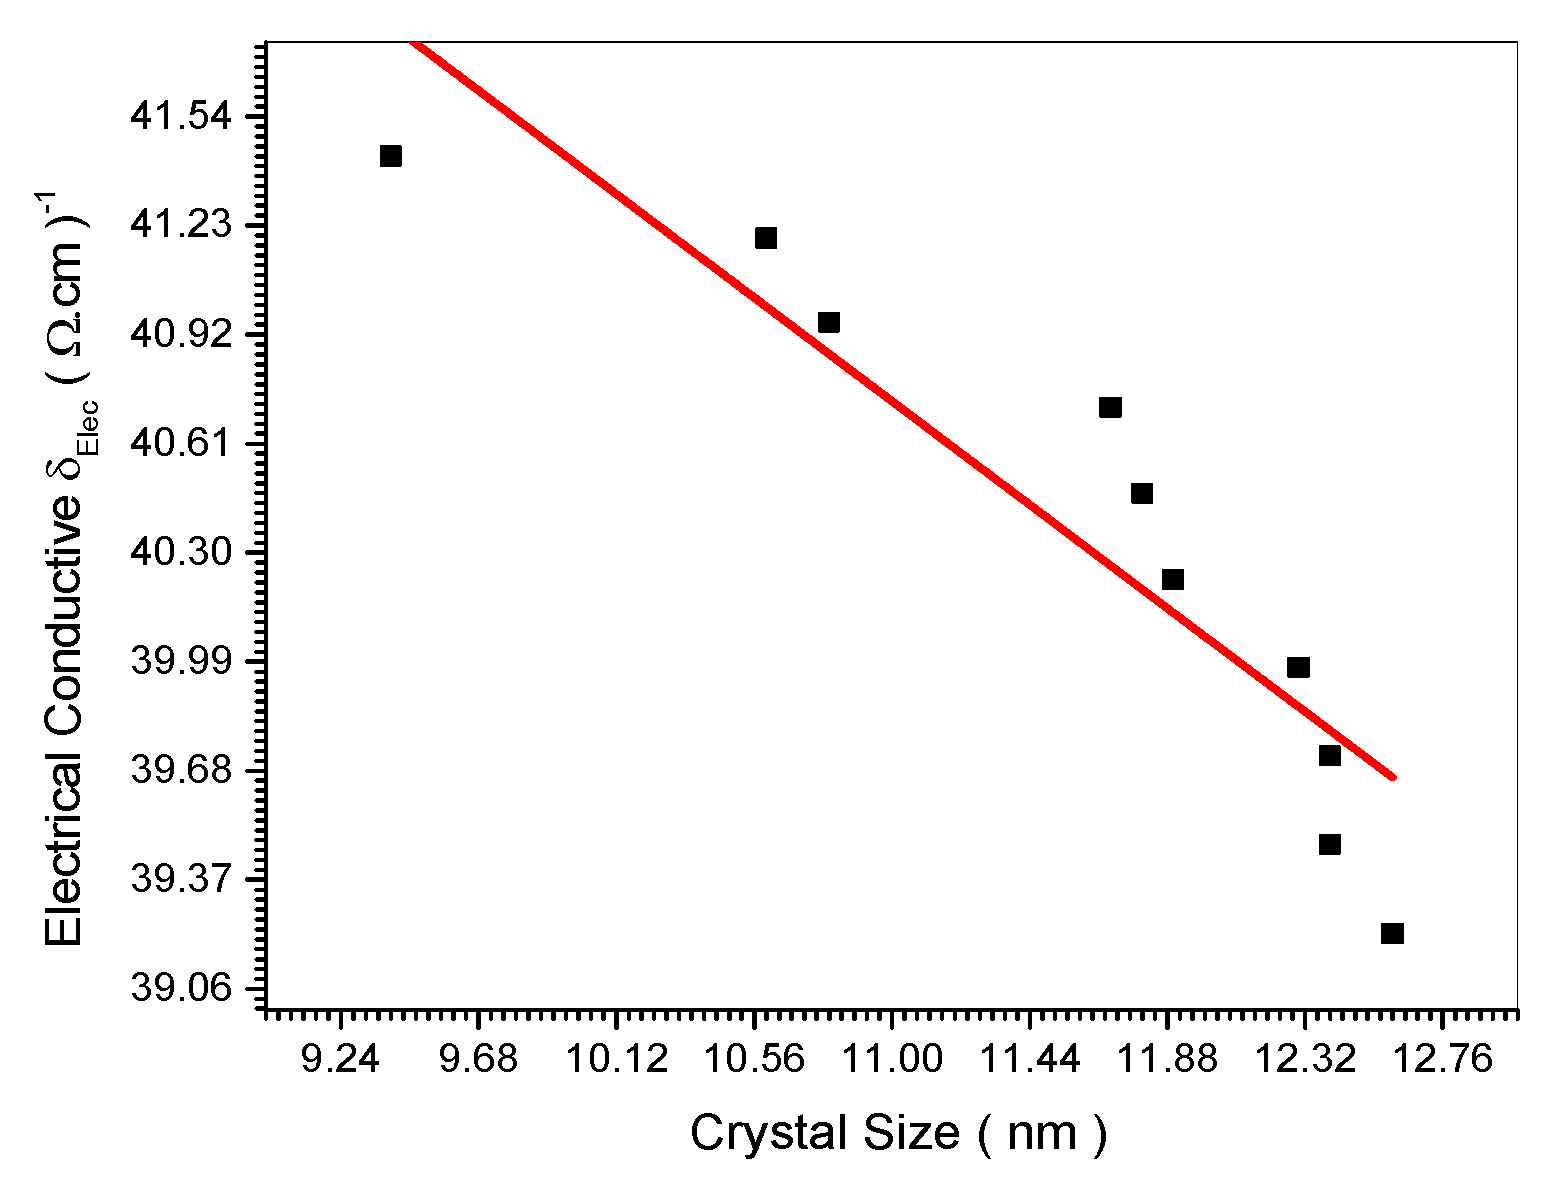
Figure 18.
Relation between Magnetic Permeability and crystal size.
5. Conclusion:
A useful relation between the nano crystal size and some optical and electrical properties was found empirically. the results obtained indicated that the absorption coefficient, electrical conductivity and magnetic permeability increase when the nano crystal size decrease. In contrast the transmission and the refractive index increase when the nano crystal size increase. These empirical relations can be explained using the string classical theory.
Funding
This research was funded by Research Group, Saudi Arabia under grant number (RGP. 2/201/44).
Data availability:
The study was conducted in accordance with the Declaration of Helsinki and was approved by the Ethics Committee for Clinical Research of the province of Padua under protocol number CESC code 4923/AO/20, approval Date 24 September 2020.
Acknowledgements
The authors extend their appreciation to the Deanship of Scientific Research at King Khalid University for funding this work through small Groups Project under grant number (RGP. 2/ 201/ 44).
Conflicts of Interest
The authors declare no conflict of interest.
Declaration of Competing Interest
The authors declare that they have no known competing financial interests or personal relationships that could have appeared to influence the work reported in this paper.
References
- Wasisto, Hutomo Suryo, Joan Daniel Prades, Jan Gülink, and Andreas Waag. "Beyond solid-state lighting: Miniaturization, hybrid integration, and applications of GaN nano-and micro-LEDs." Applied Physics Reviews 6, no. 4 (2019). [CrossRef]
- Meneghini, Matteo, Carlo De Santi, Idriss Abid, Matteo Buffolo, Marcello Cioni, Riyaz Abdul Khadar, Luca Nela et al. "GaN-based power devices: Physics, reliability, and perspectives." Journal of Applied Physics 130, no. 18 (2021). [CrossRef]
- 石黒浩三. "A. Beiser: Concepts of Modern Physics, Mc-Graw-Hill 1963, 357 頁, 15× 23cm, 3,180 円." 日本物理学会誌 19, no. 6 (1964): 394. [CrossRef]
- Raymond, A. Serway, physics for scientists and engineers with modern physics, sounders college publishing, USA (2004).
- Li, Kaiwen, Dong Lin, Jinhua Ren, and Qun Zhang. "Silicon doping and N2 annealing effects on Zn3N2 thin film transistors." Vacuum 197 (2022): 110864. [CrossRef]
- Nazeeruddin, Mohammad K., Peter Pechy, Thierry Renouard, Shaik M. Zakeeruddin, Robin Humphry-Baker, Pascal Comte, Paul Liska et al. "Engineering of efficient panchromatic sensitizers for nanocrystalline TiO2-based solar cells." Journal of the American Chemical Society 123, no. 8 (2001): 1613-1624. [CrossRef]
- Kamat, P.V., et al., Nanoparticles, in Handbook of Nanostructured Materials and Nanotechnology., Academic Press: New York.2010.
- Neha Srivastava, Manish Srivastava, P. K. Mishra and Vijai Kumar Gupta. Green Synthesis of Nanomaterials for Bioenergy Applications, First Edition. 2021 John Wiley & Sons Lt8, New York, ISBN:978-1-119-57679-2.
- Vall, CM Samba, M. Chaik, A. Tchenka, S. Hnawi, A. Mellalou, M. Aggour, and A. Outzourhit. "Effect of chromium percentage doping on the optical, structural, morphological and electrical properties of ZnS: Cr thin films." Physica E: Low-dimensional Systems and Nanostructures 130 (2021): 114694. [CrossRef]
- Ratna Tantra, Nanomaterial characterization, first published April 2016 Wiley & sons, Inc9, New York ISBN978111875354York, ISBN: 978-1-118-75346-0.
- Bhushan, Bharat, Dan Luo, Scott R. Schricker, Wolfgang Sigmund, and Stefan Zauscher, eds. Handbook of nanomaterials properties. Springer Science & Business Media, 2014. ISBN: 978-3-642-31106-2.
- L.I.Schiff, Quantum Mechanics, Mc Graw Hill, Tokyo (2005).
- K. Uuang, Quantum field theory, Wiley VCH, Weinheim (2010).
- Zhu, Y., Hu, M., Xu, M., Zhang, B., Huang, F., Cheng, Y., & Lu, J. (2022). Bilayer metal halide perovskite for efficient and stable solar cells and modules. Materials Futures. [CrossRef]
- Bist, Anup, Bishweshwar Pant, Gunendra Prasad Ojha, Jiwan Acharya, Mira Park, and Prem Singh Saud. 2023. "Novel Materials in Perovskite Solar Cells: Efficiency, Stability, and Future Perspectives" Nanomaterials 13, no. 11: 1724. [CrossRef]
- Mehra, S., Pandey, R., Madan, J., Sharma, R., Goswami, L., Gupta, G., . . . Sharma, S. N. (2023). Experimental and theoretical investigations of MAPbX3-Based perovskites (X= cl, br, I) for photovoltaic applications. Chemistry Open. [CrossRef]
- …….
- George G. Njema, Joshua K. Kibet, "A Review of the Technological Advances in the Design of Highly Efficient Perovskite Solar Cells", International Journal of Photoenergy, vol. 2023, Article ID 3801813, 35 pages, 2023. [CrossRef]
- Takahashi, S., Uchida, S., Jayaweera, P.V.V. et al. Impact of compact TiO2 interface modification on the crystallinity of perovskite solar cells. Sci Rep 13, 16068 (2023). [CrossRef]
- Ren, N., Wang, P., Jiang, J., Li, R., Han, W., Liu, J., . . . Li, T. (2023). Multifunctional additive CdAc2 for efficient perovskite-based solar cells. Advanced Materials,, 2211806. [CrossRef]
- Seo, J., Song, T., Rasool, S., Park, S., & Kim, J. Y. (2023). An overview of lead, tin, and mixed Tin–Lead-Based ABI3 perovskite solar cells Wiley. [CrossRef]
- Solar RRL - 2022 - feleki - perovskite solar cells on Polymer-Coated smooth and rough steel substrates. [CrossRef]
- Ali, N., Shehzad, N., Uddin, S., Ahmed, R. R., Jabeen, M., Kalam, A., . . . Goumri-said, S. (2021). A review on perovskite materials with solar cell prospective Hindawi Limited. [CrossRef]
- Ali, Amira Jad Elrb, Mubarak Dirar Abdallah, S. M. H. Abdalsakhi, A. E. Mohamed, and Mohamed Altambor. "The Effect of Fe Concentration on Crystal size, Crystal Spacing, Nano Size, and Absorption Coefficient for (Ba x Fe1-x Ti O 4).
Disclaimer/Publisher’s Note: The statements, opinions and data contained in all publications are solely those of the individual author(s) and contributor(s) and not of MDPI and/or the editor(s). MDPI and/or the editor(s) disclaim responsibility for any injury to people or property resulting from any ideas, methods, instructions or products referred to in the content. |
© 2024 by the authors. Licensee MDPI, Basel, Switzerland. This article is an open access article distributed under the terms and conditions of the Creative Commons Attribution (CC BY) license (http://creativecommons.org/licenses/by/4.0/).
Copyright: This open access article is published under a Creative Commons CC BY 4.0 license, which permit the free download, distribution, and reuse, provided that the author and preprint are cited in any reuse.


