
Submitted:
03 February 2024
Posted:
05 February 2024
You are already at the latest version
Abstract
Research on microglia in Down syndrome (DS) has shown that microglial activation, increased inflammatory gene expression, and oxidative stress occur at different ages in DS brains. However, most studies resulted in simplistic definitions of microglia as quiescent or active, ignoring potential intermediate states. However, a recent work on microglial cells in young DS brains indicated that those evolve through different intermediate activation phenotypes before reaching a full activated state. Here we used single nucleus RNA sequencing, to examine how trisomy affects microglial states in the Ts65Dn mouse model of DS. Despite no substantial changes in the proportion of glial populations, differential expression analysis revealed cell type-specific gene expression changes, most notably in astroglia, microglia, and oligodendroglia. Focusing on microglia, we identified differential expression of genes associated with different microglial states, including disease-associated microglia (DAMs), activated response microglia (ARMs), and human Alzheimer’s disease microglia (HAMs), in trisomic microglia. Furthermore, pseudotime analysis reveals a unique reactivity profile in Ts65Dn microglia, with fewer in a homeostatic state and more in an intermediate aberrantly reactive state than in euploid microglia. This comprehensive understanding of microglial transcriptional dynamics sheds light on potential pathogenetic mechanisms but also possible avenues for therapy for neurodevelopmental disorders.
Keywords:
Down syndrome
; microglia
; disease-associated microglia
1. Introduction
Down syndrome (DS) is the most common genetic form of intellectual disability resulting from an extra copy of chromosome 21 and is associated with a spectrum of cognitive impairments. Until very recently, it was assumed that brain phenotypes in DS were accounted for by alterations in the neuronal population [1,2]. However, recent studies have underscored the involvement of microglia, the resident immune cells of the central nervous system (CNS), not only in neuronal alterations but also in learning and memory deficits in DS [3].
Under physiological conditions, microglial cells exist in a surveillant state [4,5] contributing to brain homeostasis due to their involvement in the phagocytosis of cellular debris, misfolded proteins and apoptotic cells, among others [6]. Microglia also survey and safeguard different neuronal functions through the microglia-neuron crosstalk [7]. However, upon injury or pathogen invasion, they undergo a process of reactivity to different signals characterized by changes in their shape, mobility and phagocytic activity, which are sustained by the expression of inflammatory-related genes and proteins [8]. Reactive microglia present an amoeboid shape and have phagocytic functions [9]. Nevertheless, this oversimplified dichotomization of “resting or homeostatic” or “activated or reactive” microglial states is a subject of intense debate since it does not fully grasp the intricacy of microglial responses within the framework of different neurodegenerative disorders [5,10]. Recent developments in single-cell technologies have revealed multiple microglial states related to specific developmental, aging, and disease processes [11]. These studies emphasize that the extent of microglial reactivity goes beyond traditional phenotypes, revealing the coexistence of multiple intermediate states concurrently. Consequently, there exists a diverse array of context-dependent microglial states, which vary across species and models. Importantly, each microglial state is associated with specific functions in the brain and are influenced by various modifying factors, such as age, sex, local signals, or peripheral signals. Some of these states are referred to as Disease-Associated Microglia (DAM), and they are linked to various neurological disorders [12,13,14,15,16,17].
However, when examining DS, the dichotomous perspective on microglial states persists, despite the evolving understanding in the microglial research field. The current knowledge, coming from multiple studies in brains of individuals with DS is that trisomic microglia is in a reactive state that contributes to neuroinflammation. Amoeboid and ramified microglia, associated with reactive microglia, has been identified in DS fetuses as early as 17-22 gestational weeks across different brain regions [18], and microglial dystrophy has also been reported in adults with DS [19,20,21]. Furthermore, microglia from children with DS display an increased somatic size compared to euploid controls [20]. Immunoreactivity of microglia to IL-1β, a pro-inflammatory cytokine, was reported in fetuses, neonates, children and adults with DS, which would suggest chronic neuroinflammation [20]. Consistent with these findings, a mouse model of DS exhibited an increased production of IL-1β and superoxide in microglial cells at fetal stages [22]. Microglial cells in DS also present a transcriptomic signature related to Alzheimer’s disease (AD) and aging characterized by the expression of C1q-complement related genes [23]. Corroborating these results, adults with DS show increased expression of CD-64 and CD-86, markers of microglial reactivity [24]. Microglia reactivity has also been documented in mouse models of DS, including Ts65Dn [25,26,27,28] and Dp(16)1Yey [3]. Notably, depleting microglia in young Dp(16)1Yey DS mouse models rescues cognition and improved neuronal spine density and activity [3] and anti-inflammatory therapies restore microglial homeostasis and mitigate cognitive deficits in mouse models of DS [3,26,28]. Collectively, these findings suggest that persistent microglial reactivity may contribute to the cognitive defects in DS.
Utilizing single-nucleus RNA sequencing, we here provide an unbiased examination of gene expression patterns of the main glial cell types in the trisomic hippocampus of Ts65Dn mice at postnatal day 56 (P56), with a focus on trisomic microglia. We chose Ts65Dn for the study because it recapitulates most of the traits identified in DS. Ts65Dn mice, on the other hand, carry a triplication of 43 coding genes that are not homologous to HSA21 and are not triplicated in human DS [29,30]. We selected P56 to be able to compare our results with different databases and previously published studies and because at this age the brain is fully developed. In this study, we explored the impact of the trisomy on the microglial transcriptomic profile and whether the trisomy affects the different microglial states within the hippocampus of Ts65Dn mice. The analysis of differential expression unveiled a notable number of differentially expressed genes (DEGs) in the different glial types. Significantly, the influence of an additional chromosome on the transcriptome demonstrated specificity based on cell type, showcasing distinct patterns in astroglia, microglia, and oligodendroglia. We identified an aberrant shift in the microglial activation state, with fewer microglial cells both in a homeostatic state and in a reactive state but a remarkably higher proportion of trisomic microglia in an intermediate state of reactivity. This is a relevant finding; especially taking into consideration that previous studies in the field of DS described that trisomic microglia was more active than euploid controls. Our study refines this general view and proposes that a different and aberrant state of trisomic microglia might account for the higher microglial reactivity that is reported in DS and in DS mouse models.
In conclusion, our study provides a new scenario in which, rather than considering that there is simply a higher number of activated microglia in DS, there is a higher proportion of microglial cells in an aberrant reactive state that might contribute to the neuroinflammation that is reported in DS.
2. Results
- Unbiased identification of different glial subtypes in WT and Ts65Dn hippocampus
Prior research in individuals with DS and in mouse models of DS has extensively documented that trisomy leads to a global disruption of gene expression, affecting not only neurons but also other cell types in the brain [31,32,33,34]. To investigate the different microglial states present in the trisomic hippocampus, we conducted a single-nucleus RNA sequencing experiment in P56 euploid and Ts65Dn littermates. We sequenced a total of 17910 WT and 13633 Ts65Dn nuclei from the NeuN-negative cell population of two euploid and two Ts65Dn mice using 10X technology (Figure 1A).
Cell types were annotated using the R package SingleR, showing, that 56% were categorized as oligodendroglia, 16% as astroglia, 8% as microglia, while the remaining 20% were classified as endothelial cells, ependymal cells, neurons, which resulted from the insufficient labeling by the NeuN antibody, and other minor cell types (Figure 1B–D). There were no significant differences in cell proportions between the WT and Ts65Dn mice (Figure 1E). Subsequent analyses were restricted to glial cell types.
- Trisomic glial cells exhibit cell-type-specific transcriptomic alterations
Differential expression analysis of euploid and trisomic glial subtypes (oligodendroglia, astroglia and microglia) showed a total of 1434 differentially expressed genes (DEGs, Supplementary Table 1). Although upregulated genes were enriched in mouse chromosome 16 (Mmu16), a portion of which is triplicated in Ts65Dn, most of DEGs were distributed across all the genome, reflecting a general transcriptomic perturbation in the trisomic hippocampus, as reported in previous studies [35] (Figure 2A). As also occurs in the neuronal population [35], we found that the impact of the trisomy on the transcriptome is highly cell-type specific (Figure 2B,C; Supplementary Figure 2). As a matter of fact, microglia was the cell with a higher DEGs when comparing with the number of sequenced cells (Supplementary Figure 3A). In accordance with previous studies [34], we found that in astroglia, most of the DEGs were significantly upregulated, including triplicated genes such as Dyrk1A, App, Son and Scaf4 (Figure 2B,C; Supplementary Figure 3B). However, both in microglia and oligodendroglia we mainly found downregulated genes (Figure 2B,C; Supplementary Figure 3B,C). We identified 532 DEGs between trisomic and euploid microglia (Supplementary Table 1). Remarkably, the majority of them (514 out of 532) were predominantly downregulated (Figure 2B,C; Supplementary Table 1). Lgals9, and Cd86 part of the microglial sensome, Spi1, or Ilr7, which are all associated with the regulation of the immune system were significantly and specifically downregulated in trisomic microglia. Indeed, it is reported that a downregulation of Spi1 is associated with a deregulation of transcripts that encode for proteins involved in DNA replication pathways [36].
The cell type-specific alteration of the transcriptome was also reflected in the specific molecular pathways affected in each glial type (Figure 2D). Cell migration emerged as a shared pathway enriched across all glial clusters, featuring specific genes associated with neurodevelopmental cell migration such as Sema6d (Supplementary Table 1). Additionally, microglia displayed distinctive pathway enrichments linked to immune system development, endocytosis, myeloid cell differentiation, and signaling involved in the regulation of immune responses. Biological pathways such as immune system development, endocytosis, myeloid cell differentiation, immune response regulation signaling pathways were exclusively enriched in microglia.
- More than 60% of trisomic microglial cells are in an intermediate reactive state
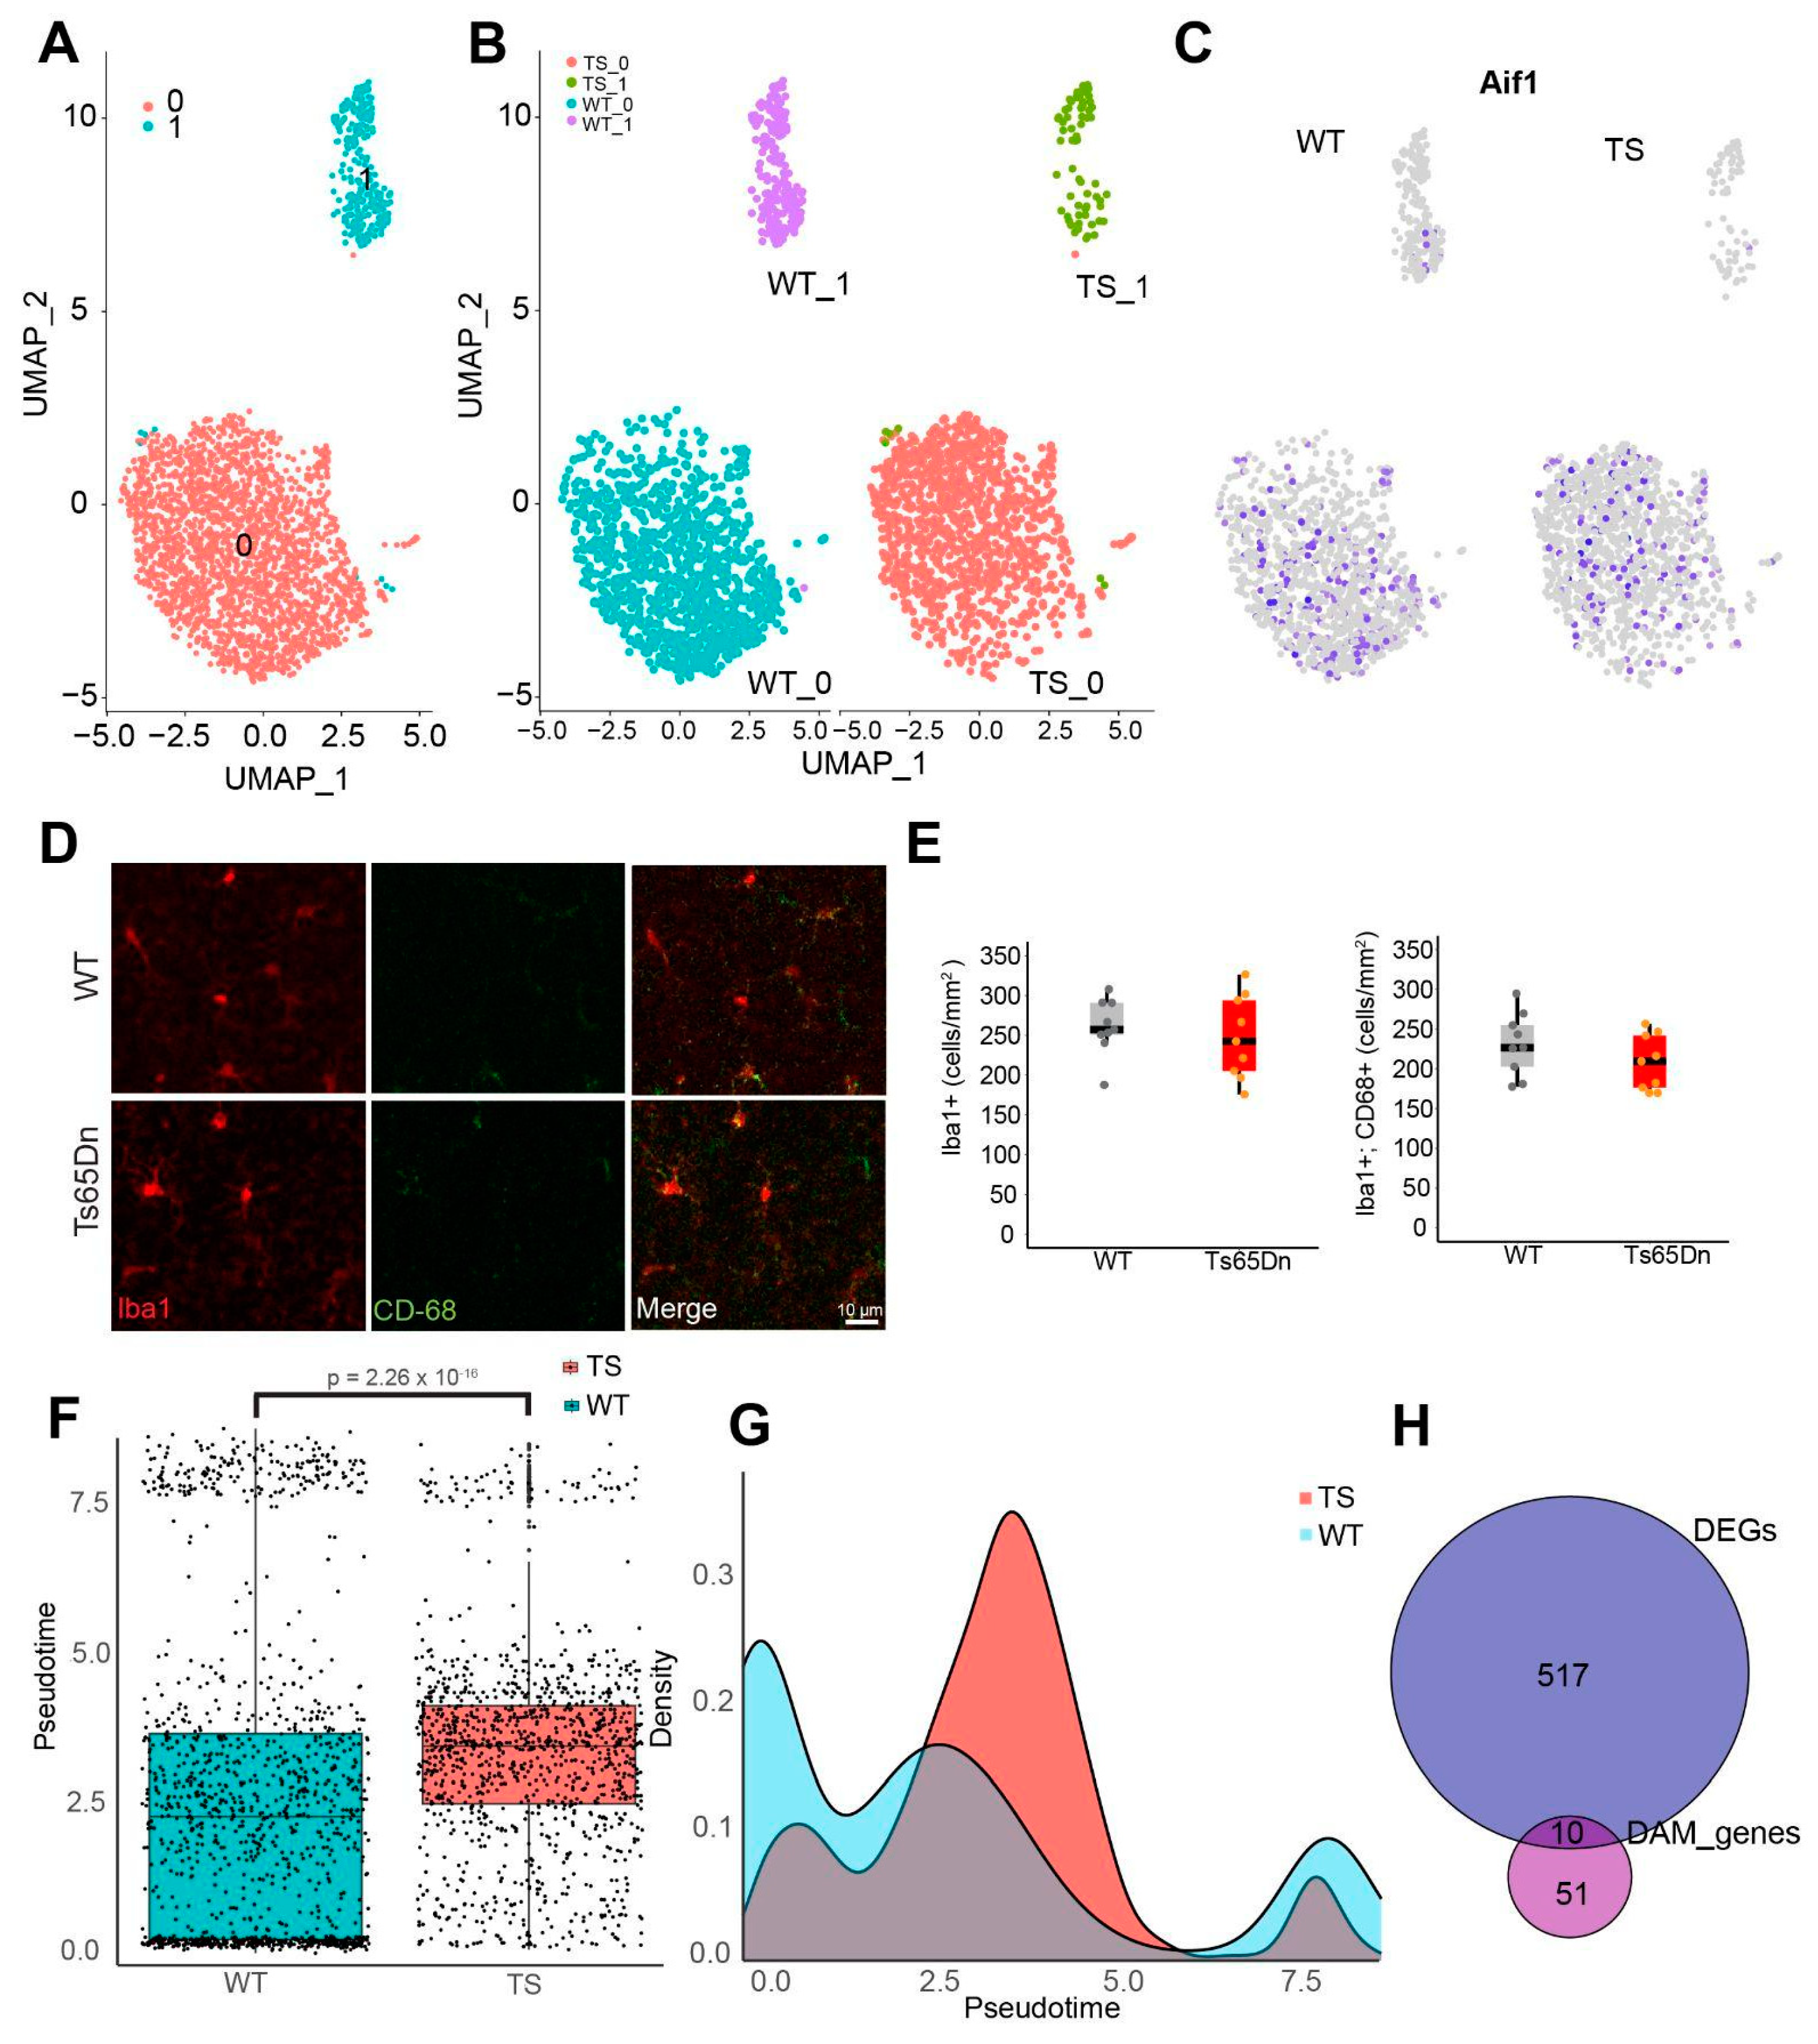
To further investigate the alterations in the microglial population of the trisomic hippocampus, we focused on this cluster. This allowed us to identify two main microglial clusters (Figure 3A), enriched either in markers of homeostatic microglia (Cluster 0) or in activation markers (Cluster 1) (Supplementary Table 4). Interestingly, the UMAP of this population showed clear differences between genotypes in both clusters 0 and 1 (Figure 3B). First, we observed a shift in the two dimensional embedding of the homeostatic cluster, with trisomic cells clustering closer to the reactive microglia population (Figure 3B). At the same time, the cluster of reactive microglia appeared to be less abundant than WT counterparts, although the difference was not significant (Supplementary Figure 4A). These differences were not explained by classical microglial activation markers such as Aif1 (encoding for Iba1; Figure 3C) or CD-68 (Supplementary Figure 5A). In accordance with these results, we found similar numbers of Iba1+ and CD-68+ cells in brain sections of the hippocampus of euploid and Ts65Dn mice (Figure 3D,E).
These results suggested an alteration in the reactive states in trisomic microglia and that intermediate states of activation should be taken into account when studying microglia in DS. To get insight into the activation trajectories of trisomic and WT microglia, we performed a pseudotime analysis, which ordered microglial cells according to their degree of activation (Supplementary Figure 5B), as shown by the expression of activation genes such as those associated to the major histocompatibility complex II (MHC-II; Supplementary Figure 5C). This analysis revealed striking differences between genotypes. While WT microglia have a pseudotime distribution in which a large proportion of microglial cells are in a resting state and a smaller fraction is activated, most trisomic microglia (67%) lay in an in-between state according to the pseudotime score (Figure 3F,G; Supplementary Figure 4B). These results suggest that trisomic microglia are permanently in an aberrantly reactive state.
In this study we also expected different disease-associated microglia (DAM) linked to the trisomy in Ts65Dn microglia. Considering previously published datasets [37,38], we found 10 DAM genes that were substantially differently expressed in trisomic microglia and that overlapped with DAM markers, including Csmd3, the most downregulated gene in trisomic microglia, or Cables1, (Figure 3H, Supplementary Table 3).
3. Discussion
Both in DS and in mouse models of DS, there is an exacerbated microglial reactivity [3,23,39] that is accompanied by an increased level of pro-inflammatory molecules [40]. However, most studies simply analyze “resting versus activated” and “M1 versus M2” states. This dualistic classification of good or bad microglia is inconsistent with the wide repertoire of microglial states and functions in development, plasticity, aging, and diseases that were elucidated in recent years. Thus, a more in-depth understanding of microglial activation states is needed, acknowledging the existence of intermediate states is essential for advancing our understanding of the role of microglia in DS. Using single nuclei RNA sequencing we investigated the influence of trisomy on the microglial transcriptomic profile and explored whether the trisomy has an impact on different microglial states within the hippocampus of Ts65Dn mice. We identified five main clusters representing different cell types, including astrocytes, oligodendroglia, microglia, endothelial cells and neurons.
Differential expression analysis of glial subtypes uncovered a total of 1434 DEGs, with the triplicated region of chromosome 16 (Mmu16) showing a higher number of significantly upregulated DEGs in Ts65Dn mice. The cell-type specificity of the transcriptomic impact on the transcriptome was striking, with mostly upregulated DEGs in astroglia and mostly downregulated in both microglia and oligodendroglia. Interestingly, a similar cell type-specific impact of the trisomy was recently reported in a single-nucleus sequencing study using the Dp16 model [32]. In accordance with our data, a recent study using DS human transcriptome from dorsolateral prefrontal cortex and cerebellar cortex showed that astroglia-associated genes and oligodendroglia-associated genes were up- and downregulated, respectively [41], whereas microglial genes were mainly upregulated. These differences might be explained not only by a different cell type-specific transcriptomic profile in those brain regions but also because the study was performed using DS human brain. However, this study and ours suggest that there is an intricate relationship between gene dosage and cell-type-specific responses to trisomy. The identification of cell type-specific DEGs allowed us to explore the potential biological pathways affected by trisomy. Cell migration emerged as a common pathway enriched in every glial cluster, with specific genes involved in neurodevelopmental cell migration showing altered expression. Moreover, microglia exhibited unique pathway enrichments related to immune system development, endocytosis, myeloid cell differentiation, and immune response regulation signaling which suggests that their function as resident macrophage CNS might be altered.
We also found a transcriptomic shift comparing euploid and trisomic microglia. Pseudotime analysis revealed a distinctive reactivity profile in Ts65Dn microglia, with a reduced number of trisomic microglia in a homeostatic or surveillant state and a higher proportion of microglia in an intermediate state of reactivity compared to euploid microglia. The pseudotime score correlated with microglial reactivity as illustrated by the activation of the MHC-II (Supplementary Figure 4C). This finding concur with previous studies showing that steady stage microglia lack MHC class II, but microglia reactivity is associated with MHC class II induction [42]. However, whether microglia MHC-II acts as antigen presentation for local T-cell activation in the CNS or modulates microglial signaling is a subject of debate [42]. This higher degree of microglial reactivity in individuals with DS and in DS mouse models has been described by different techniques such as morphological [3,26,43] and transcriptomic [32], analysis. These techniques, however, are not able to capture the different levels or degrees of reactive microglia. As a matter of fact, there is a debate about whether the classical dualistic classification “resting versus activated” should be reviewed and reevaluated according to recent single-cell technologies and multi-omics data. Though, instead of using a single gene or protein marker to identify microglial states, the combination of different markers and fate-mapping approaches would better capture the population diversity of microglial cells [5]. These studies highlight that the degree of microglial reactivity extends beyond the classical phenotypes and that multiple intermediate states can coexist at the same time [5]. Therefore, a plethora of context-dependent microglial states that differ between species and models. Recently, scRNA-seq studies have identified different microglial transcriptional signatures typical of disease models such as DAMs [12], microglial neurodegenerative phenotype (MGnD) [13] and activated response microglia (ARMs) [14], human AD microglia (HAMs) [15] and of aging including white matter-associated microglia (WAM) [44] and axon tract-associated microglia (ATMs) [45] among others. Every microglial state is associated with particular functions in the brain. It is known that different modifying factors including, age, sex, local signals or peripheral signals can influence microglial states [46,47]. Microglia also respond to different neurodevelopmental, neurological and neurodegenerative disorders by changing their molecular profile, morphology, motility and function [48,49]. We found 10 genes that were significantly differentially expressed in trisomic microglia that overlapped with DAM signature including Csmd3, which was the top downregulated gene in microglia. It was reported that deficiency in Csmd3 gene impaired synaptogenesis and neuronal development [50]. Likewise, Csmd3 deficiency promotes growth retardation, abnormal cortex development, and neurodevelopmental-related phenotypes such as lower body weight and brain size that is accompanied by defective memory in the novel object recognition test, impaired sociability, among others [50]. Whether the microglial downregulation of Csmd3 is directly related with neuronal and cognitive alterations will require further studies. However, the transcriptomic deregulation that we found in trisomic microglia extended beyond DAM markers since we also detected a downregulation of Inpp5d or Bin1 [14], which are markers associated with ARMs or reduced expression of Tnfrsf21 and Tln2, that are related to HAMs [15]. The fact that the transcriptomic signature of trisomic microglia share markers with distinct functional microglial states adds a layer of complexity in understanding the cellular and molecular mechanisms by which trisomic microglia might contribute to either maintain or disturb brain homeostasis in DS.
Although the consequences of this transcriptomic shift in the trisomic microglial population are difficult to anticipate, one possible explanation might be that a higher trisomic microglia reactivity state would promote the release of different proinflammatory cytokines such as IL-6 and TNF-𝛼 that might contribute to neuroinflammation that is reported in individuals with DS [51,52]. Given that reactive microglia is already detected early during neurodevelopment both in individuals with DS [18,19,20,21] and in DS mouse models [3,22,25,26,27,28], neuroinflammation could be explained by this increased microglial reactivity. In addition to that, it is also known that microglial reactivity increases with aging in DS [53,54], which might also contribute to the progression of DS neuropathology. However, whether microglial reactivity contributes to neuroinflammation or vice versa is not completely understood. As a matter of fact, different studies have shown that restoring microglial homeostasis with different strategies in mouse models of DS was effective to recover different neuronal alterations and recover cognitive and behavioral abilities and even reduce inflammatory markers [3,26].
In conclusion, our study contributes valuable information regarding the cell-type-specific alterations in microglial gene expression associated with trisomy in the Ts65Dn mouse model. The observed changes in transcriptomic profiles and reactivity states provide a foundation for further investigations into the underlying mechanisms and potential therapeutic targets for neurodevelopmental disorders associated with trisomy.
4. Materials and Methods
- Animals
Ts(1716)65Dn (Ts65Dn) mice were obtained through crossings of a B6EiC3Sn a/A-Ts (1716)65Dn (Ts65Dn) female to B6C3F1/J males purchased from The Jackson Laboratory (Bar Harbor, USA). Genotyping was performed by amplifying genomic DNA obtained from the mice tail as described in (Liu et al., 2003). Mice had access to food and water ad libitum in controlled laboratory conditions with temperature maintained at 22 ± 1ºC and humidity at 55 ± 10% on a 12h light/dark cycle (lights off 20:00 h). Mice were socially housed in numbers of two to four littermates. The colony of Ts65Dn mice was maintained in the Animal Facilities in the Barcelona Biomedical Research Park (PRBB, Barcelona, Spain).
According to Directive 63/2010 and Member States’ implementation of it, all trials followed the "Three Rs" principle of replacement, reduction, and refinement. The investigation was conducted in accordance with the Standards for Use of Laboratory Animals No. A5388-01 (NIH) and local (Law 32/2007) and European regulations as well as MDS 0040P2 and the Ethics Committee of Parc de Recerca Biomèdica (Comité Ético de Experimentación Animal del PRBB (CEEA-PRBB)). A/ES/05/I-13 and A/ES/05/14 grant the CRG permission to work with genetically modified organisms. See the Ethics section for further information.
- Histology
- Immunohistochemistry
In order to quantify Iba1 and CD-68 positive cells in the hippocampus, WT and Ts65Dn mice were transcardially perfused with ice-cold PBS followed by 4% paraformaldehyde (PFA) in PBS (pH 7.4). Brains were extracted and post-fixed in 4% PFA at 4ºC overnight. Brains were then transferred to PBS and 40 μm coronal consecutive brain sections were obtained employing a vibratome (Leica VT1200S, Leica Microsystems), collected in PBS and stored in cryoprotective solution (40% PBS, 30%, glycerol and 30% polyethylene glycol) for long-term storage. For immunofluorescence studies, 4-6 sections per mice were selected according to stereotaxic coordinates Bregma, -1.54 to -2.54 mm, (mouse brain atlas [55]) with the aid of a bright-field microscope (Zeiss Cell Observer HS; Zeiss). Brain sections were washed with PBS (3 x 10 min). Then, sections were permeabilized with 0.5 % Triton X-100 in PBS (PBS-T 0.5 %) (3 x 15 min) and blocked with 10% of Normal Goat Serum (NGS) for two h at room temperature (RT). Sections incubated in PBS-T 0.5% and NGS 5 % with the primary antibodies overnight at 4ºC washed again (PBS-T 0.5 % 3x15 min) and incubated with the secondary antibodies (PBS-T 0.5 % + NGS 5 %) for two h at room temperature protected from light. Finally, samples were washed with PBS-T 0.5 % (3x15 min) followed by PBS washing (3x10 min) to remove the detergent and sections were mounted and coverslipped into a pre-cleaned glass slide with Fluoromount-G medium with DAPI (Thermo Fisher Scientific #00-4959-52). Iba1 was stained with rabbit anti-Iba1 (1:1000, Wako Chemicals, #019-19741) and visualized with anti-rabbit Alexa-647 (1:500; Thermo Fisher Scientific, #A-21443). CD-68 was stained with rat anti-CD-68 (1:2500; Santa Cruz, #ab53444) and visualized with anti-rat Alexa-488 (1:500; Thermo Fisher Scientific, #A-11006). Prior to immunostaining, an optimization of the primary antibodies and PBS-T conditions was performed. Serial dilutions of primary antibodies ranging from 1:100 to 1:1000 were prepared while maintaining the secondary antibody concentration constant (1:500). By confocal microscopy, the best primary antibody concentration was selected taking into account the achievement of low background noise and the signal level obtained with the same laser configuration.
- Cell counting
In order to quantify the number of Iba1+ cells and Iba1+; CD-68+ cells in CA1 region, 40 µm coronal sections were taken from the dorsal hippocampus in the coordinates -1,54 to -2,54 mm AP (relative to bregma). Cell densities are expressed as cells/mm2. Confocal fluorescence images were acquired on a Leica SP8 scanning laser microscope using a 20x/0.70 NA objective. Cell counting was performed using the Cell Counter plugin on ImageJ software (NIH, Bethesda) in a z-stack (3 μm step size). The stratum radiatum CA1 layer was selected as region of interest (ROI) and was manually delineated according to the DAPI signal in every section.
Alexa 488 and Alexa 647 channels were filtered and combined to produce composite images. Equal cutoff thresholds were applied to remove signal background from images. The number of double positive (Iba1+ and CD-68) and single positive (Iba1+) cells were counted in CA1 stratum radiatum in 3 consecutive (spaced 200 μm between them) per mouse. Data was analyzed using R studio. Imaging and quantifications were performed blind to experimental conditions.
- Single Nucleus RNA sequencing
- Nucleus isolation
Mice were sacrificed by cervical dislocation and hippocampus were dissected and placed in cold Hanks’ Balanced Salt Solution (Sigma #55021C). To obtain a nuclei suspension, the "Frankenstein" procedure was used [56]. Each hippocampus was placed in a fresh tube with 500 μL cold EZ lysis buffer (Sigma #3408) and a sterile RNase-free douncer (Mettler Toledo #K-749521-1590) was used to homogenize the buffer. To eliminate any leftover material fragments, the homogenate was filtered through a 70 μm-strainer mesh and centrifuged at 500 g for 5 min at 4 ºC. The nuclei pellet was resuspended in 1.5 mL EZ Lysis Buffer and centrifuged again. Supernatant was discarded and 500 μL of Nuclei Wash and Resuspension Buffer (NWRB, 1X PBS, 1% BSA and 0.2 U/μL RNase inhibitor (Thermo Scientific #N8080119) was added to the pellet. After incubation, the pellet was resuspended in 1mL of NWRB. The nuclei suspension was centrifuged once again, and the washing step with 1.5 mL of NWRB was repeated. Nuclei were then resuspended in 500 μL of 1:1000 anti-NeuN antibody conjugated with Alexa Fluor 647 (Abcam, #ab190565) in PBS and incubated in rotation for 15 min at 4 ºC. Nuclei were rinsed with 500 μL of NWRB and centrifuged again after incubation. To create a single-nuclei suspension, nuclei were resuspended in NWRB mixed with DAPI and filtered through a 35 μm cell strainer.
- 10x single-cell barcoding, library preparation and sequencing
NeuN negative neuronal nuclei were sorted using fluorescent activated nuclear sorting (FANS). 10.000 nuclei from each sample were sorted directly into a 96-well plate prefilled with 10X RT buffer prepared without the RT Enzyme Mix using a 70 μm nozzle to minimize the volume deposited. Following sorting, RT Enzyme C was added, and the volume of each well was increased to 80 μL with nuclease free water. The Chromium Single Cell Chip was loaded with 75μL of the nuclei plus RT mix. The manufacturer’s instructions (10x Genomics Chromium Single Cell Kit Version 3) were followed for all downstream cDNA synthesis, library preparation, and sequencing. Libraries were sequenced on a NovaSeq 6000 S1 to an average depth of approximately 20.000 reads per cell.
- 10x data pre-processing
The readings were matched to the reference genome, including exons and introns, and transformed to mRNA molecule counts using the manufacturer’s Cellranger pipeline (CellRanger v3.0.1). For every nucleus, we quantified the number of genes for which at least one read was mapped, and then discarded any nuclei with fewer than 200 or more than 2500 genes, respectively, to eliminate low quality nuclei and duplets. Genes found in fewer than six nuclei were discarded. To normalize for differences in coverage, expression values Ei,j for gene I in cell j were calculated by dividing UMI counts for gene I by the sum of UMI counts in nucleus j, multiplying by 10,000 to create TP10K (transcript per 10,000) values, and finally computing log2(TP10K + 1) (using the NormalizeData function from the Seurat package v.2.3.4) [57].
- Batch Correction and scaling data matrix
Since samples were processed in two different experiments, batch correction and data scaling was done as described in [35]. Briefly, Harmony [58] was used on the normalized dataset and then the data was scaled using the ScaleData function from Seurat. The scaled data matrix was then used for dimensionality reduction and clustering.
- Dimensionality reduction, clustering and visualization
Using the RunPCA method in Seurat, we computed the top 60 principle components using the scaled expression matrix restricted to the variable genes. UMAP (Uniform Manifold Approximation and Projection) used the scores from these principal components as input to downstream grouping and visualization (UMAP). The FindNeighbors and FindClusters functions in Seurat (resolution = 0.05) were used to cluster the data. After that, using UMAP, the clusters were visualized. Before integrating with the IntegrateData function, reference anchors between genotypes were found, and the combined data was analyzed using the same procedures.
SingleR (version 1.0.6) [59] was used for single-cell annotation based on the "MouseRNAseqData" dataset from the celldex package (version 1.0.0) and using the “label.main” to assign cell subtypes. Clusters at a resolution of 0.05 were annotated based on the most prevalent predicted cell subtypes. The annotation was further refined by mapping the most enriched genes for each cluster (identified using the FindAllMarkers function) to the cell types of the Linnarson mouse atlas [60].
- Identification of marker genes within every cluster
The FindAllMarkers function was used to find cluster-specific marker genes using a negative binomial distribution (DESeq2). A marker gene was defined as having a detectable expression in > 20% of the cells from the related cluster and being >0.25 log-fold greater than the mean expression value in the other clusters. We were able to choose markers that were highly expressed within each cluster while still being restricted to genes unique to each individual cluster.
- Identification of differentially expressed genes between WT and Ts65Dn
Within each cell type, WT and TS samples were compared for differential gene expression using Seurat’s FindMarkers function. To be included in the analysis, the gene had to be expressed in at least 10% of the cells from one of the two groups for that cell type and there had to be at least a 0.25 fold change in gene expression between genotypes. After correcting for multiple testing, only genes with a p adjusted value < 0.001 were considered for downstream analyses.
- Gene set enrichment
Using a hypergeometric test (shinyGO) [61], the differential expression signatures from each cellular subtype were examined for enriched Gene Ontology processes. Processes were classified as considerably enriched when their p-adjusted value was less than 0.05. The universe for the hypergeometric test was the entire list of genes found in the dataset.
- Cellular proportion
The proportional fraction of nuclei in each cell type was standardized to the total number of nuclei taken from each library to acquire insight into cell type variations in the trisomic hippocampus. We used single cell differential composition analysis (scDC) to bootstrap proportion estimates for our samples to see if any changes in cell-type proportion were statistically significant [62].
- Disease-associated microglia (DAM) markers
We compared the DEGs of trisomic microglia with the DAM transcriptional signature of previously published datasets [37,38] and revealed a significant enrichment for DAM-associated genes.
- Pseudotime analysis
To infer the pseudotime of microglia in both conditions we used functions provided with the Monocle 2 package (version 2.6.4) [63,64]. The cell trajectory was defined based on the top 50 most differentially expressed genes between the two microglial clusters, corresponding to the two states of activation.
- Statistical analysis
When two conditions were compared, the Shapiro-Wilks test was conducted to check the normality of the data and Fisher’s F test was used to assess the homogeneity of variances between groups. When data met the assumptions of parametric distribution, results were analyzed by unpaired student’s t-test. Paired t-tests were employed to compare paired variables. Mann-Whitney-Wilcoxon test was applied in cases where the data did not meet the requirements of normal distribution. Statistical analyses were two-tailed. The statistical test used is indicated in every Figure. Differences in means were considered statistically significant at p < 0.05.
Data analysis and statistics were performed using R studio (Version 1.1.463).
Supplementary Materials
The following supporting information can be downloaded at the website of this paper posted on Preprints.org. Figure S1: title; Table S1: title; Video S1: title.
Author Contributions
MD, AFB and CS conceived, designed and coordinated the study, and wrote the manuscript. CS collected the sequencing datasets and analyzed them with CT. AFB prepared the figures and performed the immunofluorescence studies and analysis. All authors revised and corrected the final version of the manuscript.
Funding
The lab of MD is recognized by the Secretaria d’Universitats i Recerca del Departament d’Economia I Coneixement de la Generalitat de Catalunya (Grups consolidats 2023). This project has received funding from the Agencia Estatal de Investigación (PID2019- 110755RB-I00/AEI/10.13039/501100011033; PID2022-141900OB-I00 INTO-DS), from the European Union’s Horizon 2020 research and innovation program under grant agreement No 848077 and 899986, Jerôme Lejeune Foundation #2002, Fundació La Marató-TV3 (#2016/20-30), JPND Heroes Ministerio de Ciencia Innovación y Universidades (RTC2019-007230-1, RTC2019-007329-1; and CPP2022-009659). The CIBER of Rare Diseases is an initiative of the ISCIII. C.S. received the FI grant from Agència de Gestió d’Ajuts Universitaris i de Recerca (AGAUR) de la Generalitat de Catalunya, and A.F.B. received an FPI-SO fellowship (PRE2018-084504).
Data Availability Statement
Acknowledgments
Figure 1A was created with BioRender.com. We would like to thank the Advanced Light Microscopy Unit (ALMU) at the CRG for their support in the confocal data acquisition process. We acknowledge support of the Spanish Ministry of Science and Innovation through the Centro de Excelencia Severo Ochoa (CEX2020-001049-S, MCIN/AEI /10.13039/501100011033), the Generalitat de Catalunya through the CERCA programme and to the EMBL partnership. We are grateful to the CRG Core Technologies Programme for their support and assistance in this work.
Conflicts of Interest
The authors declare no conflicts of interest.
References
- Ross MH, Galaburda AM, Kemper TL. Down’s syndrome: Is there a decreased population of neurons? Neurology. 1984;34(7):909–16. [CrossRef]
- Guidi S, Bonasoni P, Ceccarelli C, Santini D, Gualtieri F, Ciani E, et al. Neurogenesis impairment and increased cell death reduce total neuron number in the hippocampal region of fetuses with Down syndrome. Brain Pathol. 2008. [CrossRef]
- Pinto B, Morelli G, Rastogi M, Savardi A, Fumagalli A, Petretto A, et al. Rescuing Over-activated Microglia Restores Cognitive Performance in Juvenile Animals of the Dp(16) Mouse Model of Down Syndrome. Neuron . 2020 Dec 9 ;108(5):887-904.e12. Available from: 10.1016/J.NEURON.2020.09.010. [CrossRef]
- Nimmerjahn A, Kirchhoff F, Helmchen F. Neuroscience: Resting microglial cells are highly dynamic surveillants of brain parenchyma in vivo. Science (80- ) . 2005 May 27 ;308(5726):1314–8. Available from: 10.1126/SCIENCE.1110647/SUPPL_FILE/1110647S9.MOV. [CrossRef]
- Paolicelli RC, Sierra A, Stevens B, Tremblay ME, Aguzzi A, Ajami B, et al. Microglia states and nomenclature: A field at its crossroads. Neuron . 2022 Nov 2 ;110(21):3458–83. Available from: 10.1016/J.NEURON.2022.10.020. [CrossRef]
- Sarlus H, Heneka MT. Microglia in Alzheimer’s disease. J Clin Invest . 2017 Sep 1 ;127(9):3240–9. Available from: 10.1172/JCI90606. [CrossRef]
- Cserép C, Pósfai B, Lénárt N, Fekete R, László ZI, Lele Z, et al. Microglia monitor and protect neuronal function through specialized somatic purinergic junctions. Science (80- ) . 2020 Jan 31 ;367(6477):528–37. Available from: 10.1126/SCIENCE.AAX6752/SUPPL_FILE/AAX6752_S7.MOV. [CrossRef]
- Prinz M, Jung S, Priller J. Microglia Biology: One Century of Evolving Concepts. Cell . 2019 Oct 3 ;179(2):292–311. Available from: 10.1016/J.CELL.2019.08.053. [CrossRef]
- Cornell J, Salinas S, Huang HY, Zhou M. Microglia regulation of synaptic plasticity and learning and memory. Neural Regen Res . 2022 Apr 1 ;17(4):705–16. Available from: 10.4103/1673-5374.322423. [CrossRef]
- Woodburn SC, Bollinger JL, Wohleb ES. The semantics of microglia activation: neuroinflammation, homeostasis, and stress. J Neuroinflammation 2021 181 . 2021 Nov 6 ;18(1):1–16. Available from: 10.1186/S12974-021-02309-6. [CrossRef]
- Provenzano F, Pérez MJ, Deleidi M. Redefining Microglial Identity in Health and Disease at Single-Cell Resolution. Trends Mol Med . 2021 Jan 1 ;27(1):47–59. Available from: 10.1016/J.MOLMED.2020.09.001 . [CrossRef]
- Keren-Shaul H, Spinrad A, Weiner A, Matcovitch-Natan O, Dvir-Szternfeld R, Ulland TK, et al. A Unique Microglia Type Associated with Restricting Development of Alzheimer’s Disease. Cell . 2017 Jun 15 ;169(7):1276-1290.e17. Available from: 10.1016/J.CELL.2017.05.018. [CrossRef]
- Krasemann S, Madore C, Cialic R, Baufeld C, Calcagno N, El Fatimy R, et al. The TREM2-APOE Pathway Drives the Transcriptional Phenotype of Dysfunctional Microglia in Neurodegenerative Diseases. Immunity . 2017 Sep 19 ;47(3):566-581.e9. Available from: 10.1016/J.IMMUNI.2017.08.008. [CrossRef]
- Sala Frigerio C, Wolfs L, Fattorelli N, Thrupp N, Voytyuk I, Schmidt I, et al. The Major Risk Factors for Alzheimer’s Disease: Age, Sex, and Genes Modulate the Microglia Response to Aβ Plaques. Cell Rep . 2019 Apr 23 ;27(4):1293-1306.e6. Available from: 10.1016/J.CELREP.2019.03.099. [CrossRef]
- Srinivasan K, Friedman BA, Etxeberria A, Huntley MA, van der Brug MP, Foreman O, et al. Alzheimer’s Patient Microglia Exhibit Enhanced Aging and Unique Transcriptional Activation. Cell Rep . 2020 Jun 30 ;31(13). Available from: 10.1016/J.CELREP.2020.107843. [CrossRef]
- Absinta M, Maric D, Gharagozloo M, Garton T, Smith MD, Jin J, et al. A lymphocyte-microglia-astrocyte axis in chronic active multiple sclerosis. Nature . 2021 Sep 30 ;597(7878):709–14. Available from: 10.1038/S41586-021-03892-7. [CrossRef]
- Marschallinger J, Iram T, Zardeneta M, Lee SE, Lehallier B, Haney MS, et al. Lipid-droplet-accumulating microglia represent a dysfunctional and proinflammatory state in the aging brain. Nat Neurosci . 2020 Feb 1 ;23(2):194–208. Available from: 10.1038/S41593-019-0566-1. [CrossRef]
- Wierzba-Bobrowicz T, Lewandowska E, Schmidt-Sidor B, Gwiazda E. The comparison of microglia maturation in CNS of normal human fetuses and fetuses with Down’s syndrome. Folia Neuropathol . 1999 Jan 1 ;37(4):227–34.
- Xue QS, Streit WJ. Microglial pathology in Down syndrome. Acta Neuropathol . 2011 Oct 17 ;122(4):455–66. Available from: 10.1007/S00401-011-0864-5/METRICS. [CrossRef]
- Flores-Aguilar L, Iulita MF, Kovecses O, Torres MD, Levi SM, Zhang Y, et al. Evolution of neuroinflammation across the lifespan of individuals with Down syndrome. Brain . 2020 Dec 1 ;143(12):3653–71. Available from: 10.1093/BRAIN/AWAA326. [CrossRef]
- Martini AC, Helman AM, McCarty KL, Lott IT, Doran E, Schmitt FA, et al. Distribution of microglial phenotypes as a function of age and Alzheimer’s disease neuropathology in the brains of people with Down syndrome. Alzheimer’s Dement Diagnosis, Assess Dis Monit . 2020 Jan 1 ;12(1):e12113. Available from: 10.1002/DAD2.12113. [CrossRef]
- Colton CA, Yao J, Taffs RE, Keri JE, Oster-Granite ML. Abnormal production of interleukin-1 by microglia from trisomy 16 mice. Neurosci Lett. 1991 Nov 11;132(2):270–4. [CrossRef]
- Palmer CR, Liu CS, Romanow WJ, Lee MH, Chun J. Altered cell and RNA isoform diversity in aging down syndrome brains. Proc Natl Acad Sci U S A . 2021 Nov 23 ;118(47):e2114326118. Available from: 10.1073/PNAS.2114326118/SUPPL_FILE/PNAS.2114326118.SD10.XLSX. [CrossRef]
- Wilcock DM, Hurban J, Helman AM, Sudduth TL, McCarty KL, Beckett TL, et al. Down syndrome individuals with Alzheimer’s disease have a distinct neuroinflammatory phenotype compared to sporadic Alzheimer’s disease. Neurobiol Aging. 2015 Sep 1;36(9):2468–74. [CrossRef]
- Rueda N, Vidal V, García-Cerro S, Narcís JO, Llorens-Martín M, Corrales A, et al. Anti-IL17 treatment ameliorates Down syndrome phenotypes in mice. Brain Behav Immun. 2018 Oct 1;73:235–51. [CrossRef]
- Illouz T, Madar R, Biragyn A, Okun E. Restoring microglial and astroglial homeostasis using DNA immunization in a Down Syndrome mouse model. Brain Behav Immun. 2019 Jan 1;75:163–80. [CrossRef]
- Lockrow J, Boger H, Bimonte-Nelson H, Granholm AC. Effects of long-term memantine on memory and neuropathology in Ts65Dn mice, a model for Down syndrome. Behav Brain Res. 2011 Aug 10;221(2):610–22. [CrossRef]
- Hamlett ED, Hjorth E, Ledreux A, Gilmore A, Schultzberg M, Granholm AC. RvE1 treatment prevents memory loss and neuroinflammation in the Ts65Dn mouse model of Down syndrome. Glia . 2020 Jul 1 ;68(7):1347–60 Available from: 10.1002/GLIA.23779. [CrossRef]
- Gupta M, Dhanasekaran AR, Gardiner KJ. Mouse models of Down syndrome: gene content and consequences. Mamm Genome 2016 2711 . 2016 Aug 18 ;27(11):538–55. Available from: 10.1007/S00335-016-9661-8. [CrossRef]
- Rueda N, Flórez J, Martínez-Cué C. Mouse models of down syndrome as a tool to unravel the causes of mental disabilities. Neural Plast. 2012;2012.
- Olmos-Serrano JL, Kang HJ, Tyler WA, Silbereis JC, Cheng F, Zhu Y, et al. Down Syndrome Developmental Brain Transcriptome Reveals Defective Oligodendrocyte Differentiation and Myelination. Neuron . 2016 Mar 16 ;89(6):1208–22. Available from: 10.1016/J.NEURON.2016.01.042. [CrossRef]
- Zhou Z, Zhi C, Chen D, Cai Z, Jiang X. Single-nucleus RNA sequencing reveals cell type-specific transcriptome alterations of Down syndrome hippocampus using the Dp16 mouse model. Genes Genomics . 2023 Oct 1 ;45(10):1305–15. Available from: 10.1007/S13258-023-01433-2. [CrossRef]
- Qiu JJ, Liu YN, Wei H, Zeng F, Yan J Bin. Single-cell RNA sequencing of neural stem cells derived from human trisomic iPSCs reveals the abnormalities during neural differentiation of Down syndrome. Front Mol Neurosci . 2023 ;16. Available from: 10.3389/FNMOL.2023.1137123. [CrossRef]
- Ponroy Bally B, Farmer WT, Jones E V., Jessa S, Kacerovsky JB, Mayran A, et al. Human iPSC-derived Down syndrome astrocytes display genome-wide perturbations in gene expression, an altered adhesion profile, and increased cellular dynamics. Hum Mol Genet. 2020;29(5):785–802. [CrossRef]
- Sierra C, Sabariego-Navarro M, Fernández-Blanco Á, Cruciani S, Zamora-Moratalla A, Novoa EM, et al. The lncRNA Snhg11, a new candidate contributing to neurogenesis, plasticity and memory deficits in Down syndrome. Res Sq . 2023 Sep 25 ;rs.3.rs-3184329. Available from: 10.21203/RS.3.RS-3184329/V1. [CrossRef]
- Jones RE, Andrews R, Holmans P, Hill M, Taylor PR. Modest changes in Spi1 dosage reveal the potential for altered microglial function as seen in Alzheimer’s disease. Sci Reports 2021 111 . 2021 Jul 22 [cited 2024 Jan 22];11(1):1–14. Available from: 10.1038/s41598-021-94324-z. [CrossRef]
- Reifschneider A, Robinson S, Van Lengerich B, Gnörich J, Logan T, Heindl S, et al. Loss of TREM2 rescues hyperactivation of microglia, but not lysosomal deficits and neurotoxicity in models of progranulin deficiency. EMBO J . 2022 Feb 15 [cited 2024 Jan 26];41(4). Available from: 10.15252/EMBJ.2021109108. [CrossRef]
- Sobue A, Komine O, Hara Y, Endo F, Mizoguchi H, Watanabe S, et al. Microglial gene signature reveals loss of homeostatic microglia associated with neurodegeneration of Alzheimer’s disease. Acta Neuropathol Commun 2020 91 . 2021 Jan 5 [cited 2024 Jan 26];9(1):1–17. Available from: 10.1186/S40478-020-01099-X. [CrossRef]
- Gally F, Rao DM, Schmitz C, Colvin KL, Yeager ME, Perraud AL. The TRPM2 ion channel contributes to cytokine hyperproduction in a mouse model of Down Syndrome. Biochim Biophys Acta - Mol Basis Dis. 2018 Jan 1;1864(1):126–32. [CrossRef]
- Wilcock DM, Griffin WST. Down’s syndrome, neuroinflammation, and Alzheimer neuropathogenesis. J Neuroinflammation . 2013 Jul 16 ;10. Available from: 10.1186/1742-2094-10-84. [CrossRef]
- Seol S, Kwon J, Kang HJ. Cell type characterization of spatiotemporal gene co-expression modules in Down syndrome brain. iScience . 2022 Jan 20 ;26(1). Available from: 10.1016/J.ISCI.2022.105884. [CrossRef]
- Wolf Y, Shemer A, Levy-Efrati L, Gross M, Kim JS, Engel A, et al. Microglial MHC class II is dispensable for experimental autoimmune encephalomyelitis and cuprizone-induced demyelination. Eur J Immunol . 2018 Aug 1 ;48(8):1308–18. Available from: 10.1002/EJI.201847540. [CrossRef]
- Vázquez-Oliver A, Pérez-García S, Pizarro N, Molina-Porcel L, Torre R de la, Maldonado R, et al. Long-term decreased cannabinoid type-1 receptor activity restores specific neurological phenotypes in the Ts65Dn mouse model of Down syndrome. bioRxiv . 2021 Nov 22 ;2021.11.22.469296. Available from: 10.1101/2021.11.22.469296. [CrossRef]
- Safaiyan S, Besson-Girard S, Kaya T, Cantuti-Castelvetri L, Liu L, Ji H, et al. White matter aging drives microglial diversity. Neuron . 2021 Apr 7 ;109(7):1100-1117.e10. Available from: 10.1016/J.NEURON.2021.01.027. [CrossRef]
- Hammond TR, Dufort C, Dissing-Olesen L, Giera S, Young A, Wysoker A, et al. Single-Cell RNA Sequencing of Microglia throughout the Mouse Lifespan and in the Injured Brain Reveals Complex Cell-State Changes. Immunity . 2019 Jan 15 ;50(1):253-271.e6. Available from: 10.1016/J.IMMUNI.2018.11.004. [CrossRef]
- Erny D, De Angelis ALH, Jaitin D, Wieghofer P, Staszewski O, David E, et al. Host microbiota constantly control maturation and function of microglia in the CNS. Nat Neurosci . 2015 Jun 25 ;18(7):965–77. Available from: 10.1038/NN.4030. [CrossRef]
- Thion MS, Low D, Silvin A, Chen J, Grisel P, Schulte-Schrepping J, et al. Microbiome Influences Prenatal and Adult Microglia in a Sex-Specific Manner. Cell . 2018 Jan 25 ;172(3):500-516.e16. Available from: 10.1016/J.CELL.2017.11.042. [CrossRef]
- Deczkowska A, Keren-Shaul H, Weiner A, Colonna M, Schwartz M, Amit I. Disease-Associated Microglia: A Universal Immune Sensor of Neurodegeneration. Cell . 2018 May 17 ;173(5):1073–81. Available from: 10.1016/j.cell.2018.05.003. [CrossRef]
- Song WM, Colonna M. The identity and function of microglia in neurodegeneration. Nat Immunol 2018 1910 . 2018 Sep 24 ;19(10):1048–58. Available from: 10.1038/s41590-018-0212-1. [CrossRef]
- Song W, Li Q, Wang T, Li Y, Fan T, Zhang J, et al. Putative complement control protein CSMD3 dysfunction impairs synaptogenesis and induces neurodevelopmental disorders. Brain Behav Immun . 2022 May 1 ;102:237–50. Available from: 10.1016/J.BBI.2022.02.027. [CrossRef]
- Kálmán J, Juhász A, Laird G, Dickens P, Járdánházy T, Rimanóczy Á, et al. Serum interleukin-6 levels correlate with the severity of dementia in Down syndrome and in Alzheimer’s disease. Acta Neurol Scand . 1997 Oct 1 ;96(4):236–40. Available from: 10.1111/J.1600-0404.1997.TB00275.X. [CrossRef]
- Zhang Y, Che M, Yuan J, Yu Y, Cao C, Qin XY, et al. Aberrations in circulating inflammatory cytokine levels in patients with Down syndrome: a meta-analysis. Oncotarget . 2017 Oct 10 ;8(48):84489. Available from: 10.18632/ONCOTARGET.21060. [CrossRef]
- Wilcock, DM. Neuroinflammation in the aging down syndrome brain; Lessons from Alzheimer’s disease. Curr Gerontol Geriatr Res. 2012;2012.
- García O, Flores-Aguilar L. Astroglial and microglial pathology in Down syndrome: Focus on Alzheimer’s disease. Front Cell Neurosci . 2022 Sep 20 [cited 2022 Dec 1];16. Available from: 10.3389/FNCEL.2022.987212. [CrossRef]
- Paxinos and Franklin’s the Mouse Brain in Stereotaxic Coordinates - George Paxinos, Keith B.J. Franklin - Google Libros . [cited 2022 Dec 11].
- Martelotto LG. ‘Frankenstein’ protocol for nuclei isolation from fresh and frozen tissue for snRNAseq. 2020 Mar 6 [cited 2022 Dec 11]; Available from: 10.17504/PROTOCOLS.IO.3FKGJKW. [CrossRef]
- Hochgerner H, Zeisel A, Lönnerberg P, Linnarsson S. Conserved properties of dentate gyrus neurogenesis across postnatal development revealed by single-cell RNA sequencing. Nat Neurosci . 2018 Feb 1 [cited 2022 Dec 1];21(2):290–9. Available from: 10.1038/S41593-017-0056-2. [CrossRef]
- Korsunsky I, Millard N, Fan J, Slowikowski K, Zhang F, Wei K, et al. Fast, sensitive and accurate integration of single-cell data with Harmony. Nat Methods 2019 1612 . 2019 Nov 18 ;16(12):1289–96. Available from: 10.1038/s41592-019-0619-0. [CrossRef]
- Aran D, Looney AP, Liu L, Wu E, Fong V, Hsu A, et al. Reference-based analysis of lung single-cell sequencing reveals a transitional profibrotic macrophage. Nat Immunol 2019 202 . 2019 Jan 14 ;20(2):163–72. Available from: 10.1038/s41590-018-0276-y. [CrossRef]
- Zeisel A, Hochgerner H, Lönnerberg P, Johnsson A, Memic F, van der Zwan J, et al. Molecular Architecture of the Mouse Nervous System. Cell . 2018 Aug 9 ;174(4):999-1014.e22. Available from: 10.1016/j.cell.2018.06.021. [CrossRef]
- Ge SX, Jung D, Yao R. ShinyGO: a graphical gene-set enrichment tool for animals and plants. Bioinformatics. 2020 Apr 15;36(8):2628–9. [CrossRef]
- Cao Y, Lin Y, Ormerod JT, Yang P, Yang JYH, Lo KK. scDC: single cell differential composition analysis. BMC Bioinformatics. 2019 Dec 24;20(S19):721. [CrossRef]
- Qiu X, Hill A, Packer J, Lin D, Ma YA, Trapnell C. Single-cell mRNA quantification and differential analysis with Census. Nat Methods 2017 143 . 2017 Jan 23 ;14(3):309–15. Available from: 10.1038/nmeth.4150. [CrossRef]
- Trapnell C, Cacchiarelli D, Grimsby J, Pokharel P, Li S, Morse M, et al. The dynamics and regulators of cell fate decisions are revealed by pseudotemporal ordering of single cells. Nat Biotechnol 2014 324 . 2014 Mar 23 ;32(4):381–6. Available from: 10.1038/nbt.2859. [CrossRef]
Figure 1.
Single-nucleus sequencing and cell-type identification. (A) Overview of the experimental approach with a schematic showing the NeuN-negative cell sorting (see methods). Hippocampus of WT and Ts65Dn were collected and the nuclei suspension was prepared using enzymatic digestion and mechanical dissociation. Nuclei were incubated with anti-NeuN-Alexa647 and NeuN negative nuclei were selected by FANS and subsequently sequenced using 10x sequencing. (B) All hippocampus single nuclei embedded in UMAP, displaying cell clusters in different colors. Each dot represents a single nucleus. (C) Mapping of microglia (Cx3cr1), astroglia (Aqp4) and oligodendroglia (Mbp) markers. (D) Dotplot showing enrichment of canonical markers of microglia, oligodendroglia, astroglia, endothelial cells and neurons. (E) Proportion of the main cell populations both in WT and Ts65Dn hippocampus.
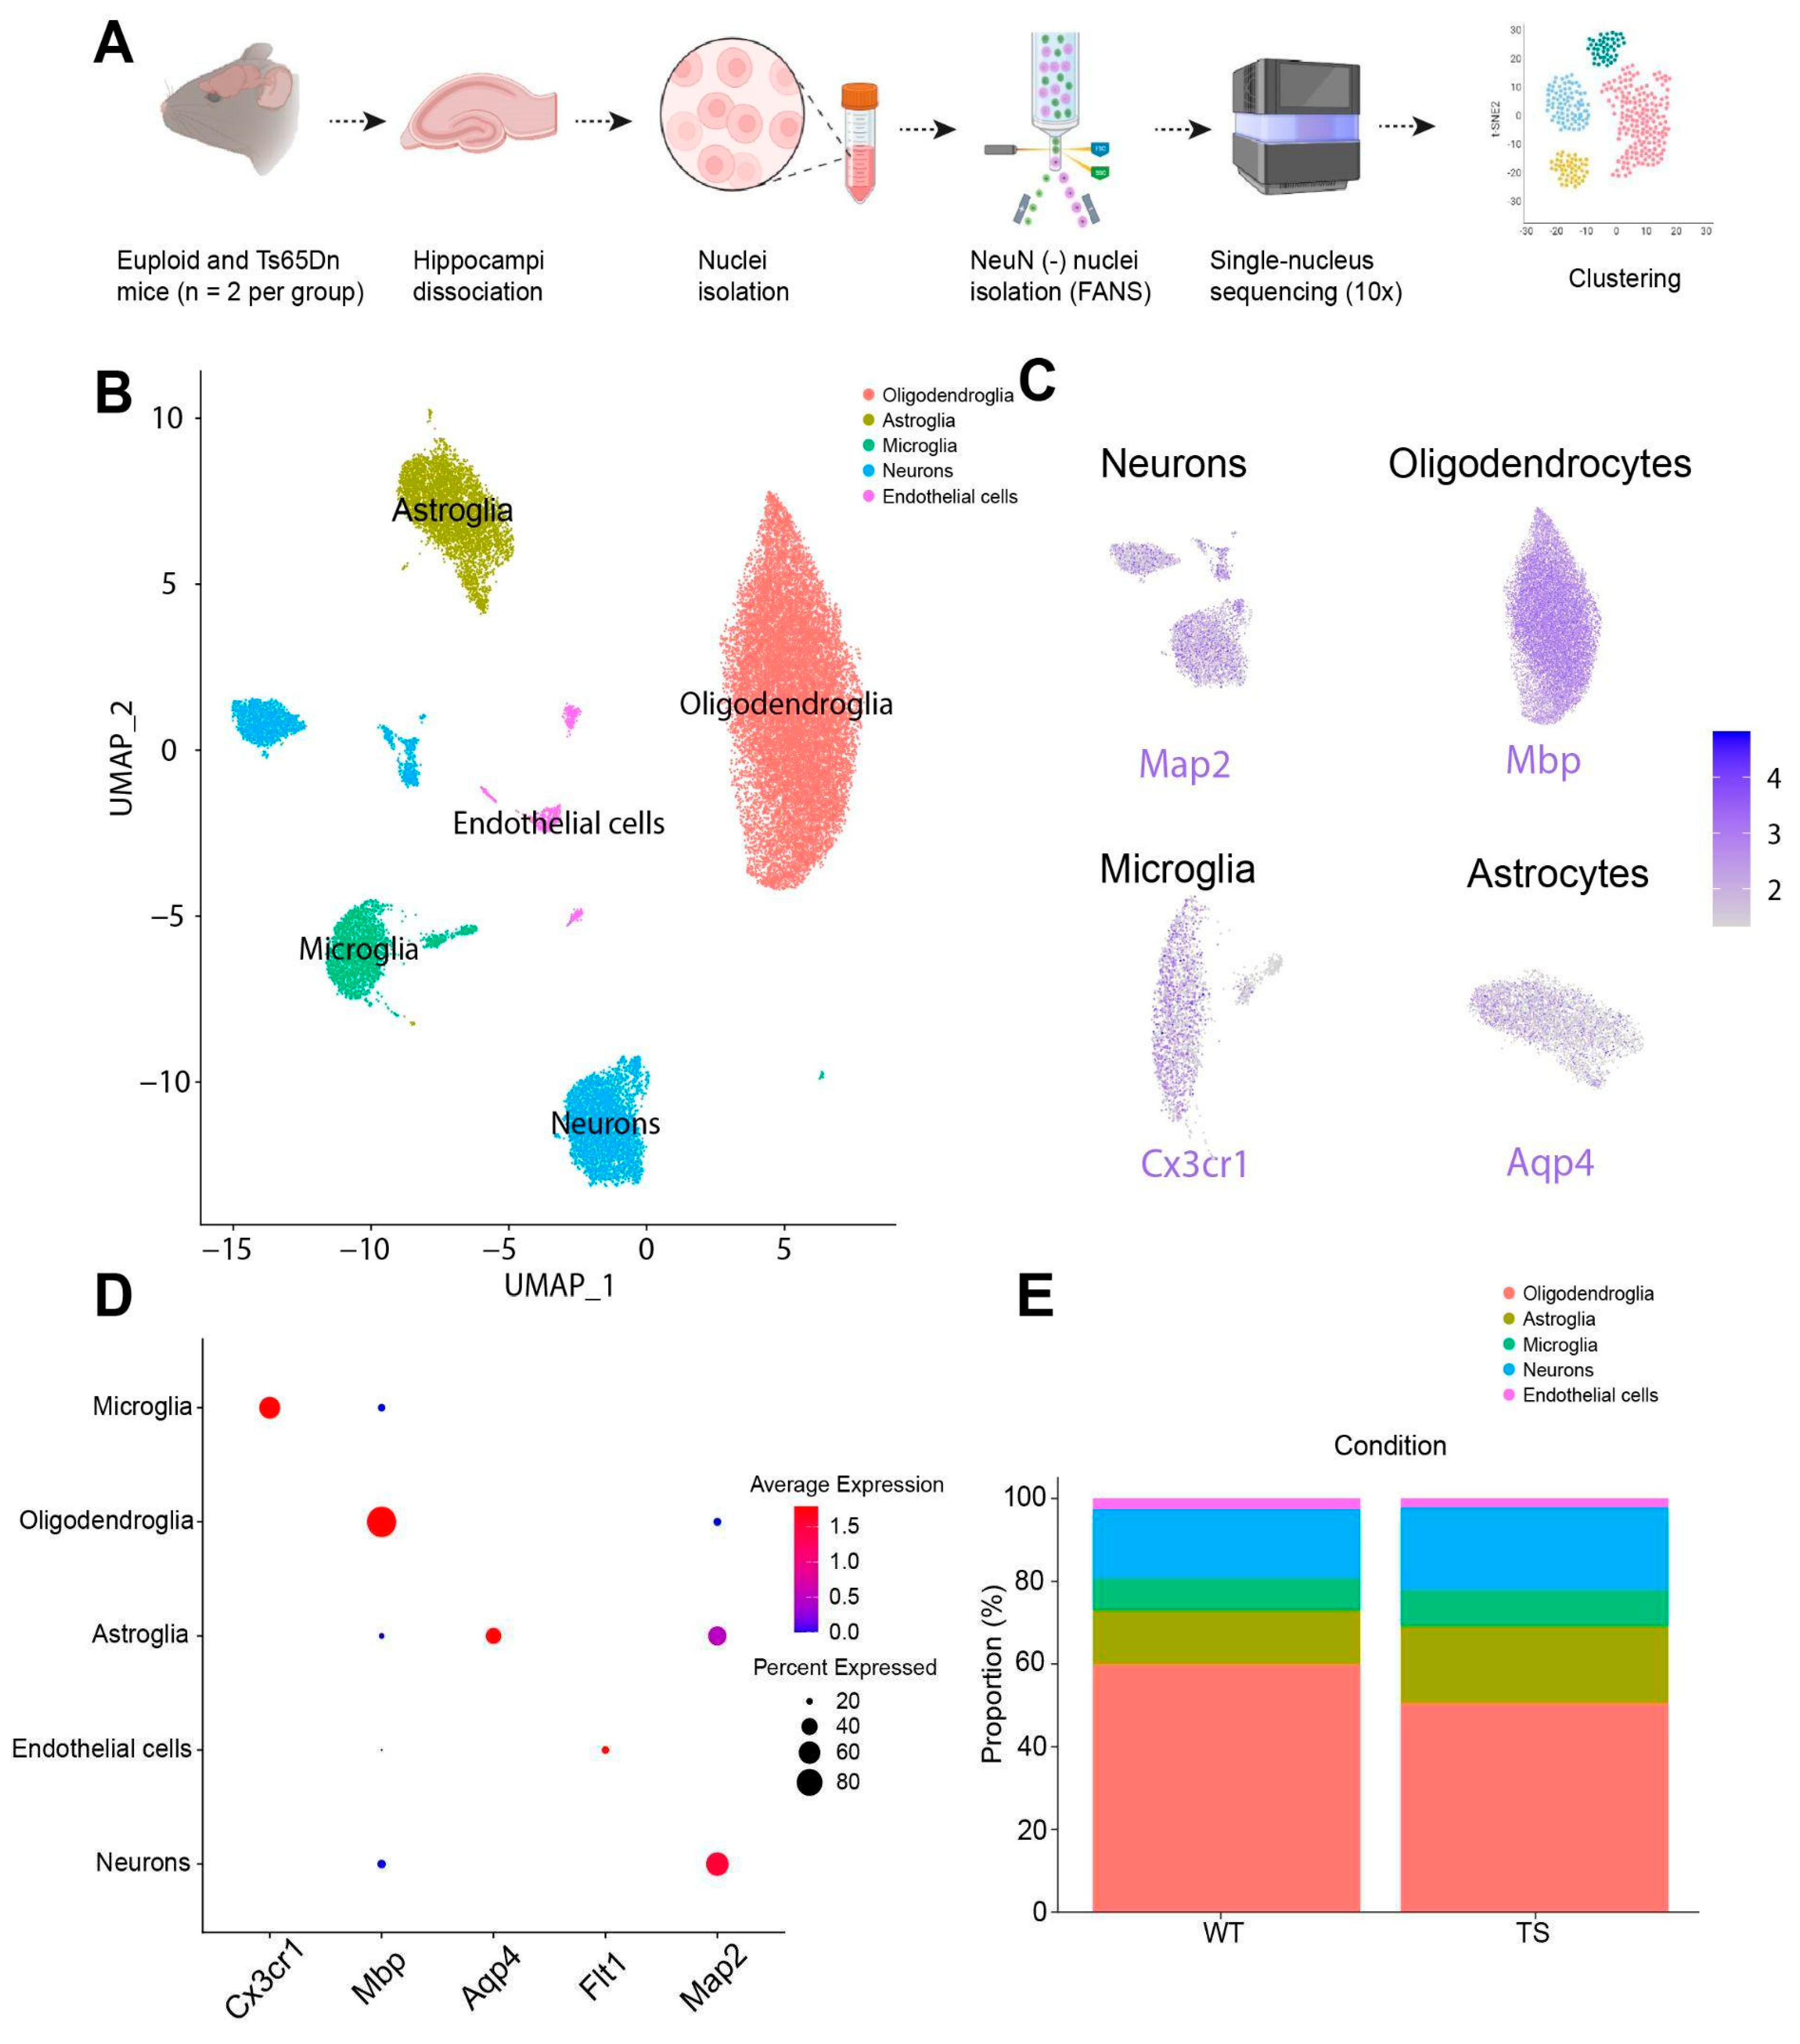
Figure 2.
Transcriptionally different cell populations within the Ts65Dn hippocampus. (A) Distribution of DEGs along the mouse chromosomes. (B) Volcano plot of DEGs colored by each major glial type. (C) Stripplot showing the average log fold change of the different DEGs colored by glial cell type. (D) Biological pathways enriched for DEGs identified in each major glial cell type.
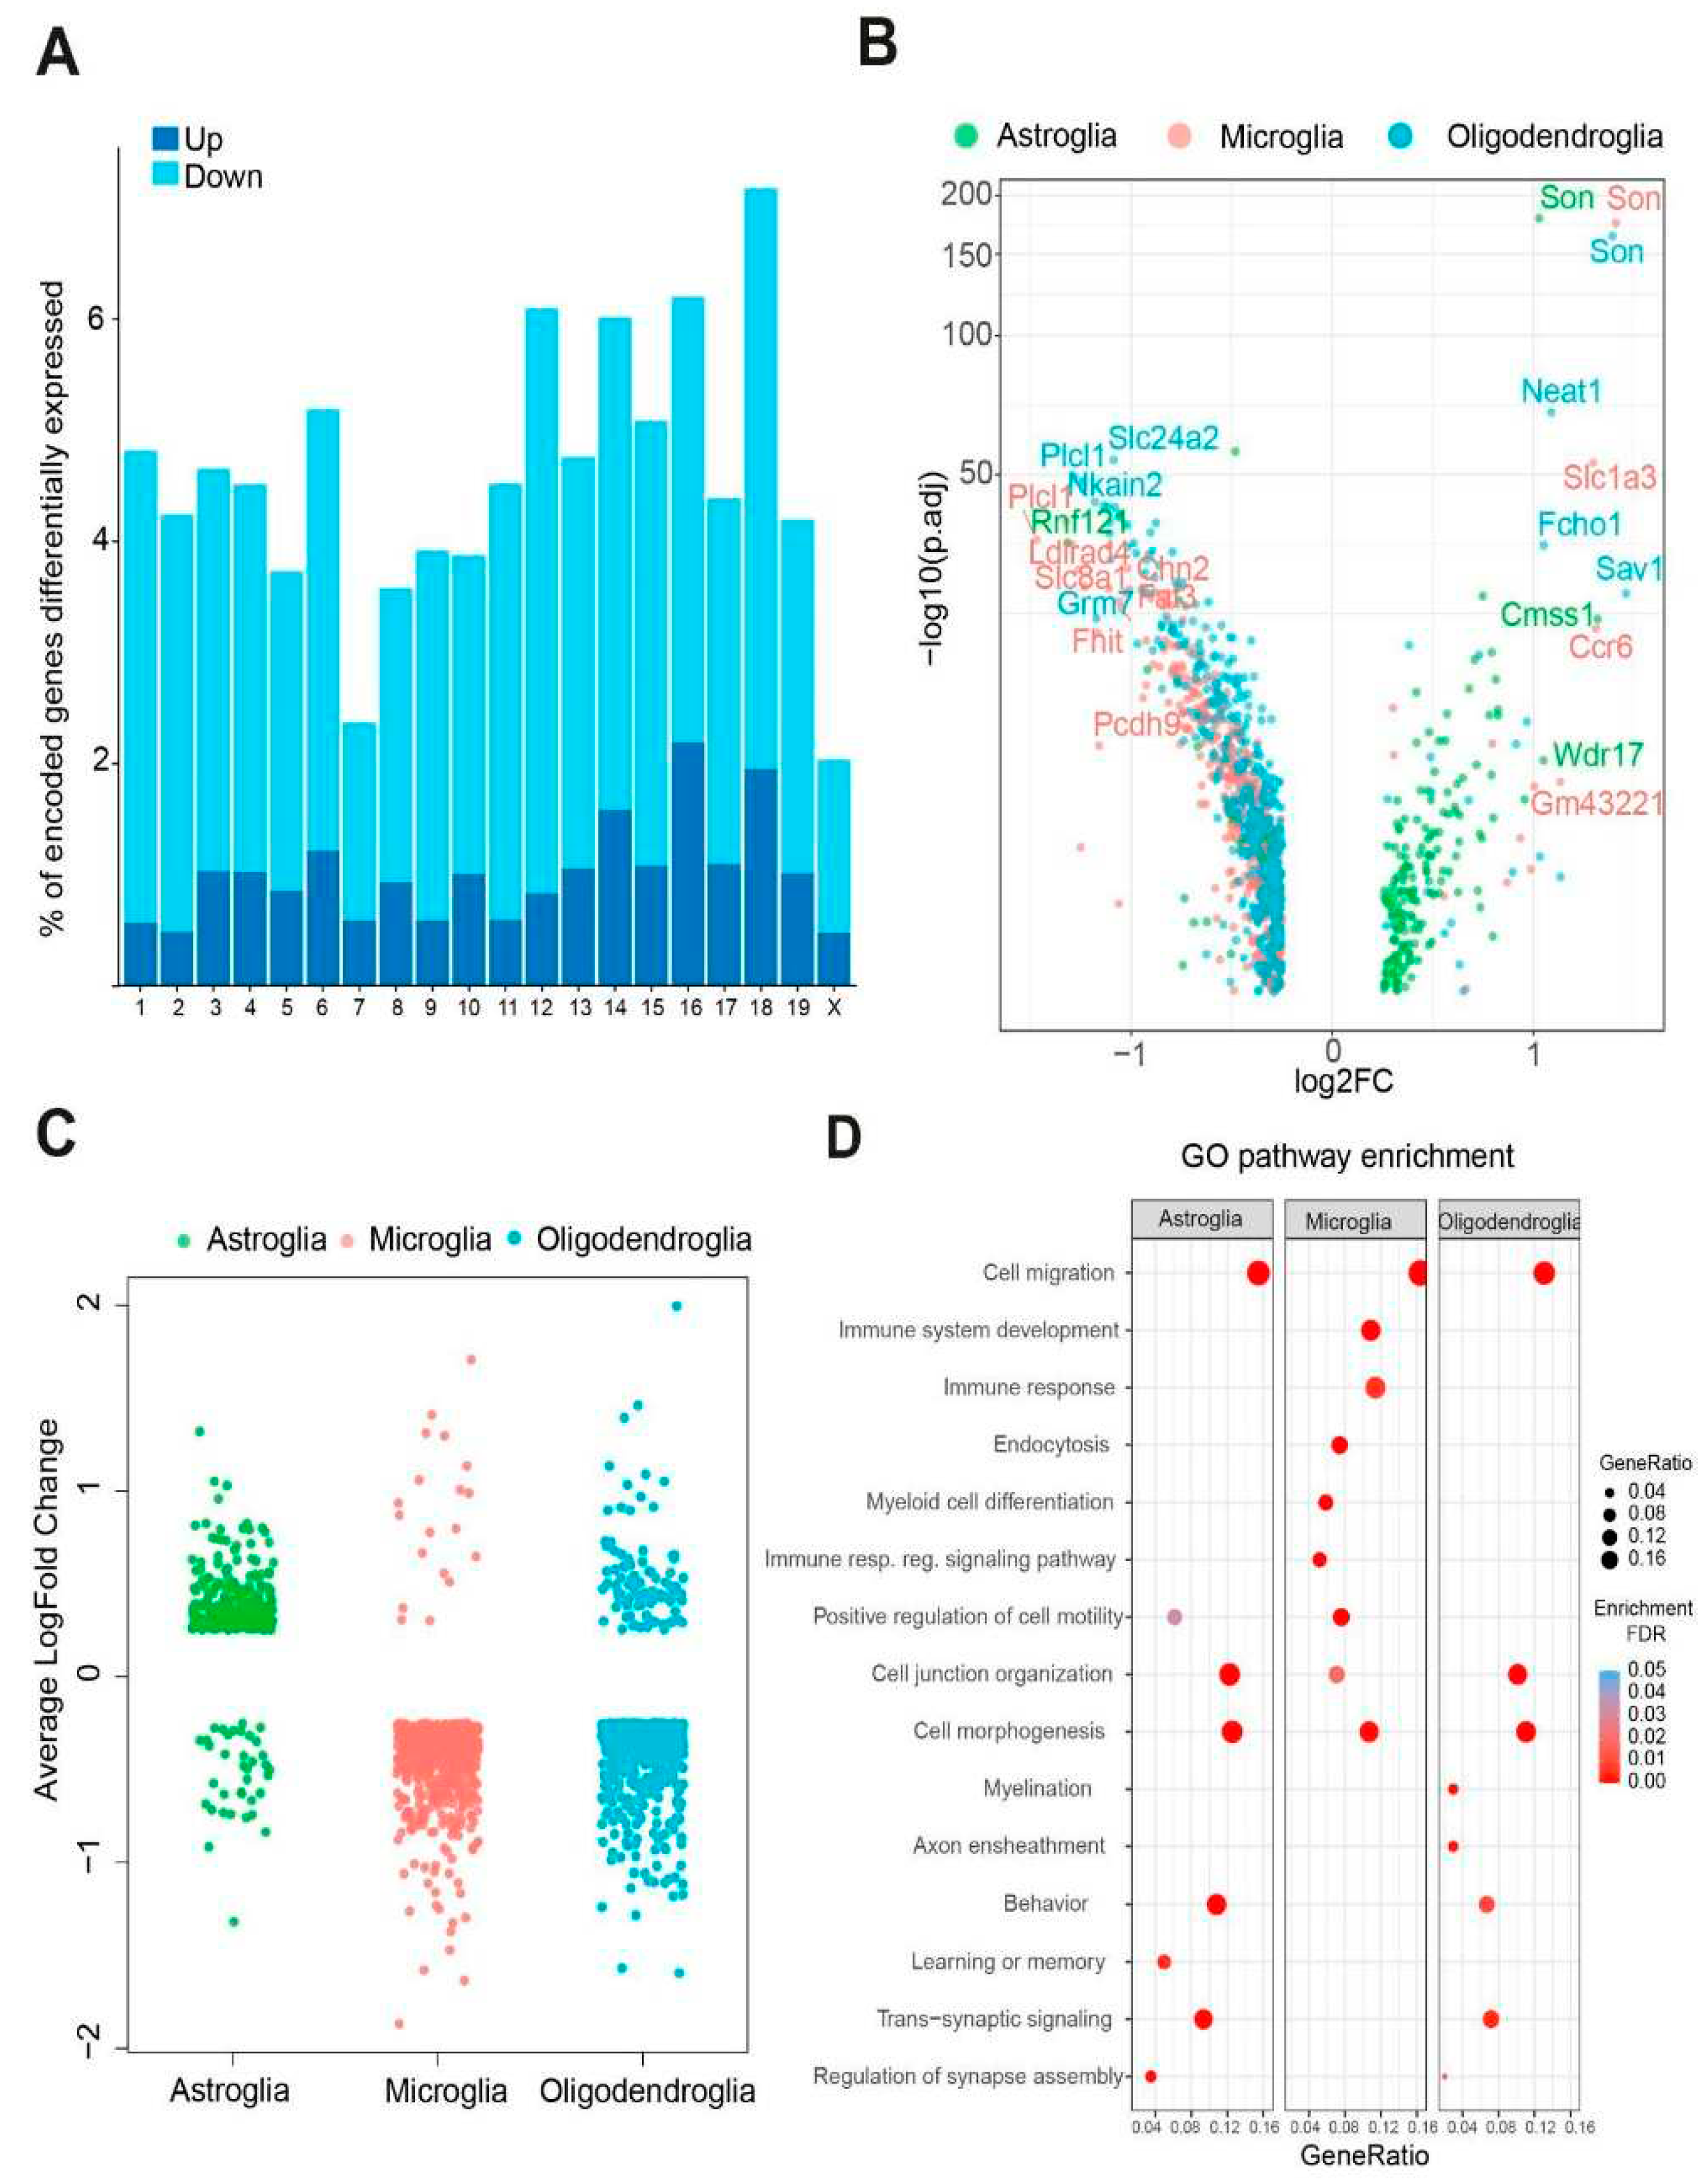
Figure 3.
Transcriptional shift in trisomic microglial cells. (A) UMAP plot showing the microglia cluster both in WT (blue) and trisomic (red) mice. (B) UMAP plot showing the different clusters of microglia both in Ts65Dn (left) and WT mice (right). (C) Mapping of the Aif marker (encoding for Iba1) both in Ts65Dn (left) and WT (right) mice. (D) Representative image of WT (above) and Ts65Dn (below) showing the Iba1+ cells (red), CD-68 signal (green) and merge image. (E) Quantification of Iba1+ cells (above) and Iba1+; CD-68+ cells (below) in CA1 stratum radiatum of WT and Ts65Dn mice (WT = 9 sections from 3 mice, Ts65Dn = 9 sections from 3 mice). Two-tailed T test. On the boxplots, the horizontal line indicates the median, the box indicates the first to third quartile of expression and whiskers indicate 1.5 × the interquartile range. (F) Box plot showing the pseudotime score of different microglial cells according to the top 50 DEG genes of both the homeostatic microglia cluster and reactive microglial cluster in Ts65Dn (red and WT mice (blue) mice. p-value = 2.26x10⁻¹⁶. (G) Relative abundance or density of microglial cells alongside the different pseudotime scores in both Ts65Dn (red) and WT (blue) hippocampus. (H) Venn diagram showing overlap between the DEGs in microglia and DAM signature.
Disclaimer/Publisher’s Note: The statements, opinions and data contained in all publications are solely those of the individual author(s) and contributor(s) and not of MDPI and/or the editor(s). MDPI and/or the editor(s) disclaim responsibility for any injury to people or property resulting from any ideas, methods, instructions or products referred to in the content. |
© 2024 by the authors. Licensee MDPI, Basel, Switzerland. This article is an open access article distributed under the terms and conditions of the Creative Commons Attribution (CC BY) license (http://creativecommons.org/licenses/by/4.0/).
Copyright: This open access article is published under a Creative Commons CC BY 4.0 license, which permit the free download, distribution, and reuse, provided that the author and preprint are cited in any reuse.


