Submitted:
02 February 2024
Posted:
05 February 2024
You are already at the latest version
Abstract
An existing simplified simulation model of global climate, population, economy, and governance is extended, through statistical and other data analysis, to include several measures of human well-being and population displacement. The revised model is used to explore (in testing to the year 2060) vicious cycles and causal cascades that, some have warned, could lead to acceleration of climate change in the coming decades. Model scenario testing addresses two uncertainties, namely the strength of the effect of climate change on governance erosion, and the strength of the “heat trap” effect from physical tipping points such as ice loss and permafrost thaw. This testing indicates that a strong heat trap effect could very well accelerate climate change, but that even a strong governance erosion effect is unlikely to do so. Governance erosion would hurt human well-being but is probably not much of a climate threat per se. These results are tentative but point to the possibility of formally modeling causal cascades beyond what the larger climate models have done to date.
Keywords:
Climate change
; well-being
; population displacement
; governance
; tipping points
; statistical regression
; global modeling
; simulation
; system dynamics
1. Introduction
Large simulation models of climate change, such as those used by the United Nations [1], have been criticized in recent years for certain limitations. These models include highly detailed portrayals of climate, energy use, and economic development, but they have generally not addressed potential vicious cycles and cascades or tipping points in the physical environment and in society. Some scientists have urged the modeling of climate-related cascades, despite the inherent difficulties and uncertainties of doing so, citing evidence that we may be soon entering an era of catastrophic tipping [2,3,4,5,6].
A related line of research on climate change explores its potential adverse effects on individuals and society. Regional studies have estimated the potential effects of climate change on health and mortality [7,8,9,10] and on food availability [11,12]. They have also documented the social and governmental chaos, as well as the population displacement, that persistent droughts and other climate-related natural disasters can cause [13,14,15,16]. If climate change undermines social stability and governance, one may imagine that individual physical and emotional well-being might suffer. Stable and supportive conditions are necessary for life satisfaction or “thriving”, and a lack of thriving can lead to physical or mental illnesses or even death [17,18].
I thought it might be possible to incorporate and explore the implications of this recent research in an existing system dynamics simulation model of global climate, population, economy, and governance [19,20]. This model is much smaller, and thus less precise, than the UN’s climate models and is also smaller than the publicly available En-ROADS model [21] of which it is an offshoot [19].
One of the virtues of simpler models is the ability to quickly revise and extend them into important new areas. My goal was to adapt the model to address potential climate impacts on society and human well-being, and also to use the model to address the possible impacts of climate tipping points. The intent was to explore these phenomena and draw general conclusions, rather than to give precise answers. This seemed like an appropriate first step toward addressing some of the modeling gaps that currently exist in the field of climate change.
2. Materials and Methods
The analysis was done in the following steps (see the following sections for more details):
First, annual data on five different well-being or quality-of-life variables (suicide rate, homicide rate, happiness, poverty, and undernourishment), from the 1990s to the present (as available), were tabulated for a large number of countries and for the world overall. Statistical regression analysis indicated how these well-being variables appear to be affected by a country’s economic status and by aspects of governance.
Second, based on the first step, two additional governance indicators were introduced in the model, and statistical regressions were run to estimate the strength of the linkage from economic status to these governance indicators. The two new governance indicators were Rule of Law and Stability & Peace, which joined the indicators of Government Effectiveness and Regulatory Quality, already in the model [20].
Third, annual data on two measures of population displacement (refugees 1990-2020, internally displaced by conflict 2009-2020) were tabulated for the world overall. Algebraic slope analysis was used to estimate the extent to which post-2000 changes in these variables have been affected by global temperature increases that occurred during the same period.
Fourth, a multiplier was introduced in the model to reflect the erosion of social stability and governance that can occur with climate change, as has been described for the cases of Syria [13,14] and Sub-Saharan Africa [15]. The strength of this governance erosion effect is uncertain, and a range of possible values was simulated, creating three alternative model scenarios out to 2060.
Fifth, an existing lookup function in the model related to climate tipping was tested. This function shows how heat transfer from the atmosphere to seas and land masses will become increasingly impaired as global temperature rises beyond 1°C above preindustrial, where it was in about 2010. This “heat trap” effect summarizes all climate tipping phenomena, including ice loss, permafrost thaw, forest loss, and coral reef loss [2,3,4]. This function was initially calibrated based on assumptions in line with larger climate models that have typically projected a temperature of about 2.5°C by 2060 [19]. A steeper version of the lookup function would correspond to a situation in which climate tipping points are encountered sooner, leading to accelerating temperature increase. An additional model scenario was simulated with a much stronger heat trap effect, in order to see how this might play out on the way to 2060.
3. Data and Statistical Analysis for the Well-Being Measures
Annual data were gathered at the country and worldwide level on seven different measures of well-being. A country was included in the dataset for a given variable if it had a 2020 population of one million or more and if it reported consistently on the variable over the years (at least one data point every 5 years). These data supplemented those previously gathered for 150 countries on population size, GDP per capita (GDPPC), and several worldwide governance indicators [20,22]. The newly gathered well-being data (“D”) included five quality-of-life measures (describing personal circumstances) and two measures of mass population displacement, as follows:
- D1. Suicide rate (1990-2019, N=148 countries reporting consistently and worldwide): The worldwide rate per 100,000 declined from 15.0 to 9.5, a 37% reduction. Of the 148 countries, the one with the highest suicide rate during 2015-2019 was Lesotho at a rate of 44 [23].
- D2. Homicide rate (1990-2019, N=148 and worldwide): The worldwide rate per 100,000 declined from 7.5 to 5.3, a 29% reduction. Of the 148 reporting countries, the ones with the highest homicide rate during 2015-2019 were El Salvador (at a rate of 60) and Honduras (at 49) [23].
- D3. Happiness (2005-2021, the Cantril/Gallup 1-10 life satisfaction scale, N=131 and worldwide): The worldwide average declined slightly from 5.3 to 5.2. Of the 131 reporting countries, the least happy during 2015-2021 was Central African Republic at 3.1 [24].
- D4. Poverty fraction (World Bank, 1990-2018, N=86 and worldwide): The worldwide figure declined from 0.55 to 0.26, a relative reduction of 53%. Of the 86 reporting countries, the poorest during 2015-2018 was Malawi at 89%, followed by Rwanda (80%), Tanzania (77%), and Zambia (74%) [25].
- D5. Undernourished fraction (1991-2020; N=94 and worldwide): The worldwide figure declined from 0.15 to 0.08, a relative reduction of 47%. Of the 94 reporting countries, the most undernourished during 2015-2021 was Central African Republic at 47%, followed by Madagascar (45%) and Haiti (42%) [26].
- D6. Refugees (1990-2020, all countries): The worldwide total declined from 19.9 million in 1990 to a low of 13.0 million in 2005, and then climbed steadily to 26.4 million by 2020. The country of origin with the most refugees in 2020 was Syria (6.0 million), followed by Afghanistan (2.6 million) and Sudan/South Sudan (2.6 million) [27,28].
- D7. Population internally displaced by conflict (2009-2020, all countries): The worldwide total declined from 25.0 million in 2009 to a low of 22.4 million in 2011 and then climbed steadily to 48.0 million by 2020. The country with the most people displaced by conflict in 2020 was Syria (6.6 million), followed by Colombia (4.9 million), Sudan/South Sudan (3.7 million), Yemen (3.6 million), Afghanistan (3.5 million), Somalia (3.0 million), and Nigeria (2.7 million) [29].
Statistical regression analysis was performed for the first five variables above, the quality-of-life measures. For Suicide rate, Homicide rate, Poverty fraction, and Undernourished fraction, the gathered data were averaged across 5-year time periods, starting with 1995-2000 and going through 2015-2020. For these variables, 1995-2000 was designated as the baseline period, and differences against the baseline were calculated for each subsequent 5-year period. In the case of Happiness (first measured in 2005), the gathered data were averaged across three time periods: 2005-2010, 2010-2015, and 2015-2021. For this variable, 2005-2010 was designated as the baseline period, and differences against the baseline were calculated for 2010-2015 and 2015-2021.
Linear regressions were performed for each non-reference time period separately, looking for strong associations that are consistent across most or all of the time periods. Insignificant factors (with higher p-values) were winnowed sequentially to maximize adjusted R-squared. Key results of the regression analysis are shown in Table 1. The regressions were performed to test the hypothesis that a given well-being measure might be influenced by the country’s economic health (namely, the natural logarithm of GDPPC—lnGDPPC—and/or the annual growth rate of GDPPC) and by one or more of the six worldwide governance indicators. The results in Table 1 show consistent significant contributions from lnGDPPC for each of the well-being measures (see Y1 to Y5), as well as contributions from three of the governance indicators, namely Government Effectiveness, Rule of Law, and Stability & Peace.
It was previously hypothesized that the governance indicators themselves may be positively influenced by lnGDPPC, and regressions showed strong effects of lnGDPPC on Government Effectiveness and Regulatory Quality [20]. In light of the results in Table 1 showing the influences of not only Government Effectiveness but also Rule of Law and Stability-Peace on several of the well-being measures, a similar regression analysis was performed for these two governance indicators. Table 1 shows significant contributions of lnGDPPC for Rule of Law (see Y6) and Stability-Peace (see Y7).
4. Estimating Effects of Climate Change on Well-Being and Governance
The literature suggested adverse effects of climate change for three of the well-being measures, as well as examples of how climate change could erode the quality of governance. The well-being measures affected by climate change include the undernourished fraction, as well as the number of refugees and internally displaced people.
Undernourishment: Springmann [11] projected 529,000 additional deaths from climate-related food crop failures in 2050, or about 7% beyond the approximately 7.5 million deaths from hunger predicted otherwise. With a 1.0°C increase in temperature expected from 2017 to 2050 (see [19]), this implies a 7% boost in hunger-related deaths, which may suggest also a 7% boost in undernourishment more broadly. (This 7% assumption also lies within the range of projections of global crop failures found in [12], pages 45-46.)
Refugees: A coefficient for the effect of climate change on refugees was estimated as 0.90 (that is, an increase of 90%) per 1.0°C of additional warming. This coefficient was estimated by focusing on the 2000-2015 period (when both the refugee rate and temperature were rising) and calculating a slope or derivative of change. With this assumption, the revised climate-population model (with all its baseline assumptions) projects refugees will rise from 26 million in 2020 to 60 million in 2050 and 73 million in 2060.
Internally Displaced Population: A coefficient for the effect of climate change on internal displacement was estimated at 2.65 (that is, an increase of 265%) per 1.0°C of additional warming. This coefficient was estimated in two ways. First, a slope of change was calculated over the 2009-2020 period, resulting in an average slope of 3.33. Second, the World Bank’s “Groundswell” report [30] projects 170 million people internally displaced due to climate change by 2050, a number that suggests about 195 million internally displaced for all reasons (climate-related or not). The revised climate-population model matches this 2050 projection when the coefficient is set to 2.65. In deference to the World Bank’s analysis, I have set the coefficient to 2.65.
Governance: The revised model also includes an adverse effect of climate change on governance, assuming the same multiplier for all four governance indicators. Although the literature is informative [13,14,15,16], the worldwide strength of this effect is uncertain. For comparison, one may consider the model’s existing adverse effect of climate change on GDP per capita, which reduces global GDPPC by about 5.3% against what it would be without the projected 1.0°C of additional warming from 2017 to 2050. For the effect on governance, I have tested coefficient values over a wide range of 0% to 10%, including a midrange value of 4%.
5. Revised Model
An overview of the revised climate-population model is shown in Figure 1. New elements include the five quality-of-life measures, as well as the global counts of refugees and internally displaced people. These well-being measures are outputs of the model, capturing the human effects of climate change beyond economic damages and mortality.
Also new is the adverse effect of climate change on governance, which creates a reinforcing feedback loop (the circle of thicker arrows) labeled as “Governance erosion”. This loop has the potential, via diminished regulatory quality (a key aspect of governance [20]), to undermine progress on CO2-equivalent emissions, and thus further accelerate climate change to some degree.
Figure 1 also includes the reinforcing “heat trap” effect noted above, reflecting climate tipping points that impair heat transfer from the atmosphere to the seas and land masses. This loop has always been part of the model but is made explicit here to underscore the goal of testing the possibility of earlier climate tipping.
The revised model includes 12 new or revised equations, presented in Table 2. These twelve equations (“E”) were formulated and estimated as follows:
- E1. Suicide rate: The regressions in Table 1 were used to estimate coefficients for lnGDPPC and Government Effectiveness. These effects explained only a portion of the 37% global reduction in suicide rate from 1990 to 2019. A 30% downward ramp from 1990 to 2015 was introduced exogenously to help produce a close fit to history. The ramp has no further effect after 2015.
- E2. Homicide rate: The regressions in Table 1 were used to estimate coefficients for lnGDPPC, Rule of Law, and Stability-Peace. These effects explained only a portion of the 29% global reduction in homicide rate from 1990 to 2019. A 28% downward ramp from 1990 to 2015 was introduced exogenously to help produce a close fit to history. The ramp has no further effect after 2015.
- E3. Happiness: The regressions in Table 1 were used to estimate coefficients for lnGDPPC, Government Effectiveness, Rule of Law, and Stability-Peace. A close fit to history was achieved assuming an initial (1990) value of 4.9 for happiness.
- E4. Poverty fraction: The regressions in Table 1 were used to estimate the coefficient for lnGDPPC. This effect explained only a portion of the 53% global reduction in poverty from 1990 to 2018. A 30% downward ramp from 1990 to 2015 was introduced exogenously to help produce a close fit to history. The ramp has no further effect after 2015.
- E5: Undernourished fraction: The regressions in Table 1 were used to estimate the coefficient for lnGDPPC. This effect explained only a portion of the 47% global reduction in undernourishment from 1991 to 2020. A 30% downward ramp from 1990 to 2015 was introduced exogenously to help produce a close fit to history. The ramp has no further effect after 2015. The equation also includes the adverse effect of climate change on undernourishment described above.
- E6-E10: Governance indicators: Regression-based equations for Government Effectiveness and Regulatory Quality were described previously [20]. For Rule of Law and Stability-Peace, the regressions in Table 1 were used to estimate the coefficients for lnGDPPC. Close fits to history were achieved using initial (1990) values of 0.48 for Rule of Law and 0.44 for Stability-Peace. The revised model also includes an adverse effect of climate change on governance (eqn. 10), assuming the same multiplier for all four governance indicators. The coefficient is uncertain, as described above; equation 10 shows a mid-range value of 4% erosion in governance per 1.0oC of additional warming.
- E11. Refugee rate: The worldwide refugee rate (refugees per thousand population) follows history until 2017 when its value was 3.2. After 2017, that 3.2 is multiplied by an adverse effect of climate change that increases refugees with a coefficient of 0.90 per 1.0oC of additional warming, as described above.
- E12. Internally displaced rate: The worldwide internal displacement rate (per thousand population) follows history (available starting 2009) until 2017 when its value was 5.4. After 2017, that 5.4 is multiplied by an adverse effect of climate change that increases the internally displaced rate with a coefficient of 2.65 per 1.0oC of additional warming, as described above.
6. Scenario Testing
The revised model was simulated from 1990 to 2060 under four alternative scenario settings. The first three scenarios vary the assumed strength of the climate-related governance erosion effect, with alternative values of 0% (least pessimistic), 4% (midrange), and 10% (most pessimistic). The fourth scenario is even more pessimistic, layering on top of the third scenario a much stronger heat trap effect, which triples the strength of the lookup function for impaired heat transfer. In other words:
- Scenario 1: 0% governance erosion effect, default (1x) heat trap effect;
- Scenario 2: 4% governance erosion effect, 1x heat trap effect;
- Scenario 3: 10% governance erosion effect, 1x heat trap effect;
- Scenario 4: 10% governance erosion effect, 3x heat trap effect.
Selected time graphs of scenario simulation results are presented in the six panels of Figure 2. Numerical results for 15 output variables for the years 2010 and 2060 are presented in Table 3. Taken together, these simulation outputs tell a story as follows:
First, the governance erosion effect of climate change puts downward pressure on all measures of governance, so that, instead of continuing to climb with improving GDPPC (as in Scenario 1), they start declining by the 2030s (in Scenario 2) or by the 2020s (in Scenario 3); see Government Effectiveness and Rule of Law in Figure 2. This erosion in governance, in turn, hurts the five quality-of-life measures to a greater or lesser extent. In particular, the Homicide rate is quite sensitive to the erosion in governance (a 30% difference between Scenarios 1 and 3 by 2060); the Happiness index is much less so (only a 4% difference); and the other well-being measures show moderate impacts (suicide, poverty, and undernourished showing 10-11% differences). The erosion in governance also hurts GDPPC, which ends 4% lower in Scenario 3 compared with Scenario 1; this reduction in GDPPC, in turn, reduces average life expectancy by 0.3 years (from 75.8 to 75.5).
Second, despite the significant erosion in governance in Scenarios 2 and 3, the reinforcing feedback to emissions (via declining regulatory quality) does not have much of an impact on climate change nor on climate-affected well-being measures. Comparing Scenarios 3 and 1 in 2060, the 14% decline in regulatory quality results in only a 1.5% increase in CO2e emissions, a 0.02°C increase in temperature, a 1.0% increase in refugees, and a 1.3% increase in the internally displaced.
Third, whereas governance erosion does not have much impact on climate change, a more severe heat trap effect clearly does so. This climate tipping effect results in a temperature vs. preindustrial of 3.21°C in Scenario 4 compared with 2.54°C in Scenario 3. As a consequence, governance is further eroded, and all well-being measures are adversely affected, as are GDPPC and life expectancy. Most tellingly, refugees increase by 25% and the internally displaced by 36%.
7. Discussion
Climate change is a looming crisis for the entire world, creating concerns for future human well-being. Regional studies have demonstrated the risks climate change poses for health, food availability, and social and governmental stability [7,8,9,10,11,12,13,14,15,16]. At the same time, scientists have identified several worrisome potential tipping points that threaten to accelerate climate change and make it worse than has been previously projected [2,3,4]. Some have warned moreover that the physical and social effects could cascade and compound one another, leading to a potential “climate catastrophe” in the coming decades [5,6]. However, to date these cascades have only been described rather than quantified and simulated.
Here I have extended a simplified climate-population simulation model (much smaller than the large models used by the United Nations [1]) in order to explore the possible speed and strength of climate-related cascades. This model is an offshoot of the well-known En-ROADS climate model [21], incorporating effects of climate change on life expectancy [19] and governance [20], and now extended to incorporate multiple measures of well-being and climate-related population displacement.
Scenario analysis was performed addressing two areas of uncertainty involving vicious cycles around climate change: the strength of the governance erosion effect, and the strength of the heat trap effect. The simulations suggest that, in terms of the risk of accelerating climate change, the heat trap vicious cycle may indeed pose a serious threat, whereas the governance erosion vicious cycle (through declining regulatory quality) probably does not.
My tentative conclusion is that, in order to perform a satisfactory analysis of potential climate change acceleration, climate scientists (a) should work toward incorporating physical tipping points in their large models, but (b) need not worry about extending their models into the social realm. Human well-being and stability will surely suffer due to climate change, but the erosion of government regulatory quality per se will not likely be a major threat at a global level. Even without the erosion of regulations, the world is proving itself sadly capable of pushing past the physical tipping points [2,3,4].
Because my model is a simplified one, its limitations are obvious. Larger models would be needed to develop these ideas with greater detail and precision. Nonetheless, this simplified model, being evidence-based and testable, may help us (as scientists and citizens) turn productively from vague omnidirectional fears to more focused and warranted concerns.
Institutional Review Board Statement
Not applicable.
Informed Consent Statement
Not applicable.
Data Availability Statement
All data presented in this article were extracted from publicly available data sources.
Conflicts of Interest
The author declares no conflicts of interest.
References
- UNFCCC (United Nations Framework Convention on Climate Change). 2023. Integrated Assessment Models (IAMs) and Energy-Environment-Economy (E3) Models. https://unfccc.int/topics/mitigation/workstreams/response-measures/modelling-tools-to-assess-the-impact-of-the-implementation-of-response-measures/integrated-assessment-models-iams-and-energy-environment-economy-e3-models.
- McKay DIA, Staal A, Abrams JF, Winkelmann R, Sakschewski B, Loriani S, Fetzer I, Cornell SE, Rockström J, Lenton TM. 2022. Exceeding 1.5°C global warming could trigger multiple climate tipping points. Science 377(6611).
- Lenton TM, Rockström J, Gaffney O, Rahmstorf S, Richardson K, Steffen W, Schellnhuber HJ. 2019. Climate tipping points-too risky to bet against. Nature 575(7784):592-595. [CrossRef]
- Zaelke D, Picolotti R, Dreyfus G, and others. 2020. The need for fast near-term climate mitigation to slow feedbacks amd avoid tipping points. Institute for Governance & Sustainable Development (IGSD) and Center for Human Rights and Environment (CHRE). 15 September 2023, 168 pp. https://www.igsd.org/wp-content/uploads/2020/09/Science-Supporting-Need-for-Fast-Near-Term-Climate-Mitigation-Sept2020.pdf.
- Rocha JC, Peterson G, Bodin Ö, Levin S. 2018. Cascading regime shifts within and across scales. Science 362(6421):1379-1383. [CrossRef]
- Kemp L, Xu C, Depledge J, Ebi KL, Gibbins G, Kohler TA, Rockström J, and others. 2022. Climate endgame: exploring catastrophic climate change scenarios. PNAS 119(34); 9 pp. [CrossRef]
- WHO (World Health Organization). 2014. Quantitative risk assessment of the effects of climate change on selected causes of death, 2030s and 2050s. 18 September 2014. 128 pp. https://www.who.int/publications/i/item/9789241507691.
- Ebi KL, Hess JJ, Watkiss P. 2017. Health risks and costs of climate variability and change. Chapter 8, pp. 153-169. In: Injury Prevention and Environmental Health (3rd edition), eds. Mock CN, Nugent R, Kobusingye O, Smith KR. The World Bank: Washington, DC. https://www.dcp-3.org/chapter/2487/health-risks-and-costs-climate-variability-and-change.
- WHO (World Health Organization). 2018. COP24 special report: health & climate change. 3 December 2018. 74 pp. https://www.who.int/publications/i/item/9789241514972.
- WHO (World Health Organization). 2023. Climate change. 12 October 2023. https://www.who.int/news-room/fact-sheets/detail/climate-change-and-health.
- Springmann M, Mason-D'Croz D, Robinson S, Garnett T, and others. 2016. Global and regional health effects of future food production under climate change: a modelling study. Lancet 387:1937-1946. [CrossRef]
- World Bank. 2012. Turn Down the Heat: Why a 4°C Warmer World Must be Avoided. World Bank Group: Washington DC. November 2012, report 74455, 105 pp. https://documents.worldbank.org/en/publication/documents-reports/documentdetail/865571468149107611/turn-down-the-heat-why-a-4-c-warmer-world-must-be-avoided.
- de Châtel F. 2014. The role of drought and climate change in the Syrian uprising: untangling the triggers of the revolution. Middle Eastern Studies 50(4):521-535.
- Kelley C, Mohtadi S, Cane M, Seager R, Kushnir Y. 2015. Climate change in the Fertile Crescent and implications of the recent Syrian drought. PNAS 112 (11):3241-3246. [CrossRef]
- Adano WR, Daudi F. 2012. Links between climate change, conflict and governance in Africa. Institute for Security Studies Paper No. 234. May 2012, 16 pp. https://www.files.ethz.ch/isn/145415/Paper_234.pdf.
- Schleussner C-F, Donges JF, Donner RV, Schellnhuber HJ. 2016. Armed-conflict risks enhanced by climate-related disasters in ethnically fractionalized countries. PNAS 113(33): 9216-9221. [CrossRef]
- Arora A, Spatz E, Herrin J, Riley C, Roy B, Kell K, Coberley C, Rula E, Krumholz HM. 2016. Population well-being measures help explain geographic disparities in life expectancy at the county level. Health Affairs 2016;35(11):2075-82. [CrossRef]
- Botchwey N, Dannenberg A, Frumkin H. 2022. Making Healthy Places: Designing and Building for Well-Being, Equity, and Sustainability. 2nd ed, 552 pp. Island Press: Washington DC. https://islandpress.org/books/making-healthy-places-second-edition.
- Homer J. 2020. Modeling global loss of life from climate change through 2060. Sys Dyn Rev 36(4):523-535. [CrossRef]
- Homer J. 2022. Can good government save us? Extending a climate-population model to include governance and its effects. Systems 10(37): 11 pp. [CrossRef]
- Climate Interactive. 2023. The En-ROADS climate solutions simulator. https://www.climateinteractive.org/en-roads/.
- Kaufmann D, Kraay A. 2023. Worldwide Governance Indicators, 2023 Update. https://www.worldbank.org/en/publication/worldwide-governance-indicators.
- IHME (Institute of Health Metrics and Evaluation). 2023. Global Health Data Exchange: deaths by homicide and suicide. https://ghdx.healthdata.org/.
- Helliwell JF, Layard R, Sachs JD, Aknin LB, De Neve J-E, Wang S (Eds.). 2023. World Happiness Report 2023 (11th ed). Sustainable Development Solutions Network (using Gallup World Poll data). https://worldhappiness.report/ed/2023/#appendices-and-data.
- World Bank. 2023. Poverty headcount ratio at $3.65 a day (2017 PPP). https://data.worldbank.org/indicator/SI.POV.LMIC.
- FAO (Food and Agriculture Organization of the United Nations). 2023. Suite of Food Security Indicators. https://fao.org/faostat/en/#data/FS.
- UNHCR (The UN Refguee Agency). 2023. Refugee Data Finder. https://www.unhcr.org/refugee-statistics/.
- World Bank. 2023. Refugee population by country or territory of asylum. https://data.worldbank.org/indicator/SM.POP.REFG.
- IDMC (Internal Displacement Monitoring Centre). 2023. Global Internal Displacement Database. https://www.internal-displacement.org/database/displacement-data.
- Clement V, Rigaud KK, de Sherbinin A, Jones B, Adarno S, Schewe J, Sadiq N, Shabahat E. 2021. Groundswell Part 2: Acting on Internal Climate Migration. World Bank: Washington DC. http://hdl.handle.net/10986/36248.
Figure 1.
Overview of revised model structure. The four measures of governance are government effectiveness, regulatory quality, rule of law, and stability-peace. The five quality-of-life metrics are suicide rate, homicide rate, happiness, poverty, and undernourishment. Blue arrows indicate positive link polarity; red arrows negative. “B” feedback loops are balancing; “R” are reinforcing. The revised model includes 274 active equations and parameters, with (as before) 20 population age groups and 3 broad causes of death [19].
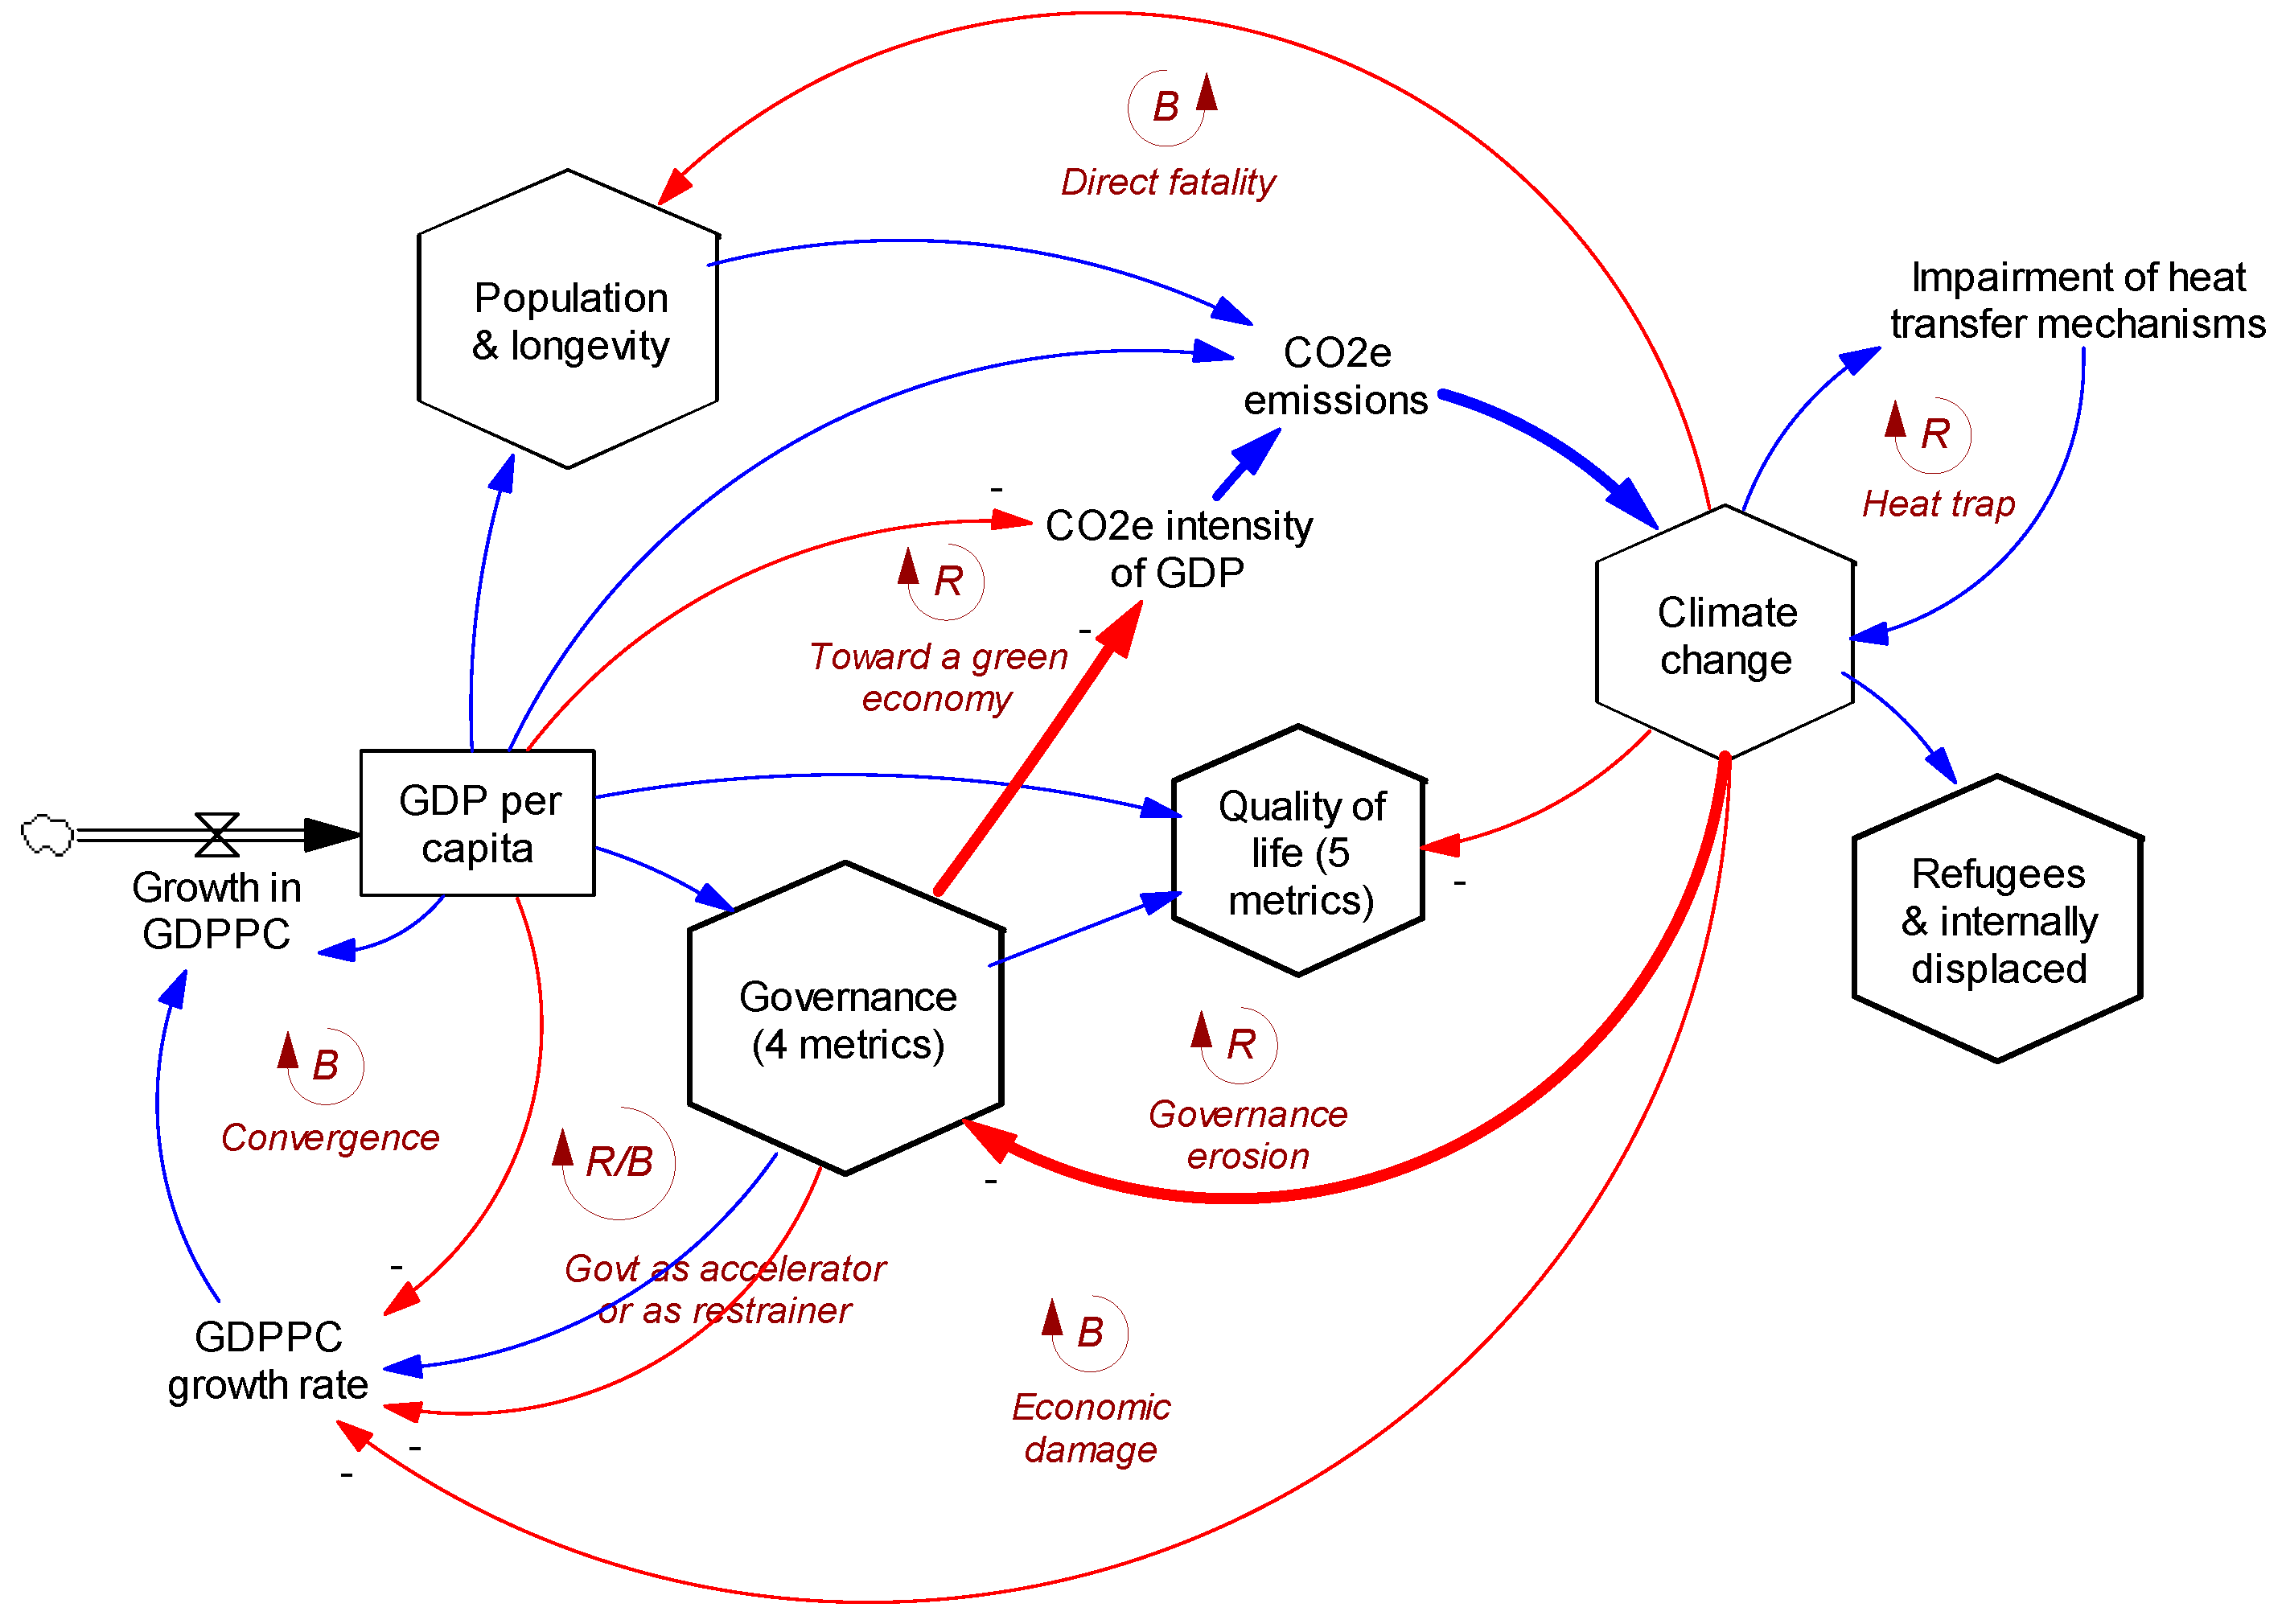
Figure 2.
Four scenarios varying uncertain governance erosion and heat trap effects of climate change. 1-Blue: 0% erosion, 1x trap; 2-Red: 4% erosion, 1x trap; 3-Green: 10% erosión, 1x trap; 4-Black: 10% erosión, 3x trap. Simulated results for six output variables 1990-2060: (a) Temperature delta vs preindustrial (°C); (b) Refugees (millions); (c) Government effectiveness (0-1 index); (d) Rule of law (0-1 index); (e) Happiness (1-10 index); (f) Homicide rate (per 100,000 population).
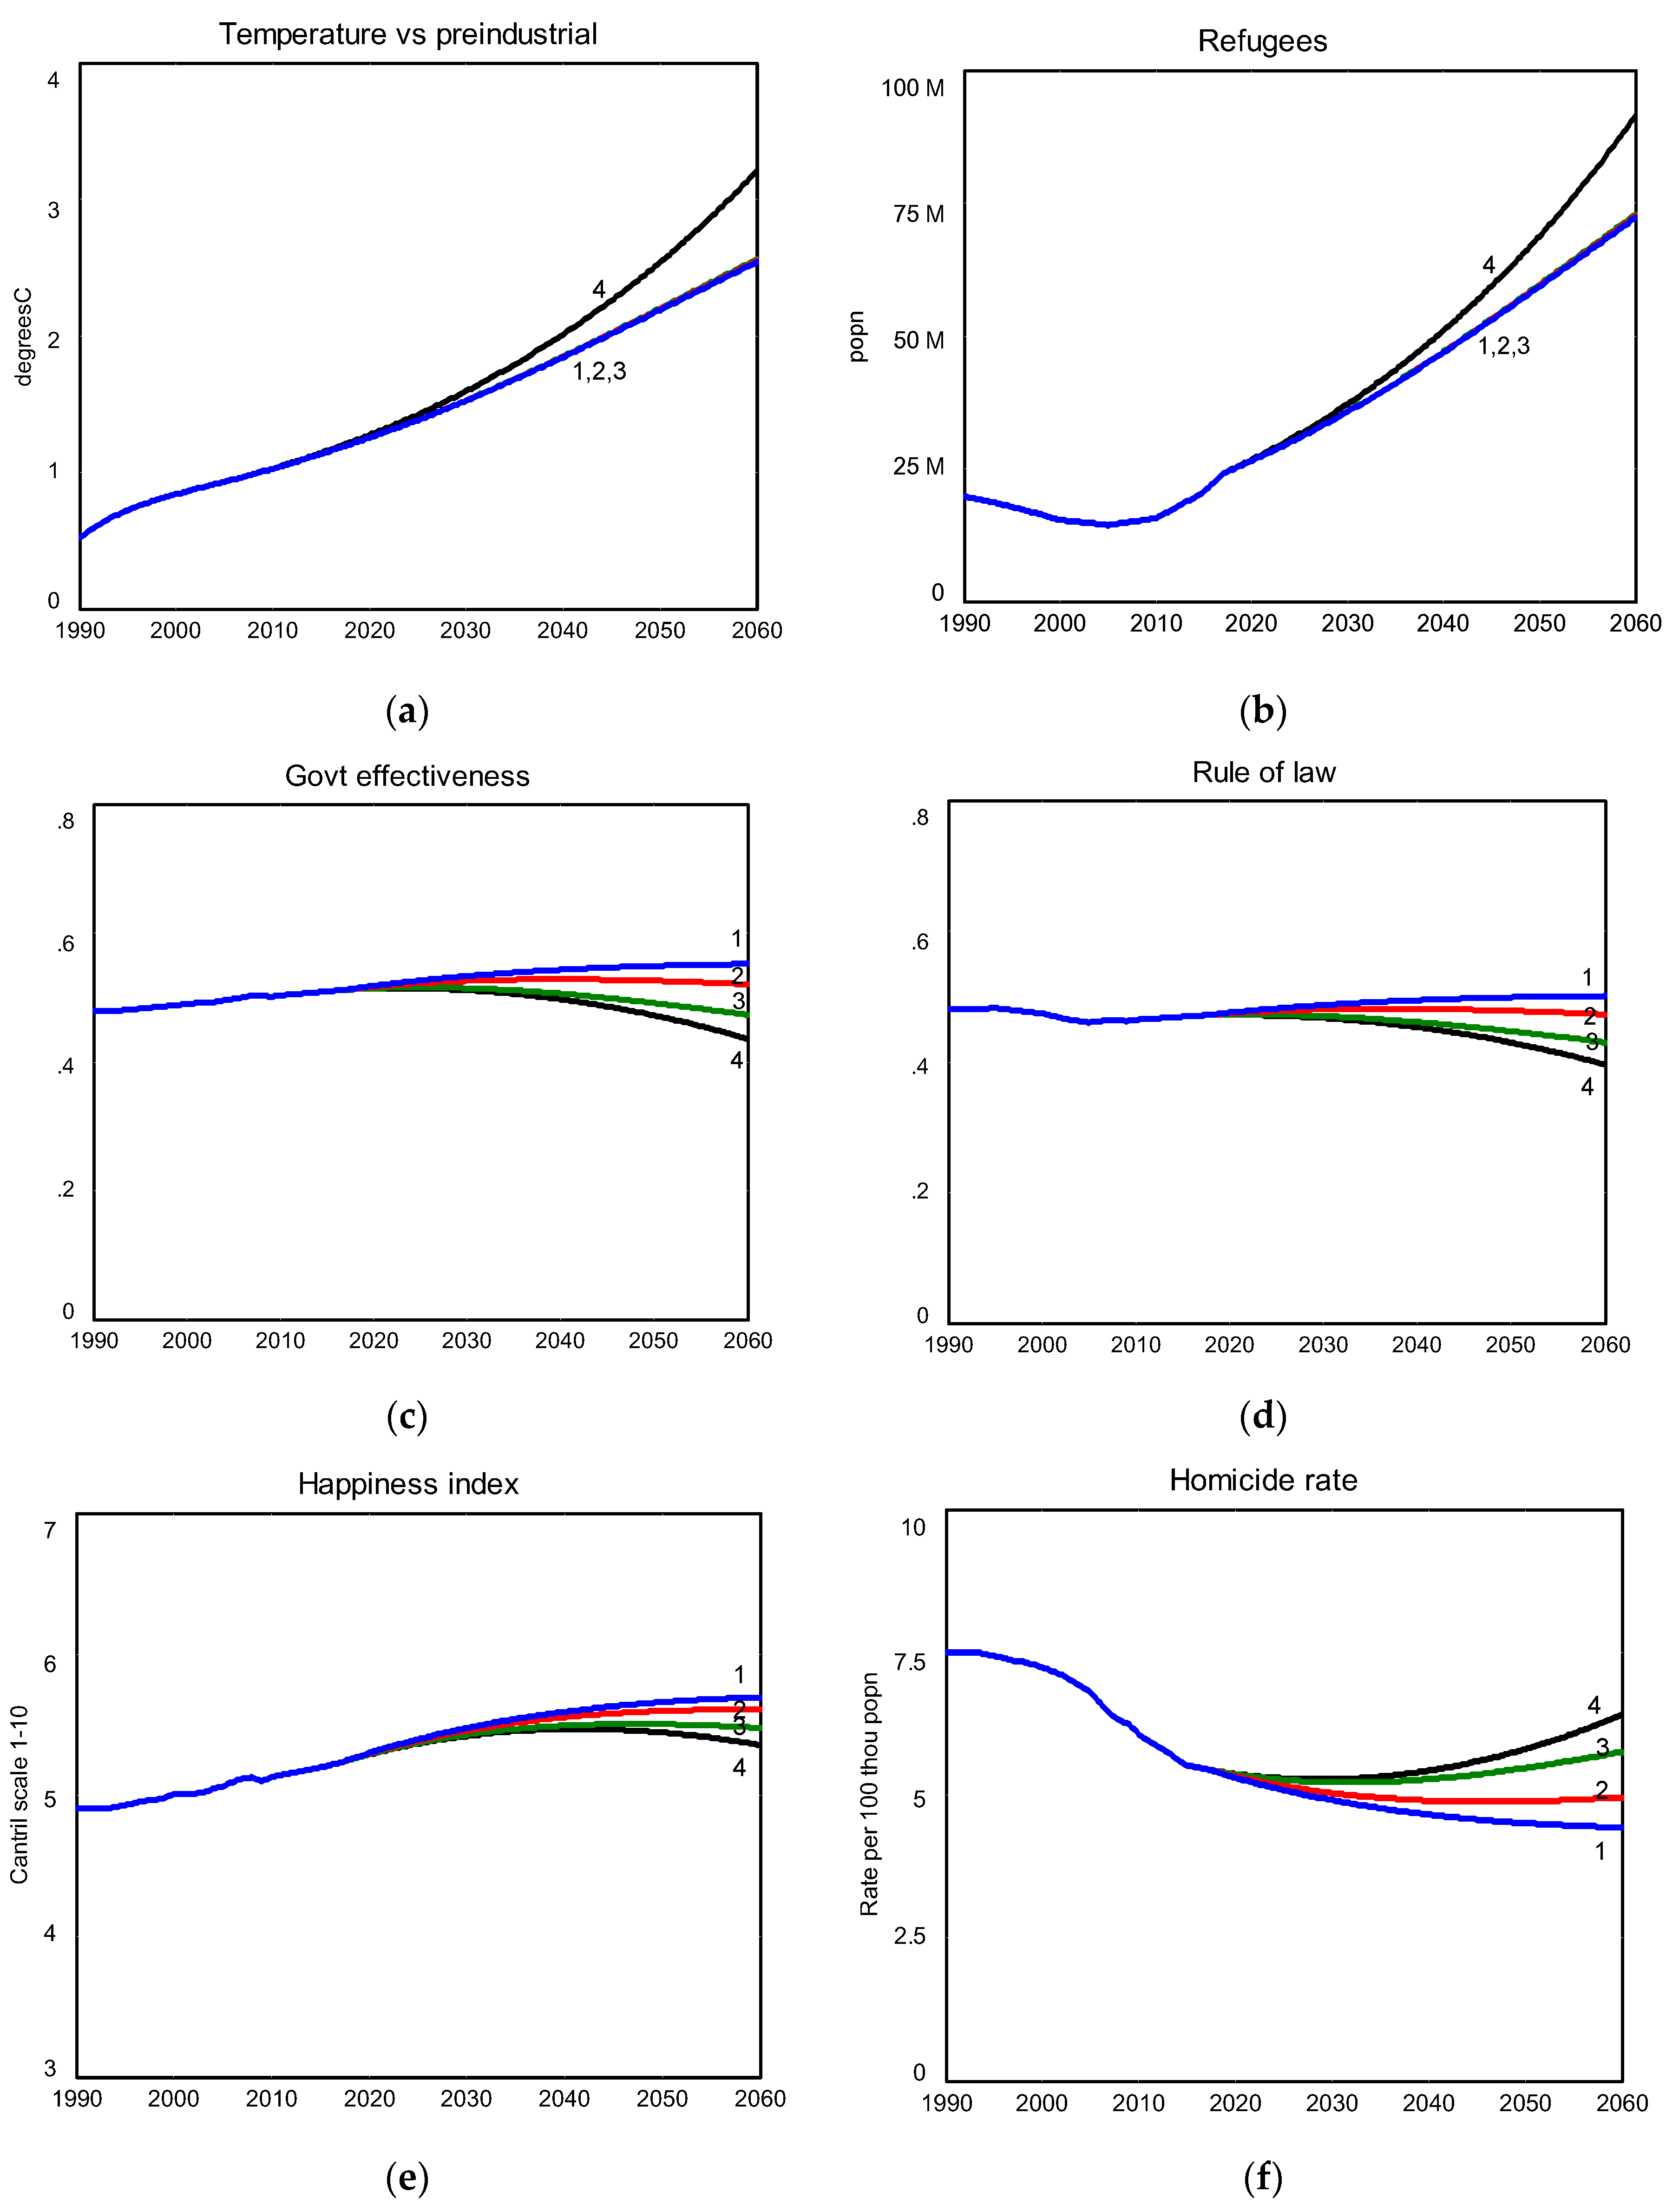

Table 1.
Statistical regression results across many countries, by 5-year time period, based on variables expressed as changes (delta) against a reference period. (ns = not significant and not present in best regression equation.).
Table 1.
Statistical regression results across many countries, by 5-year time period, based on variables expressed as changes (delta) against a reference period. (ns = not significant and not present in best regression equation.).
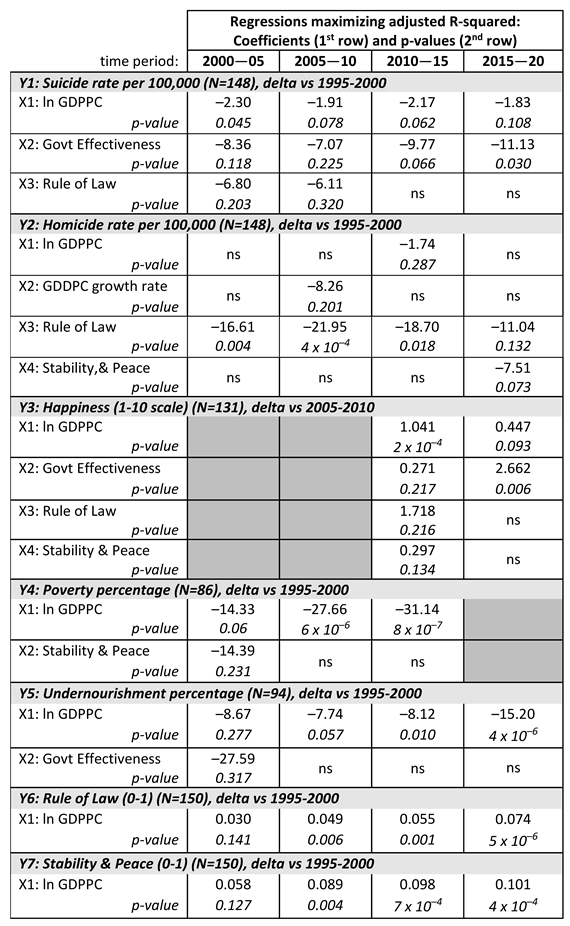
Table 2.
Twelve new or revised equations in the model, based on regression results, adjustment for historical fit, and inferences from other studies.
Table 2.
Twelve new or revised equations in the model, based on regression results, adjustment for historical fit, and inferences from other studies.
| (1) Suicides per 100 thou = 15.6 × RAMP(from 1.0 [1990] to 0.70 [2015]) – (ln GDPPC ratio to 1990 × 2.0) - (Govt effectiveness delta vs 1990 × 10.5) |
| (2) Homicide per 100 thou = 7.5 × RAMP(from 1.0 [1990] to 0.72 [2015]) – (ln GDPPC ratio to 1990 × 0.85) - (Rule of law delta vs 1990 × 15.0) - (Stability peace delta vs 1990 × 3.75) |
| (3) Happiness = 4.9 + (ln GDPPC ratio to 1990 × 0.75) + (Govt effectiveness delta vs 1990 × 1.5) + (Rule of law delta vs 1990 × 0.85) + (Stability peace delta vs 1990 × 0.15) |
| (4) Poverty fraction = 0.55 × RAMP(from 1.0 [1990] to 0.70 [2015]) – (ln GDPPC ratio to 1990 × 0.30) |
| (5) Undernourished fraction = 0.17 × RAMP(1.0 [1990] to 0.70 [2015]) × (1 + Temperature delta vs 2017 × 0.07) – (ln GDPPC ratio to 1990 × 0.10) |
| (6) Govt effectiveness = (0.48 + (ln GDDPC ratio to 1990 × 0.08)) × Climate change multiplier on governance |
| (7) Regulatory quality = (0.46 + (ln GDDPC ratio to 1990 × 0.06)) × Climate change multiplier on governance |
| (8) Rule of law = (0.48 + (ln GDDPC ratio to 1990 × 0.065)) × Climate change multiplier on governance |
| (9) Stability peace = (0.44 + (ln GDDPC ratio to 1990 × 0.10)) × Climate change multiplier on governance |
| (10) Climate change multiplier on governance = 1 – Temperature delta vs 2017 × 0.04 |
| (11) Refugees per thou (starting 2017) = 3.2 × (1 + Temperature delta vs 2017 × 0.90) |
| (12) Internally displaced per thou (starting 2017) = 5.4 × (1 + Temperature delta vs 2017 × 2.65) |
Table 3.
Simulated results of four scenarios as of 2060. S1: 0% governance erosion, 1x heat trap; S2: 4% erosion, 1x trap; S3: 10% erosion, 1x trap; S4: 10% erosion, 3x trap.
Table 3.
Simulated results of four scenarios as of 2060. S1: 0% governance erosion, 1x heat trap; S2: 4% erosion, 1x trap; S3: 10% erosion, 1x trap; S4: 10% erosion, 3x trap.
| 2010 | 2060 value by scenario | ||||
|---|---|---|---|---|---|
| Output variable | value | S1 | S2 | S3 | S4 |
| Temp. vs preindustrial (oC) | 1.03 | 2.54 | 2.55 | 2.56 | 3.21 |
| CO2e emissions (gtonnes/yr.) | 51.5 | 90.4 | 91.3 | 91.8 | 90.4 |
| Refugees (million) | 15.6 | 72.2 | 72.5 | 72.9 | 91.5 |
| Internally displaced (million) | 23.6 | 252.2 | 253.5 | 255.4 | 348 |
| GDP per capita ($/person/yr.) | 9545 | 17552 | 17272 | 16859 | 16163 |
| Life expectancy (years) | 70.6 | 75.8 | 75.7 | 75.5 | 75.2 |
| Government effectiveness (0-1) | 0.503 | 0.552 | 0.52 | 0.473 | 0.435 |
| Regulatory quality (0-1) | 0.477 | 0.514 | 0.485 | 0.441 | 0.406 |
| Rule of law (0-1) | 0.464 | 0.501 | 0.472 | 0.429 | 0.396 |
| Stability-peace (0-1) | 0.365 | 0.413 | 0.389 | 0.353 | 0.325 |
| Happiness (1-10 index) | 5.12 | 5.69 | 5.61 | 5.47 | 5.35 |
| Suicide rate (per 100,000) | 10.89 | 8.38 | 8.74 | 9.29 | 9.77 |
| Homicide rate (per 100,000) | 6.06 | 4.43 | 4.96 | 5.76 | 6.41 |
| Poverty fraction (0-1) | 0.354 | 0.117 | 0.121 | 0.129 | 0.141 |
| Undernourished fraction (0-1) | 0.094 | 0.041 | 0.042 | 0.045 | 0.055 |
Disclaimer/Publisher’s Note: The statements, opinions and data contained in all publications are solely those of the individual author(s) and contributor(s) and not of MDPI and/or the editor(s). MDPI and/or the editor(s) disclaim responsibility for any injury to people or property resulting from any ideas, methods, instructions or products referred to in the content. |
© 2024 by the authors. Licensee MDPI, Basel, Switzerland. This article is an open access article distributed under the terms and conditions of the Creative Commons Attribution (CC BY) license (http://creativecommons.org/licenses/by/4.0/).
Copyright: This open access article is published under a Creative Commons CC BY 4.0 license, which permit the free download, distribution, and reuse, provided that the author and preprint are cited in any reuse.


