
Submitted:
02 February 2024
Posted:
02 February 2024
You are already at the latest version
Abstract
Lavander distillation leads to huge quantities of solid waste produced yearly. This waste is usually discarded resulting in serious environmental issues. However, it still contains residual essential oil and other bioactive compounds. This research reports on the development and comparison of optimized solid-liquid separation methods, i.e. microwave (MAE) and ultrasound assisted extraction (UAE) of phenolic compounds from lavender distillation waste. Optimal pretreatment conditions, such as waste moisture content and particle size were also determined. The extracts were spray or freeze-dried and the resulting powders were characterized for their physicochemical properties. The majority of the original phenolic compounds in lavender were found in the leachate fraction after distillation (61%), while 43% in the solid waste. Drying of the solid waste before extraction affected the process efficiency. UAE led to higher phenolic content and antioxidant properties compared to MAE. Drying (spray or freeze) the extracts did not significantly affect their phenolic content, while the use of maltodextrin as a drying agent improved the drying process yield especially in the freeze-drying method. It is concluded that valorization of lavender distillation wastes can be achieved via an integrated process consisting of a green extraction method and a consequent drying process that result in a stable bioactive powder.
Keywords:
extraction
; lavender
; phenolics
; waste
; spray drying
; freeze drying
; microwave
; ultrasound
1. Introduction
Lavender is renowned for its aromatic and versatile nature, being widely acknowledged for both its therapeutic and fragrant qualities. It originates from the Mediterranean areas of Europe and Northern Africa and is cultivated in several European, South American, North African, southwest Asian countries, and Australia. There are more than 32 species of lavender and abundant subspecies and varieties. However, only three of them are widely used in the production of essential oil, common lavender (Lavandula angustifolia Mill.), lavender aspic (Lavandula spica L.), and lavandin (Lavandula hybrida) [1,2].
With a rich history of use in traditional medicine, cosmetics, and aromatherapy, lavender essential oil is a valuable natural product, renowned for its soothing and calming effects. The high demand for lavender essential oil in various industries, including perfumery, personal care products, and complementary medicine, has led to a growing interest in efficient methods for its extraction. Distillation is one of the most widely employed methods for lavender essential oil extraction, and its effectiveness is contingent upon the choice of distillation equipment, operational parameters, and the quality of the lavender material.
The waste generated during lavender distillation, commonly referred to as lavender distillation waste, consists of several components, each with its own potential for valorization or responsible disposal. The liquid byproducts of the distillation are wastewaters named hydrolats (or hydrosols) and leachates. Hydrosol is the aqueous byproduct resulting from the condensation of steam that carries essential oil constituents and is often used in cosmetics, skincare products, and aromatherapy as a fragrant and soothing water, thereby reducing waste and providing added value. Leachates are aqueous mixtures containing water-soluble compounds with high molecular weight, which are extracted from the plant by heating but do not undergo distillation.
In addition, there are lavender plant residues (stems, leaves, and flowers) that are left as a solid waste after distillation. According to Vasileva et al. [3], the low amount of essential oil in the lavender (0.8–1.3%) leads to huge quantities of solid waste produced yearly. These wastes are usually discarded in the nearby places resulting in serious environmental issues. However, they still contain residual essential oil and other bioactive compounds and can potentially be valorized in the following ways:
The lavender solid waste has been determined as a rich source of phenolic acids (p-coumaric, neochlorogenic, caffeic, and rosmarinic acid) and flavonoids (quercetin-3-β-glucoside, quercetin and mircetine) with antioxidant and antimicrobial activity [3,12]. Méndez-Tovar et al. [11] studied the total phenolics content and antioxidant activity of Lavandula latifolia waste produced after removing the essential oil by distillation, whereas total phenolics and flavonoids content of lavender leafy stalks (Lavandula angustifolia) was identified by Adaszyńska-Skwirzyńska et al. [13]. Recently, Truzzi et al. [14] characterized the by-products from the steam distillation of Lavandula angustifolia Mill. (LA) and Lavandula x intermedia Emeric ex Loisel (LI) aerial parts for their total polyphenol and flavonoid contents. Despite of this, very few studies are available on the process of extraction of phenolic compounds from lavender solid waste. Ivanov et al. [15] studied the phenolic content in extracts (with methanol, ethanol, and acetone) obtained by various techniques (maceration and ultrasound-assisted extraction) from lavender solid waste. Recently, Turrini et al. [16] used the pulsed ultrasound-assisted extraction as a sustainable technology to extract lavender solid waste using a mixture of ethanol and water.
Microwave-assisted extraction (MAE) stands out as a widely adopted alternative method for extraction. Its advantages encompass shortened extraction duration and reduced solvent consumption. The accelerated process and improved extraction rates in MAE are reported to stem from the synergistic effect of thermal and mass transport phenomena [17]. Microwave treatment has been extensively applied for isolation of phenolics from diverse plant materials, making MAE a promising technique for extracting phenolics from lavender solid waste. According to Zheng et al. [18], optimizing extraction parameters is crucial for comprehending the interaction among independent factors and determining the optimal combination of extraction parameters. Additionally, the efficiency of MAE relies on several variables that may not be universally applicable to all plant materials due to the diverse array of bioactive phytochemicals present. Therefore, selecting and optimizing processing conditions should be tailored to the specific matrix used, considering the desired response.
Ultrasound-assisted extraction (UAE) also stands out as a sustainable alternative which requires a moderate investment of solvent and energy [19]. UAE is based on the principle of acoustic cavitation which is capable of damaging the cell walls of the plant matrix, favoring the release of bioactive compounds [20]. Several research works have been recently published on the use of UAE applied to the extraction of phenolic compounds from a number of plants such as myrtle (Myrtus communis L.) [21], pomegranate peel (Punica granatum L.) [22], maqui (Aristotelia chilensis (Mol.) Stuntz) [23], black chokeberry (Aronia melanocarpa L.) [24], and lavender (Lavandula angustifolia Mill.) [16], among others. The efficiency of this method for phenolic compound extraction may also be altered by many factors such as time, temperature, solvent, pH, solvent-sample ratio, and ultrasound amplitude [25]. As a result, the optimization of these parameters is important to obtain the maximum yield of the target compounds.
In addition, polyphenols extracts can easily deteriorate when exposed to oxidants, light, and heat, due to the existence of unsaturated bonds in their structure. As a result, solid forms of extracts are being used increasingly since they have numerous advantages over fluid extracts, such as better stability, cheaper transport and storage, and the possibility of increased concentrations [26]. However, no work has been done on drying of lavender waste extract.
The waste generated during lavender distillation presents an opportunity for sustainable valorization and resource recovery. Responsible waste management practices and the development of innovative processes for utilizing this waste can significantly reduce the environmental impact of lavender distillation and contribute to the sustainability of the lavender industry. Additionally, it aligns with the principles of the circular economy, where waste materials are transformed into valuable resources rather than being disposed of as a burden on the environment.
Thus, the objective of the present work is to develop and optimize an effective alternative and “green” method for the phenolics extraction from lavender solid waste focusing on MAE and UAE. Pretreatment conditions (solid waste moisture content and particle size) as well as extraction parameters for both MAE and UAE were investigated and optimized for maximum phenolics yield. The obtained extract is characterized for its antioxidant capacity and is stabilized by spray- and freeze-drying. The main properties of the produced powders (moisture content, water activity, density, hygroscopicity, total phenolic content) are determined. The obtained dry extract can be used as functional ingredient in fortified foods to supplement with biofunctional metabolites.
2. Materials and Methods
2.1. Raw Material
Τhe aerial parts of Lavandula stoechas were kindly provided from local producers in Rodolivos (Rodolivos IKE, Serres, Greece). They were harvested in the full-bloom stage in June 2022. The plant material had a moisture content of about 18 ± 1% wet basis and was cut into 2–3 cm pieces. Then it was packed and placed in a cool place.
2.2. Hydrodistillation
Thirty (30) g of lavender were submitted to hydrodistillation using a Clevenger-type apparatus (LG-11125-102, Wilmad-LabGlass, Warminster, USA) and extracted with 600 mL of water. The distillation was carried out using an electric heating mantle (Model 655, Nahita Ltd, UK) for 105 min, resulting approximately in 1.5 mL essential oil yield. Further distillation was observed to have minimal effect in the oil yield. Distillation products and by-products were as follows:
- Essential oil (EO)
- Solid waste (SW): residual plant material of lavender flowers
- Liquid waste or leachate (LW): wastewater in the glass flask
- Hydrolate or floral water (Hydro): condensed water vapors
2.3. Distribution of Phenolics in the Hydrodistillation Products and By-Products
For the analysis of the total phenolic content in the hydrodistillation products, lavender flowers, solid waste (SW), and essential oil (EO) needed to undergo an extraction procedure prior to measuring their total phenolic content, whereas liquid waste (LW) and hydrolate (Hydro) fractions did not need any pretreatment. Both flowers and solid waste fractions first underwent grinding (size 1-5 mm). Extraction was conducted using a 130 W of maximum nominal output power, 20 kHz of frequency VCX-130 Sonics and Materials (Danbury, CT, USA) sonicator, equipped with a Ti–Al–V sonoprobe (13 mm). Two T-type thermocouples were submerged in the extraction solution, while the sample container was kept in a thermostat-controlled water bath. The temperature was maintained by periodically adding ice. The selected operating conditions were based on a previous work (solvent: aqueous ethanol solution 50%, v/v, extraction temperature: 35°C, solvent-to-solid ratio: 33 mL/g, pulse on/off: 7/6, sonication time: 15 min, amplitude level: 60%) [17].
As far as the pretreatment of essential oil (EO) is concerned, 5 g of essential oil were mixed with 10 mL of aqueous ethanol solution 50% v/v and 0.2 g Tween 80 followed by stirring for 5 min. Extraction was conducted in an ultrasound water bath of 35 kHz frequency and 860 W maximum nominal output power (Bandelin electronic, Model DL 512 H, Berlin, Germany) at 40% amplitude, 35°C temperature, for 30 min. The sample was then stirred for 5 min and centrifuged at 3000 rpm for 20 min. After centrifugation, the ethanolic fraction was isolated and the whole process was repeated once more in the oil fraction. Finally, after two repetitions, the ethanolic fractions were the ones measured for total phenolics.
2.4. Pretreatment Parameters of Hydrodistillation Solid Waste
To study the effect of solid waste moisture content on extraction yield, solid waste samples were dried at 40°C to various moisture contents (5, 8, and 15%). The solid waste was filtered to remove the residual water amount and dried in a tray dryer (Gallenkamp PLC, Model BR185HNI/NCC, Leicester, England) with an air velocity of 1.2 m/s, at a temperature of 40°C. The samples were prepared in 23.0 cm × 17.2 cm dishes. Three replicate runs were conducted. The drying data were obtained by periodic weighing of the samples with a balance (PCB 1000-2, KERN & Sohn GmbH, Germany). The initial moisture content was determined by the vacuum oven method at 100oC for 24 h.
In addition, the lavender solid waste was dealt with three different grinding degrees to study the effect of the solid waste particle size on extraction yield. Three samples were used, an intact dried lavender waste sample, and two samples grounded through sieves of 1 and 4 mm.
2.5. Ultrasound-Assisted Extraction (UAE) of Solid Waste
Ultrasound-assisted extraction (UAE) was conducted with an ultrasonic homogenizer (Sonopuls HD 4100, Bandelin, Berlin, Germany). One (1) g of dried lavender solid waste was mixed with 18 mL of ethanol-water solvent (1:1), and the solution was extracted with an ultrasound amplitude level of 40% for 10 min. The temperature was maintained by periodically adding ice. The above operating conditions were determined in optimization experiments presented in Supplementary Material (Figure S1, Table S1). The extracts were then filtered and stored at –18oC until further analysis.
2.6. Microwave-Assisted Extraction (MAE) of Solid Waste
Microwave-assisted extraction was conducted with a Multiwave closed microwave system (B30MC030A, AntonPaar, Graz, Austria), equipped with standard configuration with rotor for 6 sample vessels type H (50 mL quartz tubes; operating pressure 75 bars). A sample of dried solid waste (SW) was mixed with 20 mL solvent to produce different solvent/SW ratios. The extracts were collected at 4 min. The objective was to determine the optimum conditions in terms of microwave power (P), solvent/SW ratio (L/S), and solvent concentration (S) for the extraction of phenolic compounds with two different solvent types (ethanol and methanol). Since this work studies the effect of three factors for 2 types of solvent, a Central Composite Design (CCD) would result in 40 experiments. Thus, to reduce the number of experiments and not to be restricted to the predefined levels of factors for the design of experiments as in CCD, an Optimal Design was used. An I-optimal design was selected since the main objective was to optimize the extraction conditions for the different solvents (Table 1).
2.7. Characterization of Extracts
2.7.1. Total Phenolic Content (TPC)
The total phenolic content was determined for the distribution of phenolics both in the distillation products (Section 2.3) and in the UAE & MAE extracts of solid waste (Section 2.5). The quantification of the total phenolics was carried out following the Folin-Ciocalteu spectrophotometric assay [17]. Extraction Yield (Y), denoted in mg GAE/g, was determined as the ratio of the total weight of gallic acid equivalents (GAE) extracted to the mass of the used sample.
2.7.2. Antioxidant Activity (AA)
2.8. Drying of Extracts
Extracts prepared at the optimum conditions (MAE and UAE) were concentrated to a solids concentration of 10% (w/w) in a rotary vacuum evaporator (Model R 114, Buchi Laboratoriums-Technik, Flawil, Switzerland). The final extracts were stored at –18 ± 1°C into glass bottles until the drying experiments. In the case of spray drying, after preliminary experiments, it was found that the addition of maltodextrin (10 DE) at a content of 10% w/v is necessary to increase the efficiency of the process. Therefore, the concentrated extract is mixed with maltodextrin for 24 h before being introduced into the spray dryer.
For the spray drying experiments, the liquid feed was sprayed dried using a ADL 311S spray dryer (Yamato Scientific Co., Tokyo, Japan) with a maximum compressed air pressure of 0.1 MPa, a feed flow rate of 3.9 mL/min, a drying air flow rate of 0.07 m³/min, and an inlet air temperature of 170°C. The resulted outlet temperature was about 57 ± 2°C. The powder was collected, vacuum packed, and stored until further analysis.
In the case of freeze drying, the concentrated extract was subjected to a freezing process at a temperature of –18°C for 48 h. Subsequently, the frozen material was transferred to a lyophilizer (model Alpha 1–4 LD Plus, Martin Christ, Osterode am Harz, Germany), which was equipped with a capacitance manometer for precise monitoring of the condenser pressure. The freeze dryer was operated under vacuum (1.6 mm Hg) for an additional 24 h. This procedure continued until moisture content was stabilized. During the process, the chamber was maintained at a temperature of 35°C, while the ice condenser was set at –55°C. The resulting powder was stored under refrigeration.
2.9. Characterization of Dried Extracts
The powders produced by spray drying and freeze drying, with and without maltodextrin, were characterized for the following main properties. All analyses were done in triplicate.
Moisture: Drying at 70°C in a vacuum oven was used to measure the moisture content until successive weightings produced a change of less than 0.3% [29]. The moisture content was given as 100 × kg water/kg wet material, or the percent wet basis (w.b.).
Bulk density: One 15 mL graduated cylinder was filled with 2 g of powder. By dividing the mass of the powder by the volume inside the cylinder, the aerated bulk density was computed.
Hygroscopicity: On Petri plates with a diameter of 9 cm, 1 g of powder was equally distributed to provide a large surface area between the powder and the humid air at 25°C and 76% relative humidity. The hygroscopicity was measured after 48 h and was expressed as g of absorbed water per 100 g of dry powder.
Water activity: It was measured using a Rotronic HygroLab laboratory analyzer.
Total phenolic content and antioxidant activity: About 1 g of powder was added to 20 mL of water and the total phenolic content and antioxidant activity were determined according to the methods described in Section 2.7.
2.10. Statistical Analysis
To determine the significance of the effects and their interactions, analysis of variance (ANOVA) was performed. A p-value of less than 0.05 was considered statistically significant. Minitab (Release 15, Statistical Software, MINITAB Inc., USA) was used to analyze the obtained experimental data and determine the optimal experimental conditions.
3. Results and Discussion
3.1. Distribution of Phenolics for the Distillation of Lavender Flowers
Phenolic compounds distribution for the different fractions as aforementioned in Section 2.3 is presented in Figure 1. The basis to compare the phenolic content of each fraction was the TPC of raw material. Processing of waste streams more often than not requires a drying process to remove excess water depending on the type of distillation used [16,30,31]. The initial distilled flower solid waste had absorbed high amounts of water and that was evident on the reduced residual water volume after the process and the increase in solid material weight. Lavender flowers had indeed the highest amount of TPC at 18.05 mg GAE/g dry weight (d.w.).
For each distillation, 30 g of raw material yielded approximately 19 g of flower waste that had the 43 ± 2% of the phenolic content of the raw material. Lavender flower solid residues, like most aromatic plant solid waste, were reported to be compromised basically by water-insoluble matter such as hemicellulose, cellulose, and lignin along with compounds of phytochemical nature [1,32]. Plant origin and especially the distillation technique heavily affects the resulting distribution of phenolics [33]. In hydrodistillation, the water and raw material come into direct contact enabling the leaching of soluble solids into the main volume of water. Water solubility of phenols is not originally very high but gets greatly enhanced by the high temperatures that occur during distillation, because of their ability to form hydrogen bonds with water molecules ultimately enabling their dissolution in the wastewater [34,35].
Richly infused wastewaters after hydrodistillation process had been reported for T. vulgaris [36] and H. officinalis [37]. Wollinger et al. [38] reported that an increase in hydrodistillation time up to 2.5 h had a positive effect in continuously enriching the wastewaters of R. officinalis with antioxidants. Alice et al. [39] studied different Lamiaceae species and similarly reported a phenolics reduction in the main solid waste and an increase in wastewaters due to solubilization and degradation. Wastewaters in the current study amounted up to more than half (61 ± 3%) of the phenolics present in the raw material, which implies their affinity to water enhanced by the distillation heating. The phenolic compounds of lavender distillation residues had already been reported to be of medium-hydrophilic nature and their optimum extraction could be augmented with the addition of solvents, which complies with the assumptions of the current study [1,15,16,31,40]. Turrini et al. [16] on the other hand, reported minimal amounts of phenolic compounds in the wastewaters compared to the flower solid waste of lavender. However, it should be noted that the distillation method used was steam-distillation, which potentially minimizes the solubility of such substances that were left intact in the solid waste tissue.
The essential oil fraction showed negligible amounts of phenolic compounds. Lavender essential oil contains many compounds of volatile nature such as terpenes and terpenoids and is constituted mainly by monoterpenes linalool, linalyl acetate, and trans β-ocymene. Phenolic compounds content in the essential oils is greatly affected by distillation type and duration as well as the plant tissue [30]. However, because of the nature of the process, only phenolic compounds of volatile and/or lipophilic nature would be mostly present in the oil. Furthermore, the oil quantity was far lower than the rest of the by-products and the major volume of phenolics was already determined in the solid and liquid wastes.
Phenolic compounds in the hydrolate fraction were not detected. In a similar manner to the essential oil, only compounds of volatile nature are able to transverse the Clevenger apparatus and be present in the hydrolates. In literature, the most widely known and identified compounds in hydrolates were the monoterpenes thymol and carvacrol, as well as the phenylopropene eugenol [33]. However, these substances are not present in Lavandula angustifolia and the hydrolates consist mostly of linalool, borneol, and linalool oxides [41]. Hydrolate residue of lavender flowers has not been examined widely. In the study of Turrini et al. [16], a similar trend was observed regarding the hydrolates of lavender steam distillation. They reported that hydrolates had really low phenolic content, while both their antiradical activity (RSA) and flavonoid content (TFC) were not detectable.
3.2. Effect of Lavender Solid Waste Moisture and Degree of Grinding on Extraction Efficiency
The drying curve of lavender solid waste was obtained by monitoring the moisture content of the material over time under controlled drying conditions (40°C). The drying process was analyzed to assess the variations in drying rates at different stages and to prevent over-drying, which can lead to product degradation, or under-drying which can result in product spoilage or inefficient extraction. The initial moisture content of the sample was found to be 88.18%. From the drying curve (Figure 2), three parts can be distinguished: (i) the initial transition period, where the rate of moisture removal is slow and the curve has a slight downward slope (1 - 4 h), (ii) the constant drying rate phase (4-12 h), (iii) the reduced drying rate phase, where the rate of moisture removal slows down (12-14 h).
The comparison of the samples with moisture content 15, 8, and 5 % was carried out by collecting them and conducting ultrasound extraction under the same optimized conditions. The antioxidant activity of each extract was assessed through the determination of TPC (total phenolic content) and the use of DPPH (2,2-diphenyl-1-picrylhydrazyl) assay, as well as the FRAP (ferric reducing antioxidant power) assay. The results (Figure 3) indicate that the drying degree of lavender affects to some extent the TPC and the % antioxidant capacity values, since they are significantly higher (p-value < 0.05) in the sample with moisture content of 5% and generally decrease in higher moisture contents. FRAP assay shows slightly better values in the 5% moisture content sample, although it is not considered statistically important (p-value > 0.05).
The lavender solid waste was ground through a sieve of 4 mm diameter and a sieve of 1 mm diameter. These two samples along with a sample of untreated solid waste were extracted in the ultrasonic homogenizer under the same optimized conditions, with the aim to determine if the grinding degree can be considered a key factor in the extraction process. As performance criteria for the process, DPPH and FRAP assays, and TPC measurement were used.
Upon examining the graphs (Figure 4), it is apparent that the 1 mm sieve-ground sample exhibits superior behavior. However, following statistical analysis, it was determined that variations in milling degree do not result in significant changes (p-value > 0.05) in terms of TPC and % antioxidant capacity. In the FRAP assay, a statistically significant increase (p-value < 0.05) was observed in the 1 mm sieve-ground sample compared to the unground one. Nevertheless, this finding is deemed insufficient to conclusively designate the milling degree as a key factor in maximizing extraction efficiency.
3.3. Optimization of Microwave-Assisted Extraction of Lavender Solid Waste
In all experiments, the extraction yield (Y) was time dependent and increased with prolonged times, particularly from 1 to 4 min, but slowly from 4 to 30 min. Thus, the effective extraction time for attaining maximum yield was about 4 min. Two different solvents were studied, aqueous ethanol and aqueous methanol. The results for each type of solvent are presented in Figure 5.
As shown in Figure 5, ethanol led to higher yields ranging from 0.821 to 12.390 mg GAE/g d.w. (dry weight), whereas methanol yielded 0.080-12.125 mg GAE/g d.w. and for both cases, the lowest value was observed when pure solvent was used (no water added). It should be noted that methanol’s highest TPC value was acquired on experimental conditions where methanol was not present (experiment 2 of Table 1) and the solvent was pure water. The highest yield with methanol present as solvent was 8.2 mg GAE/g d.w. (experiment 4 of Table 1). The effect of the solvent type was found statistically significant (p = 0.004). Furthermore, methanol is considered toxic for humans and can cause severe environmental problems [42]. Agustin-Salazar et al. [42] studied the effect of ethanol and methanol for the extraction of grape marc and reported that ethanol had superior or equal effect on the total phenolic content, total flavonoid content, and antioxidant ability, while being environmentally friendly. As a result, ethanol was the solvent of choice for the current study of MAE.
Microwave-assisted extraction is based on ionic conduction and dipole rotation that occurs when microwave power is given to any system able to absorb it. Different solvents have various dielectric constants and loss tangent factors that are related to their ability to transform electromagnetic radiation to heat enhancing diffusion and solubilization phenomena [43,44]. Ethanol, methanol, and water have loss tangent values of 0.892, 0.522, and 0.123, respectively, at 25oC [17]. Because of this, ethanol is more capable than methanol of absorbing microwaves and turning them into heat, accelerating the breakdown of plant material [17,45]. Ivanov et al. [15] also reported that ethanol led to better results regarding the ultrasound-assisted extraction of lavender solid waste compared to methanol. In addition, the higher efficiency of ethanol could be possibly attributed to its polarity and better affinity with the phenolic compounds of lavender flower, thus enabling better isolation from the plant matrix. Higher extraction efficiency of ethanol compared to methanol was also reported by Kaderides et al. [17] for the MAE of polyphenols from pomegranate peels, Amirabbasi et al. [46] for the phenolics extraction from okra stems and Do et al. [47] for the isolation of phenolics and flavonoids from Limnophilia aromatica.
Figure 6 presents the effect of microwave power (P), solvent/SW ratio (L/S), and solvent concentration (S) on extraction yield with ethanol as solvent. Microwave power is one of the most important factors in MAE, since it facilitates greatly the diffusion of the solvent into the plant tissue matrix and enhances mass transfer phenomena. It is also associated with the rate at which heat accumulates in the extraction system, which affects the rate of plant tissue deterioration along with chemical reactions occurrence. Accumulation of heat inside the cell also reduces liquid rarefaction, thus increasing the liquid mobility in the plant matrix and the penetration of solvent in the cells. In addition, it causes evaporation of moisture, thus increasing the internal pressure on the cell wall. Finally, the pressure gradient with the outer environment of the cell escalates and the cell ruptures causing the release of active constituents [43,44,45]. The importance of power level was evident in the results since lower power levels (100 W) had the lowest yields in TPC, while an increase in microwave power had a positive effect in achieving the highest TPC values. The yield actually diminished when power was at 800 W, however this could be attributed to the nature of these experiments, where extreme conditions were examined. The experiment at 800 W with pure water resulted in relative high yield (11.5 mg GAE/g d.w.), while the other one was with pure ethanol and had really low yield (2 mg GAE/g d.w.). Pimentel-Moral et al. [48] reported that higher temperatures (up to 164oC) induced by microwaves had a positive effect on the MAE of hibiscus and similar results were also found by Casazza et al. [49] for the MAE of apple peels. Considering that MAE in the current study was conducted only for 4 min, sufficiently high-power levels were mandatory to enable the rapid heating of the solvent. Kaderides et al. [17], for the MAE of pomegranate peels, and Solomakou et al. [50], for the MAE of spent coffee grounds, also come in agreement with the findings of the current study.
Ethanol concentration in the solvent solution exhibited a significant effect on the extraction yield. Considering Figure 6, it was observed that while a water system had satisfactory results in yield values, the introduction of ethanol to the water had a positive effect. Ethanol and water have relative polarities of 0.654 and 1.0, respectively (Kaderides et al., 2019). This disparity in polarity has a beneficial effect in the extraction of phenolics as a bipolar medium could potentially influence a wider variety of phenolic compounds. This principle is called “polarity versus polarity” and its basis is that the higher the molecular weight of the solvent, the lower the polarity, which allows other substances of about the same molecular weight to be easily extracted [51]. In addition, as aforementioned, the presence of ethanol in the solution enables higher efficiency in conversion of microwave power to heat, because of the ethanol’s dielectric properties. Moreover, ethanol has the ability to effectively dissolve constituents of the cell wall and enable their dissolution and availability in the main solvent volume [52]. However, with increasing ethanol concentration in the solution, there is an equilibrium up until negative effects start to occur and such was the case of high S values (above 70%). Chilev et al. [31] similarly reported that a 40% aqueous ethanol had the highest yield in extracting rosmarinic acid, caffeic acid, and luteolin from lavender distillation solid waste compared to 70% and especially 100% ethanol solutions. This phenomenon may be ascribed to a diminished capacity for the transfer of extracted phenolic compounds from the cellular matrix to the bulk solution, primarily owing to the absence of water. This absence results in reduced solubility. Furthermore, the overheating is instigated by ethanol's strong affinity for microwave energy, leading to the degradation of these thermosensitive compounds. Turrini et al. [16] also utilized a 70/30 ethanol/water system to facilitate the extraction of polyphenols from steam-distillated lavender solid waste. Similar findings were reported for MAE of various waste streams such as grape by-products, spent coffee grounds, pomegranate peels, and apple peels [17,49,50,53,54].
In terms of the liquid-to-solid ratio (L/S), our observations indicate that it was the least important factor in the study. To ensure the effectiveness of our experimental conditions, we initially set a relatively high L/S concentration, 30 mL/g. Consequently, further adjustments to increase the L/S ratio did not yield any significant effects. The most favorable results were obtained within the approximate range of 30-40 mL/g. When the liquid volume exceeded a certain threshold, the available microwave energy proved insufficient to swiftly elevate the solvent's temperature and expedite the extraction process. Additionally, this excess liquid could result in over-dilution of the extracts, leading to increased processing costs [50,55,56,57]. Notably, the liquid-to-solid ratio was the only factor that was found to be statistically insignificant (p-value > 0.05).
The statistical analysis of variance was performed for the ethanol microwave-assisted extraction and the results are presented in Table 2. The coefficient of variability (R2) at 98.89% indicates that the variability of the response was well-captured by the proposed model and the experimental data. Furthermore, the adjusted R2 at 97.22% suggests a high level of agreement between the experimental and predicted yield values. The model's F-value, which stood at 59.23 with a p-value of 0.000, underscores its significance. Additionally, the lack of fit test, with a non-significant p-value (p-value > 0.05), affirms that the regression model is crucial and aligns well with the experimental data. Specifically, both the power (P) and solvent concentration (S) were found to be statistically significant (p-value < 0.05). However, there was no detected interactions between the model's parameters.
The desirability profile for optimum yield showed that the highest desirability level (on a scale of 0-1) can be achieved with a power of 800 W, a solvent/solid ratio of 30 mL/g, and 34% aqueous ethanol as solvent at an extraction time of 4 min (Figure 7). Under these conditions, the predicted extraction yield was 16.487 mg GAE/g d.w., whereas the observed experimental value was 14.750 ± 0.350 mg GAE/g d.w.
3.4. Drying of Lavender Solid Waste Extract
Spray drying the UAE extract had 20% solids yield without an encapsulation agent, but this increased to 52% when 10% w/v maltodextrin (10 DE) was added to the extract prior to drying. Comparatively, the yield for the MAE extract was 40% without maltodextrin, rising to 55% with the encapsulation agent. The notable disparity in the non-encapsulated extracts could be attributed to intrinsic variations in the physical and chemical properties of the extracts. It's also noteworthy that the MAE extract without maltodextrin exhibited lower stickiness on the walls of the drying chamber, suggesting that this could potentially contribute to the observed variations in yield. Although the obtained yield using maltodextrin is acceptable [58], it is strongly suggested that some key parameters (inlet temperature, maltodextrin concentration, etc.) should be optimized so that the process can be possibly applied on an industrial scale. The yields obtained from freeze drying ranged between 70 and 75%. The higher efficiency of the freeze-drying method is also noted by Kandasamy et al. [59] on their review regarding the efficiency of the two encapsulation techniques, wherein freeze-drying is also demonstrated as more cost and time-consuming method.
A primary objective of the experiment was to investigate whether various extraction and drying methods adversely affect the antioxidant properties and polyphenolic content of the extract. Focusing on ultrasound-assisted extraction (UAE) and microwave-assisted extraction (MAE) techniques, alongside freeze-drying and spray-drying processes, this research also contemplates the impact of maltodextrin as an encapsulation medium. The detailed findings are presented in Table 3, with a particular focus on assessing to what extent the resulting powders retain the same polyphenolic content and antioxidant activity as the original extracts.
Comparing the effects of drying techniques on polyphenolic content, freeze-drying emerges as the superior method for preserving total phenolic content (TPC), as measured by Folin-Ciocalteu method. Notably, freeze-drying ensures the retention of higher TPC levels both with and without the addition of maltodextrin in comparison with the spray -drying method (Table 3). Specifically, during freeze-drying, a statistically insignificant degradation of phenolic compounds is noted (p-value > 0.05), while in the case of spray-drying, despite maltodextrin supplementation, a statistically significant degradation is observed (p-value < 0.05). Additionally, ultrasound-assisted extraction (UAE) seems to outperform microwave-assisted extraction (MAE) both on the extract and in the powder form. Maltodextrin, employed as an encapsulation agent, elicits varied effects on TPC. In the context of UAE extracts, the addition of maltodextrin contributes to enhanced TPC preservation. Conversely, for MAE extracts, the utilization of maltodextrin leads to a small reduction (p-value > 0.05) in TPC compared with the extract without maltodextrin during the drying process. The different behavior of UAE and MAE extracts on the encapsulation medium, can possibly be attributed to the significant difference in the yield of the spray drying process on the non-encapsulated extract (20% for the UAE versus 40% for the MAE extract). Based on this, it is safe to infer that maltodextrin could act supportively on the MAE extract if added in a smaller amount. In summary, the influence of maltodextrin on TPC is contingent upon the extraction method employed, underscoring its varied effects on polyphenolic preservation in distinct extraction and drying processes.
The preservation of antioxidant capacity, as assessed through FRAP and DPPH radical scavenging assays, appears to be better enhanced in the freeze-drying method in comparison with spray-drying, aligning with the trends observed in total phenolic content. It is also observed that the UAE method, consistently exhibits higher FRAP and DPPH values compared to MAE counterparts (Table 3). This trend also aligns with the earlier observation that UAE tends to outperform MAE in preserving TPC. The addition of maltodextrin appears to have a non-significant impact on FRAP and DPPH values. While the non-encapsulated UAE spray-dried extract shows a slightly higher FRAP and DPPH value (p-value > 0.05) than its maltodextrin-supplemented counterpart, the opposite trend is observed in the MAE spray-dried extracts.
In conclusion, the comprehensive evaluation employing the FRAP, DPPH, and Folin-Ciocalteu methods consistently points to the freeze-drying method, particularly when accompanied by maltodextrin, as the optimal approach for preserving the antioxidant capacity of lavender extracts. Similar results regarding the better quality of the freeze-dried extracts in terms of TPC, DPPH and Frap assay, were obtained by several researchers [60,61,62,63] and are based on the dehydration of a frozen product: due to the absence of liquid water and the law temperatures required for the process.
It is also concluded that the UAE method exhibits higher values in terms of TPC, FRAP, and DPPH. Previous experimental findings also indicate that UAE is more effective in extracting total phenolics from lime peel waste, with high antioxidant activity, saving 33% of time compared to MAE [64]. Espada-Bellido et al. [65] noted that non-significant differences were obtained when using UAE and MAE at their respective optimum conditions for the extraction of TA and TPC from blackberry. On the contrary, Dahmoune et al. [66] reported that the MAE extract of Myrtus communis L. leaves was the best in terms of antioxidant activity and total phenolic content compared to UAE extracts. In addition, they reported that the antioxidant activity of the extract depends on the process as well as on the plant type and the assay applied. From another perspective, Shen et al. [67] demonstrates that the combination of ultrasonic assisted extraction and microwave-assisted extraction (UMAE) has been shown to be a highly efficient and cost-effective extraction technique.Aρχή φόρμαςAρχή φόρμας
Moisture content
The moisture content for all the obtained dry extract, ranged between 3.05 and 5.93% (Table 4). These values were in the desired range of quality parameters for a powder to be considered a dry product [68]. The values of the freeze-dried powders were found to be lower than these of their spray-dried counterparts. Similar results were also obtained by Lee et al. [60] and Jovanovic et al. [69] in their research and were attributed to the rapid spray-drying process that caused the dried powder to be developed into a complete amorphous state that tends to absorb a high amount of moisture during powder handling process after spray-drying and to the higher transition temperature of spray-dried samples, accordingly. Slightly increased values were observed in the obtained powders due to the addition of maltodextrin. A similar trend has been reported by Goula and Adamopoulos [70] and can be attributed to the fact that is difficult for water molecules to diffuse past the larger maltodextrin molecules.
Bulk density
Bulk density of the dry extracts is an important property when considering transportation, storage, packaging, and mixing processes. The bulk densities of the lyophilized and sprayed-dried powders ranged between 320–385 and 300-456 mg/mL, respectively, with slightly higher values of the spray-dried samples compared to the corresponding lyophilized samples (Table 4). The MAE extract was found to have significantly higher bulk density It was noted that bulk density increased with the addition of maltodextrin as a drying agent. This phenomenon could be explained by agglomerate formation in the presence of maltodextrin due to a delay in the formation of a semi-permeable layer by the internal components during drying [68].
Hygroscopicity
The obtained sprayed-dried extracts showed moderate hygroscopicity, between 9.66 g and 16.93 g per 100 g of dry solids (Table 4). The lowest values were observed when maltodextrin was used. This is due to the fact that maltodextrin is a material with low hygroscopicity and confirms its efficiency as a carrier agent [71]. Moreover, the powders obtained using as feed the extract from ultrasonic extraction presented slightly lower values of hygroscopicity in comparison with the ones coming from microwave extraction. In general, the observed values are in accordance with the existing bibliography on medical plant extracts [68,72,73]. In regard to the freeze-dried extract, it was observed to have the lowest hygroscopicity values (Table 4).
Water activity
Water activity is a determining factor that influences microorganism growth and various chemical/biochemical reactions within the matrix and as a result the shelf life and quality of the product. It can be observed in Table 4, that all powders showed water activity below 0.6, which is considered microbiologically stable [74]. The water activity values were affected significantly (p-value < 0.05) by drying technique and the addition of maltodextrin. Specifically, spray-dried extract powders with maltodextrin showed the lowest aw values (Table 4). These results were consistent with other researches [75,76].
4. Conclusions
This study aimed to investigate the impact of various parameters on the extraction efficiency of lavender solid waste, including moisture content and grinding degree. The drying curve analysis revealed distinct phases in the drying process, emphasizing the importance of monitoring and controlling moisture levels to prevent product degradation. The comparison of samples with different moisture contents demonstrated a significant influence on antioxidant activity, with the 5% moisture content sample exhibiting superior results.
Additionally, the grinding degree of lavender solid waste was explored, with ultrasound extraction conducted under controlled conditions. While the 1 mm sieve-ground sample displayed superior behavior, statistical analysis indicated that variations in milling degree did not lead to significant changes in total phenolic content and antioxidant capacity. Therefore, the role of grinding degree in maximizing extraction efficiency remained inconclusive.
Furthermore, the study delved into the optimization of microwave-assisted extraction (MAE) of lavender solid waste. Ethanol was identified as the preferred solvent due to its higher efficiency in extracting phenolic compounds compared to methanol. The optimization process revealed that a power of 800 W, a solvent/solid ratio of 30 mL/g, and 34% aqueous ethanol as solvent for 4 min yielded the highest desirability level and an observed extraction yield of 14.750 ± 0.350 mg GAE/g d.w.
Subsequent investigations into the drying of lavender solid waste extracts using different methods (spray drying, freeze drying) and use of maltodextrin as drying agent demonstrated varying impacts on the antioxidant properties and polyphenolic content. Freeze drying, particularly when accompanied by maltodextrin, was identified as the optimal approach for preserving the antioxidant capacity of lavender extracts. Additionally, the study highlighted the influence of drying techniques and encapsulation using maltodextrin on physicochemical properties such as moisture content, bulk density, hygroscopicity, and water activity.
In summary, the research provided valuable insights into optimizing the extraction and drying processes for lavender solid waste, contributing to the understanding of factors influencing the quality and efficiency of lavender extract production from distillation wastes. These findings have implications for industries utilizing lavender and possibly other aromatic/medicinal plant extracts in various applications, including pharmaceuticals, cosmetics, and food products.
Supplementary Materials
The following supporting information can be downloaded at the website of this paper posted on Preprints.org. Figure S1: Main effects plots for the effect of extraction time and ultrasound amplitude on (a) total phenolic content of extract (GAE mg/g of waste), (b) antioxidant capacity of extract (DPPH, %,) (c) antioxidant capacity (FRAP, μmoles TPTZ/L).; Table S1: Experimental design for the UAE of lavender solid waste for two different solvents.
Author Contributions
Conceptualization, A.M.G., P.V.; methodology, D.F., V.P., A.M.G., P.V.; software, D.F., E.T., S.K.,A.M.G.; validation, D.F., E.T.; formal analysis, D.F. V.P.; investigation, D.F., V.P.; resources, A.M.G., P.V.; data curation, D.F., V.P. S.K.; writing—original draft preparation, D.F., V.P.; writing—review and editing, A.M.G., P.V.; visualization, A.M.G.; supervision, A.M.G., P.V.; project administration, A.M.G., P.V.; funding acquisition, A.M.G, P.V. All authors have read and agreed to the published version of the manuscript.
Funding
This research was funded by the Ministry of Agriculture, Program for Agricultural Development, ESPA 2014-2020, Submeasure 16.1 and 16.2, grant number Μ16ΣΥΝ-00110.
Institutional Review Board Statement
Not applicable.
Informed Consent Statement
Not applicable.
Data Availability Statement
The datasets used and/or analyzed during the current study are available from the corresponding author on reasonable request.
Conflicts of Interest
The authors declare no conflict of interest.
References
- Lesage-Meessen, L.; Bou, M.; Sigoillot, J. C.; Faulds, C. B.; Lomascolo, A. Essential oils and distilled straws of lavender and lavandin: a review of current use and potential application in white biotechnology. Applied microbiology and biotechnology 2015, 99, 3375–3385. [Google Scholar] [CrossRef]
- Stoyanova, M.; Vrancheva, R.; Stoyanova, A.; Nemska, M. P. HPLC analysis of terpenoid content of flowers of lavender. Sci Work Uni Food Technol 2016, 3, 1–6. [Google Scholar]
- Vasileva, I.; Denkova, R.; Chochkov, R.; Teneva, D.; Denkova, Z.; Dessev, T.; Denev, P.; Slavov, A. Effect of lavender (Lavandula angustifolia) and melissa (Melissa Officinalis) waste on quality and shelf life of bread. Food Chemistry 2018, 253, 13–21. [Google Scholar] [CrossRef]
- Noma, Y.; Asakawa, Y. Biotransformation of monoterpenoids by microorganisms, insects, and mammals. In Handbook of essential oils: science, technology,and applications, 1st ed; Baser HCK., Buchbauer G. Eds: CRC Press, Florida Boca Raton, 2010, pp. 585–736.
- Daramwar, P. P.; Rincy, R.; Niloferjahan, S.; Krithika, R.; Gulati, A.; Yadav, A.; Sharma, R.; Thulasiram, H. V. Transformation of (±)-lavandulol and (±)-tetrahydrolavandulol by a fungal strain Rhizopus oryzae. Bioresource Technology 2012, 115, 70–74. [Google Scholar] [CrossRef]
- Marumoto, S.; Miyazawa, M. Microbial reduction of coumarin, psoralen, and xanthyletin by Glomerella cingulata. Tetrahedron 2011, 67, 495–500. [Google Scholar] [CrossRef]
- de Elguea-Culebras, G. O.; Sánchez-Vioque, R.; Santana-Méridas, O.; Herraiz-Peñalver, D.; Carmona, M.; Berruga, M. I. In vitro antifungal activity of residues from essential oil industry against Penicillium verrucosum, a common contaminant of ripening cheeses. LWT 2016, 73, 226–232. [Google Scholar] [CrossRef]
- Yohalem, D.; Passey, T. Amendment of soils with fresh and post-extraction lavender (Lavandula angustifolia) and lavandin (Lavandula× intermedia) reduce inoculum of Verticillium dahliae and inhibit wilt in strawberry. Applied Soil Ecology 2011, 49, 187–196. [Google Scholar] [CrossRef]
- Cintura, E.; Nunes, L.; Esteves, B.; Faria, P. Agro-industrial wastes as building insulation materials: A review and challenges for Euro-Mediterranean countries. Industrial Crops and Products 2021, 171, 113833. [Google Scholar] [CrossRef]
- González-Moreno, M. A.; García Gracianteparaluceta, B.; Marcelino Sádaba, S.; Zaratiegui Urdin, J.; Robles Domínguez, E.; Pérez Ezcurdia, M. A.; Seco Meneses, A. Feasibility of vermicomposting of spent coffee grounds and silverskin from coffee industries: A laboratory study. Agronomy 2020, 10, 1125. [Google Scholar] [CrossRef]
- Méndez-Tovar, I.; Herrero, B.; Pérez-Magariño, S.; Pereira, J. A.; Manzanera, M. C. A. S. By-product of Lavandula latifolia essential oil distillation as source of antioxidants. journal of food and drug analysis 2015, 23, 225–233. [Google Scholar] [CrossRef] [PubMed]
- Slavov, A. M.; Karneva, K. B.; Vasileva, I. N.; Denev, P. N.; Denkova, R. S.; Shikov, V. T.; Monolova, M. N.; Lazarova Y., L.; Ivanova, V. N. Valorization of lavender waste–obtaining and characteristics of polyphenol rich extracts. Food Science and Applied Biotechnology 2018, 1, 11–18. [Google Scholar] [CrossRef]
- Adaszyńska-Skwirzyńska, M.; Dzięcioł, M. Comparison of phenolic acids and flavonoids contents in various cultivars and parts of common lavender (Lavandula angustifolia) derived from Poland. Natural product research 2017, 31, 2575–2580. [Google Scholar] [CrossRef] [PubMed]
- Truzzi, E.; Chaouch, M. A.; Rossi, G.; Tagliazucchi, L.; Bertelli, D.; Benvenuti, S. Characterization and valorization of the agricultural waste obtained from Lavandula steam distillation for its reuse in the food and pharmaceutical fields. Molecules 2022, 27, 1613. [Google Scholar] [CrossRef]
- Ivanov, I.; Petkova, N.; Tumbarski, Y.; Vrancheva, R.; Stoyanova, M. Lavender waste–promising source of triterpenoids and polyphenols with antioxidant and antimicrobial activity. Ind. Technol 2018, 5, 26–32. [Google Scholar]
- Turrini, F.; Beruto, M.; Mela, L.; Curir, P.; Triglia, G.; Boggia, R.; Zunin, P.; Monroy, F. Ultrasound-assisted extraction of lavender (Lavandula angustifolia miller, cultivar rosa) solid by-products remaining after the distillation of the essential oil. Applied Sciences 2021, 11, 5495. [Google Scholar] [CrossRef]
- Kaderides, K.; Papaoikonomou, L.; Serafim, M.; Goula, A. M. Microwave-assisted extraction of phenolics from pomegranate peels: Optimization, kinetics, and comparison with ultrasounds extraction. Chemical Engineering and Processing-Process Intensification 2019, 137, 1–11. [CrossRef]
- Zheng, X.; Xu, X.; Liu, C.; Sun, Y.; Lin, Z.; Liu, H. Extraction characteristics and optimal parameters of anthocyanin from blueberry powder under microwave-assisted extraction conditions. Separation and Purification Technology 2013, 104, 17–25. [Google Scholar] [CrossRef]
- Medina-Torres, N.; Ayora-Talavera, T.; Espinosa-Andrews, H.; Sánchez-Contreras, A.; Pacheco, N. Ultrasound assisted extraction for the recovery of phenolic compounds from vegetable sources. Agronomy 2017, 7, 47. [Google Scholar] [CrossRef]
- Tiwari, B. K. Ultrasound: A clean, green extraction technology. TrAC Trends in Analytical Chemistry 2015, 71, 100–109. [Google Scholar] [CrossRef]
- González de Peredo, A. V.; Vázquez-Espinosa, M.; Espada-Bellido, E.; Ferreiro-González, M.; Amores-Arrocha, A.; Palma, M.; Barbero, G. F.; Jiménez-Cantizano, A. Alternative ultrasound-assisted method for the extraction of the bioactive compounds present in myrtle (Myrtus communis L.). Molecules 2019, 24, 882. [Google Scholar] [CrossRef]
- Santos, M. P.; Souza, M. C.; Sumere, B. R.; da Silva, L. C.; Cunha, D. T.; Bezerra, R. M. N.; Rostagno, M. A. Extraction of bioactive compounds from pomegranate peel (Punica granatum L.) with pressurized liquids assisted by ultrasound combined with an expansion gas. Ultrasonics sonochemistry 2019, 54, 11–17. [Google Scholar] [CrossRef]
- Vázquez-Espinosa, M.; González de Peredo, A. V.; Ferreiro-González, M.; Carrera, C.; Palma, M; Barbero, G.F.; Espada-Bellido, E. Assessment of ultrasound assisted extraction as an alternative method for the extraction of anthocyanins and total phenolic compounds from maqui berries (Aristotelia chilensis (Mol.) Stuntz). Agronomy 2019, 9, 148. [Google Scholar] [CrossRef]
- Vázquez-Espinosa, M.; González-de-Peredo, A. V.; Espada-Bellido, E.; Ferreiro-González, M.; Toledo-Domínguez, J. J.; Carrera, C.; Palma, M.; Barbero, F.G. Ultrasound-assisted extraction of two types of antioxidant compounds (TPC and TA) from black chokeberry (Aronia Melanocarpa L.): Optimization of the individual and simultaneous extraction methods. Agronomy 2019, 9, 456. [Google Scholar] [CrossRef]
- Alasalvar, H.; Yildirim, Z. Ultrasound-assisted extraction of antioxidant phenolic compounds from Lavandula angustifolia flowers using natural deep eutectic solvents: An experimental design approach. Sustainable Chemistry and Pharmacy 2021, 22, 100492. [Google Scholar] [CrossRef]
- Ahmad-Qasem, M. H.; Ahmad-Qasem, B. H.; Barrajon-Catalan, E.; Micol, V.; Carcel, J. A.; Garcia-Perez, J. V. Drying and storage of olive leaf extracts. Influence on polyphenols stability. Industrial Crops and Products 2016, 79, 232–239. [Google Scholar] [CrossRef]
- Filippou, P.; Mitrouli, S. T.; Vareltzis, P. Sequential Membrane filtration to recover polyphenols and organic acids from red wine lees: The antioxidant properties of the spray-dried concentrate. Membranes 2022, 12, 353. [Google Scholar] [CrossRef]
- Hayes, W. A.; Mills, D. S.; Neville, R. F.; Kiddie, J.; Collins, L. M. Determination of the molar extinction coefficient for the ferric reducing/antioxidant power assay. Analytical Biochemistry 2011, 416, 202–205. [Google Scholar] [CrossRef]
- Kiritsakis, K.; Goula, A. M.; Adamopoulos, K. G.; Gerasopoulos, D. Valorization of olive leaves: Spray drying of olive leaf extract. Waste and biomass valorization 2018, 9, 619–633. [Google Scholar] [CrossRef]
- Alexandri, M.; Christaki, S.; Gkatzionis, K.; Mourtzinos, I.; Tsouko, E. Residual biomass from major aromatic and medicinal flora of the Mediterranean: Challenges towards sustainable integration into food systems within the circular bioeconomy. Trends in Food Science & Technology 2023, 104123. [Google Scholar] [CrossRef]
- Chilev, C.; Simeonov, E.; Dimitrova, B.; Yonkova, V.; Pietsch, S.; Heinrich, S.; Peshev, D. VALORIZATION OF WASTE LAVENDER RESIDUE FROM THE ESSENTIAL OIL INDUSTRY FOR PRODUCTION OF ROSMARINIC ACID-A STUDY ON THE SOLID-LIQUID EXTRACTION. Journal of Chemical Technology & Metallurgy 2022, 57. [Google Scholar]
- Gonzalez-Rivera, J.; Campanella, B.; Pulidori, E.; Bramanti, E.; Tiné, M. R.; Bernazzani, L.; Onor, M.; Barberi, P.; Duce, C.; Ferrari, C. From volatiles to solid wastes: Towards the full valorization of lavender and rosemary by simultaneous in situ microwaves and ultrasounds irradiation extraction. Industrial Crops and Products 2023, 194, 116362. [Google Scholar] [CrossRef]
- de Elguea-Culebras, G. O.; Bravo, E. M.; Sánchez-Vioque, R. Potential sources and methodologies for the recovery of phenolic compounds from distillation residues of Mediterranean aromatic plants. An approach to the valuation of by-products of the essential oil market–A review. Industrial Crops and Products 2022, 175, 114261. [Google Scholar] [CrossRef]
- Noubigh, A.; Abderrabba, M.; Provost, E. Temperature and salt addition effects on the solubility behaviour of some phenolic compounds in water. The Journal of Chemical Thermodynamics 2007, 39, 297–303. [Google Scholar] [CrossRef]
- Martins, M. A.; Silva, L. P.; Ferreira, O.; Schröder, B.; Coutinho, J. A.; Pinho, S. P. Terpenes solubility in water and their environmental distribution. Journal of Molecular Liquids 2017, 241, 996–1002. [Google Scholar] [CrossRef]
- Chizzola, R.; Michitsch, H.; Franz, C. Antioxidative properties of Thymus vulgaris leaves: comparison of different extracts and essential oil chemotypes. Journal of agricultural and food chemistry 2008, 56, 6897–6904. [Google Scholar] [CrossRef]
- Džamić, A. M.; Soković, M. D.; Novaković, M.; Jadranin, M.; Ristić, M. S.; Tešević, V.; Marin, P. D. Composition, antifungal and antioxidant properties of Hyssopus officinalis L. subsp. pilifer (Pant.) Murb. essential oil and deodorized extracts. Industrial Crops and Products 2013, 51, 401–407. [Google Scholar] [CrossRef]
- Wollinger, A.; Perrin, É.; Chahboun, J.; Jeannot, V.; Touraud, D.; Kunz, W. Antioxidant activity of hydro distillation water residues from Rosmarinus officinalis L. leaves determined by DPPH assays. Comptes Rendus Chimie 2016, 19, 754–765. [Google Scholar] [CrossRef]
- Alice, G.; Corina, B.; Lucia, P.; Sultana, N.; Bazdoaca, C.; Nicoleta, D. Polyphenol content dynamics in hydrodistillation water residues of lamiaceae species. Journal of Essential Oil Bearing Plants 2019, 22, 858–864. [Google Scholar] [CrossRef]
- Ciocarlan, A.; Lupascu, L.; Aricu, A.; Dragalin, I.; Popescu, V.; Geana, E. I.; Ionete, R. E.; Vornicu, N.; Duliu, O. G.; Hristozova, G.; Zinicovscaia, I. Chemical composition and assessment of antimicrobial activity of lavender essential oil and some by-products. Plants 2021, 10, 1829. [Google Scholar] [CrossRef]
- Śmigielski, K. B.; Prusinowska, R.; Krosowiak, K.; Sikora, M. Comparison of qualitative and quantitative chemical composition of hydrolate and essential oils of lavender (Lavandula angustifolia). Journal of essential oil research 2013, 25, 291–299. [Google Scholar] [CrossRef]
- Agustin-Salazar, S.; Medina-Juárez, L. A.; Soto-Valdez, H.; Manzanares-López, F.; Gámez-Meza, N. Influence of the solvent system on the composition of phenolic substances and antioxidant capacity of extracts of grape (V itis vinifera L.) marc. Australian Journal of Grape and Wine Research 2014, 20, 208–213. [Google Scholar] [CrossRef]
- Routray, W.; Orsat, V. Microwave-assisted extraction of flavonoids: a review. Food and Bioprocess Technology 2012, 5, 409–424. [Google Scholar] [CrossRef]
- Veggi, P. C.; Martinez, J.; Meireles, M. A. A. Fundamentals of microwave extraction. In Microwave-assisted extraction for bioactive compounds: theory and practice; Chemat, F., Cravotto, G. Eds.; Springer US, Boston, MA, 2012: pp. 15–52. [CrossRef]
- Ekezie, F. G. C.; Sun, D. W.; Cheng, J. H. Acceleration of microwave-assisted extraction processes of food components by integrating technologies and applying emerging solvents: A review of latest developments. Trends in Food Science & Technology 2017, 67, 160–172. [Google Scholar] [CrossRef]
- Amirabbasi, S.; Elhamirad, A. H.; Saeediasl, M. R.; Armin, M.; Ziaolhagh, S. H. R. Optimization of polyphenolic compounds extraction methods from Okra stem. Journal of Food Measurement and Characterization 2021, 15, 717–734. [Google Scholar] [CrossRef]
- Do, Q. D.; Angkawijaya, A. E.; Tran-Nguyen, P. L.; Huynh, L. H.; Soetaredjo, F. E.; Ismadji, S.; Ju, Y. H. Effect of extraction solvent on total phenol content, total flavonoid content, and antioxidant activity of Limnophila aromatica. Journal of food and drug analysis 2014, 22, 296–302. [Google Scholar] [CrossRef]
- Pimentel-Moral, S.; Borrás-Linares, I.; Lozano-Sánchez, J.; Arráez-Román, D.; Martínez-Férez, A.; Segura-Carretero, A. Microwave-assisted extraction for Hibiscus sabdariffa bioactive compounds. Journal of Pharmaceutical and Biomedical Analysis 2018, 156, 313–322. [Google Scholar] [CrossRef]
- Casazza, A. A.; Pettinato, M.; Perego, P. Polyphenols from apple skins: A study on microwave-assisted extraction optimization and exhausted solid characterization. Separation and Purification Technology 2020, 240, 116640. [Google Scholar] [CrossRef]
- Solomakou, N.; Loukri, A.; Tsafrakidou, P.; Michaelidou, A. M.; Mourtzinos, I.; Goula, A. M. Recovery of phenolic compounds from spent coffee grounds through optimized extraction processes. Sustainable Chemistry and Pharmacy 2022, 25, 100592. [Google Scholar] [CrossRef]
- Kaderides, K.; Goula, A. M.; Adamopoulos, K. G. A process for turning pomegranate peels into a valuable food ingredient using ultrasound-assisted extraction and encapsulation. Innovative Food Science & Emerging Technologies 2015, 31, 204–215. [CrossRef]
- Goula, A. M. Ultrasound-assisted extraction of pomegranate seed oil–Kinetic modeling. Journal of Food Engineering 2013, 117, 492–498. [Google Scholar] [CrossRef]
- Drevelegka, I.; Goula, A. M. Recovery of grape pomace phenolic compounds through optimized extraction and adsorption processes. Chemical Engineering and Processing-Process Intensification 2020, 149, 107845. [Google Scholar] [CrossRef]
- Pezzini, V.; Agostini, F.; Smiderle, F.; Touguinha, L.; Salvador, M.; Moura, S. Grape juice by-products extracted by ultrasound and microwave-assisted with different solvents: a rich chemical composition. Food Science and Biotechnology 2019, 28, 691–699. [Google Scholar] [CrossRef] [PubMed]
- Alara, O.R.; Abdurahman, N.H.; Olalere, O.A. Optimization of microwave-assisted extraction of flavonoids and antioxidants from Vernonia amygdalina leaf using response surface methodology. Food and bioproducts processing 2018, 107, 36–48. [Google Scholar] [CrossRef]
- Galan, A. M.; Calinescu, I.; Trifan, A.; Winkworth-Smith, C.; Calvo-Carrascal, M.; Dodds, C.; Binner, E. New insights into the role of selective and volumetric heating during microwave extraction: Investigation of the extraction of polyphenolic compounds from sea buckthorn leaves using microwave-assisted extraction and conventional solvent extraction. Chemical Engineering and Processing: Process Intensification 2017, 116, 29–39. [Google Scholar] [CrossRef]
- Pavlić, B.; Kaplan, M.; Bera, O.; Olgun, E. O.; Canli, O.; Milosavljević, N.; Antić, B.; Zeković, Z. Microwave-assisted extraction of peppermint polyphenols–Artificial neural networks approach. Food and Bioproducts Processing 2019, 118, 258–269. [Google Scholar] [CrossRef]
- Tontul, I.; Topuz, A. Spray-drying of fruit and vegetable juices: Effect of drying conditions on the product yield and physical properties. Trends in food science & technology 2017, 63, 91–102. [Google Scholar] [CrossRef]
- Kandasamy, S.; Naveen, R. A review on the encapsulation of bioactive components using spray-drying and freeze-drying techniques. Journal of Food Process Engineering 2022, 45, e14059. [Google Scholar] [CrossRef]
- Lee, S. Y.; Ferdinand, V.; Siow, L. F. Effect of drying methods on yield, physicochemical properties, and total polyphenol content of chamomile extract powder. Frontiers in Pharmacology 2022, 13, 1003209. [Google Scholar] [CrossRef]
- Wilkowska, A.; Ambroziak, W.; Czyzowska, A.; Adamiec, J. Effect of microencapsulation by spray-drying and freeze-drying technique on the antioxidant properties of blueberry (Vaccinium myrtillus) juice polyphenolic compounds. Polish Journal of Food and Nutrition Sciences 2016, 66, 11. [Google Scholar] [CrossRef]
- Koffi, E.; Kassi, A. B. B.; Adje, F. A.; Lozano, Y. F.; Bekro, Y. A. Effect of freeze-drying and spray-drying on total phenolics content and antioxidant activity from aqueous extract of Justicia secunda leaves. Trends in Phytochemical Research 2020, 4, 69–76. [Google Scholar]
- Gomes, W. F.; França, F. R. M.; Denadai, M.; Andrade, J. K. S.; da Silva Oliveira, E. M.; de Brito, E. S.; Rodrigues, S.; Narain, N. Effect of freeze-and spray-drying on physico-chemical characteristics, phenolic compounds and antioxidant activity of papaya pulp. Journal of food science and technology 2018, 55, 2095–2102. [Google Scholar] [CrossRef]
- Rodsamran, P.; Sothornvit, R. Extraction of phenolic compounds from lime peel waste using ultrasonic-assisted and microwave-assisted extractions. Food bioscience 2019, 28, 66–73. [Google Scholar] [CrossRef]
- Espada-Bellido, E.; Ferreiro-González, M.; Carrera, C.; Palma, M.; Álvarez, J. A.; Barbero, G.F.; Ayuso, J. Extraction of antioxidants from blackberry (Rubus Ulmifolius L.): Comparison between ultrasound-and microwave-assisted extraction techniques. Agronomy 2019, 9, 745. [Google Scholar] [CrossRef]
- Dahmoune, F.; Nayak, B.; Moussi, K.; Remini, H.; Madani, K. Optimization of microwave-assisted extraction of polyphenols from Myrtus communis L. leaves. Food chemistry 2015, 166, 585–595. [Google Scholar] [CrossRef] [PubMed]
- Shen, L.; Pang, S.; Zhong, M.; Sun, Y.; Qayum, A.; Liu, Y.; Rashid, A.; Xu, B.; Liang, Q.; Ma, H.; Ren, X. A comprehensive review of ultrasonic assisted extraction (UAE) for bioactive components: Principles, advantages, equipment, and combined technologies. Ultrasonics Sonochemistry 2023, 106646. [Google Scholar] [CrossRef] [PubMed]
- Vidović, S. S.; Vladić, J. Z.; Vaštag, Ž. G.; Zeković, Z. P.; Popović, L. M. Maltodextrin as a carrier of health benefit compounds in Satureja montana dry powder extract obtained by spray drying technique. Powder technology 2014, 258, 209–215. [Google Scholar] [CrossRef]
- Jovanović, A. A.; Lević, S. M.; Pavlović, V. B.; Marković, S. B.; Pjanović, R. V.; Đorđević, V. B.; Nedović, V. B.; Bugarski, B. M. Freeze vs. Spray drying for dry wild thyme (Thymus serpyllum L.) extract formulations: The impact of gelatin as a coating material. Molecules 2021, 26, 3933. [Google Scholar] [CrossRef]
- Goula, A. M.; Adamopoulos, K. G. A new technique for spray drying orange juice concentrate. Innovative Food Science & Emerging Technologies 2010, 11, 342–351. [Google Scholar] [CrossRef]
- Tonon, R. V.; Brabet, C.; Hubinger, M. D. Influence of process conditions on the physicochemical properties of açai (Euterpe oleraceae Mart.) powder produced by spray drying. Journal of food engineering 2008, 88, 411–418. [Google Scholar] [CrossRef]
- Gallo, L.; Ramírez-Rigo, M. V.; Piña, J.; Bucalá, V. A comparative study of spray-dried medicinal plant aqueous extracts. Drying performance and product quality. Chemical Engineering Research and Design 2015, 104, 681–694. [Google Scholar] [CrossRef]
- Gallo, L.; Llabot, J. M.; Allemandi, D.; Bucalá, V.; Piña, J. Influence of spray-drying operating conditions on Rhamnus purshiana (Cáscara sagrada) extract powder physical properties. Powder Technology 2011, 208, 205–214. [Google Scholar] [CrossRef]
- Quek, S. Y.; Chok, N. K.; Swedlund, P. The physicochemical properties of spray-dried watermelon powders. Chemical Engineering and Processing: Process Intensification 2007, 46, 386–392. [Google Scholar] [CrossRef]
- Caliskan, G.; Dirim, S. N. The effect of different drying processes and the amounts of maltodextrin addition on the powder properties of sumac extract powders. Powder technology 2016, 287, 308–314. [Google Scholar] [CrossRef]
- Dadi, D. W.; Emire, S. A.; Hagos, A. D.; Eun, J. B. Effects of spray drying process parameters on the physical properties and digestibility of the microencapsulated product from Moringa stenopetala leaves extract. Cogent Food & Agriculture 2019, 5, 1690316. [Google Scholar] [CrossRef]
Figure 1.
Distribution of total phenolic content in each fraction of the distillation procedure.
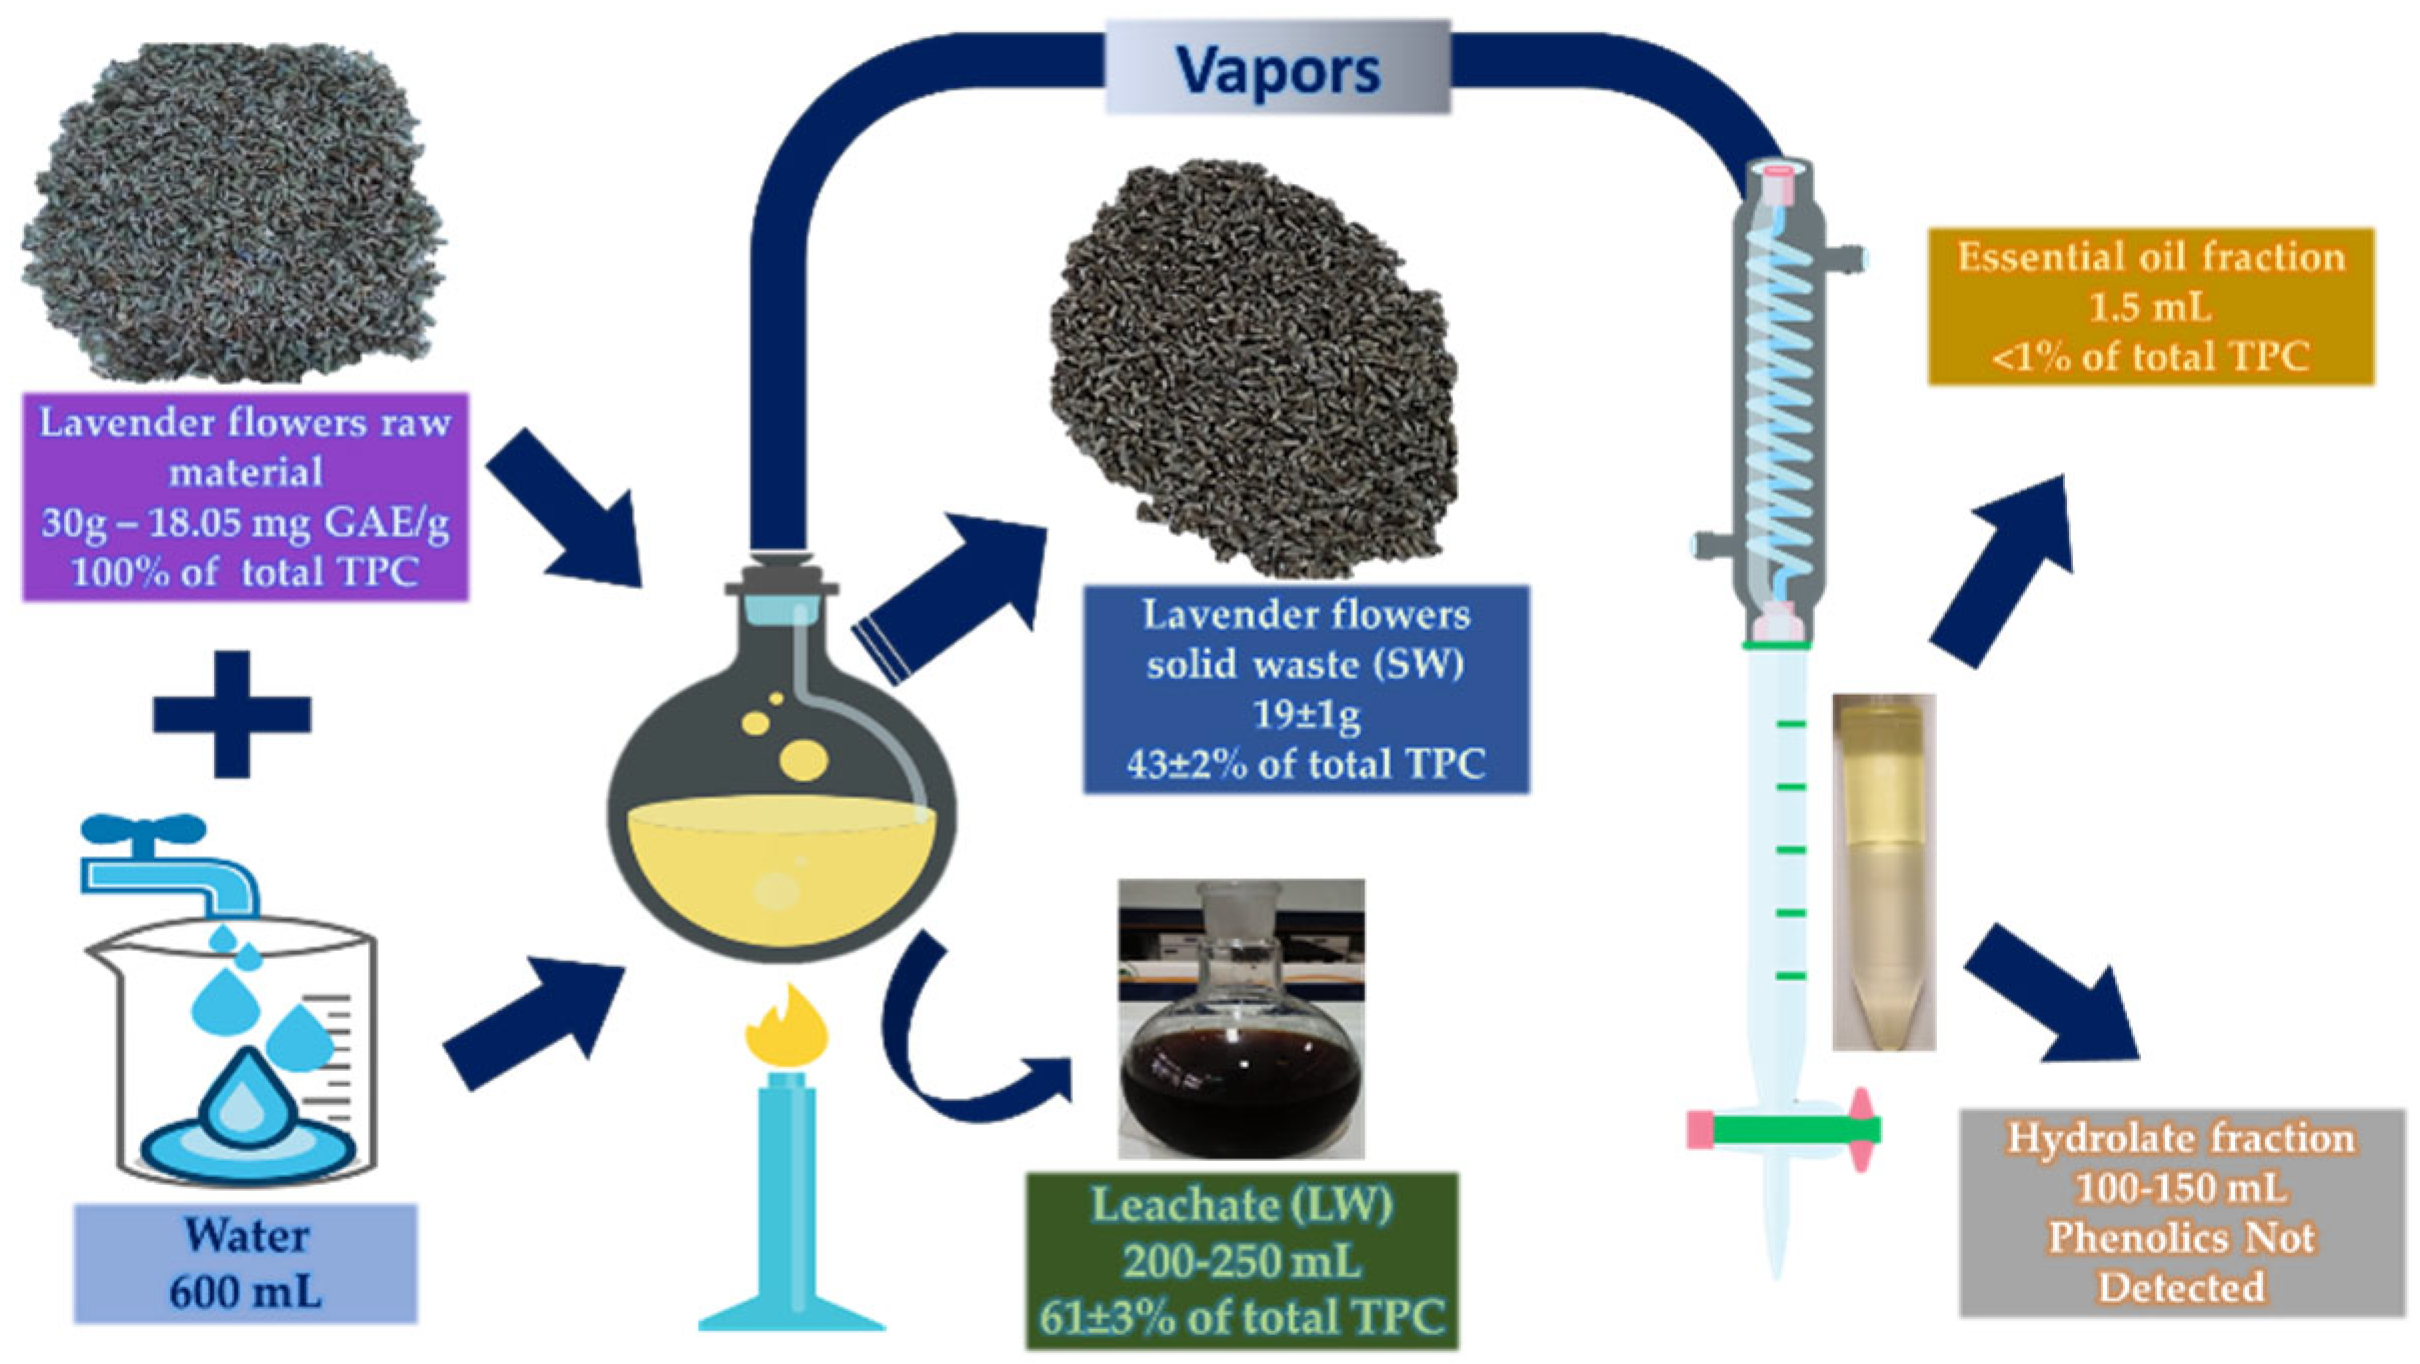
Figure 2.
Drying curve of lavender solid waste at 14 h period.
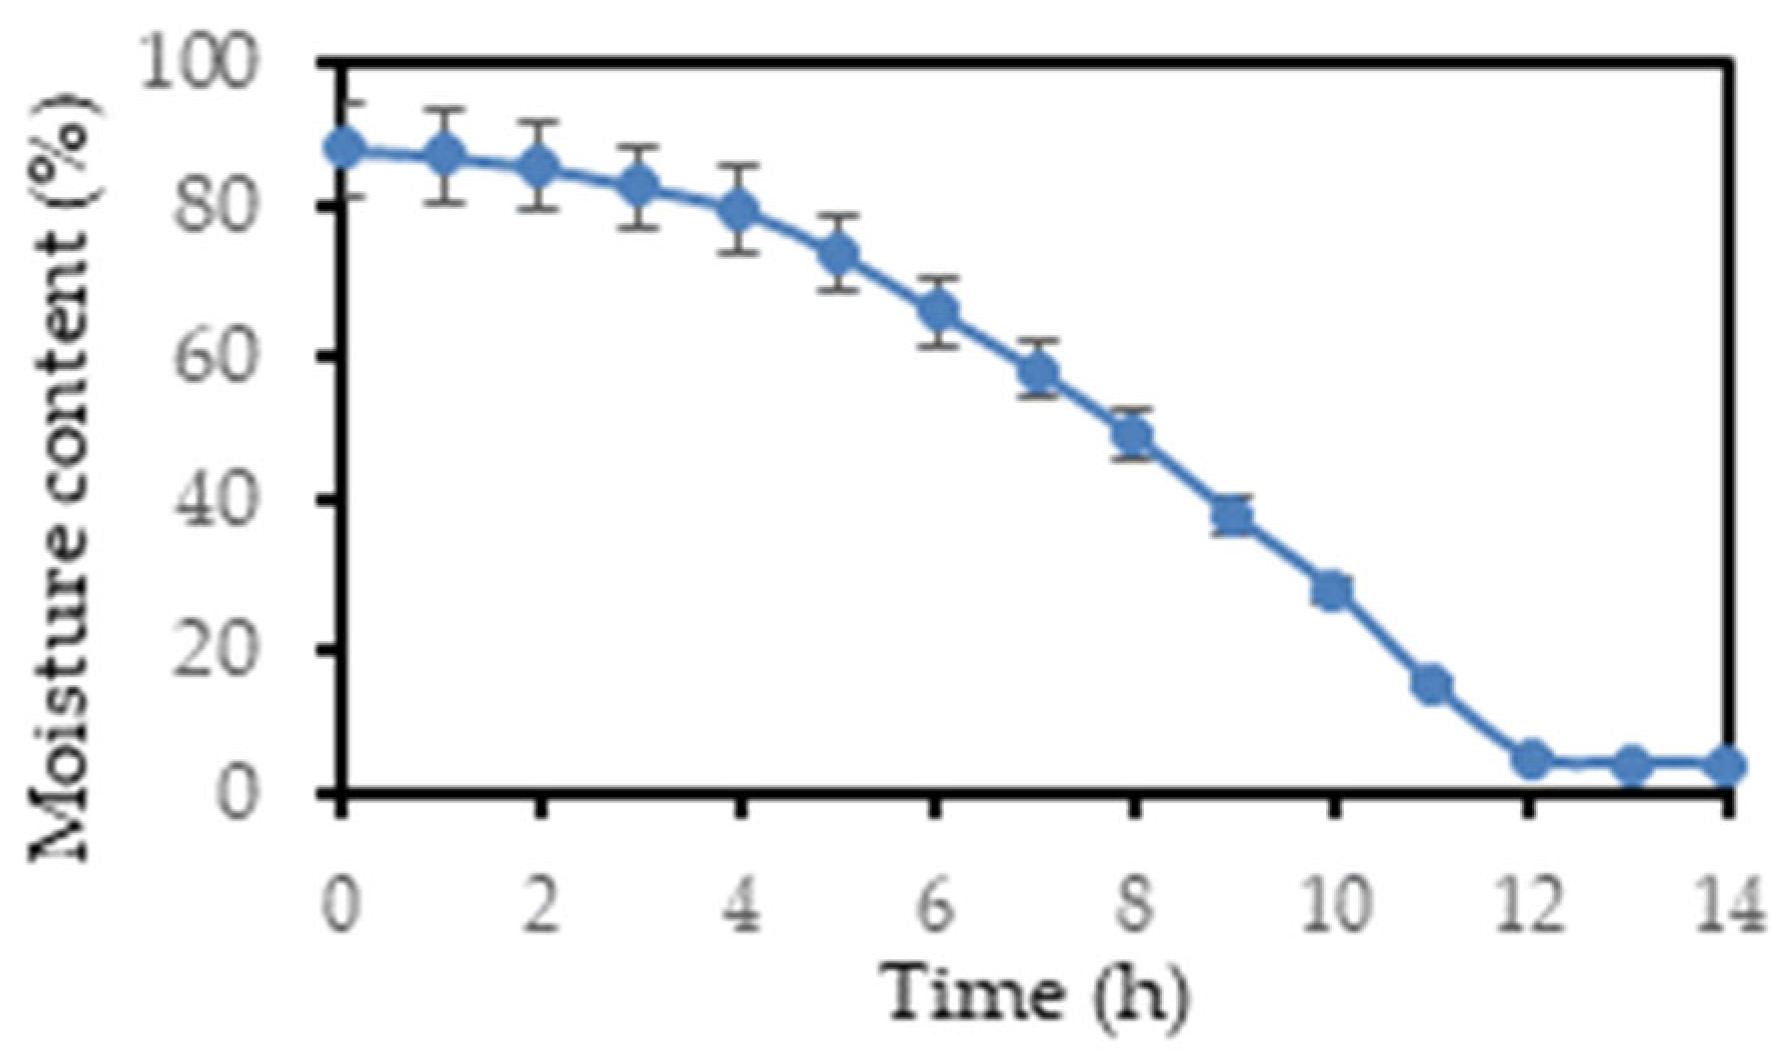
Figure 3.
Effect of moisture content of lavender solid waste on (a) total phenolic content of extract (GAE mg/g of waste), (b) antioxidant capacity of extract (DPPH, %,) (c) antioxidant capacity (FRAP, μmoles TPTZ/L).
Figure 3.
Effect of moisture content of lavender solid waste on (a) total phenolic content of extract (GAE mg/g of waste), (b) antioxidant capacity of extract (DPPH, %,) (c) antioxidant capacity (FRAP, μmoles TPTZ/L).
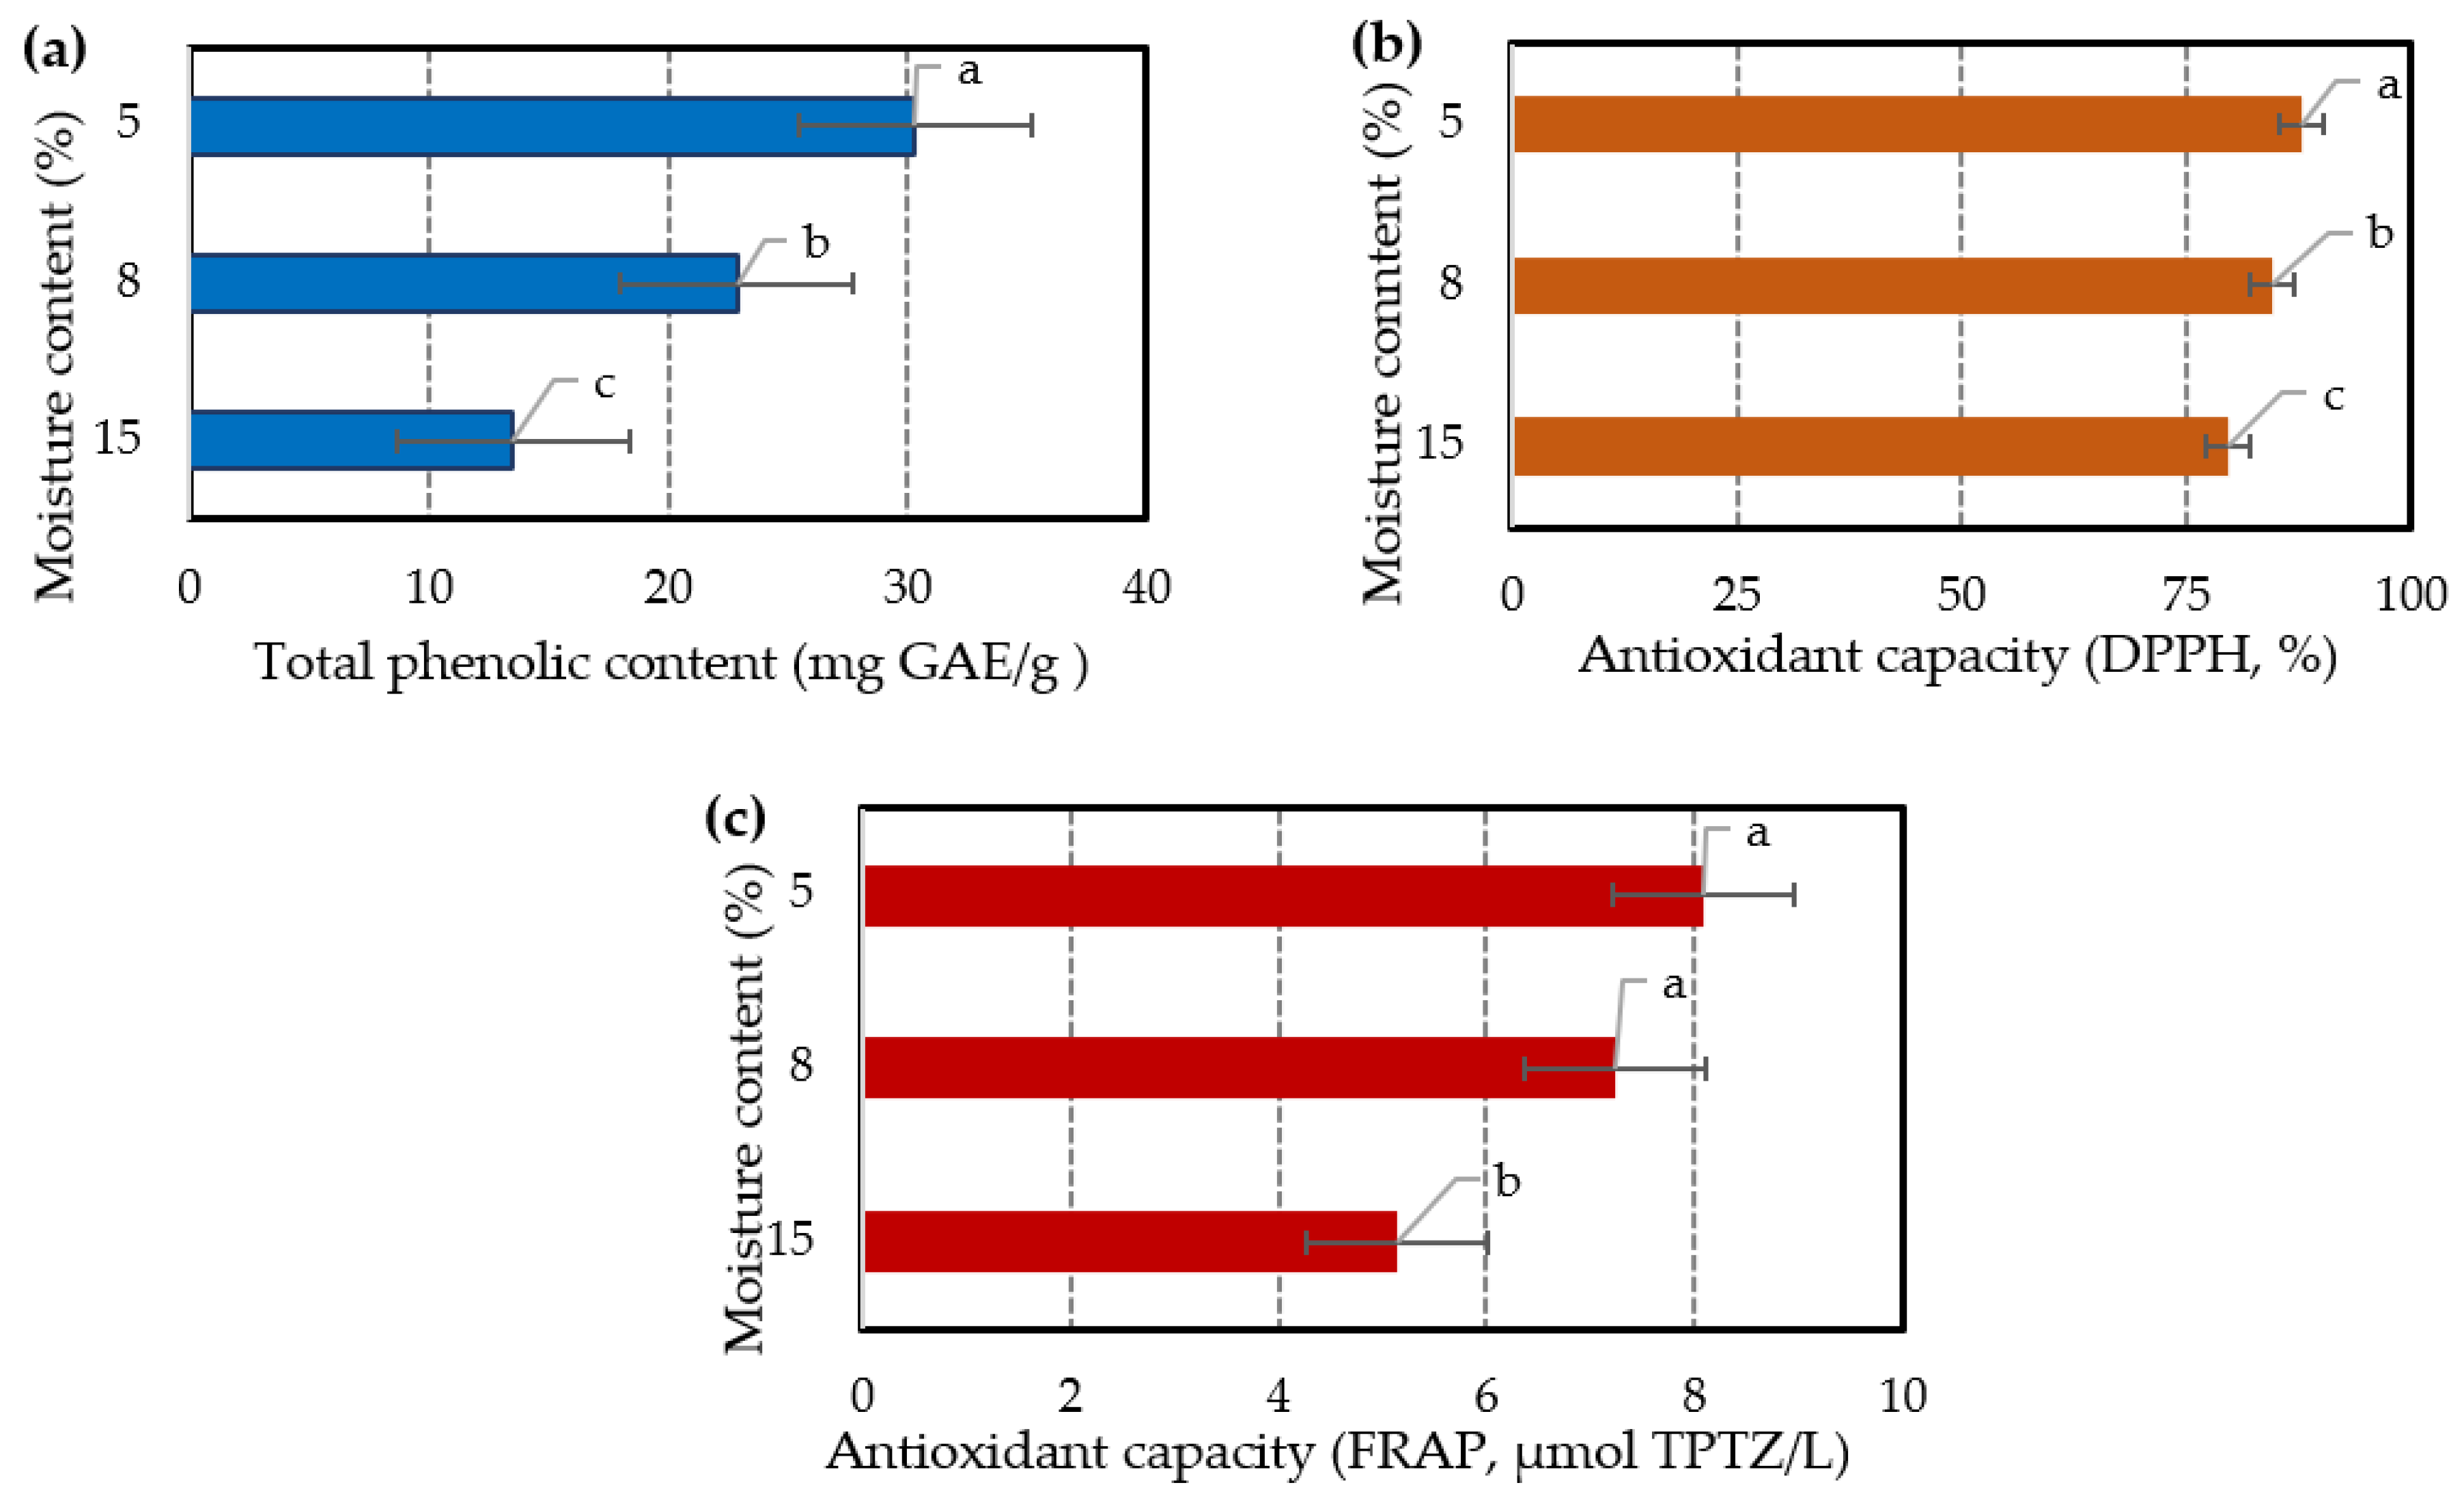
Figure 4.
Effect of milling degree of lavender solid waste (a) total phenolic content of extract (GAE mg/g of waste), (b) antioxidant capacity of extract (DPPH, %,) (c) antioxidant capacity (FRAP, μmoles TPTZ/L).
Figure 4.
Effect of milling degree of lavender solid waste (a) total phenolic content of extract (GAE mg/g of waste), (b) antioxidant capacity of extract (DPPH, %,) (c) antioxidant capacity (FRAP, μmoles TPTZ/L).
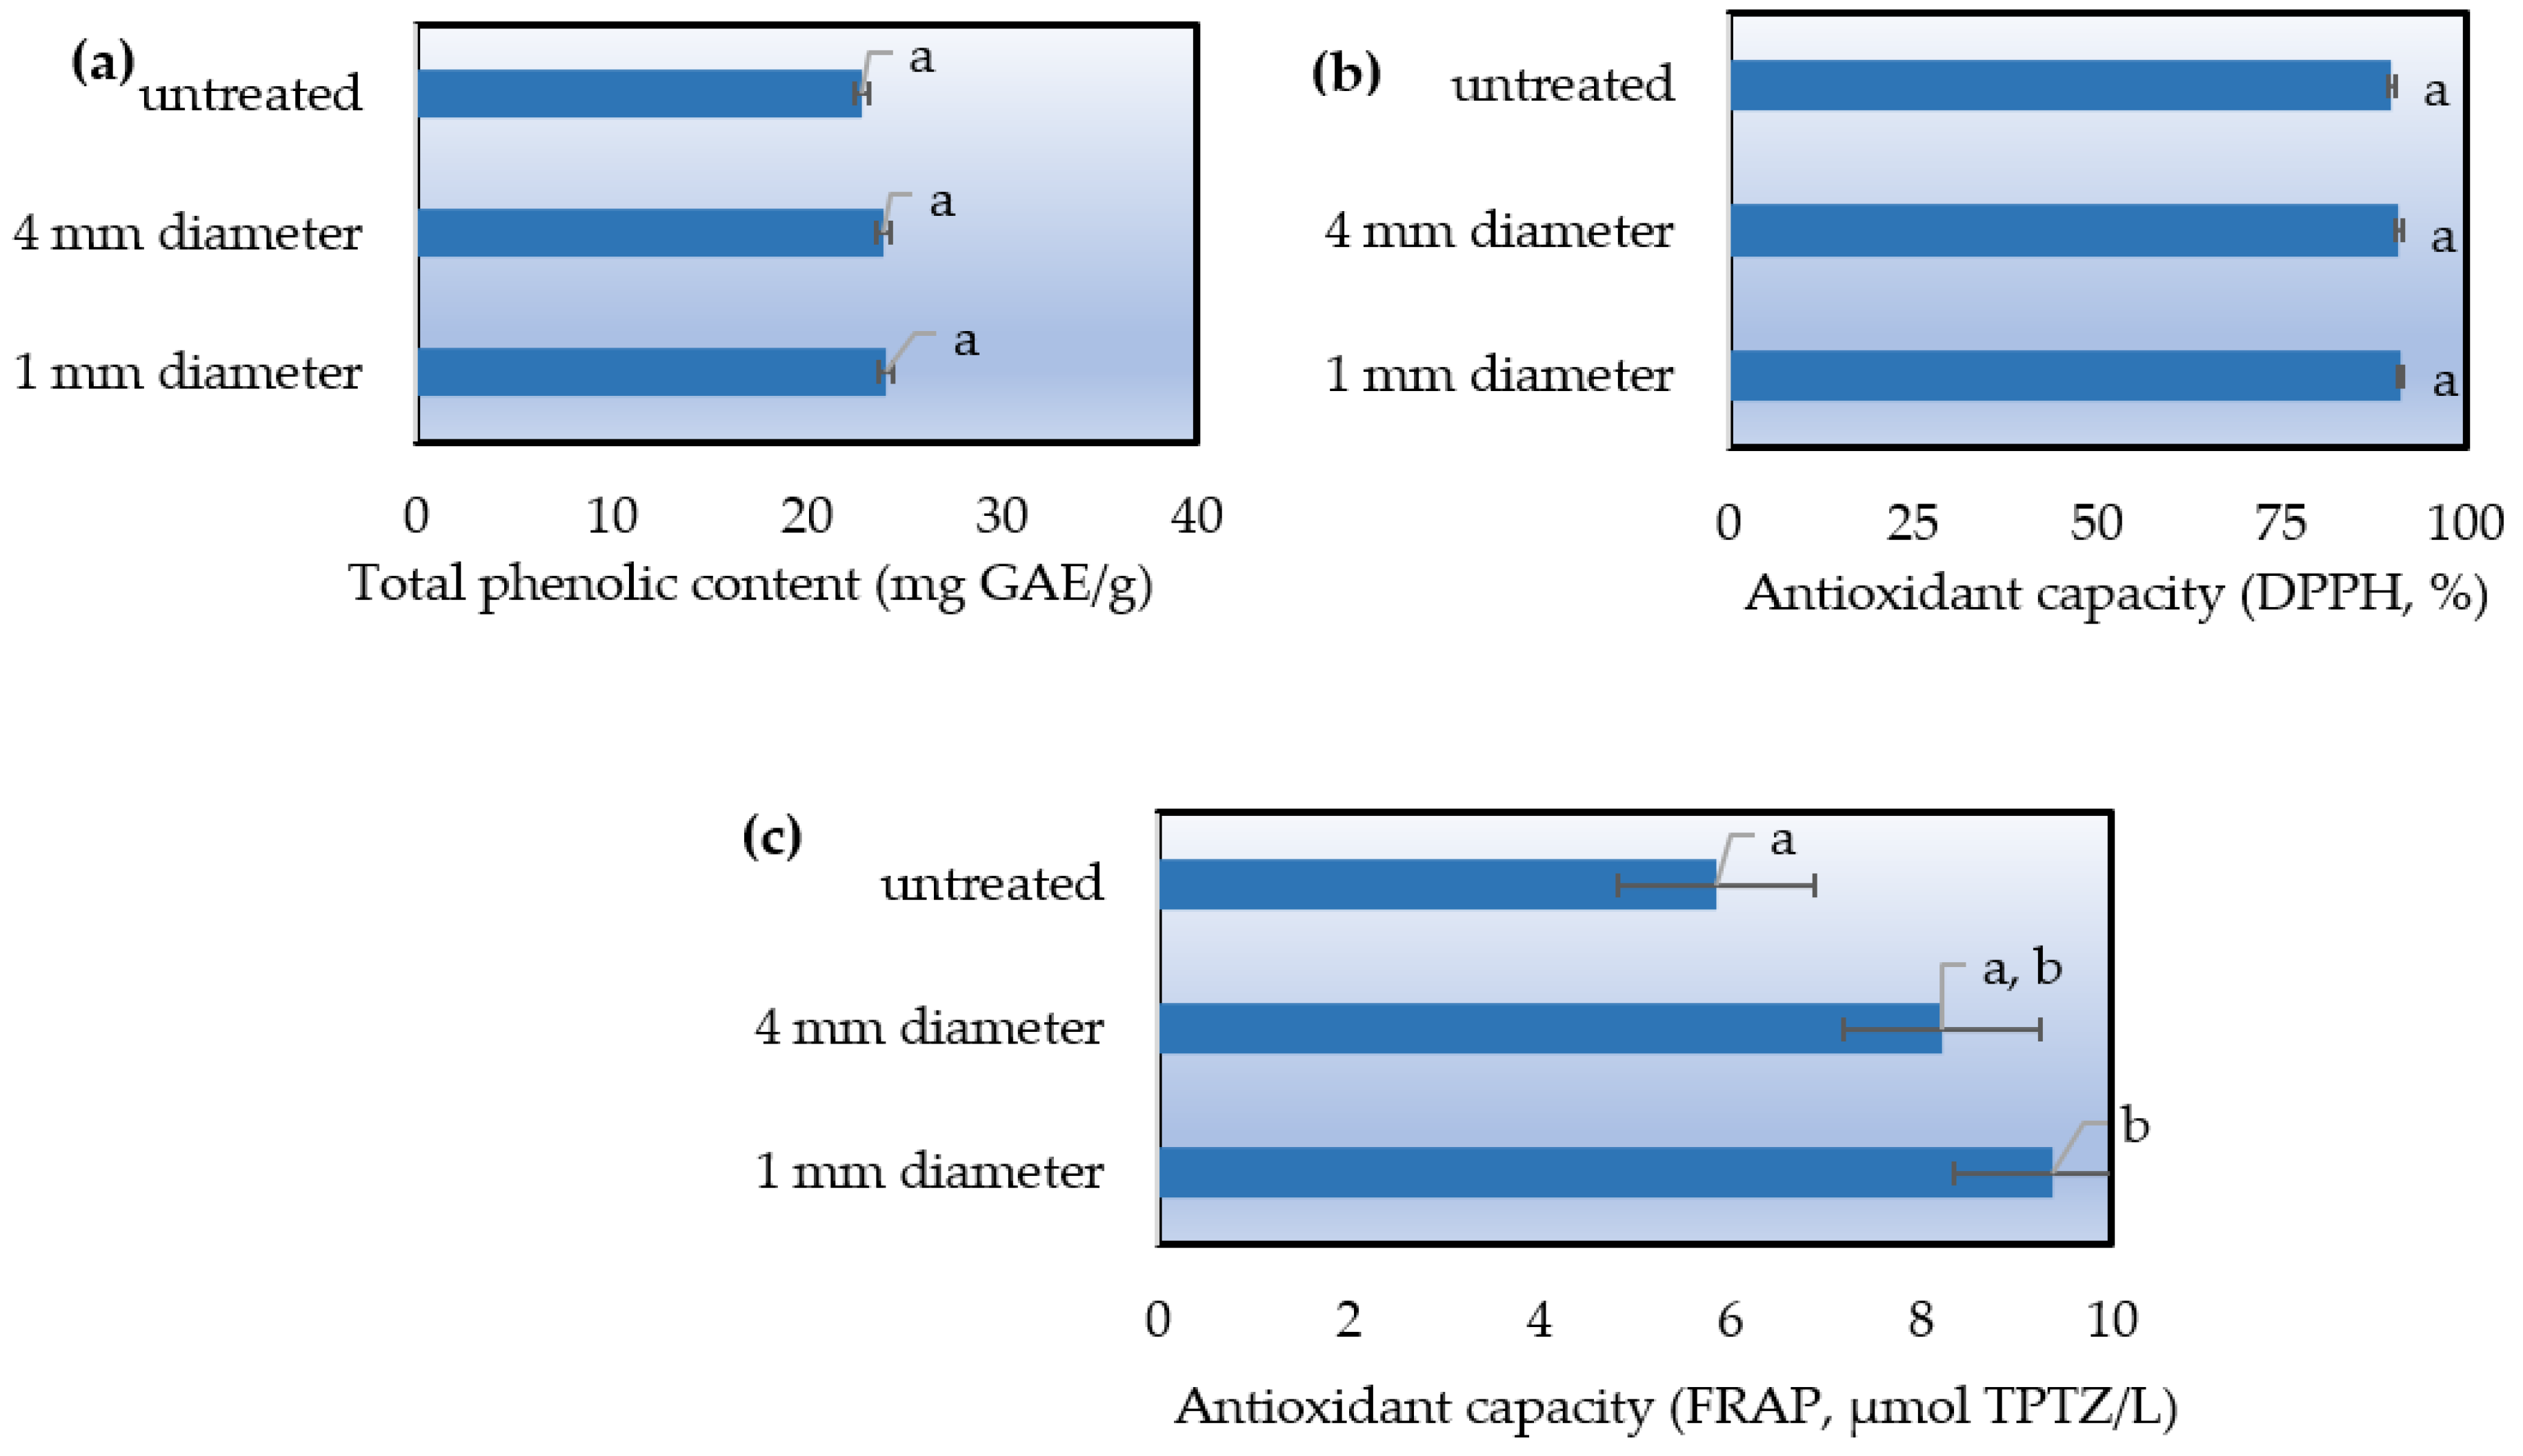
Figure 5.
Box plot showing the effect of solvent type on extraction yield (Y, mg GAE/g d.w.).
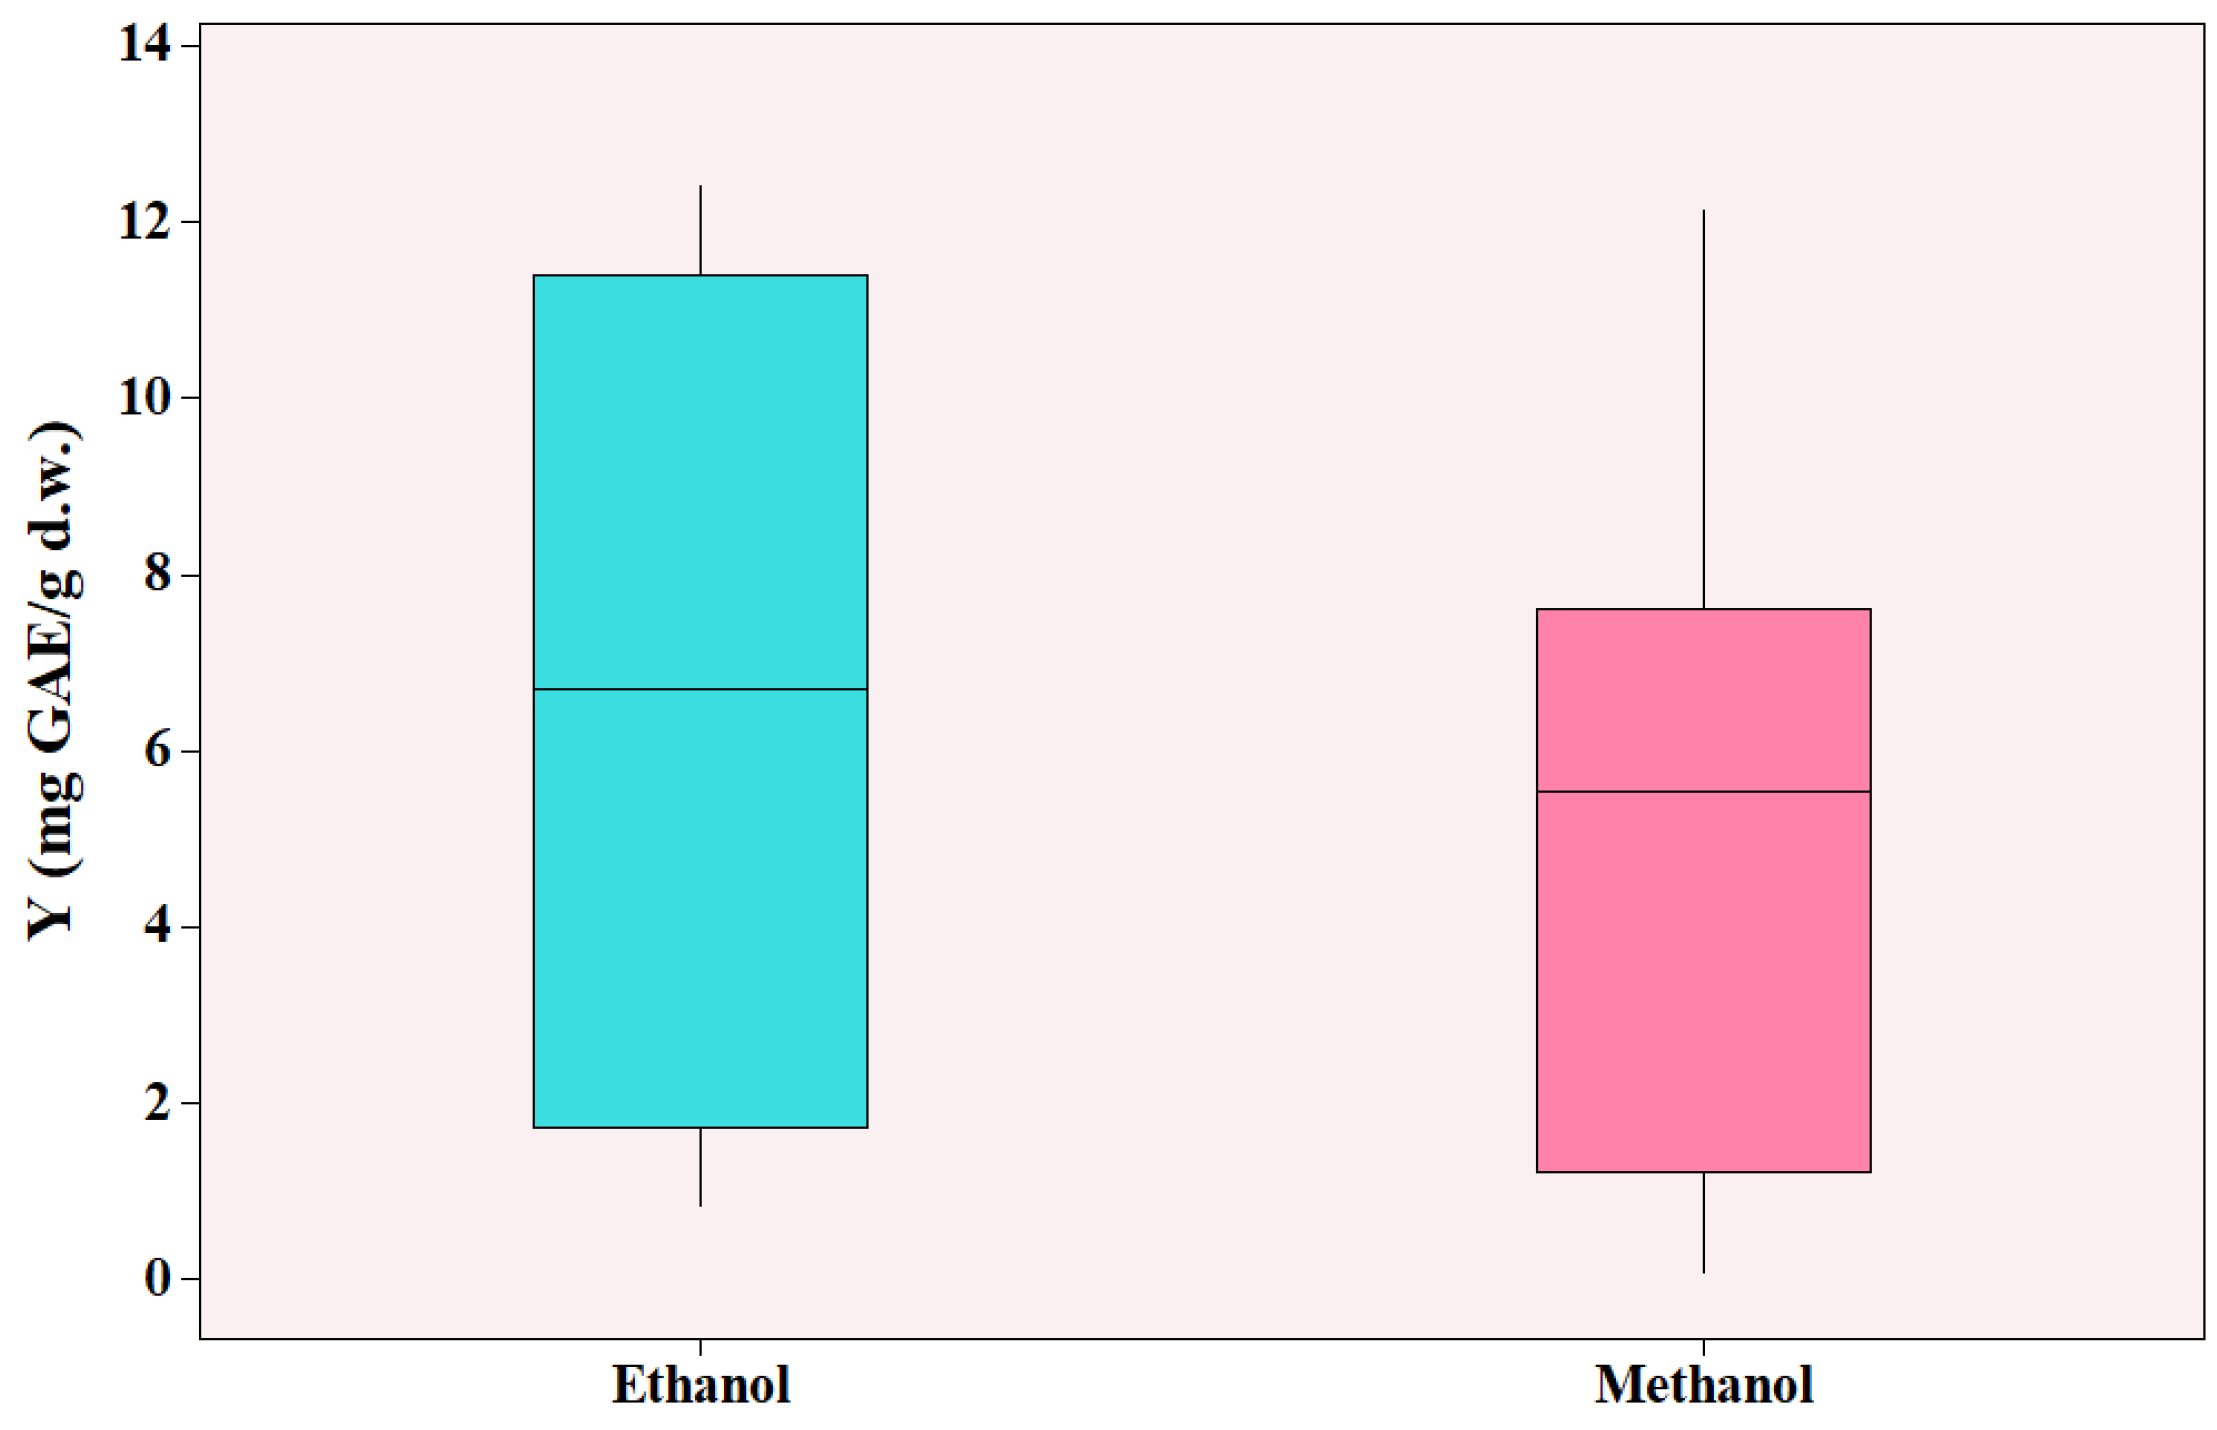
Figure 6.
Effect of microwave power (P, W), solvent/SW ratio (L/S, mL/g), and solvent concentration (S, %) on extraction yield (Y, mg GAE/g d.w.).
Figure 6.
Effect of microwave power (P, W), solvent/SW ratio (L/S, mL/g), and solvent concentration (S, %) on extraction yield (Y, mg GAE/g d.w.).
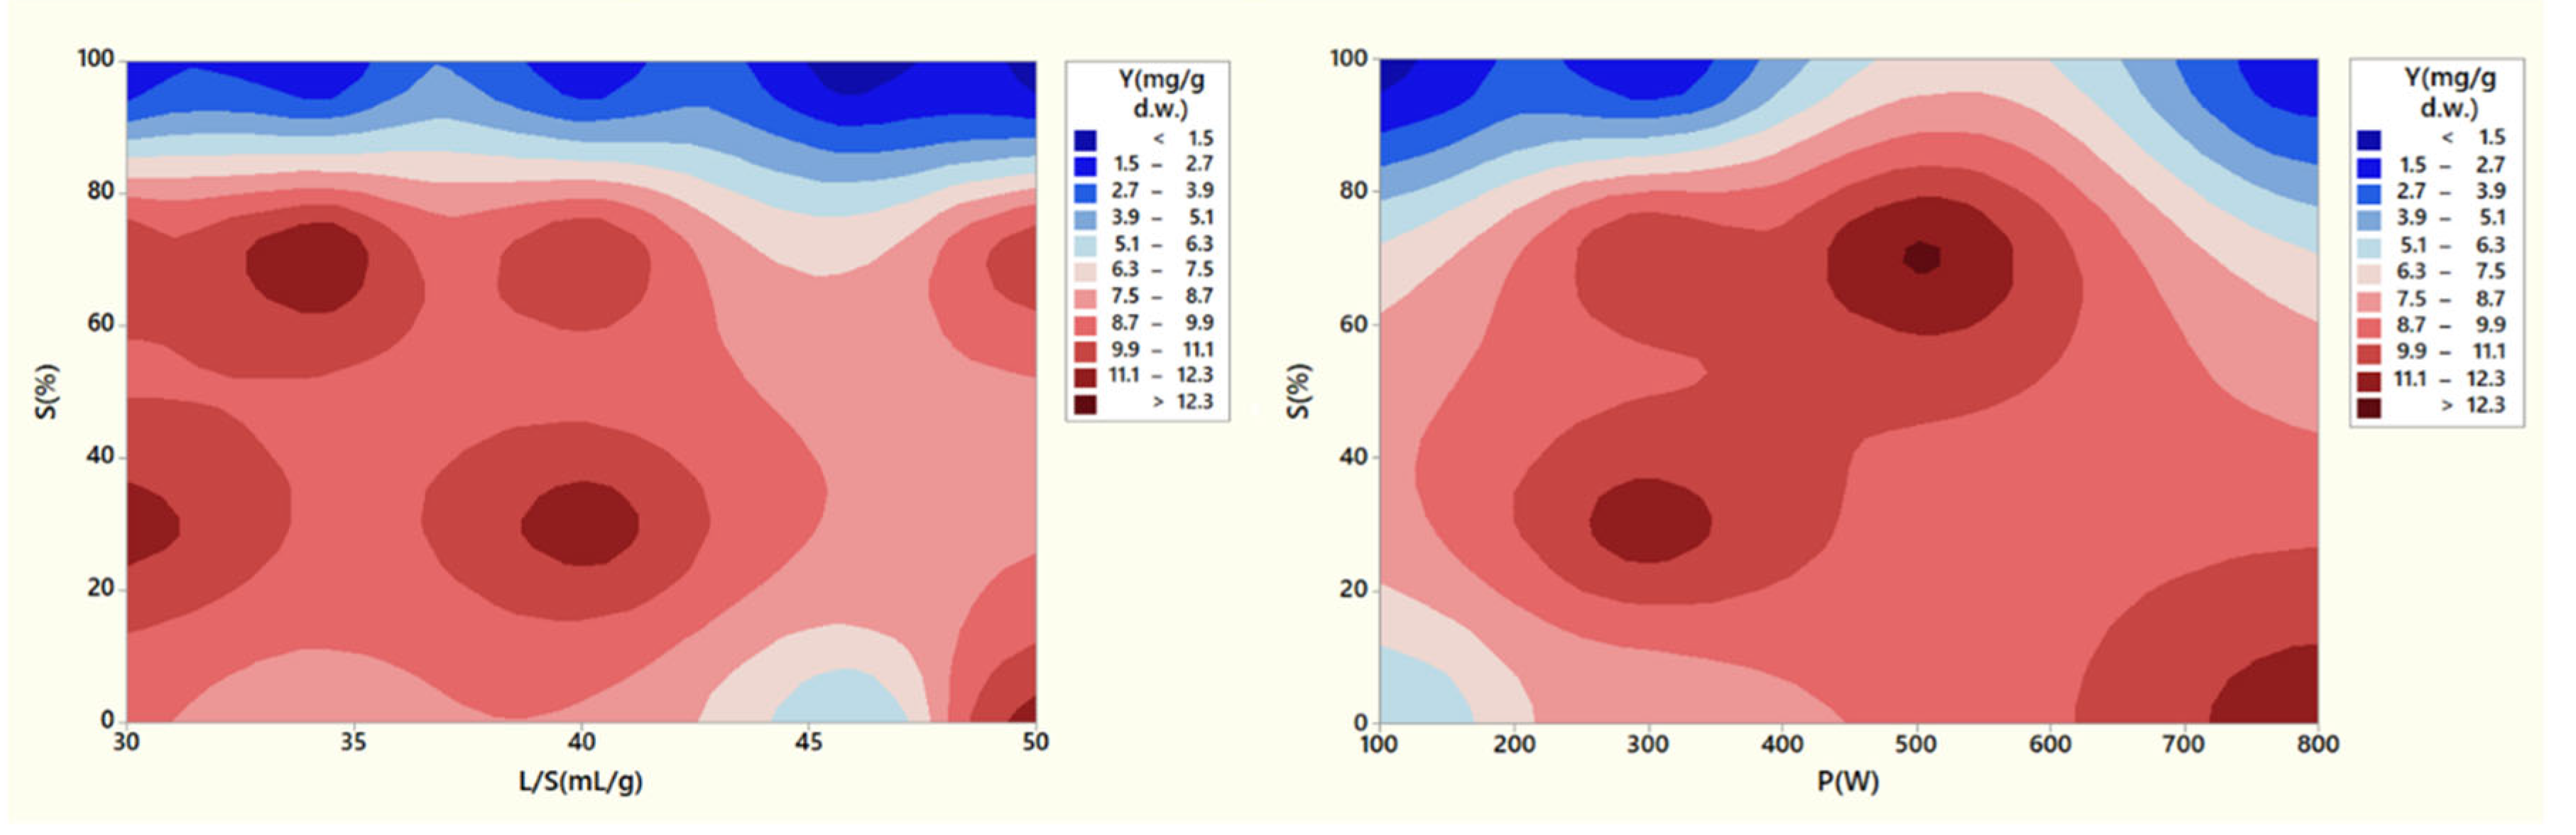
Figure 7.
Optimization for the MAE of phenolic compounds from lavender solid waste.
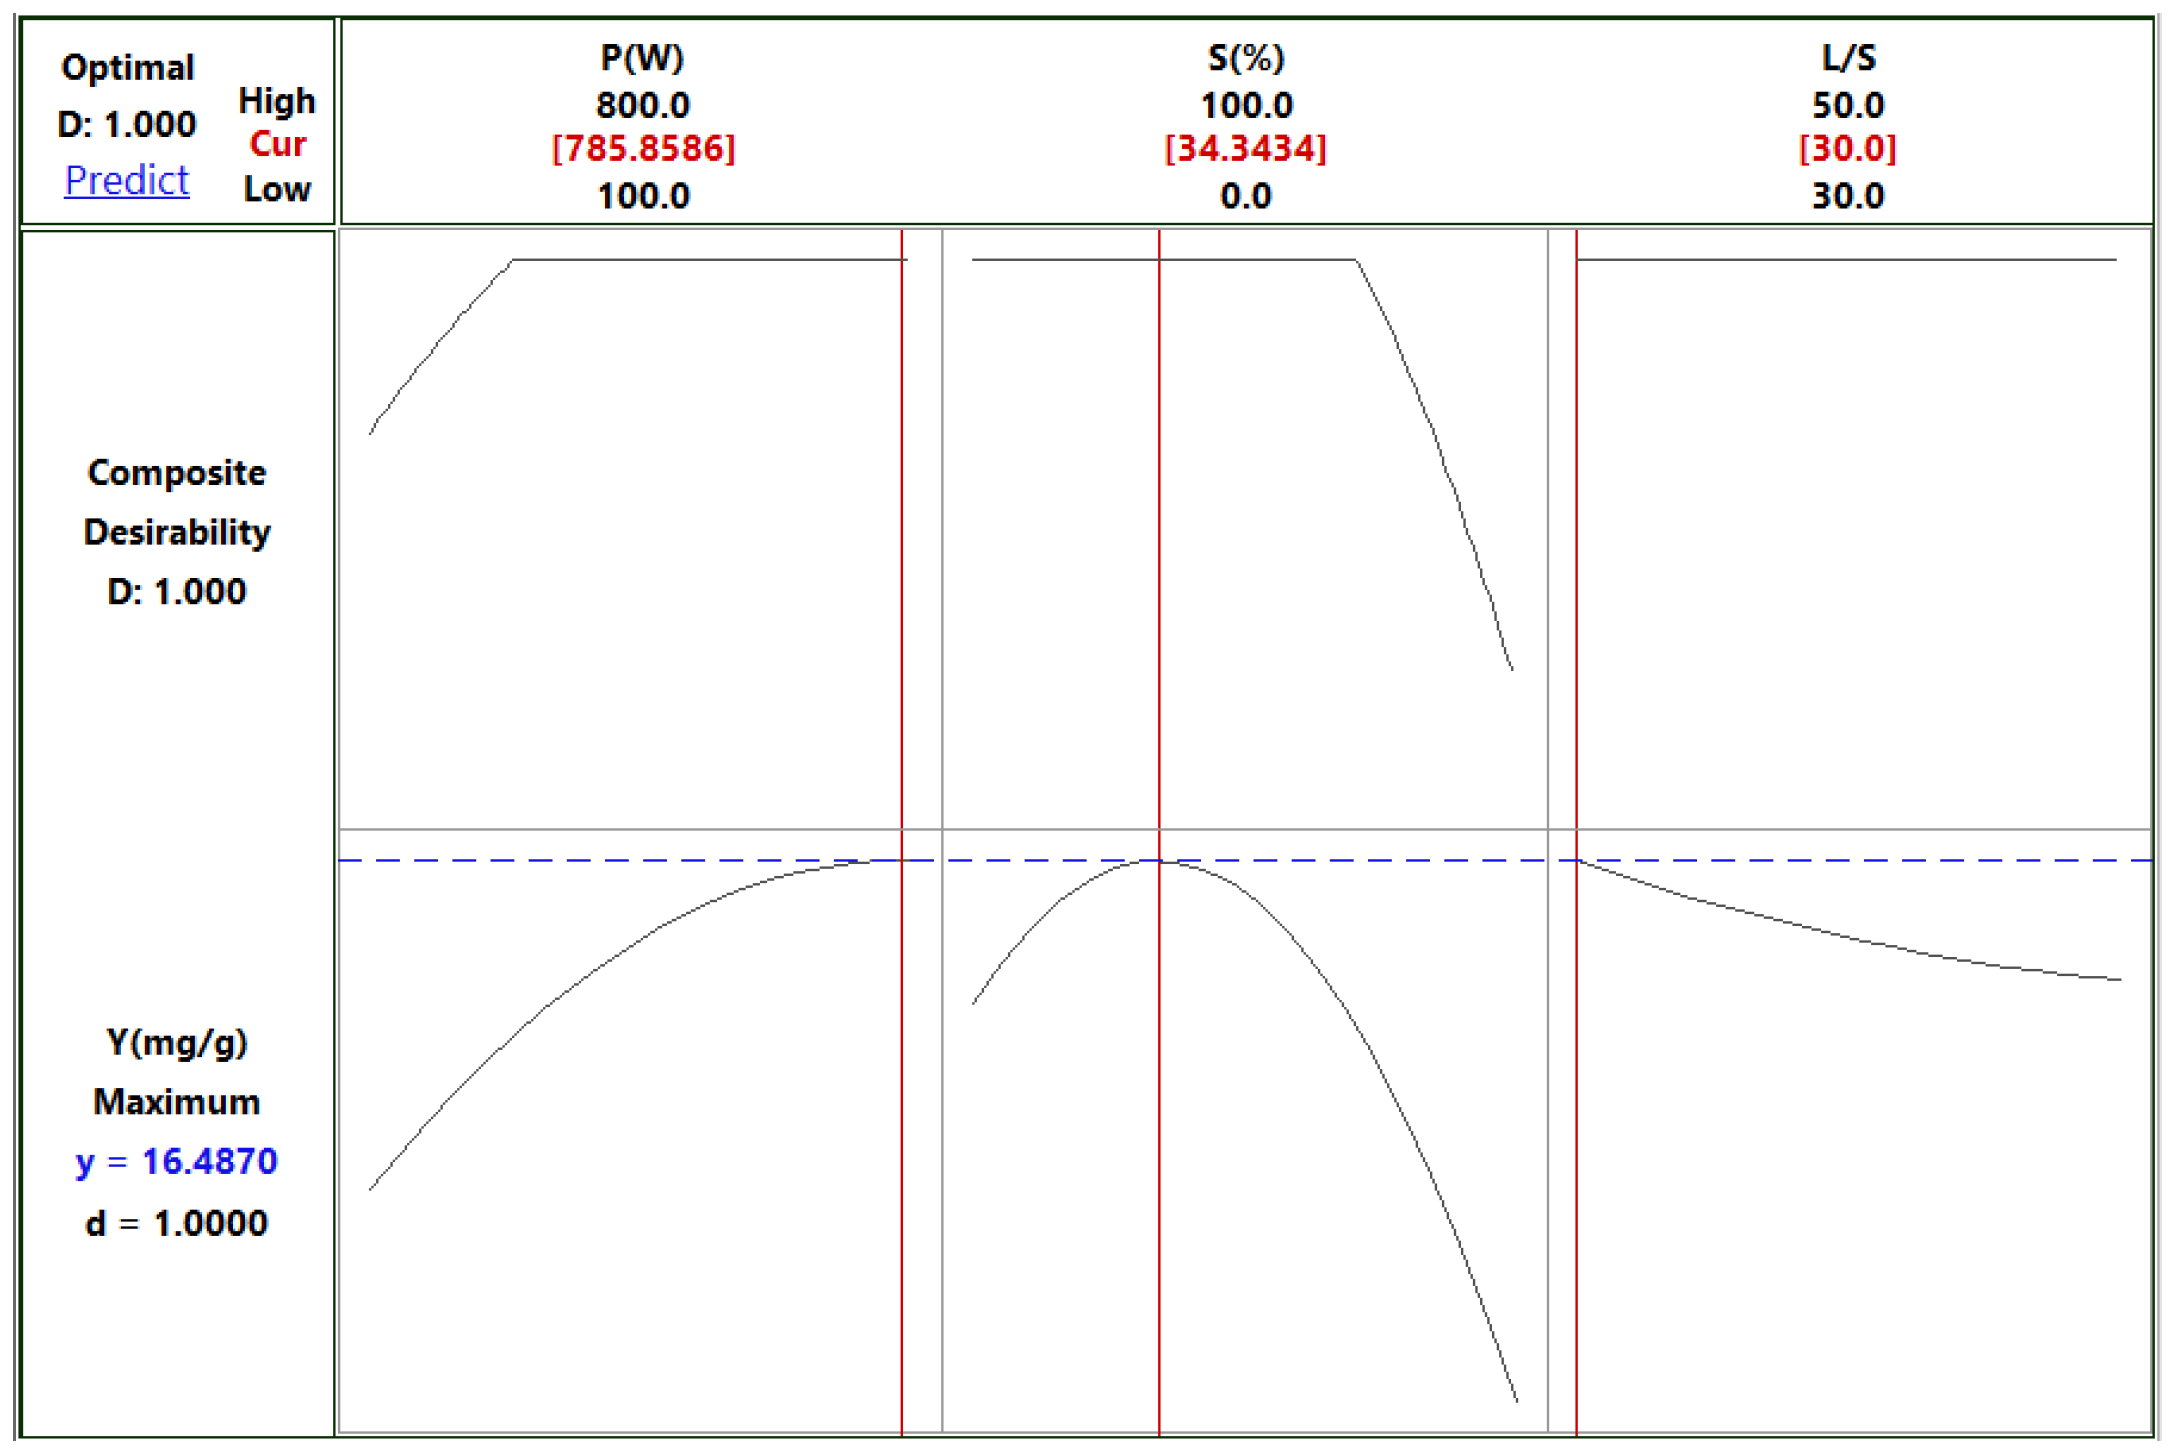

Table 1.
I-optimal experimental design for the MAE of lavender solid waste for two different solvents.
Table 1.
I-optimal experimental design for the MAE of lavender solid waste for two different solvents.
| Experiment No | Microwave Power (P, W) | Solvent Ratio (S, %) | Liquid/Solid Ratio (L/S, mL/g) |
| 1 | 100 | 100 | 30/1 |
| 2 | 800 | 0 | 50/1 |
| 3 | 800 | 100 | 34/1 |
| 4 | 500 | 70 | 34/1 |
| 5 | 300 | 70 | 20/1 |
| 6 | 100 | 0 | 46/1 |
| 7 | 300 | 0 | 34/1 |
| 8 | 300 | 70 | 40/1 |
| 9 | 300 | 30 | 30/1 |
| 10 | 100 | 100 | 34/1 |
| 11 | 300 | 70 | 30/1 |
| 12 | 100 | 10 | 50/1 |
| 13 | 300 | 30 | 40/1 |
| 14 | 100 | 100 | 46/1 |
| 15 | 300 | 100 | 40/1 |
| 16 | 300 | 100 | 40/1 |
Table 2.
Analysis of variance for the MAE of phenolic compounds from lavender solid waste.
| Source | DF | F-value | p-value |
| Model | 9 | 59.23 | 0.000 |
| Linear | 3 | 40.13 | 0.000 |
| P (W) | 1 | 20.97 | 0.004 |
| S (%) | 1 | 27.50 | 0.002 |
| L/S (mL/g) | 1 | 0.33 | 0.586 |
| Square | 3 | 80.86 | 0.000 |
| P (W) * P (W) | 1 | 3.04 | 0.132 |
| S (%) * S (%) | 1 | 74.44 | 0.000 |
| L/S (mL/g) * L/S (mL/g) | 1 | 0.39 | 0.557 |
| 2-way interaction | 3 | 4.22 | 0.063 |
| P (W) * S (%) | 1 | 3.73 | 0.102 |
| P (W) * L/S (mL/g) | 1 | 0.74 | 0.422 |
| S (%) * L/S (mL/g) | 1 | 1.47 | 0.271 |
| Lack of fit | 5 | 30.79 | 0.136 |
| Model Summary | |||
| S | R2 | R2adjusted | |
| 0.805 | 98.89% | 97.22% | |
Table 3.
Effect of drying and encapsulation on the extract’s antioxidant properties.
| Sample | Total phenolic content (mg GAE/g dry lavender) | % Antioxidant $$$$$$capacity | FRAP $$$$$$(μmol TPTZ/L) |
|---|---|---|---|
| UAE extract | 21.26 ± 3.52 a | 89.14 ± 1.26 a | 12.25 ± 1.18 a |
| MAE extract | 14.75 ± 0.35 b | 72.2 ± 1.34 b | 7.34 ± 1.52 b, c |
| Spray-dried UAE extract | 14.8 ± 1.86 b, c | 72.24 ± 1.86 b | 7.75 ± 0.79 b |
| Spray-dried UAE extract with 10% maltodextrin | 17.14 ± 2.45 c | 83.73 ± 3.06 c | 8.84 ± 1.69 a, b |
| Spray-dried MAE extract | 12.25 ± 1.37 d | 91± 0.33 d | 5.58 ± 0.08 c |
| Spray-dried MAE extract with 10% maltodextrin | 10.49 ± 1.5 d | 87 ± 0.95 e | 5.62 ± 0.43 c |
| Freeze-dried UAE extract | 15.89 ± 2.07 b | 75.49 ± 1.98 f | 9.15 ± 3.56 a |
| Freeze-dried UAE extract with 10% maltodextrin | 20.43 ± 0.9 a | 86.27 ± 0.24 e | 10.90 ± 1.47 a |
Same letters denote no statistically significant difference between the values in the same column (p > 0.05).
Table 4.
Comparison of physicochemical properties in the powder samples.
| Sample | Moisture$$$$$$content (% wet basis) | Bulk density (mg/mL) | Hygroscopicity (g water/100 g powder) |
Water activity (aw) |
|---|---|---|---|---|
| Spray-dried UAE extract | 4.41 ± 0.62 | 300 | 13.02 ± 0.66 a | 0.418 ± 0.01 a |
| Spray-dried UAE extract with 10% maltodextrin | 4.61 ± 0.33 | 363 | 9.66 ± 0.92 b | 0.327 ± 0.02 b |
| Spray-dried MAE extract | 5.05 ± 0.49 | 350 | 16.93 ± 0.44 c | 0.531 ± 0.04 c |
| Spray-dried MAE extract with 10% maltodextrin | 5.93 ± 1.12 | 456 | 15.04 ± 0.09 d | 0.481 ± 0.04 d |
| Freeze-dried UAE extract | 3.05 ± 0.83 | 320 | 10.51 ± 1.45 a, e | 0.550 ± 0.08 c |
| Freeze-dried UAE extract with 10% maltodextrin | 3.17 ± 0.66 | 385 | 8.33 ± 0.77 b, e | 0.483 ± 0.07 d |
No statistically significant difference between the values in the same column with the same letter (p > 0.05).
Disclaimer/Publisher’s Note: The statements, opinions and data contained in all publications are solely those of the individual author(s) and contributor(s) and not of MDPI and/or the editor(s). MDPI and/or the editor(s) disclaim responsibility for any injury to people or property resulting from any ideas, methods, instructions or products referred to in the content. |
© 2024 by the authors. Licensee MDPI, Basel, Switzerland. This article is an open access article distributed under the terms and conditions of the Creative Commons Attribution (CC BY) license (http://creativecommons.org/licenses/by/4.0/).
Copyright: This open access article is published under a Creative Commons CC BY 4.0 license, which permit the free download, distribution, and reuse, provided that the author and preprint are cited in any reuse.


