Submitted:
28 January 2024
Posted:
29 January 2024
You are already at the latest version
Abstract
Red mud (RM), a bauxite residue, contains hazardous radioactive wastes and alkaline material and poses severe surface water and groundwater contamination risks, necessitating recycling. Pretreated RM can be used to make adsorbents for water treatment. However, its performance is affected by many factors, resulting in a nonlinear correlation and coupling relationship. This study aimed to identify the best formula for an RM adsorbent using a mathematical model that examines the relationship between 11 formulation types (e.g., pore-assisting agent, component modifier, and external binder) and nine properties (e.g., specific surface area, wetting angle, and Zeta potential, among others). This model was built using a back-propagation neural networks(BP) based on single-factor experimental data and orthogonal test data. The model trained and predicted the established network structure to obtain the optimal adsorbent formula. The RM particle adsorbents had a pH of 10.16, specific surface area(BET) of 48.92 m2·g−1, pore volume of 2.10 cm3·g−1, compressive strength(ST)) of 1.12 KPa, and 24-h immersion pulverization rate(η_m) of 3.72%. In the removal of total phosphorus in flotation tailings backwater, it exhibited a good adsorption capacity (Q)and total phosphorous removal rate(η) of 48.63 mg·g−1 and 95.13%, respectively.
Keywords:
Back-propagation neural networks
; hazardous bauxite waste
; orthogonal test
; wastewater treatment
1. Introduction
Red mud (RM) is a bauxite residue produced in the alumina industry. On average, 1–1.5 tons of RM are produced for every ton of alumina produced[1,2]. The abandoned RM not only occupies a large area of land but also contains thorium, potassium, and other radioactive elements[3,4], which are hazardous solid wastes. In addition, the RM is an alkaline material and the alkali in the RM dissolve in the rainwater and contaminate the surface water and groundwater, causing severe environmental pollution[5]. Therefore, multichannel and massive recycling of RM resources is necessary. RM has a small particle diameter and a pore frame structure. It has a substantially larger pore ratio than typical soil and a large specific surface area. Hematite, goethite, and other minerals can also be found in the RM[6,7,8]. Pretreatmented RM can adsorb radioactive substances such as Co2+ and Sr2+[9], heavy metal ions such as Cu2+ and Pb2+[10], non-metallic hazardous compounds such as PO43−and As3+, and some organic contaminants[11,12]. It can also be used for wastewater decolorization and clarity[13,14] used calcination in the range of 500°C–800°C to produce macroporous iron- and carbon-combined calcined red mud (ICRM) and carbon-calcined red mud. The test results show that RM calcined with iron and carbon additives, or ICRM, achieved the highest U adsorption capacity (59.45 mg·g−1) under proper calcination temperature (i.e., 600°C) pH of 2.5 and optimum reaction conditions. [15] used a hydrothermal approach to modify RM by adsorbing Pb (II) ions in aqueous solutions using colloidal silica and sodium hydroxide under mild conditions. According to the test results, the saturated adsorption capacity of the modified RM for Pb(II) ion is ~564.97 mg·g−1, and the Langmuir constant KL is 0.23, which suggests that the adsorption process is favorable.
Using RM as the primary adsorbent, a spherical RM particle adsorbents with a double-layer structure was prepared in this study. The RM particle adsorbents produced has a high adsorption capacity and strong mechanical properties for phosphorus in phosphate ore flotation wastewater. The experimental results show that the composition of the raw material has a great influence on the adsorption effect of the adsorbent. Many input and output factors affect the performance of the adsorbent. Since most parameters of the adsorbent change nonlinearly, traditional methods are inadequate to determine the optimal formula for adsorbent. The current material formula optimization methods mainly include the orthogonal test method[16] and response surface method[17]. For complex systems with multivariable, nonlinear, and highly coupled variables, the traditional data analysis methods cannot satisfy the requirements. In 1986, Romelhart and McClelland proposed the error back-propagation (BP) algorithm. Since the training of the multilayer feedforward network often uses this algorithm, the multilayer feedforward network is often called the BP network[18,19,20] developed a removal rate and adsorption capacity model using the artificial neural network method. The results show that these models can predict the removal rate and adsorption capacity of ferricyanide and ferricyanide using active RM by changing input variables. Jie [21] used RSM and ANN to study the effects of hydrochloric acid concentration, temperature, and time on the activated adsorption of phosphorus by bauxite acid. The results show that they all provide good prediction quality, but the prediction accuracy of the artificial neural network is better than that of RSM. Therefore, BP neural network can be well applied to multi-factor formula optimization, realizing the transformation from a linear model to a nonlinear model, and can predict the experimental results well.
This paper presents an integrated computational intelligence approach based on a hybrid strategy of neural networks and a multiobjective evolutionary algorithm. The BP neural network was used to establish a multiinput and multioutput neural network model to optimize the formula. The experimental data were trained to obtain a neural network model that reflected the nonlinear mapping relationship between the parameter vector space and target vector space during parameter optimization. The trained neural network model was embedded into the multiobjective evolutionary algorithm, which is used as the individual fitness evaluation function in the evolutionary process. Hence, the multiobjective evolutionary algorithm could be directly applied in product parameter optimization design.
2. Materials and Methods
2.1. Test materials
RM, fly ash (FA), aluminate cement (A2C), and manganese dioxide (MnO2) are the main raw materials of the particle adsorbents in this study. The moisture content of RM was 30%. After drying at 50°C for 12 h, the RM was ground by a ball mill and screened using a 0.075 mm sieve. For FA, the burning loss was ≤5%, SiO2 content was ≥30%, and SO3 content was ≤2%; for the aluminate cement, Al2O3 accounted for 50%; CaO, 30%; SiO2, 10%; and Fe2O3, 3%. MnO2 was of industrial grade, with a purity of 97%.
The main reagents used in the test were hydrogen peroxide (H2O2), HCl (concentration 36%-38%), ICP test standard solution, HNO3 (concentration 68%), sodium dodecyl benzene sulfonate (SDSB), and sodium silicate (Na2SiO4), all of which were analytically pure. Further, commercially pure hydroxypropyl methyl cellulose (referred to as HPMC, 2 million mPa·s) and KH-602 silane-coupling agent were used.The adsorption activity site of the adsorbent was improved by adding FA[16,22], which was rich in Fe and Al compounds and larger than the surface. Foaming catalysts like H2O2[23] and MnO2[24] were added to increase the specific surface area of the adsorbent. The pH value, Zeta potential, and pore size distribution of the adsorbent were changed due to HCl[25] activation. The anionic surfactant and wetting agent sodium dodecylbenzene sulfonate (SDBS)[26] were used to alter the adsorbent’s wettability and surface activity, while also increasing its adsorption capacity. Combining the reinforcing agent (A2C+HPMC + Na2SiO4 + KH-602 enhanced the adsorbent’s strength and immersion loss rate[27,28].
For the test, phosphorus-containing wastewater was collected from a phosphate ore dressing plant in Guizhou, China. The recycling water containing flotation tailings was collected; this water contained 1278 mg·L−1 of phosphorous. To prepare RM particle adsorbents, the recycling water containing flotation tailings diluted 10 times was selected as the test water. This choice is based on the measurement range of the ICP instrument (Thermo Fisher Scientific, USA, model ICP-7400).
The test equipment included PQ10 granulating disk, electronic balance (model: BL-2000F), ball mill (XMGB Φ 305 × 3.5), SHBY-40B constant temperature and humidity standard curing box, SHBY-40B water bath thermostatic oscillator, JJ-1 enhanced electric agitator, HY-4 speed-regulating multi-purpose oscillator, and self-made dynamic adsorption and desorption integrated equipment.
2.2. Preparation method of the RM adsorbent
Preparation of the main material for the adsorbent powder: RM and aluminate cement were added to the agitator with a mass ratio of 6:4. After mixing the materials evenly, the mixture was placed in a granulating disk, and deionized water was sprayed into the agitator while rotating until the mixture was formed. Subsequently, a 1 mm sieve was used to remove circular particles. After sieving, the mixture was dried in a 40°C electric blast-drying oven till the water content was less than 5%, resulting in the formation of nucleating granule support. In the high-speed powder dispersing machine, the adsorbent powder was prepared by adding RM, 1.7%–8.5% FA, 2%–10% A2C, 10%–20% MnO2, and other powders according to the ratio.
Preparation of the active binder: KH-602, hydroxypropyl methyl cellulose (HPMC), and Na2SiO4 powders were added into the deionized water with a water-binder ratio of 3:1, with mass ratios of 0.1%-0.4%, 0.5%-2.5%, and 2%-4%, respectively. Thereafter, the mixture was magnetically stirred for 5 min, and then it was kept standing for ~24 h for later use; subsequently, H2O2 was added according to the mass ratio of 0.4%–2.0%, followed by magnetic stirring for 5 min and standing for ~24 h; HCl and SDBS were added with mass ratios of 0.25%–1.2% and 0.05%–0.25%, respectively, followed by magnetic stirring for 5 min and standing for ~24 h, resulting in the formation of the active binder.
Preparation of RM particle adsorbents: First, 10%–20% nucleating particle support was added to the granulating disk, and the adsorbent powder was added while rotating. The active binder was slowly sprayed in continuously till the adsorptive active coating attained a certain thickness. After rotating for another 10 min, the adsorbent was screened and placed in the cement concrete standard curing box under constant temperature and humidity for 3 days and finally dried at 40°C in the electric blast-drying oven. Thus, the RM particle adsorbents was obtained.
2.3. Establishment and application of the BP neural network model
The main objective of adsorbent formula optimization was to improve the mechanical adsorbent properties while satisfying the adsorption capacity. The preparation conditions clearly indicate that there exists certain coupling and nonlinearity among the various adsorbent properties, and the orthogonal test method cannot satisfy the formula optimization. Therefore, the neural network was used for nonlinear formula optimization to obtain the relationship between the appropriate ratio and the optimal performance.
2.3.1. Determination of input and output training datasets
The input training data of the network are single-factor test data and orthogonal test data of the RM particle adsorbents, and the output data are performance test data of non-thermal activated RM particle adsorbents. In all, 131 sets of training data were used.
Among them, the first 31 groups of training data were single-factor test data. In the single-factor test, 300 g of RM with a water–cement ratio of 1:3, 2% Na2SiO4, and 0.1% KH-602 were used as blank tests. They were added as indicated in Table 1. After #02 to #06 tests, the amount of RM added was set to 285 g, and the FA concentration was set to 5.1%. Then, the concentrations of A2C, HPMC, H2O2, MnO2, and HCl were determined as 8%, 0.25%, 1.6%, 0.32% and 0.75%, respectively.
The last 100 groups of training data were 11-factor 5-level orthogonal test data, where the concentrations of aluminate cement and Na2SiO4 were determined as 8%, 2%, respectively. Then, the orthogonal test was performed by changing the amount of RM,FA, H2O2, MnO2, HPMC,HCl, and SDBS ,with a water–cement ratio of 1:3.
After the preparation of the adsorbent, it is necessary to test nine properties—specific surface area(BET), wetting angle(), Zeta potential(), adsorption capacity(Q)[19], compressive strength(ST)[29], removal rate()[30], immersion pulverization rate(K), water absorption rate, and pH—of the adsorbent, of which the adsorption capacity, compressive strength, removal rate, and pulverization rate are the important basic indexes to measure the particle adsorbents. Zeta potential[31] is a useful metric for determining the adsorption system’s stability and electrochemical properties. Colloids with high Zeta potential are stable, while those with low Zeta potential tend to flocculate. The pH value[32] is the main influencing factor of Zeta potential. There is a good correlation between wettability and adsorption capacity, and the better the wettability[33] of the adsorbent surface, the better the adsorption effect. The larger specific surface area[34] is beneficial to the adsorption effect of the adsorbent, and the specific surface area is related to the water absorption[35] and adsorption capacity.
The removal rate η of phosphorus in the solution, the adsorption capacity Q of the adsorbent, the pulverization rate of the adsorbent , and the water absorption rate K of the adsorbent were calculated according to Eqs. (1) and (4) as follows:
Where, η represents the removal rate of phosphorus in the solution (%); represents the concentration of phosphorus in the solution before adsorption (mg·L−1); represents the concentration of phosphorus in the solution after adsorption (mg·L−1); represents the adsorption capacity of adsorbent per unit mass (mg·g−1); represents the volume of the solution (L); represents the mass of the adsorbent after drying (g); represents the pulverization rate of the adsorbent (%); represents the drying mass of the adsorbent after adsorption (g); represents adsorbing capacity (g); represents the water absorption rate (%); represents the mass of deionized water absorbed by the adsorbent (g).
Micro metrics measured the specific surface area of particle adsorbents ASAP2020 N2 adsorption/desorption physical adsorption instrument (BET), and the specific surface area (SBET) was calculated using the Brunauer-Emmett-Teller method.
The Zeta potential ()on the surface of the adsorbent before and after adsorption was determined using the nanoparticle size /Zeta potential analyzer (Beckman Coulter, USA, model: DELSA Nano C). The test sample was put into a beaker, and a certain volume of deionized water was added. The suspension was prepared with a water–cement mass ratio of 100:1. After magnetic stirring for 10 min, the suspension was fully dispersed and then left standing for 6 h. Subsequently, the supernatant was collected into the sample cell and placed in a potentiometer for determining the Zeta potential.
The wetting angle of the particle adsorbents was measured by the LAUDA wetting angle measuring instrument/contact angle measuring instrument (LAUDA Scientific, Germany, model: LSA60). Since a block sample reflects the real wetting angle of the mineral better than a powder-pressed sample, 1 × 1 × 1 cm cubic mineral blocks that were ground with sandpaper, washed with distilled water, and dried naturally before being used were adopted for all the wetting angle tests. An ore cube was immersed in the solution to be tested for 30 min and then taken out for measuring the wetting angle by the floating bubble method. The measurement was repeated five times to obtain the average value.
Particle strength ST (KPa) was measured by the APT-3 particle strength tester.
The pH value of the solution is affected by the content of the adsorbent formula—the pH value of the phosphorus-containing wastewater after adsorption is measured with a pH meter.
2.3.2. Establishment of a BP network optimization model
The BP neural network optimization model of the nonthermally active RM particle adsorbents is shown in Figure 1. The model has an 11-input-9-output structure. The designed neural network has a three-layered structure, including input layer, output layer and hidden layer, where X is the input layer, representing the parameter change of each formula. Y represents the amount of change in each performance index caused by a change in X and is used to investigate the influence of the change amount of each factor on the performance index of the adsorbent. The following formula was used to select the number of neurons in the hidden layer:
where m represents the number of nodes in the input layer; l represents the number of nodes in the hidden layer; n represents the number of nodes in the output layer; and is a constant between 1 and 10.
The input-output relationship is represented as follows:
x = {RM, FA, A2C, HPMC, H2O2, MnO2, HCl, SDBS, Na2SiO4, KH-602, Water–Cement Ratio},
y = {specific surface area, wetting angle, Zeta potential, adsorption capacity, compressive strength, removal rate, immersion pulverization rate, water absorption rate, pH}.
2.3.3. Training data preprocessing and parameter setting
When the input value is too large, the neurons will be in a saturated state, thus losing the ability to learn. Therefore, the input value should be normalized, and the input value is processed within [0,1]. The normalized function is as follows[36]:
The input and output data sets were normalized. Similarly, the predicted results were normalized and then output. The training parameters were set after normalizing the training data. Among the 131 experimental data, 84 data were randomly selected as training data for neural network training and 47 data were used as test data for network validation. MATLAB R2022b software was used to set parameters as follows: 84 input samples, 47 test samples, a maximum of 10,000 training steps, and a training error of 10−3.
3. Results and Analysis
3.1. Network training and verification
The network was trained after setting the parameters. Figure 2 shows the curve of the number of training steps and error. For a training time of 4 min and 30 s and 10,000 training steps, the network error converged to 10−3, and the training correlation coefficient R = 0.99879. The results show that the training steps of the prediction network model are reasonable, and the prediction results are consistent with the actual values with high accuracy and relatively small error, thereby meeting the training requirements. Therefore, the established prediction network model can be used for test prediction.
The trained network was verified using orthogonal test samples. A comparison of learning and testing of the nine output parameters of the network is shown in Figure 3. The fitting value is consistent with the experimental value, the network error is modest, and the convergence is good, as shown in the figure, so it can be used for parameter optimization and prediction.
After the optimization ratio calculation is completed, the adsorbent is prepared according to the optimized formula, and the performance of the adsorbent is verified to determine the optimized formula finally. H2O2, HCl, and SDBS were found to be the important agents affecting adsorption capacity. The synergistic effect of these three agents increased the specific surface area of the adsorbent, reduced the wetting angle, and changed the wettability of the surface. The key agents affecting the strength were HPMC and aluminate cement, whose synergistic effect enhanced the compressive strength and water-immersion pulverization rate. However, during non-thermal activation, there is a tradeoff between the regulation of adsorption capacity and mechanical properties. The evaluation results of BP neural network can better guide the optimization of the adsorbent formula in the field.
After research that shows that many factors affect the adsorption effect of RM particle adsorbents. These factors include the preparation method, raw material formula, drug system, operating conditions, and adsorption state. By establishing a multiinput multioutput comprehensive evaluation model based on a BP neural network model, the sensitive factors of the adsorption process are obtained. This allows a comprehensive evaluation of the adsorption performance. With regard to the parameter optimization for adsorption and desorption, adsorption analysis is a dynamic process with many influencing parameters and many output factors. Using a neural network to simulate and optimize the parameters can greatly reduce the number of tests, modify the test precision, and improve the efficiency.

Table 2.
The range of the optimized parameters.
| Name of component | RM/g | FA/g | W:H | A2C/% | HPMC/% | Na2SiO4/% |
| Range | 275–300 | 1.7–8.5 | 1:3 | 2–10 | 0.05–0.25 | 2 |
| Name of component | KH-602/% | H2O2/% | MnO2/% | HCl/% | SDBS/% | |
| Range | 0.1 | 0.4–2 | 0.08–0.4 | 0.25–1.25 | 0.05–0.25 |
3.2. Performance analysis of RM particle adsorbents
Once the network has been trained and tested for validation, the model can be used to predict and analyse the results of the experiment.During formula optimization, 11 input parameters and 9 output parameters were optimized. By fixing the ratio of 11 agents and changing the dosage of the agent to be optimized, the value was calculated according to the range of the dosage from small to large with a certain step size, and the changes in the output parameters at each change points were compared. Then, according to the target output value of the RM particle adsorbents, the optimal ratio was derived. The training shows that the results obtained by the BP neural network constructed by us are consistent with the experimental values.
3.2.1. Effect of FA on adsorbent properties
As can be seen from Figure 4, after adding FA to RM, the removal rate of total phosphorus gradually increased, but FA reduced the adhesion and the strength of the adsorbent. When the amount of FA added was 8.5%, the removal rate of total phosphorus reached 78.27%, while the pulverization rate reached 94.30%. As can be seen from Figure 4, the specific surface area and water absorption increased with increase in FA content. As the FA content increased to 8.5%, the specific surface area increased to 26.98 m2·g−1, and the water absorption increased to 14.17%. FA is an acidic secondary ash with fine particles and a large specific surface area[37], the addition of FA results in a smaller wetting angle, enhanced hydrophilicity, and reduced pH value; further, the Zeta potential decreased first and then increased in the positive direction, which is not conducive for the stability of a solution system but is beneficial to the adsorption of anions.
3.2.2. Effect of enhanced and anti-chalking agents on the adsorbent properties
The enhanced and anti-chalking agents used in this work are mainly the combined reagent A2C/HPMC/Na2SiO4/KH-602. The influence of A2C on the performance of the adsorbent when the dose of fixed coupling agent KH-602 was 0.1% is shown in Figure 5.When the dose of A2C was increased from 2% to 10%, the compressive strength of the adsorbent increased from 0.58 kPa to 0.81 kPa, and the pulverization rate decreased from 5.60% to 3.50%. Meanwhile, the adsorption capacity of A2C for total phosphorus decreased from 37.22 mg·g−1 to 31.01 mg·g−1, and the removal rate decreased from 72.81% to 60.66%. As can be seen from Figure 5, with additional A2C, the specific surface area of the adsorbent and water absorption rate decreased, adding A2C to the adsorbent increases the pH, increases the wetting angle, weakens the hydrophilicity, increases the Zeta potential in a negative direction, and weakens anions adsorption.
By fixing the addition amount of A2C to 8% and adding 2% Na2SiO4 and 0.1% KH-602, a certain amount of HPMC was added to further adjust the mechanical properties of the particle adsorbents. The influence of HPMC on the adsorbent properties is shown in Figure 6. Under identical conditions, the addition of HPMC had a great effect on adsorbent performance. With the increase in the amount of HPMC added, the adsorption capacity of the adsorbent for total phosphorus decreased. When the dose of HPMC increased from 0.05% to 0.25%, the adsorption capacity of total phosphorus decreased from 30.56 mg·g−1 to 25.98 mg·g−1, and the removal rate decreased from 59.78% to 50.82%, but the strength increased from 0.93 kPa to 1.46 kPa, and the pulverization rate of the particles decreased significantly. When the dose of HPMC was 0.25%, the 24 h pulverization rate decreased to 1.2%. The effects of HPMC on the specific surface area and water absorption rate were similar to those of A2C. HPMC has little influence on pH, but it does raise the wetting angle, weakens the hydrophilicity, increases the Zeta potential in a negative direction, and develops the system in a stable direction, which is unfavorable adsorption, as shown in Figure 6.
3.2.3. The effect of non-thermal pore-forming agent H2O2 on adsorbent properties
As can be seen from Figure 7, when the dose of H2O2 was 0.4%-2%, the adsorption capacity of the adsorbent on total phosphorus increased from 35.13 mg·g−1 to 44.67 mg·g−1, and the removal rate increased from 68.72% to 87.38%, but the strength decreased from 1.32 kPa to 0.92 kPa. Further, the water-immersion pulverization rate of the particles decreased, and the soaking pulverization rate increased from 1.5% to 4.2%. The oxidation and foaming effects of H2O2 led to a rapid increase in the specific surface area of the adsorbent. When the dose of H2O2 increased from 0.4% to 2.0%, the specific surface area of the adsorbent increased from 23.95 m2·g−1 to 35.23 m2·g−1; thus, the water absorption rate also increased because of the formation of more pores. With an increase in H2O2, some basic substances were oxidized[38], and the pH value of ARMFA tended to decrease; further, the surface tension decreased, and the surface energy increased. The liquid formed a continuous phase on the solid surface, and the wetting angle became smaller, and the Zeta potential changed in the positive direction, which was beneficial for the adsorption of anionic pollutants.
3.2.4. Effect of HCl on adsorbent properties
The properties of the HCl-modified particle adsorbents are shown in Figure 8. After adding H2O2 and MnO2 foaming agents, HCl was added to activate the adsorbent, which further improved the porosity of the adsorbent. When the dose of HCl was 0.75%, the adsorption capacity of total phosphorus was 47.44 mg·g−1, and the removal rate was 92.80%. The strength was 1.03 kPa, and the 24-h immersion pulverization rate was 4.16%. HCl is a strong inorganic acid and can release a large amount of H+ in the binder. With an increase in the HCl dose, the adsorption capacity of the adsorbent first increased and then decreased, and the adsorption effect was significant when 0.75% HCL was added. Thereafter, as the dose of HCl was further increased, the adsorption capacity and strength decreased, and the immersion pulverization rate increased. When HCl content exceeds 0.75%, OH− and H+ in the system are neutralized by acid and base, respectively, resulting in increased pores and partially forming through pores, which increases the desorption capacity of the system and decreases the adsorption capacity. When HCl was added, the water absorption increased with an increase in HCl dose, but the specific surface area increased initially and then decreased. As can be seen from Figure 8, when the dose of HCl was 0.75%, the specific surface area of the adsorbent increased to 47.72 m2·g−1. Thereafter, as the dose of HCl further increased, the specific surface area began to decrease. The addition of HCl introduced a large amount of H+, reducing the pH, and the wetting angle increased initially and then decreased, and the Zeta potential changed in the positive direction, which was conducive to the adsorption of anions.
3.2.5. Effect of the surfactant on the adsorbent properties
The adsorbent properties after the addition of surfactant SDBS are shown in Figure 9. When the SDBS dose was increased from 0.05% to 0.25%, the adsorption capacity and removal rate of total phosphorus first increased and then decreased. The adsorption performance was reduced as the amount of SDBS was increased due to the formation of wide pores caused by the increased foaming of microbubbles. When the SDBS dose was 0.2%, the adsorption capacity of total phosphorus reached 48.53 mg·g−1, and the removal rate reached 94.93%. SDBS is an anionic surfactant with certain foaming effect. The addition of SDBS led to further increase in the micropores, specific surface area, surface activity, and water absorption and resulted in good hydrophilicity. On the contrary, it caused a decrease in the surface wetting angle. With the addition of SDBS, the pH of the adsorbent fluctuated within a small range; the wetting angle decreased with an increase in the SDBS dose, and the Zeta potential changed in the negative direction with an increase of SDBS dose. Further, the adsorbent became stable .
3.2.6. The influence of adsorbent dose on adsorption
The adsorption time was set at 14 h, and the effect of adsorbent quantity on the adsorption effect was investigated. The results are shown in Figure 10. When the addition amount was 25 g·L−1, the total phosphorus in the solution had been removed, so the amount of adsorbent was determined to be 25 g·L−1.
3.2.7. The influence of adsorption time on adsorption
The fixed adsorbent concentration was 25 g·L−1, and the effect of adsorption time (t) on the adsorption effect was investigated. The results were shown in Figure 11. The adsorbent adsorption tended to be stable when the adsorption period was 14 h, so the adsorption time was determined to be 14 h.
3.3. Preparation and test of the active RM adsorbent with the optimal formula
Table 3 lists the optimization results of the outputs. The formula of RM particle adsorbents is as follows: According to the following mass ratio, the primary material (RM 95% + FA 5.2%), admixture (water–cement ratio 0.33 + cement 8.2% + HPMC 0.25% + sodium silicate 2% + coupling agent 0.01% + H2O2 1.64% + MnO2 0.33% + HCl 0.75% (concentration: 37%) + SDBS 0.21%) and 9% nucleated particle proppant were mixed to prepare 30 kg of RM particle adsorbents, with a pH of 10.16, specific surface area of 48.92 m2·g−1, pore volume of 2.10 cm3·g−1, compressive strength of 1.12 kPa, 24-h pulverization rate of 3.72%, and true density of 1530 kg·m−3. The prepared RM particle adsorbents were used to adsorb the total phosphorus in recycling water continuing flotation tailings. When the initial concentration of total phosphorus was 127.8 mg·L−1, the amount of RM particle adsorbents was 25 g·L−1, and the adsorption time was 14 h, and the adsorption capacity and removal rate of total phosphorus were 48.63 mg·g−1 and 95.13%, respectively. The results are listed in Table 3.
4. Conclusions
(1) A novel approach to optimize the formula of RM adsorbent by establishing a BP neural network model is proposed. From the single-factor test and orthogonal test, learning samples of BP neural network were obtained, thereby reducing the number of experiments and ensuring the representativeness of the learning samples. The application of the BP neural network compensates for the limitation of the orthogonal test, and simulates and predicts the strength and adsorption capacity of RM adsorbent over a wide range to obtain the optimal formula of the adsorbent.
(2) After formula optimization based on the BP neural network, granulation was performed according to the preparation and curing method of RM particle adsorbents, and the adsorbent was prepared with a pH of 10.16, specific surface area of 48.92 m2·g−1, pore volume of 2.10 cm3·g−1, compressive strength of 1.12 kPa, and 24 h immersion pulverization rate of 3.72%. The prepared adsorbent was used to adsorb total phosphorus from phosphorus-containing wastewater. When the initial concentration of total phosphorus was 127.8 mg·L−1, the amount of the adsorbent was 25 g·L−1, and the adsorption time was 14 h. The adsorption capacity and removal rate of total phosphorus were 48.63 mg·g−1 and 95.13%, respectively, indicating a significant phosphorus removal effect.
(3) The verification results prove that the prediction results of the established prediction model are reliable, and it is feasible and effective to predict the strength and adsorption capacity and optimize the formula of RM adsorbent via BP neural network, which provides reference and scientific guidance for the experimental design of RM adsorbent. However, the application of neural network in the optimization of material formula is still in the exploratory stage, and further study and improvement are required.
Author Contributions
Longjiang Li: Supervision, Project administration, Data curation, Writing - review & editing. Tong Zhou: Methodology, Investigation, Data curation, Formal analysis, Writing - original draft. Zhiwen Yang and Hui Liao: Investigation, Data curation, Formal analysis, Writing - review & editing.
Acknowledgments
Thanks to the National Natural Science Foundation of China (51964010) for funding 478,000 yuan, and thanks to the support of the Large Analysis and Testing Instrument Sharing Platform of Guizhou University.
Declaration of Competing Interest
The authors declare that they have no known competing financial interests or personal relationships that could have appeared to influence the work reported in this paper.
Table of Abbreviations
| BP | Back-propagation neural networks |
| FA | Fly ash |
| RM | Red mud |
| SDBS | Sodium dodecylbenzene sulfonate |
| A2C | aluminate cement |
References
- Joseph, C.G., Taufiq-Yap, Y.H., Krishnan, V., Li Puma, G., 2020. Application of modified red mud in environmentally-benign applications: A review paper. Environ. Eng. Res. 25. 795–806. [CrossRef]
- Wang, L., Sun, N., Tang, H., Sun, W., 2019. A review on comprehensive utilization of red mud and prospect analysis. Minerals. 9. [CrossRef]
- Hegedűs, M., Tóth-Bodrogi, E., Jónás, J., Somlai, J., Kovács, T., 2018. Mobility of 232Th and 210Po in red mud. J. Environ. Radioact. 184–185. [CrossRef]
- Papatheodorou, G., Papaefthymiou, H., Maratou, A., Ferentinos, G., 2005. Natural radionuclides in bauxitic tailings (red-mud) in the Gulf of Corinth. Greece, Radioprotection. 40. S549–S555. [CrossRef]
- Rai, S., Bahadure, S., Chaddha, M.J., Agnihotri, A., 2020. Disposal Practices and Utilization of Red Mud (Bauxite Residue): A Review in Indian Context and Abroad. J. Sustain. Metall. 6. 1–8. [CrossRef]
- Qi, X., Wang, H., Zhang, L., Xu, B., Shi, Q., Li, F., 2020. Removal of Cr (Ⅲ) from aqueous solution by using bauxite residue (red mud): Identification of active components and column tests. Chemosphere. 245. 125560. [CrossRef]
- Cusack, P.B., Callery, O., Courtney, R., Ujaczki, É., O’Donoghue, L.M.T., Healy, M.G., 2019. The use of rapid, small-scale column tests to determine the efficiency of bauxite residue as a low-cost adsorbent in the removal of dissolved reactive phosphorus from agricultural waters. J. Environ. Manage. 241. 273–283. [CrossRef]
- Zhu, X., Niu, Z., Li, W., Zhao, H., Tang, Q., 2020. A novel process for recovery of aluminum, iron, vanadium, scandium, titanium and silicon from red mud. J. Environ. Chem. Eng. 8. 103528. [CrossRef]
- Milenković, A.S., Smičiklas, I.D., Šljivić-Ivanović, M.Z., Živković, L.S., Vukelić, N.S., 2016. Effect of experimental variables onto Co2+ and Sr2+ sorption behavior in red mud-water suspensions. J. Environ. Sci. Heal. - Part A Toxic/Hazardous Subst. Environ. Eng. 51. 679–690. [CrossRef]
- Tsamo, C., Djomou Djonga, P.N., Dangwang Dikdim, J.M., Kamga, R., Kinetic and Equilibrium Studies of Cr(VI), Cu(II) and Pb(II) Removal from Aqueous Solution Using Red Mud, a Low-Cost Adsorbent. Arab. J. Sci. Eng. 43. 2353–2368. [CrossRef]
- ]Lin, J.Y., Kim, M., Li, D., Kim, H., pao Huang, C., 2020. The removal of phosphate by thermally treated red mud from water: The effect of surface chemistry on phosphate immobilization. Chemosphere. 247. 125867. [CrossRef]
- López-García, M., Martínez-Cabanas, M., Vilariño, T., Lodeiro, P., Rodríguez-Barro, P., Herrero, R., Barriada, J.L., 2017. New polymeric/inorganic hybrid sorbents based on red mud and nanosized magnetite for large scale applications in As(V) removal. Chem. Eng. J. 311. 117–125. [CrossRef]
- Ribas, M.C., Adebayo, M.A., Prola, L.D.T., Lima, E.C., Cataluña, R., Feris, L.A., Puchana-Rosero, M.J., Machado, F.M., Pavan, F.A., Calvete, T., 2014. Comparison of a homemade cocoa shell activated carbon with commercial activated carbon for the removal of reactive violet 5 dye from aqueous solutions. Chem. Eng. J. 248. 315–326. [CrossRef]
- Wu, W., Chen, Z., Huang, Y., Li, J., Chen, D., Chen, N., Su, M., 2021. Red mud for the efficient adsorption of U(VI) from aqueous solution: Influence of calcination on performance and mechanism. J. Hazard. Mater. 409. 124925. [CrossRef]
- Lyu, F., Niu, S., Wang, L., Liu, R., Sun, W., He, D., 2021. Efficient removal of Pb(II) ions from aqueous solution by modified red mud. J. Hazard. Mater. 406. [CrossRef]
- Pu, X., Luo, A., Su, H., Zhang, K., Tian, C., Chen, B., Chai, P., Xia, X., 2020. Optimization and mechanism of postponing aging of polysaccharides from Chinese herbal medicine formula. Toxicol. Res. (Camb). 9. 239–248. [CrossRef]
- Madani-Tonekaboni, M., Kamankesh, M., Mohammadi, A., 2015. Determination of furfural and hydroxymethyl furfural from baby formula using dispersive liquid-liquid microextraction coupled with high performance liquid chromatography and method optimization by response surface methodology. J. Food Compos. Anal. 40. 1–7. [CrossRef]
- He, Y., Meng, Z., Xu, H., Zou, Y., 2020. A dynamic model of evaluating differential automatic method for solving plane problems based on BP neural network algorithm. Phys. A Stat. Mech. Its Appl. 556. 124845. [CrossRef]
- Li, Y., Huang, H., Xu, Z., Ma, H., Guo, Y., 2020. Mechanism study on manganese(II) removal from acid mine wastewater using red mud and its application to a lab-scale column. J. Clean. Prod. 253. 119955. [CrossRef]
- Deihimi, N., Irannajad, M., Rezai, B., 2018. Prediction of removal percentage and adsorption capacity of activated red mud for removal of cyanide by artificial neural network. Geosystem Eng. 21, 273–281. [CrossRef]
- Genç-Fuhrman, H., Tjell, J.C., McConchie, D., 2004. Adsorption of Arsenic from Water Using Activated Neutralized Red Mud. Environ. Sci. Technol. 38. 2428–2434. [CrossRef]
- Ye, J., Zhang, P., Hoffmann, E., Zeng, G., Tang, Y., Dresely, J., Liu, Y.,2014. Comparison of response surface methodology and artificial neural network in optimization and prediction of acid activation of bauxsol for phosphorus adsorption. Water. Air. Soil Pollut. 225. [CrossRef]
- Wang, C., Xu, G., Gu, X., Gao, Y., Zhao, P., 2021. High value-added applications of coal fly ash in the form of porous materials: A review. Ceram. Int. [CrossRef]
- Wang, P., Yan, Y., Cao, J., Feng, J., Qi, J., 2021. Surface activation towards manganese dioxide nanosheet arrays via plasma engineering as cathode and anode for efficient water splitting. J. Colloid Interface Sci. 586. 95–102. [CrossRef]
- Li, T., Wang, Z., Zhou, T., He, Y., Huang, F., 2019. Preparation and properties of magnesium phosphate cement foam concrete with H2O2 as foaming agent. Constr. Build. Mater. 205. 566–573. [CrossRef]
- Bacioiu, I.G., Stoica, L., Constantin, C., Stanescu, A.M., 2017. Removal of Tartrazine from Aqueous Solution by Adsorption on Activated Red Mud. Water. Air. Soil Pollut. 228. [CrossRef]
- Wołowicz, A., Staszak, K., Hubicki, Z., 2019. Static sorption of heavy metal ions on ion exchanger in the presence of sodium dodecylbenzenesulfonate. Adsorption. 25. 393–404. [CrossRef]
- Jiang, G.P., Tao, D.L., 2020. Improved green strength of ceramic bodies through extrusion using hydroxypropyl methylcellulose as binder. Int. J. Appl. Ceram. Technol. 17. 1249–1254. [CrossRef]
- Ba, M., Gao, Q., Ma, Y., Zhu, J., Du, Y., 2021. Improved hydration and properties of magnesium oxysulfate (MOS) cement using sodium silicate as an additive. Constr. Build. Mater. 267. [CrossRef]
- Ye, J., Cong, X., Zhang, P., Hoffmann, E., Zeng, G., Wu, Y., Zhang, H., Fan, W., 2015. Phosphate Adsorption onto Granular-Acid-Activated-Neutralized Red Mud: Parameter Optimization, Kinetics, Isotherms, and Mechanism Analysis. Water. Air. Soil Pollut. 226. [CrossRef]
- Kaewmee, P., Song, M., Iwanami, M., Tsutsumi, H., Takahashi, F., 2020. Porous and reusable potassium-activated geopolymer adsorbent with high compressive strength fabricated from coal fly ash wastes. J. Clean. Prod. 272. 122617. [CrossRef]
- Wu, S., Xie, F., Chen, S., Fu, B., 2020. The removal of Pb (II) and Cd (II) with hydrous manganese dioxide: mechanism on zeta potential and adsorption behavior. Environ. Technol. (United Kingdom). 41. 3219–3232. [CrossRef]
- Zhao, Y., Liu, F., Qin, X., 2017. Adsorption of diclofenac onto goethite: Adsorption kinetics and effects of pH. Chemosphere. 180. 373–378. [CrossRef]
- Liu, Y., Liu, S., 2017. Wettability Modification of Lignite by Adsorption of Dodecyl Based Surfactants for Inhibition of Moisture Re-adsorption. J. Surfactants Deterg. 20. 707–716. [CrossRef]
- Sanchez, C., Jeremias, F., Ernst, S.J., Henninger, S.K., 2017. Synthesis, functionalization and evaluation of ethylene-bridged PMOs as adsorbents for sorption dehumidification and cooling systems. Microporous Mesoporous Mater. 244. 151–157. [CrossRef]
- Zhang, L., Dan, H., Bukasa, O.T., Song, L., Liu, Y., Wang, L., Li, J., 2020. Low-Cost Efficient Magnetic Adsorbent for Phosphorus Removal from Water. ACS Omega. 5. 25326–25333. [CrossRef]
- Jin, J., Li, M., Jin, L., 2015. Data Normalization to Accelerate Training for Linear Neural Net to Predict Tropical Cyclone Tracks. Math. Probl. Eng. 21.18-29. [CrossRef]
- Chingono, K.E., Sanganyado, E., Bere, E., Yalala, B., 2018. Adsorption of sugarcane vinasse effluent on bagasse fly ash: A parametric and kinetic study. J. Environ. Manage. 224. 182–190. [CrossRef]
- Boczkaj, G., Gągol, M., Klein, M., Przyjazny, A., 2017. Effective method of treatment of effluents from production of bitumens under basic pH conditions using hydrodynamic cavitation aided by external oxidants. Ultrason. Sonochem. 40. 969–979. [CrossRef]
- Gu, G., Xu, F., Ruan, S., Huang, X., Zhu, J., Peng, C., 2020. Influence of precast foam on the pore structure and properties of fly ash-based geopolymer foams. Constr. Build. Mater. 256. 119410. [CrossRef]
- Cusack, P.B., Healy, M.G., Ryan, P.C., Burke, I.T., O’ Donoghue, L.M.T., Ujaczki, É., Courtney, R., 2018. Enhancement of bauxite residue as a low-cost adsorbent for phosphorus in aqueous solution, using seawater and gypsum treatments. J. Clean. Prod. 179. 217–224. [CrossRef]
- Zhao, Y.H., Li, Q.F., Wang, J.W., Kang, M.Q. Wang, X.K., 2014. Preparation and properties of carbon fiber/polyether polyurethane composites. Xinxing Tan Cailiao/New Carbon Mater. 29 .454–460. [CrossRef]
Figure 1.
Back-propagation (BP) network optimization model for the formula optimization of the RM particle adsorbents.
Figure 1.
Back-propagation (BP) network optimization model for the formula optimization of the RM particle adsorbents.
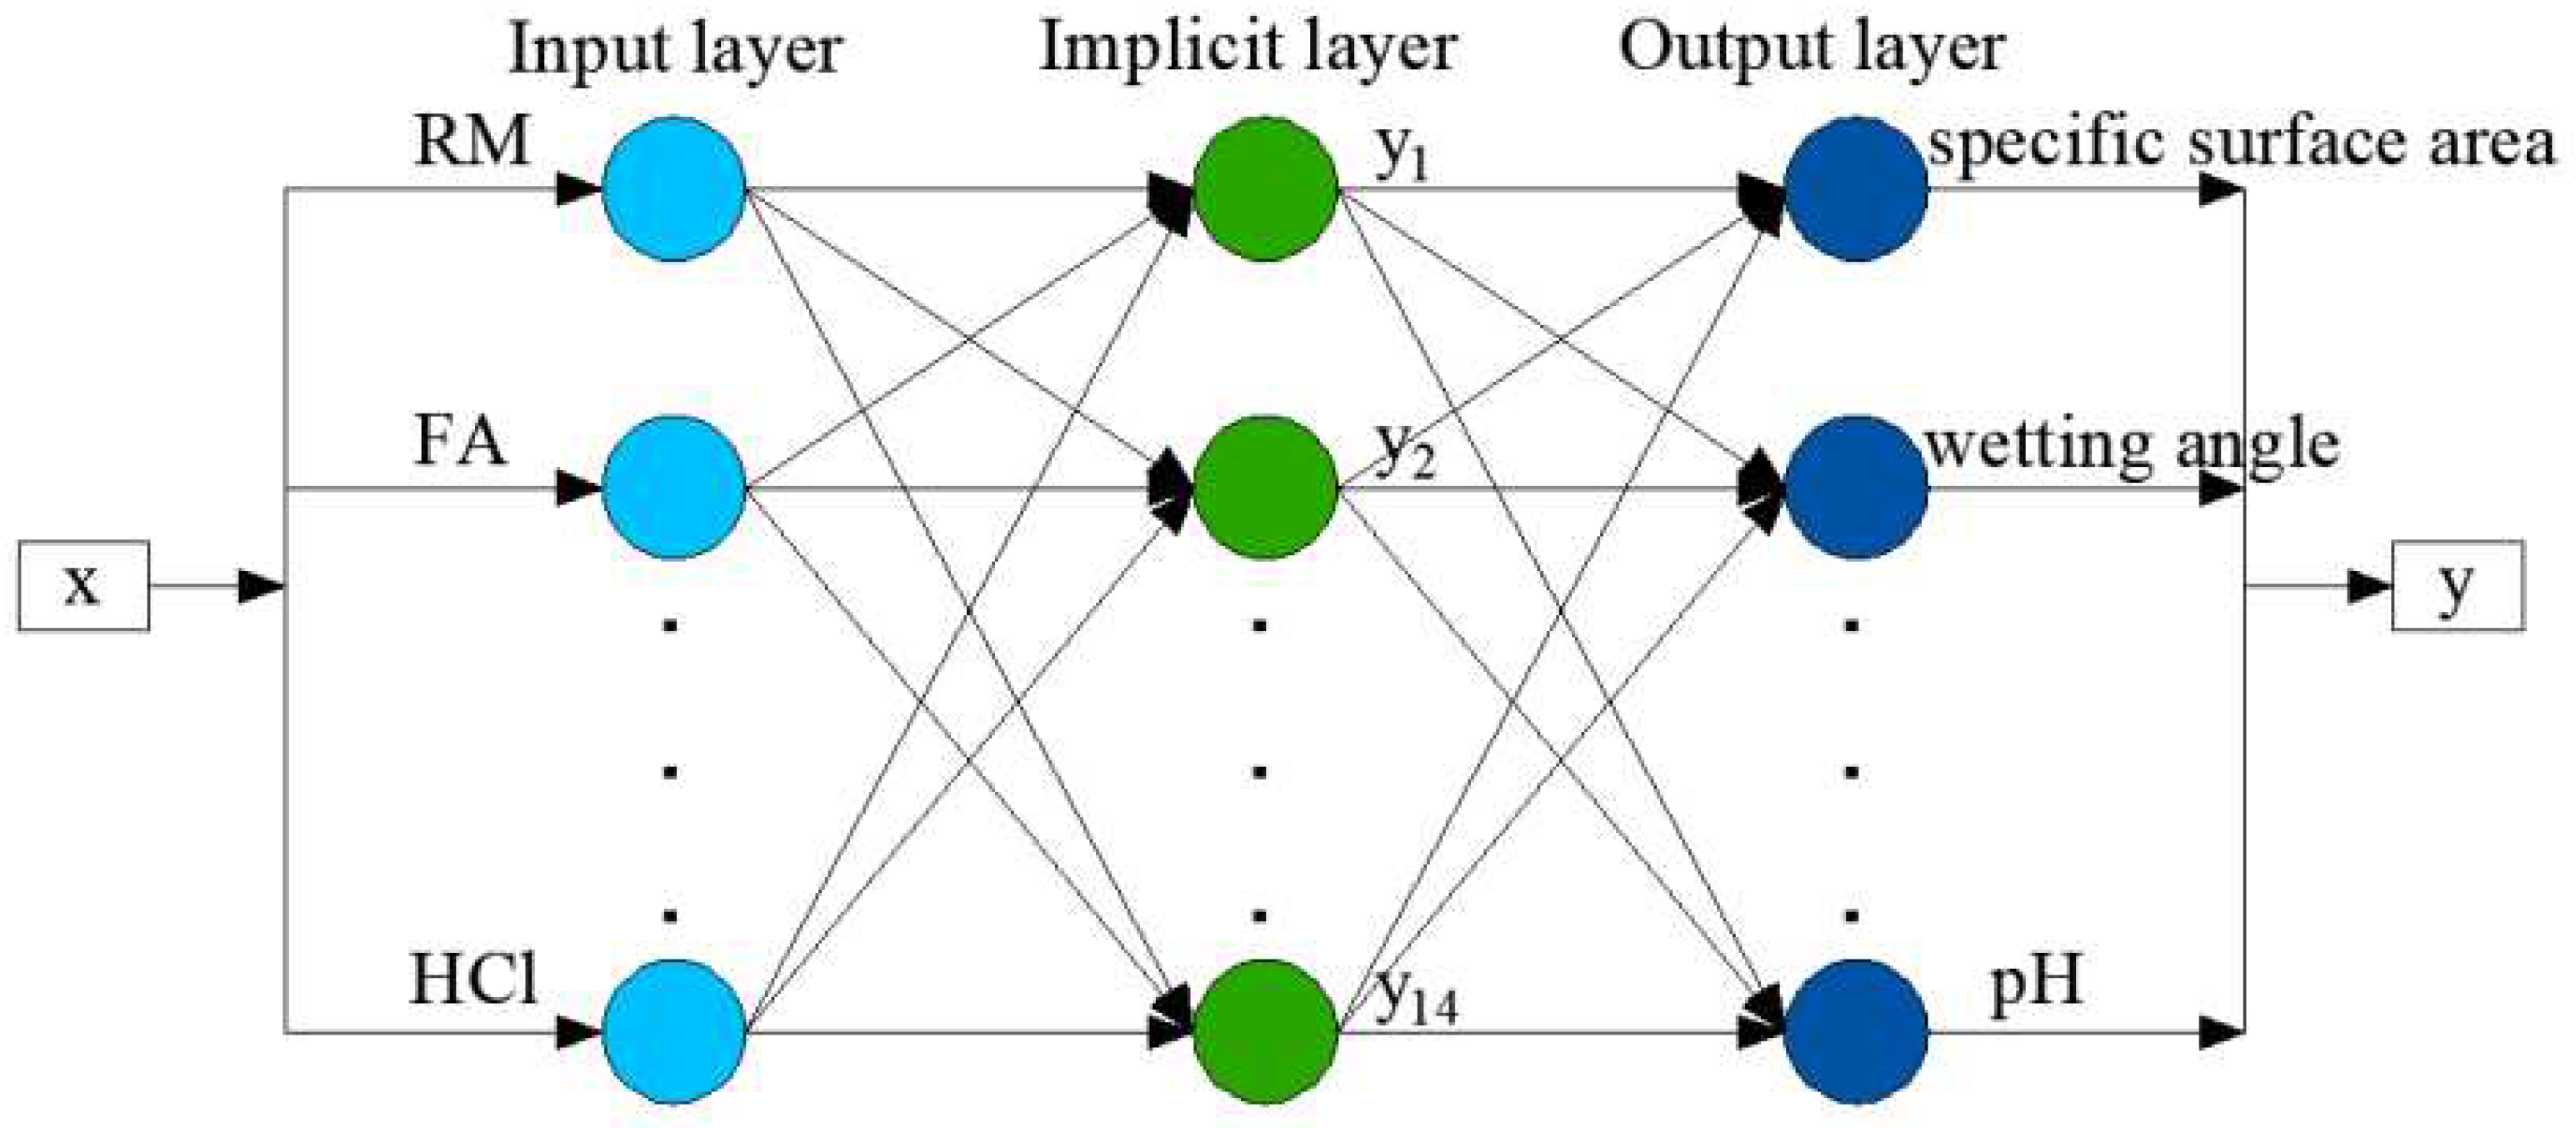
Figure 2.
Sample training error curve.
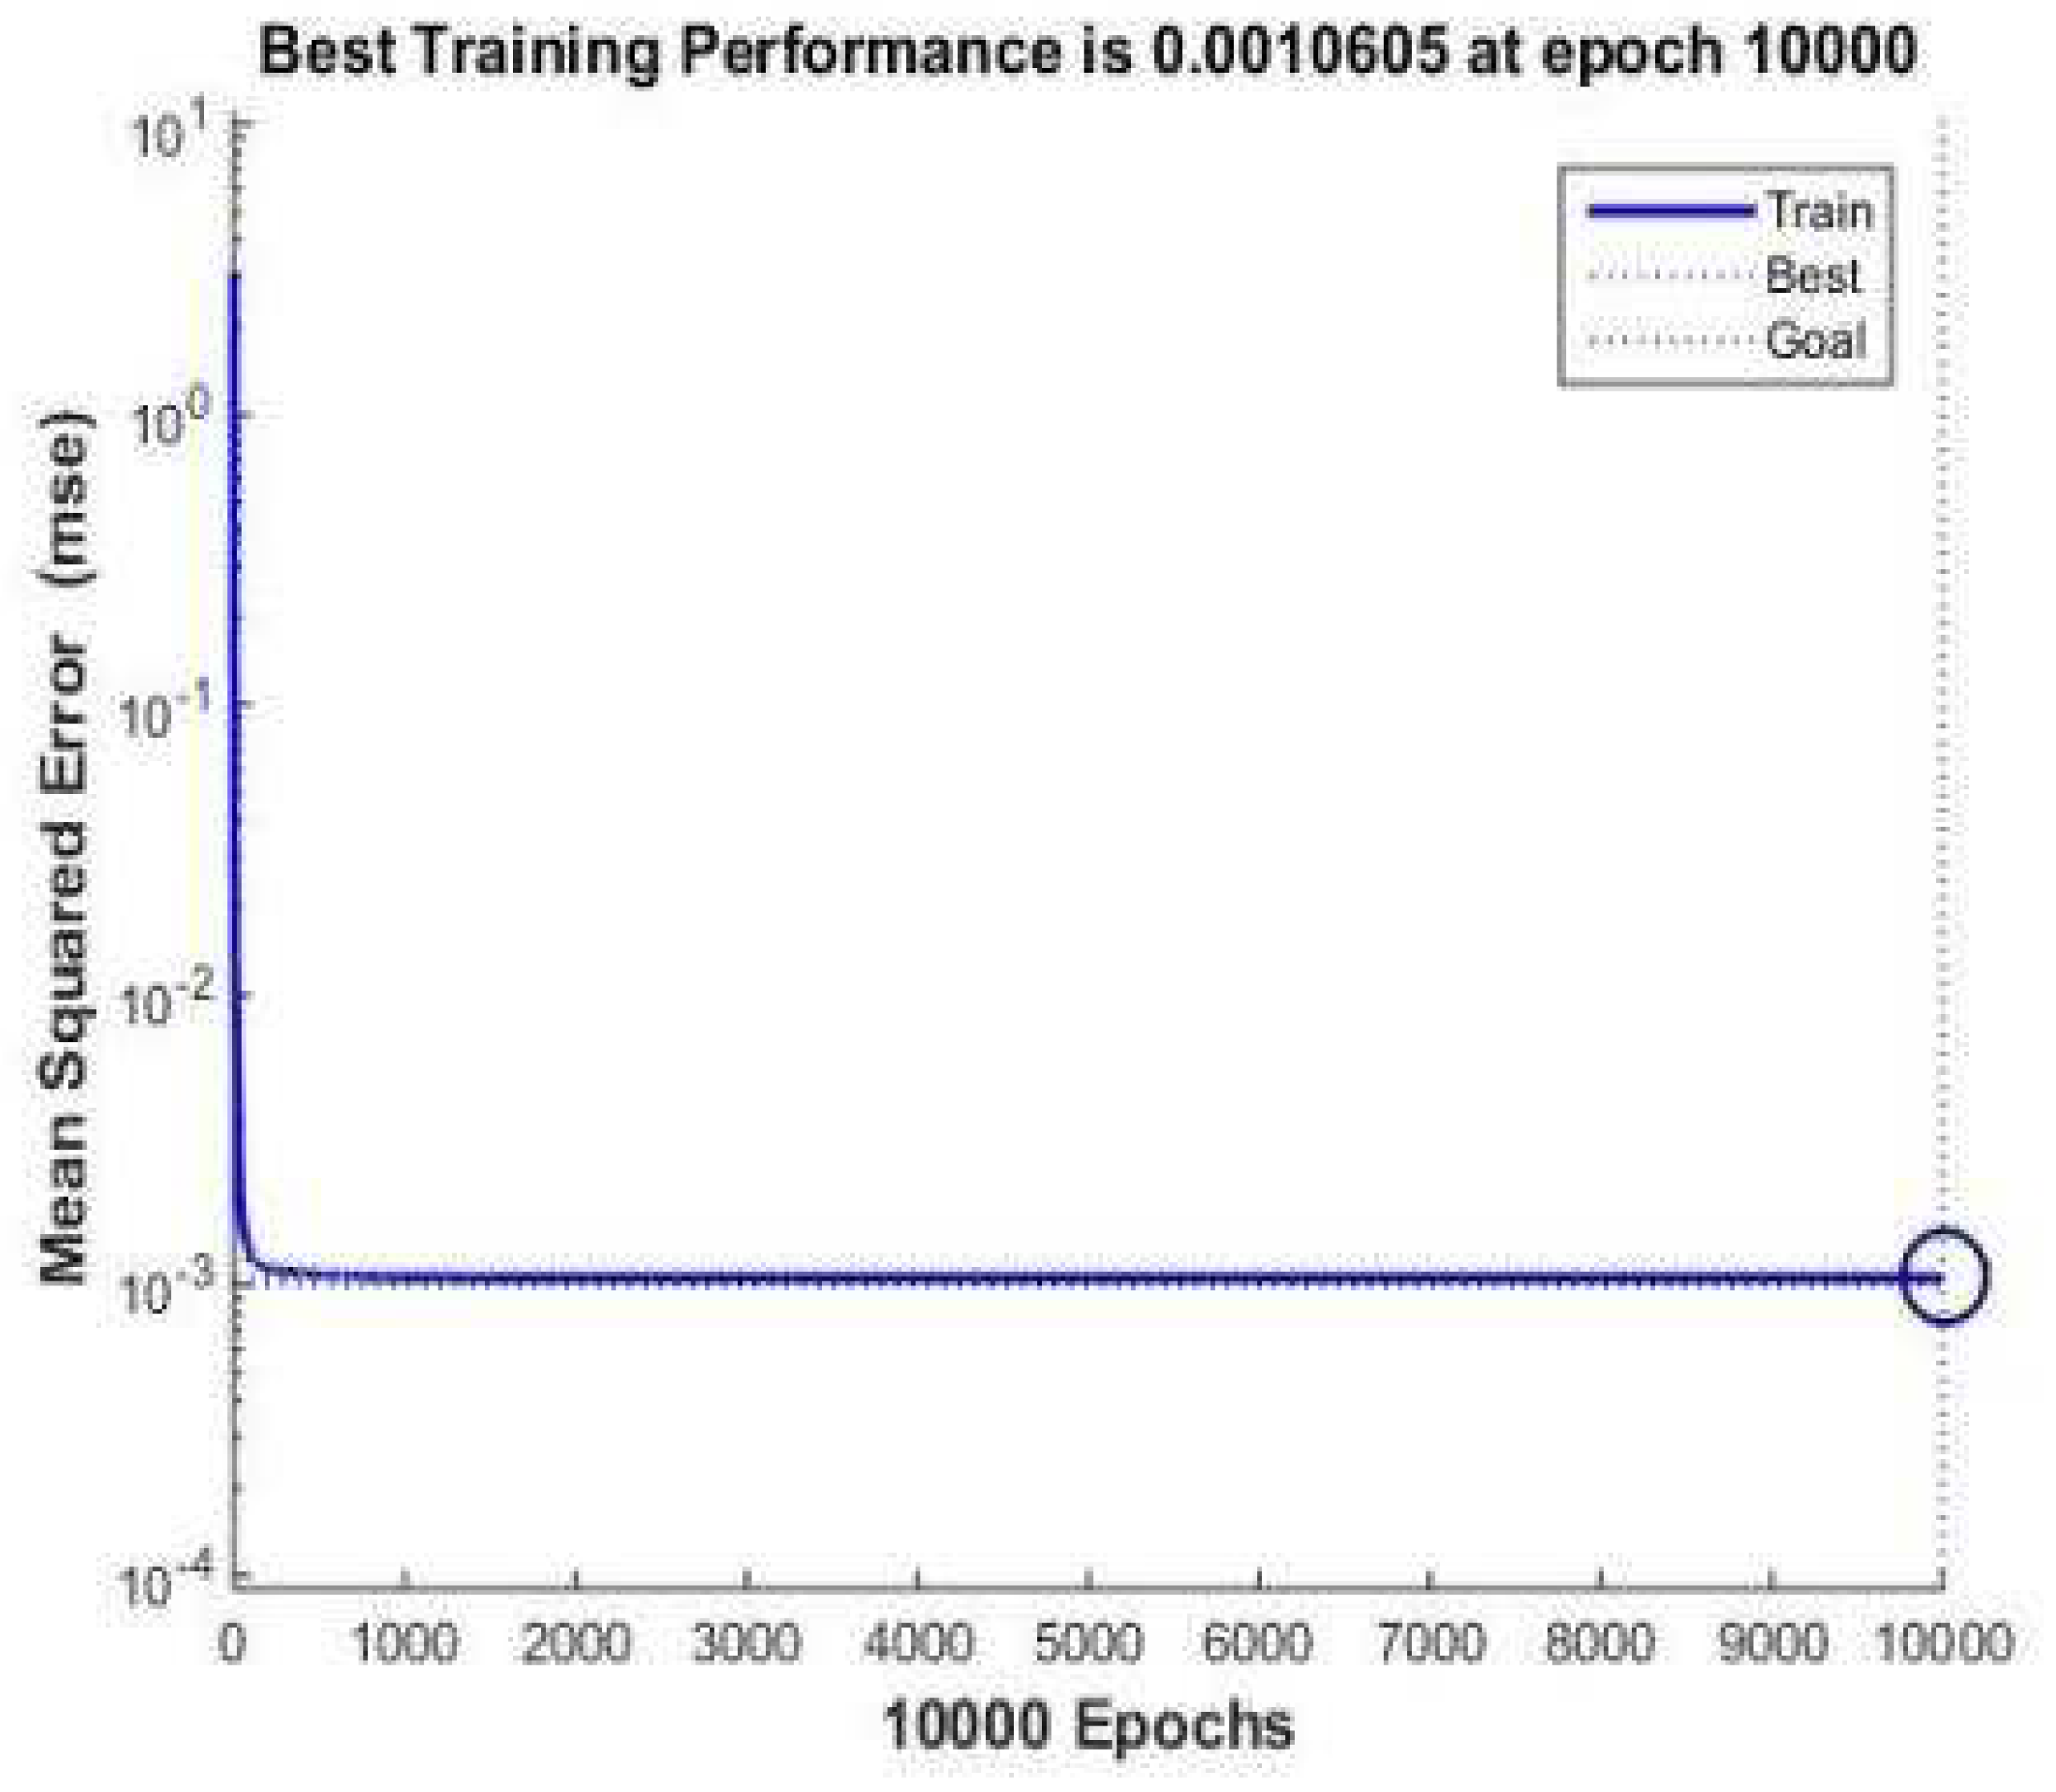
Figure 3.
Comparison of learning and testing of the output parameters.
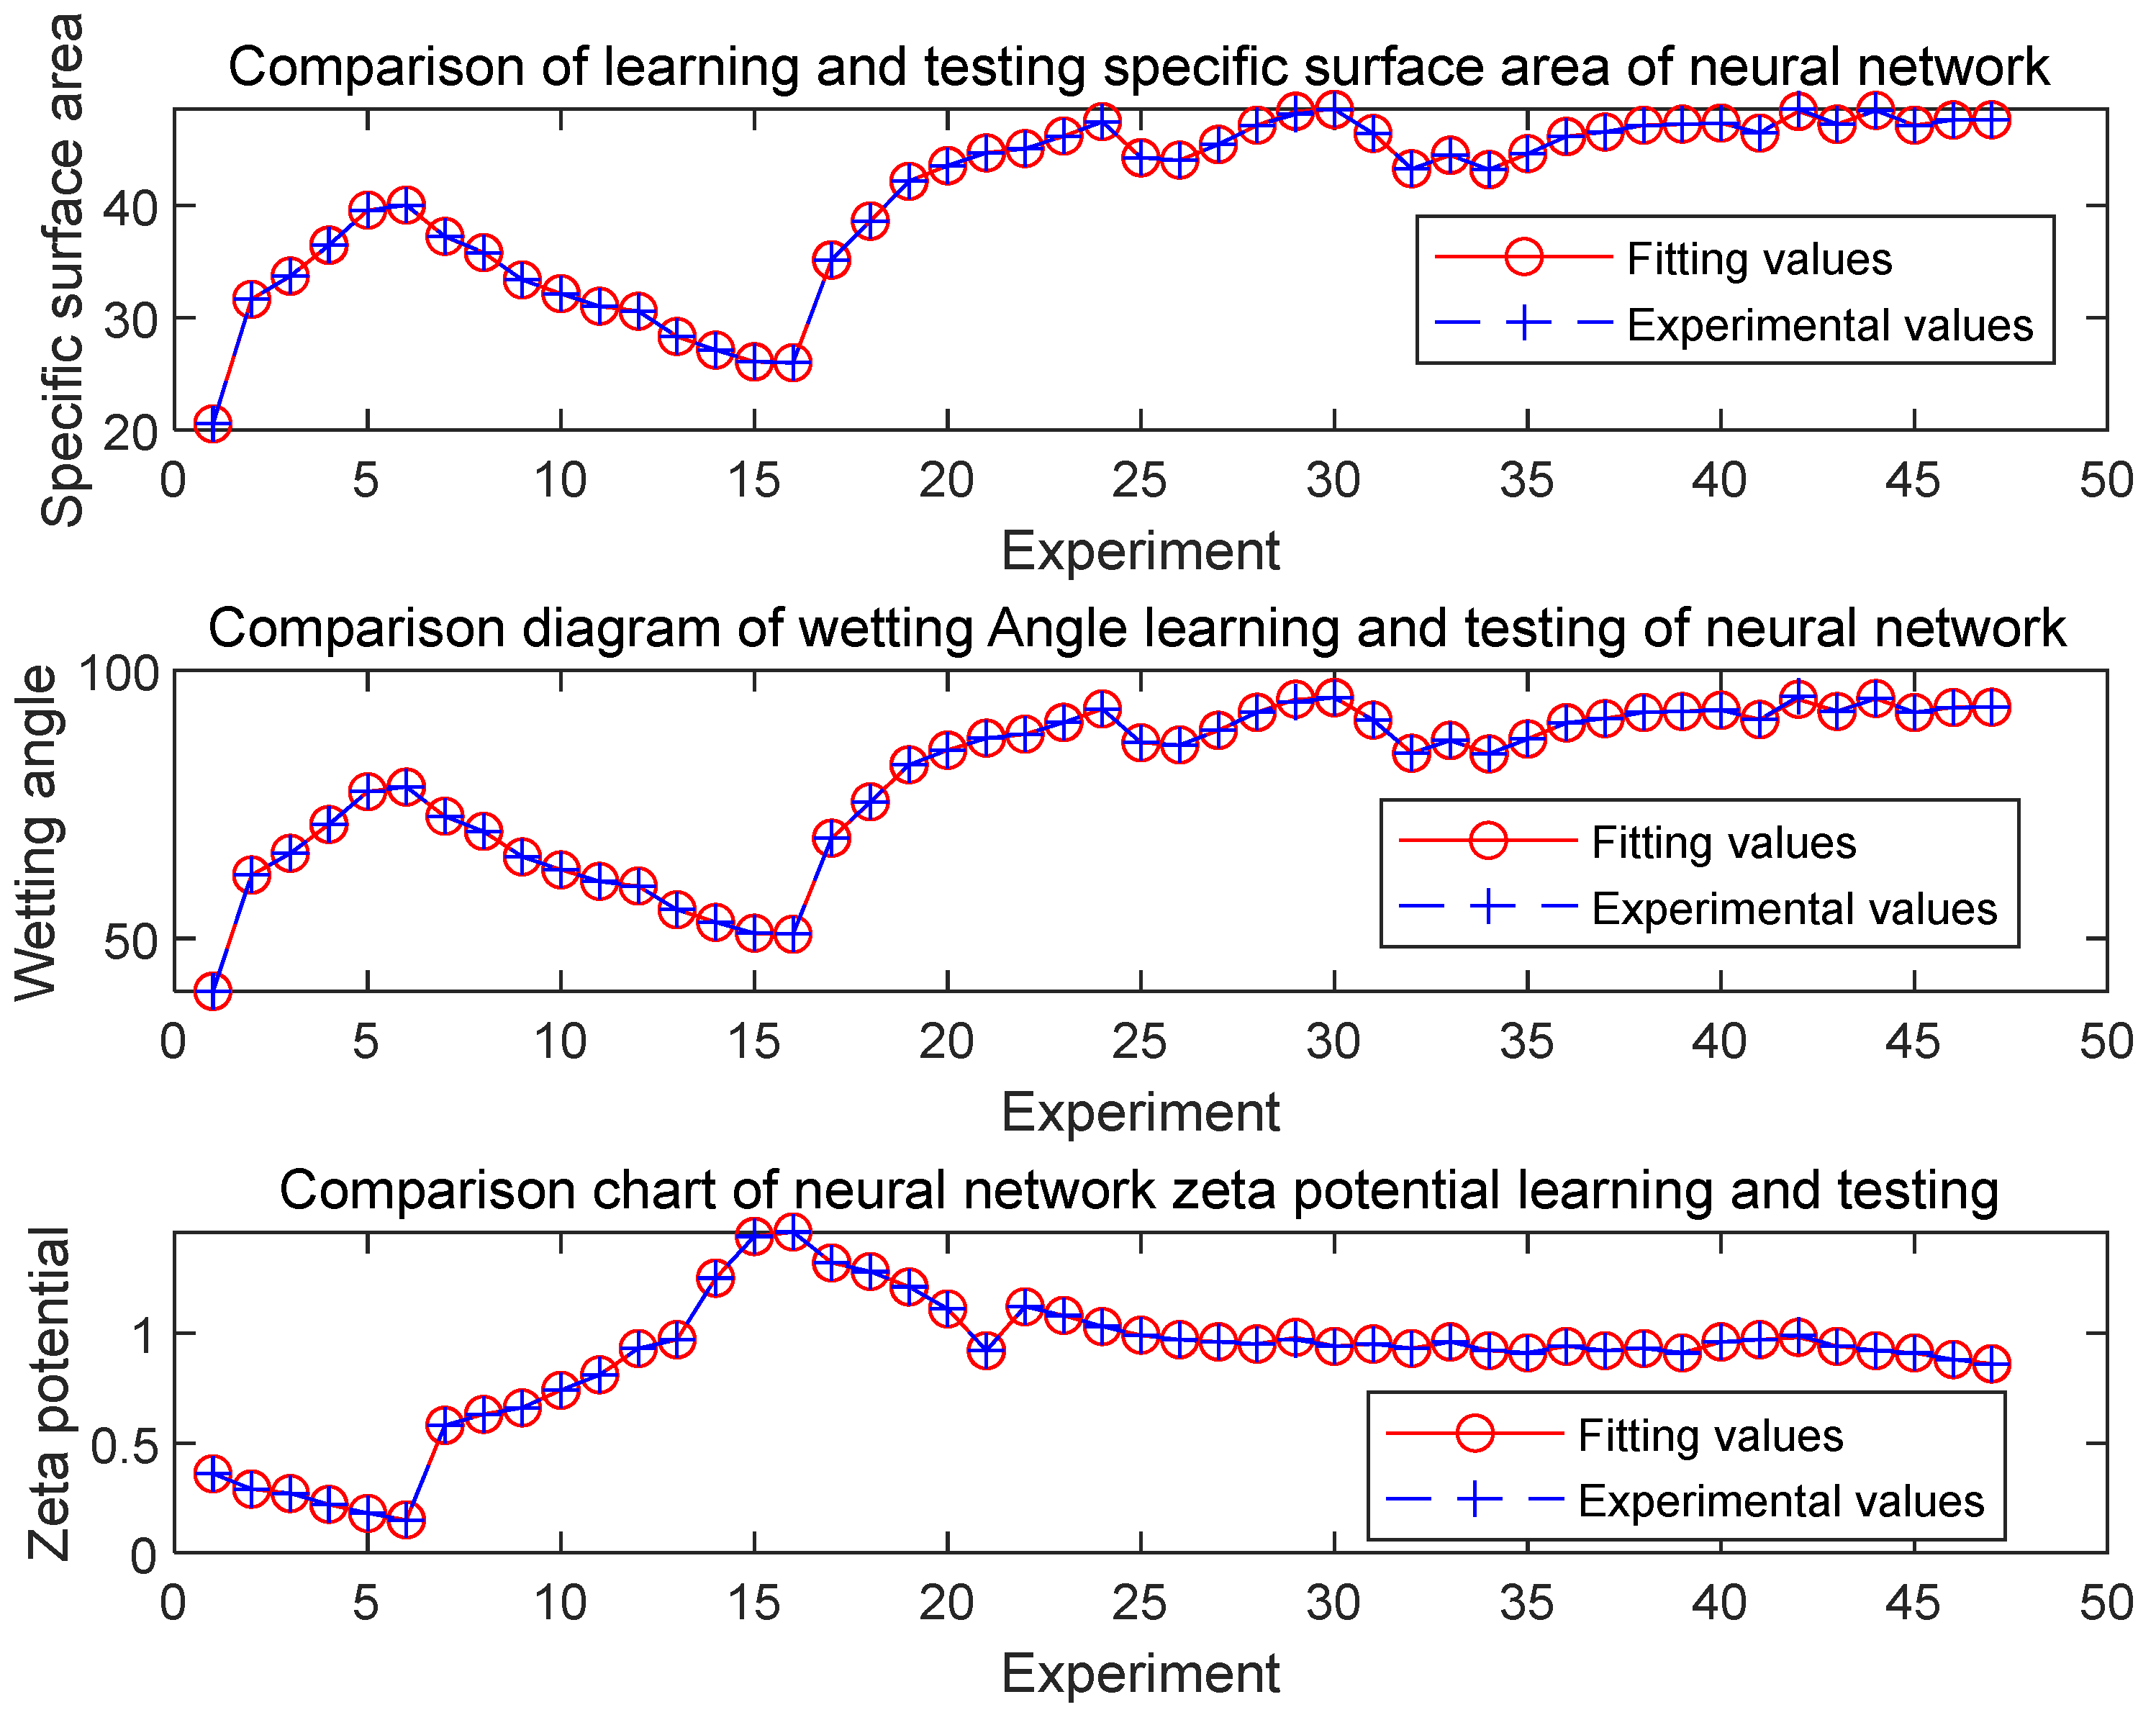
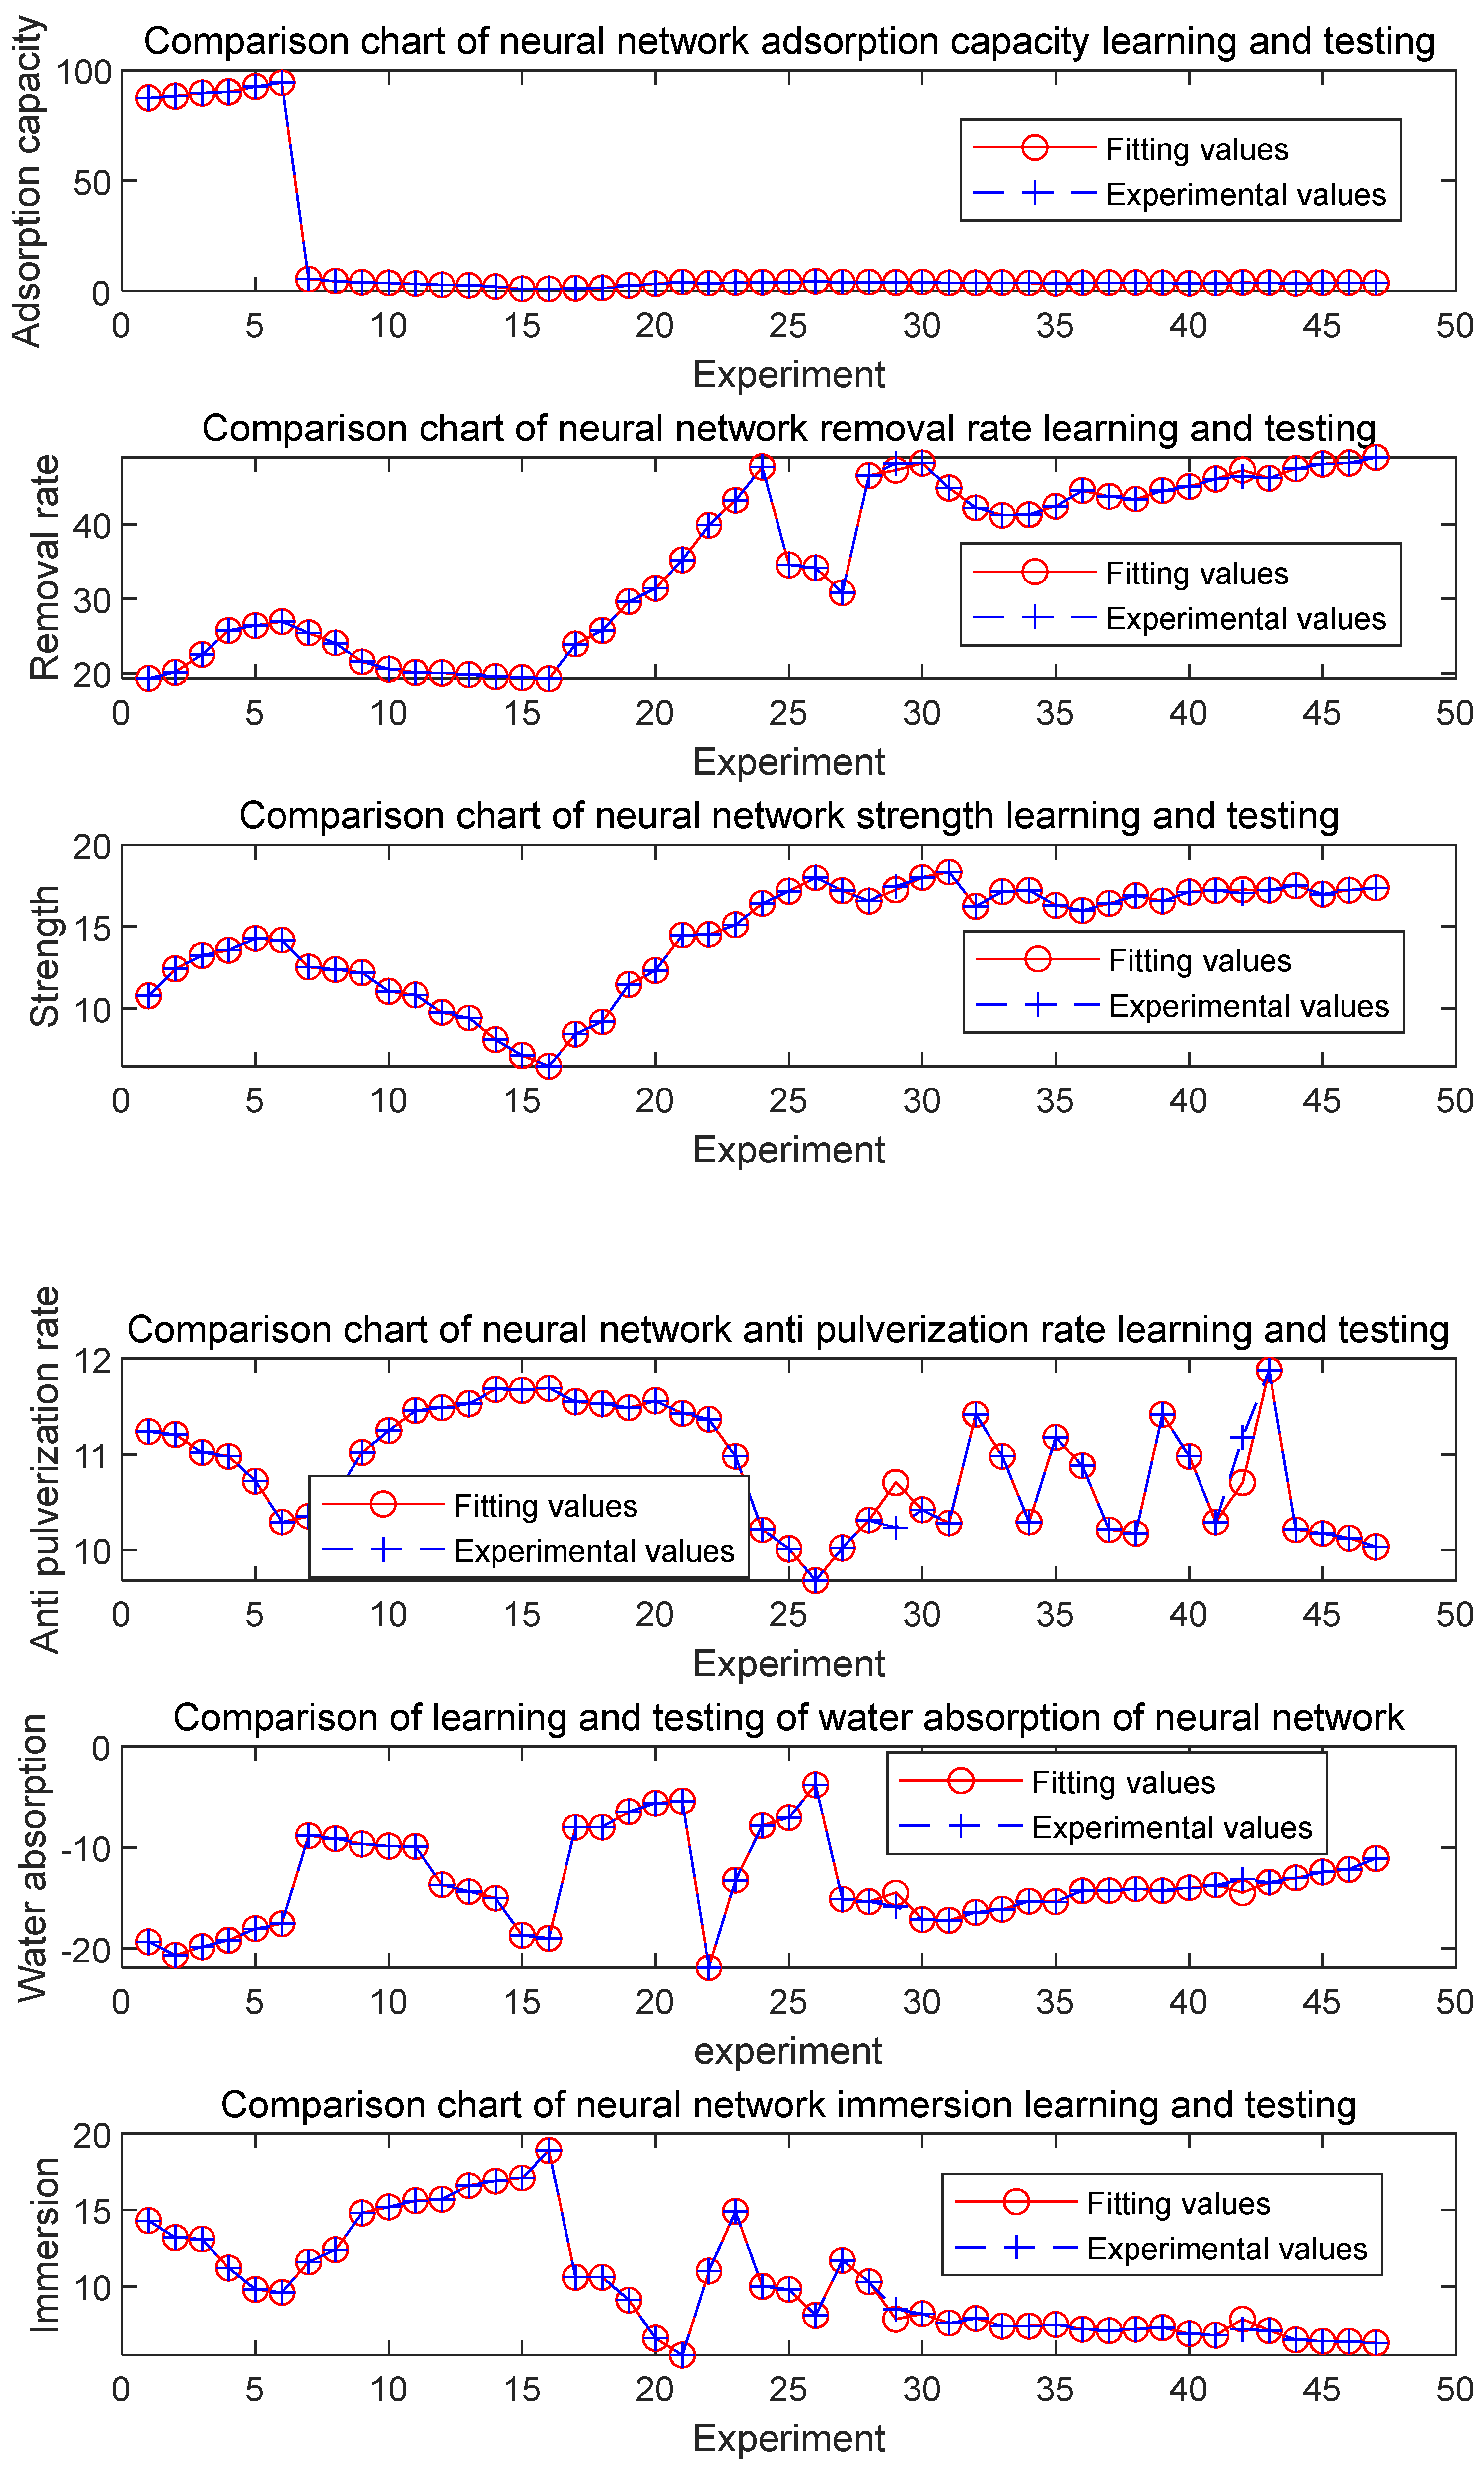
Figure 4.
Influence of FA on various adsorbent properties.
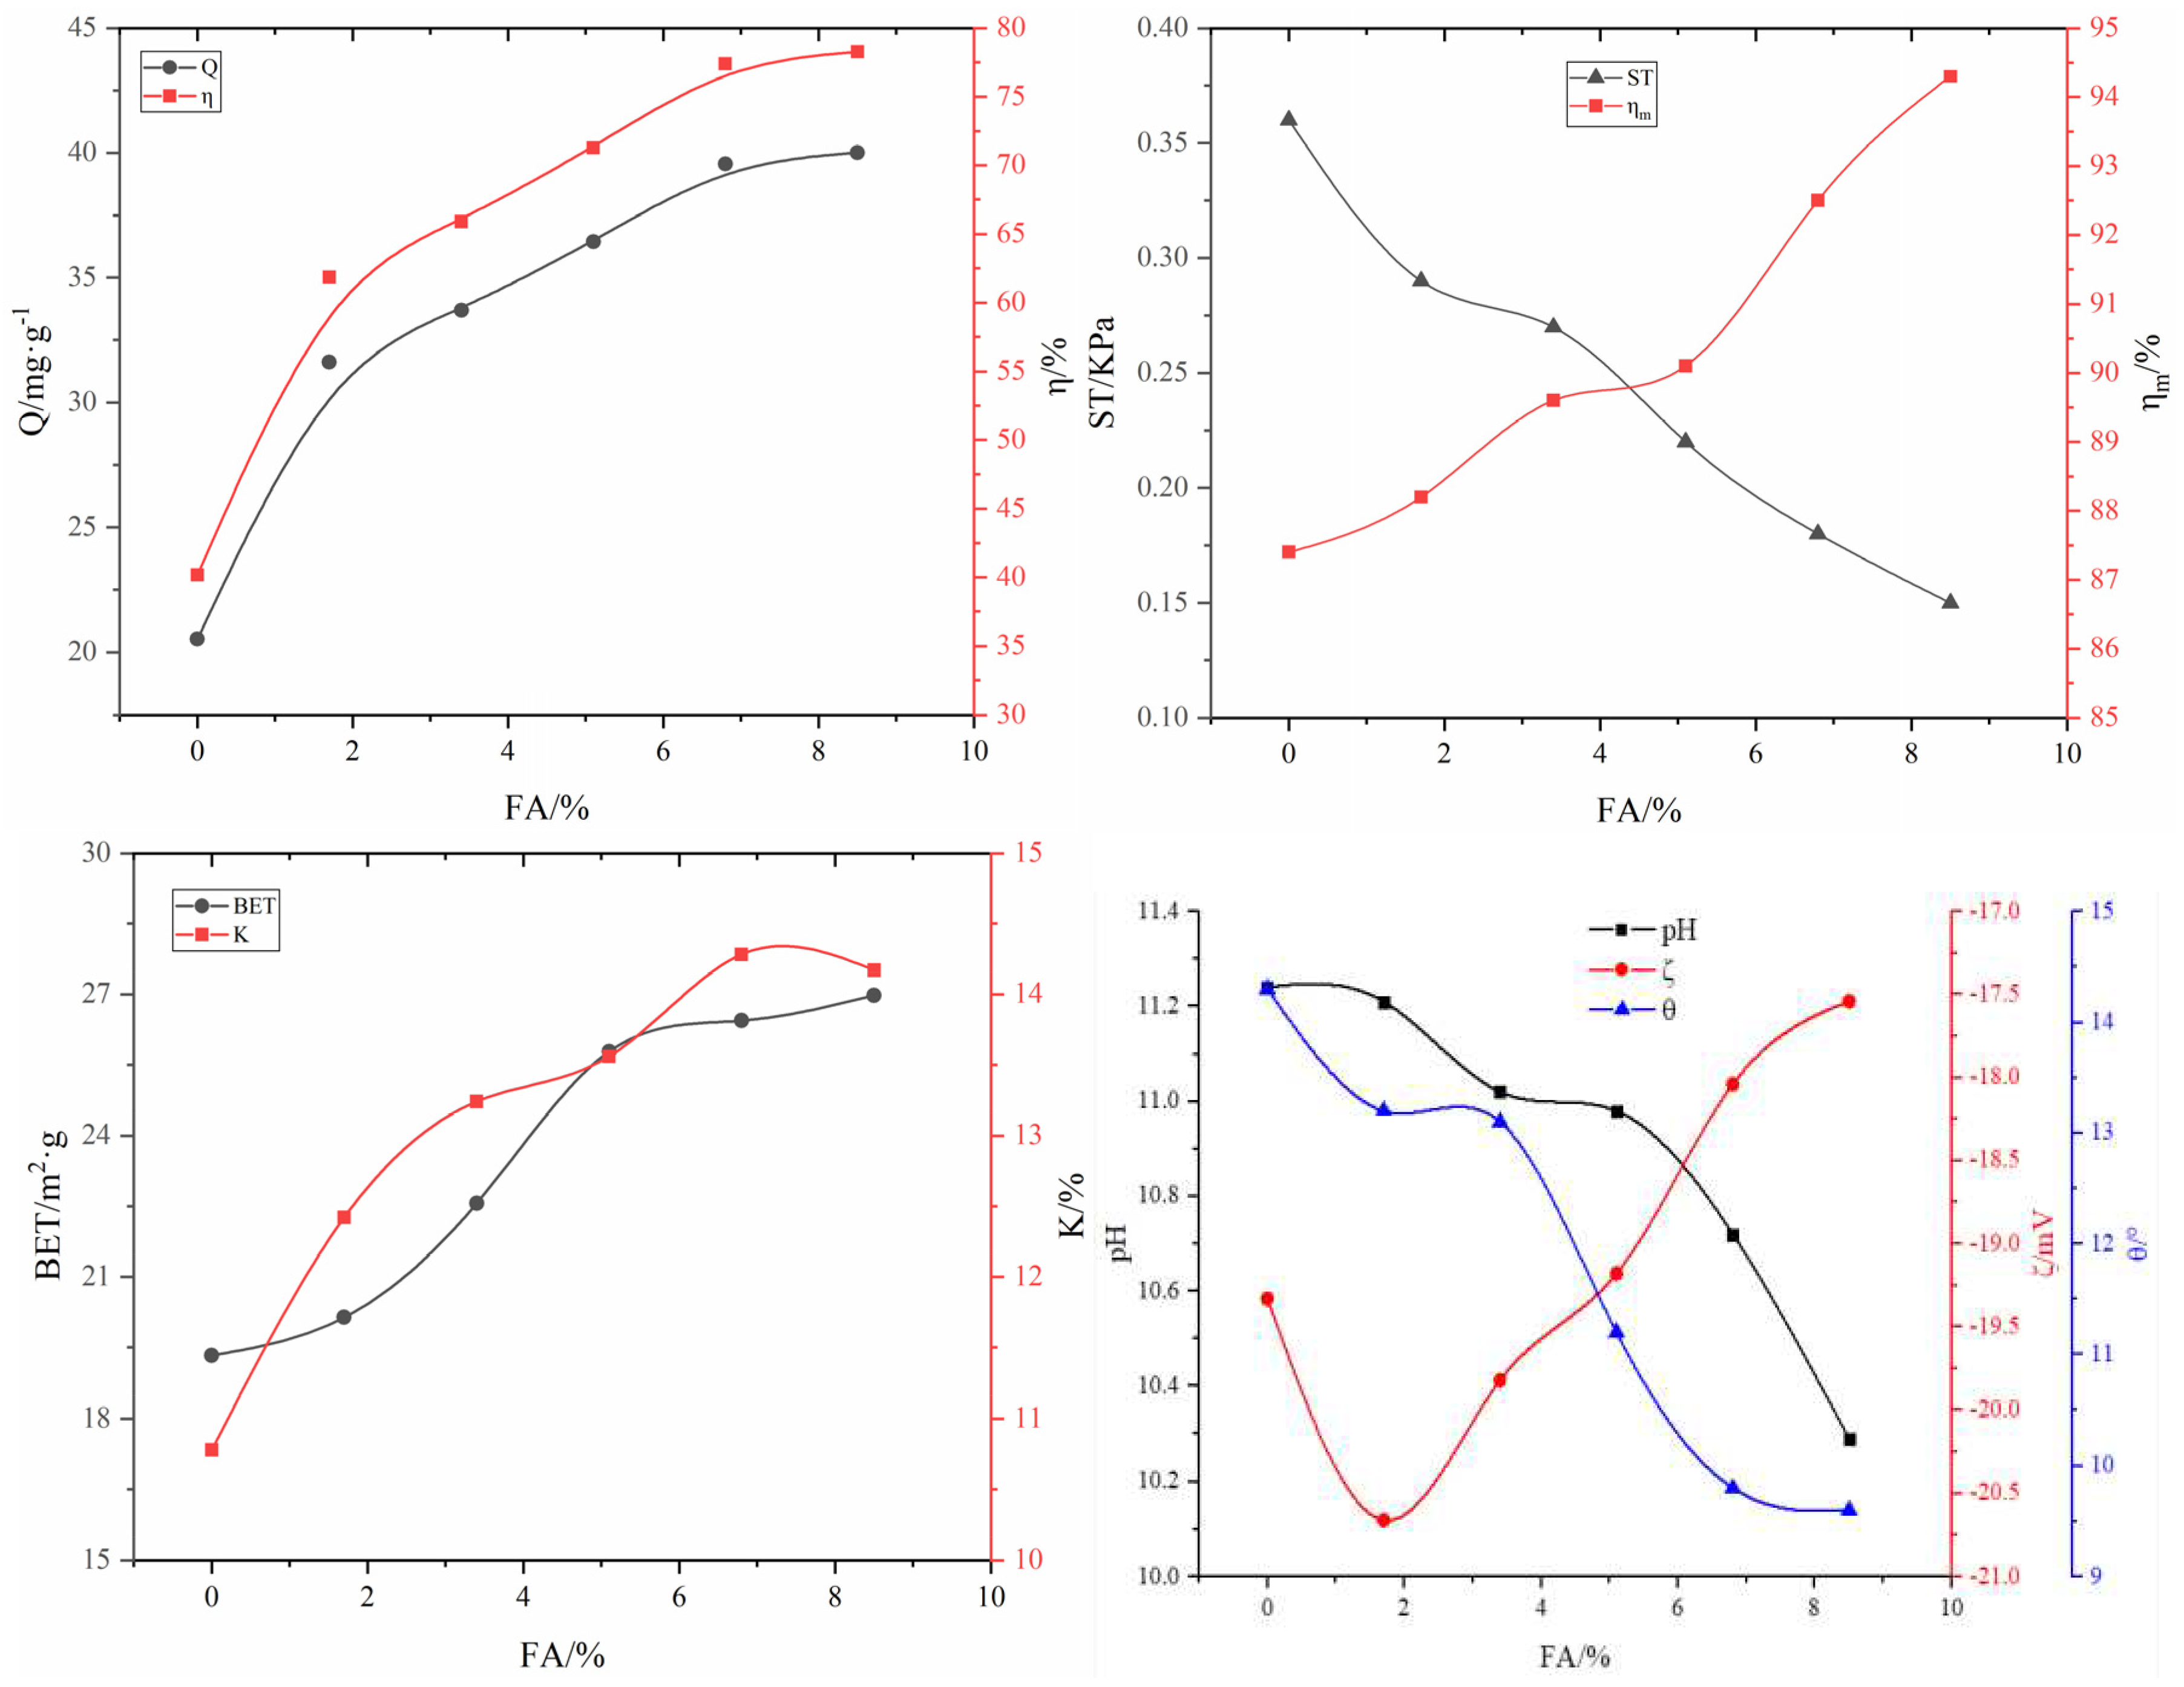
Figure 5.
Influence of A2C on various adsorbent properties.
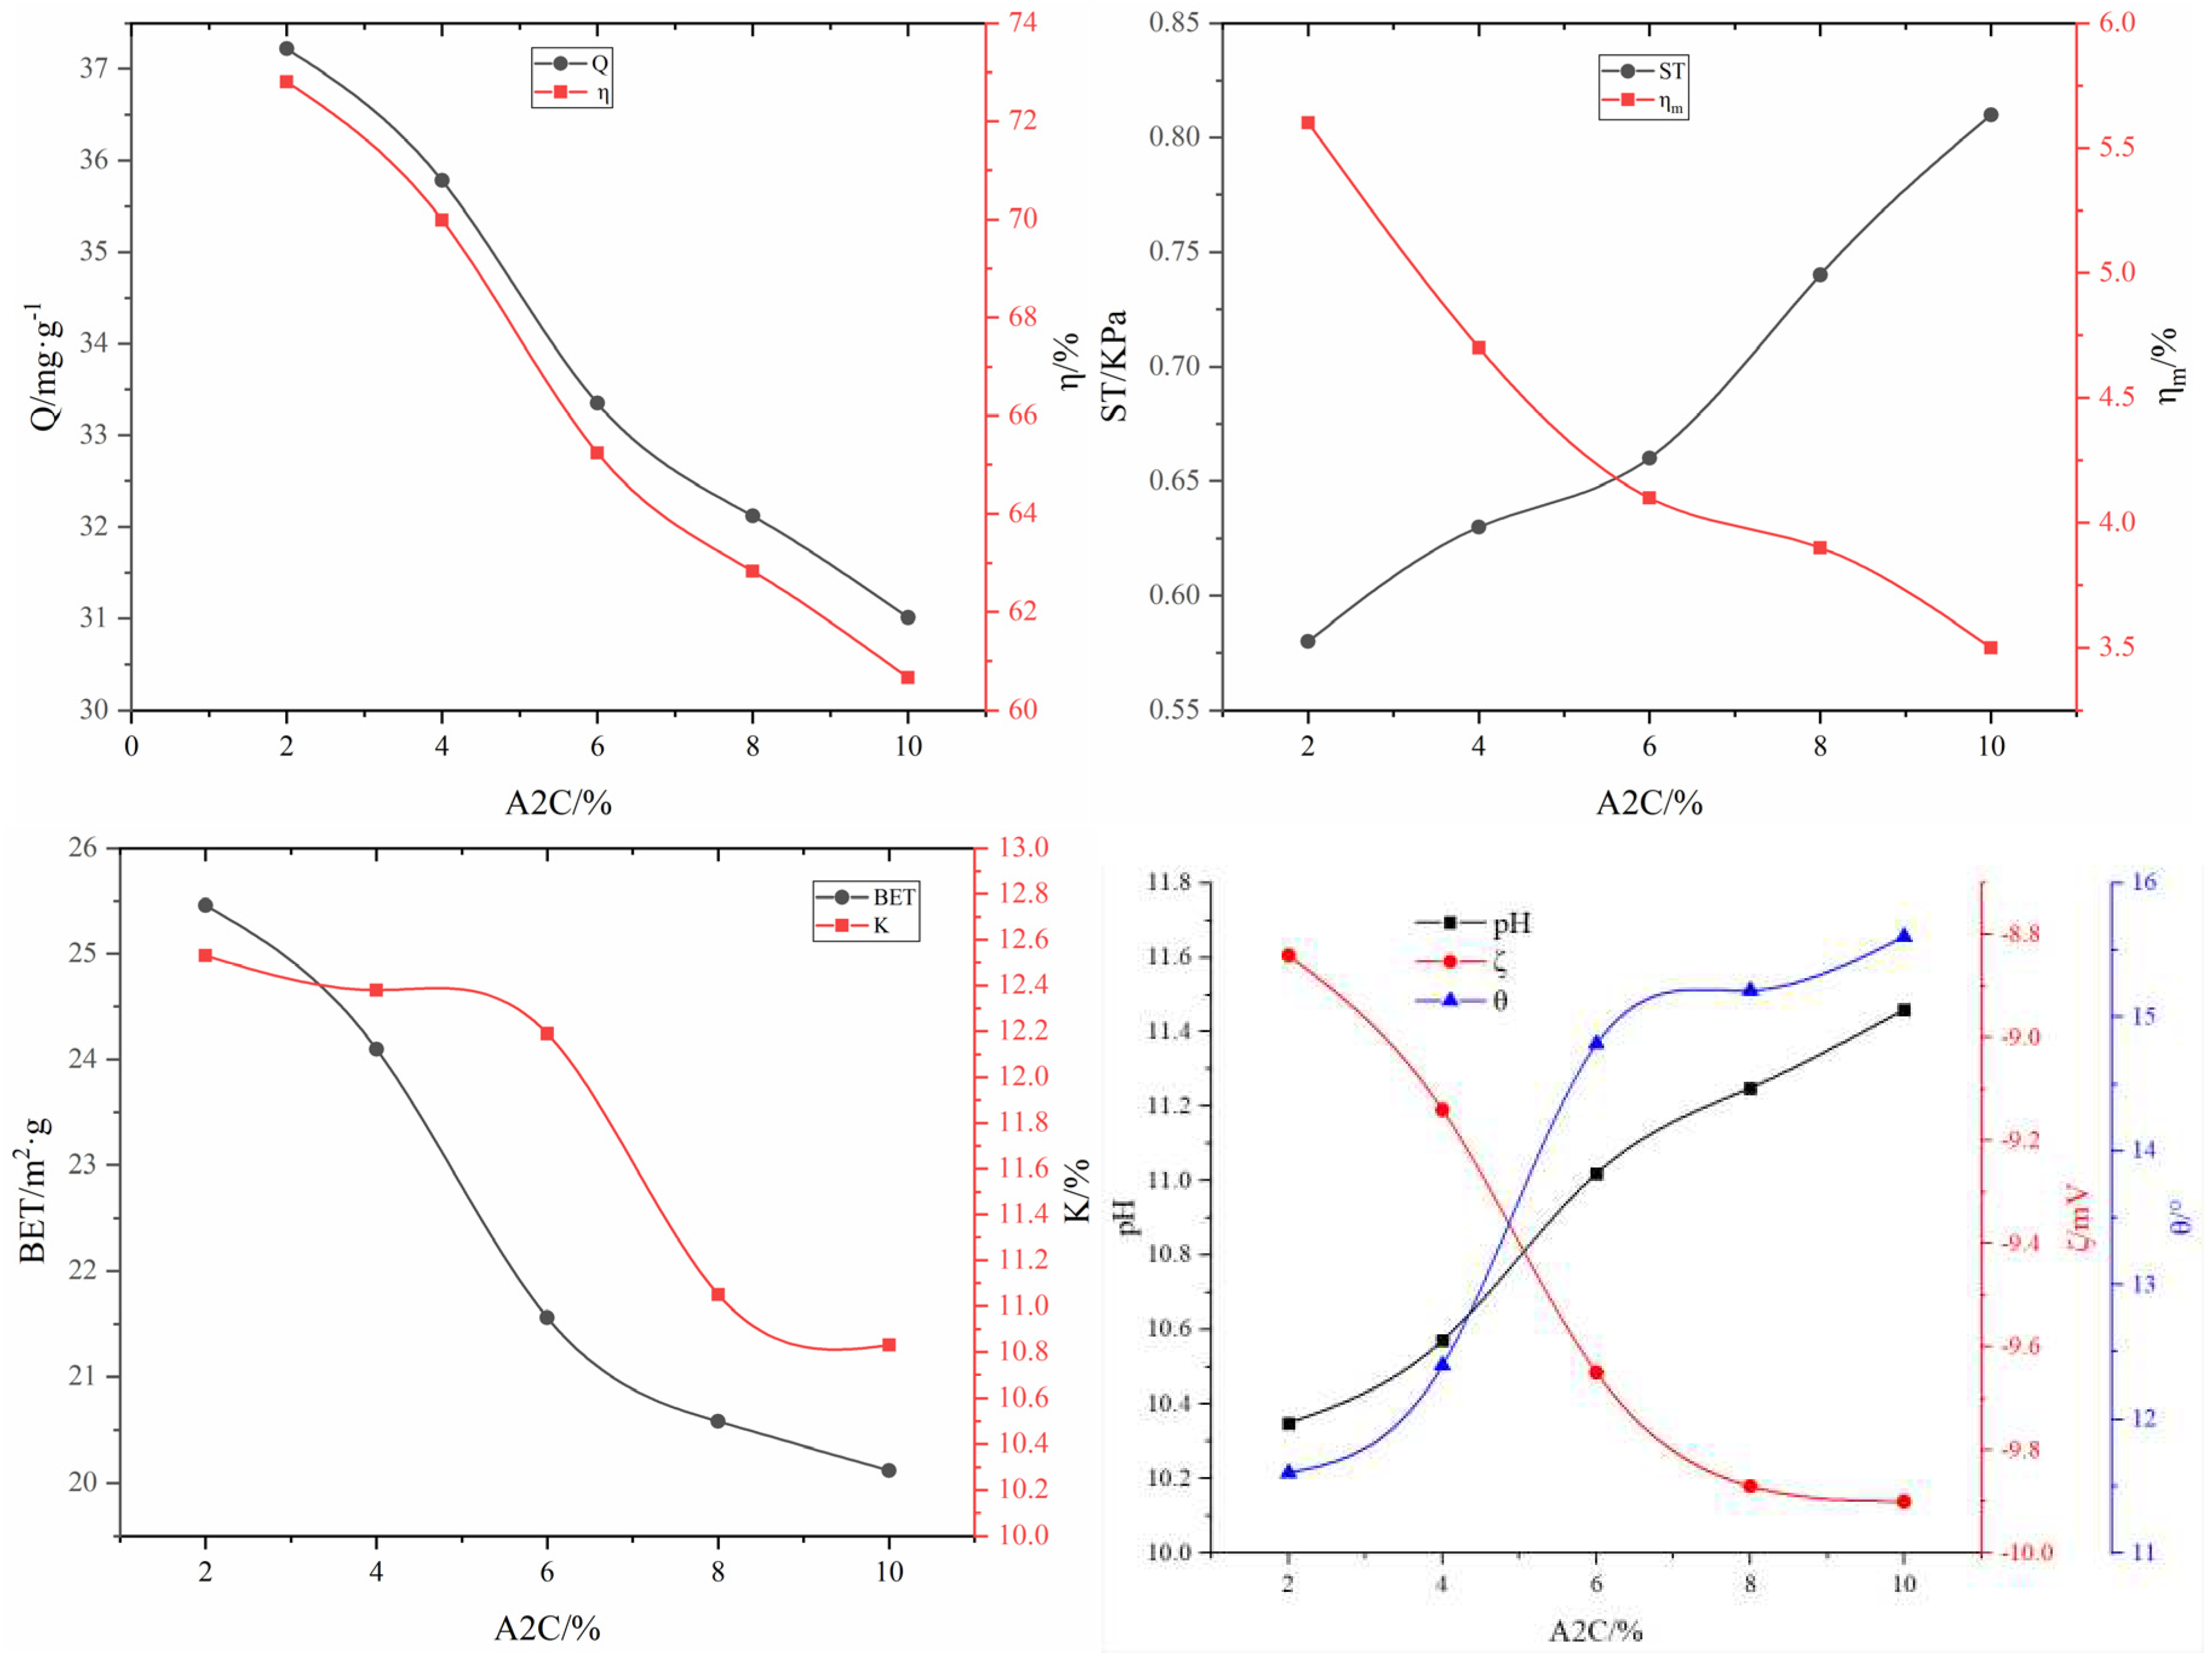
Figure 6.
Influence of HPMC on various adsorbent properties.
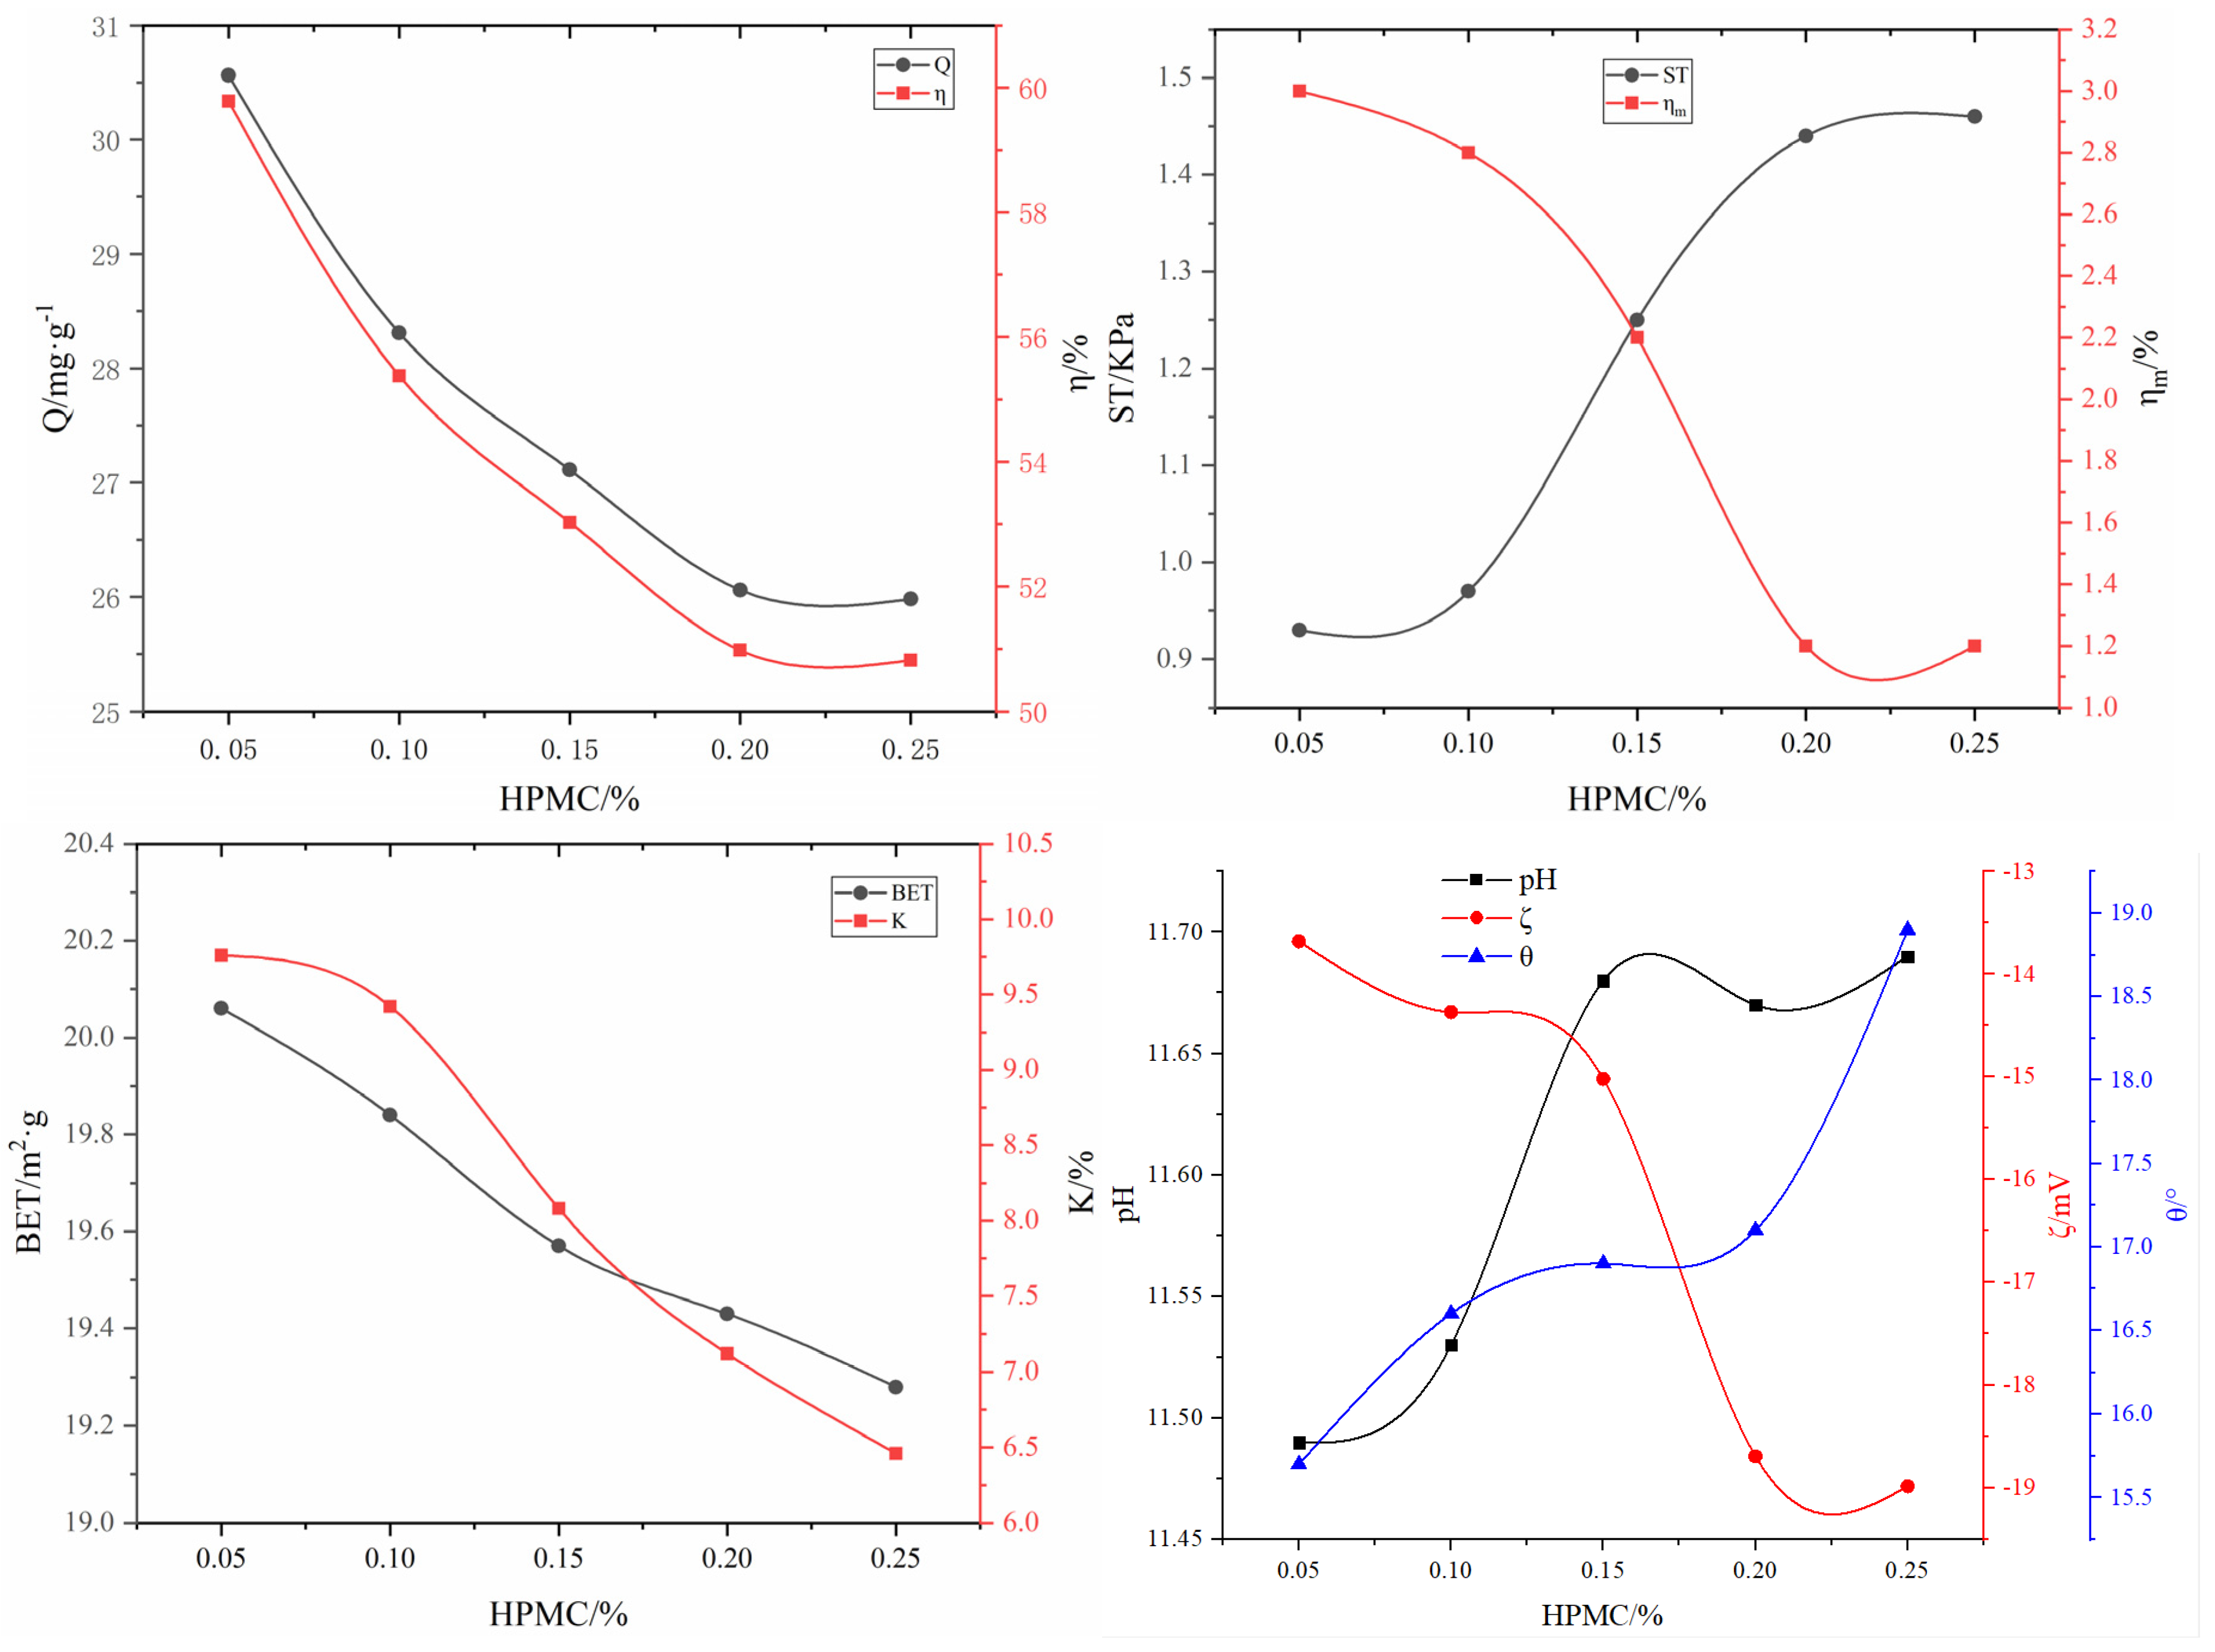
Figure 7.
Influence of H2O2 on various adsorbent properties.
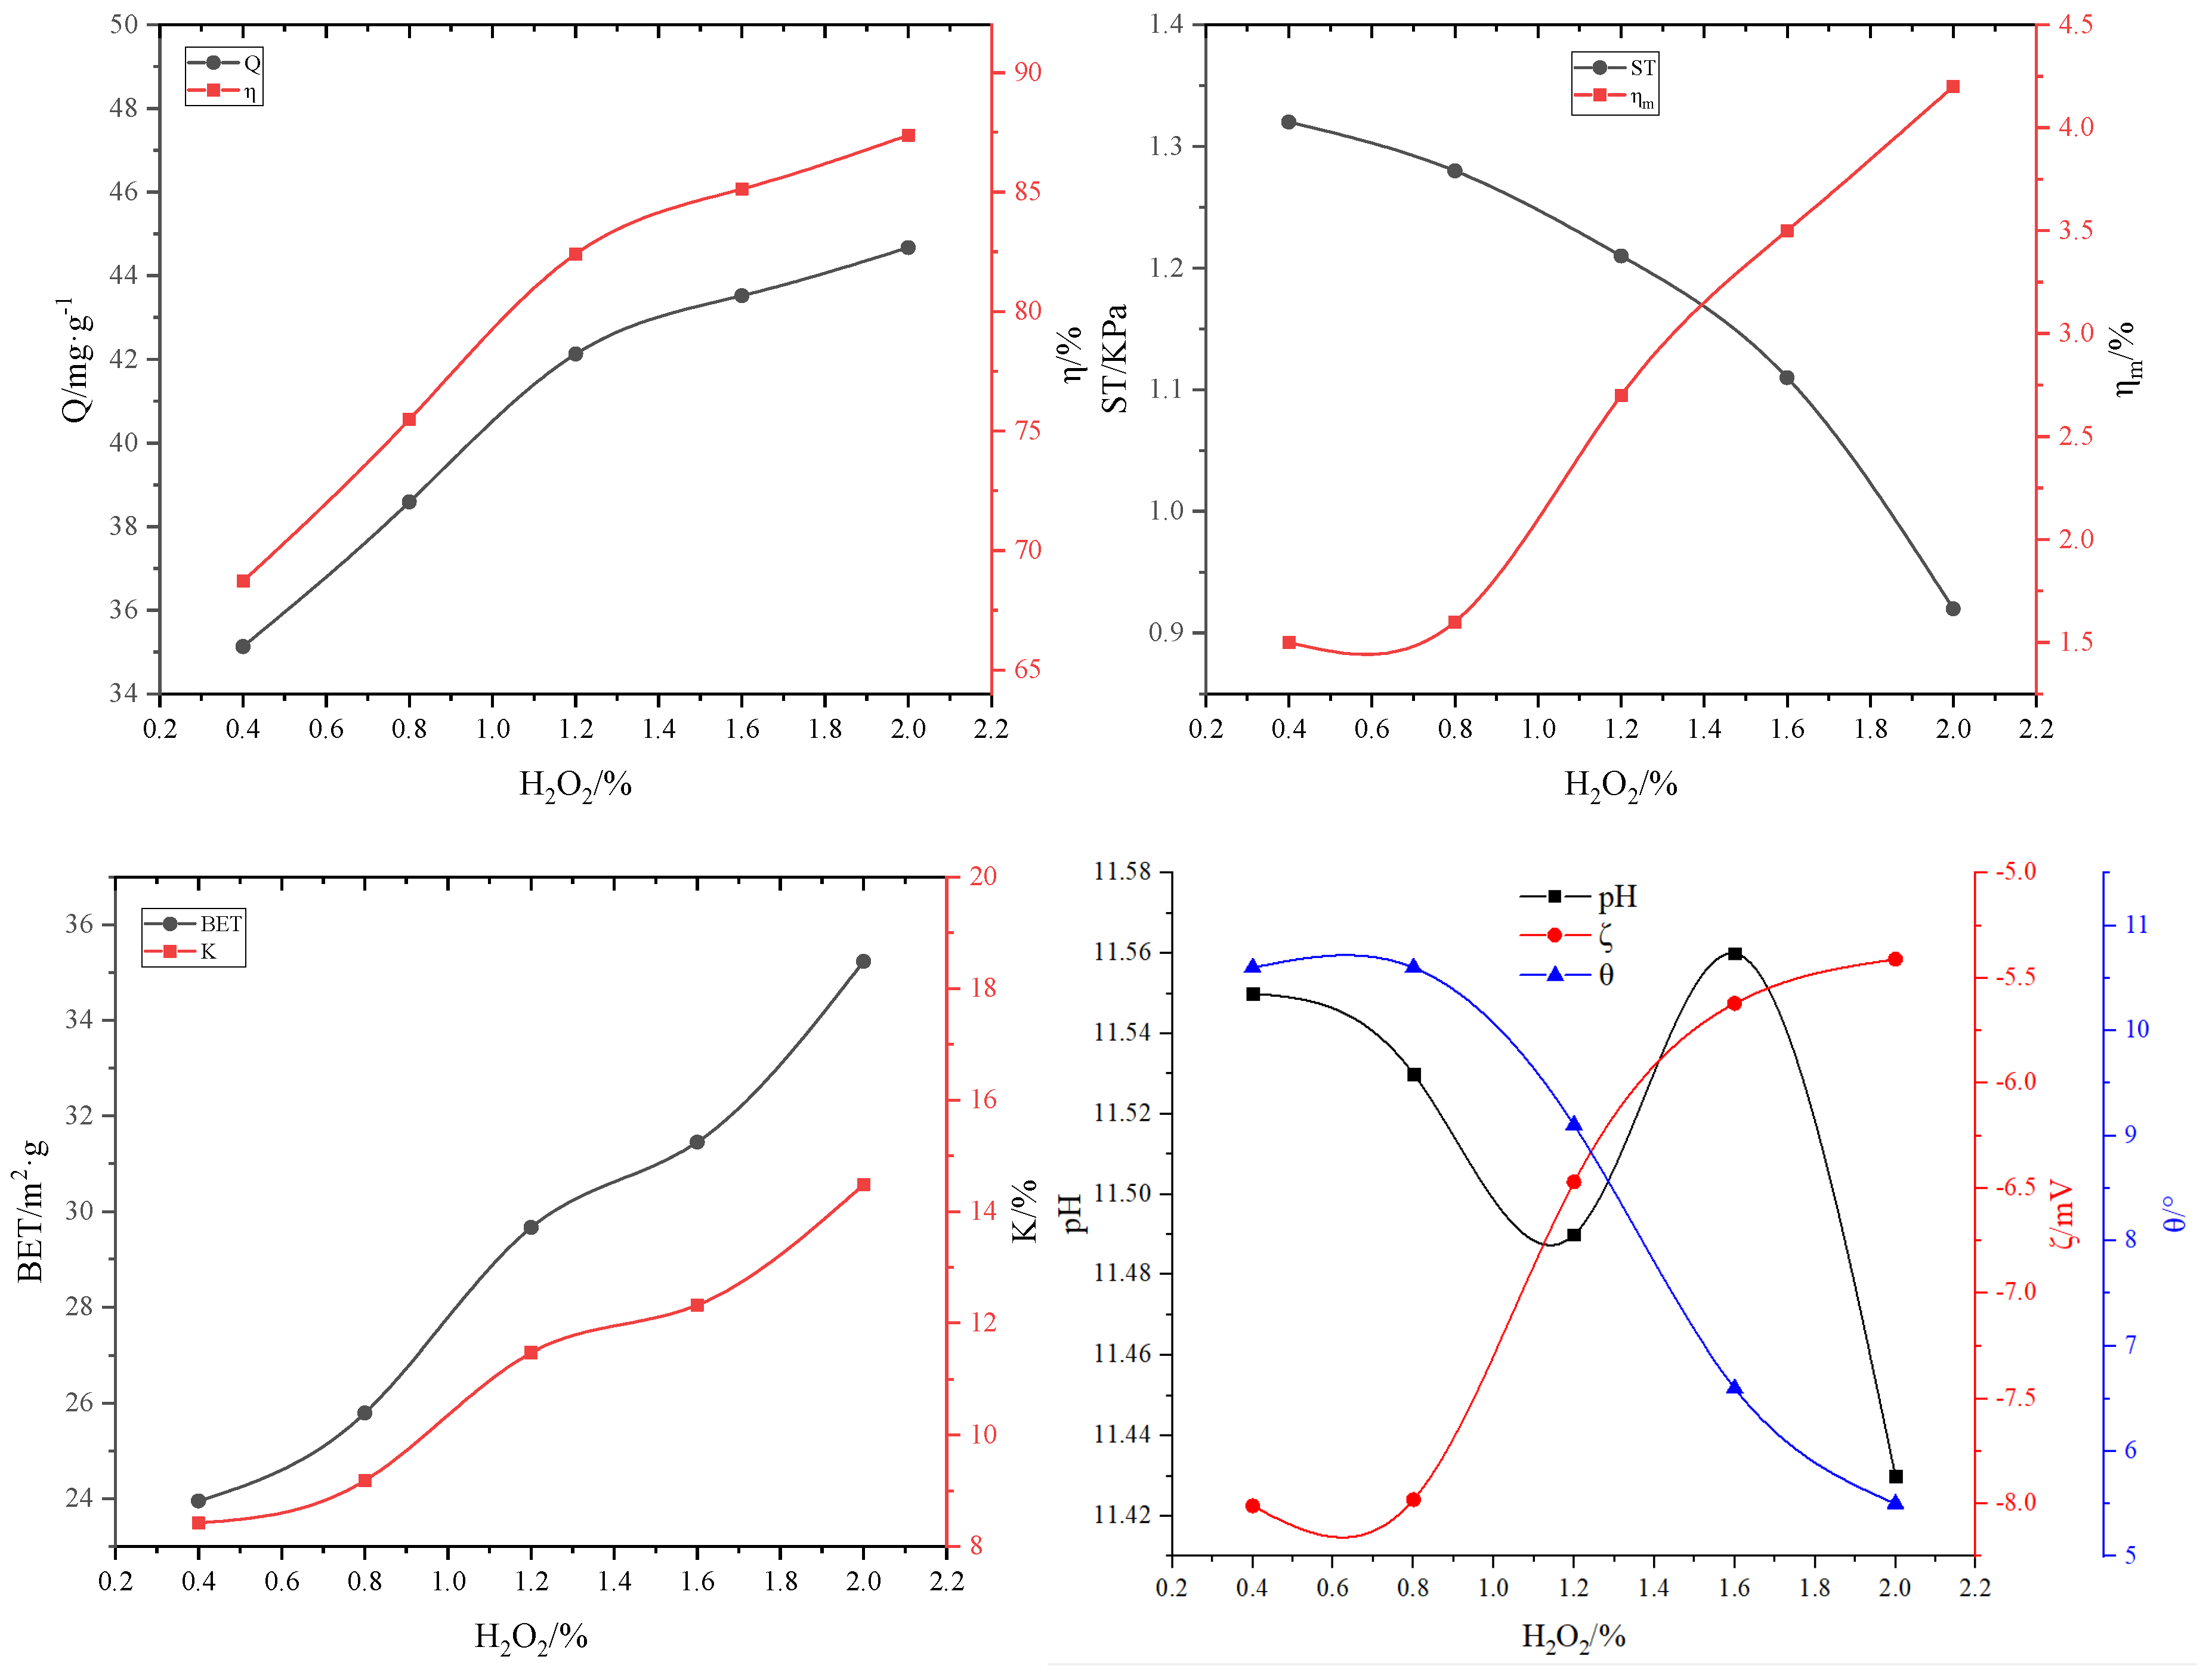
Figure 8.
Influence of HCl on various adsorbent properties.
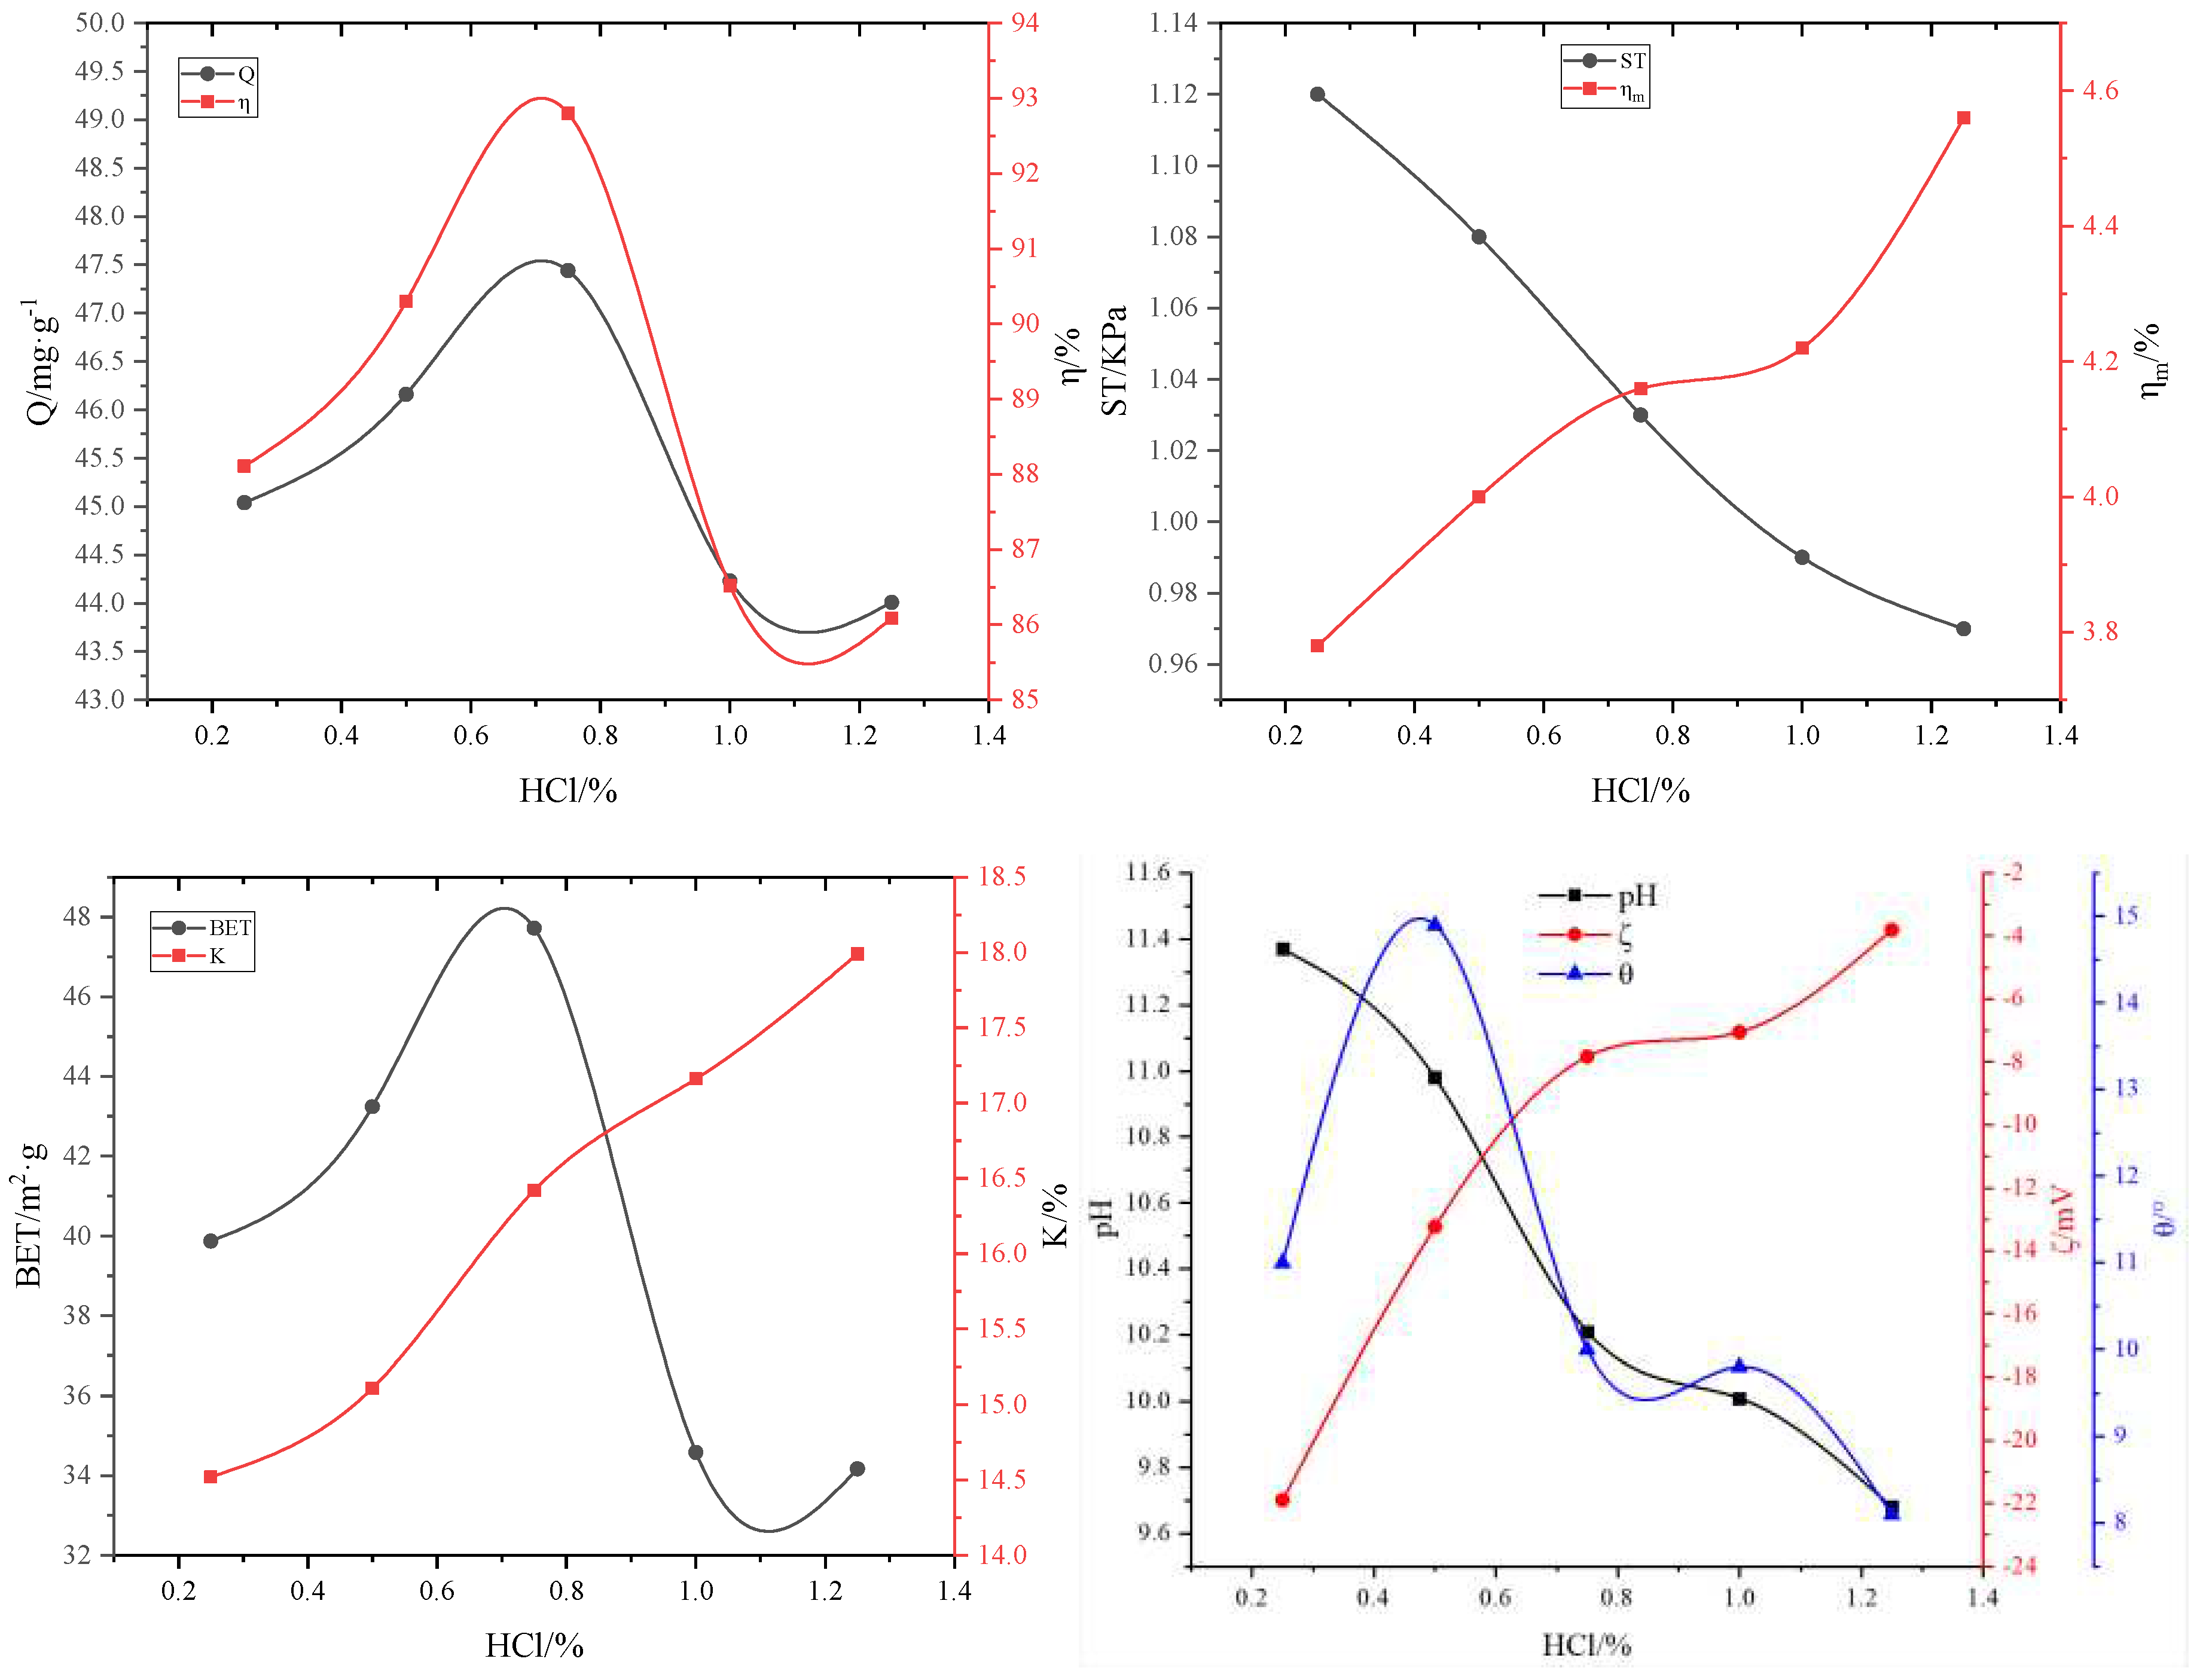
Figure 9.
Influence of dodecylbenzene sulfonate (SDBS) on various adsorbent properties.
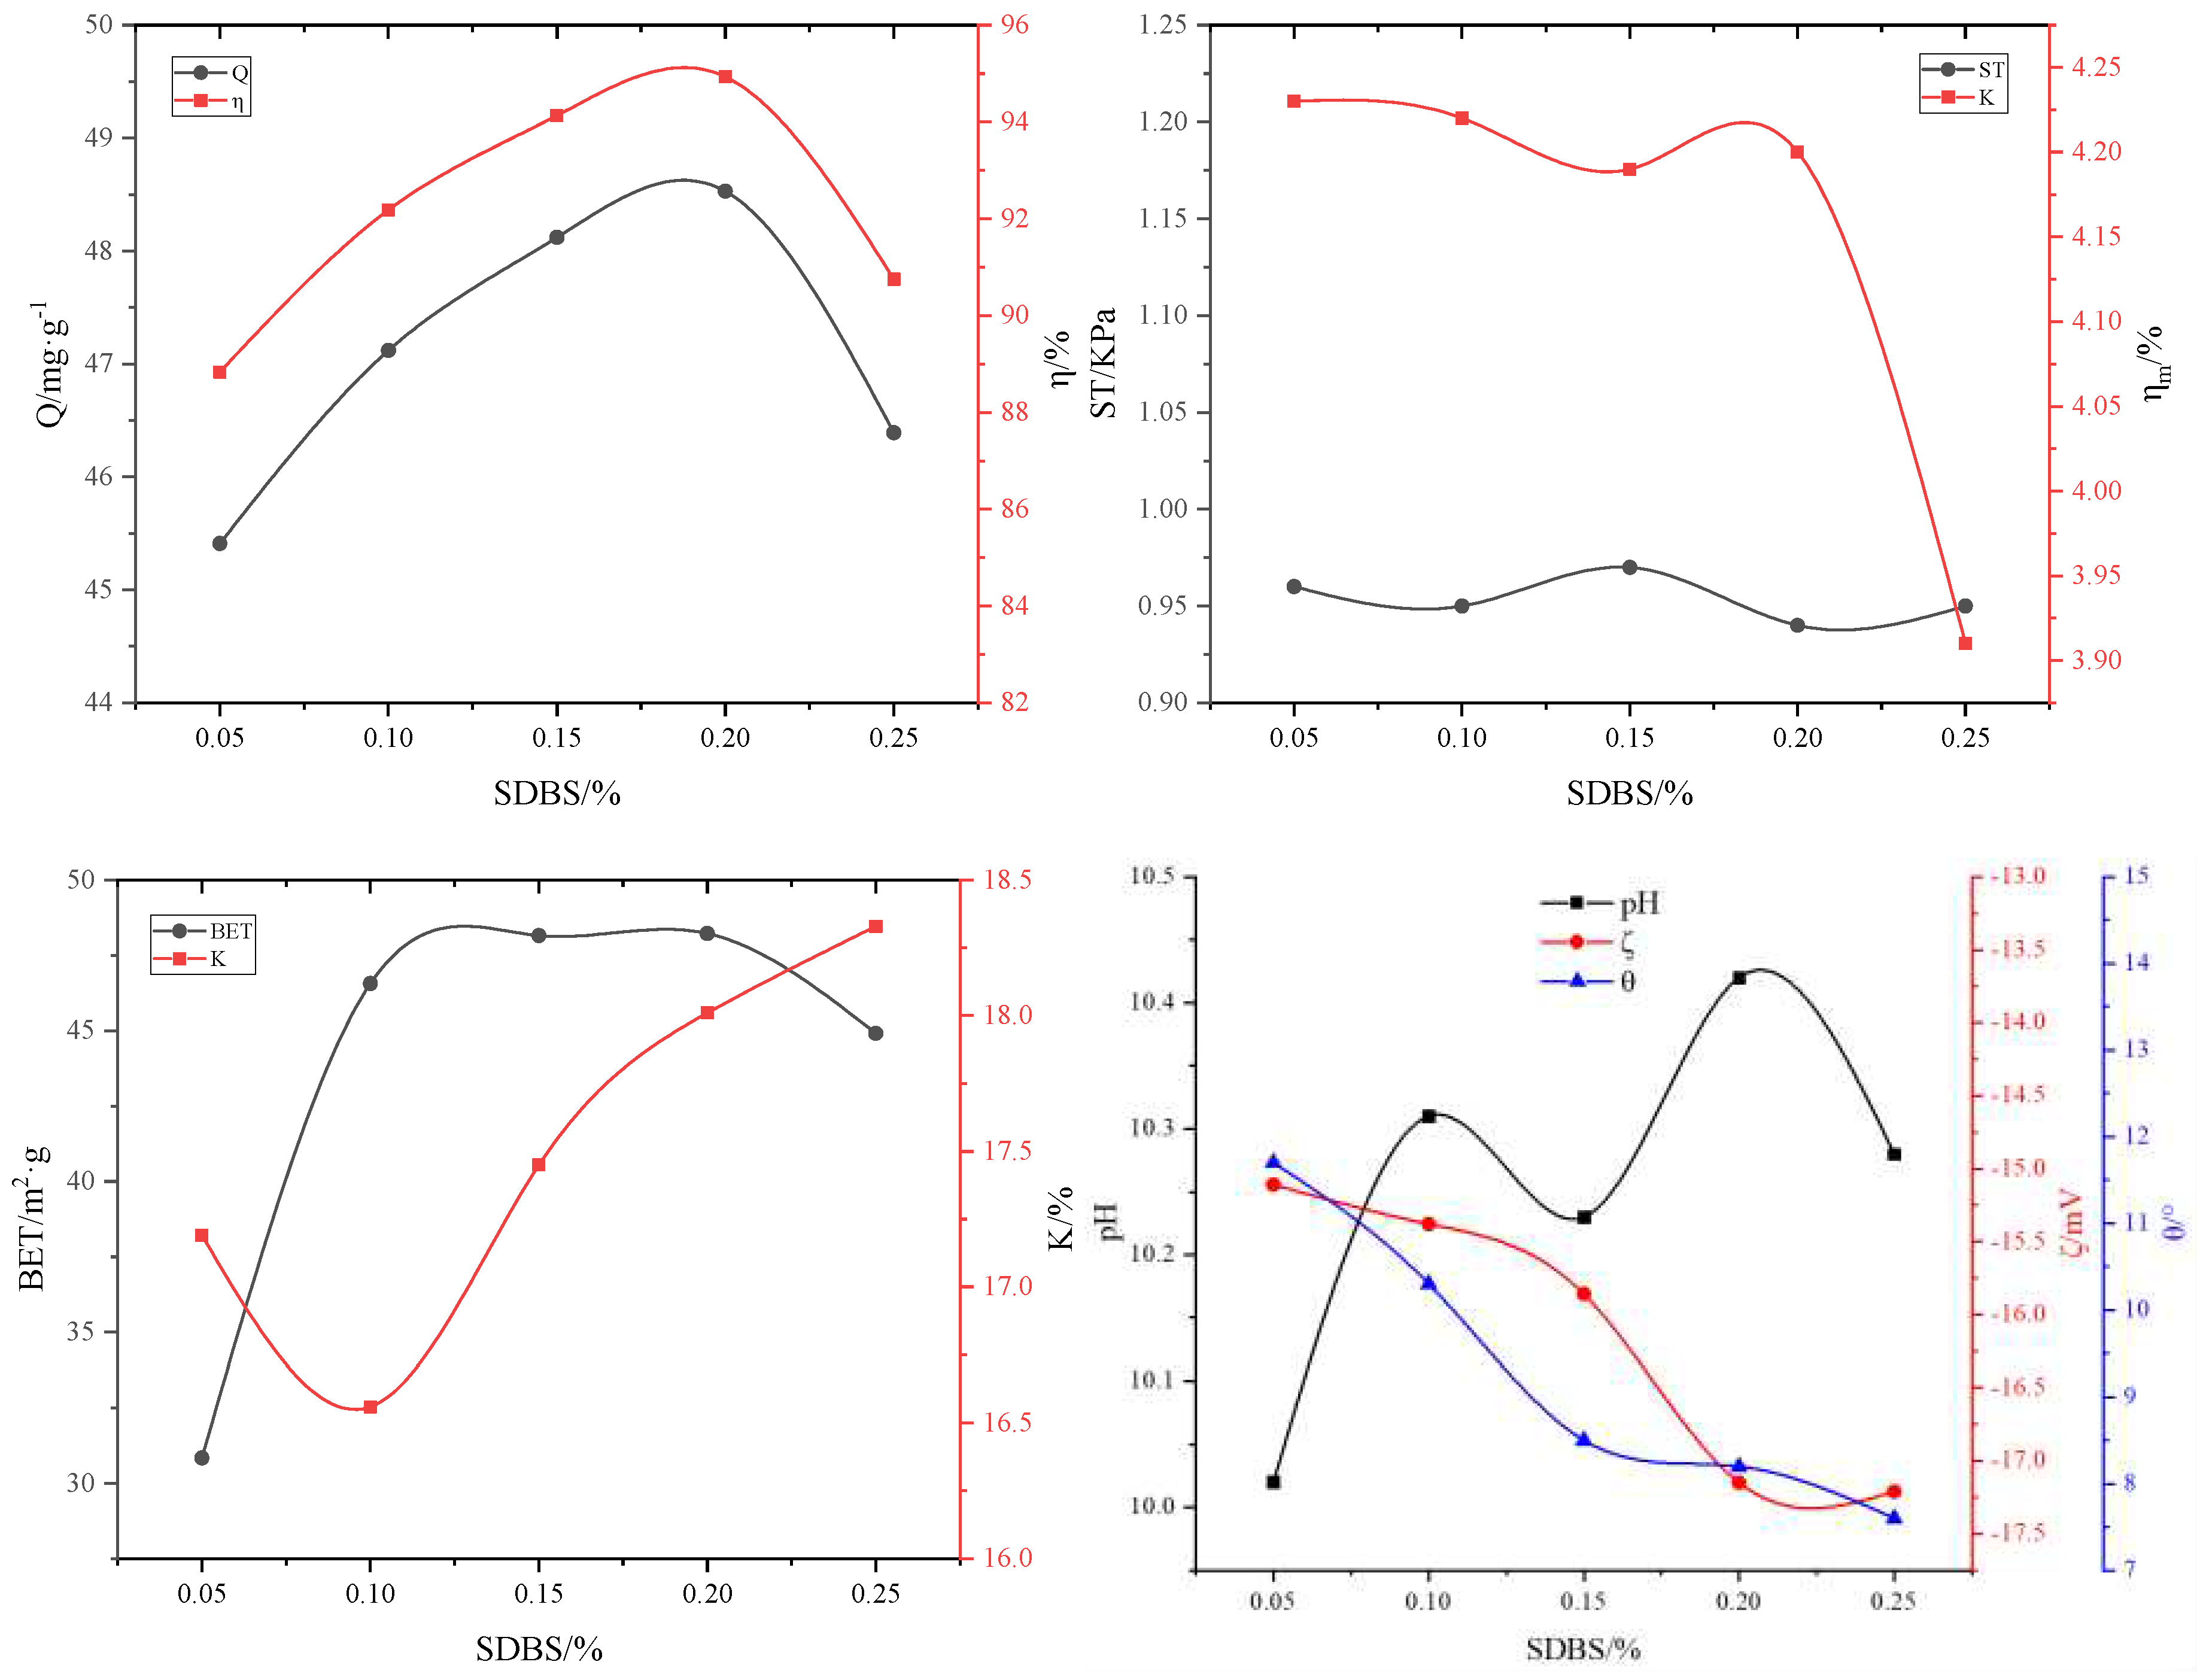
Figure 10.
Influence of the amount of red mud adsorbent on the removal rate in flotation tailings water.
Figure 10.
Influence of the amount of red mud adsorbent on the removal rate in flotation tailings water.
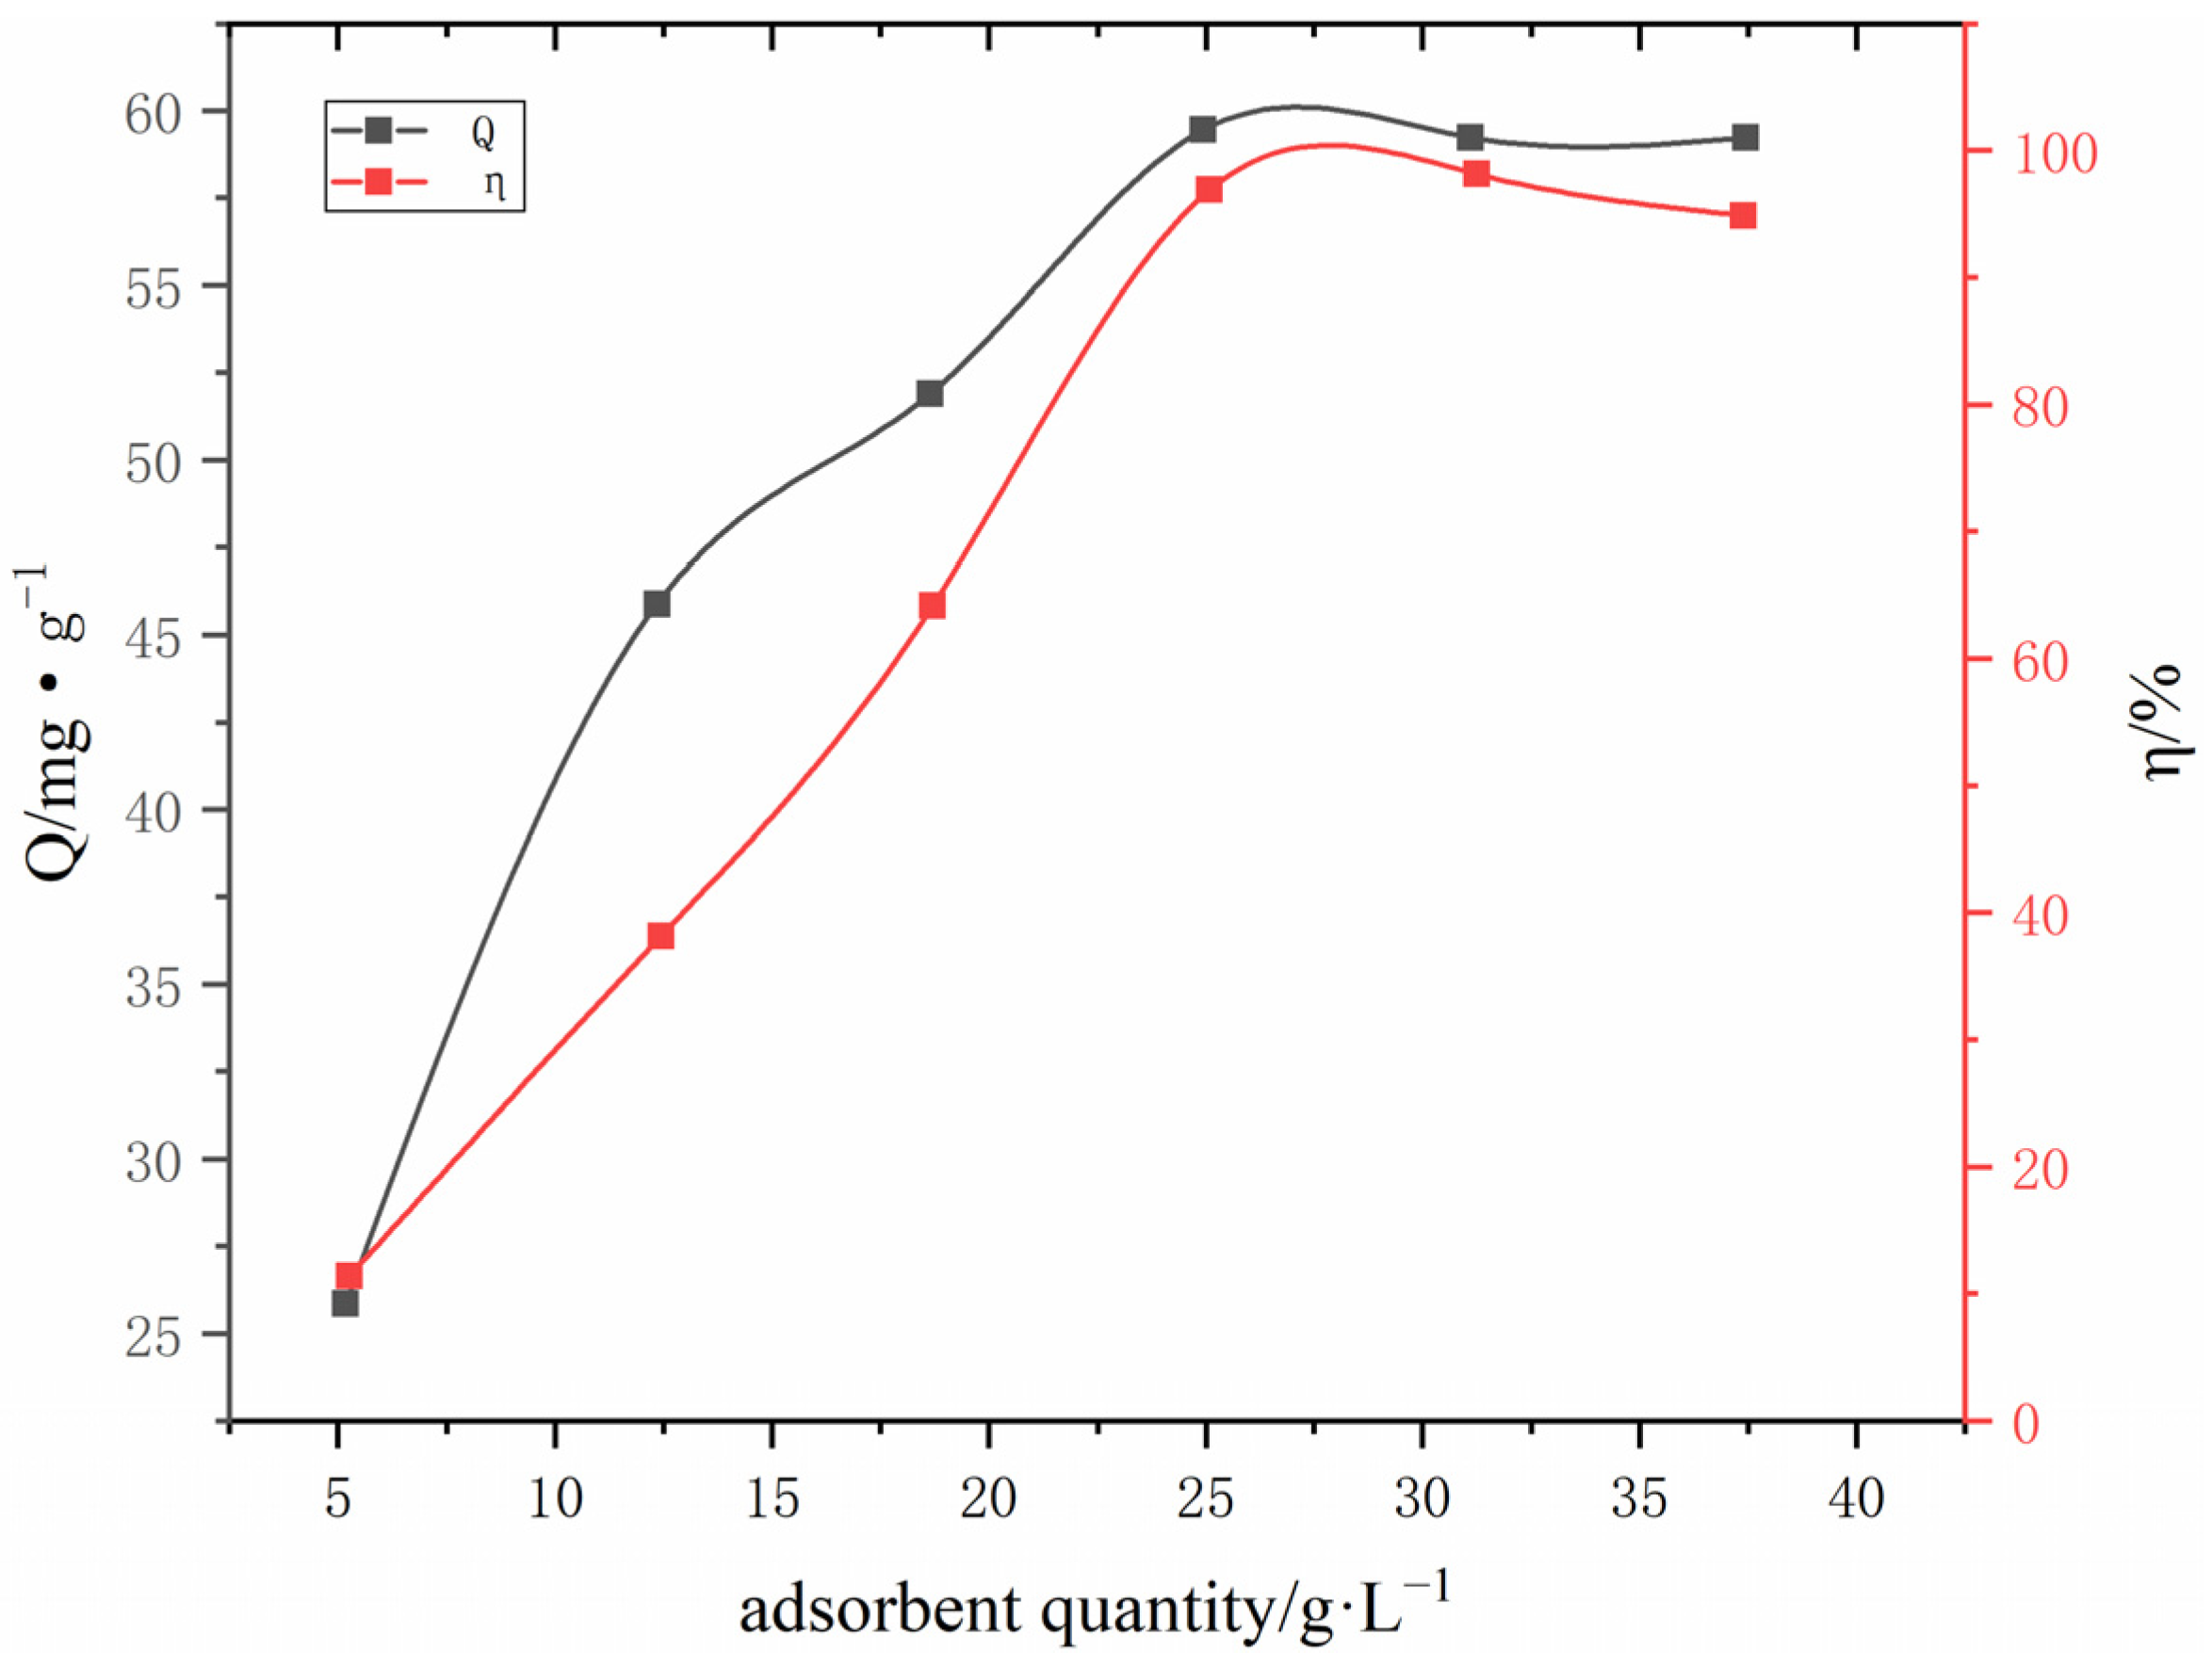
Figure 11.
Adsorption capacity of flotation tailings back to water as a function of adsorption time.
Figure 11.
Adsorption capacity of flotation tailings back to water as a function of adsorption time.
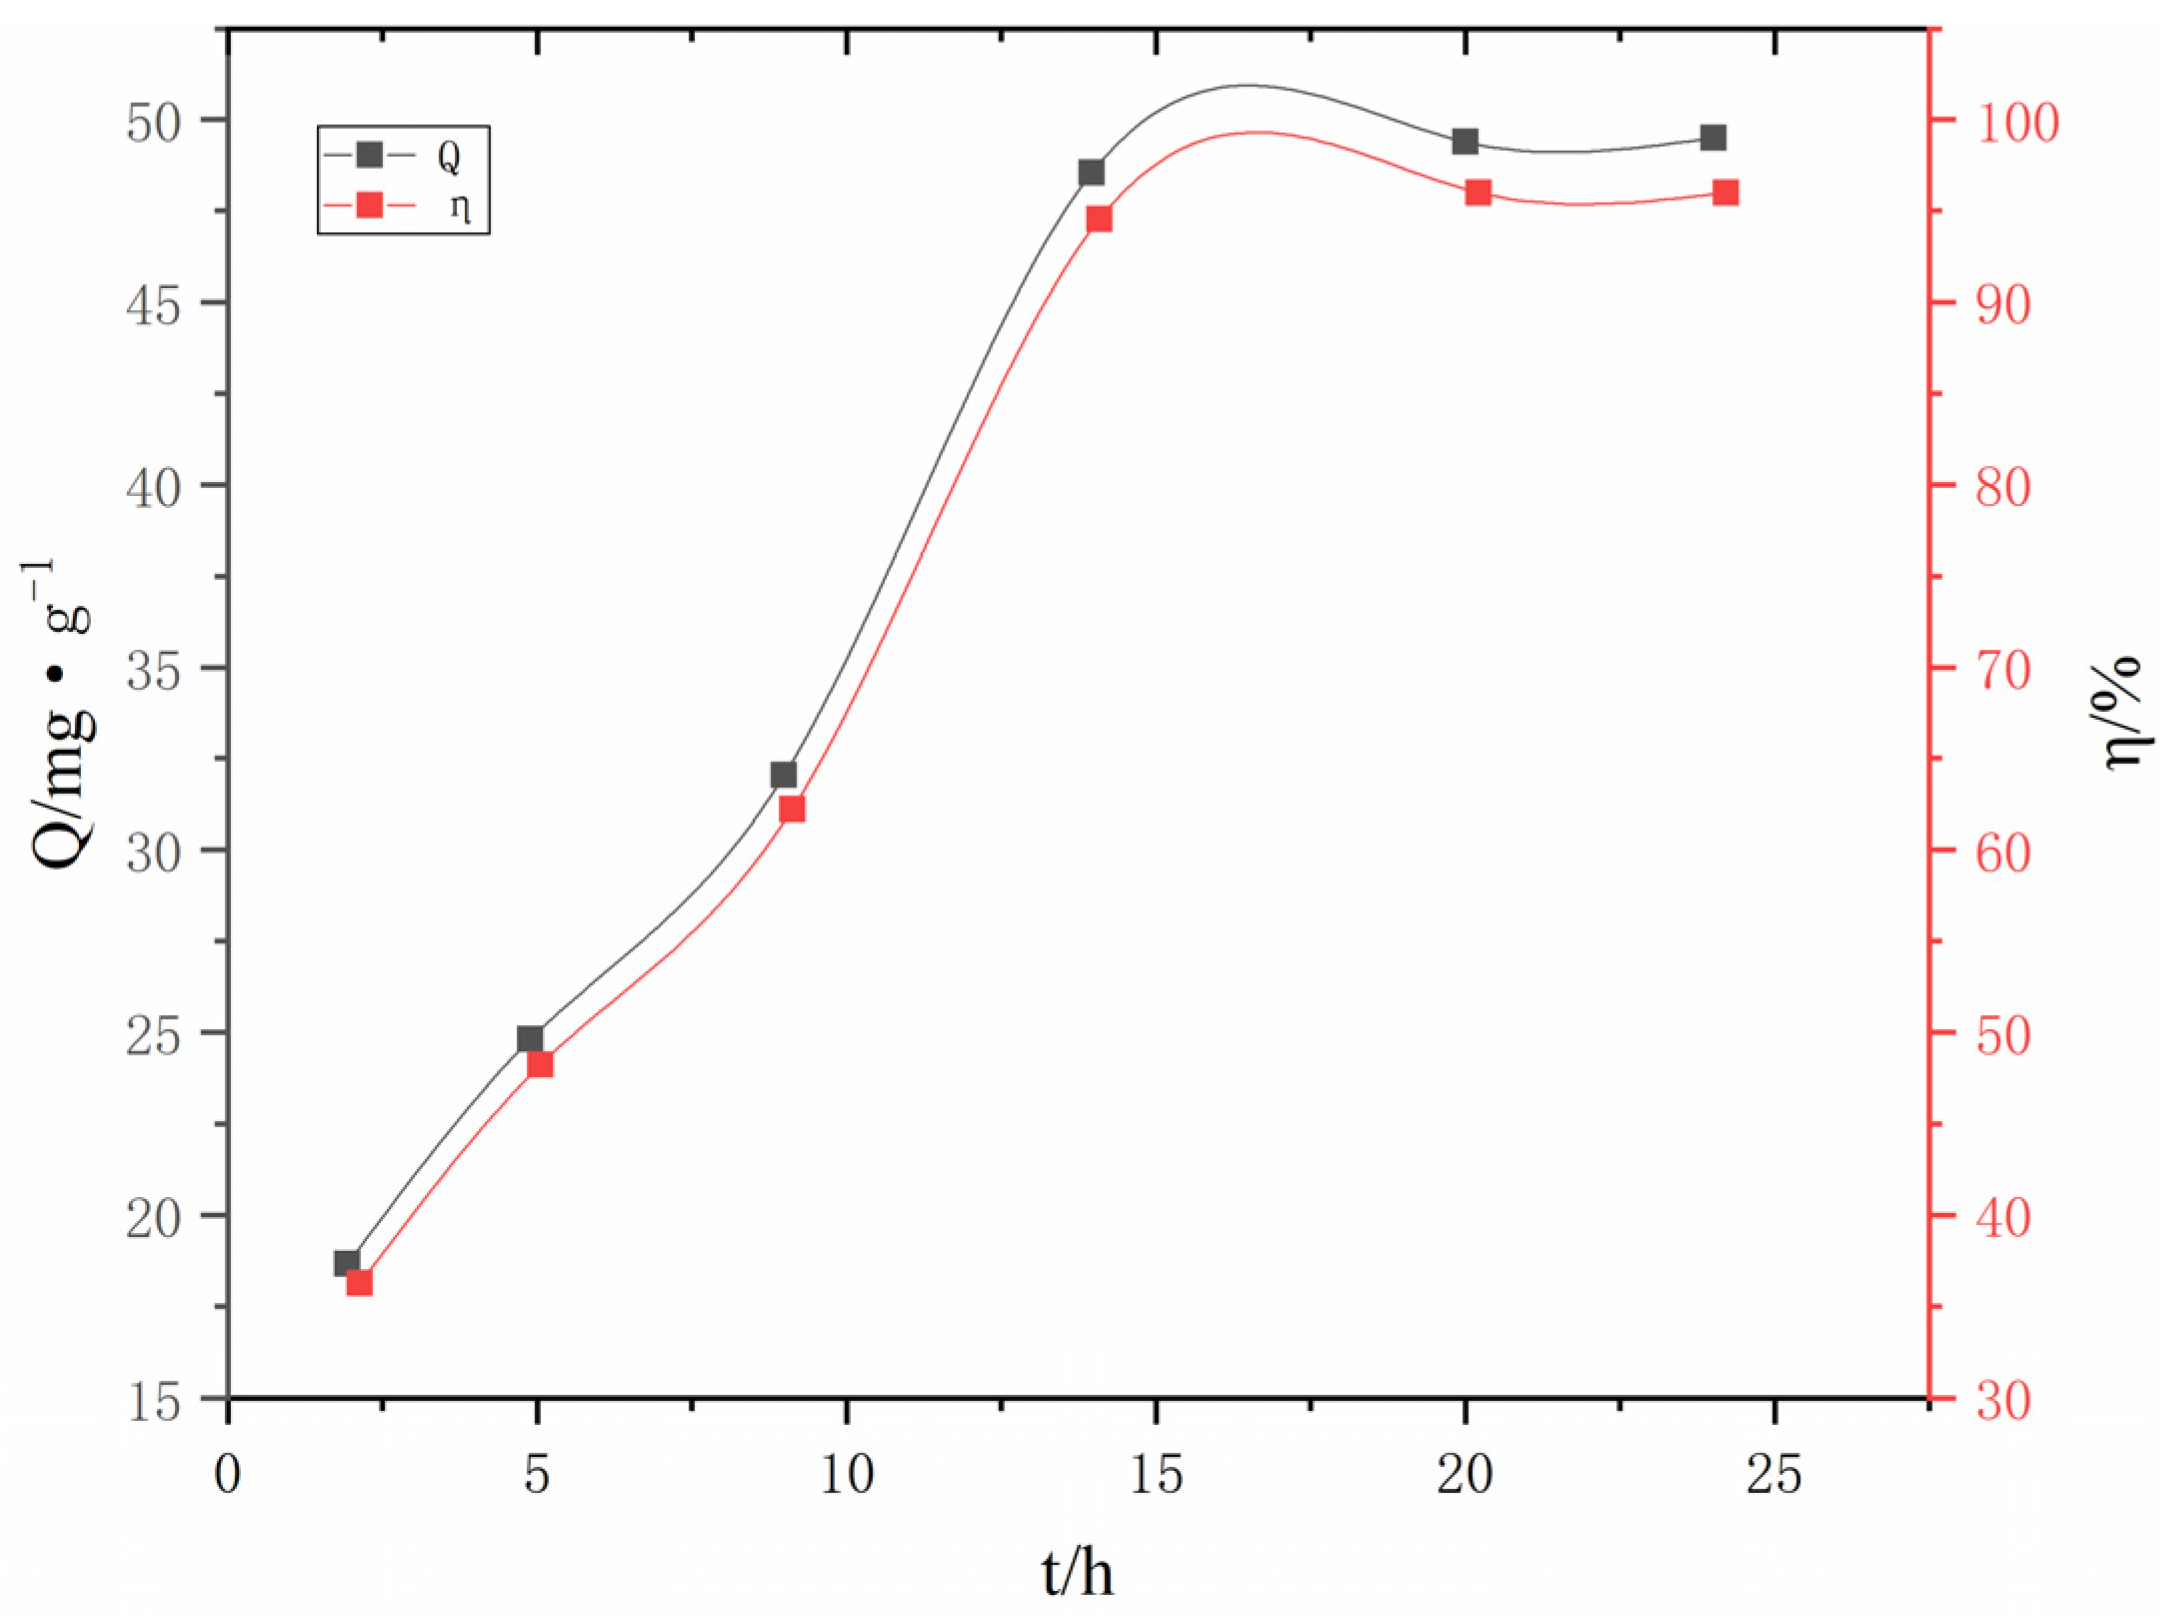
Table 1.
Single-factor test data table.
| #02-#06 | #07-#11 | #12-#16 | #17-#21 | #22-#26 | #27-#31 | ||
| RM/g | FA/% | A2C/% | HPMC/% | H2O2/% | MnO2/% | HCl/% | SDBS/% |
| 295 | 1.7 | 2 | 0.05 | 0.4 | 0.08 | 0.25 | 0.05 |
| 290 | 3.4 | 4 | 0.10 | 0.8 | 0.16 | 0.5 | 0.1 |
| 285 | 5.1 | 6 | 0.15 | 1.2 | 0.24 | 0.75 | 0.15 |
| 280 | 6.8 | 8 | 0.20 | 1.6 | 0.32 | 1.00 | 0.2 |
| 275 | 8.5 | 10 | 0.25 | 2.0 | 0.4 | 1.25 | 0.25 |
Table 3.
Performance parameters of RM particle adsorbents.
| BET/m2·g−1 | Zeta potential/mV | Wetting angle/° | Immersion pulverization rate/% | pH |
| 48.92 | −8.23 | 6.1 | 3.79 | 10.16 |
| Adsorption capacity of phosphorus/mg·g−1 | Removal rate of phosphorus/% | Compressive strength/KPa | Water absorption/% | |
| 48.63 | 95.13 | 1.12 | 16.58 |
Disclaimer/Publisher’s Note: The statements, opinions and data contained in all publications are solely those of the individual author(s) and contributor(s) and not of MDPI and/or the editor(s). MDPI and/or the editor(s) disclaim responsibility for any injury to people or property resulting from any ideas, methods, instructions or products referred to in the content. |
© 2024 by the authors. Licensee MDPI, Basel, Switzerland. This article is an open access article distributed under the terms and conditions of the Creative Commons Attribution (CC BY) license (http://creativecommons.org/licenses/by/4.0/).
Copyright: This open access article is published under a Creative Commons CC BY 4.0 license, which permit the free download, distribution, and reuse, provided that the author and preprint are cited in any reuse.


