
Submitted:
24 January 2024
Posted:
24 January 2024
You are already at the latest version
Abstract
Neural-objective and image optimization approaches for drilling fluid rheology automation are crucial for drilling engineering optimization. A myriad of intelligent computational models are employed to predict and monitor the parameters of mud rheology and filter cake permeability posture using an artificial neural network feedforward (ANN-FF) function, a non-ANN-FF function, an image processing tool, and a model optimization tool. 498 datasets of synthetic-based mud (SBM) flat rheology from a drilling mud laboratory at Nazarbayev University were imported into a user-friendly MATLAB application using image processing and nftool. Apart from the Google TensorFlow Sequential API DNN architecture used, a Levenberg-Marquardt training algorithm with input sigmoid hidden neurons 10, 12, and 18 coupled with a linear output layer was also used to predict the SBM flow index. OBM and SBM filter cakes were processed for void spaces; however, a model study was extrapolated to maximize filtration volume Vf. The study’s findings show that the ANN-FF model employed for rheological property monitoring and prediction had higher steady and exponential levels of accuracy and a correlation coefficient of 0.96-0.99. More so, SBM and OBM image processing presented an area of void spaces of 1790M2 and 1739M2, respectively. The porosity and permeability postures of both SBM and OBM resulted in a significant void space capable of maximizing the flow index. In addition, the single-objective modelling based on a genetic algorithm did validate the experimental rheological data for flow index or filtration volume Vf optimization; the study resulted in the finding that the constrained physics-informed objective function hindered maximizing oil recovery and instead predicted possible formation damage. It is empirical to note that automating flow predictions with neural, objective, and image functions has presented an alternative novel method for non-programmers using MATLAB and Google Colabs that is capable of enhancing mud rheological parameters, drilling efficiency, and hydrocarbon recovery.
Keywords:
Mud Rheology
; Filter Cakes
; Neural Network
; Image
; Objective Optimization
1. Introduction
1.1. Research Background
An efficient circulation of mud in the wellbore, maintaining a constant hydrostatic pressure in the drilling column, safe carriage of cuttings, effective reduction of drilling bit and string temperatures, and good hole cleaning are all reliant on a good drilling mud formulation [1,2]. This in its entirety prevents fluid pressures from drilled formations invading the wellbore, and if this is not properly managed, a devastating blowout is expected. About the essence of good mud engineering, mud cakes are formed [3] and are efficient not only in preventing the formation of fluids in the wellbore [4,5] but also in deterring the filtration of mud into the pore throats of the formation, otherwise it would cause formation damage.
There have been considerably brilliantly implemented ideas of drilling fluid formulations [6] that have been extensively researched, posing as the best drilling mud efficiency for preventing formation damage. Despite the numerous available drilling mud designs, most of these that are commonly used are classified into two categories based on the materials used in their formulation: oil and water base. These industrially acceptable muds tend to have some rheological profiles [7,8] that are most sensitive to the formation and are eco-friendly to personnel and equipment. The American Petroleum Institute (API 13I) rheological profiles [9,10] standard in these muds is technically made for effective filtration that doesn’t tend to damage near-wellbore but is intended to increase drilling productivity and reduce non-productive time during the drilling cycle [11].
The presence of oil in synthetic-based muds [12] provides good hole cleaning and circulation, increasing the chance of protecting and persevering drilled formation walls. Moreover, this has the advantage of providing no damageable traits to the drilling sections, which provides a high degree of performance concerning flat rheology. However, in shallow and deep wells [13] under drilling operations, some fluid engineers consider the efficacy of synthetic-based drilling fluids as suitable fluids whose properties do not change over time or react inefficiently when in contact with high-temperature and high-pressure regions. In aspects where drilling is done in extremely cold regions, the flow behavior of the mud must maintain its physiochemical properties; these new formulations are experimented with and further researched to handle severe drilling conditions. Drilling fluids [14,15], and their hydraulics [16] are the basis for understanding computational flow geometry to handle efficient drilling operations.
1.1.1. Synthetic Fluid Chemical Compositions
Fluids whose bases are synthetic have a long carbon chain history from to [17]. This organic compound is easily degradable but has extreme potency, behaving like an extract from crude oil as the base oils do. However, this inverted emulsion has a continuous external phase, while the brine exhibits an internal phase. In addition, the popularity of synthetic fluids in markets today cannot be underestimated; ester, di-ether, poly-a-olefin, and detergent alkylate are examples. It is worth noting that some of these are formed by mixing alcohol with fatty acids, condensation and oxidation of alcohols, polymerization of ethylene, and alkylbenzene.
1.1.2. Rheology
The flow index and fluid hydraulics observe an API standard for measuring fluid rheology at the drilling site; operators of drilling fluid keep a close eye on the evaluation and monitoring of fluid profiles to keep the well safe and balanced to prevent devastating situations [18]; the proficiency of the fluid in question is kept under rigorous test for safe operations. These profiles under consideration take into account the density of the fluid, apparent and plastic viscosity, yield point, and gel strengths; the relevancy of this check helps ascertain the circulation and pressure loss of the drilling fluids’ performances. Alsabaa [19] had demonstrated the flow behavior of drilling mud using the Marsh funnel experiment; the author further used Fann 35 [20,21] rotating viscometer to define mud rheology. However, the continuous testing for the flat rheological properties of the synthetic-based drilling mud [22] in the fields and the laboratory remains a relevant job for the rig crews to do because, when it comes to multilateral wells, suitable drilling fluids are designed to cater for well control. It is also recommended that the density of the fluid in operation be checked periodically, especially 3–4 times an hour, to detect possible deviations from stable rheological properties. The constant alert for this check is because the drilling fluids may and could have gotten into contact with some delicate formations. For this unknown reason, the fluid density must be in the constant test.
1.1.3. Neural Networks
However, while we tend to monitor and evaluate the drilling fluid profiles in constant check, artificial and deep neural networks are by far employed to reduce time-cost [23,24,25] effects on the drilling and production of hydrocarbons in the petroleum and civil engineering industries. Its application to solve complex and technical problems is derived from biological neuron concepts. This has the potential to solve linear and non-linear problems [23,24] based on adaptable models and datasets. More so, optimizing the prediction of fluid rheology [26,27] requires an efficient computational model. The most reliable indicators for predicting the accuracy of machine learning outcomes are the mean square errors (MSE) and the coefficient of correlation (R). A lower MSE value indicates a higher level of accuracy in the predictions, while a higher R-value (ranging from 0.7 to 0.9) signifies a stronger linear relationship between the variables [4].
As reported by [28], their previous research shed light on optimizing gauge biofilm thickness and its hydrodynamic parameters using deep learning convolutional neural network algorithms. Their successful 2D and 3D biofilm thickness predictions were better than intuitive reasoning and manual calculations. Given this, the current study brings to light an intelligent means of predicting [29,30,31,32] the rheology of 498 sampled synthetic-based mud rheological profiles to determine and improve future drilling performance optimization expectations. The focus of this is to obtain or maximize filtration or flow index for prediction and proper monitoring. In addition, the flow index computation from the neural network is a dependent variable of the entire fluid rheology parameters, recognizing PV, AV, and YP as its independent variables. [26].
1.1.4. Filter cakes
The formation of thinly layered slurry on the walls of the well is termed filter cake [31]. In previous studies, authors [33,34] devised means to determine the efficacy of drilling fluids by subjecting them to rigorous pressure and temperature. Filtration [3] loss explains the potency of the cake to return permeability or increase the enhancement of hydrocarbon production after washing. This study concentrated on synthetic-based muds [35] that were formulated in the laboratory as indicated in previous studies; the liquid phase of the slurry simply slipped into permeable formations, leaving behind packed solid particles. More so, cakes that have a higher degree of thickness or tightly packed particles increase the drag and torque, thereby easily getting pipes stuck in the well during drilling. As a result, when particles are packed more loosely, it enhances the porosity and permeability profile, leading to a favourable rheological profile determination.
1.1.5. Single-Objective Optimization (SOO)
There have been several widespread optimization algorithms for finding optimal engineering design solutions. Based on the given problem or physics-informed objective functions, algorithms such as the Levenberg-Marquardt algorithm, grey wolf, ant colony, particle swarm optimization, evolutionary algorithm, differential evolution, hill climbing, stochastic optimization, and now the most popular Adam algorithm [36] is widely used for optimization problems.
Moreover, the quest to find the flow index and maximise filtration volume for the optimum recovery of oil in filter cakes throws out a physics-informed objective as described in the method section below; focuses on the general single-objective optimization algorithm illustrated in the following Eq. 1-4 [37];
Dias and Liu [37,38] computed single and multiple objective optimizations for pultrusion and multistage filtration processes. Dias inferred informed physics and mathematics and then defined a pultrusion die with six heaters and C-section composite geometry.
While the current study optimizes filtration volume based on a default genetic algorithm, Dias et al. introduced two different algorithms for single-objective computation: particle swarm optimization (PSO) and sequential quadratic programming (SQP) algorithms. These algorithms were used under the influence of a constraint on the minimum degree of cure of 0.9. After drawing a comparative analysis, the sequential quadratic programming (SQP) algorithm performed better at 30.31% in determining the minimum objective function than that of particle swarm optimization (PSO).
Meanwhile, Liu et al. computed a superstructure for the optimal design of a continuous multistage reaction and crystallization process for the production of aspirin. The objective of the research problem was to maximize yield and minimize waste under certain imposed constraints. The literature for this previous research was to pay maximum attention to the wash filtration stage amongst other critical physics-informed components such as temperatures, mass flow rate, and residence times. Despite several optimization scenarios, Liu maintained a genetic algorithm under single-objective computation to best define the optimal crystal size, yield, and coefficient of variation (CV). It, however, turned out that the respective mean crystal size and yield were 628 and 87.91, while the minimum coefficient of variation (CV) of 0.3596 was achieved.
1.1.6. Image processing
The nature of pore spaces [39] and permeability capacity support fluid engineers’ understanding of flow patterns and pore geometry through a permeable drilled formation. This current study supports the recognition and appreciation of the pore networks of solid particles [40] that are left behind by synthetic-based mud after filtration. As the current study monitors the rheological profiles of the drilling fluid in operation, it is important that the crews on the rig site further visualize the flow geometry to recover oil.
In previous literature from [41,42], the suspension of solid particles was quantified, and segments [43] of the flow patterns were presented in 2-D imagery; these techniques were informative to the drilling management and to the current study. However, the data for testing, training, validation, image processing, and objective analysis [44,45,46] are exponentially revealed in the preceding sections.
1.2. Research significance and motivation
In the absence of rig and mud engineers, crews should be able to understand fundamental computational analysis for gear drilling operations, with an emphasis on monitoring and evaluating mud rheology and filter cake formation in the wellbore. Drawing up the usage of user-friendly application programming interfaces (APIs) for non-programmers is expounded on in this current study to predict flow, maximize filtration volume, monitor void spaces, and evaluate formation damage occurrences, if any. However, this predictive analysis has become very crucial in the petroleum industry to enhance drilling efficiency and hydrocarbon recovery in conventional and unconventional wells.
1.3. Research objectives
The current computational modeling is aimed at constructing useful models to symmetrically optimize flow index or maximize filtration volume based on the mud rheology dataset using friendly neural network APIs from Matlab and Google TensorFlow and also determining the pore posture or permeability tendencies of oil and synthetic-based mud from image processing.
The study, however, identifies the need to find optimal solutions for maximizing oil recovery from treated filter cakes by using a fundamentally informed physics objective problem. All this computation modeling seeks to provide an alternative fluid evaluation and monitoring algorithm for decision-making, mud rheology, and oil recoverable forecast capabilities for daily operations in the oil and gas fields. Figure 1 presents an explicit understanding of how all computational work in this study was carried out.
2. Methods
2.1. Experimental Data
The data collected were from an experiment with flat rheology from synthetic-based mud in a drilling fluid laboratory at Nazarbayev University [47]. The experimental monitoring of mud rheological properties explains all parameters involved, as shown in Table 1 and Table 2, as recorded for further computational analysis. However, these mud reports were sorted and filtered to avoid training irrelevant data. The sampled mud rheology reported 498 data points from the laboratory, which consisted of fluid density, plastic and apparent viscosity, yield point, gel strength at different periods, and flow index.
2.2. Neural Network Approach
Artificial neural networks, the most efficient and intelligent means for prediction [48,49] mimic the biological neural system as a means of reasoning to solve complex problems [50]. This computational model, which is well-known in the petroleum industry, has three or more layers depending on the complexity of the data used. The input, hidden, and output layers are the only layers used in this study’s data training, which supports the final model selection for an optimized prediction setting [51,52].
However, the relationship between layers is a deeply interconnected neuron network [53]. In this study, the artificial neural network feedforward function (ANN-FF) from MATLAB’s nftool application, a user-friendly neural network processing toolbox meant for non-programmers, used the entire data from each fluid rheological component to model and predict better responses for fluid behavior [54,55]. The model was trained using inputs such as plastic viscosity, apparent viscosity, yield point, and gel strength (10 sec. and 10 min.) to determine the output flow index. This model is widely seen as effective because it can extract weights and biases from the trained data and the equations used. The already pre-processed data imported used 10, 12, and 18 neurons as a means to validate the results compared with Alsabaa’s research [19] in Figure 8b. More so, Figure 2(a-l) shows the propagation of more stable linear regression analysis by employing nftools’ non-linear hidden neurons sigmoid with a linear output neuron based on the rheological parameters. While focusing on the computational speed with less memory accessibility, ANN-FF proceeded with the Levenberg-Marquardt training algorithm and the mean square error loss function.
Whereas ANN-FF was used to train 70%, validate 15%, and test 15% of the 498 datasets, the study further investigated the accuracy of a non-ANN-FF tool (OriginPro) to validate the potency of the dataset in question, as demonstrated in Figure 3. However, the accuracy of this algorithm was achieved by monitoring the correlation coefficient R-value for each rheological property, as illustrated in Table 1 and Table 2. The current study introduced the means to compute parameters for predictive analysis by maintaining Alsabaa’s trained neurons for a fairer observation and validation process of how the network will coordinate the relationship between the input and output values to define accurate correlation coefficients.
2.3. Filter Cake Image Processing
The interpretation of solid particles and their pore networks from the mud slurry was crucial for this study to support an easy visualization of flow geometry to better define the flow index. Images in Figure 4 are filter cakes from previous studies [47,56] that were captured and used for the interpretations. This process involved a MATLAB-Image Processing Toolbox; the embedded software is featured to recognize images and extract valid details both in quality and quantity. Data from these images is simply collated from their quantitative dimensional measurement and pixel segmentation; however, this analysis was based on colour intensity, thus RGB and grayscale.
The method simply has a simplified structured algorithm as illustrated in Figure 5, where an input of the image gives rise to the output results; some techniques were employed while processing the image [57], and some of these are the region of interest (ROI), binary operations, neighbourhood and block, linear filtering and filter, and a geometric operation, to mention but a few. While other previous studies [42] paid attention to binary image operations and regions of interest, this current study utilizes the same focusing on the entire mud cake as the region of interest and thresholding by converting full-color image or grayscale images into binary.
Nevertheless, montage, an image editing technique, was used to effectively code the images from previous studies [47,56]; the analysis of these images was converted from their original colours (Red, Green, Blue-RGB) to grayscale and binary images [58,59]. The intensity of the grayscale is rationed from 0 to 255; the lesser the number, the darker it becomes, and the greater the number, the more grayscale is attained. Also, the algorithm supports the conversion of grayscale to binary, and it is tuned by its intensity from 0 to 1. The imported images [60,61] were partitioned into several multiple visible fragments in a uniform pixel arrangement [62,63], and this process was seen as segmentation.
The next step after segmentation was thresholding, which involved the extraction of a partitioned image based on its intensity and properties. Further grayscale image interpretation for this current study fairly reviewed a 2D adjusted histogram of the two filter cakes, which were formulated from synthetic- and oil-based mud. The x-y axis of the histogram represents the respective intensities and amounts of pore spaces. A 3D particle distribution [64,65], and pore networks were initiated to explain how these two different mud compositions interact with permeability. Red, Green, and Blue (RGB) and hue saturation values (HSV) were selected for these processes. Thus, particle distribution [66] and particle suspension enhance simple visualization and expose the region of interest (ROIs); however, these processes are coined from thresholding.
2.4. Flow Index Single-Objective Simulation
After considerable flow index optimization with feed-forward neural network architecture and image processing. A careful objective function is obtained and processed in a MATLAB optimization toolbox. However, while filtration flow from a three-dimensional CFD simulation is adapted from Mathematical models of particle filtration in Figure 7, it illustrates the flow occurrences in a ceramic disc concerning fluid and particle flow, particle and pore sizes, and irregular structures of ceramic pore throats.
The single-objective simulation for the collated data presented a nitrogen gas injection in a carrier cell with a pressure of 20psi for the recovery of oil through treated filter cakes on a ceramic disc. Optimizing or maximising the flow index (filtration) in filter cakes for oil production would require narrowing the physics-based problem to a spatial solution. However, the study takes inspiration from Puderbach’s [67,68,69,70] filtration model as presented in Eq. 5 and 6, where is the filter medium (ceramic disc), , pressure drop, , viscosity, A, Area, , filtration volume, , filter cake resistance, , filtration constant and t, filtration time.
While satisfying the flow objective, the simulation considered holding other flow parameter constants as indicated in Eq.7. However, maximising the flow index would literally mean optimizing filtration volume , and once filtration volume is maximised then the tendency of the treated filter cakes to produce or recover the required oil would have been achieved due to the porosity and permeability posture the cake possesses.
Objective Approximation;
f(x,y) Constraints for volume;
f(x,y) Constraints for pressure;
The experimental data incorporated into this study expounds on the analysis of several treated filter cakes undergoing oil-recoverable processes. This analysis demonstrated that within 12 hours of the initial oil recovery, the maximum filtration volume was at 39.6ml. However, the total 200ml synthetic oil recoverable was 200 ml which indicated that; the time which has been held constant in this objective would be 61 hours for the complete oil recoverable process. This elaborates the model as expressed in Eq.8; filtration volume and pressure drop are replaced with the variables x and y respectively. Whereas ’x’ represents the vertical nitrogen gas injection into the carrier cell, ’y’ illustrates the horizontal placement of the ceramic disc coupled with treated filter cakes and synthetic oil in the carrier cell. As pressure was applied to the said carrier cell, oil was expected to flow through the treated filter cakes, whose polymeric strands were considered broken to optimize oil recovery processes. In simple terms, if oil takes a longer period to recover or to maximize the filtration volume in the graduated cylinder, then the ceramic disc would be considered damaged (formation damage) because the pore throats of the disc would be blocked by several chemical impurities formed from improperly designed synthetic-based mud and treatment solutions.
3. Results and Discussion
3.1. Rheology Prediction Optimization
A predictive accuracy boost for the rheological parameters in this study required a high degree of computational algorithm; this involved a sensitive analysis initiated by several neurons in the hidden layer used and the type of function the algorithm operated on. Though the study limited its data to 498 data points, the number of neurons increased significantly and had an impact on the correlation accuracy, as shown in Figure 8. This further explains the ineffectiveness of increasing the number of neurons since 10 and 12 neurons were enough for training and testing the data. An increase in the number of neurons in this study yielded significantly low accuracy; however, the best number of neurons for the training for the said data was between 10 and 12.
The study further made a comparative analysis with Alsabaa’s model and a non-ANN-FF linear fit model. The average of Alsabaa’s mud weights’ correlation coefficient (cc) and the average of the number of neurons is demonstrated in Figure 8b, which foretells the accuracy of the rheologically sensitive prediction analysis. The ANN-FF model from nftool clearly distinguishes between the best training and testing algorithms.
3.2. Cake Image Optimization
In image segmentation [42,61], an image-segmented app was loaded with an adjusted grayscale SBM image, and a high balanced threshold intensity of 90 was set for the SBM cake to attain a 2D binary image (black and white) shown in Figure 6a. Morphology [71] at this stage wasn’t necessary because there was no foreign interference in this analysis. More so, further segmentation was conducted to generate a 3D particle image dispersion or image spacing taking into account SBM cake, and a colour thresholding MATLAB app was launched. SBM cake (actual colour) was imported; a scattered particle spacing is shown in Figure 6a, which includes the RGB and HSV. The region of concern is the visually dispersed particles indicating high porosity, which could also be simply identified by the less dense area of both the 3D scattered plot and the 2D binary image. It is worth noting that the study considered converting the actual pixels of the image to micrometres. The RGB-SBM image pixel area was 25570, and the conversion to an area micrometre yielded 1790M2.
A similar segmentation algorithm for the oil-based mud (OBM) was conducted; The image filter cake was imported and segmented using the embedded segmentation app, the RGB image was converted into grayscale using the im2gray function and finally into a 2D binary image using the thresholding function. The threshold intensity of 90 used for the SBM was maintained for the OBM image processing; the colour threshold exposed a 3D dispersity of particles [39] in the OBM filter cake as shown in Figure 6b. Notwithstanding, the entire area pixel of the filter cake was 24,846 whereas the micrometre’s area was 1739M2. However, the analysis for this study focused on the 2D binary image and the 3D scattered particles; the binary image from Figure 6a,b explains, comparatively, that the SBM-binary had considerable amounts of white portions compared to the OBM-binary, which in effect means it had a greater tendency for increased permeability than the black portions, which tends to impede flow. Remarkably, the 3D scattered plots depict more flow accessibility [72] for SBM than that of the OBM; this analysis was based on a standard thresholding intensity of 90 for both filter cakes to avoid computational biases and with the assumption that the cakes taken were of the same image quality. Figure 9 represents the area of void spaces in micrometres for SBM and OBM.
3.3. Flow Index Single-Objective Optimization
The optimal solution with a genetic algorithm for this single extrapolated objective in Eq. 8 based on Eq. 5-7 resulted in x=0.6940 and y=5.0536e-10. Though the computation was satisfactory at the optimum constraints given in Eq. 9 and 10, the objective function was not feasible at a non-decreasing value. As indicated in Figure 10, the visual representation of the optimal solution demonstrated a possible fluid flow at the sharp edges of the graph, meaning that, while oil is possibly recoverable from formation damage, the edges of the ceramic disc would turn to give way to flow at a minimum induced pressure and a longer period. However, the analysis drawn indicates that the distribution of cake particles on the ceramic disc is quite uneven, thereby contributing to the solution of the extrapolated objective function.
Algorithms from Google TensorFlow with emphasis on Keras architectures from Sequential APIs focused on importing the initial extrapolated objective with the available experimental dataset to optimize the flow index. The object-based and other computed solutions were matched with the deep neural network optimal solution to satisfy the best model. Figure 11a and 11b show a scattered flow index response from its target in linear and non-linear regression with probability. The trained and tested data based on the extrapolated model and after several tweaking indicated a final loss of 4.8 given that the trained models were optimized using Adam optimizer at a learning rate of 0.01.
The overall computational flow optimization analyses are shown in Table 3 to aid flow index optimization in filter cake conclusions.
4. Conclusions
This study introduces an automated method for computing rheological properties’ high-frequency data, specifically designed for individuals without programming experience. Utilizing the novel approach of Neural-image-objective processing optimization, this technique predicts, monitors, and verifies the required algorithm. As a result, managers, operators, and engineers gain a deeper understanding of these tools, leading to more precise decision-making. The following conclusions are derived from the computations, as demonstrated in Table 3.
- Neural Networks;
By incorporating the feedforward function into the artificial neural network, the prediction of specific rheological properties was significantly improved. Specifically, when considering PV, AV, and YP, the accuracy reached an impressive 0.99 with 10 and 12 neurons. The non-ANN-FF model for rheological parameters exhibited an even better correlation efficiency of 0.99. The flow index, a property of particular interest for prediction, was focused on and iterated with 10, 12, and 18 neurons. This resulted in an accuracy of 0.97, making it an exceptional parameter compared to other neurons and models, as evidenced in Figure 8b. However, the automation of this number of neuron-driven flow indexes significantly contributed to effective predictive analysis. In addition to MATLAB’s artificial neural network nftool, Google TensorFlow was employed to develop a deep neural network. The goal was to minimize the error function using the Adam algorithm, which ultimately led to a final loss of 4.8. This achievement indicated the successful attainment of the flow index with the study’s objective.
- Image Processing;
Separate investigations into oil and synthetic-based mud filter cakes were conducted. Automating the visual pore structures of the two cakes indicated that the oil-based mud, with an area of 1739M2, had fewer pore spaces as compared to the synthetic-based mud, whose area of pore spaces was 1790M2. There is an acceptable degree of erroneous image binary that emanates from the light intensity captured with the cameras in Figure 6a and 6b. The supposed area of void spaces could have been fairly eliminated or reduced if the images from the cameras used had a considerable amount of light intensity. Despite the pitfalls in processing, the image processing in a further probe revealed that the synthetic-based mud had an effective flow and good permeability. By using this constructive predictive analysis, the computational analysis conducted in this study using an image processing tool from MATLAB carefully reduces the time spent in the laboratory for designing effective mud.
- Objective Optimization;
The single-objective optimization for maximizing filtration volume at this stage of the analysis validated the experimental data, where longer periods (61 hours) were attained to recover oil from the treated filter cakes in the carrier cell. Despite objective approximations being far more considered and having impeded flow at the centre, however, the optimal solution for the simulation was at x = 0.6940 and y = 5.0536e-10. The solution based on a genetic algorithm further concludes that the formation for recovering oil from the treated cakes is damaged. However, it also explains that the composition of the chemical solution for treatment might be at its minimum and suggests improving eco-friendly filter cake wash. The quantities of nanoparticles for the formulation of the filter cake treatment solution could be minimized in grams to reduce the overlaying particles on the existing cake thickness.
In a nutshell, this research offers hybrid non-programming tools from MATLAB to define better fluid rheology and permeability predictions, which are easily accessible at the drilling site. Managers who are challenged with difficult predictive analysis and big data can use these non-programming tools to make and enforce the right decisions. However, further optimization for these findings could be extended for flow index predictions, computing CFD-DEM, and multiple-objective analysis, thereby making other exempted rheological parameters useful.
Author Contributions
Conceptualization, D.D.K.W. and S.I.; methodology, D.D.K.W.; validation, A.S., S.I., and J.K.; formal analysis, D.D.K.W., and S.I.; investigation, D.D.K.W., V.R. and M.Z.M.N.; resources, A.S., J.K., and S.I.; data curation, D.D.K.W.; writing—original draft preparation, D.D.K.W., and S.I; writing—review and editing, V.R., S.I., A.S; visualization, D.D.K.W.; supervision, V.R., S.I., A.S., M.Z.M.N; project administration, A.S., J.K., and S.I.; funding acquisition, A.S., J.K., and S.I. All authors have read and agreed to the published version of the manuscript.
Funding
This research was funded by Nazarbayev University grant numbers 11022021CRP1512 and 08042FD1911, and the APC was funded by 11022021CRP1512.
Data Availability Statement
The main data that supports the findings of this study are openly available in [Nazarbayev University Repository] at http://nur.nu.edu.kz/handle/123456789/6132 and others are duly referenced.
Acknowledgments
We are grateful to Nazarbayev University for providing us with the opportunity to continue sharing our work as part of the Collaborative Research Program (CRP) for the periods of 2022–2024 with project number 11022021CRP1512. We again show our appreciation for the support of the Faculty-Development Competitive Research Grant for 2020-2022 (batch 2) with project number 08042FD1911. Despite these, we wholeheartedly thank the authors cited in this piece of writing for their extensive study that promotes knowledge sharing. Any opinions, findings, conclusions, or recommendations expressed in this material are those of the author(s) and do not necessarily reflect the views of Nazarbayev University.
Conflicts of Interest
The authors hereby declare that the research presented in this paper was not impacted by any known conflicting financial interests or personal connections.
Abbreviations
The following abbreviations are used in this manuscript:
| ANN | Artificial Neural Network |
| DNN | Deep Neural Network |
| CFD | Computation Fluid Dynamic |
| APIs | Application Programming Interfaces |
| API | American Petroleum Institute |
| CC | Coefficient Correlation |
| CV | Coefficient of Variation Interfaces |
| FI | Flow Index |
| GS | Gel Strength |
| PV | Plastic Viscosity |
| AV | Apparent Viscosity |
| YP | Yield Point |
| HSV | Hue saturation value |
| RGB | Red, green, blue |
| OBM | Oil-based Mud |
| SBM | Synthetic-based Mud |
| GA | Genetic Algorithm |
| SOO | Single Objective Optimization |
References
- AlAwad, M.N.J. A new approach for understanding the mechanism of wellbore strengthening theory. J. of King Saud Uni. Eng. Sci. 2022, 34.1, 67–76. [Google Scholar] [CrossRef]
- Kizayev, T.; Irawan, S.; Khan, J.A.; Khan, S.M.; Cai, B.; Zeb, N.; Wayo, D.D.K. Factors affecting drilling incidents: Prediction of suck pipe by XGBoost model. Energy Reports 2023, 9, 270–279. [Google Scholar] [CrossRef]
- Salehi, S.; Ghalambor, A.; Saleh, F.K.; Jabbari, H.; Hussmann, S. Study of filtrate and mud cake characterization in HPHT: Implications for formation damage control. In Proceedings of the SPE European Formation Damage Conference and Exhibition, Budapest, Hungary, June 2015. [Google Scholar] [CrossRef]
- Duru, U.I.; Wayo, D.D.K.; Ogu, R.; Cyril, C.; Nnani, H. Computational analysis for optimum multiphase flowing bottom-hole pressure prediction. Transylvanian Review 2022, 30, 2. [Google Scholar]
- Galkin, V.I.; Martyushev, D.A.; Ponomareva, I.N.; Chernykh, I.A. Developing features of the near-bottomhole zones in productive formations at fields with high gas saturation of formation oil. J. of Mining Inst. 2021, 249, 386–392. [Google Scholar] [CrossRef]
- Aftab, A.; Ali, M.; Arif, M.; Chernykh, I.A. Influence of tailor-made TiO2/API bentonite nanocomposite on drilling mud performance: Towards enhanced drilling operations. App. Clay Sci. 2020, 199, 105862. [Google Scholar] [CrossRef]
- Liu, N.; Zhang, D.; Gao, H.; Hu, Y.; Duan, L. Real-time measurement of drilling fluid rheological properties: A review. Sensors 2021, 21.11, 3592. [Google Scholar] [CrossRef]
- Husin, H.; Elraies, K.A.; Choi, H.J.; Aman, Z. Influence of graphene nanoplatelet and silver nanoparticle on the rheological properties of water-based mud. App. Sci. 2018, 8.8, 1386. [Google Scholar] [CrossRef]
- Beg, M.; Kumar, P.; Choudhary, P.; Sharma, S. Effect of high temperature ageing on TiO2 nanoparticles enhanced drilling fluids: A rheological and filtration study. Upst. Oil and Gas Tech. 2020, 5, 100019. [Google Scholar] [CrossRef]
- Murtaza, M.; Alarifi, S.A.; Kamal, M.S.; Onaizi, S.A.; Al-Ajmi, M.; Mahmoud, M. Experimental investigation of the rheological behavior of an oil-based drilling fluid with rheology modifier and oil wetter additives. Molecules 2021, 26.1, 4877. [Google Scholar] [CrossRef]
- Candler, J.E.; Rushing, J.H.; Leuterman, A.J.J. Synthetic-based mud systems offer environmental benefits over traditional mud systems. In Proceedings of the SPE/EPA Exploration and Production Environmental Conference, San Antonio, Texas, March 1993; Abstract Number (SPE-25993-MS). [Google Scholar] [CrossRef]
- Sayindla, S.; Lund, B.; Ytrehus, J.D.; Saasen, A. Hole-cleaning performance comparison of oil-based and water-based drilling fluids. J. of Petro. Sci. and Eng. 2017, 159, 49–57. [Google Scholar] [CrossRef]
- Ay, A.; Dogan, H.A.; Sonmez, A. Drilling Fluids Project Engineering Guidance and Most Common Fluids Related Challenges for Deepwater and HPHT Offshore Wells. In Proceedings of the Offshore Technology Conference, Virtual and Houston, Texas, August 2021. Abstract Number (OTC-31179-MS). [Google Scholar] [CrossRef]
- Fink, J. Water-based chemicals and technology for drilling, completion, and workover fluids, 1st ed.; Gulf Prof. Pub.: Houston, Texas, USA, 2015. [Google Scholar] [CrossRef]
- Caenn, R.; Chillingar, G.V. Drilling fluids: State of the Art. J. of Petro. Sci. and Eng. 1996, 14.3-4, 221–230. [Google Scholar] [CrossRef]
- Fadairo, A.; Ling, K.; Rasouli, V.; Adelakun, A.; Tomomewo, O. An improved hydraulics model for aerated fluid underbalanced drilling in vertical wells. Upst. Oil and Gas Tech. 2020, 5, 100009. [Google Scholar] [CrossRef]
- Growcock, F.B.; Andrews, S.L.; Frederick, T.P. Physicochemical properties of synthetic drilling fluids. In Proceedings of the IADC/SPE Drilling Conference, Dallas, Texas, February 1994. Abstract Number (SPE-27450-MS). [Google Scholar] [CrossRef]
- Martyushev, D.A.; Govindarajan, S.K. Development and study of a visco-elastic gel with controlled destruction times for killing oil wells. J. of King Saud Uni. Eng. Sci. 2022, 34.7, 408–415. [Google Scholar] [CrossRef]
- Alsabaa, A.; Gamal, H.; Elkatatny, S.; Abdelraouf, Y. Machine Learning Model for Monitoring Rheological Properties of Synthetic Oil-Based Mud. ACS omega 2022, 7.18, 15603–15614. [Google Scholar] [CrossRef] [PubMed]
- Sedaghat, A.; Omar, M.A.A.; Damrah, S.; Gaith, M. Mathematical modelling of the Marsh Funnel for measuring rheological properties of drilling nanofluids for energy-efficient environment. In Proceedings of the International Conference on Ecological Vehicles and Renewable Energies (EVER), 2016. J. Energy Tech. 2016, 1, 1–12. [Google Scholar]
- Kumar, V.; Guria, C. An improved shear rate estimation using rotating coaxial cylinder Fann viscometer. J. of Pet. Sci. and Eng. 2013, 110, 162–168. [Google Scholar] [CrossRef]
- Oort, E.V.; Lee, J.; Friedheim, J.; Toups, B. New flat-rheology synthetic-based mud for improved deepwater drilling. In Proceedings of the SPE Annual Technical Conference and Exhibition, Houston, Texas, September 2004. Abstract Number (SPE-90987-MS). [Google Scholar] [CrossRef]
- Lyros, E.; Kostelecky, J.; Plicka, V.; Vratislav, F.; Sokos, E.; Nikolakopoulos, K. Detection of tectonic and crustal deformation using GNSS data processing: The case of ppgnet. Civ Eng J 2021, 7.1, 14–23. [Google Scholar] [CrossRef]
- Goliatt, L.; Mohammad, R.S.; Abba, S.I.; Yaseen, Z.M. Development of hybrid computational data-intelligence model for flowing bottom-hole pressure of oil wells: New strategy for oil reservoir management and monitoring. Fuel 2023, 350, 128623. [Google Scholar] [CrossRef]
- Silva, R.O.; Saporetti, C.M.; Abba, S.I.; Yaseen, Z.M.; Pereira, E.; Goliatt, L. An approach for total organic carbon prediction using convolutional neural networks optimized by differential evolution. Neural Comp. and App. 2023, xxx, 1–15. [Google Scholar] [CrossRef]
- Balhoff, M.T.; Lake, L.W.; Bommer, P.M.; Lewis, R.E.; Weber, M.J.; Calderin, J.M. Rheological and yield stress measurements of non-Newtonian fluids using a Marsh Funnel. J. of pet. Sci. and Eng. 2011, 77.3-4, 393–402. [Google Scholar] [CrossRef]
- Sedaghat, A. Rheological and yield stress measurements of non-Newtonian fluids using a Marsh Funnel. J. of pet. Sci. and Eng. 2017, 156, 896–916. [Google Scholar] [CrossRef]
- Qamar, A.; Kerdi, S.; Amin, N.; Zhang, X.; Vrouwenvelder, J.; Ghaffour, N. A deep neural networks framework for in-situ biofilm thickness detection and hydrodynamics tracing for filtration systems. Sep. and Puri. Techn. 2022, 301, 121959. [Google Scholar] [CrossRef]
- Elkatatny, S. Real-time prediction of rheological parameters of KCL water-based drilling fluid using artificial neural networks. Arab. J. for Sci. and Eng. 2017, 42, 1655–1665. [Google Scholar] [CrossRef]
- Elkatatny, S. Real-time prediction of the rheological properties of water-based drill-in fluid using artificial neural networks. Sustainability 2019, 11.18, 5008. [Google Scholar] [CrossRef]
- Elkatatny, S. New approach to optimize the rate of penetration using artificial neural network. Arab. J. for Sci. and Eng. 2018, 43, 6297–6304. [Google Scholar] [CrossRef]
- Souza, D.P.; Martinho, A.D.; Rocha, C.C.; Christo, E.D.S.; Goliatt, L. Hybrid particle swarm optimization and group method of data handling for short-term prediction of natural daily streamflows. Modeling Earth Syst. and Env. 2022, 8.4, 5743–5759. [Google Scholar] [CrossRef]
- Kabir, A.; Gamwo, I.K. Filter cake formation on the vertical well at high temperature and high pressure: computational fluid dynamics modeling and simulations. J. of Pet. and Gas Eng. 2011, 2.7, 146–164. [Google Scholar]
- Falahati, N.; Chellappah, K.; Routh, A.F. Assessing filter cake strength via discrete element method simulations. Chem. Eng. Res. and Design 2021, 173, 215–223. [Google Scholar] [CrossRef]
- Israil, M.; Ashraf, M.; Fahim, M.; Rehan, R.; Khan, S.W.; Hussain, S. Evaluation of bentonite mixed indigenous clays for development of clay liners. Civil Eng. J. 2020, 6, 24–32. [Google Scholar] [CrossRef]
- Wayo, D.D.K.; Irawan, S.; Satyanaga, A.; Kim, J. Data-Driven Fracture Morphology Prognosis from High Pressured Modified Proppants Based on Stochastic-Adam-RMSprop Optimizers; tf. NNR Study. Big Data and Cogn. Comp. 2023, 7.2, 57. [Google Scholar] [CrossRef]
- Dias, R.C.C.; Santos, L.S. Analysis of single and multi-objective optimization of the pultrusion process. Mat. Today Com. 2023, 35, 105677. [Google Scholar] [CrossRef]
- Liu, J.; Benyahia, B. Single and Multi-Objective Superstructure Optimization of an Integrated Continuous Multistage Reaction-Crystallization-Filtration Process with Recycles. Comp. Aided Chem. Eng. 2023, 52, 667–672. [Google Scholar] [CrossRef]
- Wu, S.; Zhu, W.; Chen, Y.; Liu, J.; Shu, S. Pore characteristics of cake and its effect on cake filtration. Sep. Sci. and Tech. 2021, 56.4, 789–799. [Google Scholar] [CrossRef]
- Kato, K.; Yamamoto, K.; Ogawa, N. Proposal for new image processing application for taste evaluation of sponge cake using 3D range sensor. Sep. Sci. and Tech. 2008, 56.2, 63–67. [Google Scholar] [CrossRef]
- Rabbani, A.; Ayatollahi, S.; Kharrat, R.; Dashti, N. Estimation of 3-D pore network coordination number of rocks from watershed segmentation of a single 2-D image. Adv. in Water Res. 2016, 94, 264–277. [Google Scholar] [CrossRef]
- Jahari, A.F.; Shafian, S.R.M.; Husin, H.; Razali, N.; Irawan, S. Quantification method of suspended solids in micromodel using image analysis. J. of Pet. Exp. and Prod. Tech. 2021, 11, 2271–2286. [Google Scholar] [CrossRef]
- Habib, S.; Khan, I.; Aladhadh, S.; Islam, M.; Khan, S. External Features-Based Approach to Date Grading and Analysis with Image Processing. Emerg. Sci. J. 2022, 6.4, 694–704. [Google Scholar] [CrossRef]
- Hernandez, M.; Quissak, F.; Córdova, M.; Torres, J. Synthetic Base Drilling Fluid Applications Under Extreme Pressure and Temperature Conditions in Gulf of Mexico. In Proceedings of the SPE Latin American and Caribbean Petroleum Engineering Conference, Virtual, July 2020; Abstract Number (SPE-198969-MS). [CrossRef]
- Young, S.; Friedheim, J.; Lee, J.; Prebensen, O.I. A new generation of flat rheology invert drilling fluids. In Proceedings of the SPE Oil and Gas India Conference and Exhibition, Mumbai, India, March 2012; Abstract Number (SPE-154682-MS). [Google Scholar] [CrossRef]
- Herzhaft, B.; Peysson, Y.; Isambourg, P.; Delepoulle, A.; Toure, A. Rheological properties of drilling muds in deep offshore conditions. In Proceedings of the SPE/IADC Drilling Conference, Amsterdam, Netherlands, February 2001; Abstract Number (SPE-67736-MS). [Google Scholar] [CrossRef]
- Primary Evaluation of Filter Cake Breaker in Biodegradable Synthetic-Based Drill-In-Fluid. Available online: URL: https://nur.nu.edu.kz/handle/123456789/6132 (accessed on 23 January, 2024).
- Wang, Y.; Salehi, S. Application of real-time field data to optimize drilling hydraulics using neural network approach. J. of Energy Res. Tech. 2015, 137.6, 062903. [Google Scholar] [CrossRef]
- Pitt, M.J. The Marsh funnel and drilling fluid viscosity: a new equation for field use. SPE Dril. and Comp. 2000, 15.01, 3–6. [Google Scholar] [CrossRef]
- Lippmann, R. An introduction to computing with neural nets. IEEE Assp mag 1987, 4.2, 4–22. [Google Scholar] [CrossRef]
- Agwu, O.E.; Akpabio, J.U.; Alabi, S.B.; Dosunmu, A. Artificial intelligence techniques and their applications in drilling fluid engineering: A review. J. of Pet. Sci. and Eng. 2018, 167, 300–315. [Google Scholar] [CrossRef]
- Okrajni, S.S.; Azar, J.J. The effects of mud rheology on annular hole cleaning in directional wells. SPE Drill. Eng. 1986, 1.04, 297–308. [Google Scholar] [CrossRef]
- Coussot, P.; Bertrand, F.; Herzhaft, B. Rheological behavior of drilling muds, characterization using MRI visualization. Oil & gas sci. and tech. 2006, 59.1, 23–29. [Google Scholar] [CrossRef]
- Maglione, R.; Robotti, G.; Romagnoli, R. In-situ rheological characterization of drilling mud. SPE J. 2000, 5.04, 377–386. [Google Scholar] [CrossRef]
- Guria, C.; Kumar, R.; Mishra, P. Rheological analysis of drilling fluid using Marsh Funnel. J. of Pet. Sci. and Eng. 2013, 105, 62–69. [Google Scholar] [CrossRef]
- Al-Ibrahim, H.; AlMubarak, T.; Almubarak, M.; Osode, P.; Bataweel, M.; Al-Yami, A. Chelating agent for uniform filter cake removal in horizontal and multilateral wells: laboratory analysis and formation damage diagnosis. In Proceedings of the SPE Saudi Arabia Section Annual Technical Symposium and Exhibition, Al-Khobar, Saudi Arabia, April 2015; Abstract Number (SPE-177982-MS). [Google Scholar] [CrossRef]
- Parmiggiani, F.; Moctezuma-Flores, M.; Wadhams, P.; Aulicino, G. Image processing for pancake ice detection and size distribution computation. Int. J. of rem. sens. 2019, 40.9, 3368–3383. [Google Scholar] [CrossRef]
- Yang, W. Finite element model of concrete material based on CT image processing technology. J. of Vis. Com. and Image Rep. 2019, 64, 102631. [Google Scholar] [CrossRef]
- Yu, F.; Sun, D.; Hu, M.; Wang, J. Study on the pores characteristics and permeability simulation of pervious concrete based on 2D/3D CT images. Const. and Build. Mat. 2019, 200, 687–702. [Google Scholar] [CrossRef]
- Xu, S.; Chang, C.; Liu, Y. A novel image compression technology based on vector quantisation and linear regression prediction. Conn. Sci. 2021, 33.2, 219–236. [Google Scholar] [CrossRef]
- Yang, D.; Du, Y.; Yao, H.; Bao, L. Image semantic segmentation with hierarchical feature fusion based on deep neural network. Conn. Sci. 2022, 34.1, 1772–1784. [Google Scholar] [CrossRef]
- Russell, B.C.; Torralba, A.; Murphy, K.P.; Freeman, W.T. LabelMe: a database and web-based tool for image annotation. Int. J. of comp. v. 2008, 77, 157–173. [Google Scholar] [CrossRef]
- Xu, M.; Zhu, J.; Lv, P.; Zhou, B.; Tappen, M.F.; Ji, R. Learning-based shadow recognition and removal from monochromatic natural images. IEEE Trans. on Image Process. 2017, 26.12, 5811–5824. [Google Scholar] [CrossRef]
- Xu, M.; Li, M.; Xu, W.; Deng, Z.; Yang, Y.; Zhou, K. Interactive mechanism modeling from multi-view images. ACM Trans. on Graph. 2016, 35.6, 1–13. [Google Scholar] [CrossRef]
- Shen, X.; Maa, J.P. A camera and image processing system for floc size distributions of suspended particles. Marine Geo. 2016, 376, 132–146. [Google Scholar] [CrossRef]
- Wayo, D.D.K.; Irawan, S.; Khan, J.A.; Fitrianti. Validation for Assessing the Repercussions of Filter Cake Breakers; EDTA and SiO2 on Filter Cake Return Permeability. App. Art. Intel. 2022, 36.1, 2112551. [Google Scholar] [CrossRef]
- Puderbach, V.; Schmidt, K.; Antonyuk, S. A coupled CFD-DEM model for resolved simulation of filter cake formation during solid-liquid separation. Processes 2021, 9.5, 826. [Google Scholar] [CrossRef]
- Ripperger, S.; Gösele, W.; Alt, C.; Loewe, T. Filtration, 1. Fundamentals. Ullmann’s 2013,.
- Junk, M.; Yong, W. Rigorous Navier-Stokes limit of the lattice Boltzmann equation. Asymp. Analy. 2003, 35.2, 165–185. https://content.iospress.com/ articles/asymptotic-analysis/asy563.
- A Stoß, M. Mechanical process engineering - particle technology 1, 3rd ed.; Publisher: Springer Berlin, Heidelberg 2008; pp. XI, 499. [Google Scholar] [CrossRef]
- Chu, C.P.; Lee, D.J.; Liu, Z.; Jin, W.H. Morphology of sludge cake at electroosmosis dewatering. Sep. sci. and tech. 2005, 39.6, 1331–1346. [Google Scholar] [CrossRef]
- Chase, G.G.; Willis, M.S. Flow resistance in filter cakes due to air. Sep. sci. and tech. 1991, 26.1, 117–126. [Google Scholar] [CrossRef]
Figure 1.
Computational Framework
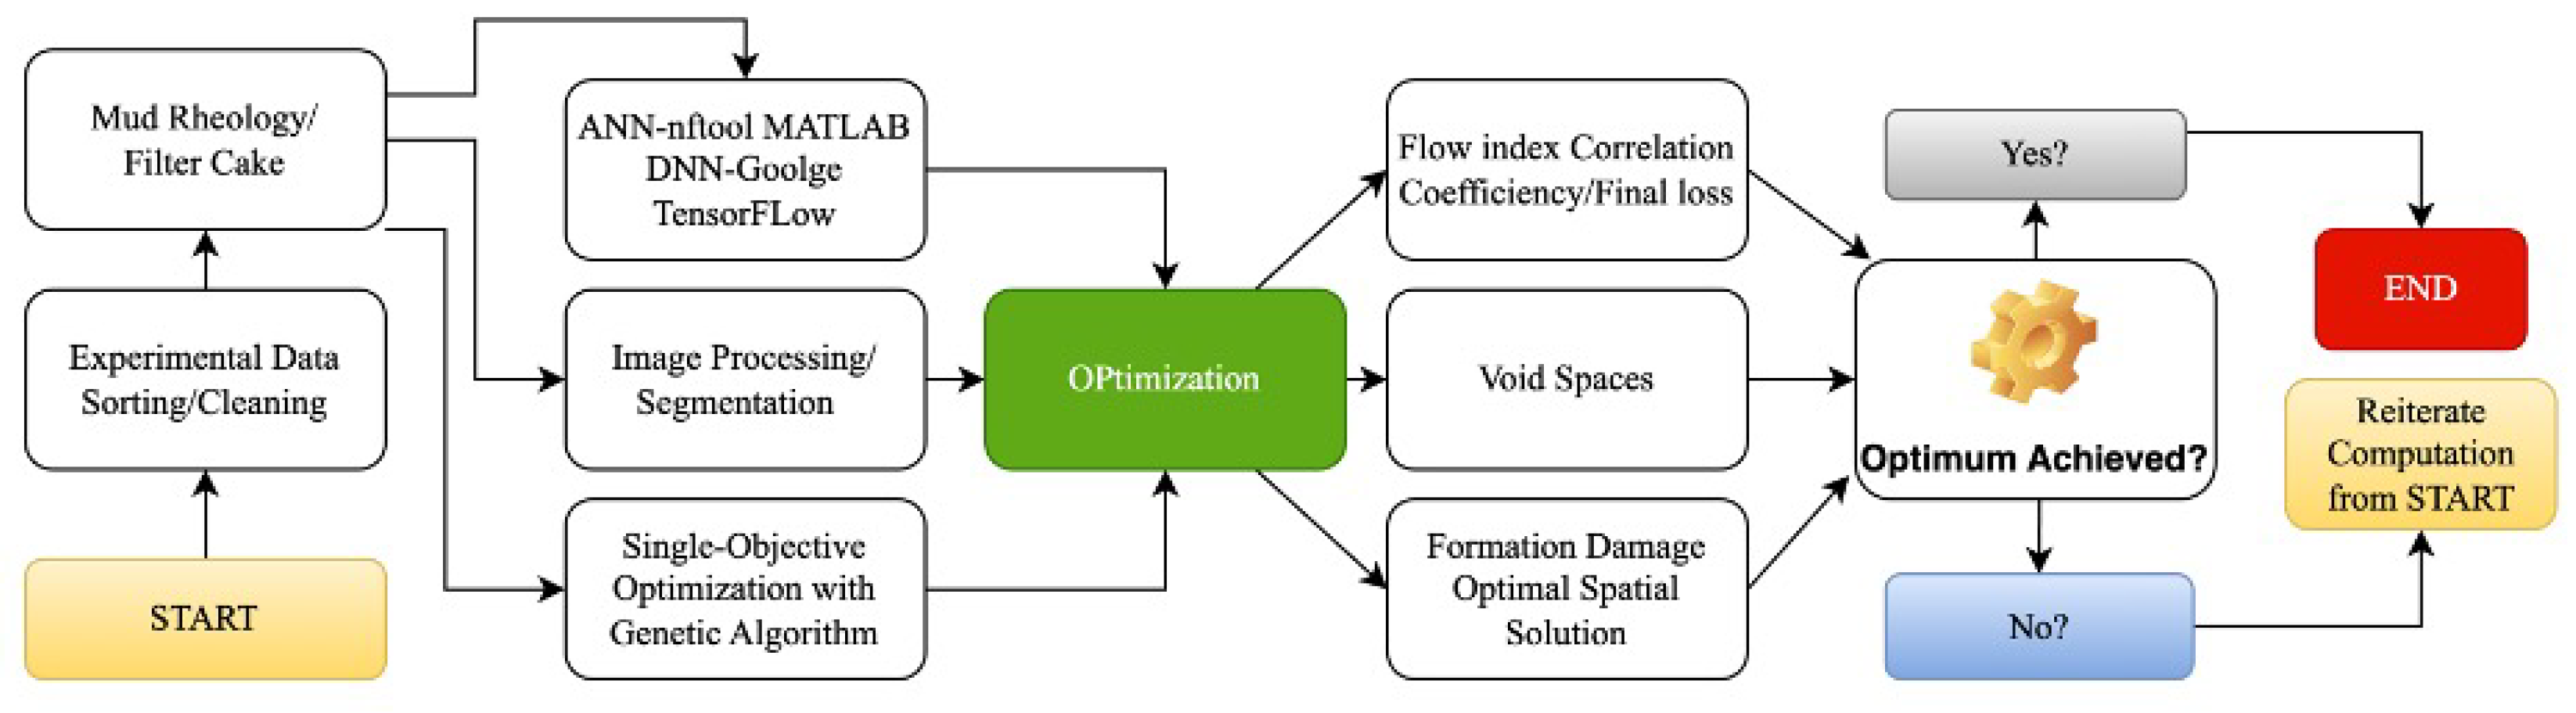
Figure 2.
ANN-FF Correlation Coefficient for respective 10,12,18 hidden neurons; Plastic viscosity, a=0.98819, b=0.98817, c=0.98814, Apparent viscosity, d=0.99956, e=0.99953, f=0.99958; Yield Point, g=0.97813, h=0.97803, i=0.97811; Gel Strength (10mins), j=0.86326, k=0.86326, l=0.86326
Figure 2.
ANN-FF Correlation Coefficient for respective 10,12,18 hidden neurons; Plastic viscosity, a=0.98819, b=0.98817, c=0.98814, Apparent viscosity, d=0.99956, e=0.99953, f=0.99958; Yield Point, g=0.97813, h=0.97803, i=0.97811; Gel Strength (10mins), j=0.86326, k=0.86326, l=0.86326
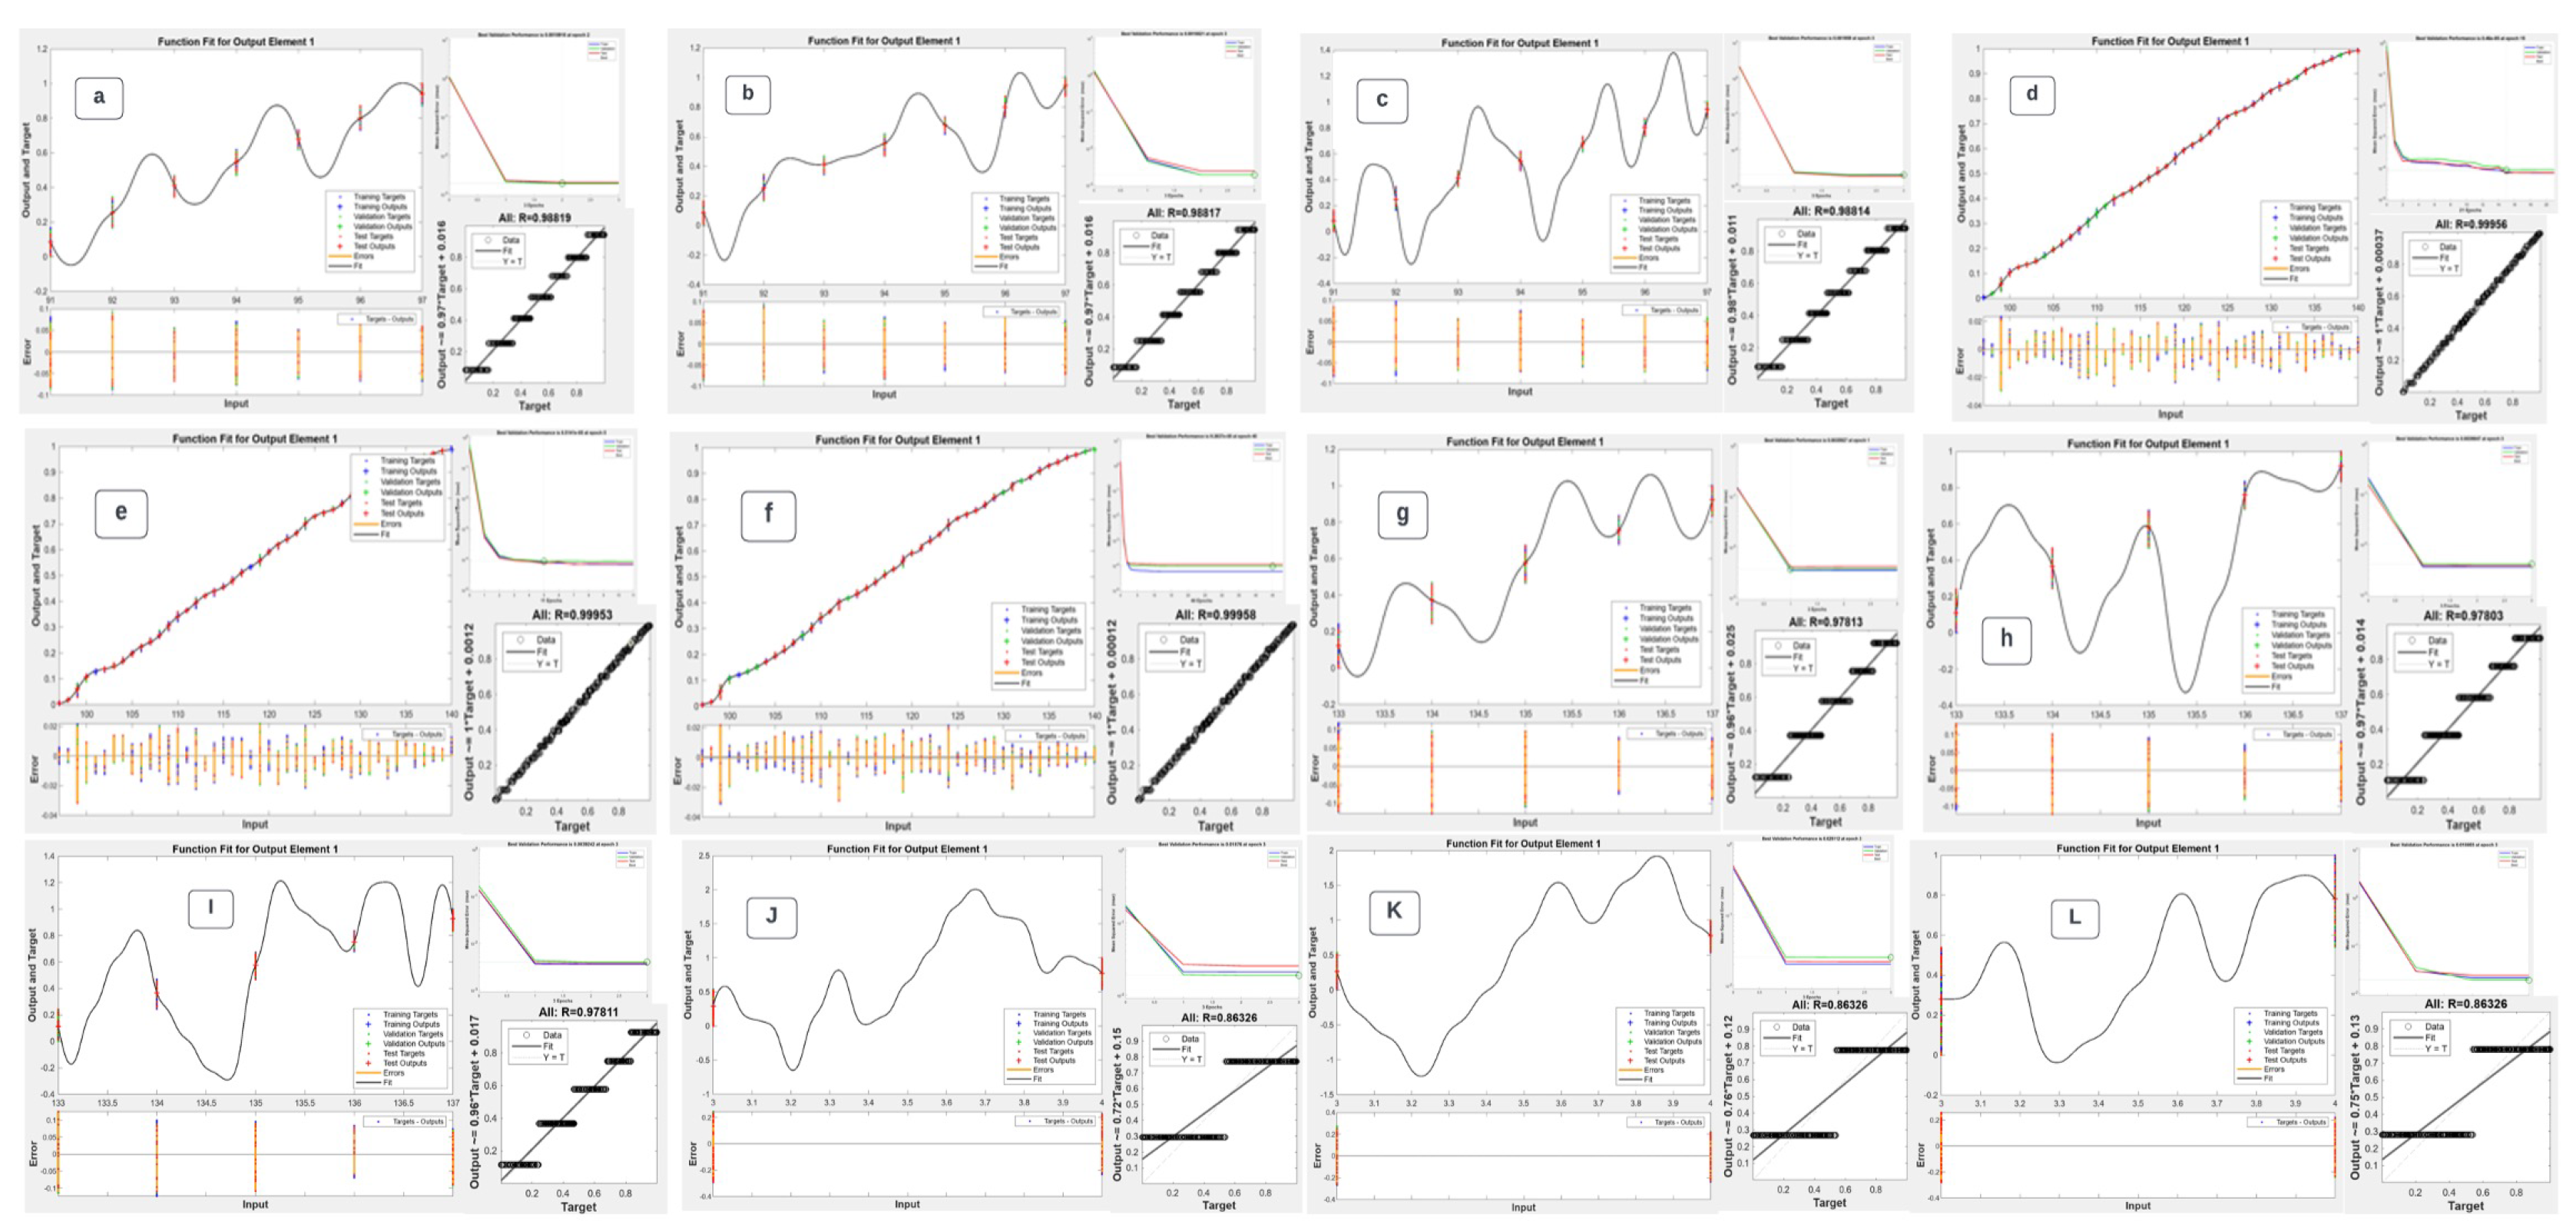
Figure 3.
Non-ANN Correlation Coefficient (a) PV, CC=0.97359, (b) AV, CC=0.99503, (c) YP, CC=0.94969, (d) GS 10mins, CC=0.74471
Figure 3.
Non-ANN Correlation Coefficient (a) PV, CC=0.97359, (b) AV, CC=0.99503, (c) YP, CC=0.94969, (d) GS 10mins, CC=0.74471
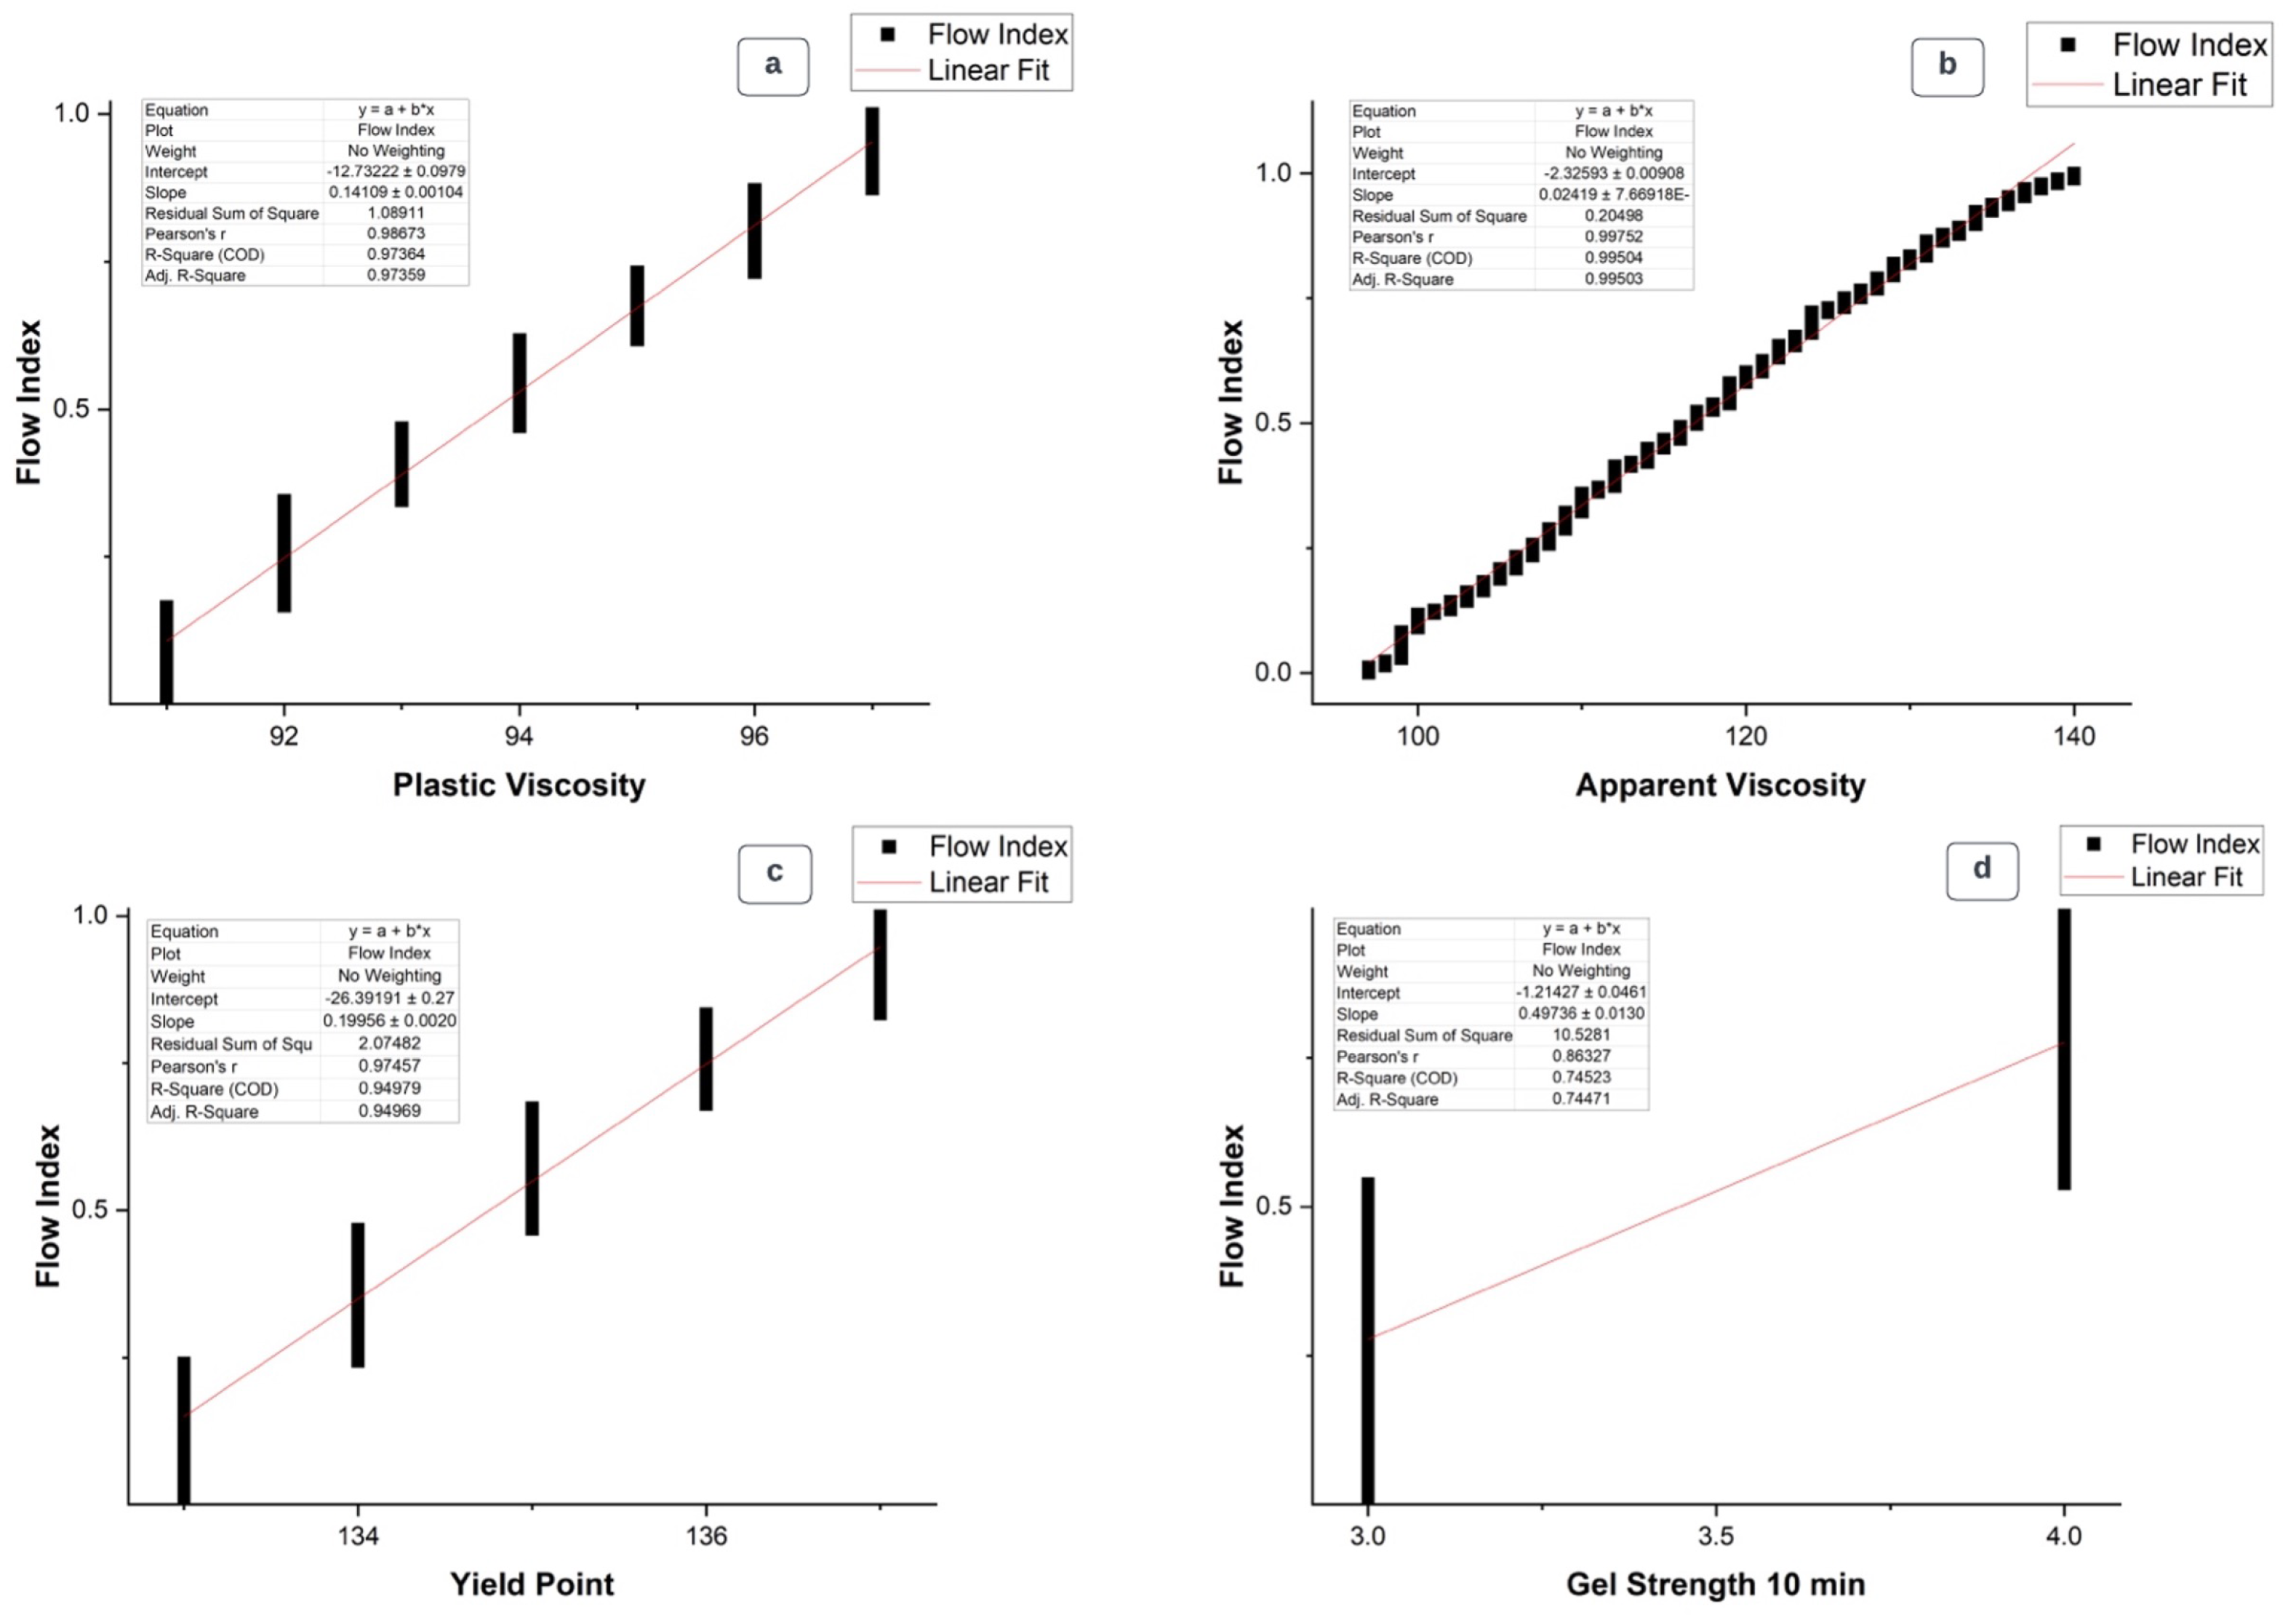
Figure 4.
Images of laboratory filter cakes (a) Synthetic-based Muds (b) Oil-based Muds
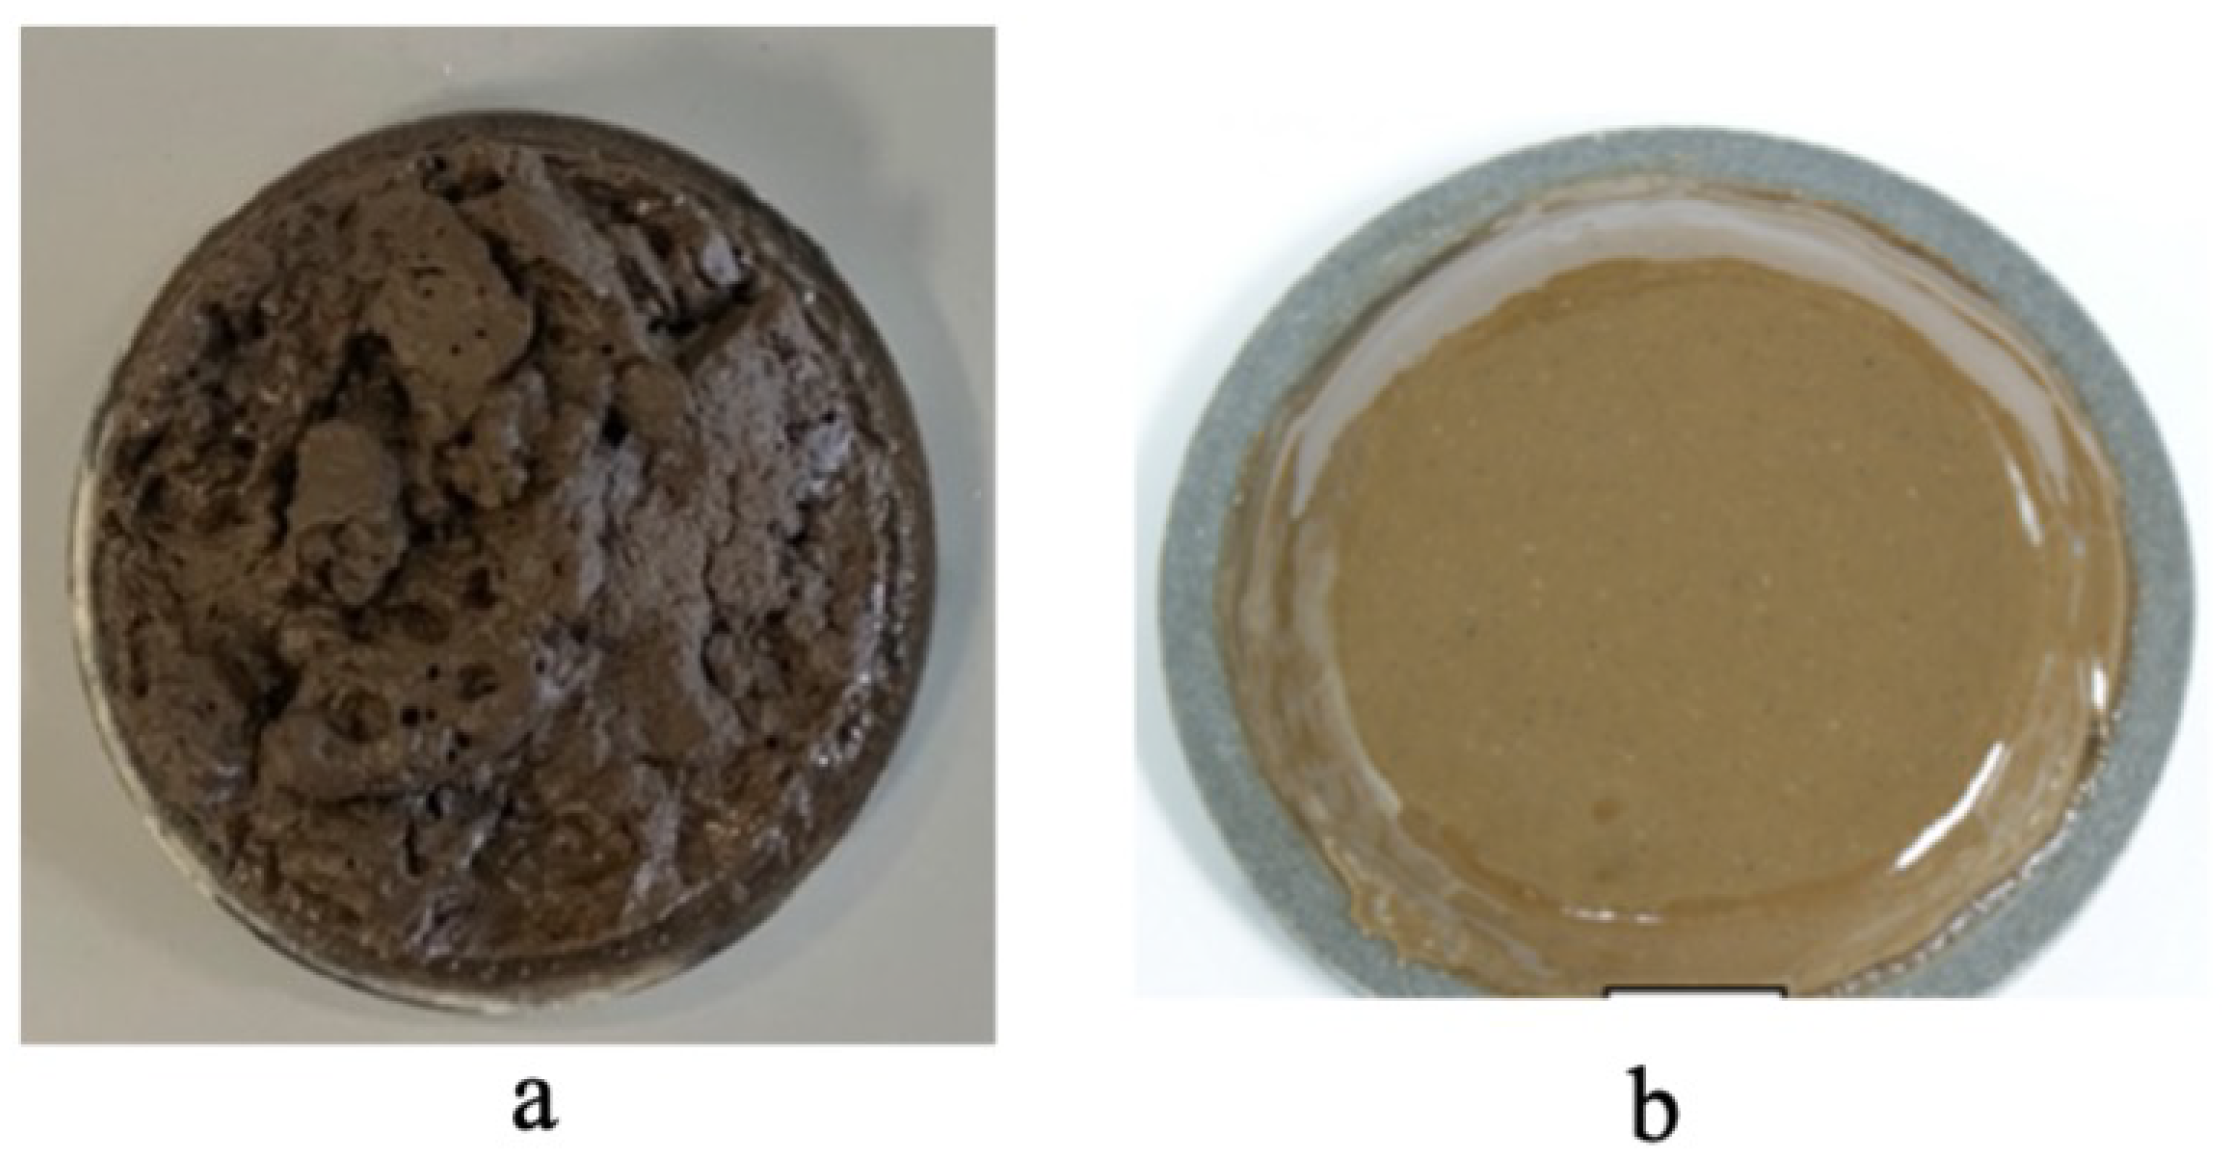
Figure 5.
Flow chart for filter cake image processing
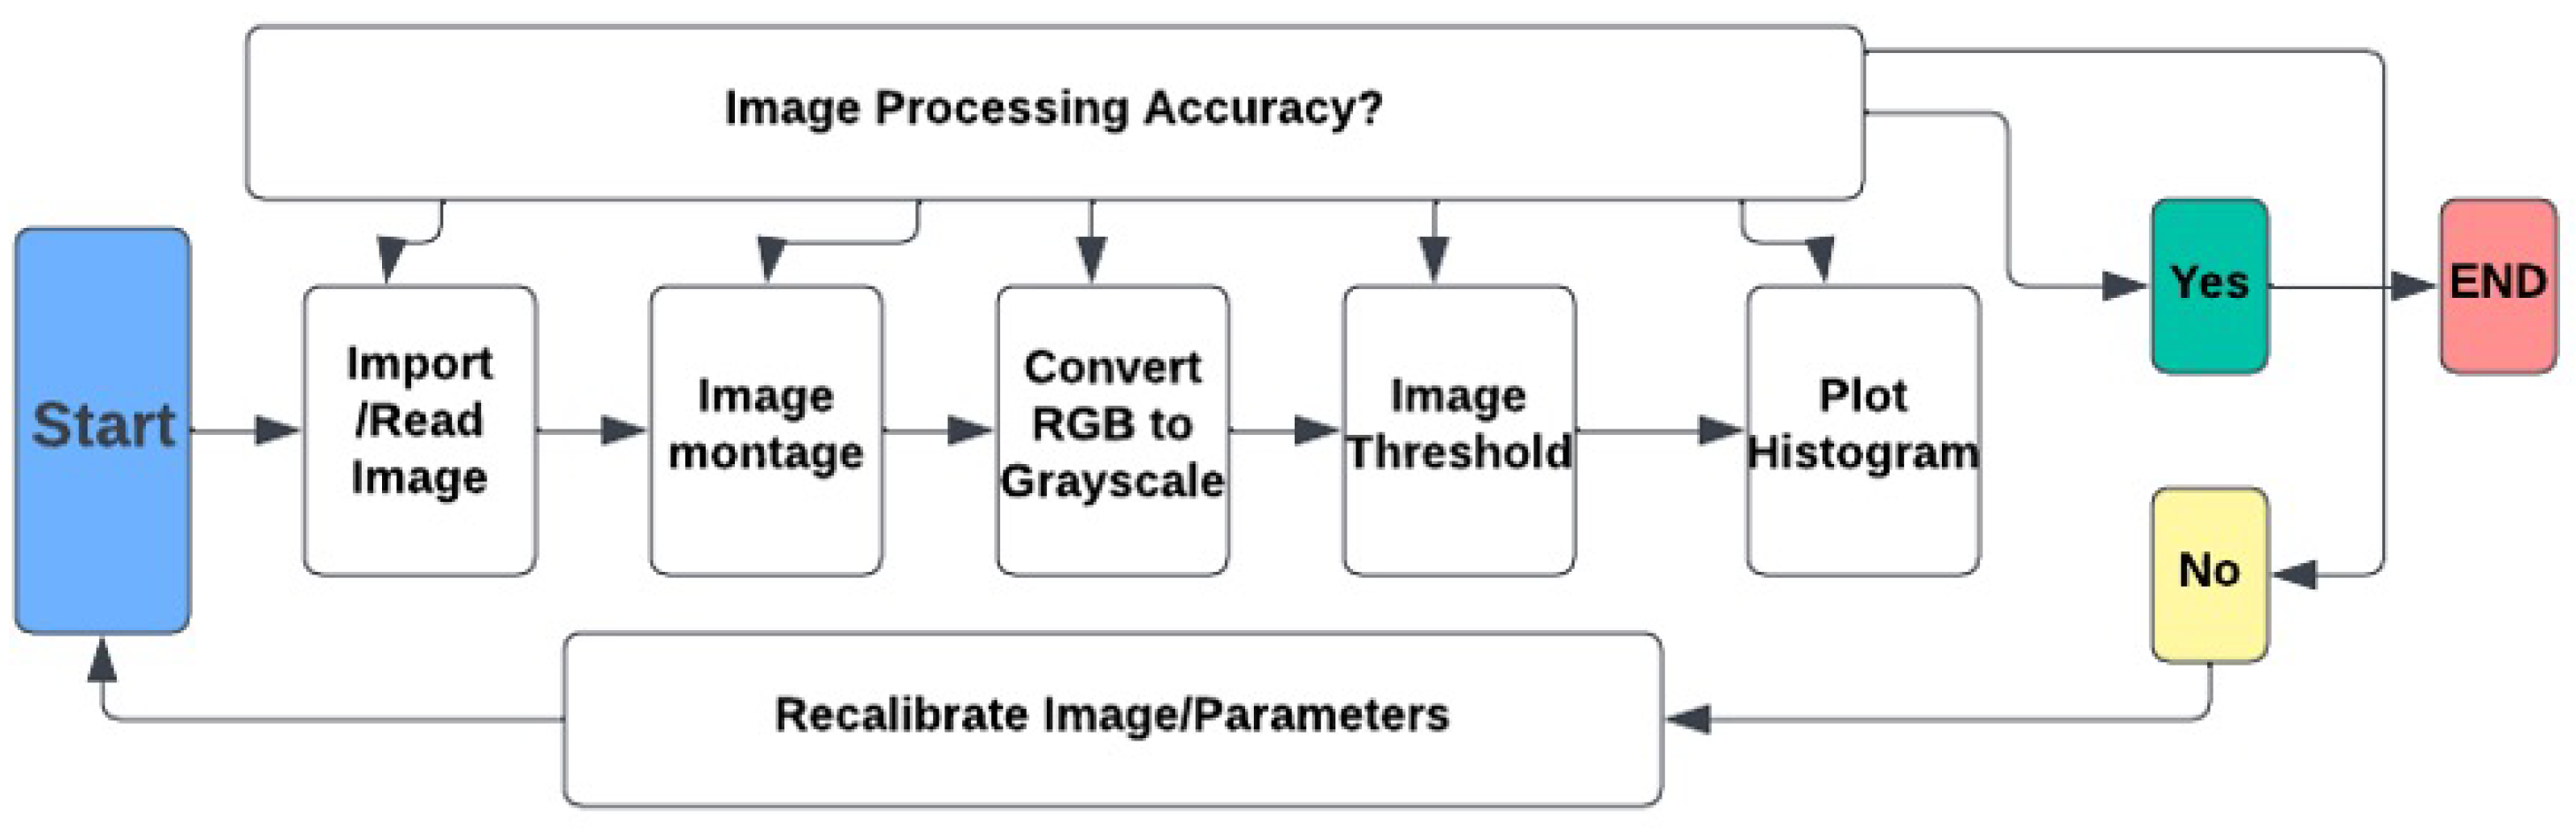
Figure 6.
(a) Synthetic-Based mud filter cake image processing, PA: 1739M2 (b) Oil-Based mud filter cake image processing, PA: 1790M2
Figure 6.
(a) Synthetic-Based mud filter cake image processing, PA: 1739M2 (b) Oil-Based mud filter cake image processing, PA: 1790M2
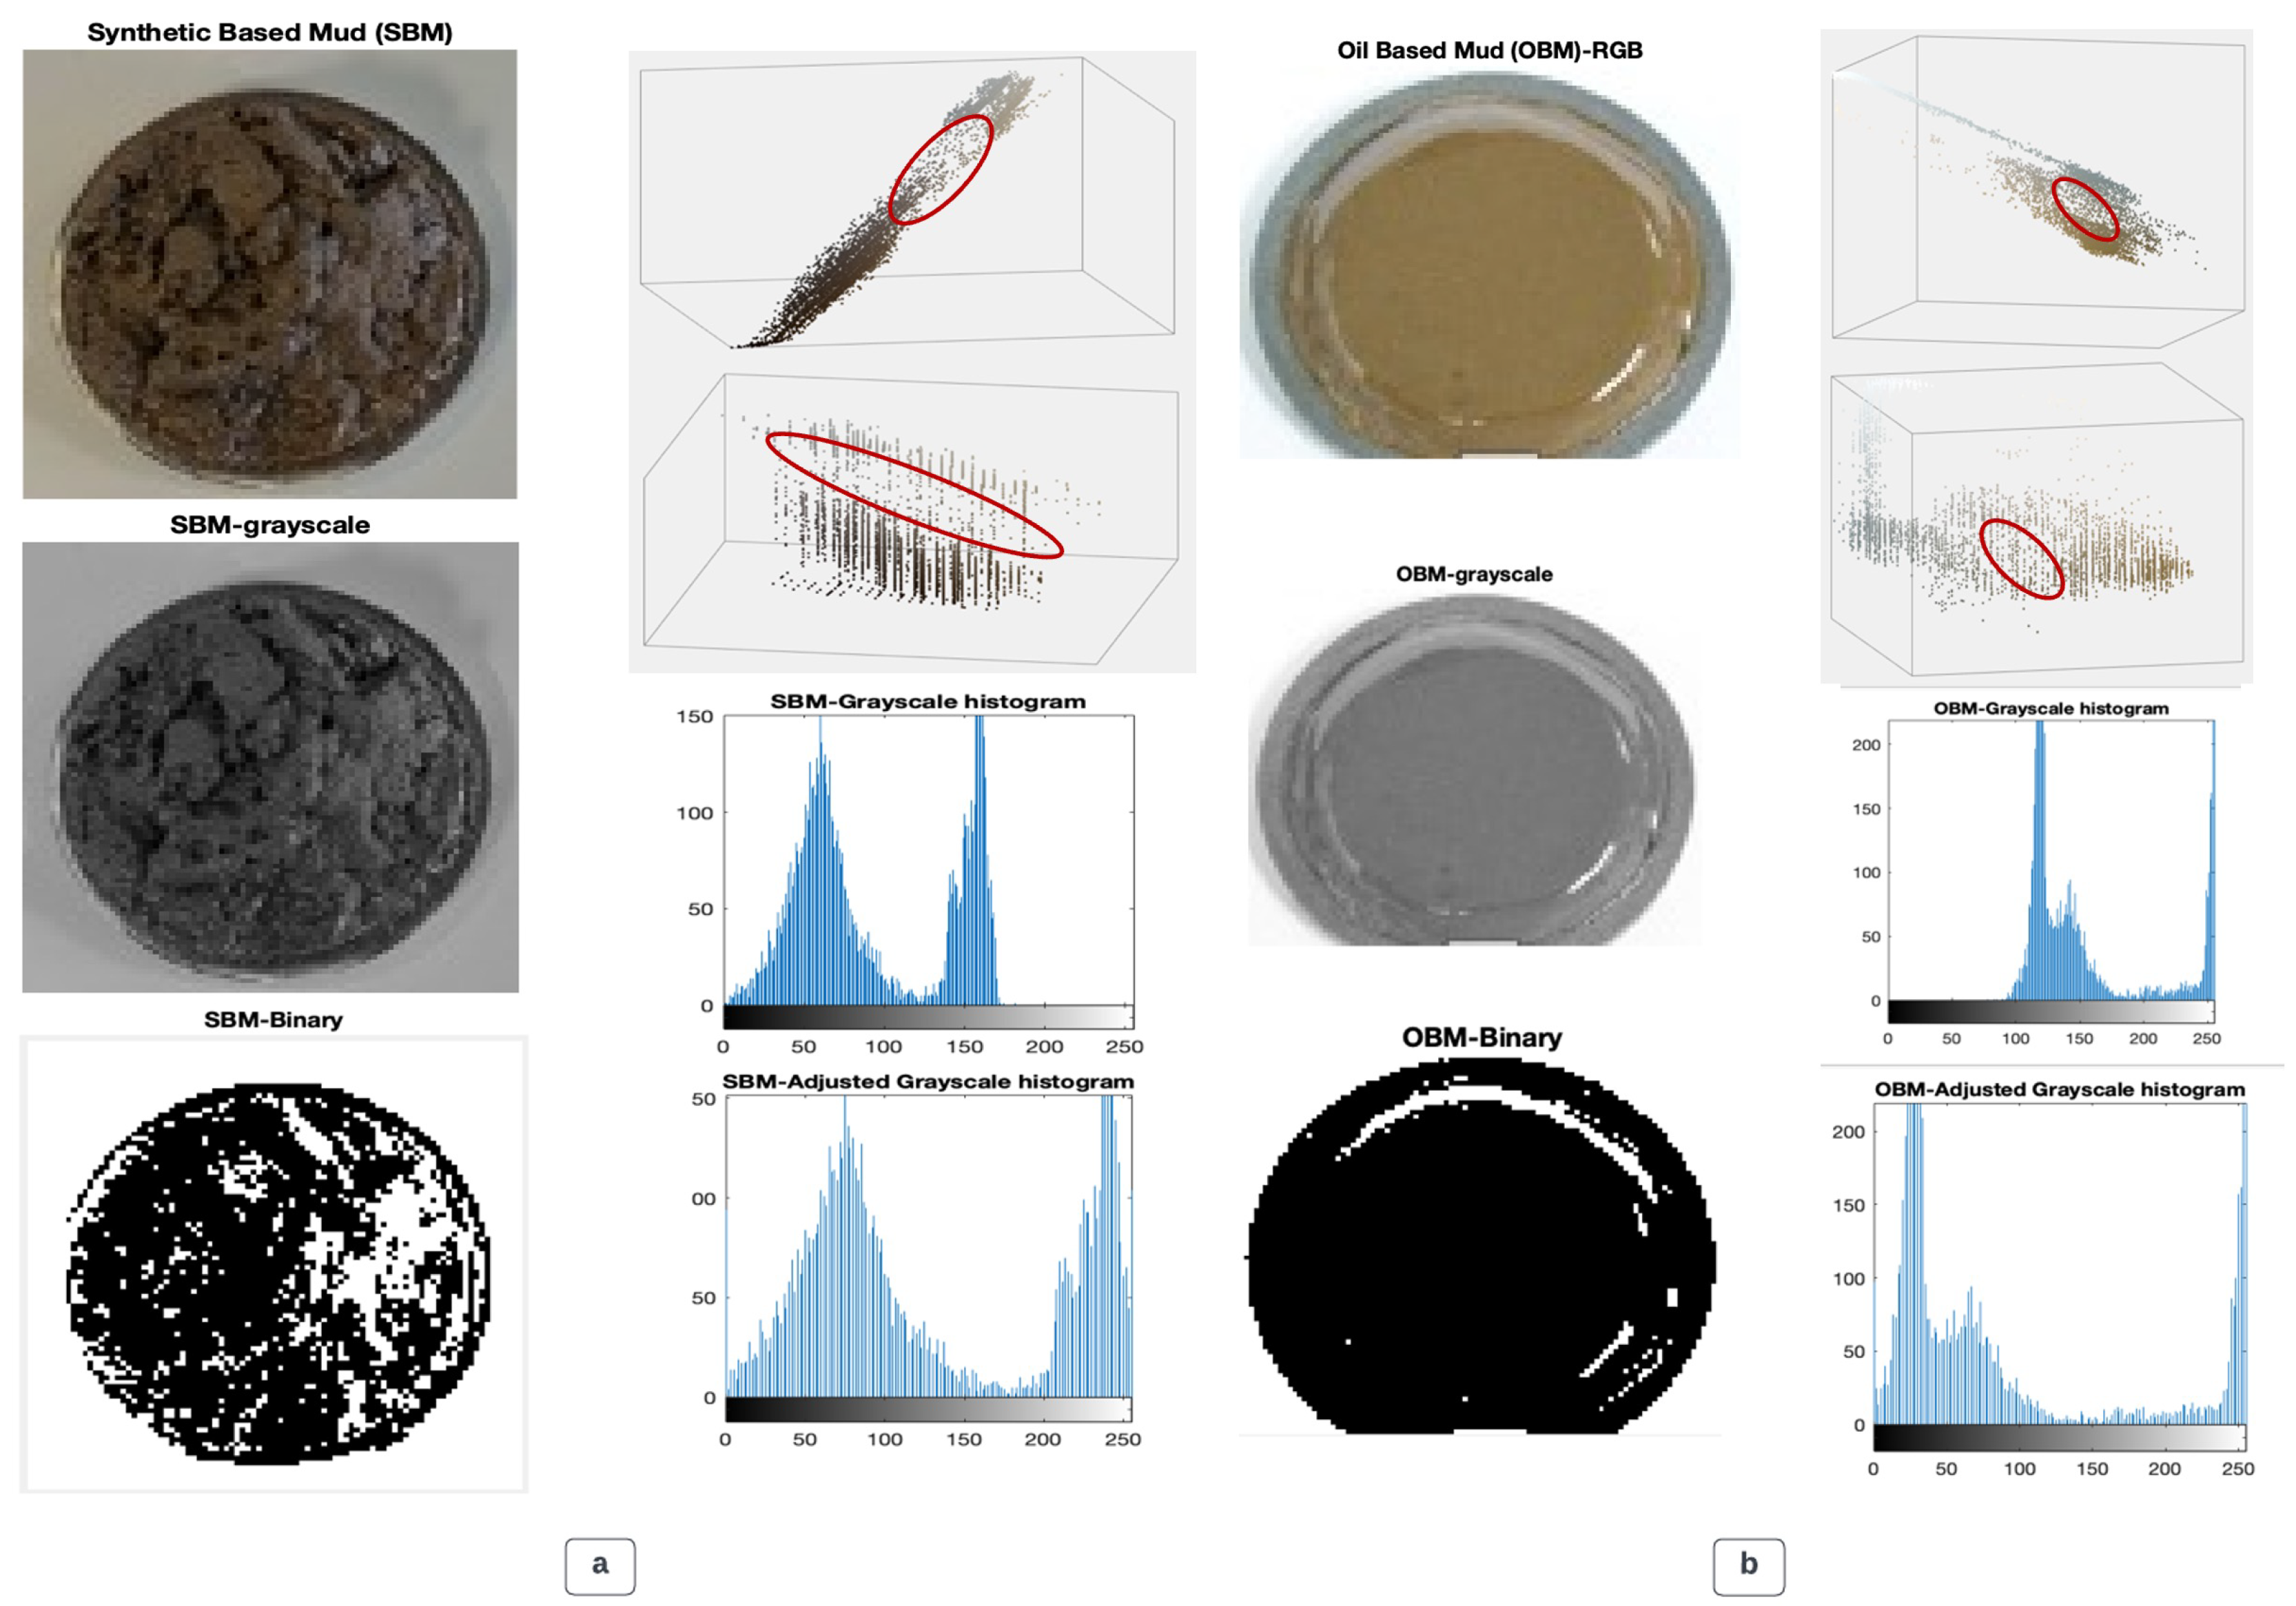
Figure 7.
Monitoring flow index with 3D CFD simulation for filter cake
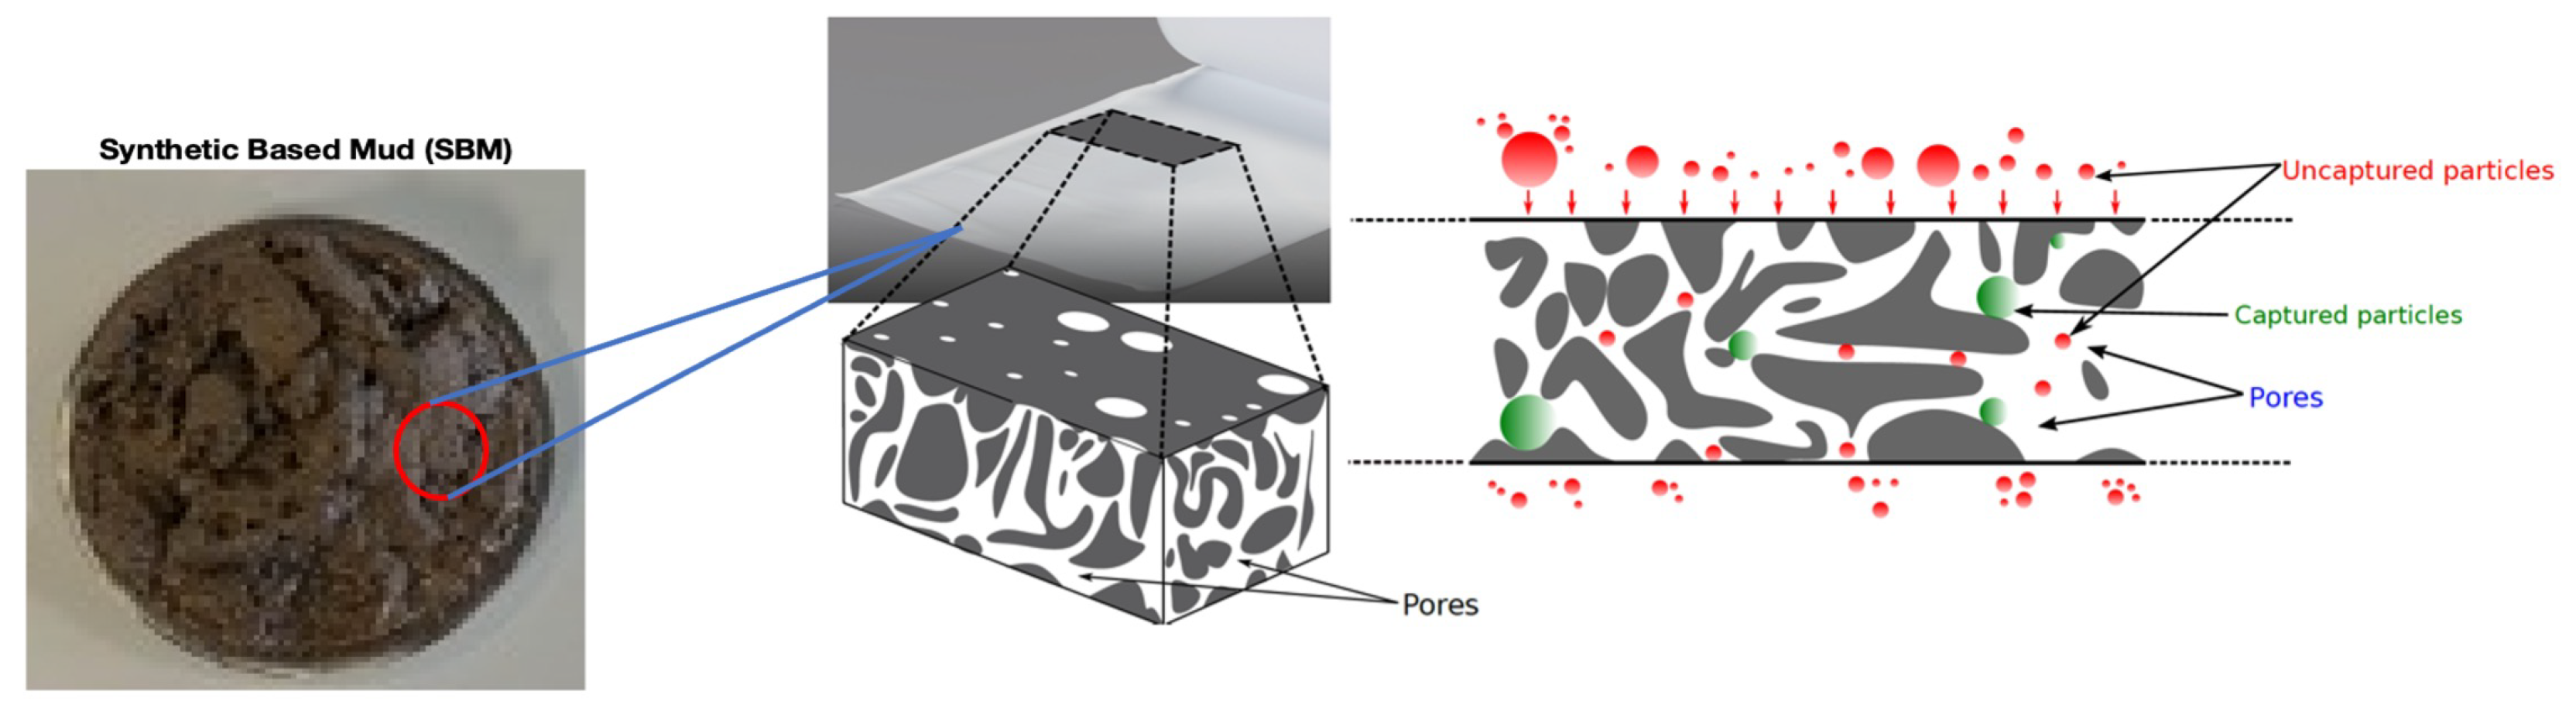
Figure 8.
Flow Index predictive analysis based on (a) Neurons (b) Models
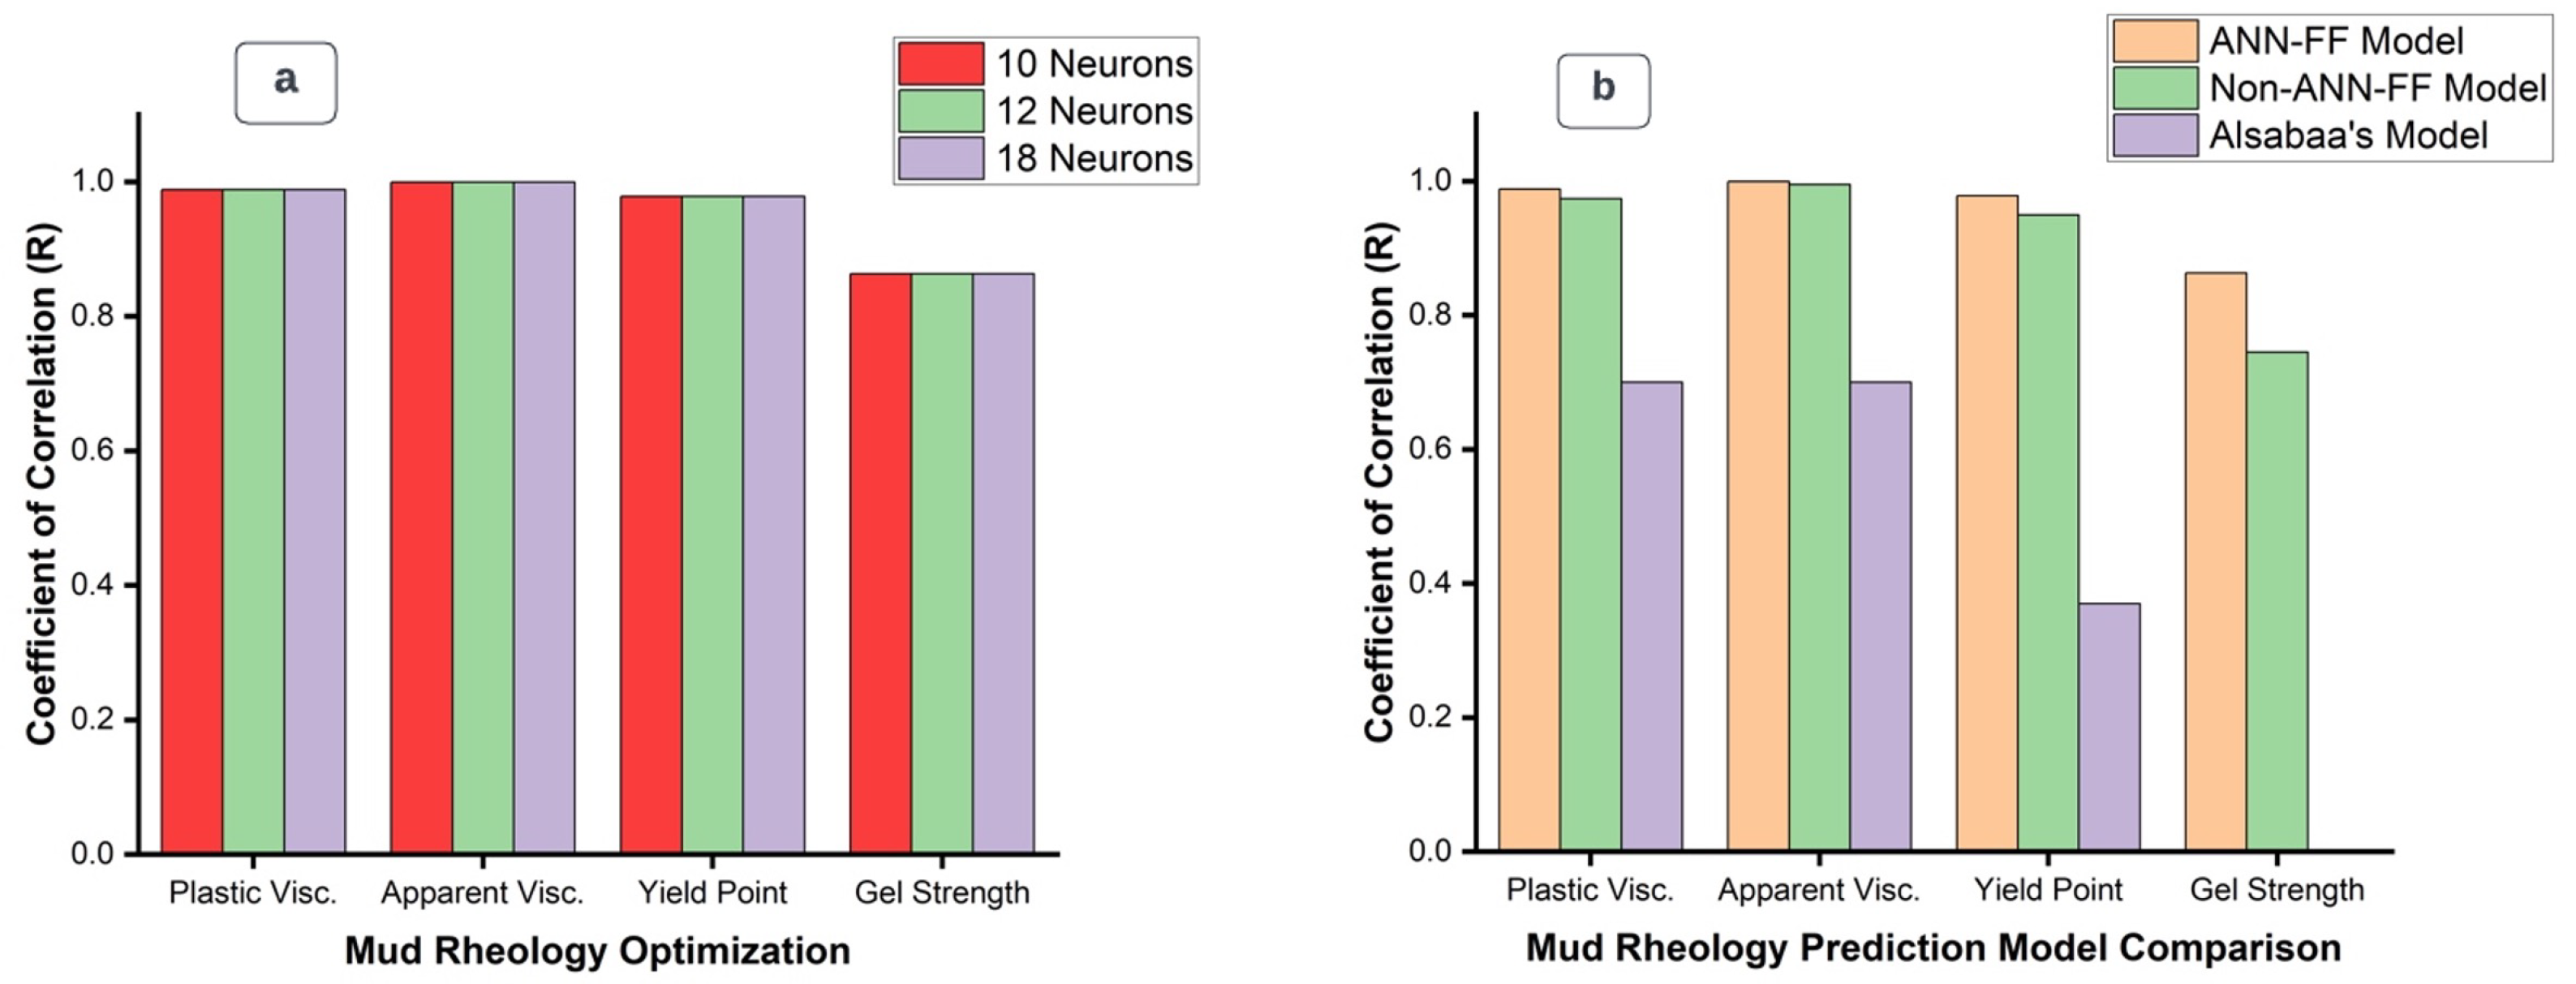
Figure 9.
Comparative area of void spaces in synthetic-based and oil-based filter cakes
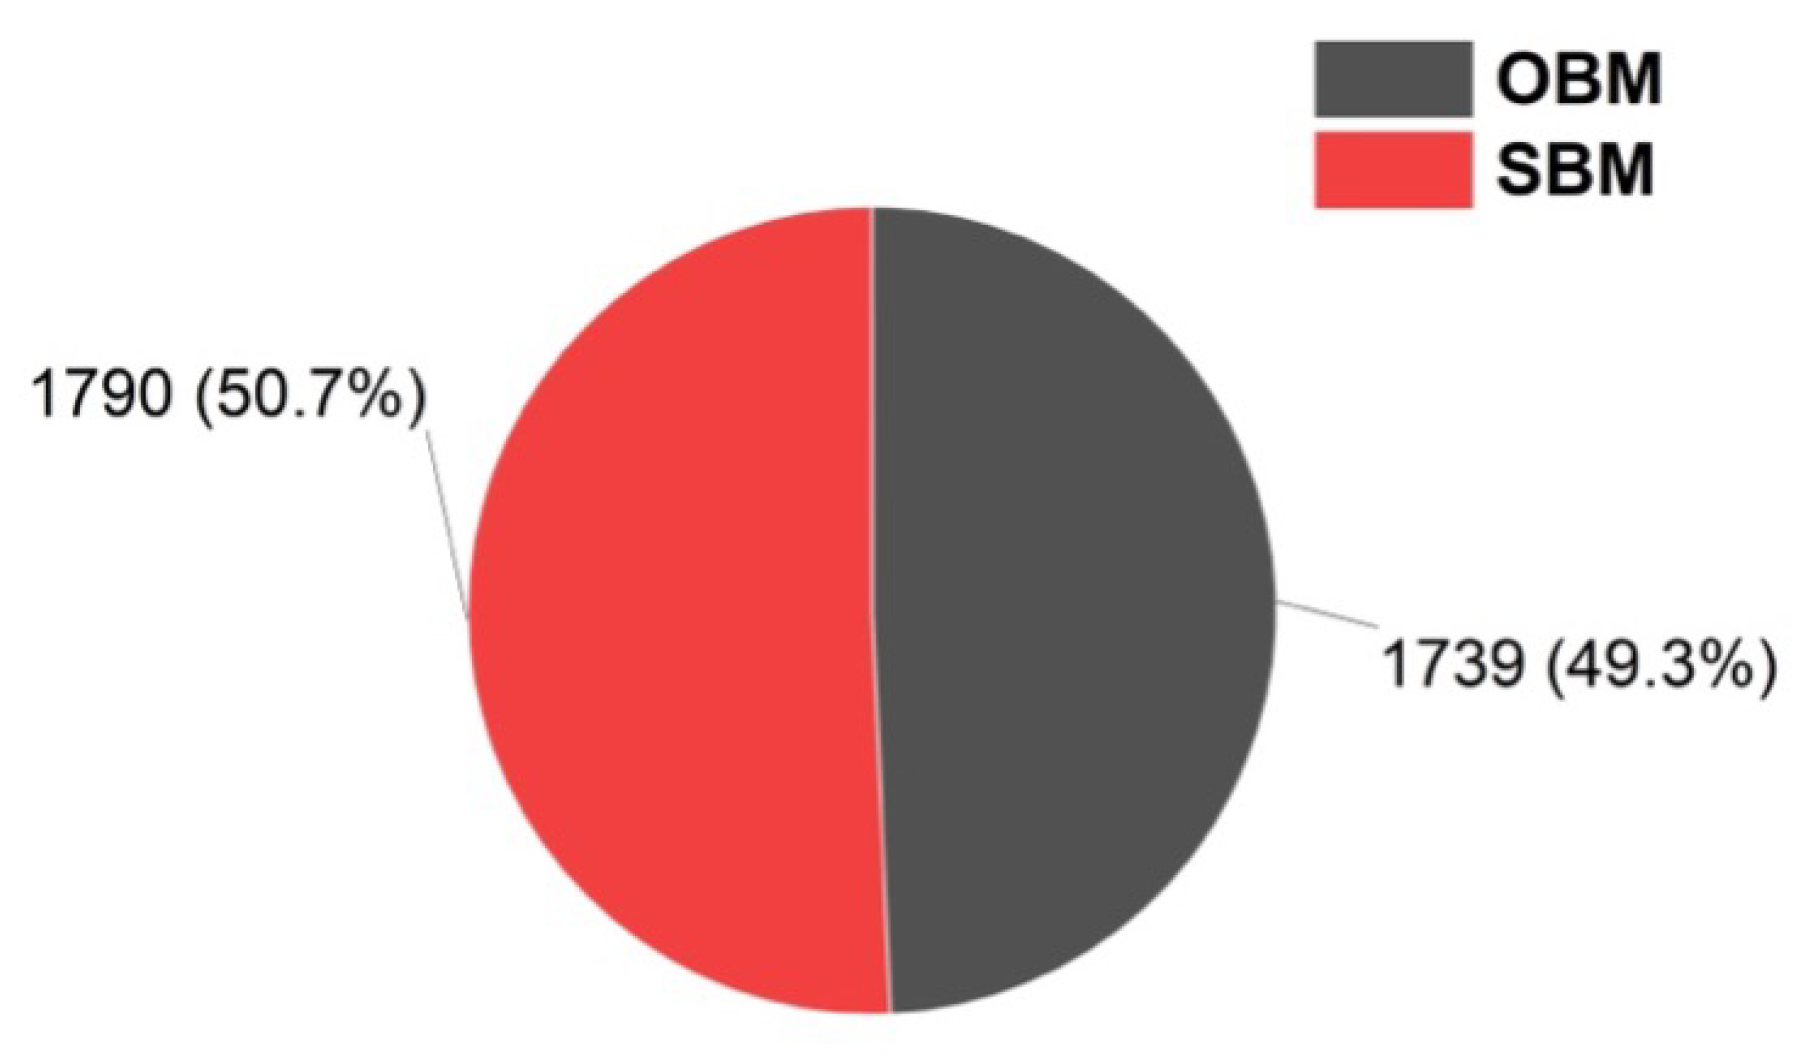
Figure 10.
3D Single-Objective modelling for filtration optimisation (a, b) optimal objective solution (c) trace of local maximum
Figure 10.
3D Single-Objective modelling for filtration optimisation (a, b) optimal objective solution (c) trace of local maximum
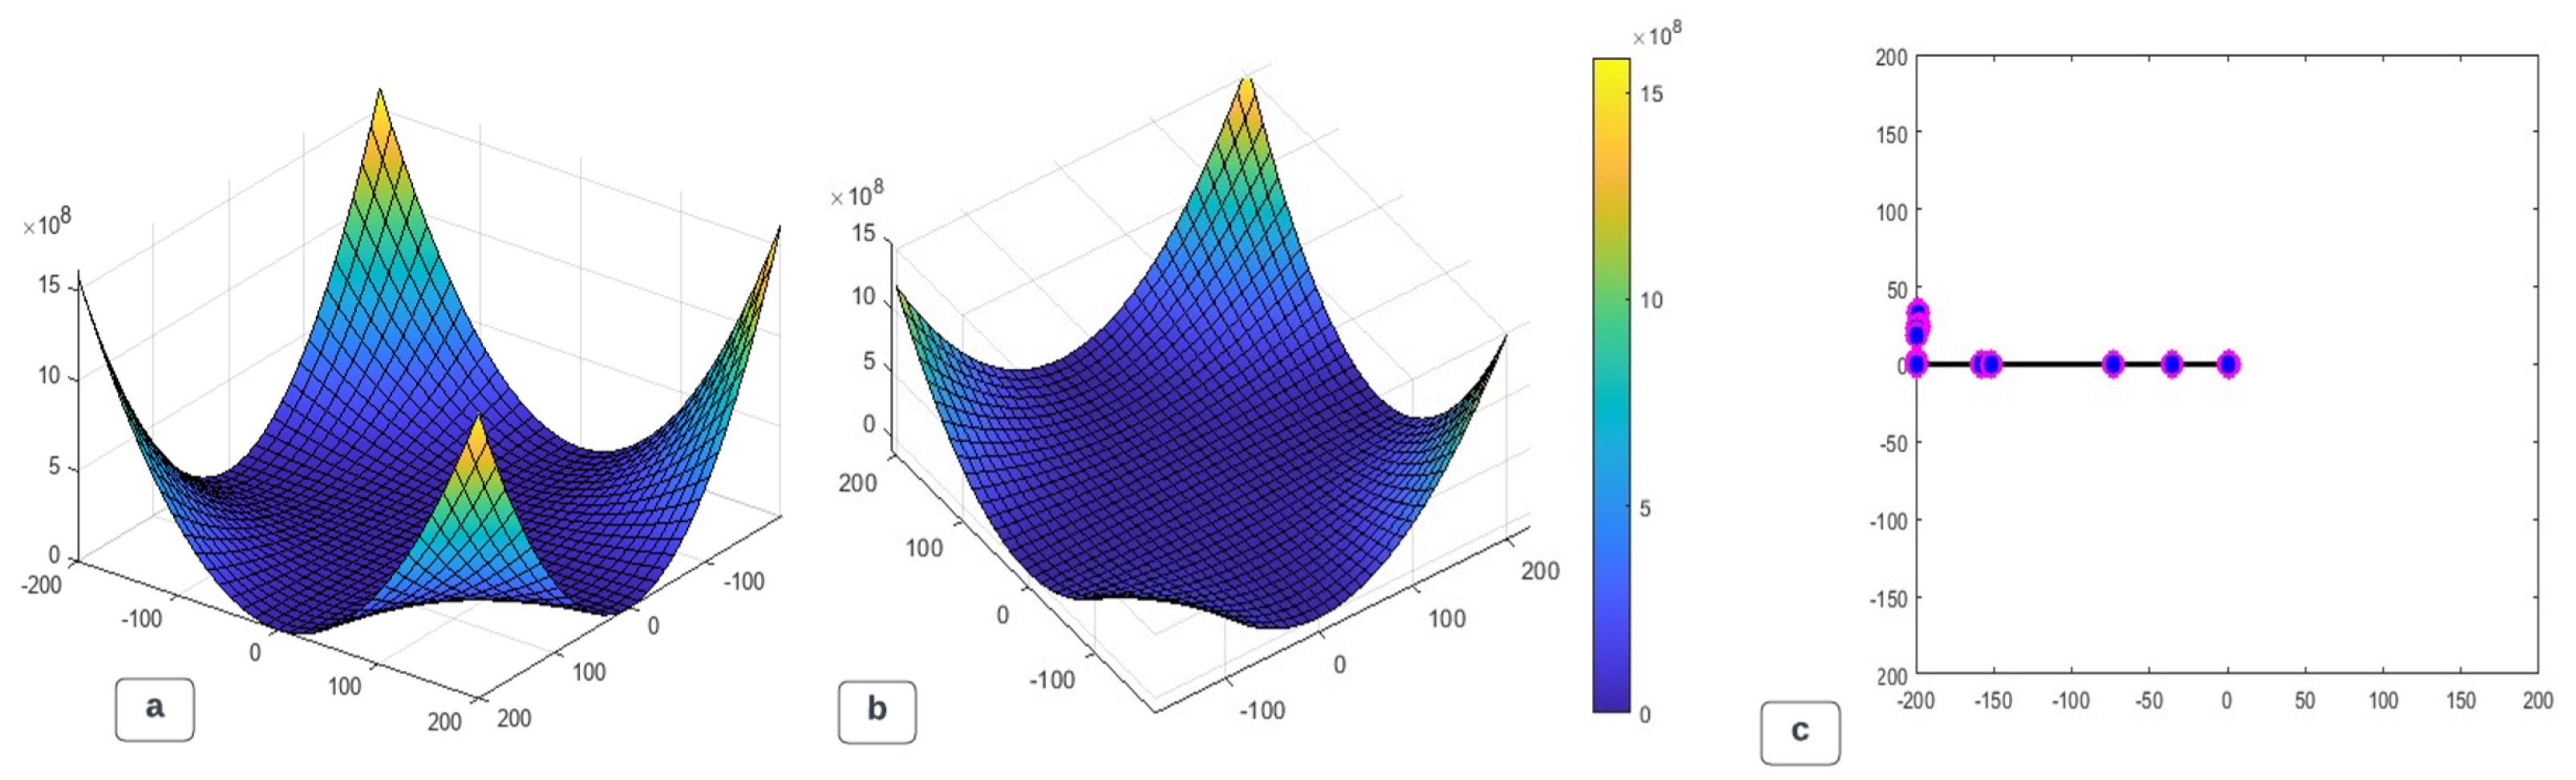
Figure 11.
Neural-Single-Objective Optimization (a) linear (b) non-linear
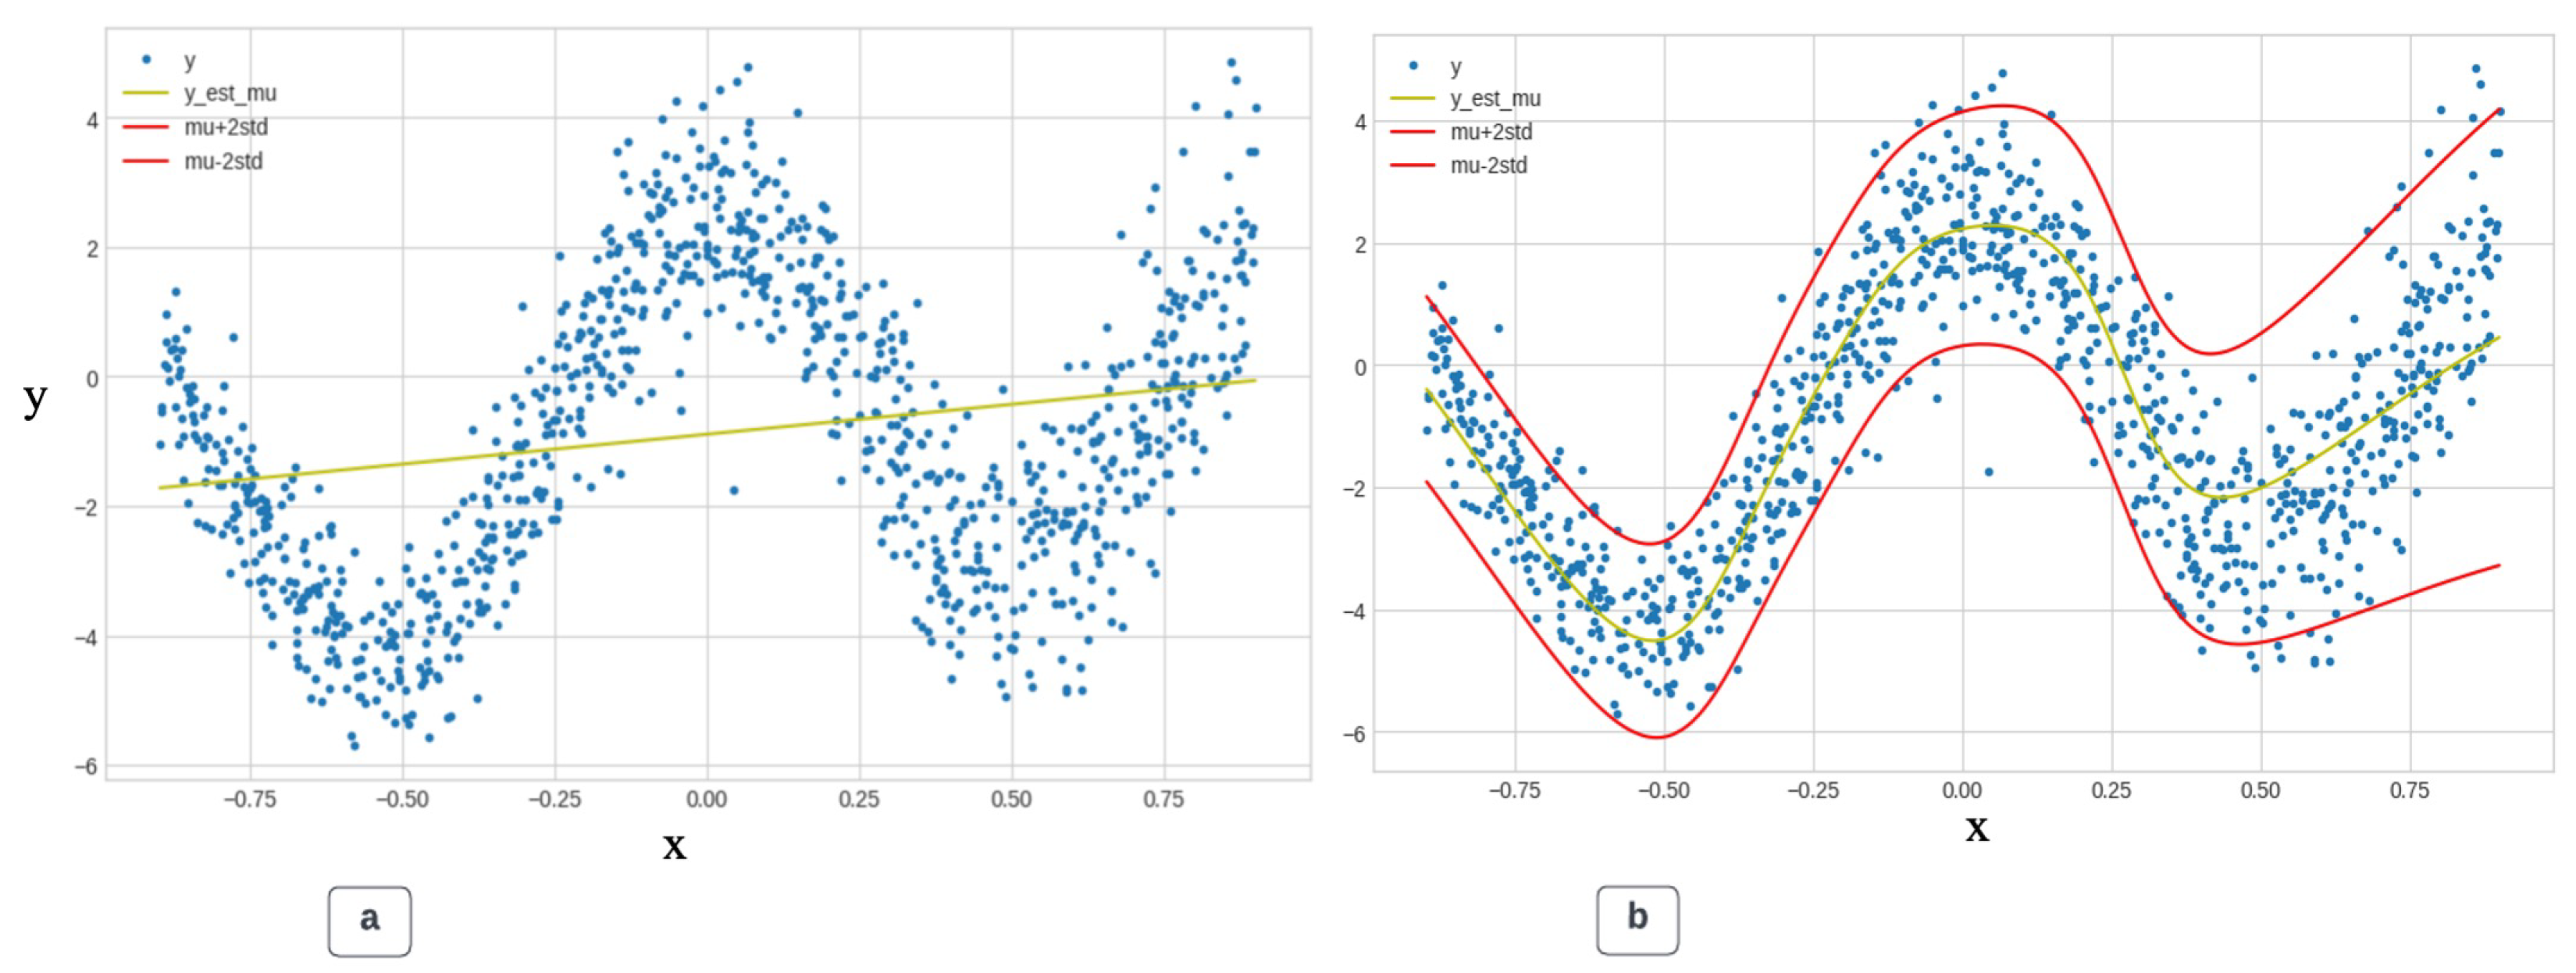

Table 1.
ANN-FF Rheological Neuron Analysis
| Property | Function | No. Neurons | R | No. Neurons | R | No. Neurons | R |
|---|---|---|---|---|---|---|---|
| Plastic Viscosity (PV) | FF | 10 | 0.98819 | 12 | 0.98817 | 18 | 0.98814 |
| Apparent Viscosity (AV) | FF | 10 | 0.99956 | 12 | 0.99953 | 18 | 0.99958 |
| Yield Point (YP) | FF | 10 | 0.97813 | 12 | 0.97803 | 18 | 0.97811 |
| Gel Strength (10mins) | FF | 10 | 0.86326 | 12 | 0.86326 | 18 | 0.86326 |
Table 2.
Rheological Neuron and Non-Neuron Model Analysis
| ANN-FF Model | Non-ANN-FF Model | |
|---|---|---|
| Property | Average R | Adj. R2 |
| Plastic Viscosity (PV) | 0.98816 | 0.97359 |
| Apparent Viscosity (AV) | 0.99956 | 0.99503 |
| Yield Point (YP) | 0.97809 | 0.94969 |
| Gel Strength (10mins) | 0.86326 | 0.74471 |
Table 3.
Neural-Image-Objective Modeling Analyses
| Computation-Property | Model Optimization |
|---|---|
| Artificial Neural Network (ANN-FF) | 0.99956 cc |
| Non Artificial Neural Network (Non-ANN-FF) | 0.99503 cc |
| Image Processing (Synthetic Based Muds) | 1790M2. |
| Single-Objective ( ) | 0.6940, 5.0536e-10 |
| Deep Neural Network (DNN)-Final loss | 4.8 |
Disclaimer/Publisher’s Note: The statements, opinions and data contained in all publications are solely those of the individual author(s) and contributor(s) and not of MDPI and/or the editor(s). MDPI and/or the editor(s) disclaim responsibility for any injury to people or property resulting from any ideas, methods, instructions or products referred to in the content. |
© 2024 by the authors. Licensee MDPI, Basel, Switzerland. This article is an open access article distributed under the terms and conditions of the Creative Commons Attribution (CC BY) license (http://creativecommons.org/licenses/by/4.0/).
Copyright: This open access article is published under a Creative Commons CC BY 4.0 license, which permit the free download, distribution, and reuse, provided that the author and preprint are cited in any reuse.


