Submitted:
23 January 2024
Posted:
24 January 2024
You are already at the latest version
Abstract
We have successfully synthesized a series of Bi doped BaFe2As2 high quality single crystals for the first time. The x-ray diffraction (XRD) patterns show an expansion of lattice parameter c with Bi doping, indicating a negative pressure effect. By investigating the resistivity, a Fermi liquid (FL) to non-Fermi liquid (NFL) crossover is observed from normal state to antiferromagnetic order state, accompanied by three superconducting transitions labeled as SC I, SC II and SC III which are supposed to be induced from three superconducting realms with various Bi concentration. Thus, the NFL behavior is proposed to be closely related with the presence of superconductivity. The magnetic susceptibility measurements further speculates that the SC I and SC III phases should be filamentary superconductivity while the SC II be a possible bulk superconductivity with TC 7 K.
Keywords:
BaFe2As2
; iron-based superconductor
; isovalent doping
; negative pressure
1. Introduction
The iron-based superconductors (IBSC) have stimulated another round of high-temperature superconductor research interest after cuprates [1] since the discovery of TC = 26 K superconductivity in LaO1-xFxFeAs [2]. Among them, the ‘122’ system AEFe2As2 (AE = Ba, Sr and Ca) with ThCr2Si2-type structure has been heavily studied because of its easily grown, large, suitable and high-quality single crystals [3,4,5]. As for BaFe2As2 parent compound [3], it exhibits an anomaly transition at 140 K which is attributed to a spin-density wave (SDW) and a tetragonal (I4/mmm) to orthorhombic (Fmmm) crystallographic structure transition. The superconductivity could eventually appear when the SDW transition is suppressed by applying physical pressure or chemical doping.
Compared with physical pressure, chemical doping has several alternative tuning modes, which can not only apply positive or negative chemical pressure, but also introduce hole or electron carriers. That’s why it has been widely chosen as an effective method to investigate the superconductivity in BaFe2As2. For example, the superconductivity could be yielded by isovalent P [6] or Ru [7] substitution for As or Fe to introduce positive or negative chemical pressure, K substitution for Ba to introduce hole carriers [3] and Co [8] or Ni [9] substitution for Fe to introduce electron carriers. Unexpectedly, some other hole substitutions (Cr, Mn and V) at Fe site could not induce superconductivity even though the SDW transition has also been gradually suppressed [10,11,12]. The absence of hole carriers and a new competing G-type antiferromagnetic order has been proposed to prevent the emergence of superconductivity in Mn- and Cr-doped BaFe2As2 [13,14]. However, even the strong hole-doping effect has been identified by Hall effect measurements in Ba(Fe1−xVx)2As2 [12], only local superconductivity along with coexisting magnetism is found and consistent with the lack of bulk superconductivity [15]. This significant difference between hole doping and electron doping at Fe site still has intense debate. Moreover, the other much simpler correlation mechanism is proposed from a review article that a decrease in c-lattice parameter is required to induce ‘in-plane’ (FeAs layer) superconductivity [16]. Based on this guideline, the bulk superconductivity induced by electron dopants at Fe site and isovalent dopant at As site with smaller P element seems to be easily understood. Even for the isovalent Ru dopant at Fe site can be well interpreted although the radius of Ru ion is larger than Fe ion, since it only expands lattice parameter a and volume but indeed causes a decrease of lattice parameter c [7].
Recently, Jayalakshmi et al. theoretically proposed that the superconductivity is possible in (Ca,Sr,Ba)Fe2Bi2 compounds and BaFe2Bi2 might exhibit high TC (≈ 30 K) than other proposed materials [17,18]. But the structural data shows that the lattice parameter c is larger than BaFe2As2 which is contrary to the previous prediction that c should be reduced for ‘in-plane’ bulk superconductivity. In order to verify whether BaFe2As2 could become superconductor by isovalent Bi substitution for As to introduce a negative pressure and whether the relationship between c decrease and bulk superconductivity is still satisfied. In this work, we report the synthesis and investigation of Bi doped BaFe2As2 single crystals experimentally for the first time. Two filamentary superconducting phases with TC ~ 25 K (SC I) and 15 K (SC III), and another possible bulk superconducting phase (SC II) with TC ~ 7 K are found, which indirectly confirms the possible superconductivity in BaFe2Bi2 and the reduction of lattice parameter c for ‘in-plane’ bulk superconductivity might be not sufficient.
2. Materials and Methods
The BaFe2(As1-xBix)2 single crystals were synthesized by self-flux method. FeAs1-xBix were prepared as precursors using the highly pure raw materials Fe, As and Bi by solid reaction method. The Fe, As and Bi powders were mixed together thoroughly and sealed in the evacuated quartz tube. The mixture was heated up to 750 ℃ and kept for 30 h. The obtained material was reground and sintered twice using the same heating procedure in order to make the Bi doping much more homogeneous. After we got the precursors, the Ba lump, FeAs and FeAs1-xBix powders were loaded in the alumina oxide tube and sealed in the evacuated quartz tube according to the stoichiometry ratio 1:2:2. The quartz tube was heated up to 1150 ℃ for 20 h and then slowly cooled down to 1000 ℃ with a rate of 2 ℃/h to grow single crystals. In the end, the high-quality single crystals can be obtained with dimensions up to 8 mm × 6 mm × 0.1 mm as shown in Figure 1(a). All the synthesis manipulations were carried out in a glove box filled with high-purity nitrogen gas.
The surface morphology and actual chemical compositions of BaFe2(As1-xBix)2 single crystals were examined by a scanning electron microscope (SEM) equipped with energy dispersive x-ray spectroscopy (EDX). The x-ray diffraction (XRD) was conducted with 2θ ange from 10° to 80° on a Rigaku x-ray diffractometer (SmartLab SE) using Cu Kα radiation ( λ = 1.5406 Å) generated at 40 kV and 30 mA. Both the resistivity and DC magnetic susceptibility was measured by the Quantum Design’s Magnetic Property Measurement System MPMS3. The resistivity was measured using the standard four-probe method while the DC magnetic susceptibility using the zero-field-cooling (ZFC) and field-cooling (FC) modes with two fields H = 20 Oe and 1 T along ab plane.
3. Results and Discussion
3.1. Actual doping concentration and lattice parameter c
We have successfully grown 5 batches of BaFe2(As1-xBix)2 single crystals for the first time. The typical photograph of the single crystals in Figure 1(a) shows a quite shiny and flat surface, and the surface morphology in Figure 1(b) taken by SEM clearly displays its layered structure character, which can both reflect the high quality of our single crystals. In order to determine the actual Bi doping concentration, we conducted the EDX measurement. The nominal and actual Bi concentration x are listed in Table 1 and the actual doping concentration x will be used to label the single crystals hereafter. We can find that the actual concentration of Bi is quite lower than the nominal value and with the increasing of the nominal doping level, the actual concentration first increases slightly, but further decreases when nominal x is above 0.2. The highest actual doping level could only reach up to 0.22%. This indicates that the Bi is quite difficultly doped into the As site which maybe result from the solid solubility limit or unstable phase.
Figure 1(c) shows the XRD patterns of BaFe2(As1-xBix)2 single crystals. Only sharp (00l) peaks can be reflected on the patterns, suggesting that the cleaved planes are perpendicular to the c-axis. The inset is the enlarged (004) peaks. The high intensity and the narrow full width at half maximum (FWHM) labeled in the inset (2θ ~ 0.12°) indicate the high quality of our single crystals again. Meanwhile, the (004) peak shifts to the lower diffraction angle with the increasing of the Bi concentration x, indicating that the Bi element is indeed introduced into BaFe2As2. The lattice parameter c for each doping sample was calculated through the XRD patterns and was plotted as a function of concentration 100x in Figure 1(d). When x is below 0.002, the lattice parameter c increases almost linearly with the doping evolution which is consistent with the Vegard’s law [19] and it begin to deviate above 0.002 with a step increase of lattice parameter c for x = 0.0022 sample. Compared with P dopant, Bi substitution for As expands c-axis, presenting a negative pressure effect which also matches the expectation since the radius of Bi ion is larger than that of As ion.
3.2. Superconducting transitions and non-Fermi liquid behavior
In order to investigate its superconducting property, we first conducted the resistivity measurements. Figure 2(a) displays the temperature dependence of resistivity down to 5 K measured with 10 mA current for BaFe2(As1-xBix)2 single crystals. For all the samples, compared with the parent compound, a similar SDW transition around 135 K is found. But when temperature decreases to around 25 K, another transition happens with a drop of resistivity which may be associated with a superconducting transition. Actually, this kind of phenomenon is also observed in some BaFe2As2 [20,21], CaFe2As2 [22] and SrFe2As2 [23] parent compounds, and Ni-doped BaFe2As2 [24] and Pr-doped CaFe2As2 [25], which are proposed as a filamentary superconducting transition. For x = 0.0022 sample, the percentage of resistivity dropping is highest about 78%. Thus, we measured it again with a lower current 1 mA down to 2 K as shown in Figure 2(c). Then, the zero resistivity is detected and with the increasing of magnetic field, the transition temperature is suppressed gradually, confirming its superconducting property. This significant current dependence of the resistivity is consistent with a more filamentary nature superconductivity. To determine the antiferromagnetic (TN) and superconducting (TC) transitions, the temperature dependence of d2ρ/dT2 is plotted in Figure 2(b) and the minimum of d2ρ/dT2 is taken as the transition temperature marked by arrows. To our surprise, for the superconducting transition at low temperature, except of the one around 25 K (labeled as TC1), there seems to have another two superconducting transitions around 15 K (labeled as TC3) and 10 K (labeled as TC2). These transitions are much clearer for x = 0.0022 sample under 1 mA which can also be identified easily just by eyes as marked by arrows in Figure 2(c). Corresponding with the three temperatures, three superconducting phases are defined as SC I (TC1), SC II (TC2) and SC III (TC3).
The filamentary superconductivity (FL SC) has been argued to be attributed to the lattice distortion or strain [23], spin and orbital fluctuations [21], the antiphase domain walls [22] and the spontaneous electronic inhomogeneity at the nanoscale level [25]. Considering the average Bi concentration is quite low in our single crystals, we proposed our own scenario to interpret this behavior. We speculate that there might exist three kinds of realms in our sample: some realms (R I) are almost similar with the parent compound circumstance without any Bi dopants, some realms (R II) are highly Bi doped, and the ratio of Bi doping in the rest realms (R III) is between the first two realms. The SC I with TC1, the SC II with TC2, and the SC III with TC3 are originated from R I, R II and R III respectively. The reasonable relationship between them will be discussed in detail later.
In iron pnictides, the normal state resistivity has been extensively described by the power law formula ρ = ρ0 + AT n, where n is the temperature exponent, ρ0 is the residual resistivity, and A is a constant. Here, to avoid the antiferromagnetic (AFM) and superconducting transitions’ influence, the 30-50 K (above TC1 and below TN) and 170-300 K (above TN) ranges are chosen as two fitting regions. The solid lines shown in Figure 2(a) represent the perfect fitting results using the power law. The evolution of n with Bi doping are summarized in Figure 2(d). There is no significant doping dependence of n for both regions. But n is much close to 2 corresponding to a Fermi-liquid (FL) ground state above TN, whereas close to 1 corresponding to a non-Fermi-liquid (NFL) behavior below TN before the emergence of superconductivity. This anomalous NFL behavior has often been revealed just above the superconducting dome which may hold a close tie with superconductivity [26,27]. Moreover, a simultaneous disappearance of the superconductivity and the NFL transport is observed in CaFe2(As1−xPx)2 [28]. From our results, this explicit indication of a FL to NFL crossover from normal state to AFM order state confirms these scenarios that NFL behavior may play a crucial role for the presence of superconductivity.
3.3. Superconducting volume and effective moment
To further investigate the superconducting diamagnetism, the temperature dependence of magnetic susceptibility was measured with H = 20 Oe magnetic field by the zero-field-cooling (ZFC) and field-cooling (FC) modes, as shown in Figure 3(a), (b) and (c). Contrast with the three superconducting transitions observed in resistivity, the one at TC1 could not be detected anymore while the one at TC3 only detected for the low Bi doping single crystals with x = 0.0007, 0.0010 and 0.0018 at 17 K as shown in Figure 3(a), and the one at TC2 only detected for the high Bi doping single crystals with x = 0.0020 and 0.0022 at 7 K as shown in Figure 3(b). The absence of SC I in the magnetic susceptibility confirms its filamentary nature superconductivity. Although the SC III is present, the superconducting transition is broad and the shielding signal magnitude is very weak that only the x = 0.0018 sample shows a diamagnetic property even below 6 K, indicating a very small superconducting volume fraction. The absolute superconducting volume (SC V) is calculated by 4πχv(TC) − 4πχv(5 K) as shown in Figure 5(a) (left axis). The SC V for x = 0.0007, 0.0010 and 0.0018 is about 0.01%, 0.01%, 0.09% respectively. It indicates that the SC III is not a bulk superconductivity, but it does reflect that the superconductivity is less filamentary compared with SC I and the SC V increases with the increasing of Bi doping. Especially with further increase of Bi concentration, a very sharp superconducting transition and a dramatically enhanced shielding signal are observed for SC II as shown in Figure 3(b). The SC V for x = 0.0020 and 0.0022 has increased significantly up to about 1.65% and 0.34%. With the increasing of Bi doping, the SC V changes by order of magnitude, crossing from 0 for SC I to 10-2 order for SC III and then to 10-1 or 1 order for SC II. Since the chemical substitution can create local, hence average structural changes which would then greatly impact the electronic structure, the lattice effect of Bi doping could not be ignored. This suggests that these three superconducting phases and doping level are mutually related. Therefore, the scenario we proposed previously about the relationship between the three superconducting phases (SC I, SC II and SC III) and the three realms (R I, R II and R III) would be reasonable and easily understood. Moreover, compared with the SC V for x = 0.0007, the relative variation ratio (V − V(x = 0.0007))/V(x = 0.0007) is also plotted as a function of 100x as shown in Figure 5(a)(right axis). Even though all of our single crystals show a non-bulk superconductivity with SC V less than 2%, the relative variation ratio has a dramatic increase, up to 600%, 13300% and 2565% for x = 0.0018, 0.0020 and 0.0022 respectively, clearly heralding the emergence of a possible bulk superconductivity (Bulk SC) for SC II. The reason why the bulk superconductivity was not shown in our sample is that the actual Bi concentration is still too low. We wonder that a true bulk superconductivity could be emerged if the Bi concentration could be further increased. This is also supported by the theoretical calculation that the parent BaFe2Bi2 might hold a TC ~ 30 K superconductivity [18].
To study the upper critical field µ0HC2, the magnetic susceptibility for x = 0.0022 was measured again down to 2 K under various magnetic fields up to 700 Oe as shown in Figure 3(c). As field increases, the superconducting transition is gradually suppressed to lower temperature, confirming its superconductivity property. Combined with the resistivity and magnetic susceptibility, by taking the data from Figure 2(c) and Figure 3(c), the TC value at each field is plotted as µ0HC2 versus T shown in Figure 3(d). The dashed curves are fits to the Werthamer-Helfand-Hohenberg (WHH) relation [29], HC2(0) = -0.693TC(dHC2/ and the solid curves are fits to Ginzburg-Landau (GL) model : HC2(T) = HC2(0) [(1 − t2) / (1 + t2)], where t represents the normalized temperature T/TC. The obtained fitting parameters of TC and µ0HC2 are summarized in Table 2. The values of TC are consistent with each other while the values of µ0HC2(0) obtained from WHH are lower than GL, which is similar to that reported in other iron pnictide superconductors [30,31]. These values are much smaller than the nominal Pauli paramagnetic limit which is roughly estimated by µ0HP = 1.84TC [32], indicating the orbital limit effect. The GL coherence length ξGL shown in Table 2, is also calculated using the relation µ0HC2(0) = Φ0/(2π), where Φ0 = 2.0710-15 T⋅m2 is the flux quantum.
The magnetic susceptibility is also measured by applying H = 1 T magnetic field as shown in Figure 4(a). The SDW transitions are observed for all the single crystals and the minimum of d2χ/dT2 plotted in Figure 4(b) is taken as the AFM transition temperature, which is consistent with the resistivity measurement. Above TN, the magnetic susceptibility shows a T-linear behavior for x = 0.0007 and 0.0010, which is universal in iron pnictides and explained as the existence of a wide antiferromagnetic fluctuation [34]. When x > 0.0018, the deviation from T-linear behavior becomes obvious and gradually changes to a Curie–Weiss-like behavior. As shown in Figure 4 (c), the magnetic susceptibilities can be well fitted between 150 K and 220 K by the Curie–Weiss law 1/(χ χ0) = (T θCW)/C, where χ0 is the temperature independent magnetic susceptibility, θCW is the Curie temperature and C is the Curie–Weiss constant. The extracted effective moment μeff per Fe is plotted in Figure 4(d). The values are about 1.95μB, 2.26μB and 1.74μB for x = 0.0018, 0.0020 and 0.0022, corresponding to an effective spin close to S = 1/2 and is comparable with the value about 1.9μB for parent compound BaFe2As2 studied by inelastic neutron scattering [33]. It seems that the effective moment is almost independent with the Bi substitution. In contrast, the effective moment gradually decreases with increasing x for the other two isovalent substitution systems in BaFe2(As1-xPx)2 [35,36] and Ba(Fe1-xRux)2As2 [37,38]. Especially for Ba(Fe1-xRux)2As2 system, the Ru substitution also presents a negative pressure effect but with a decrease of c-axis. The dilution of the magnetic moment at the Fe site is contributed to the decrease in zAs which is correlated with the decrease of c-axis [38]. Therefore, the doping independence of effective moment in our BaFe2(As1-xBix)2 sample may be linked to the increase of c-axis.
3.4. Superconducting phasediagram
Based on the resistivity and magnetic susceptibility data, we construct a complete temperature-doping phase diagram of BaFe2(As1-xBix)2 which is presented in Figure 5(b). One AFM phase and three superconducting phases labeled as SC I, SC II and SC III are well defined and coexistent. The TC is about 25 K, 15 K and 7 K for SC I, SC III and SC II respectively. Attributed to the relatively low Bi concentration, the coexistence of AFM state and superconductivity might just be in microscopic region. In addition, both the AFM and superconducting transition temperatures seem to be independent with the slight Bi variation. From the normal state to AFM order state, a FL to NFL crossover is revealed and the NFL behavior just appears at the boundary of superconducting phases which may be a significant factor to drive the presence of superconductivity. The red data points at superconducting region manifest that only the SC II and SC III could be detected by the diamagnetic signal. Combined with the dramatic enhancement of SC V in Figure 5(a), we strongly suggest that these superconducting phases are closely correlated with the Bi concentration and the SC I and SC III should be filamentary superconductors while the SC II a bulk superconductor.
4. Conclusions
In conclusion, a series of high quality BaFe2(As1-xBix)2 single crystals are successfully grown for the first time. The highest doping level could only reach up to 0.22% and the Bi doping enlarges the lattice parameter c, showing a negative pressure effect. By investigating resistivity and magnetic susceptibility, a FL to NFL crossover from normal state to AFM state and three superconducting phases labeled as SC I, SC II and SC III are observed. The NFL behavior is assumed to play a crucial role for the presence of superconductivity. The evolution of SC V with Bi doping suggests that these superconducting phases should be highly related with the Bi doping concentration and the SC II with TC ~ 7 K is proposed to be a possible bulk superconductor. Thus, the previous prediction about the superconductivity in parent BaFe2Bi2 is possible and the reduction of lattice parameter c for ‘in-plane’ bulk superconductivity might be not sufficient. To further confirm our scenarios about the origin of the three superconducting phases, we recommend to conduct the scanning tunneling microscopy measurement for specific investigation in the future.
Author Contributions
Conceptualization and supervision, L.X.; investigation, J.S., J.Z. and Y.L.; formal analysis and writing—original draft preparation, L.X.; writing—review and editing, J.Z., Y.L., C.J., J.L. and L.X. All authors have read and agreed to the published version of the manuscript.
Funding
This research was funded by the National Natural Science Foundation of China (grant numbers 12004104 and 12204515) and the Young Elite Scientists Sponsorship Program by CAST (grant number 2022QNRC001).
Institutional Review Board Statement
Not applicable.
Informed Consent Statement
Not applicable.
Data Availability Statement
Data are available upon request to the corresponding author.
Conflicts of Interest
The authors declare no conflicts of interest.
References
- J. G. Bednorz; K. A. Muller. Possible high Tc superconductivity in the Ba−La−Cu−O system. Zeitschrift Fur Physik B: Condensed Matter 1986, 64, 189–193. [CrossRef]
- Kamihara, Y.; Watanabe, T.; Hirano, M.; Hosono, H. Iron-based layered superconductor La[O1-xFx]FeAs (x=0.05-0.12) with Tc = 26 K. J. Am. Chem. Soc. 2008, 130, 3296. [Google Scholar] [CrossRef]
- Rotter, M.; Tegel, M.; Johrendt, D. Superconductivity at 38 K in the iron arsenide (Ba1-xKx)Fe2As2. Phys. Rev. Lett. 2008, 101, 107006. [Google Scholar] [CrossRef]
- Sasmal, K.; Lv, B.; Lorenz, B.; Guloy, A. M.; Chen, F.; Xue, Y. Y.; Chu, C. W. Superconducting fe-based compounds (A1-xSrx)Fe2As2 with A = K and Cs with transition temperatures up to 37 K. Phys. Rev. Lett. 2008, 101, 107007. [Google Scholar] [CrossRef]
- Zhao, K.; Liu, Q. Q.; Wang, X. C.; Deng, Z.; Lv, Y. X.; Zhu, J. L.; Li, F. Y.; Jin, C. Q. Superconductivity above 33 K in (Ca1 −xNax)Fe2As2. J. Phys. Condens. Matter 2010, 22, 222203. [Google Scholar] [CrossRef]
- Jiang, S.; Xing, H.; Xuan, G.; Wang, C.; Ren, Z.; Feng, C.; Dai, J.; Xu, Z. a.; Cao, G. Superconductivity up to 30 K in the vicinity of the quantum critical point in BaFe2(As1−xPx)2. J. Phys. Condens. Matter 2009, 21, 382203. [Google Scholar] [CrossRef] [PubMed]
- Thaler, A.; Ni, N.; Kracher, A.; Yan, J. Q.; Bud’ko, S. L.; Canfield, P. C. Physical and magnetic properties of Ba(Fe1−xRux)2As2 single crystals. Phys. Rev. B 2010, 82, 014534. [Google Scholar] [CrossRef]
- Sefat, A. S.; Jin, R. Y.; McGuire, M. A.; Sales, B. C.; Singh, D. J.; Mandrus, D. Superconductivity at 22 K in Co-doped BaFe2As2 crystals. Phys. Rev. Lett. 2008, 101, 117004. [Google Scholar] [CrossRef] [PubMed]
- Li, L. J.; Luo, Y. K.; Wang, Q. B.; Chen, H.; Ren, Z.; Tao, Q.; Li, Y. K.; Lin, X.; He, M.; Zhu, Z. W.; Cao, G. H.; Xu, Z. A. Superconductivity induced by Ni doping in BaFe2As2 single crystals. New. J. Phys. 2009, 11, 025008. [Google Scholar] [CrossRef]
- Thaler, A.; Hodovanets, H.; Torikachvili, M. S.; Ran, S.; Kracher, A.; Straszheim, W.; Yan, J. Q.; Mun, E.; Canfield, P. C. Physical and magnetic properties of Ba(Fe1−xMnx)2As2 single crystals. Phys. Rev. B 2011, 84, 144528. [Google Scholar] [CrossRef]
- Sefat, A. S.; Singh, D. J.; VanBebber, L. H.; Mozharivskyj, Y.; McGuire, M. A.; Jin, R.; Sales, B. C.; Keppens, V.; Mandrus, D. Absence of superconductivity in hole-doped BaFe2−xCrxAs2 single crystals. Phys. Rev. B 2009, 79, 224524. [Google Scholar] [CrossRef]
- Li, X.-G.; Sheng, J.-M.; Tian, C.-K.; Wang, Y.-Y.; Xia, T.-L.; Wang, L.; Ye, F.; Tian, W.; Wang, J.-C.; Liu, J.-J.; Zhang, H.-X.; Bao, W.; Cheng, P. Effects of vanadium doping on BaFe2As2. EPL 2018, 122, 67006. [Google Scholar] [CrossRef]
- Suzuki, H.; Yoshida, T.; Ideta, S.; Shibata, G.; Ishigami, K.; Kadono, T.; Fujimori, A.; Hashimoto, M.; Lu, D. H.; Shen, Z. X.; Ono, K.; Sakai, E.; Kumigashira, H.; Matsuo, M.; Sasagawa, T. Absence of superconductivity in the hole-doped Fe pnictide Ba(Fe1−xMnx)2As2: Photoemission and x-ray absorption spectroscopy studies. Phys. Rev. B 2013, 88, 100501. [Google Scholar] [CrossRef]
- Marty, K.; Christianson, A. D.; Wang, C. H.; Matsuda, M.; Cao, H.; VanBebber, L. H.; Zarestky, J. L.; Singh, D. J.; Sefat, A. S.; Lumsden, M. D. Competing magnetic ground states in nonsuperconducting Ba(Fe1−xCrx)2As2 as seen via neutron diffraction. Phys. Rev. B 2011, 83, 060509(R). [Google Scholar] [CrossRef]
- Sefat, A. S.; Nguyen, G. D.; Parker, D. S.; Fu, M. M.; Zou, Q.; Li, A.-P.; Cao, H. B.; Sanjeewa, L. D.; Li, L.; Gai, Z. Local superconductivity in vanadium iron arsenide. Phys. Rev. B 2019, 100, 104525. [Google Scholar] [CrossRef]
- Konzen, L. M.; Sefat, A. S. Lattice parameters guide superconductivity in iron-arsenides. J. Phys. Condens. Matter 2017, 29, 083001. [Google Scholar] [CrossRef] [PubMed]
- Sundareswari, M.; Jayalakshmi, D. S.; Viswanathan, E. A first principles study on newly proposed (Ca/Sr/Ba)Fe2Bi2 compounds with their parent compounds. Philos Mag 2016, 96, 511–523. [Google Scholar] [CrossRef]
- Jayalakshmi, D. S.; Sundareswari, M.; Viswanathan, E.; Hemanand, D.; Pranesh, V. Computational study on unconventional superconductivity and mechanical properties of novel antiferrromagnetic (Ca,Sr,Ba)Fe2Bi2 compounds. Int J Mod Phys B 2019, 33, 1950341. [Google Scholar]
- Vegard, L. Die Konstitution der Mischkristalle und die Raumfüllung der Atome. Z Phys 1921, 5, 17–26. [Google Scholar] [CrossRef]
- Kim, J. S.; Blasius, T. D.; Kim, E. G.; Stewart, G. R. Superconductivity in undoped single crystals of BaFe2As2: field and current dependence. J. Phys. Condens. Matter 2009, 21, 342201. [Google Scholar] [CrossRef]
- Xiao, H.; Hu, T.; He, S. K.; Shen, B.; Zhang, W. J.; Xu, B.; He, K. F.; Han, J.; Singh, Y. P.; Wen, H. H.; Qiu, X. G.; Panagopoulos, C.; Almasan, C. C. Filamentary superconductivity across the phase diagram of Ba(Fe,Co)2As2. Phys. Rev. B 2012, 86, 064521. [Google Scholar] [CrossRef]
- Xiao, H.; Hu, T.; Dioguardi, A. P.; apRoberts-Warren, N.; Shockley, A. C.; Crocker, J.; Nisson, D. M.; Viskadourakis, Z.; Tee, X.; Radulov, I.; Almasan, C. C.; Curro, N. J.; Panagopoulos, C. Evidence for filamentary superconductivity nucleated at antiphase domain walls in antiferromagnetic CaFe2As2. Phys. Rev. B 2012, 85, 024530. [Google Scholar] [CrossRef]
- Saha, S. R.; Butch, N. P.; Kirshenbaum, K.; Paglione, J.; Zavalij, P. Y. Superconducting and ferromagnetic phases induced by lattice distortions in stoichiometric SrFe2As2 single crystals. Phys. Rev. Lett. 2009, 103, 037005. [Google Scholar] [CrossRef] [PubMed]
- Zhang, W.; Dai, Y.-M.; Xu, B.; Yang, R.; Liu, J.-Y.; Sui, Q.-T.; Luo, H.-Q.; Zhang, R.; Lu, X.-Y.; Yang, H.; Qiu, X.-G. Magnetoresistivity and filamentary superconductivity in nickel-doped BaFe2As2. Chin. Phys. B 2016, 25, 047401. [Google Scholar] [CrossRef]
- Nguyen, G. D.; Fu, M.; Zou, Q.; Sanjeewa, L. D.; Li, A. P.; Sefat, A. S.; Gai, Z. Nanoscale Superconducting States in the Fe-Based Filamentary Superconductor of Pr-Doped CaFe2As2. Nanomaterials 2021, 11, 1019. [Google Scholar] [CrossRef] [PubMed]
- K. Hashimoto; K. Cho; T. Shibauchi; S. Kasahara; Y.Mizukami; R. Katsumata; Y. Tsuruhara; T. Terashima; H.Ikeda; M. A. Tanatar; H. Kitano; N. Salovich; R. W. Giannetta; P. Walmsley; A. Carrington; R. Prozorov; Matsuda, Y. A Sharp Peak of the Zero-Temperature Penetration Depth at Optimal Composition in BaFe2(As1–xPx)2. Science 2012, 336, 1554. [Google Scholar]
- R. Zhou; Z.Li; J. Yang; D.L. Sun; Lin,, C. T.; Zheng, G.-q. Quantum criticality in electron-doped BaFe2−xNixAs2. Nat. Commun. 2013, 4, 2265. [Google Scholar] [CrossRef] [PubMed]
- Kasahara, S.; Shibauchi, T.; Hashimoto, K.; Nakai, Y.; Ikeda, H.; Terashima, T.; Matsuda, Y. Abrupt recovery of Fermi-liquid transport following the collapse of the c axis in CaFe2(As1−xPx)2 single crystals. Phys. Rev. B 2011, 83, 060505(R). [Google Scholar] [CrossRef]
- Werthamer, N. R.; Helfand, E.; Hohenberg, P. C. Temperature and Purity Dependence of the Superconducting Critical Field,Hc2. III. Electron Spin and Spin-Orbit Effects. Phys Rev 1966, 147, 295–302. [Google Scholar] [CrossRef]
- Kumar, N.; Nagalakshmi, R.; Kulkarni, R.; Paulose, P. L.; Nigam, A. K.; Dhar, S. K.; Thamizhavel, A. Anisotropic magnetic and superconducting properties of CaFe2−xCoxAs2(x=0,0.06) single crystals. Phys. Rev. B 2009, 79, 012504. [Google Scholar] [CrossRef]
- Zhu, X.; Yang, H.; Fang, L.; Mu, G.; Wen, H.-H. Upper critical field, Hall effect and magnetoresistance in the iron-based layered superconductor LaFeAsO0.9F0.1−δ. Superconductor Science and Technology 2008, 21, 105001. [Google Scholar] [CrossRef]
- Clogston, A. M. Upper Limit for the Critical Field in Hard Superconductors. Phys. Rev. Lett. 1962, 9, 266–267. [Google Scholar] [CrossRef]
- Harriger, L. W.; Liu, M.; Luo, H.; Ewings, R. A.; Frost, C. D.; Perring, T. G.; Dai, P. Temperature dependence of the paramagnetic spin excitations in BaFe2As2. Phys. Rev. B 2012, 86, 140403(R). [Google Scholar] [CrossRef]
- Zhang, G. M.; Su, Y. H.; Lu, Z. Y.; Weng, Z. Y.; Lee, D. H.; Xiang, T. Universal linear-temperature dependence of static magnetic susceptibility in iron pnictides. EPL 2009, 86, 37006. [Google Scholar] [CrossRef]
- Allred, J. M.; Taddei, K. M.; Bugaris, D. E.; Avci, S.; Chung, D. Y.; Claus, H.; dela Cruz, C.; Kanatzidis, M. G.; Rosenkranz, S.; Osborn, R.; Chmaissem, O. Coincident structural and magnetic order in BaFe2(As1−xPx)2 revealed by high-resolution neutron diffraction. Phys. Rev. B 2014, 90, 104513. [Google Scholar] [CrossRef]
- Hu, D.; Lu, X.; Zhang, W.; Luo, H.; Li, S.; Wang, P.; Chen, G.; Han, F.; Banjara, S. R.; Sapkota, A.; Kreyssig, A.; Goldman, A. I.; Yamani, Z.; Niedermayer, C.; Skoulatos, M.; Georgii, R.; Keller, T.; Wang, P.; Yu, W.; Dai, P. Structural and Magnetic Phase Transitions near Optimal Superconductivity in BaFe2(As1-xPx)2. Phys. Rev. Lett. 2015, 114, 157002. [Google Scholar] [CrossRef] [PubMed]
- Sharma, S.; Bharathi, A.; Chandra, S.; Reddy, V. R.; Paulraj, S.; Satya, A. T.; Sastry, V. S.; Gupta, A.; Sundar, C. S. Superconductivity in Ru-substituted polycrystalline BaFe2−xRuxAs2. Phys. Rev. B 2010, 81, 174512. [Google Scholar] [CrossRef]
- Sharma, S.; Bharathi, A.; Vinod, K.; Sundar, C. S.; Srihari, V.; Sen, S.; Ghosh, H.; Sinha, A. K.; Deb, S. K. Structural investigations in BaFe2-xRuxAs2 as a function of Ru and temperature. Acta Crystallogr B Struct Sci Cryst Eng Mater 2015, 71, 61–67. [Google Scholar] [CrossRef]
Figure 1.
(a) The typical photograph, (b) The typical SEM surface morphology photograph, (c) The XRD patterns (inset is the enlarged (004) peaks and the FWHM is labeled) and (d) The concentration 100x dependence of lattice parameter c for BaFe2(As1-xBix)2 single crystals.
Figure 1.
(a) The typical photograph, (b) The typical SEM surface morphology photograph, (c) The XRD patterns (inset is the enlarged (004) peaks and the FWHM is labeled) and (d) The concentration 100x dependence of lattice parameter c for BaFe2(As1-xBix)2 single crystals.
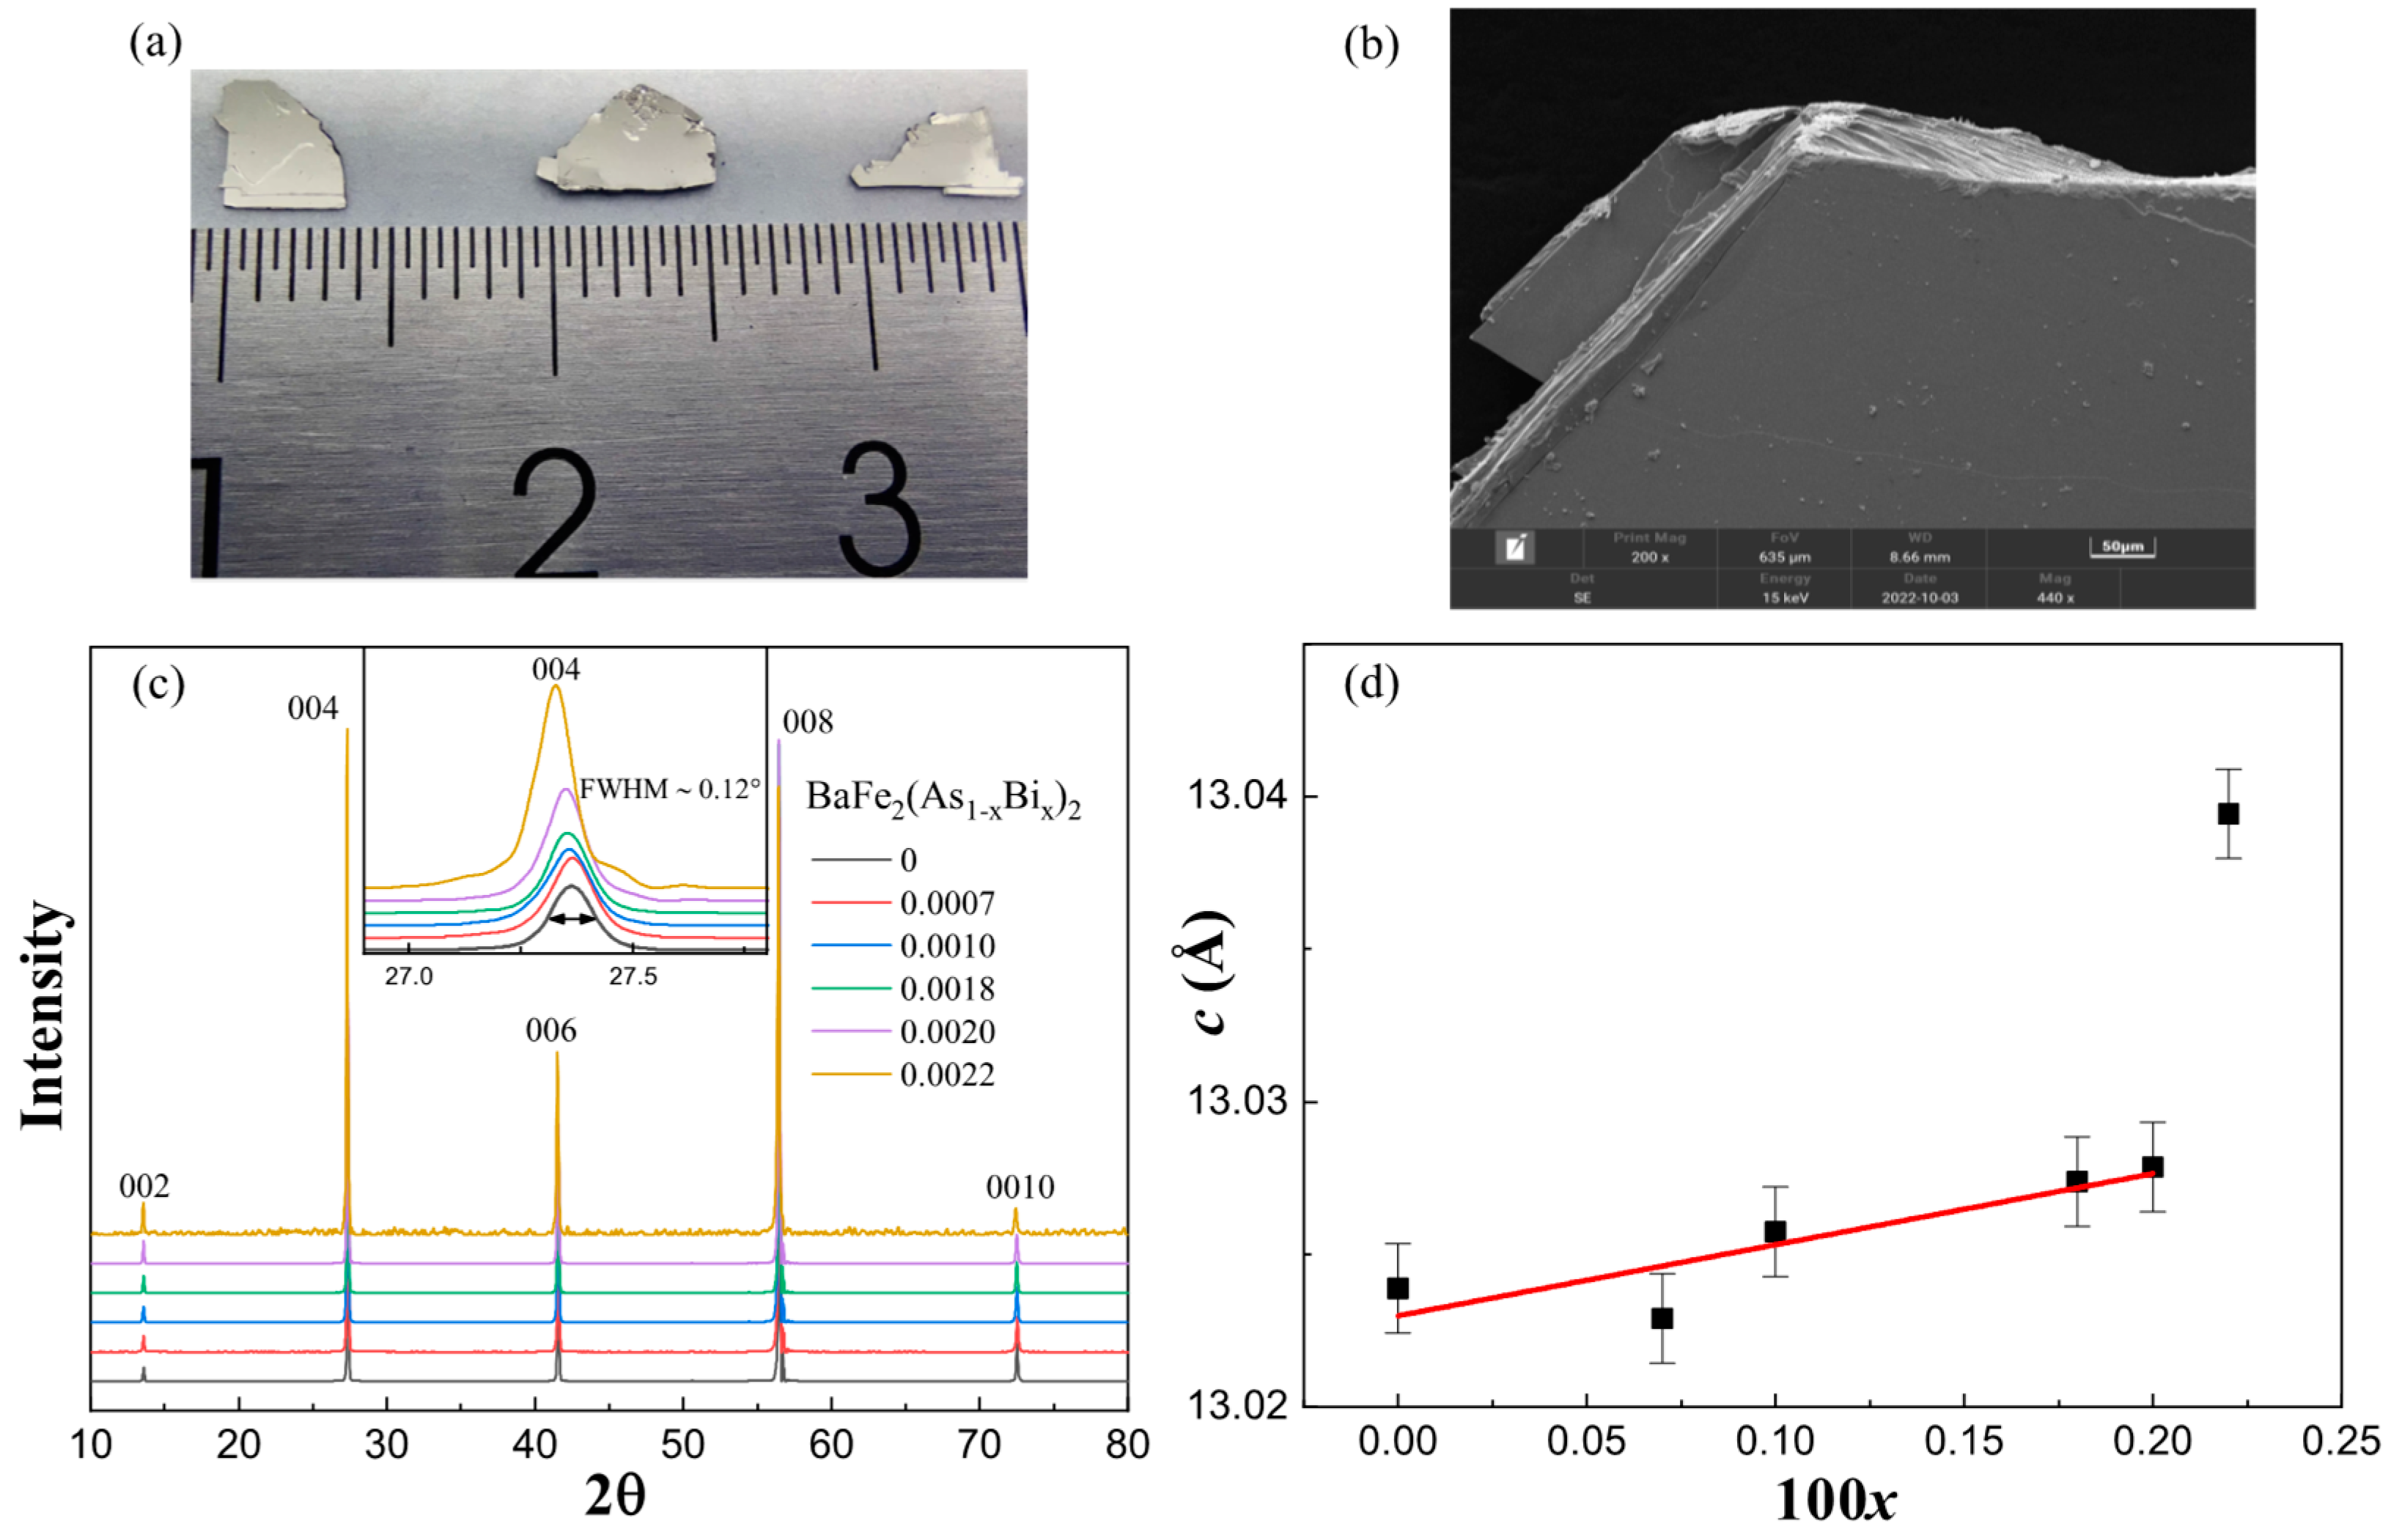
Figure 2.
(a) The temperature dependence of resistivity measured with 10 mA current for BaFe2(As1-xBix)2 single crystals. The solid lines are the fitting lines using the power law formula ρ = ρ0 + AT n between 30-50 K and 170-300 K. (b) The d2ρ/dT2 as a function of temperature according to the data from (a) and (c). (c) The temperature dependence of resistivity under different magnetic fields measured with 1 mA current for x = 0.0022 sample. (d) The concentration 100x dependence of fitting parameter n obtained from (a).
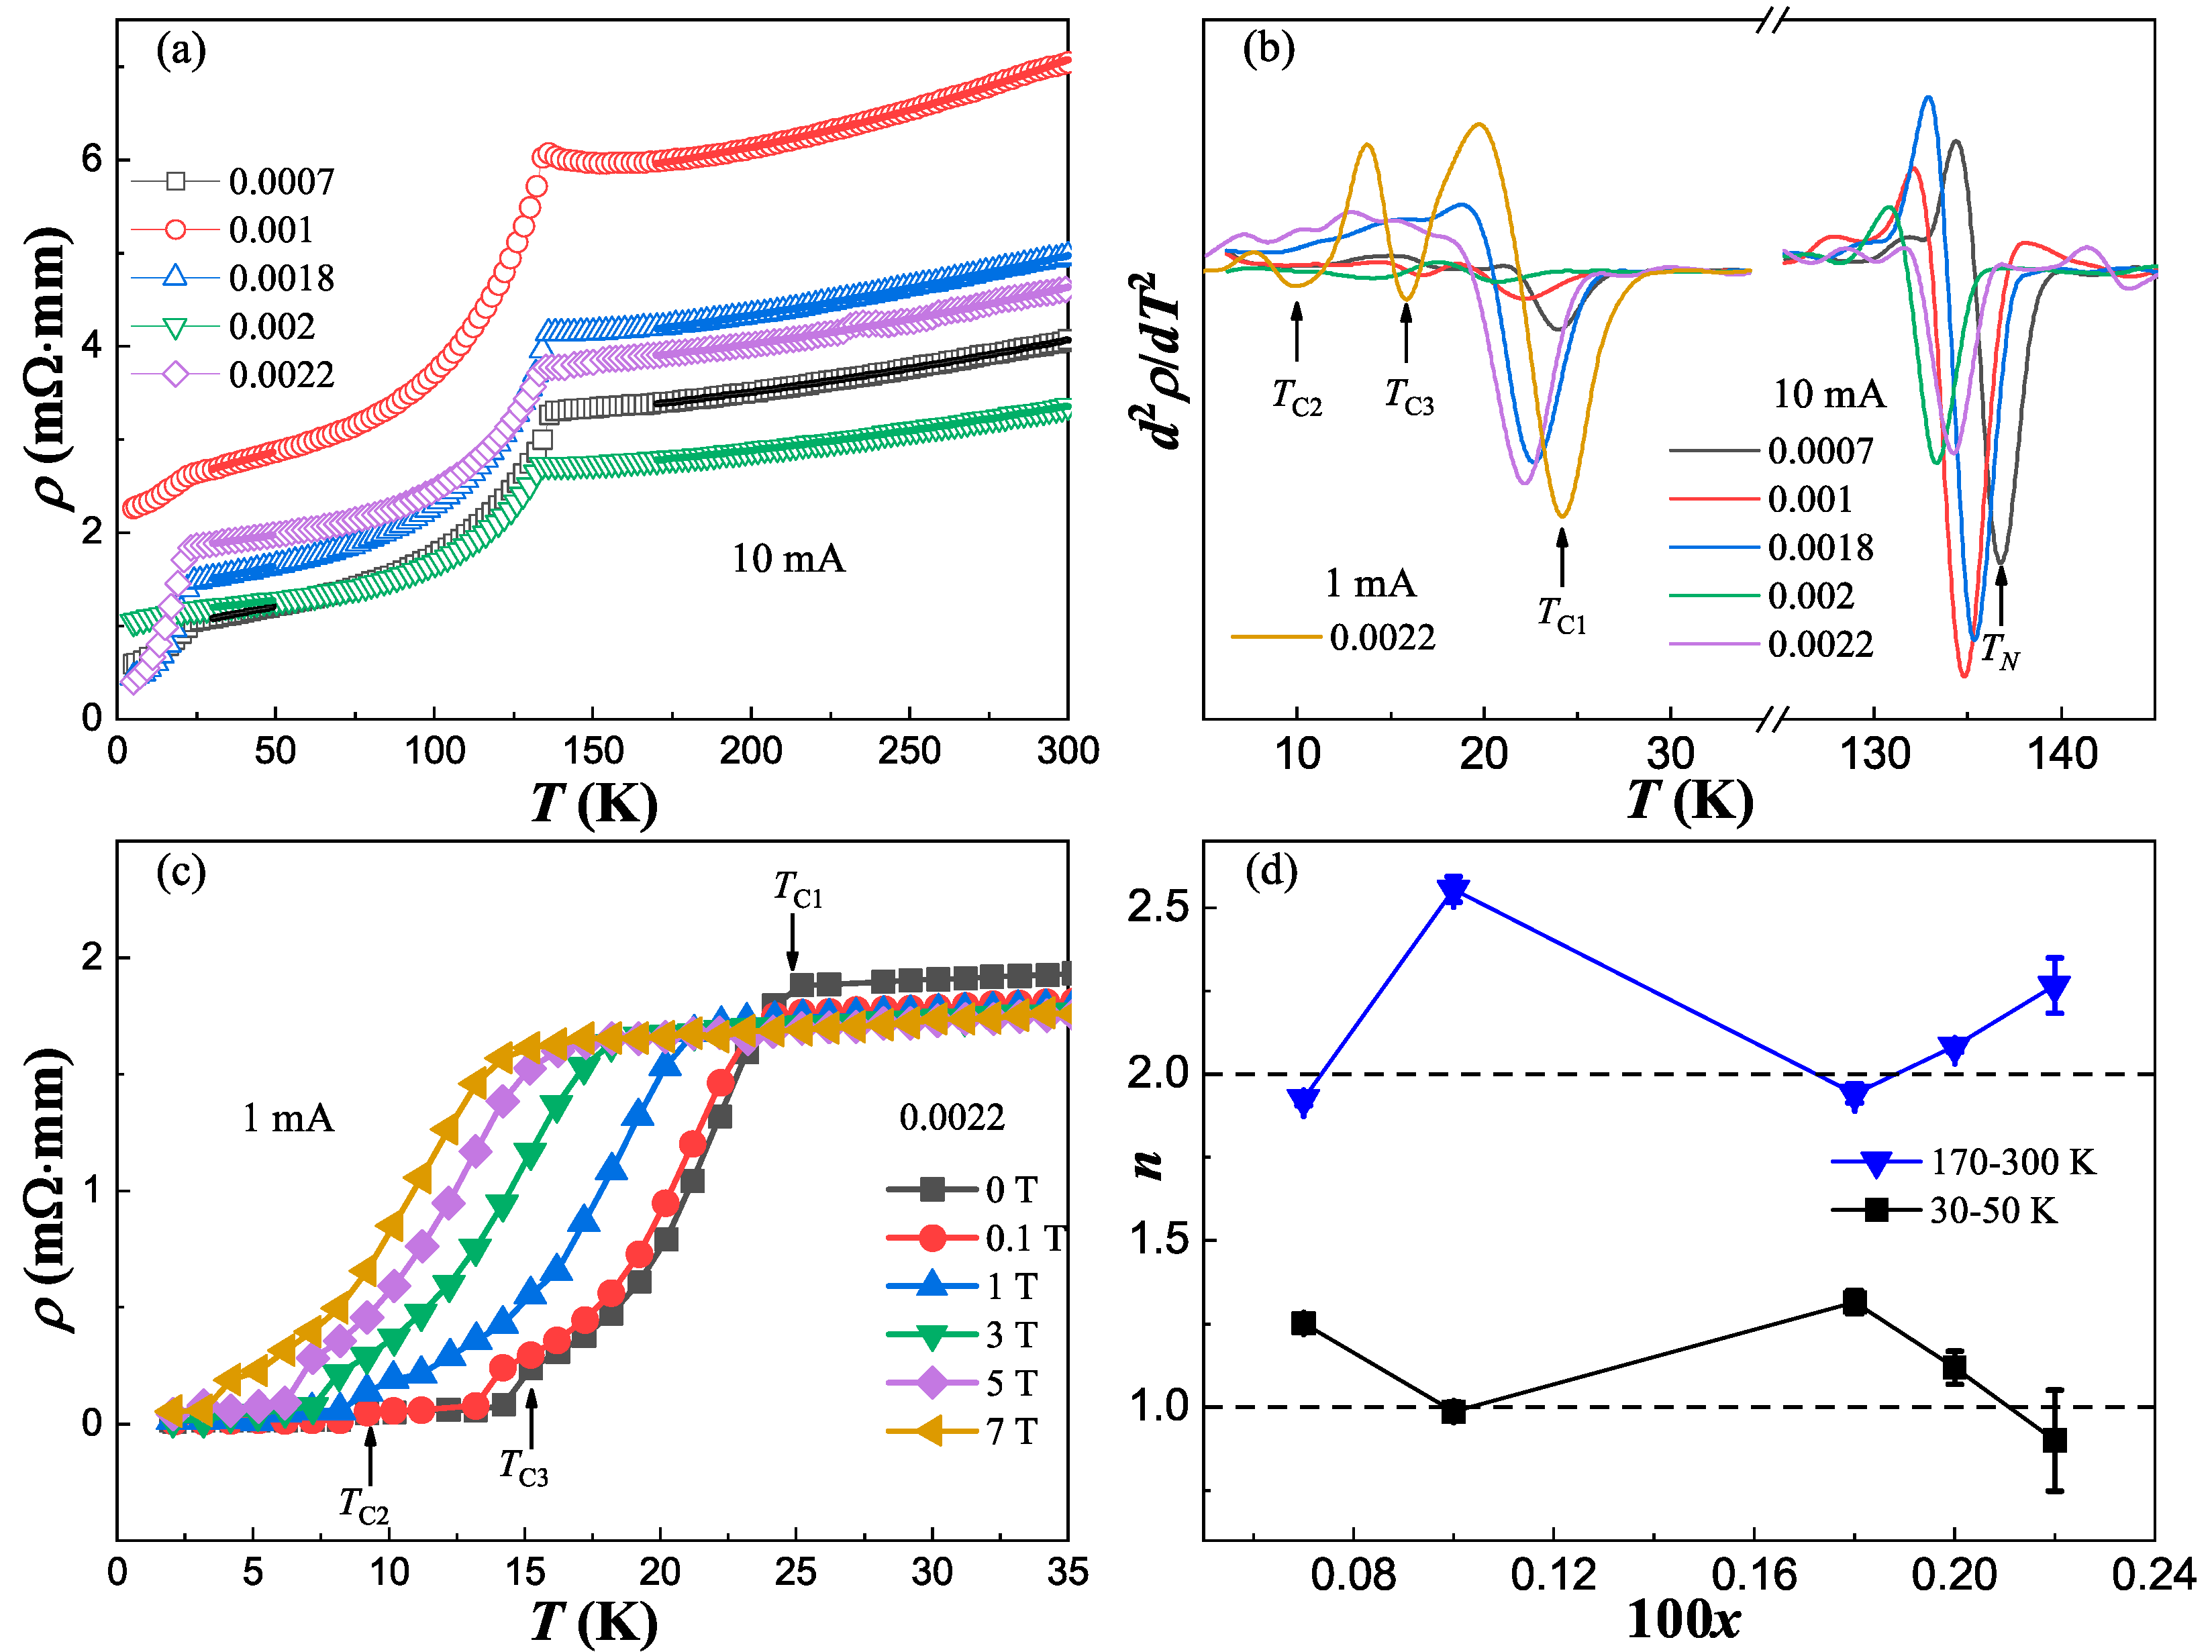
Figure 3.
The temperature dependence of magnetic susceptibility for (a) BaFe2(As1-xBix)2 (x = 0.0007, 0.0010 and 0.0018) with H = 20 Oe magnetic field, (b) x = 0.0020 and 0.0022 with H = 20 Oe magnetic field, and (c) x = 0.0022 under different magnetic fields. (d) The temperature dependence of µ0Hc2 for x = 0.0022 sample. The black points corresponding to the left coordinate axis are obtained from resistivity data in Figure 2 (c) and the blue points corresponding to the right coordinate axis from magnetization data in Figure 3 (c). The red solid line are the fitting lines according to GL function and the red dash lines according to WHH function.
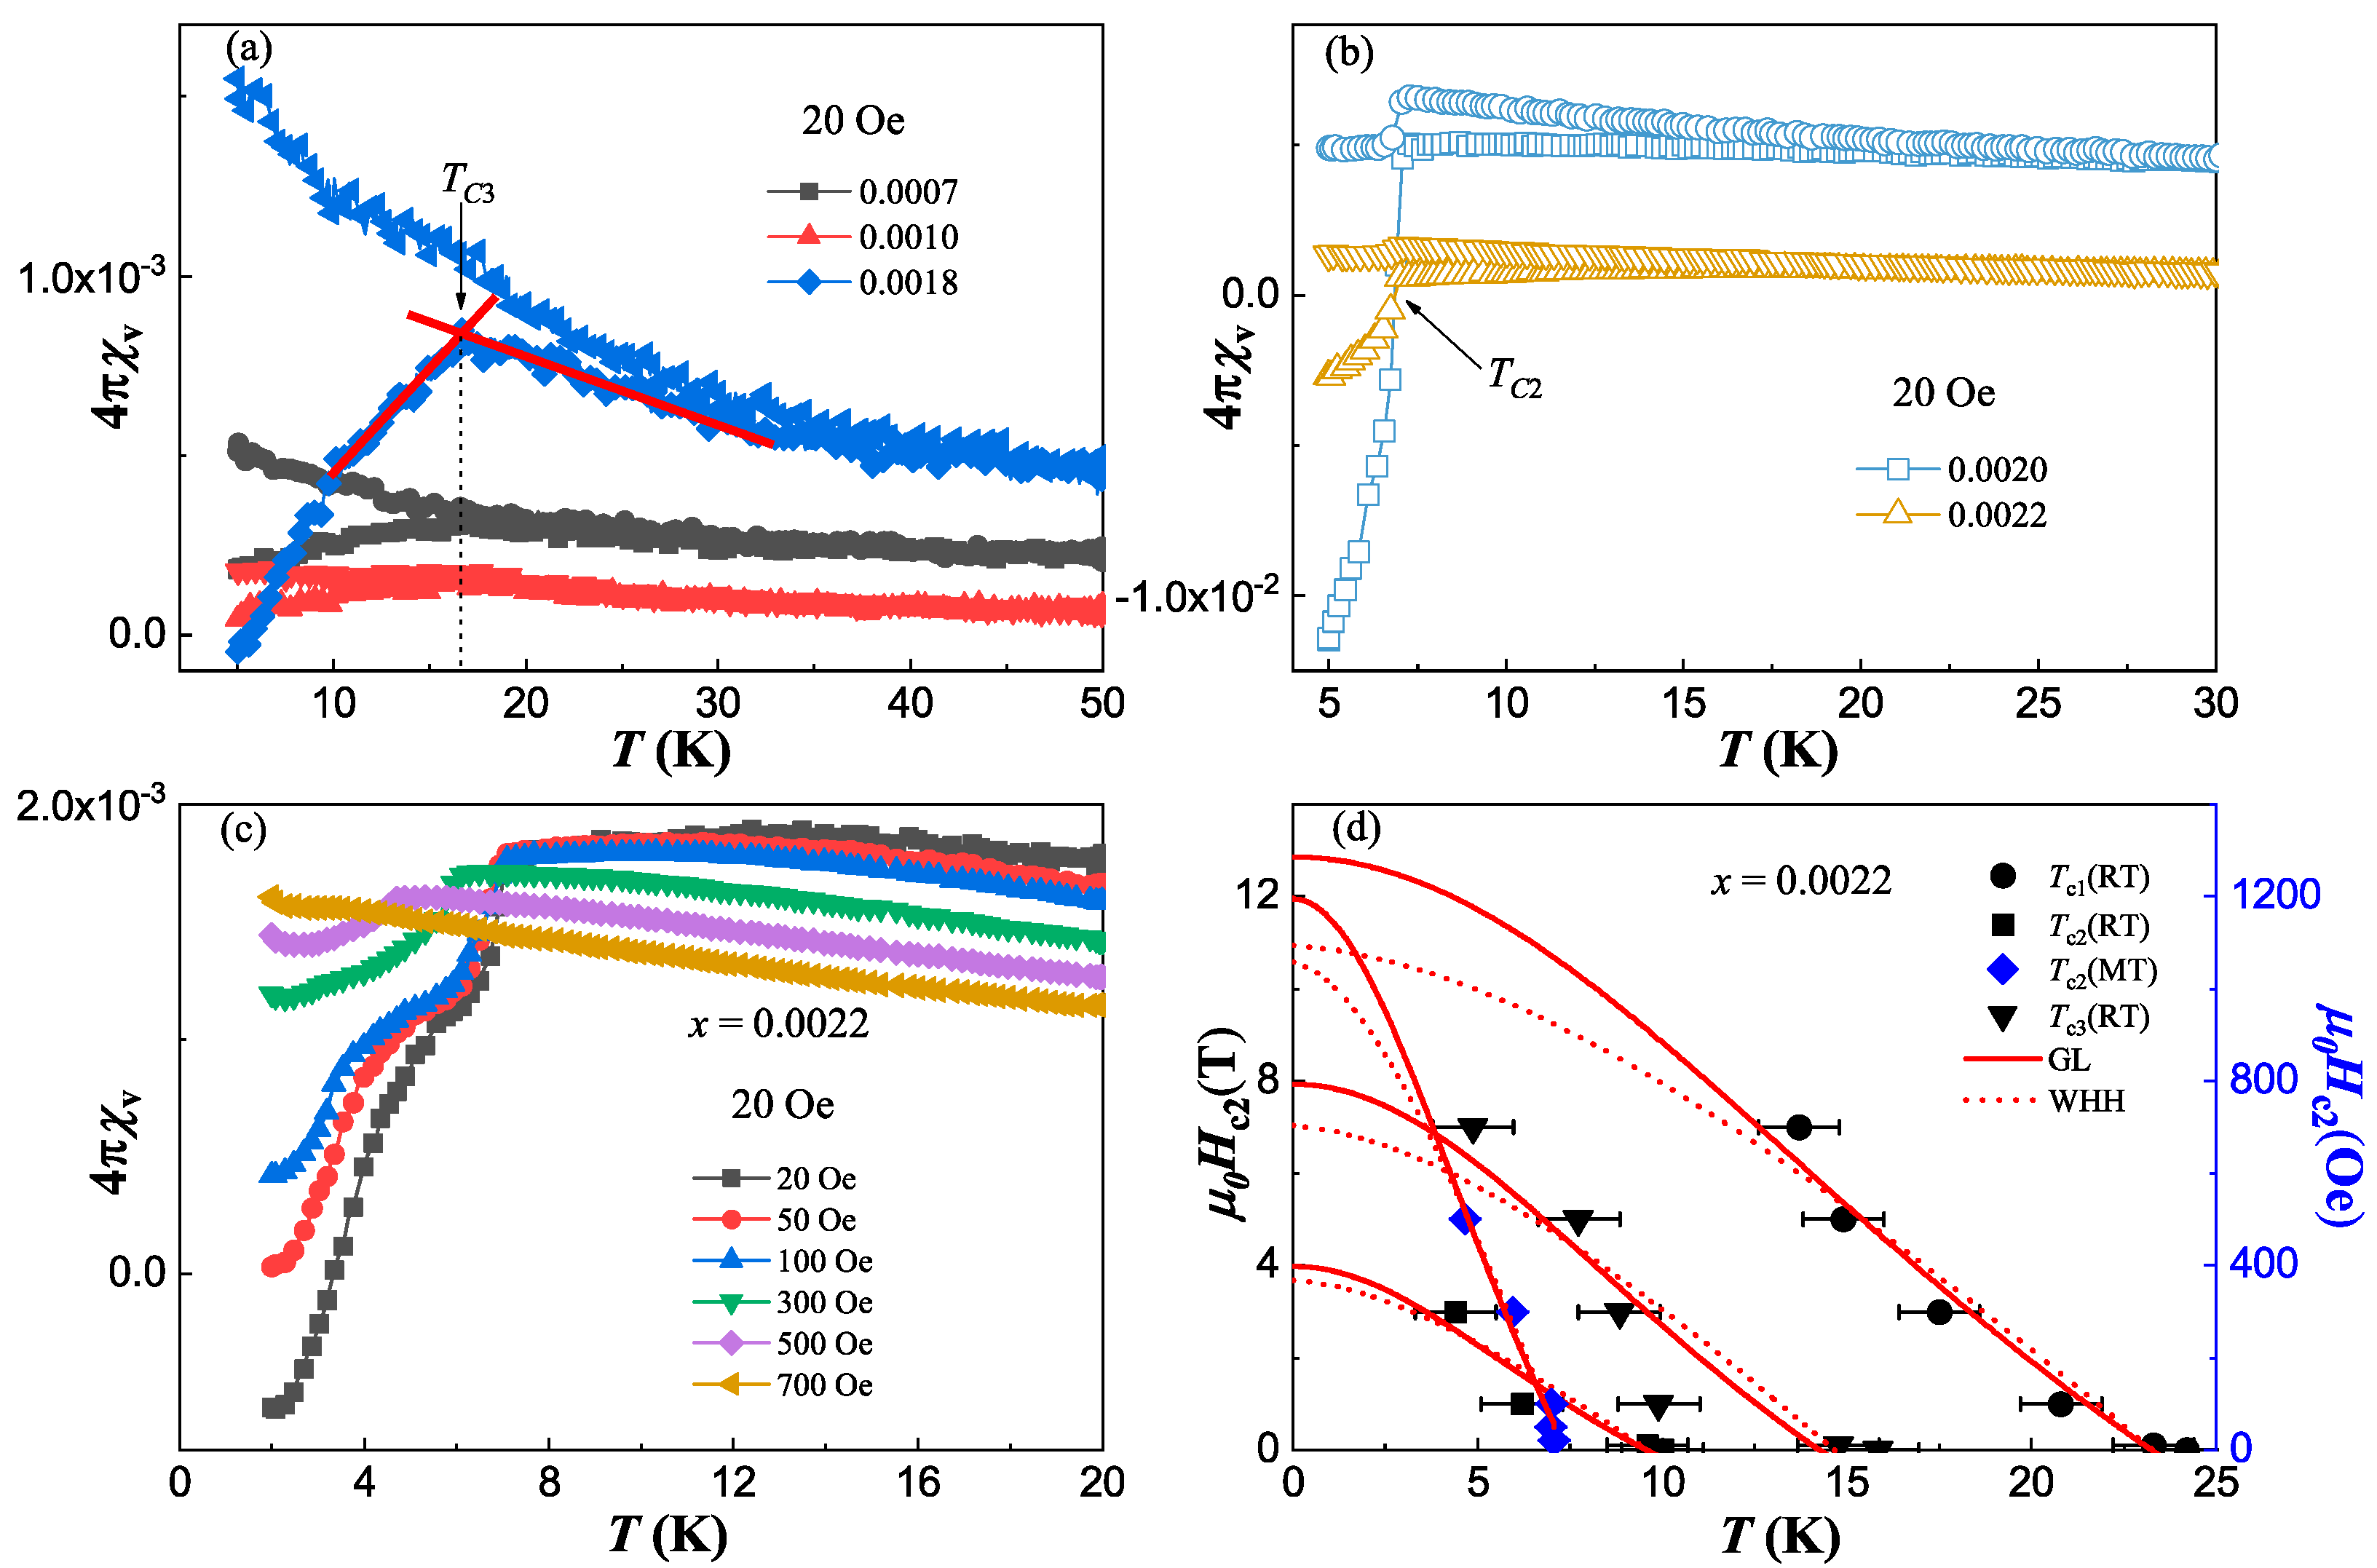
Figure 4.
(a) The temperature dependence of magnetic susceptibility for BaFe2(As1-xBix)2 single crystals with H = 1 T magnetic field. (b) The d2χ/dT2 as a function of temperature according to the data from (a). (c) The temperature dependence of 1/(χ − χ0) for x = 0.0018, 0.0020 and 0.0022 sample. The red solid lines are fits to the Curie-Weiss law. (d) The effective moment per Fe site as a function of the doping concentration x. The blue square points are our results and the black star point is from reference [33].
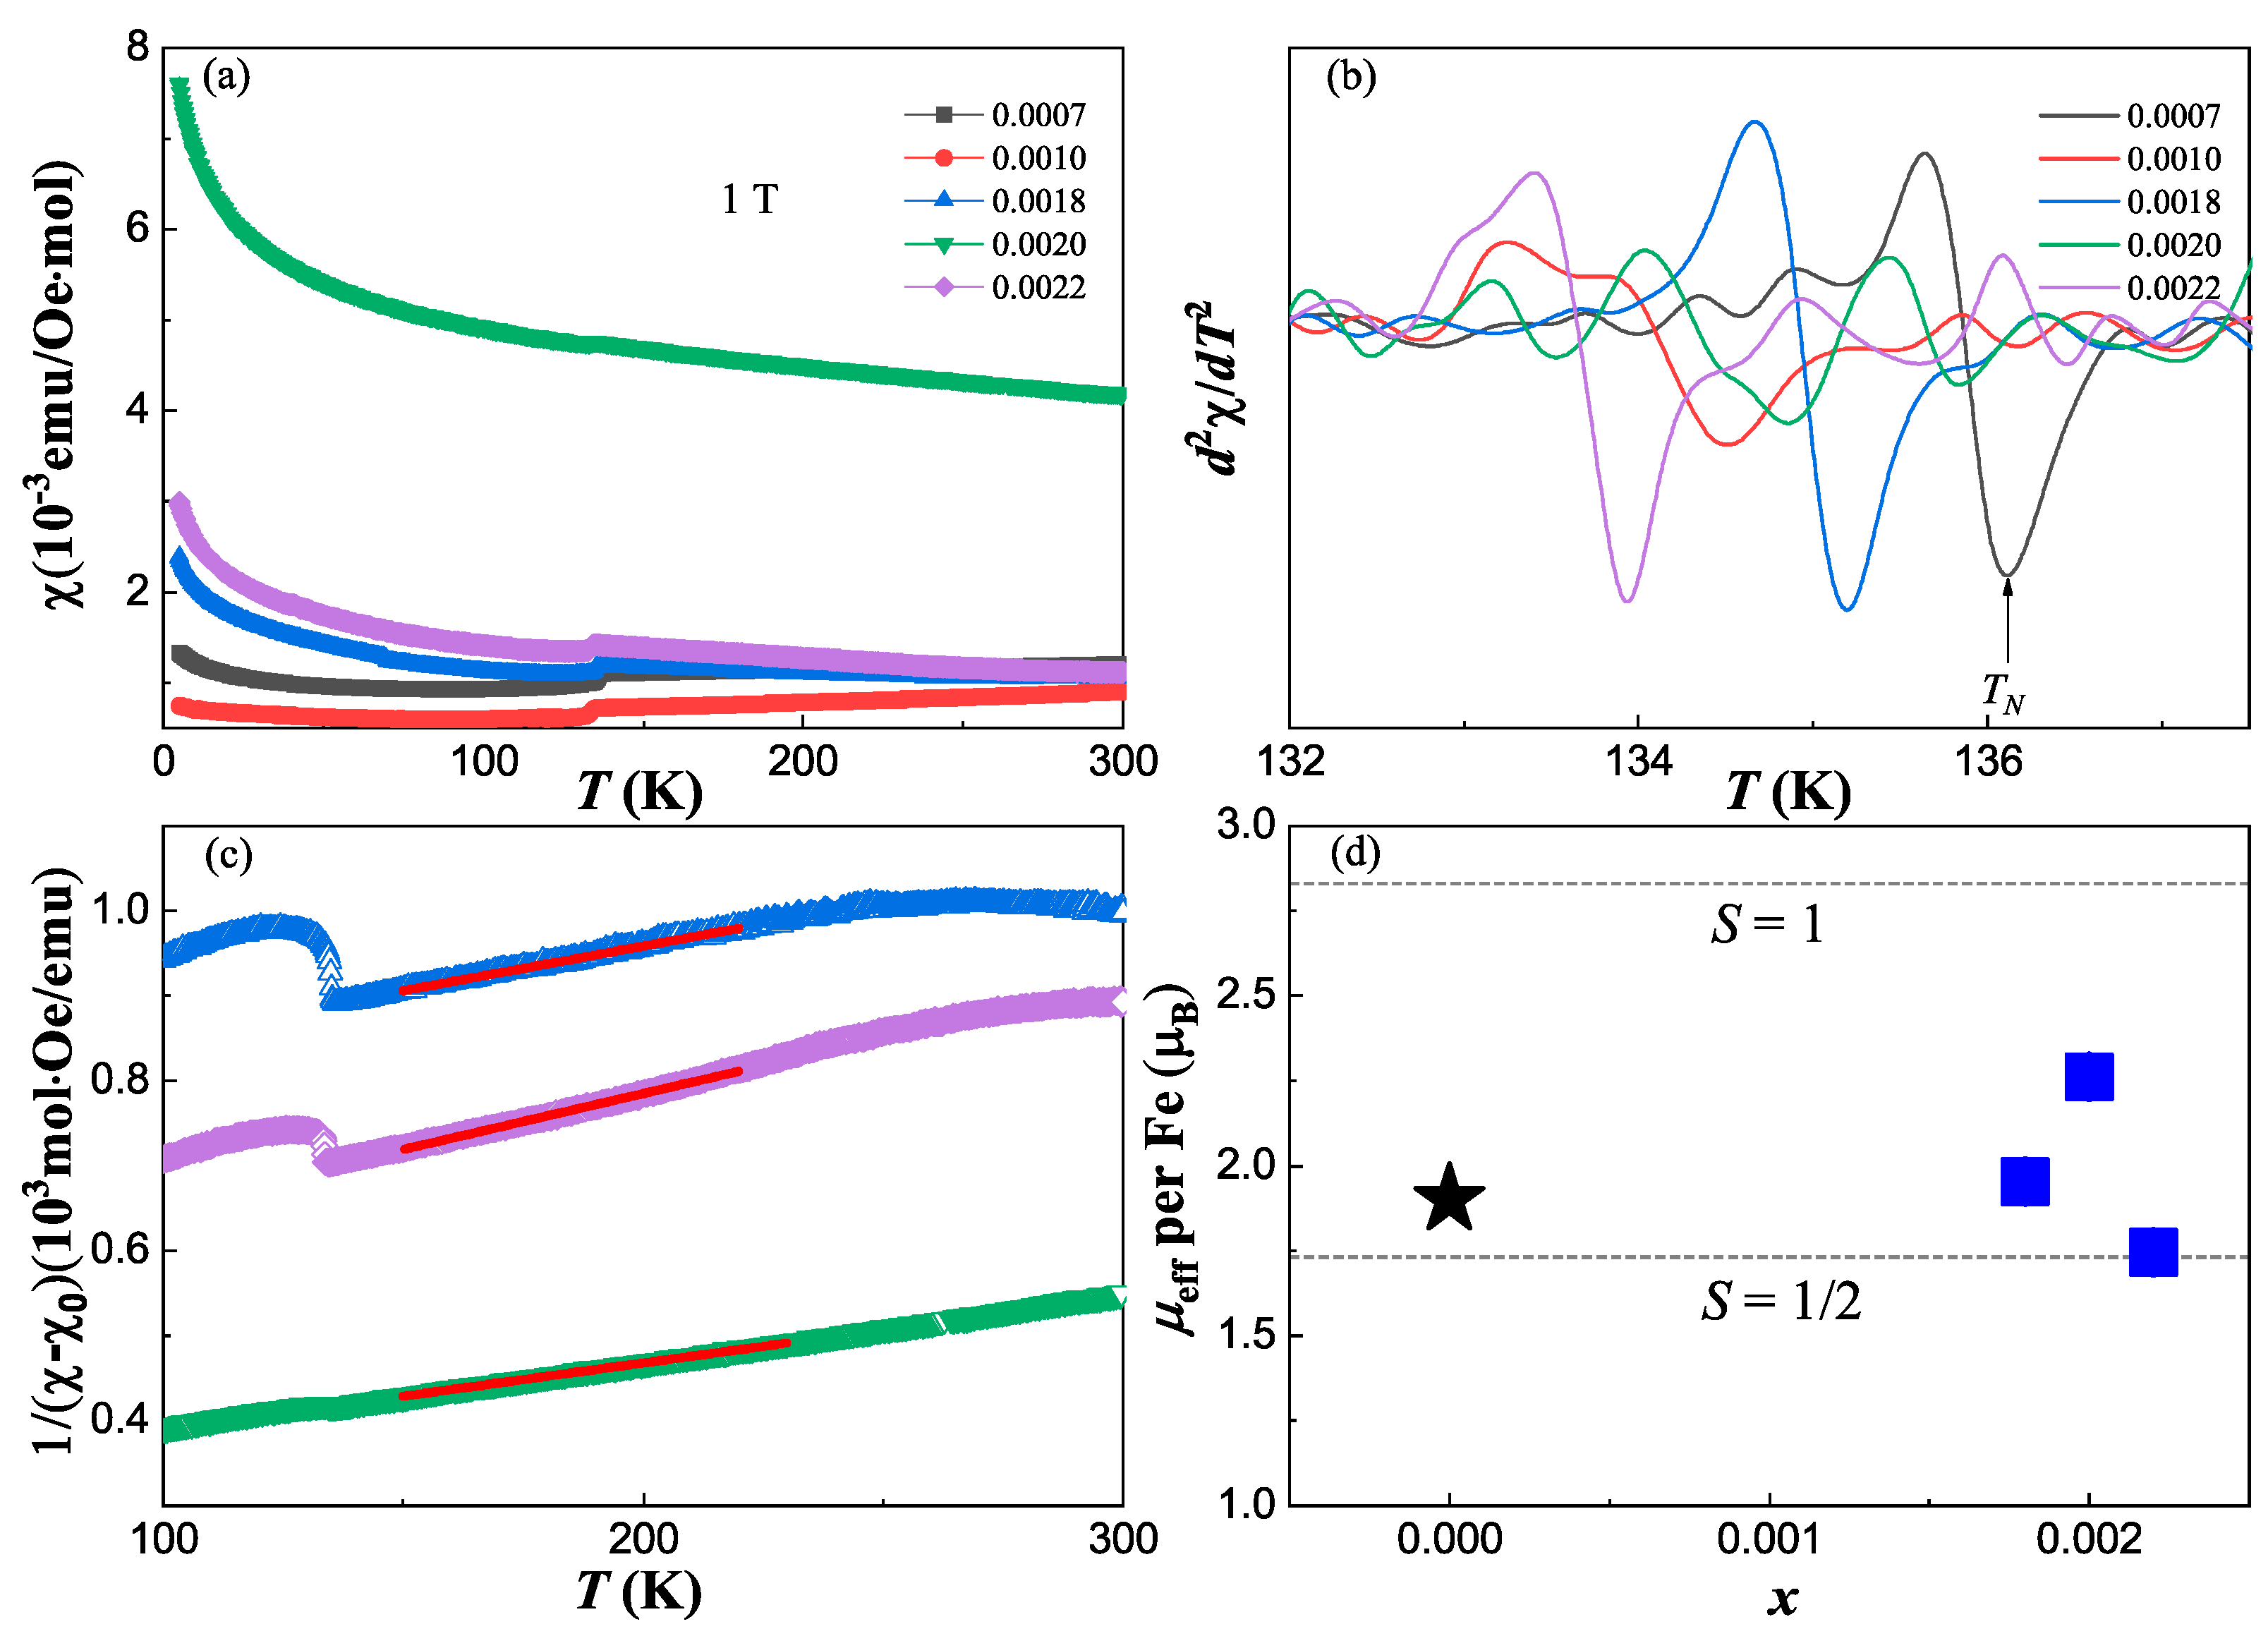
Figure 5.
(a) The concentration 100x dependence of superconducting Volume (left axis) and the relative variation ratio (V − V(x = 0.0007))/V(x = 0.0007) (right axis). (b) The phase diagram of BaFe2(As1-xBix)2 as a function of concentration 100x. The solid black (empty blue) points are derived from resistivity measured with 10 mA (1 mA) current. The solid red points are derived from magnetic susceptibility.


Table 1.
The nominal and actual doping concentration of BaFe2(As1-xBix)2 single crystals.
| Nominal x | Actual x |
|---|---|
| 0.01 | 0.0007 |
| 0.05 | 0.0020 |
| 0.10 | 0.0018 |
| 0.20 | 0.0022 |
| 0.35 | 0.0010 |
Table 2.
The superconducting transition temperature TC, upper critical field µ0HC2 and GL coherence length ξGL parameters obtained from WHH and GL fits for the three superconducting phases derived from resistivity and magnetic susceptibility measurements for the x = 0.0022 sample.
Table 2.
The superconducting transition temperature TC, upper critical field µ0HC2 and GL coherence length ξGL parameters obtained from WHH and GL fits for the three superconducting phases derived from resistivity and magnetic susceptibility measurements for the x = 0.0022 sample.
| x = 0.0022 | WHH fit | GL fit | |||
|---|---|---|---|---|---|
|
TC (K) |
µ0HC2 (T) |
TC (K) |
µ0HC2 (T) |
ξGL (Å) |
|
| SC I (RT) | 23.3 | 10.91 | 23.2 | 12.90 | 51 |
| SC II (RT) | 9.6 | 3.67 | 9.6 | 3.98 | 91 |
| SC II (MT) | 7.3 | 0.11 | 7.4 | 0.12 | 524 |
| SC III (RT) | 14.7 | 7.01 | 14.3 | 7.93 | 65 |
Disclaimer/Publisher’s Note: The statements, opinions and data contained in all publications are solely those of the individual author(s) and contributor(s) and not of MDPI and/or the editor(s). MDPI and/or the editor(s) disclaim responsibility for any injury to people or property resulting from any ideas, methods, instructions or products referred to in the content. |
© 2024 by the authors. Licensee MDPI, Basel, Switzerland. This article is an open access article distributed under the terms and conditions of the Creative Commons Attribution (CC BY) license (http://creativecommons.org/licenses/by/4.0/).
Copyright: This open access article is published under a Creative Commons CC BY 4.0 license, which permit the free download, distribution, and reuse, provided that the author and preprint are cited in any reuse.


