
Submitted:
18 January 2024
Posted:
19 January 2024
You are already at the latest version
Abstract
This study aimed to examine the association of blood triglyceride levels with fasting blood glucose levels and type 2 diabetes (T2D) prevalence in Chinese adults with normal triglyceride levels (<1.7 mmol/L), using linear regression and binary logistic regression, respectively. This cross-sectional study included 16,706 Chinese adults, among which 1,067 had T2D. Triglycerides were positively associated with fasting plasma glucose after multivariate adjustment (β=0.034, P<0.001). One natural log unit increase in blood triglycerides was associated with a 61% higher multivari-ate-adjusted risk of T2D (odds ratio [OR], 1.61; 95% confidence interval [CI], 1.19-2.17; P=0.002). The positive associations remained when participants who were treated with lipid-lowering or an-ti-diabetic drugs were excluded. The optimal cut-off of triglycerides for T2D was 1.09 mmol/L (obtained using Receiver Operating Characteristic curve analysis). Participants with triglycerides of ≥1.09 mmol/L had a 28% higher risk of T2D (OR, 1.28; 95% CI, 1.07-1.53; P=0.006) compared to those with triglycerides below the cut-off. In conclusion, this study showed that, in people with normal triglyceride levels, triglycerides at the upper normal range correlated with increased T2D diagnosis risk, with an optimal cut-off of 1.09 mmol/L. Therefore, adults with high “normal” triglyceride levels (1.09-1.69 mmol/L) may need to be closely monitored for the development of T2D.
Keywords:
diabetes mellitus
; triglyceride
; glucose
; association
; risk factor
1. Introduction
Diabetes is one of the largest global public health concerns, imposing a heavy global burden on public health [1,2]. In 2021, approximately 529 million individuals were affected by type 2 diabetes (T2D) corresponding to 6.1% of the world’s population [3,4]. Over 1 million deaths per year can be attributed to diabetes alone [5]. T2D accounts for ~90% of all diagnosed diabetes cases [6]. Therefore, it is important to identify modifiable factors for diabetes, particularly, T2D.
Epidemiological studies show that triglycerides are higher in patients with T2D [7,8]. Moreover, participants with higher than normal triglycerides (≥ 1.7 mmol/L or 150 mg/dL) [9] are associated with a higher risk of diabetes diagnosis [10,11], diabetes incidence [12,13,14,15,16,17], and diabetes mortality [11]. Higher than normal triglycerides are also associated with high cardiovascular mortality risk in people with diabetes [18].
To the best of our knowledge, only one study investigated the association between triglycerides and diabetes in people with normal triglycerides [19]. That study [19] found that higher normal triglycerides (from 1.13 to 1.69 mmol/L) were associated with an increased risk for new-onset T2D compared with those with triglycerides <1.13 mmol/L after a follow-up of 7.6 years. However, that study [19] has several limitations. First, only participants from Israel were studied. Second, the sample size was relatively small (N=3,722 participants with normal triglycerides). Third, whether normal triglycerides are associated with plasma glucose was not investigated. Fourth, whether normal triglycerides are associated with T2D prevalence was not investigated, as that study only enrolled participants without diabetes at baseline [19].
The current study aimed to investigate the associations between triglycerides and fasting plasma glucose and between triglycerides and T2D prevalence using a large group of Chinese adults (N=16,706) whose triglyceride levels were in the normal range (i.e., < 1.7 mmol/L).
2. Materials and Methods
2.1. Participants
A total of 22,571 participants underwent a routine health examination between January and May 2019 at the Health Physical Examination Centre of the First Affiliated Hospital of Shandong First Medical University, Jinan, Shandong Province, China [20]. A total of 5,771 participants were excluded as their triglyceride levels were ≥ 1.7 mmol/L, i.e., not in the normal range recommended by the US National Lipid Association Expert Panel [9]. Thirteen participants were further excluded due to being younger than 18 years and another one was excluded due to missing blood pressure data. In addition, 80 participants who were taking insulin were excluded. The remaining 16,706 adult participants were included in this cross-sectional study (Figure 1).
2.2. Definition of diabetes and T2D
2.3. Covariates
Blood pressure was measured in all participants by trained professionals using Omron HBP-9020 Automated BP Monitors (Omron Healthcare Co. Ltd., Tokyo, Japan) in the seated position after the participant rested for 10 minutes. Blood pressure was measured 2 times at 2-min intervals and mean systolic and diastolic blood pressure were recorded [22]. BMI was calculated as weight in kilograms divided by height in meters squared. Venous blood samples were collected after an overnight fast. Fasting plasma glucose and serum concentrations of triglycerides, LDL cholesterol, and HDL cholesterol were measured using the Olympus AU2700 automatic biochemical analyzer. The use of lipid-lowering drugs was categorized as the number of lipid-lowering drugs prescribed (0, 1, or 2). The use of anti-diabetic drugs was categorized as the number of anti-diabetic drugs prescribed (0, 1, 2, 3, or 4).
2.4. Statistical analyses
All statistical analyses were performed using SPSS version 27.0 (IBM SPSS Statistics for Windows, Armonk, NY, International Business Machines Corporation). Data were expressed as mean and standard deviation (SD) for continuous variables or number and percentage for categorical variables [23]. Statistical comparisons of continuous data among groups were performed using one-way ANOVA (for LDL cholesterol) or Kruskal-Wallis one-way ANOVA (for age, triglycerides, glucose, BMI, systolic blood pressure, and HDL cholesterol) [18]. Statistical comparisons of categorical data among groups were performed using Pearson’s Chi-square test [24]. The associations between triglycerides and glucose and between triglycerides and diabetes diagnosis were analyzed by linear regression and binary logistic regression, respectively, with or without adjustment for confounding factors including age, sex, BMI, systolic blood pressure, HDL cholesterol, LDL cholesterol, use of lipid-lowering drugs, and use of anti-diabetic drugs. Age, fasting plasma glucose, BMI, systolic blood pressure, triglycerides, and HDL cholesterol were natural log-transformed before putting into the regression models. Sensitivity analyses were conducted when those participants who were using lipid-lowering drugs or anti-diabetic drugs (N=414) were excluded. Receiver operating characteristic (ROC) curves were constructed and the area under the curve (AUC) was calculated to assess the association of triglycerides and diabetes diagnosis and to determine the optimal cutoff of triglycerides for increased risk of T2D according to the Youden index [25]. All tests were two-sided and a P value of < 0.05 was regarded as statistically significant.
3. Results
3.1. Clinical characteristics of the participants
The study included 16,706 participants aged 18–95 years with a mean (SD) age of 44.9 (14.3) years (Table 1). Among those participants, 1,067 had T2D. Participants with higher triglycerides had higher fasting plasma glucose, higher prevalence of T2D, and higher prevalence of use of anti-diabetic drugs. In addition, participants with higher triglycerides were older and had a higher percentage of males, higher body mass index (BMI), higher systolic blood pressure, higher low-density lipoprotein (LDL) cholesterol, and lower high-density lipoprotein (HDL) cholesterol (Table 1).
3.2. Triglycerides were positively associated with fasting plasma glucose in participants with normal triglycerides
3.3. Higher triglycerides were a risk factor for T2D in participants with normal triglycerides
Logistic regression analyses showed that higher triglycerides (continuous variable) were associated with higher risks of T2D, and a 1-natural-log-unit increase in triglycerides (e.g., from 0.50 to 1.36 mmol/L or from 44 to 120 mg/dL) was associated with a 61% higher multivariate-adjusted risk of diabetes diagnosis (odds ratio [OR], 1.61; 95% confidence interval [CI], 1.19-2.17; P=0.002; Table 3).
The Receiver Operating Characteristic (ROC) curve analysis confirmed that higher triglycerides were significantly associated with higher risks of T2D (area under the curve, 0.63; 95% CI, 0.61-0.64; P<0.001; Figure 3). The prevalence of T2D was 4.5% and 9.3% in those with triglycerides <1.09 mmol/L and ≥1.09 mmol/L, respectively (Table 4). The optimal cutoff value, assessed by the Youden Index, was 1.09 mmol/L. When triglycerides were treated as a dichotomous variable using this optimal cutoff (i.e., ≥1.09 mmol/L or <1.09 mmol/L), participants with triglycerides at or above the cutoff had a 28% higher risk of diabetes diagnosis (OR, 1.28; 95% CI, 1.07-1.53; P=0.006; Table 5) compared with those with triglycerides below the cutoff.
Further analyses were conducted when triglycerides were treated as quartiles. Results showed that higher triglycerides (top versus bottom quartile) were associated with a 54% higher multivariate-adjusted risk of T2D diagnosis (OR, 1.54; 95% CI, 1.14-2.09; Table 6).
3.4. Sensitivity analyses
4. Discussion
This study found, for the first time, that triglycerides were positively associated with fasting plasma glucose in a large group of Chinese participants who had normal triglycerides. In addition, triglycerides in the normal range were positively associated with T2D prevalence, and those with high normal triglycerides (1.09-1.69 mmol/L) had a 28% higher multivariate-adjusted risk of T2D compared with those with low normal triglycerides (<1.09 mmol/L).
The positive association between hypertriglyceridemia and diabetes is well-known [10,11,12,13,14,15,16,17,18]. Most evidence supports a causal role of abnormally high triglycerides in diabetes pathogenesis. For example, in people without diabetes at baseline, higher fasting triglycerides predicted impaired glucose tolerance [26], impaired fasting glucose, new-onset diabetes [14,15,16,17,19], and diabetes-caused mortality [11]. In addition, some triglyceride-lowering drugs are frequently reported to be associated with better glycemic control; examples of these drugs include the peroxisome proliferator-activated receptors (PPAR) alpha agonist fenofibrate [27], the PPAR alpha/delta agonist GFT505 [28], and the diacylglycerol acyltransferase 1 inhibitor pradigastat [29].
Some potential mechanisms have been proposed to explain the possible diabetes-causing role of hypertriglyceridemia. High concentrations of triglycerides and their metabolites could inhibit glucose transporter activity by reducing phosphoinositide 3-kinase [30]. In addition, high triglycerides could decrease glucose utilization by inhibiting glucose oxidation [31]. Moreover, high triglycerides decrease glycogen synthesis rate as well as glycogen content in the muscle [32].
However, some genetic studies provide conflicting information. For example, triglyceride-enhancing alleles have been reported to be either positively associated with [33], inversely associated with [16,34,35], or not associated with diabetes [36]. One of the genetic studies [16] revealed inconsistency between genetic and non-genetic results from the same cohort of participants: baseline circulating triglyceride levels were positively associated with new-onset diabetes; whereas triglycerides-enhancing alleles were negatively associated with new onset of the disease. The reasons underlying the observed inconsistencies [16] are unknown; some of the selected genetic alleles might have other functions beyond regulating circulating triglycerides.
So far, only one study investigated the association between triglycerides and T2D in people with normal triglycerides [19] and found that higher normal triglycerides (from 1.13 to 1.69 mmol/L) were associated with an increased risk for new-onset T2D compared with those with triglycerides <1.13 mmol/L after a follow-up of 7.6 years in 3,722 Israeli participants who did not have diabetes at baseline. However, it is unknown whether normal triglycerides are associated with plasma glucose or T2D prevalence. Therefore, more studies are needed to address these questions, and it would also be of value to use participants from another ethnic background, as ethnicity often affects health status and disease outcomes [37,38,39,40].
This study found that, in a large group of Chinese adults with normal triglycerides, triglycerides were positively associated with fasting plasma glucose. The mechanism underlying this novel finding is unclear. It is unknown whether the above-mentioned mechanisms, which explain the effect of hypertriglyceridemia on blood glucose, work under normal triglyceride conditions. It is also worth noting that one cannot rule out the possibility that higher blood glucose could lead to higher circulating triglycerides due to the cross-sectional design of the current study.
The current study also revealed that triglycerides were positively associated with diabetes prevalence in people with normal triglycerides. Thus, this study expanded the positive association between abnormally high triglycerides and diabetes prevalence [10,11] to people with “normal” triglycerides (< 1.7 mmol/L) and found that people with a triglycerides level between 1.09 and 1.69 mmol/L had a 28% higher risk of T2D compared with those with triglycerides <1.09 mmol/L.
This study had several strengths. First, the associations between triglycerides and plasma glucose and between triglycerides and T2D were adjusted for both HDL cholesterol and LDL cholesterol, as these two types of cholesterol are common confounding factors for triglycerides [28,41,42]. Second, this study had a large sample size (N = 16,706). This study also had several limitations. First, the cross-sectional nature of the study could not establish a causal relationship between triglycerides and plasma glucose and between triglycerides and T2D. Second, this study only adjusted for a limited number of confounders.
5. Conclusions
This study found that higher triglycerides were positively associated with fasting plasma glucose and T2D prevalence in Chinese adult participants with normal triglycerides. Adults with high “normal” triglyceride levels (1.09-1.69 mmol/L) may need to be closely monitored for the development of T2D.
Author Contributions
Conceptualization: Y.W., G.Y.; Methodology: H.L., S.M., T.Q., H.S., Q.X., Resources: X.H., W.H., G. Z.; Formal analysis and investigation: Y.W.; Writing - original draft preparation: Y.W., M.J., D.S., A.J.R.H.; Writing - review and editing: all authors.
Funding
This research was funded by the Shandong Natural Fund, grant number ZR2015HL008, and by the National Health and Medical Research Council of Australia, grant number 1062671.
Institutional Review Board Statement
The study was conducted in accordance with the Declaration of Helsinki, and approved by the Research Ethics Committee of the First Affiliated Hospital of Shandong First Medical University (approval code: S545).
Informed Consent Statement
Patient consent was waived on the basis that this study was to analyze a deidentified dataset.
Data Availability Statement
Datasets are available from corresponding authors on reasonable request.
Acknowledgments
None.
Conflicts of Interest
The authors declare no conflicts of interest.
References
- Lin, X.; Xu, Y.; Pan, X.; Xu, J.; Ding, Y.; Sun, X.; Song, X.; Ren, Y.; Shan, P.-F. Global, regional, and national burden and trend of diabetes in 195 countries and territories: an analysis from 1990 to 2025. Sci. Rep. 2020, 10, 14790. [Google Scholar] [CrossRef] [PubMed]
- Xie, J.; Wang, M.; Long, Z.; Ning, H.; Li, J.; Cao, Y.; Liao, Y.; Liu, G.; Wang, F.; Pan, A. Global burden of type 2 diabetes in adolescents and young adults, 1990-2019: systematic analysis of the Global Burden of Disease Study 2019. BMJ 2022, 379, e072385. [Google Scholar] [CrossRef] [PubMed]
- Ong, K.L.; Stafford, L.K.; McLaughlin, S.A.; Boyko, E.J.; Vollset, S.E.; Smith, A.E.; Dalton, B.E.; Duprey, J.; Cruz, J.A.; Hagins, H.; et al. Global, regional, and national burden of diabetes from 1990 to 2021, with projections of prevalence to 2050: a systematic analysis for the Global Burden of Disease Study 2021. The Lancet 2023, 402, 203–234. [Google Scholar] [CrossRef] [PubMed]
- Safiri, S.; Karamzad, N.; Kaufman, J.S.; Bell, A.W.; Nejadghaderi, S.A.; Sullman, M.J.M.; Moradi-Lakeh, M.; Collins, G.; Kolahi, A.A. Prevalence, Deaths and Disability-Adjusted-Life-Years (DALYs) Due to Type 2 Diabetes and Its Attributable Risk Factors in 204 Countries and Territories, 1990-2019: Results From the Global Burden of Disease Study 2019. Front. Endocrinol. (Lausanne) 2022, 13, 838027. [Google Scholar] [CrossRef] [PubMed]
- Khan, M.A.B.; Hashim, M.J.; King, J.K.; Govender, R.D.; Mustafa, H.; Al Kaabi, J. Epidemiology of Type 2 Diabetes - Global Burden of Disease and Forecasted Trends. J Epidemiol Glob Health 2020, 10, 107–111. [Google Scholar] [CrossRef] [PubMed]
- Bullard, K.M.; Cowie, C.C.; Lessem, S.E.; Saydah, S.H.; Menke, A.; Geiss, L.S.; Orchard, T.J.; Rolka, D.B.; Imperatore, G. Prevalence of Diagnosed Diabetes in Adults by Diabetes Type - United States, 2016. MMWR Morb. Mortal. Wkly. Rep. 2018, 67, 359–361. [Google Scholar] [CrossRef]
- Al-Mawali, A.; Al-Harrasi, A.; Jayapal, S.K.; Morsi, M.; Pinto, A.D.; Al-Shekaili, W.; Al-Kharusi, H.; Al-Balushi, Z.; Idikula, J. Prevalence and risk factors of diabetes in a large community-based study in the Sultanate of Oman: STEPS survey 2017. BMC Endocr. Disord. 2021, 21, 42. [Google Scholar] [CrossRef]
- Urrutia, I.; Martín-Nieto, A.; Martínez, R.; Casanovas-Marsal, J.O.; Aguayo, A.; Del Olmo, J.; Arana, E.; Fernandez-Rubio, E.; Castaño, L.; Gaztambide, S. Incidence of diabetes mellitus and associated risk factors in the adult population of the Basque country, Spain. Sci. Rep. 2021, 11, 3016. [Google Scholar] [CrossRef]
- Jacobson, T.A.; Ito, M.K.; Maki, K.C.; Orringer, C.E.; Bays, H.E.; Jones, P.H.; McKenney, J.M.; Grundy, S.M.; Gill, E.A.; Wild, R.A.; et al. National Lipid Association recommendations for patient-centered management of dyslipidemia: part 1 - executive summary. J. Clin. Lipidol. 2014, 8, 473–488. [Google Scholar] [CrossRef]
- Dai, C.Y.; Huang, J.F.; Hsieh, M.Y.; Lee, L.P.; Hou, N.J.; Yu, M.L.; Chuang, W.L. Links between triglyceride levels, hepatitis C virus infection and diabetes. Gut 2007, 56, 1167–1168. [Google Scholar]
- Wang, Y. Higher fasting triglyceride predicts higher risks of diabetes mortality in US adults. Lipids Health Dis. 2021, 20, 181. [Google Scholar] [CrossRef]
- D'Agostino, R.B., Jr.; Hamman, R.F.; Karter, A.J.; Mykkanen, L.; Wagenknecht, L.E.; Haffner, S.M. Cardiovascular disease risk factors predict the development of type 2 diabetes: the insulin resistance atherosclerosis study. Diabetes Care 2004, 27, 2234–2240. [Google Scholar] [CrossRef]
- Wilson, P.W.; Meigs, J.B.; Sullivan, L.; Fox, C.S.; Nathan, D.M.; D'Agostino, R.B., Sr. Prediction of incident diabetes mellitus in middle-aged adults: the Framingham Offspring Study. Arch. Intern. Med. 2007, 167, 1068–1074. [Google Scholar] [CrossRef] [PubMed]
- Zhao, J.; Zhang, Y.; Wei, F.; Song, J.; Cao, Z.; Chen, C.; Zhang, K.; Feng, S.; Wang, Y.; Li, W.-D. Triglyceride is an independent predictor of type 2 diabetes among middle-aged and older adults: a prospective study with 8-year follow-ups in two cohorts. J. Transl. Med. 2019, 17, 403. [Google Scholar] [CrossRef] [PubMed]
- Fujihara, K.; Sugawara, A.; Heianza, Y.; Sairenchi, T.; Irie, F.; Iso, H.; Doi, M.; Shimano, H.; Watanabe, H.; Sone, H.; et al. Utility of the triglyceride level for predicting incident diabetes mellitus according to the fasting status and body mass index category: the Ibaraki Prefectural Health Study. J Atheroscler Thromb 2014, 21, 1152–1169. [Google Scholar] [CrossRef] [PubMed]
- Klimentidis, Y.C.; Chougule, A.; Arora, A.; Frazier-Wood, A.C.; Hsu, C.H. Triglyceride-Increasing Alleles Associated with Protection against Type-2 Diabetes. PLoS Genet. 2015, 11, e1005204. [Google Scholar] [CrossRef]
- Tirosh, A.; Shai, I.; Bitzur, R.; Kochba, I.; Tekes-Manova, D.; Israeli, E.; Shochat, T.; Rudich, A. Changes in triglyceride levels over time and risk of type 2 diabetes in young men. Diabetes Care 2008, 31, 2032–2037. [Google Scholar] [CrossRef]
- Wang, Y.; Fang, Y.; Magliano, D.J.; Charchar, F.J.; Sobey, C.G.; Drummond, G.R.; Golledge, J. Fasting triglycerides are positively associated with cardiovascular mortality risk in people with diabetes. Cardiovasc. Res. 2023, 119, 826–834. [Google Scholar] [CrossRef]
- Beshara, A.; Cohen, E.; Goldberg, E.; Lilos, P.; Garty, M.; Krause, I. Triglyceride levels and risk of type 2 diabetes mellitus: a longitudinal large study. J. Investig. Med. 2016, 64, 383–387. [Google Scholar] [CrossRef]
- Wang, Y.; Shao, Y.; Qian, T.; Sun, H.; Xu, Q.; Hou, X.; Hu, W.; Zhang, G.; Song, D.; Fang, Y.; et al. Hypouricemia is a risk factor for diabetes in Chinese adults. Obesity Medicine 2022, 31, 100405. [Google Scholar] [CrossRef]
- American Diabetes Association. 2. Classification and Diagnosis of Diabetes: Standards of Medical Care in Diabetes—2021. Diabetes Care 2021, 44, S15–S33. [Google Scholar] [CrossRef] [PubMed]
- Wang, Y.; Zhang, W.; Qian, T.; Sun, H.; Xu, Q.; Hou, X.; Hu, W.; Zhang, G.; Drummond, G.R.; Sobey, C.G.; et al. Reduced renal function may explain the higher prevalence of hyperuricemia in older people. Sci. Rep. 2021, 11, 1302. [Google Scholar] [CrossRef]
- Wang, Y. Definition, prevalence, and risk factors of low sex hormone-binding globulin in US adults. J Clin Endocrinol Metab 2021, 106, e3946–e3956. [Google Scholar] [CrossRef]
- Wang, Y. Stage 1 hypertension and risk of cardiovascular disease mortality in United States adults with or without diabetes. J. Hypertens. 2022, 40, 794–803. [Google Scholar] [CrossRef]
- İlhan Topcu, D.; Can Çubukçu, H. Optimization of patient-based real-time quality control based on the Youden index. Clin. Chim. Acta 2022, 534, 50–56. [Google Scholar] [CrossRef]
- Love-Osborne, K.; Butler, N.; Gao, D.; Zeitler, P. Elevated fasting triglycerides predict impaired glucose tolerance in adolescents at risk for type 2 diabetes. Pediatr. Diabetes 2006, 7, 205–210. [Google Scholar] [CrossRef]
- Damci, T.; Tatliagac, S.; Osar, Z.; Ilkova, H. Fenofibrate treatment is associated with better glycemic control and lower serum leptin and insulin levels in type 2 diabetic patients with hypertriglyceridemia. Eur. J. Intern. Med. 2003, 14, 357–360. [Google Scholar] [CrossRef]
- Cariou, B.; Zaïr, Y.; Staels, B.; Bruckert, E. Effects of the New Dual PPARα/δ Agonist GFT505 on Lipid and Glucose Homeostasis in Abdominally Obese Patients With Combined Dyslipidemia or Impaired Glucose Metabolism. Diabetes Care 2011, 34, 2008–2014. [Google Scholar] [CrossRef]
- Meyers, C.D.; Amer, A.; Majumdar, T.; Chen, J. Pharmacokinetics, pharmacodynamics, safety, and tolerability of pradigastat, a novel diacylglycerol acyltransferase 1 inhibitor in overweight or obese, but otherwise healthy human subjects. J. Clin. Pharmacol. 2015, 55, 1031–1041. [Google Scholar] [CrossRef]
- Shulman, G.I. Cellular mechanisms of insulin resistance. J. Clin. Invest. 2000, 106, 171–176. [Google Scholar] [CrossRef]
- Jensen, C.B.; Storgaard, H.; Holst, J.J.; Dela, F.; Madsbad, S.; Vaag, A.A. Insulin secretion and cellular glucose metabolism after prolonged low-grade intralipid infusion in young men. J Clin Endocrinol Metab 2003, 88, 2775–2783. [Google Scholar] [CrossRef]
- Phielix, E.; Begovatz, P.; Gancheva, S.; Bierwagen, A.; Kornips, E.; Schaart, G.; Hesselink, M.K.C.; Schrauwen, P.; Roden, M. Athletes feature greater rates of muscle glucose transport and glycogen synthesis during lipid infusion. JCI insight 2019, 4, e127928. [Google Scholar] [CrossRef]
- Lee, K.H.; Kim, O.Y.; Lim, H.H.; Lee, Y.J.; Jang, Y.; Lee, J.H. Contribution of APOA5-1131C allele to the increased susceptibility of diabetes mellitus in association with higher triglyceride in Korean women. Metabolism 2010, 59, 1583–1590. [Google Scholar] [CrossRef]
- Yan, J.; Hu, C.; Jiang, F.; Zhang, R.; Wang, J.; Tang, S.; Peng, D.; Chen, M.; Bao, Y.; Jia, W. Genetic variants of PLA2G6 are associated with Type 2 diabetes mellitus and triglyceride levels in a Chinese population. Diabet. Med. 2015, 32, 280–286. [Google Scholar] [CrossRef]
- Vaxillaire, M.; Cavalcanti-Proença, C.; Dechaume, A.; Tichet, J.; Marre, M.; Balkau, B.; Froguel, P. The common P446L polymorphism in GCKR inversely modulates fasting glucose and triglyceride levels and reduces type 2 diabetes risk in the DESIR prospective general French population. Diabetes 2008, 57, 2253–2257. [Google Scholar] [CrossRef] [PubMed]
- De Silva, N.M.; Freathy, R.M.; Palmer, T.M.; Donnelly, L.A.; Luan, J.; Gaunt, T.; Langenberg, C.; Weedon, M.N.; Shields, B.; Knight, B.A.; et al. Mendelian randomization studies do not support a role for raised circulating triglyceride levels influencing type 2 diabetes, glucose levels, or insulin resistance. Diabetes 2011, 60, 1008–1018. [Google Scholar] [CrossRef] [PubMed]
- Mahajan, S.; Caraballo, C.; Lu, Y.; Valero-Elizondo, J.; Massey, D.; Annapureddy, A.R.; Roy, B.; Riley, C.; Murugiah, K.; Onuma, O.; et al. Trends in Differences in Health Status and Health Care Access and Affordability by Race and Ethnicity in the United States, 1999-2018. JAMA 2021, 326, 637–648. [Google Scholar] [CrossRef] [PubMed]
- Hayes-Larson, E.; Mobley, T.M.; Gilmore-Bykovskyi, A.; Shaw, C.; Karlamangla, A.; Manly, J.J.; Mayeda, E.R. Racial/Ethnic Differences in Health-Related Quality of Life in Persons With and Without Dementia. J. Am. Geriatr. Soc. 2021, 69, 629–636. [Google Scholar] [CrossRef] [PubMed]
- Reijneveld, S.A. Ethnic differences in health and use of health care: the questions to be answered. International Journal of Public Health 2010, 55, 353–355. [Google Scholar] [CrossRef] [PubMed]
- Chandola, T. Ethnic and class differences in health in relation to British South Asians: using the new National Statistics Socio-Economic Classification. Soc. Sci. Med. 2001, 52, 1285–1296. [Google Scholar] [CrossRef]
- Cariou, B.; Hanf, R.; Lambert-Porcheron, S.; Zaïr, Y.; Sauvinet, V.; Noël, B.; Flet, L.; Vidal, H.; Staels, B.; Laville, M. Dual peroxisome proliferator-activated receptor α/δ agonist GFT505 improves hepatic and peripheral insulin sensitivity in abdominally obese subjects. Diabetes Care 2013, 36, 2923–2930. [Google Scholar] [CrossRef] [PubMed]
- Araki, E.; Yamashita, S.; Arai, H.; Yokote, K.; Satoh, J.; Inoguchi, T.; Nakamura, J.; Maegawa, H.; Yoshioka, N.; Tanizawa, Y.; et al. Effects of Pemafibrate, a Novel Selective PPARα Modulator, on Lipid and Glucose Metabolism in Patients With Type 2 Diabetes and Hypertriglyceridemia: A Randomized, Double-Blind, Placebo-Controlled, Phase 3 Trial. Diabetes Care 2018, 41, 538–546. [Google Scholar] [CrossRef] [PubMed]
Figure 1.
Flow diagram of the study participants. BP, blood pressure; TG, triglycerides.
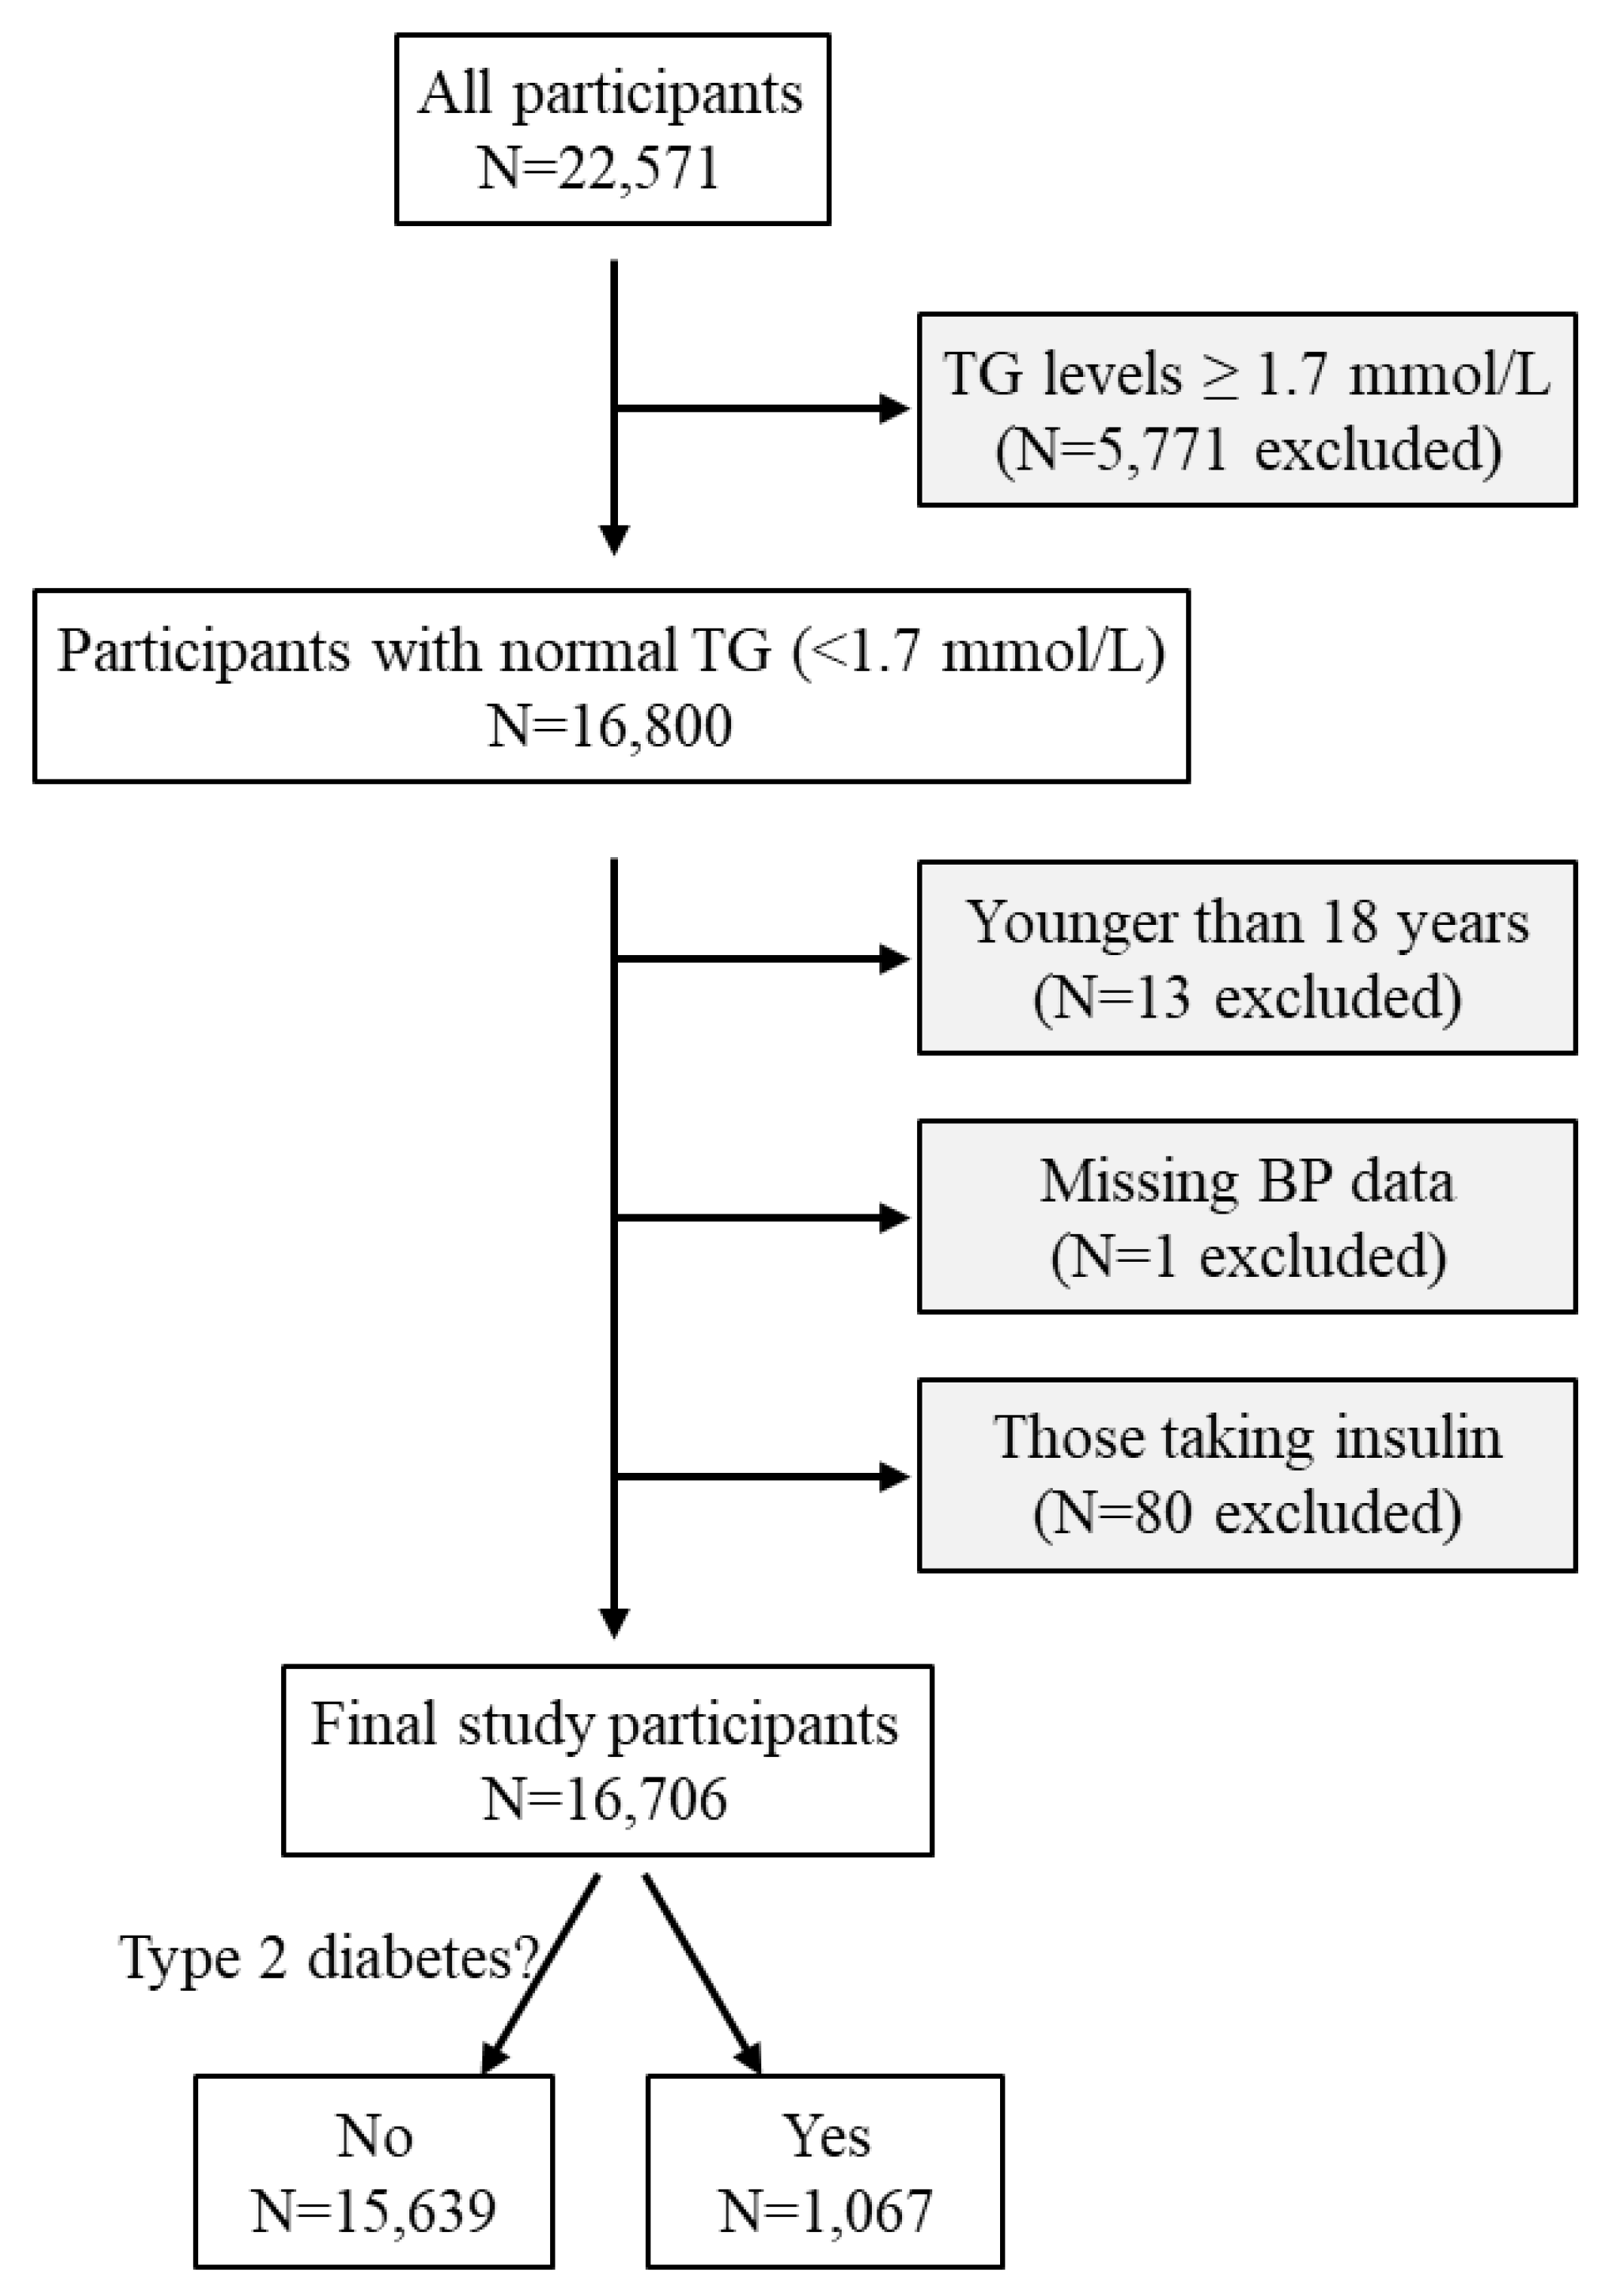
Figure 2.
Mean fasting plasma glucose and serum triglyceride concentrations in 16,706 participants with normal triglycerides. Triglycerides were stratified according to the observed deciles. TG, triglycerides.
Figure 2.
Mean fasting plasma glucose and serum triglyceride concentrations in 16,706 participants with normal triglycerides. Triglycerides were stratified according to the observed deciles. TG, triglycerides.
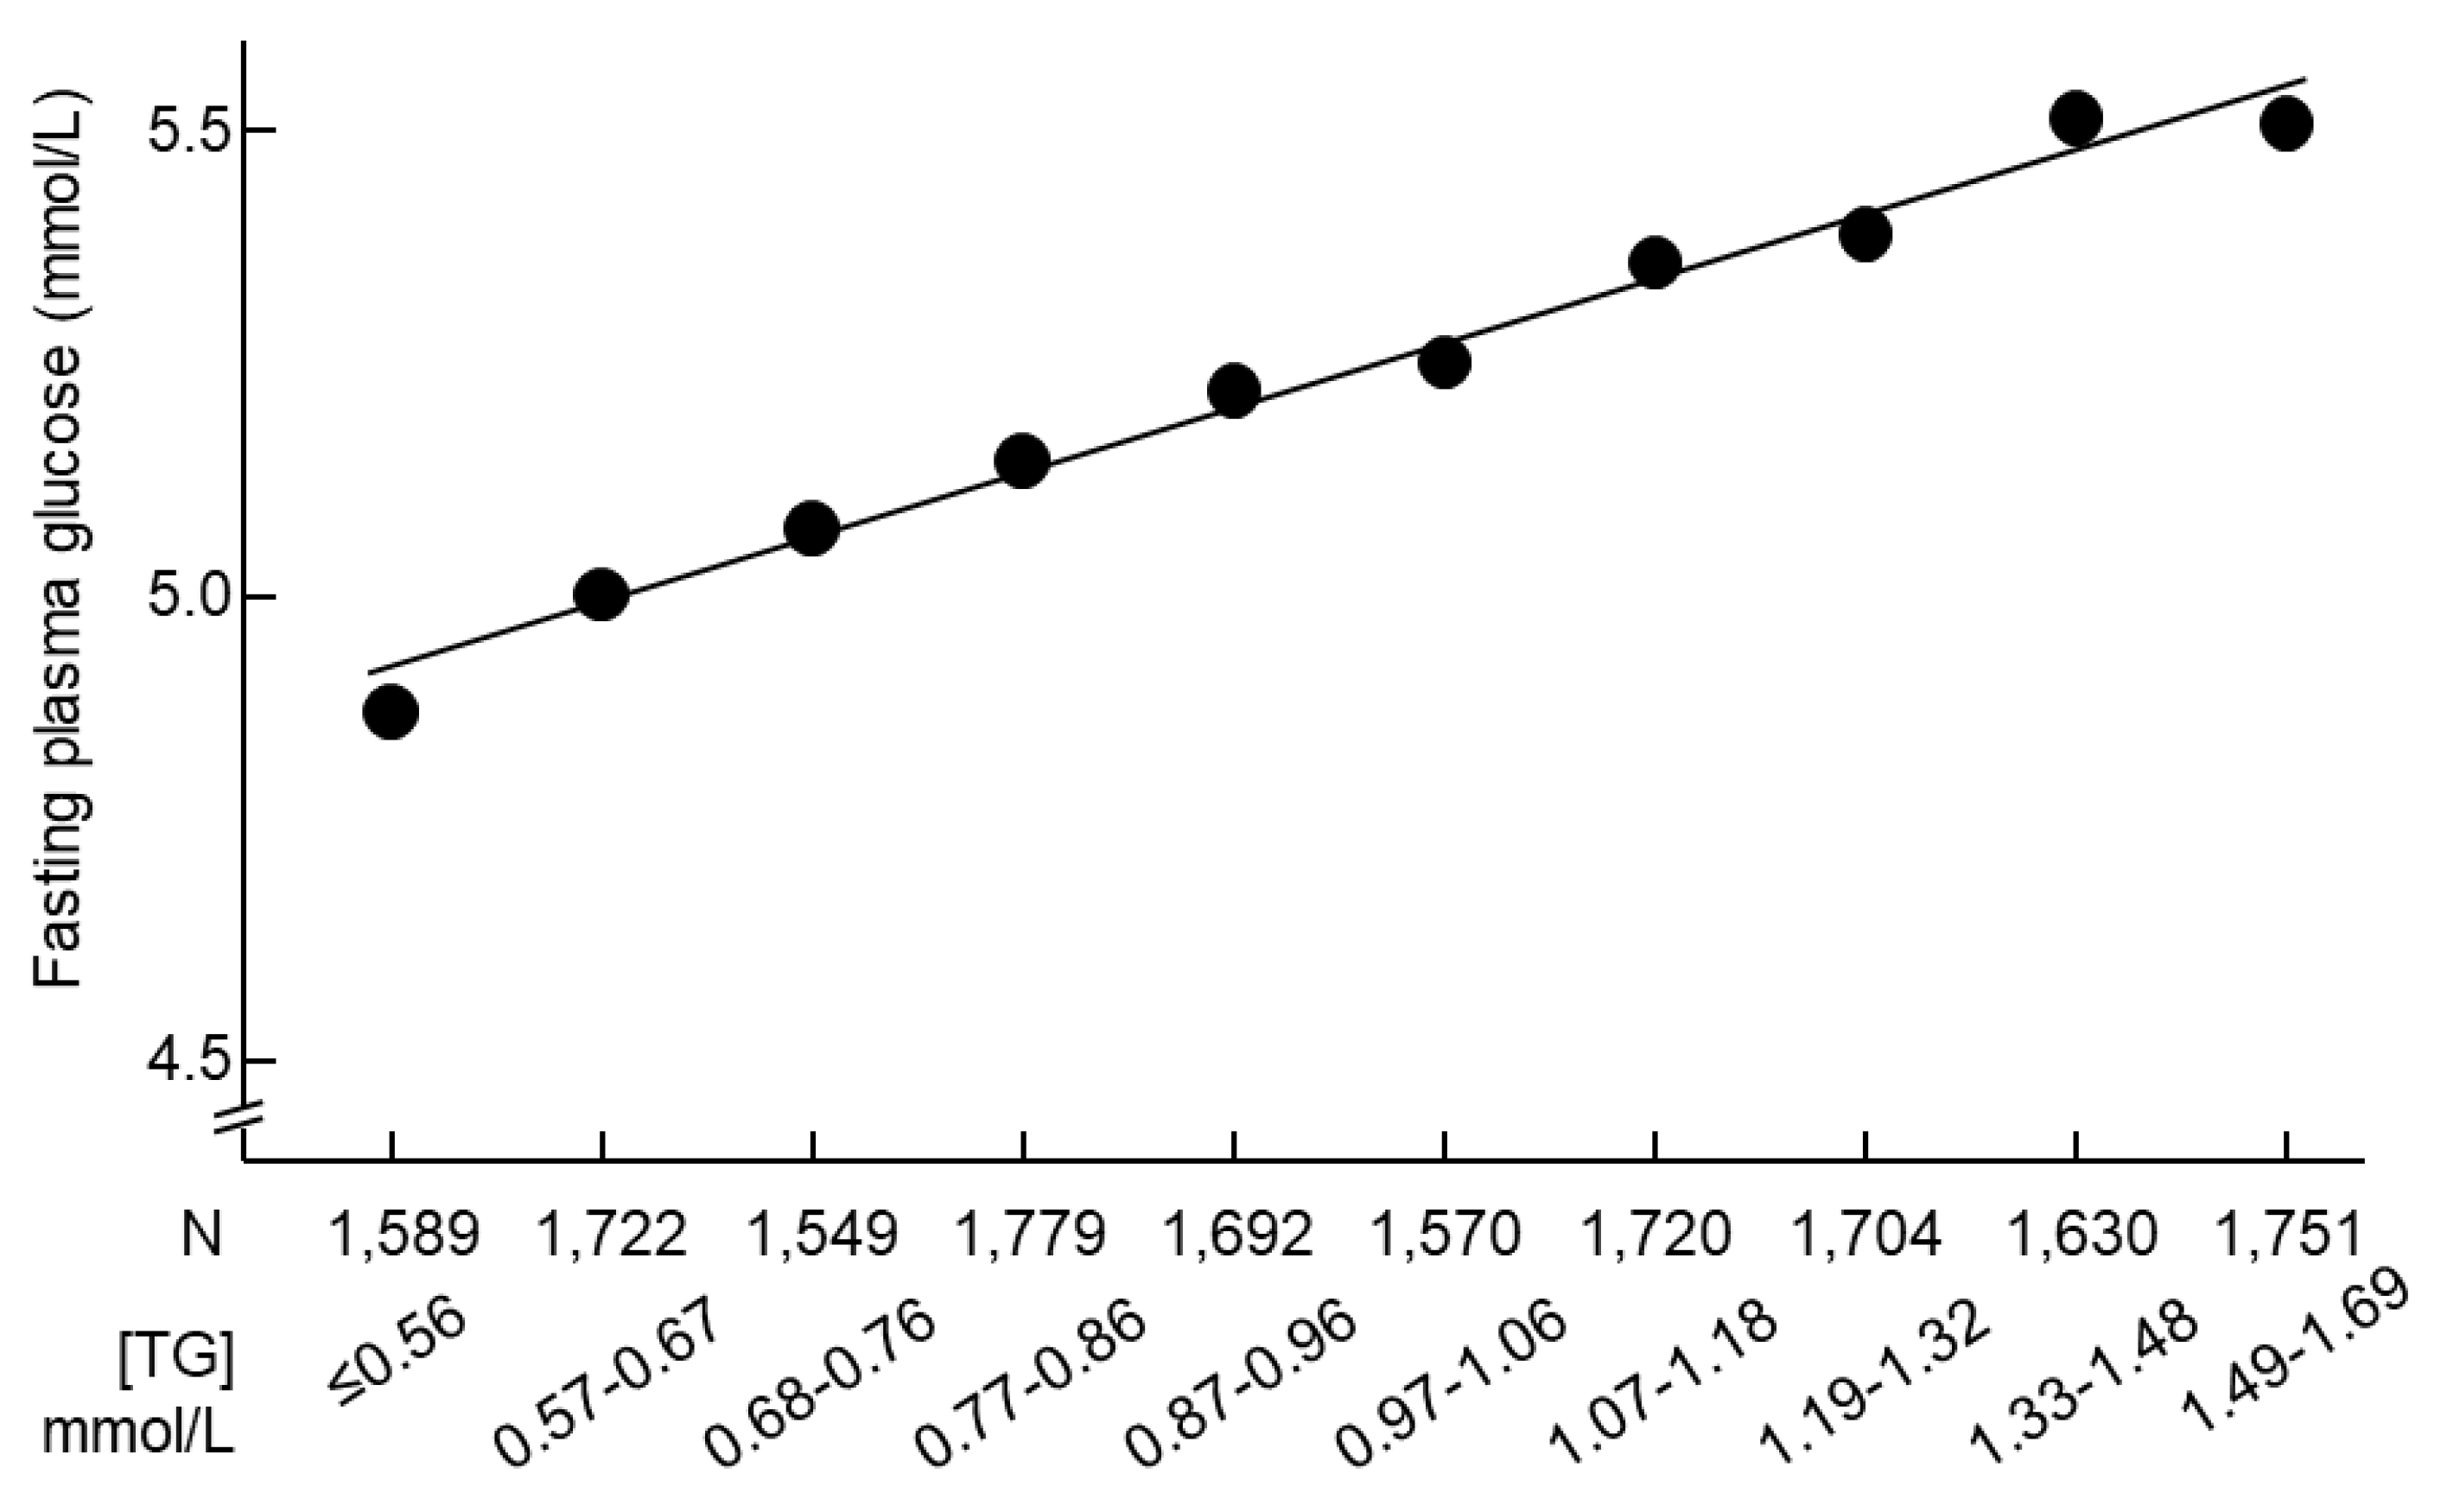
Figure 3.
ROC curve analysis of the association of triglycerides with risks of type 2 diabetes. Sensitivity represents true-positive results and 1-specificity represents false-positive results. The optimal cutoff of triglycerides for increased risk of type 2 diabetes was 1.09 mmol/L, with a sensitivity of 0.57 and specificity of 0.62. 95% CI, 95% confidence interval; AUC, area under the curve; ROC, receiver operating characteristic.
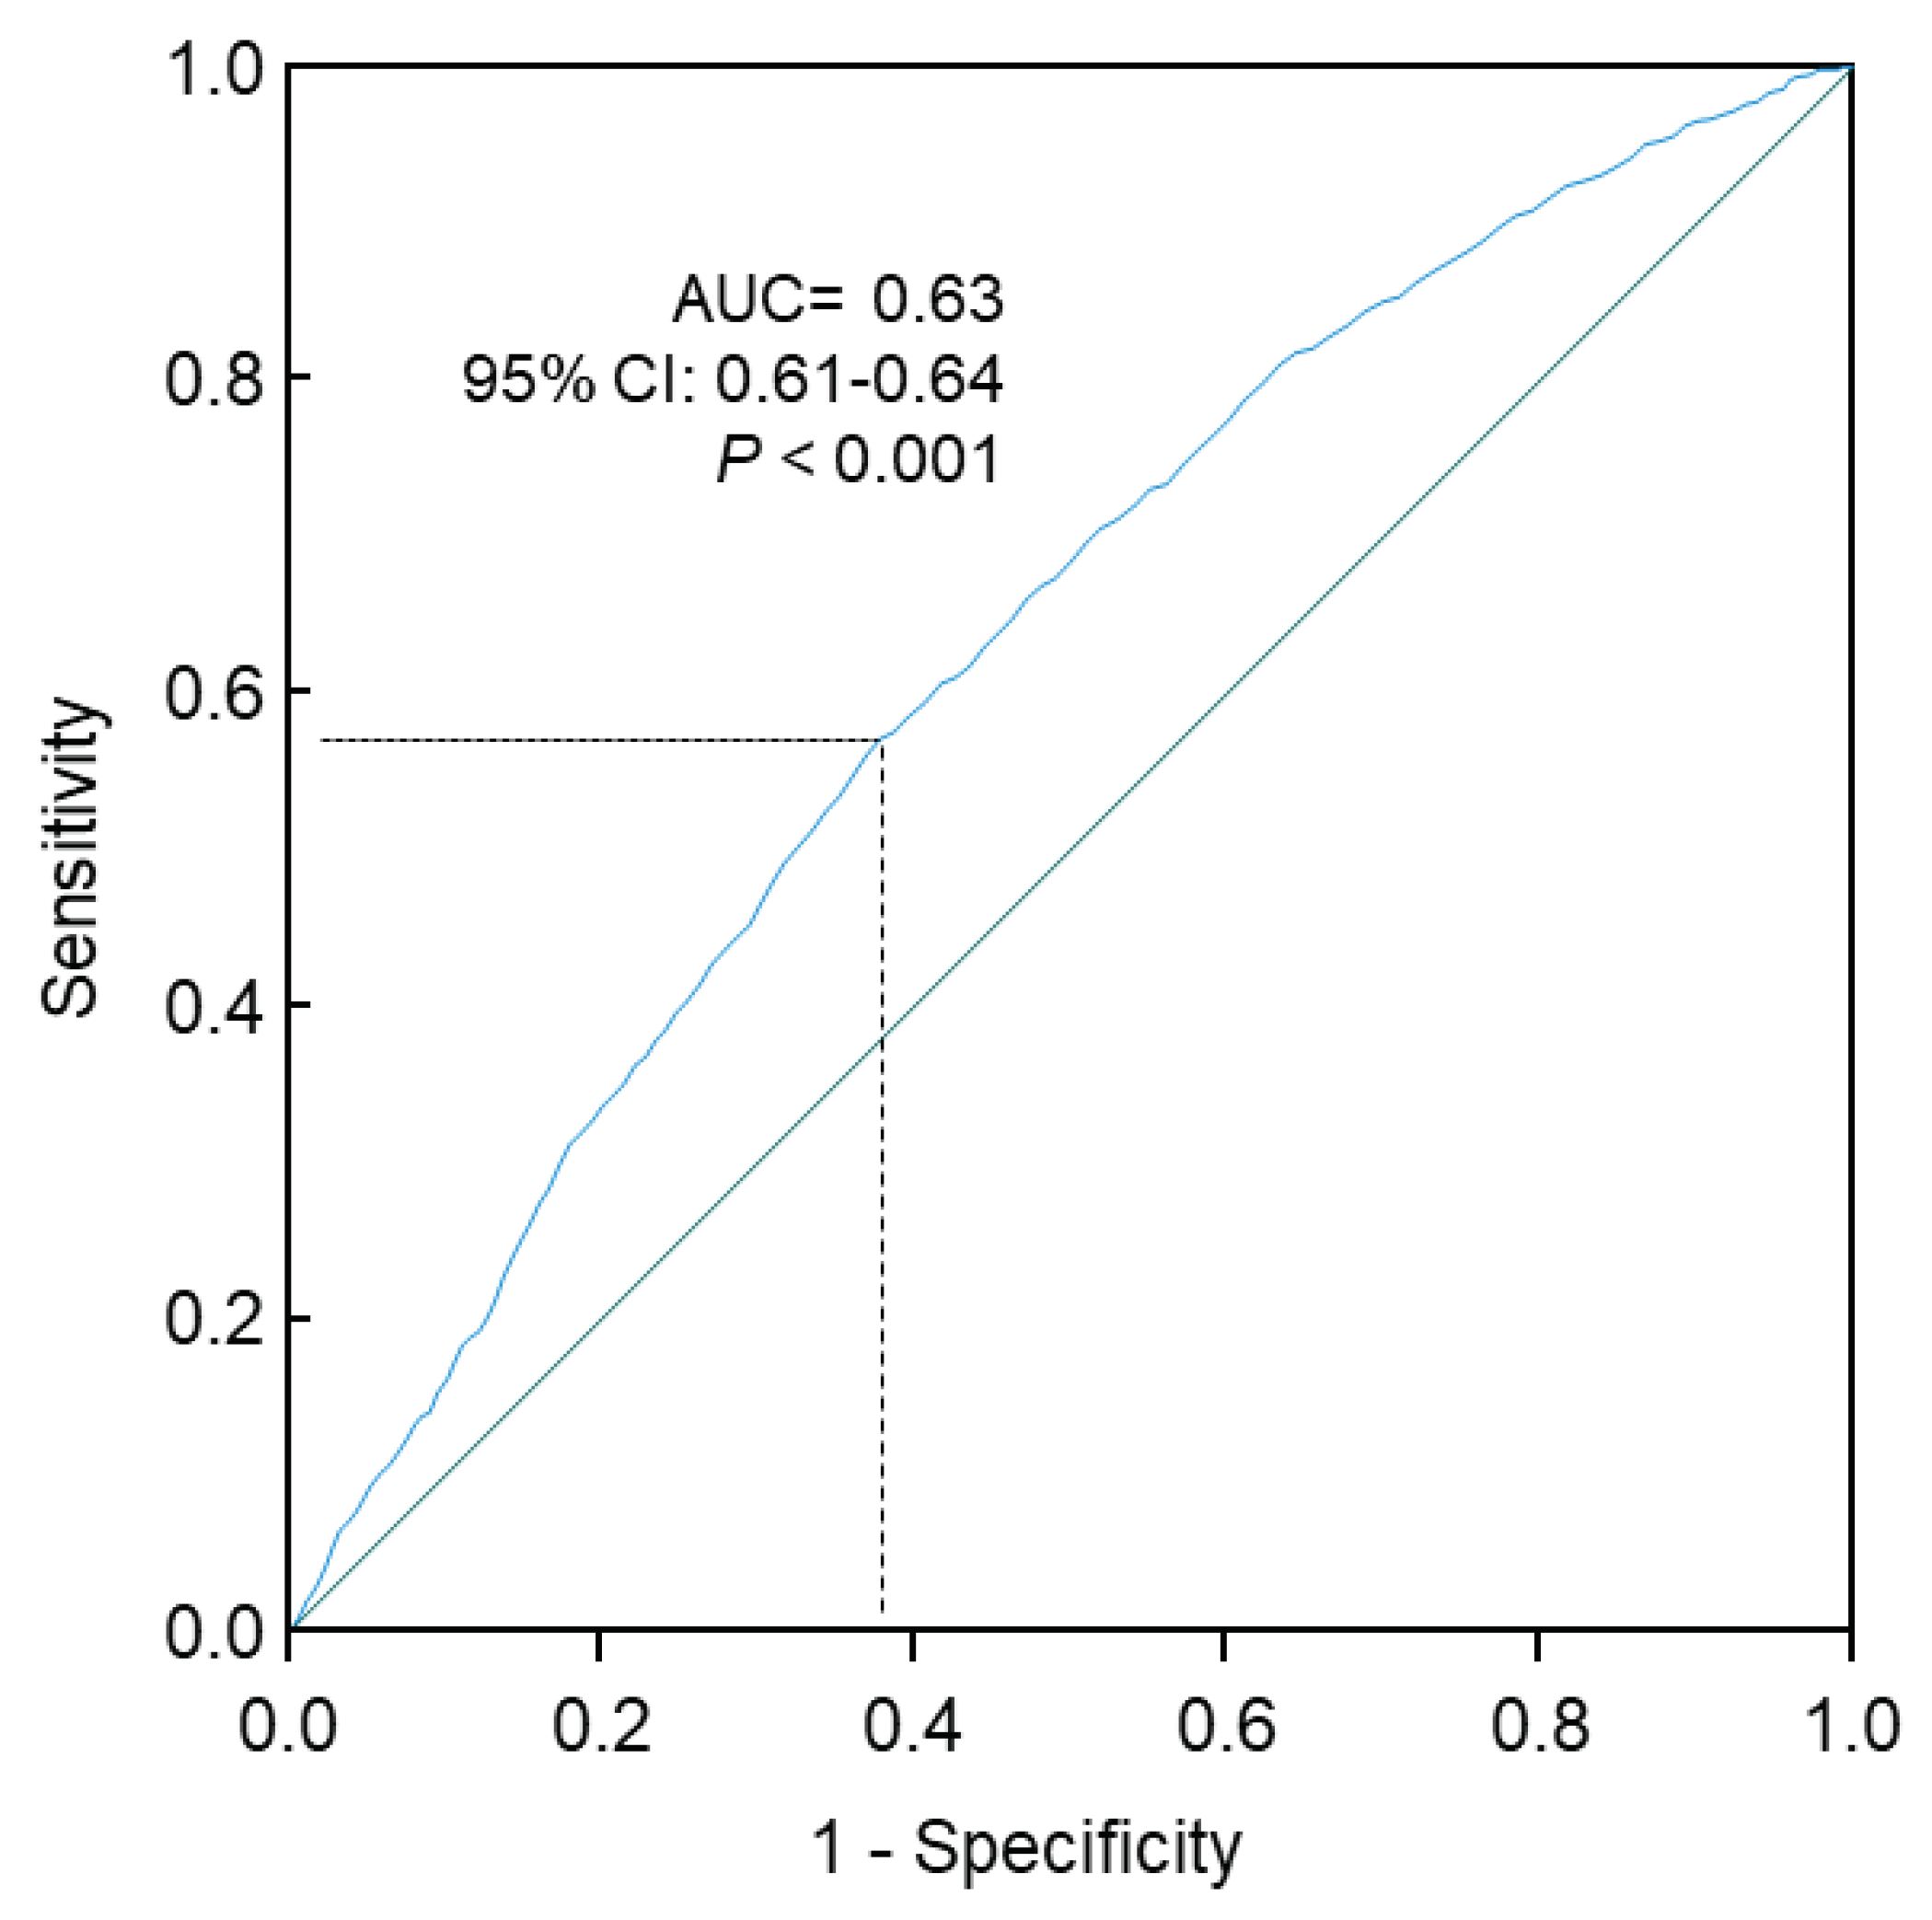

Table 1.
Clinical characteristics of the 16,706 participants, stratified by quartiles of triglycerides.
Table 1.
Clinical characteristics of the 16,706 participants, stratified by quartiles of triglycerides.
| 1st quartile | 2rd quartile | 3rd quartile | 4th quartile | Overall | P for trend | |
| TG, mean (SD), mmol/L | 0.58 (0.10) | 0.84 (0.07) | 1.10 (0.08) | 1.45 (0.13) | 1.00 (0.34) | < 0.001 |
| Sample size, N | 4,152 | 4,179 | 4,083 | 4,292 | 16,706 | NA |
| Age, mean (SD), y | 39.9 (13.0) | 44.6 (14.2) | 46.7 (14.2) | 48.3 (14.3) | 44.9 (14.3) | < 0.001 |
| Males, N (%) | 1,538 (37.0) | 2,091 (50.0) | 2,451 (60.0) | 2,802 (65.3) | 8,882 (53.2) | < 0.001 |
| FPG, mean (SD), mmol/L | 4.97 (0.78) | 5.17 (0.96) | 5.32 (1.11) | 5.49 (1.35) | 5.24 (1.09) | < 0.001 |
| BMI, mean (SD), kg/m2 | 22.3 (3.0) | 23.7 (3.3) | 24.8 (3.3) | 25.7 (3.2) | 24.2 (3.5) | < 0.001 |
| SBP, mean (SD), mm Hg | 121 (17) | 127 (18) | 131 (19) | 133 (19) | 128 (19) | < 0.001 |
| LDL-C, mean (SD), mmol/L | 2.36 (0.58) | 2.65 (0.65) | 2.84 (0.69) | 2.96 (0.70) | 2.70 (0.69) | < 0.001 |
| HDL-C, mean (SD), mmol/L | 1.47 (0.29) | 1.38 (0.27) | 1.29 (0.25) | 1.23 (0.24) | 1.34 (0.28) | < 0.001 |
| Type 2 diabetes, N (%) | 130 (3.1) | 218 (5.2) | 294 (7.2) | 425 (9.9) | 1,067 (6.4) | < 0.001 |
| Number of people on anti-diabetic drugs, N (%) | 63 (1.5) | 84 (2.0) | 109 (2.7) | 137 (3.2) | 393 (2.4) | < 0.001 |
| Number of people on lipid-lowering drugs, N (%) | 27 (0.7) | 35 (0.8) | 46 (1.1) | 46 (1.1) | 154 (0.9) | 0.085 |
Abbreviations: BMI, body mass index; FPG, fasting plasma glucose; HDL-C, high-density lipoprotein cholesterol; LDL-C, low-density lipoprotein cholesterol; N, number; NA, not applicable; SBP, systolic blood pressure; SD, standard deviation; TG, triglycerides.
Table 2.
Association between fasting plasma glucose 1 (dependent) and triglycerides 1 (independent) in 16,706 participants with normal triglycerides.
Table 2.
Association between fasting plasma glucose 1 (dependent) and triglycerides 1 (independent) in 16,706 participants with normal triglycerides.
| Models | β | P value |
| Model 1 | 0.211 | < 0.001 |
| Model 2 | 0.098 | < 0.001 |
| Model 3 | 0.036 | < 0.001 |
| Model 4 | 0.034 | < 0.001 |
1 Natural log-transformed. Model 1: Not adjusted; Model 2: Adjusted for age and sex; Model 3: Adjusted for factors in Model 2 plus body mass index, systolic blood pressure, LDL cholesterol, and HDL cholesterol; Model 4: Adjusted for factors in Model 3 plus use of lipid-lowering drugs and use of anti-diabetic drugs.
Table 3.
Natural log-transformed triglycerides and risk for type 2 diabetes in 16,706 participants with normal triglycerides.
Table 3.
Natural log-transformed triglycerides and risk for type 2 diabetes in 16,706 participants with normal triglycerides.
| Models | Odds ratio | 95% CI | P value |
| Model 1 | 3.85 | 3.17-4.68 | < 0.001 |
| Model 2 | 2.21 | 1.79-2.73 | < 0.001 |
| Model 3 | 1.45 | 1.14-1.83 | 0.002 |
| Model 4 | 1.61 | 1.19-2.17 | 0.002 |
Abbreviations: CI, confidence interval. Model 1: Not adjusted; Model 2: Adjusted for age and sex; Model 3: Adjusted for factors in Model 2 plus body mass index, systolic blood pressure, LDL cholesterol, and HDL cholesterol; Model 4: Adjusted for factors in Model 3 plus use of lipid-lowering drugs and use of anti-diabetic drugs.
Table 4.
Prevalence of type 2 diabetes, stratified by the triglyceride cutoff of 1.09 mmol/L.
| Triglycerides, <1.09 mmol/L |
Triglycerides, ≥1.09 mmol/L |
Overall | |
| Sample size | 10,189 | 6,517 | 16,706 |
| Type 2 diabetes, N | 458 | 609 | 1,067 |
| Type 2 diabetes, % | 4.5% | 9.3% | 6.4% |
Table 5.
OR (95% CI) for type 2 diabetes associated with higher triglycerides using the optimal cutoff (≥1.09 vs <1.09 mmol/L).
Table 5.
OR (95% CI) for type 2 diabetes associated with higher triglycerides using the optimal cutoff (≥1.09 vs <1.09 mmol/L).
| Models | Odds ratio | 95% CI | P value |
| Model 1 | 2.19 | 1.93-2.48 | < 0.001 |
| Model 2 | 1.59 | 1.40-1.81 | < 0.001 |
| Model 3 | 1.26 | 1.09-1.45 | 0.002 |
| Model 4 | 1.28 | 1.07-1.53 | 0.006 |
Abbreviations: CI, confidence interval. Model 1: Not adjusted; Model 2: Adjusted for age and sex; Model 3: Adjusted for factors in Model 2 plus body mass index, systolic blood pressure, LDL cholesterol, and HDL cholesterol; Model 4: Adjusted for factors in Model 3 plus use of lipid-lowering drugs and use of anti-diabetic drugs.
Table 6.
OR (95% CI) of triglycerides in quartiles for type 2 diabetes diagnosis in 16,706 participants with normal triglycerides.
Table 6.
OR (95% CI) of triglycerides in quartiles for type 2 diabetes diagnosis in 16,706 participants with normal triglycerides.
| Models | Q1 | Q2 | Q3 | Q4 | P for trend |
| Model 1 | 1 | 1.70 (1.36-2.13) | 2.40 (1.94-2.97) | 3.40 (2.78-4.16) | < 0.001 |
| Model 2 | 1 | 1.20 (0.96-1.51) | 1.48 (1.19-1.84) | 1.94 (1.57-2.39) | < 0.001 |
| Model 3 | 1 | 1.03 (0.81-1.30) | 1.10 (0.87-1.39) | 1.32 (1.05-1.66) | 0.020 |
| Model 4 | 1 | 1.15 (0.84-1.58) | 1.22 (0.90-1.66) | 1.54 (1.14-2.09) | 0.009 |
Abbreviations: CI, confidence interval; OR, odds ratio; Q, quartile. Model 1: Not adjusted; Model 2: Adjusted for age and sex; Model 3: Adjusted for factors in Model 2 plus body mass index, systolic blood pressure, LDL cholesterol, and HDL cholesterol; Model 4: Adjusted for factors in Model 3 plus use of lipid-lowering drugs and use of anti-diabetic drugs.
Table 7.
Sensitivity analysis of the association between fasting plasma glucose1 (dependent) and triglycerides1 (independent) when those 414 participants who were using lipid-lowering drugs or anti-diabetic drugs were excluded.
Table 7.
Sensitivity analysis of the association between fasting plasma glucose1 (dependent) and triglycerides1 (independent) when those 414 participants who were using lipid-lowering drugs or anti-diabetic drugs were excluded.
| Models | β | P value |
| Model 1 | 0.261 | < 0.001 |
| Model 2 | 0.183 | < 0.001 |
| Model 3 | 0.145 | 0.005 |
1 Natural log-transformed. Model 1: Not adjusted; Model 2: Adjusted for age and sex; Model 3: Adjusted for factors in Model 2 plus body mass index, systolic blood pressure, LDL cholesterol, and HDL cholesterol.
Table 8.
Sensitivity analysis of the association of triglycerides (natural log-transformed) with type 2 diabetes diagnosis when those 414 participants who were using lipid-lowering drugs or anti-diabetic drugs were excluded.
Table 8.
Sensitivity analysis of the association of triglycerides (natural log-transformed) with type 2 diabetes diagnosis when those 414 participants who were using lipid-lowering drugs or anti-diabetic drugs were excluded.
| Models | Odds ratio | 95% confidence interval | P value |
| Model 1 | 4.83 | 3.76-6.21 | < 0.001 |
| Model 2 | 2.77 | 2.12-3.64 | < 0.001 |
| Model 3 | 1.62 | 1.20-2.18 | 0.002 |
Model 1: Not adjusted; Model 2: Adjusted for age and sex; Model 3: Adjusted for factors in Model 2 plus body mass index, systolic blood pressure, LDL cholesterol, and HDL cholesterol.
Disclaimer/Publisher’s Note: The statements, opinions and data contained in all publications are solely those of the individual author(s) and contributor(s) and not of MDPI and/or the editor(s). MDPI and/or the editor(s) disclaim responsibility for any injury to people or property resulting from any ideas, methods, instructions or products referred to in the content. |
© 2024 by the authors. Licensee MDPI, Basel, Switzerland. This article is an open access article distributed under the terms and conditions of the Creative Commons Attribution (CC BY) license (http://creativecommons.org/licenses/by/4.0/).
Copyright: This open access article is published under a Creative Commons CC BY 4.0 license, which permit the free download, distribution, and reuse, provided that the author and preprint are cited in any reuse.


