Submitted:
17 January 2024
Posted:
19 January 2024
You are already at the latest version
Abstract
Hydrogen from natural gas reforming can be produced efficiently with a high CO2 capture rate. This can be achieved with oxygen-blown autothermal reforming as core technology combined with pressure-swing adsorption for hydrogen purification and refrigeration-based tail gas separation for CO2 capture and recirculation of residual hydrogen, carbon monoxide and methane. The low-temperature tail gas separation section is presented in detail, and to quantify the exergy efficiency of this section, a detailed exergy analysis is conducted. The irreversibilities in 42 different process components are quantified. In order to provide a transparent verification of the consistency of exergy calculations, the total irreversibility rate is calculated by two independent approaches: Through the bottom-up approach, all individual irreversibilities are added to obtain the total irreversibility rate. Through the top-down approach, the total irreversibility rate is calculated solely by the exergy flows crossing the control volume boundaries. The consistency is verified as the comparison of results obtained by the two methods shows a relative deviation of 4·10-7. The exergy efficiency of the CO2 capture process is calculated based on two different definitions. Both methods give a baseline exergy efficiency of 58.38%, which indicates a high degree of exergy utilisation in the process.
Keywords:
CO2 capture
; hydrogen
; tail gas
; separation
; exergy
1. Background and Motivation
Hydrogen is considered to be an enabling technology for utilising fossil fuels such as natural gas and coal with low CO2 emissions [1]. With respect to CO2 capture, an important feature of pre-combustion technologies is the advantage of high CO2 fraction and partial pressure which enables the removal of CO2 with less energy-demanding and more compact separation processes. Whereas direct combustion of fossil fuels generates flue gases with low CO2 concentrations and partial pressures, fossil fuels can be converted to synthesis gases in which CO2 is available in higher concentrations and at partial pressures that can be orders of magnitude higher than in flue gases.
Most proposed solutions for natural gas reforming with CO2 capture are either retrofits or retrofit-like, with the use of chemical solvents either post-combustion or pre-combustion for selective CO2 removal from flue gas or synthesis gas, in combination with pressure-swing adsorption (PSA) for hydrogen purification. Since the proposed solutions are largely based on existing reformer process structures, they are also once-through processes. A once-through structure implies that in order to achieve high decarbonisation and correspondingly low specific CO2 emissions, the reforming and water-gas shift reactors must provide extreme conversion ratios of alkanes to CO2 via CO. Moreover, the CO2 separation stage must provide an extremely high stand-alone CO2 capture ratio, since residual CO2 eventually leads to additional carbon slip as it is entrained in the tail gas by-product along with residual fractions of CO and methane. If conventional once-through technologies for syngas separation, such as chemical solvent scrubbing in series with PSA, are to be fitted with off-gas recycle for increasing the CO2 capture ratio, a dedicated recycle compressor is required, which is unlikely to be an attractive solution [2].
Despite being a proven technology featuring advantages such as deep CO2 removal rates and the possibility of a high CO2 product purity, chemical solvents are arguably inefficient technologies energy-wise, that can have even negative exergy efficiency in pre-combustion applications [3]. They become increasingly inefficient for very high CO2 removal rates as there is a steeply increasing marginal specific energy penalty associated with reboiler duty. In order to better exploit the high CO2 concentrations that reforming processes can provide, and to improve overall energy efficiency of hydrogen production, an innovative solution has been proposed by Straus et al. [4], in which a PSA unit is combined with a low-temperature tail gas separation process for CO2 capture as well as recovery and enrichment of the energy components CO, methane and hydrogen. These can in turn be recycled in different proportions to the upstream water-gas shift reactors and reformer, without the need for a dedicated recycle compressor. Unlike the retrofits of the conventional technology [2], this solution can achieve very high global CO2 capture ratio and simultaneously a very high plant efficiency [4].
The high efficiency achievable through the combination of PSA and low-temperature tail gas separation can partly be explained by a reduction in the parasitic energy requirement for separating the syngas into high-purity and high-pressure hydrogen and CO2 products. To demonstrate the achievable power requirement for low-temperature tail gas separation for CO2 capture, the present work will provide a detailed process description and present a detailed exergy analysis of this process, in order to:
- Allocate and quantify all thermodynamic losses in the low-temperature tail gas separation process;
- Quantify the exergy efficiency, calculated as the ratio between the actual power requirement and the minimum exergy requirement in the case of a reversible process.
2. Literature Review
Low-temperature technologies for CO2 capture through condensation and liquefaction have been studied extensively for several different applications, which will be briefly reviewed in the following.
2.1. Low-Temperature and Cryogenic Post-Combustion CO2 Capture
Post-combustion capture conditions provide far too low CO2 fractions in the flue gas to allow for direct liquefaction and separation of CO2. If CO2 is to be captured directly from flue gases through phase change and separation, this requires direct freeze-out induced by cryogenic temperatures well below the CO2 solidification temperature. Different process structures for CO2 solidification have been proposed, either for lowering the flue gas stream temperature sufficiently for CO2 to solidify, or for freezing out and depositing CO2 locally on cold surfaces [5,6,7,8,9,10,11,12,13,14,15].
If a low-temperature technology is combined with a complementary front-end CO2 enrichment process such as a polymeric membrane, the CO2 concentrations can become sufficiently high to allow a high fraction of CO2 to be liquefied in a secondary low-temperature separation stage. Hybrid processes combining CO2 selective membranes and CO2 liquefaction have been studied extensively [16,17,18,19,20], where the CO2 processing includes typically vacuum pumping, compression and partial condensation and separation at temperatures typically around –50 °C.
2.2. CO2 Capture from Oxyfuel Combustion
In oxyfuel combustion processes, a fossil fuel is burnt in an atmosphere of mainly oxygen and CO2. Ideally, an oxyfuel-derived flue gas would consist of CO2 and water vapour only, but in practice there will be a considerable amount of "non-condensable" diluents in the flue gas in form of oxygen, nitrogen and argon. There are different causes for this, such as air leakage, impure oxygen supply from cryogenic air separation, and a certain stoichiometric oxygen surplus in the combustor.
Still, the flue gas can contain as much as roughly 75–85 mol% CO2 on a wet basis, and up to 85–95 mol% after water removal [21,22]. Such compositions provide highly favourable conditions for low-temperature CO2 processing units (CPUs), technologies that are considered as the most efficient means for removing the volatile components and purifying CO2. Separation and purification is usually achieved by compressing and partially condensing the flue gas mixture at temperatures down to around –50 °C. Different process layouts of CPUs for CO2 capture in oxyfuel processes have been proposed [22,23,24,25,26,27].
2.3. CO2 Capture in Pre-Combustion Syngas and Hydrogen Production Processes
Provided sufficiently high CO2 fractions in the syngas and syngas separation products, refrigeration processes for cooling and partial condensation can provide efficient alternatives for CO2 separation and purification. The CO2 fraction, and correspondingly the partial pressure, is highly dependent on the fossil energy source, as well as the reforming/gasification and the hydrogen separation technologies. Oxygen-blown coal gasification can provide pressurised syngas with a sufficiently high CO2 fraction allowing for high CO2 capture ratio through direct use of low-temperature CO2 separation [28,29,30].
Reforming processes for natural gas generate syngas with CO2 content typically in the range 15–25 mol% after the water-gas shift reactions [21]. This range is considerably below what is viable for partial condensation and separation of liquefied CO2, but the use of hydrogen-selective separation processes such as pressure-swing adsorption or hydrogen-selective membranes can produce tail gas or retentate gas with highly favourable conditions with respect to CO2 fraction [4,31,32,33].
2.4. Exergy Analysis of Low-Temperature CO2 Separation Processes
Most published studies of different types of low-temperature CO2 capture units are concerned with energy-related and techno-economic key performance indicators (KPIs) such as specific power requirement, CO2 capture ratio and specific CO2 capture cost or CO2 avoidance cost. While the specific power requirement is a highly useful KPI that also provides a clear indication of the specific exergy requirement, it does not provide any information about the exergy efficiency of a process and the performance relative to the minimum exergy requirement. Whereas the specific power requirement is useful for comparing processes that have equal or close to equal feed and product conditions, the specific power requirement is not an unambiguous comparison basis when there are differences in feed and product stream specifications. Such differences can to a large extent affect the minimum exergy requirement [3,34], which is a function of the defined boundary stream conditions and the ambient conditions only, and therefore independent of the actual process structure.
Regarding reported exergy efficiencies of low-temperature CO2 capture units, another issue requiring careful consideration is the applied definition of exergy efficiency. As one illustrative example, [23] present an oxyfuel CPU that in the base case captures 94.11% of the CO2 from a flue gas containing 82.4 mol% CO2, with a final CO2 product purity of 96.9 mol%. The CO2 product pressure is 18.4 bar while the CO2-depleted off gas leaves the process at 28.8 bar. The exergy efficiency is reported to be 67.8% based on the following definition:
In Equation (1), equals the total irreversibility rate as the sum of internal exergy destruction () and external exergy losses (), and is defined as the "total fuel exergy of the system". As discussed and exemplified in previous publications such as [35], there are different ways to define and assess exergy efficiency from the exergy balance of processes. In [3], it is argued that a rigorous definition of exergy efficiency that leaves no room for further interpretation is the ratio between minimum exergy requirement, , and the actual exergy input to the process, :
From the exergy data of the process streams in [23], the minimum exergy requirement based on the state of the feed and product streams is 36.93 MW or 63.10 kWh per ton CO2 captured. Since the actual exergy input is 116.16 kWh per ton CO2 captured, the resulting exergy efficiency becomes 54.3%, which is 13.5 % points lower than originally reported.
This numerical example of the exergy efficiency assessment highlights an important issue: While the exergy balance of a process can be rigorously calculated from the mass and energy balance, the chosen model for thermophysical properties and the defined ambient conditions, the exergy efficiency can be defined and interpreted in several different ways [35]. This implies that in defining exergy efficiency, an element of subjectivity can be present, which in turn can result in different evaluations of the process performance.
3. Method: Exergy Analysis
The concept of exergy provides a tool for revealing the thermodynamic losses and useful output for a given process. With a correct formulation and quantification of the exergy balance with credible and representative thermophysical property models, the exergy balance reveals the useful exergy transfer and the complementary exergy loss, or irreversibility, for each process unit as well as for the overall process. From the exergy balance, the identification of causal mechanism (e.g. friction loss, heat loss, mixing loss, etc.) and the location of each irreversibility contribution can in turn be evaluated and ranked with respect to improvement opportunities. Furthermore, exergy is a prerequisite for determining the performance of reversible processes. Depending on the nature of the process, this can be either the minimum exergy requirement for obtaining a desired transformation/conversion of feed(s) into product(s), or alternatively the maximum obtainable exergy output, given a set of feed(s) and product(s). Based on this information, the actual performance can be compared to what is theoretically achievable in order to determine the exergy-based efficiency and evaluate the potential for improvement. Dodge [36] formulated this in the following way: "With the reversible process as our standard, we know at once whether an actual process is already highly efficient or whether it is very inefficient and therefore capable of considerable improvement."
3.1. Exergy Components
In a flowing system, the exergy of a material stream is defined as the maximum work that can be extracted when it is brought from its current state to a dead state, in which it is in equilibrium with the ambient surroundings. The molar exergy () can be expressed as the sum of thermomechanical (), chemical (), kinetic () and potential () exergies:
The exergy of a process stream can be reduced to the sum of thermomechanical and chemical exergies only, on the assumption that kinetic and potential exergies are of insignificant orders of magnitude1 in a thermal process.
The molar thermomechanical exergy of a process stream is expressed in Equation (4), and it is a function of the enthalpy and entropy at the current state (, ) and at ambient state (, ) as well as the ambient temperature :
The molar chemical exergy of a mixture can be expressed as:
Here, and denote the molar fraction and molar chemical exergy for each single chemical component in the mixture. and denote the respective molar enthalpy and entropy for each single component in pure form at ambient conditions (, ).
3.2. Exergy Balance of a Control Volume
Figure 1 illustrates a generic process control volume with m boundary-crossing inlet exergy flows and k outlet exergy flows. Each flow carries exergy in the form of either matter, power or heat. The total irreversibilities occurring within the boundaries of the control volume can be calculated from the exergy flows crossing the boundaries. The expression for total irreversibility rate in Equation (6) will be referred to as the top-down approach in the following.
Inside the control volume, there are n individual elements of irreversibility that are caused by exergy destruction in the various process units or sub-processes. The irreversibility rate for each individual process unit can be calculated from the local exergy balance, applying Equation (6) to the local control volume. The number of individual irreversibility components n in Equation (7) depends on the chosen resolution or abstraction level applied in the subdivision of the process into process elements. If all stand-alone irreversibility rates are added together, the total irreversibility rate can be calculated with what will be referred to as the bottom-up approach:
So, it is possible to calculate the overall process irreversibility rate in two independent ways, and it is thus possible to verify the consistency of irreversibility calculations by comparing these two figures [37,38]. An element generally lacking in exergy analyses presented in the literature is checks and balances provided by a transparent comparison of the total irreversibility rate calculated by the top-down and bottom-up expressions provided in Equations (6) and (7), respectively.
The present work will in detail analyse the exergy balance and the resulting exergy efficiency of a low-temperature tail gas separation unit for CO2 capture and recycle of recovered energy components (methane, CO, hydrogen) in a hydrogen production plant. All irreversibilities will be allocated and quantified both in a top-down and bottom-up manner, and results from the two approaches will be compared in a transparent way to verify consistency.
In order to locate and quantify the drivers of irreversibilities in the separation unit, the exergy balance for all individual sub-process units must be established and calculated. The methods for achieving this are described in Section 3.4.
3.3. Minimum Exergy Requirement
Processes such as separation, liquefaction or compression have defined tasks of bringing about a desired change for one or more defined feed streams into one or more product streams. The feed and product streams are in turn defined by properties such as flowrate, temperature, pressure and chemical composition. Before considering an actual process layout and assessing its performance, the minimum exergy requirement can be calculated based on the exergy flows of the defined feed and product streams. A separation process with one feed stream and two product streams is used as an illustration in Figure 2. Also indicated is an inwards directed exergy flow, denoted . Assuming the process to be reversible, Equation (6) applied to the control volume reduces to:
3.4. Irreversibilities in Process Components
The total irreversibility of a larger process can be obtained from the balance of boundary-crossing exergy flows as expressed in Equation (6), but this figure provides no further information about the location and magnitude of each driver of irreversibilities. As mentioned at the start of Section 3, one of the main purposes of exergy analysis is to identify where and to what extent losses occur in different parts of a system. This in turn reveals where improvements have the largest potential. A detailed breakdown of irreversibilities will provide each individual term on the right hand side of Equation (7), which in turn provides information on a much lower level of abstraction than the left hand side term in Equation (6). Hence, expressions must be established for each defined process element in order to calculate the individual irreversibilities. In the following, the necessary relations for all process units present in the low-temperature tail gas separation process will be developed.
3.4.1. Heat Exchangers
For a well-insulated heat exchanger with n streams, the following expression for the irreversibility rate can be derived by combining Equations (4)–(6):
Since there are no chemical reactions or mixing of streams, all terms related to chemical exergy in Equation (5) are eliminated from the equation, and the irreversibility rate can thus be expressed by the ambient temperature, specific or molar entropies and mass or molar flowrates of the process streams.
It is possible to lower the abstraction level further by decomposing into irreversibilities caused by heat transfer across finite temperature differences () and by pressure losses ():
The heat transfer related irreversibility is a function of the ambient temperature, and temperatures on the hot and cold side of the heat exchanger. It can be calculated from the temperature composite curves of the heat exchanger from the following expression:
Here and denote the temperature of the hot and cold composite curve as function of the heat exchanger duty , while is the difference between and . As can be observed, the incremental heat transfer irreversibility is proportional to the temperature difference , but inversely proportional to both and .
Irreversibilities caused by pressure losses are calculated for each individual process stream. The sum of pressure loss related irreversibilities for a heat exchanger with n process streams can be expressed as [38,39]:
Here, denotes the mass flowrate of stream j and , , denote the local properties density, temperature and pressure for stream j through the heat exchanger pass, respectively.
The two approaches to quantify heat exchanger irreversibilities enable an additional opportunity to verify the results, since the heat exchanger irreversibility obtained from Equation (9) can be checked against the corresponding results obtained from combining Equations (10)–(12). Whereas the first approach is quick and simple, the second approach is more cumbersome and requires two sets of integrals in the domains of heat and pressure in the heat exchanger.
3.4.2. Compressors and Intercoolers
Figure 3 illustrates and defines separate control volumes for an adiabatic compressor with a downstream intercooler. Referring to the indicated stream numbering, the irreversibility rate for the control volume enclosing the compressor can be expressed either as
or
The illustrated cooling stage uses cooling water pressurised by a pump on the cold side, but the setup in Figure 3 is also applicable to air-blown intercoolers by replacing the pump symbol and power input with those of an air fan. In the heat exchanger, cooling water is heated and a certain portion of the thermomechanical exergy is transferred from the compressed gas to cooling water.
By including a portion of the environment in the control volume, the external irreversibilities can be internalised [40]. By doing so, all elements of exergy destruction occurring inside the heat exchanger due to heat transfer and pressure drop, as well as the additional dissipation of pumping power and rejection of waste heat from the water to the environment, can be included. In this case, the total irreversibility for the intercooling stage can be expressed as:
3.4.3. Expanders
The expander used in the low-temperature tail gas separation process (see Section 4) is not used to recover power, but to induce a temperature drop in the gas stream. In the absence of an electric generator, the expander is coupled to a brake compressor through a shaft in order to transfer and dissipate power. The transferred power is used to compress gas in a closed loop that includes a throttling valve and a cooler located outside the coldbox rejecting heat to the ambient surroundings. As for the intercooler in Figure 3, the control volumes of the expander and brake compressor in Figure 4 also extend into the environment so that all exergy transferred to the brake gas loop is eventually accounted for as irreversibilities. Based on these assumptions and the stream numbering in Figure 4, the irreversibility of the defined control volume can be expressed as:
3.4.4. Regenerative Solid Desiccant Dehydration Unit
The regenerative drying unit consists of one or more parallel active desiccant beds where water in the inlet gas stream is adsorbed onto the packing material. After a certain time of operation in active mode, the bed is regenerated at lower pressure and high temperature. In the present case, regeneration is achieved by recycling a relatively small stream of dry gas. The dry gas is throttled to the regeneration pressure and heated before flowing through the bed in regeneration mode, as illustrated in Figure 5. The recycle gas is thereafter cooled so that water condenses and can be separated and rejected to the environment.
The regeneration process consists of different modes of operation such as depressurisation, heating, regeneration, cooling and repressurisation, all with different duration and dependent on the exact design and procedures of the drying process. As one example, the electric heater is active only during the removal of water in the regenerating bed. After the solid desiccant has been regenerated, the recycled gas stream will still be flowing through the regenerating bed, but now with the heater switched off so that the packing material is cooled down before switching to active mode. A consequence of this is that also the flow of rejected water will be present only in certain periods of operation. Due to the batch nature of the regeneration process, the representation of the flow of energy and matter is provided in time-averaged terms. Using average values, the exergy balance for the control volume in Figure 5 can be expressed as:
As for the ambient cooler in Figure 3, a portion of the environment is included in the control volume of the cooler in Figure 5. The condensed water is assumed to be rejected to the environment so that the exergy of the water stream is accounted for as an element of irreversibility in the control volume.
3.4.5. Other Components: Mixers, Separators and Valves
Mixing of streams can cause irreversibilities caused by differences in composition, pressure and temperature. For an adiabatic mixer, the resulting irreversibility rate can be calculated by combining Equations (4)–(6), where all exergy flows in and out of the mixing point correspond to material streams.
The same equations apply to separators, provided that they are assumed to be well-insulated and therefore adiabatic. In the case of an adiabatic vapour–liquid separator with a single inlet stream, this will result in zero irreversibilities2. In the case of multiple inlets, an adiabatic separator may cause irreversibilities due to mixing effects. Irreversibilities in a vapour–liquid separator at subambient temperature can be caused also by heat leakage from the ambient surroundings, the significance of which is further discussed in a sensitivity analysis in Section 5.6.
For an adiabatic and isenthalpic throttling valve, the following expression for irreversibility can be derived from Equations (4) and (6):
4. Process Description
4.1. Hydrogen Production Plant with CO2 Capture
The tail gas separation cycle in consideration is part of a hydrogen production process with integrated CO2 capture and a capacity of 500 ton hydrogen per day, previously documented in [4]. A process flow diagram is given in Figure 6. The core technology of the reforming plant is an oxygen-blown autothermal reforming (ATR) section for syngas generation. A pre-reformer first converts higher hydrocarbons in the natural gas feed, before the feed is further heated and mixed with a fraction of the CO2-depleted tail gas recycled from the gas separation section, and then sent to the main reformer. The tail gas recycling to the ATR reactor represents a difference to the process documented in [4], where tail gas is recycled only to the water-gas shift section. After cooling in a steam generation section, the syngas passes through a high- and low-temperature water-gas shift reactor (HT-WGS and LT-WGS, respectively) to increase the carbon monoxide to CO2 conversion and correspondingly the hydrogen production. A second fraction of the CO2-depleted tail gas is recycled to the LT-WGS reactor to increase the overall carbon monoxide conversion. Although all reactors correspond to types found in conventional plants, the recycling of tail gas from the gas separation to the ATR and LT-WGS reactors represents a novelty that can enable the simultaneous achievement of very high efficiency, decarbonisation ratio and hydrogen recovery ratio [4].
After the water-gas shift reactors, the shifted syngas is cooled to near ambient temperature before the condensed water, with a certain amount of dissolved gas components, is removed by phase separation. The condensed water is subsequently flashed to recover a fraction of the dissolved CO2. After water knockout, the syngas is separated into high-purity hydrogen retained at high pressure and tail gas discharged at low-pressure using a conventional PSA. Although this process consists of parallel batch units (see Section 4.2 for further discussion about stability and continuity), it is modelled as a continuous black-box unit with the following main assumptions, which are considered to be conservative:
- 1.1 bar(a) tail gas discharge pressure;
- 85% hydrogen recovery ratio.
Upon discharge, the low-pressure, CO2-rich PSA tail gas is mixed with the gas stream from the condensed water flash unit and passed on to the low-temperature tail gas separation unit.
The hydrogen production process has been modelled as a steady-state process in Aspen HYSYS using the cubical Peng-Robinson equation of state to calculate thermophysical fluid properties. All reactors are modelled as equilibrium reactors. Surplus heat of the process is utilised in a steam cycle. The steam cycle includes a high, medium and low pressure stage for power generation. All heaters and coolers in Figure 6 as well as the heaters in the steam cycle are included for a subsequent pinch analysis. The pinch analysis is achieved through a coupled Python script that automatically extracts the required values from the HYSYS simulation. An in-depth description of the process, as well as a detailed analysis of the process can be found in Straus et al. [4]. Table 1 shows the chosen process conditions and the corresponding KPIs. They differ slightly from the provided values by Straus et al. [4], since a fraction of the tail gas is recycled to the ATR.
4.2. Low-Temperature Unit for CO2 Capture and Tail Gas Recovery and Recycling
A process flow diagram for the low-temperature unit with stream numbering is shown in Figure 7. The main sections of the process are:
- Multi-stage tail gas compression with intercoolers and dehydration unit;
- Heat exchanger network for partial condensation of the compressed tail gas;
- Main separation vessel for phase separation of the partially condensed tail gas;
- Three stage flash separation for CO2 purification and flash gas recycle to compressors;
- Auxiliary cascade refrigeration cycle with propane and ethane as refrigerants;
- Pressurisation of the purified CO2 by liquid pumping.
A disclosure of data for process streams, compressors, heat exchangers and more is provided in tabular form in Appendix A.
Although the PSA unit is a batch process with respect to pressurisation, blowdown and purge, configurations with parallel columns cycling between the different operation modes can provide a close to continuous flow of separation products. The low-pressure tail gas discharged from the PSA is assumed to be supplied with a constant chemical composition and at otherwise steady-state conditions. This should be a reasonable assumption based on practical experience from PSA tail gas compression, where respectively 1–2% and 0.2–0.4% volume flow fluctuations at the compressor suction and discharge are reported [41]. In addition to the buffering capabilities in the compression section, the vapour–liquid separators in the process will provide additional buffering capacity so that a steady flow of separation products can be provided.
The tail gas is compressed in five intercooled stages, from 1.1 bar suction pressure to 56.5 bar discharge pressure. At the suction of the three last stages, the tail gas stream is mixed with gas streams from three flash separation stages. While the tail gas feed has a CO2 fraction of 60.9 mol%, the first two flash gas recycle streams have significantly higher CO2 fractions, which leads to an enrichment of CO2. The final recycle stream has a CO2 fraction marginally below that of the feed stream and the resulting CO2 fraction of the stream entering the coldbox is about 63.5 mol%. Intercoolers in the tail gas compressor train reduce the gas temperature to 23 °C by cooling water, with a specific power requirement in the water pumps equivalent to 0.007 MJp per MJth rejected heat.
Between the fourth and fifth compression stage, the tail gas undergoes deep dehydration in a molsieve desiccant bed. As mentioned in Section 3.4.4, while the drying process in the active bed is continuous, the overall drying unit operates as a batch process in the depressurisation, regeneration, cooling and repressurisation stages of the desiccant bed operation. It is operated with parallel beds in active mode or regeneration mode to ensure continuous dehydration. The active bed dehydrates the tail gas continuously at 32.7 bar inlet pressure with a pressure drop of 1 bar from inlet to outlet, while the pressure level of the regenerated bed is 18 bar. Regeneration heat is provided by electricity for heating a smaller flow of dry tail gas (REC01) equivalent to 6% of the total flowrate of the dehydrated stream. The dry regeneration gas is extracted downstream of the dehydration unit. Due to the batch nature of the regeneration cycle, the specific power requirement of the regeneration cycle is given as an average value of 8 MJ per kg water removed. This figure includes the duty of the electric heater as well as cooling water pumping for condensing out water from the recycle stream.
It should be mentioned that given the availability of high-temperature heat in the heat recovery section of the hydrogen production plant, and also the possibility of partial integration with intercooler heat, more rational means for heat supply are possible from the viewpoint of thermodynamic efficiency. To avoid excessive integration measures, electric power for heating is assumed in the current process, thereby incurring some additional thermodynamic losses compared to what could be achieved with heat integration.
After compression and dehydration, the pressurised tail gas is cooled to –53 °C in a network of heat exchangers inside an insulated coldbox. Two multistream plate-fin heat exchangers (MS-HX1, MS-HX2) ensure heat integration between the feed stream and the process streams while the remainder of the refrigeration duty is provided by two heat exchangers transferring heat to the auxiliary propane and ethane refrigeration cycles (AUX-HX1, AUX-HX2). Figure 8 shows the temperature composite curves for the four heat exchangers. Minimum temperature approach constraints are set to 3 °C for MS-HX1, MS-HX2 and AUX-HX1, and 2 °C in the cold end of AUX-HX2, where the temperature is relatively close to the freeze-out temperature for CO2. As discussed in [30] on the basis of [42], –53 °C/–55 °C on the tail gas/refrigerant sides in the cold end of AUX-HX2 is unlikely to pose any risk of CO2 freeze-out, and even lower separator temperatures may be applicable.
At the main separator inlet, the liquid mass fraction in the partially condensed tail gas stream is around 0.80, with 90.1% of the CO2 liquefied. The liquid-phase CO2 fraction is 95.6 mol% with the complementary fraction (4.4 mol%) consisting of dissolved hydrogen, methane, CO and nitrogen. In the main separator, the CO2-rich liquid phase is separated from the CO2-depleted vapour phase, which has a hydrogen fraction of 53.9 mol%. The liquid stream is subsequently stripped of the volatile components in a three-stage flash separation cascade to obtain higher CO2 purity. To avoid freeze-out as well as to enhance the purification of CO2, the high-pressure liquid stream is heated to –22.5 °C in MS-HX2 before flashing. The pressure level of each flash stage is matched with the suction pressure of compressors TG-CPR3–5, adjusted with a pressure loss of 0.1 bar in each recycle stream. Pressure levels in the flash separators are 31.80 bar, 17.10 bar and 6.94 bar. At the liquid outlet of the final flash stage, the temperature is –50.7 °C and a CO2 purity of 99.85 mol% is achieved. In order to reach the 110 bar target pressure for the purified CO2 product, the liquid stream is pumped in two stages; in the first stage to 70 bar to limit the required pressure rating of heat exchangers MS-HX1 and MS-HX2, and finally to 110 bar after heating.
As described in Section 4.1, the vapour product from the main separator is to a high degree recycled to reactors in the hydrogen production plant along with a smaller fraction for purge and thermal recuperation via a combustor. To maximise the heat recuperation of the vapour product, it is first used to cool the tail gas feed stream in MS-HX1 and MS-HX2. Since there is a potential to utilise also parts of the pressure-based exergy of this stream, it is expanded from 54.7 bar to 42.3 bar in a low-temperature turbine. The expansion induces a 15.5 °C temperature drop, which enables the re-use of the stream in a second cold-side pass in MS-HX2, thereby increasing the recuperation and further reducing the required duty of auxiliary refrigeration. The shaft power of the turbine is assumed to be dissipated by a turbine brake connected to the same shaft, as described in Section 3.4.3.
The auxiliary refrigeration cycle is designed to provide evaporative refrigeration duty on the cold side of heat exchangers AUX-HX1 and AUX-HX2 to compensate for the deficit in refrigeration duty. The propane cycle has two compressor stages raising the pressure between the evaporator pressure at 2.27 bar, intermediate pressure at 3.46 bar and the high-pressure level for condensation at 9.50 bar. In the condenser, propane is cooled by water to 23 °C, giving it a slight subcooling before the stream is throttled into the economiser at the intermediate pressure stage. The liquid stream extracted from the economiser is throttled down to the evaporator pressure and distributed to heat exchangers AUX-HX1, providing refrigeration for tail gas cooling, and the cascade C2 Condenser for ethane condensation. The process for distributing propane to these heat exchangers can be configured with different layouts, for instance by locating the splitter immediately downstream the liquid outlet and with two individual throttling valves replacing C3-V1 in Figure 7. This would enable distribution of the two propane refrigerant streams in liquid phase. This avoids the need for splitting a two-phase stream, which may easily lead to maldistribution. However, for the purpose of the present work, the choice of configuration will neither affect mass and energy balances, nor the exergy balance or other results, since AUX-HX1 and C2 Condenser have equal evaporation pressures.
5. Results and Discussion
The energy supplied to the low-temperature tail gas separation process is entirely made up of power. The main portion, about 82%, of the power input is caused by the need for tail gas compression. A summary of the power requirement is given in Table 2, while a more detailed breakdown of compressor power is provided in Appendix A.
The power requirement in the tail gas separation unit equals 34.22 MW, or 706.9 MJ/tonCO2 in specific terms. This states the amount of power required per mass unit of CO2 captured at high purity and high pressure but does not reveal the actual efficiency of the process. In order to determine the exergy efficiency as expressed in Equation (2), the minimum exergy requirement must be calculated.
Furthermore, in order to understand the causes and drivers of exergy losses and to pinpoint potential ways to improve the efficiency, an exergy analysis of all sub-process units is required. In the following, a detailed exergy analysis will be presented, with the purpose of:
- Deriving the minimum exergy requirement for transforming the tail gas feed stream into the specified separation products;
- Calculating the exergy efficiency of this process;
- Providing full transparency of the causes of exergy losses;
and thereby provide:
- A detailed explanation of the required power input to the process;
- Transparent checks and balances to verify that all irreversibilities have been accounted for by disclosing the relative difference in the independent irreversibility calculations based on the bottom up and top down approaches (see Equations (6–7));
- A basis for assessing further opportunities for improving the process efficiency.
5.1. Minimum Exergy Requirement for the Tail Gas Separation Unit
The minimum exergy requirement is obtained from Equations (3–5) and (8) and equals the difference between the exergy flows of the two product streams C12 and VP05, and the feed stream TG01. Process stream properties are provided in Appendix A, while the calculated exergy flows are presented graphically and numerically in Figure 9.
As can be observed, the exergy transfer and thus the minimum exergy input to the process amounts to 19 979 kW. Of this, the main exergy transfer consists of an increase in thermomechanical exergy equal to 17 696 kW, while the corresponding increase in chemical exergy equals 2 283 kW. In specific terms, the minimum exergy requirement scaled by the flowrate of captured CO2 is 412.7 MJ/tonCO2. However, it should be mentioned that for this particular process, both separation products are key outputs. Therefore, scaling the exergy requirement with the flowrate of CO2 and using it as a key performance indicator is associated with a degree of ambiguity. As can be observed in Figure 9, almost half of the thermomechanical exergy is transferred to the process stream VP05, 93% of which is recycled to the hydrogen plant (see Table 1). So, the task of the tail gas separation process is to provide both a high-pressure, high-purity CO2 product, and a recyclable, high-pressure, CO2-depleted tail gas stream.
5.2. Distribution of Process Irreversibilities
By applying the methodology for quantifying individual irreversibilities described in Section 3.4, exergy losses have been calculated for 42 different process units or components, comprising a total of 50 irreversibility elements. The results are summarised in Figure 10 and broken down in two different stacked bar diagrams.
The left hand stack shows the contribution from each of the 42 components, while the right hand stack shows results for seven different sub-processes. As shown in Table 2, tail gas compression is by far the dominant driver for power input to the process. This is also the case with respect to irreversibilities in the system, where the tail gas compressors and intercoolers account for around 61.1% of the total irreversibilities. Auxiliary refrigeration is second to tail gas compression with respect to irreversibilities and causes around 14.3% of the total irreversibilities. The desiccant dehydration process causes around 8.0% of the total irreversibilities, and the proportion of losses in the four heat exchangers MS-HX1, MS-HX2, AUX-HX1 and AUX-HX2 combined is of a similar proportion of around 8.2%.
As can be observed from the decomposed irreversibility numbers, the separation and purification units, which comprise the main separator and three flash stages, account for only about 513 kW, or only 3.6% of the overall losses. These losses are entirely caused by the throttling valves upstream of each flash separation stage. The irreversibility rate in each separator equals zero since each separator itself is assumed to be adiabatic, at phase equilibrium, and otherwise has no inlet or outlet losses due to the neglection of kinetic and potential exergy terms. The C3 economiser in the auxiliary refrigeration cycle, to which the same assumptions apply, is attributed an irreversibility rate of about 4 kW. This is explained by the fact that this separator has two inlet streams with different temperatures, which in turn causes irreversibilities caused by mixing effects in the vessel. The significance of heat leakage into the low-temperature separation vessels is discussed in the sensitivity analysis in Section 5.6.
5.3. Irreversibility components in process heat exchangers
Heat exchangers contribute to a significant portion of overall irreversibilities. While the five compressor intercoolers cause a total irreversibility of 5148 kW, mainly due to the complete dissipation of waste heat, the four low-temperature heat exchangers for partial liquefaction of the tail gas cause a total irreversibility of 1166 kW. Although the total irreversibility incurred in each heat exchanger can be determined by Equation (9) from the entropy and flowrate of each inlet and outlet process stream, Equations (11) and (12) make it possible to determine the separate irreversibility components caused by heat transfer and pressure drop.
Figure 11 shows the temperature composite curves and cumulative irreversibility components for coldbox heat exchangers MS-HX1, MS-HX2, AUX-HX1 and AUX-HX2. In each diagram, the cumulate values for and are plotted as function of the normalised heat transfer with the cold end of the heat exchanger as reference point. In all heat exchangers, the heat transfer across finite temperature difference is the dominant cause of irreversibilities. MS-HX1 is the unit with the highest share of irreversibility caused by pressure drop, corresponding to 22.7% of the irreversibility. In MS-HX2, the corresponding percentage is 12.4%, while roughly 9% of irreversibilities are caused by the pressure drop in heat exchangers AUX-HX1 and AUX-HX2.
5.4. Consistency of Irreversibility Calculations
To corroborate the numerical results of the exergy analysis and to verify the consistency of the exergy balance, the two independent calculations for irreversibilities given by Equations (6) and (7) should be compared. Discrepancies between the two numbers will imply potential errors in the exergy calculations and book-keeping methodology, however, without locating or pinpointing such discrepancies.
Table 3 presents the total irreversibility rate quantified by the independent top-down and bottom-up approaches, where the first figure is based on boundary-crossing exergy flows and the second equals the sum of 50 individual irreversibility terms for 42 different components (see Figure 10). As can be observed, the relative difference between the two numbers is , which is of an order of magnitude reflecting the background accuracy of convergence the simulation software. The consistency between the top-down and the detailed bottom-up irreversibility calculations is therefore considered to be verified.
5.5. Exergy Efficiency
Equation (2) defines the exergy efficiency of the low-temperature tail gas separation process as the ratio between the minimum theoretical work and actual work for transforming the feed stream into the two separation products at desired thermodynamic states. The minimum exergy requirement for this process is calculated to be 19 979 kW as given by Figure 9, while the corresponding power requirement in the current process configuration is found to be 34 223 kW, as given in Table 2. The resulting exergy efficiency thus becomes 58.38%.
This result may be checked against a more general definition of exergy efficiency, such as the rational efficiency [40],
where each numerator term represents useful exergy output, and each denominator term represents necessary exergy input. In the separation process in consideration, there is no main product and by-product, rather two useful products, as discussed in Section 5.1. The useful output of the process can thus be considered as the sum of increased chemical exergy and increased thermomechanical exergy, while the necessary input equals the sum of power consumption:
When comparing the third and fourth columns in Figure 9, it becomes clear that the sum of increased chemical and thermomechanical exergies equals the minimum exergy requirement for the process. Therefore, the numerical values of the numerator and denominator are equal in the two expressions for exergy efficiency given by Equations (2) and (20), thus giving the same result.
5.6. Sensitivity Analysis
The exergy balance and resulting exergy efficiency of the low-temperature tail gas separation unit relies on an extensive set of assumptions that is summarised in Appendix A. To supplement the baseline results that are used as basis to derive the exergy balance and efficiency figures, a supplementary sensitivity analysis is presented in Table 4. A selection of variables is subject to arbitrary changes, and the stand-alone impact each change has on the total irreversibility rate, power requirement and exergy efficiency is ranked in a descending order.
Since compression of the tail gas and the refrigerants make up about 95% of the total exergy input, it is obvious that the overall efficiency is sensitive to compressor efficiencies. A 5 % point reduction in each compressor's isentropic efficiency reduces the overall exergy efficiency by 3.3 % points. Second to this sensitivity it was found that doubling pressure losses in all heat exchangers and ambient coolers in the process reduces the exergy efficiency by 2.5 % points.
In the baseline results, all separators and the refrigeration cycle economiser are considered to be adiabatic. Even with two insulating barriers (surface insulation and cold-box insulation), there will be a certain heat leakage from the ambient surroundings. Given the size of the plant and vapour–liquid separators, the potential heat leakage is assumed to be in the kilowatt order of magnitude. Hence, the aggregate impact of 1000 W heat leakage into each vessel has been evaluated, and is found to reduce the exergy efficiency by only 0.01 % points.
6. Discussion
It should be emphasised that the variable changes in Table 4 represent stricter assumptions that result in higher irreversibilities and power demand, and consequently lower exergy efficiency. Thus, no upside potentials with respect to efficiency are presented here, although obvious opportunities for improvements exist. As an example, recovery of the expander power in the form of mechanical or electric power has the potential to improve the exergy efficiency by up to around 0.7 % points. Another possibility for power recovery is to compress the vapour product stream (VP05) with a compressor drawing power directly from the expander shaft, before the CO2-depleted vapour product is recycled to the hydrogen production plant. This will allow a higher pressure ratio across the expander and thus a higher induced temperature drop, which in turn will increase the internal heat recuperation and correspondingly reduce the duty of AUX-HX2 as well as the compressor duties in the auxiliary refrigeration cycles.
Turbines can theoretically replace the throttling valves HFV, MFV and LFV in the CO2 purification section. It should be noted that these valves have a combined irreversibility of 512.7 kW, which is considerable in proportion when compared to for instance the multi-megawatt low-temperature heat exchangers. As one example, the LFV valve has an irreversibility rate of about 182 kW, which is virtually equal to the total irreversibilities in MS-HX1, which has a thermal duty close to 5 MW. Replacing the throttling valves with expanders would theoretically reduce the entropy production and thus the irreversibilities associated with CO2 purification. However, the realisation of such expanders must be investigated in depth, as freeze-out of the cold CO2-rich liquid due to pressure- and enthalpy drop in nozzles and impellers cannot be ruled out. Moreover, such expanders must be able to handle a two-phase outlet flow.
Ambient coolers in the tail gas compression section and the auxiliary refrigeration cycle account for almost 41% of the total process irreversibilities. Hence, it is obvious that utilisation of waste heat provides at least a theoretical potential to improving the overall exergy efficiency. The highest temperatures of rejected heat are found after the first and second compressor stages, with discharge temperatures of 116.9 °C and 110.7 °C, respectively. The perhaps most obvious potential for internal recuperation of waste heat is found in the molsieve desiccant dehydration process, which is the only section of the process with a heat demand above ambient temperature. Therefore, the power requirement and thus the irreversibilities in the dehydration process can theoretically be reduced by a partial heat integration with the cooling of compressed tail gas. Depending on plant co-location with adjacent industries, external utilisation of waste heat in greenhouses, aquaculture, district heating and more, can also be envisaged [43].
7. Conclusions
In order to estimate the exergy efficiency of the tail gas separation unit and to quantify and locate the cause of thermodynamic losses in form of irreversibility, a detailed exergy analysis has been conducted for a proposed configuration of the tail gas processing cycle as part of a large-scale 500 t/d hydrogen production plant.
The total irreversibility rate is made up of 42 identified components and 7 sub-processes. The main portion of exergy demand, 82%, is caused by the need for tail gas compression. This is also reflected in the exergy balance, where 61.1% of irreversibilities are caused by tail gas compression and intercooling. The other drivers for irreversibilities are found to be auxiliary refrigeration (14.3%), solid desiccant dehydration (8.0%), coldbox heat exchangers for tail gas cooling and liquefaction (8.2%), CO2 separation/purification (3.6%), the cold expander and expander brake system (3.4%) and CO2 pumps (1.4%).
Two independent calculations for total irreversibility rate in the low-temperature separation units have been performed to check the degree of consistency and thereby verify the results obtained from the exergy analysis. Comparing the sum of individual irreversibilities in all 42 different components with the corresponding irreversibility rate obtained from the balance of exergy flows crossing the system boundaries, it is concluded that the two methods yield identical results, as the relative deviation between the independent calculations has a value of . Given the current set of assumptions applied to the process model, the overall exergy efficiency and the rational efficiency of the low-temperature tail gas separation process are both calculated to be 58.38%.
A supplementary sensitivity analysis suggests that the main uncertainty with respect to exergy efficiency pertains the efficiency of compressors used for tail gas compression and for auxiliary refrigerant compression. This is explained by the fact that about 95% of the exergy requirement is supplied as compressor power, which in turn affects irreversibilities in compressors as well as intercoolers.
Author Contributions
Conceptualization, D.B., J.S. and T.G.; methodology, D.B., J.S. and T.G.; validation, D.B.; formal analysis, D.B.; writing—original draft preparation, D.B. and J.S.; writing—review and editing, T.G.; visualization, D.B. and J.S.; supervision, T.G.; All authors have read and agreed to the published version of the manuscript.”
Funding
This research was funded by the Research Council of Norway (Norges forskningsråd).
Data Availability Statement
The original contributions presented in the study are included in the article and appendix. Further inquiries can be directed to the corresponding author.
Acknowledgments
The authors acknowledge the Research Council of Norway for basic funding supporting this work.
Conflicts of Interest
D.B. and J.S. are inventors of one granted Norwegian patent no. 347086 "Method for production of H2 with high carbon capture ratio and efficiency" and patent-pending application "Method for production of h2 with high carbon capture ratio and efficiency" (EP4263424A1; PCT/NO2021/050264), and co-inventors on patent-pending application "Method and plant for separation of carbon dioxide (co2)" (PCT/EP2023/065703). The funders had no role in the design of the study; in the collection, analyses, or interpretation of data; in the writing of the manuscript; or in the decision to publish the results.
Appendix A

Table A1.
Process stream data.
| Stream ID | Temperature | Pressure | Molar Flow | Enthalpy | Entropy | Chemical composition [mol%] | |||||||
| °C | bar | kmol/h | kJ/kmol | kJ/(kmol-K) | CH4 | CO2 | N2 | CO | H2O | H2 | C3H8 | C2H6 | |
| C01 | –53.00 | 55.00 | 5049.9 | –395822 | 78.15 | 1.09 | 95.61 | 1.65 | 0.63 | 0.00 | 1.02 | — | — |
| C02 | –22.50 | 54.70 | 5049.9 | –393152 | 89.49 | 1.09 | 95.61 | 1.65 | 0.63 | 0.00 | 1.02 | — | — |
| C03 | –25.43 | 31.80 | 5049.9 | –393152 | 89.95 | 1.09 | 95.61 | 1.65 | 0.63 | 0.00 | 1.02 | — | — |
| C04 | –25.43 | 31.80 | 4802.7 | –400800 | 87.71 | 0.84 | 97.51 | 0.97 | 0.38 | 0.00 | 0.30 | — | — |
| C05 | –32.87 | 17.10 | 4802.7 | –400800 | 88.08 | 0.84 | 97.51 | 0.97 | 0.38 | 0.00 | 0.30 | — | — |
| C06 | –32.87 | 17.10 | 4463.6 | –407318 | 84.00 | 0.45 | 99.06 | 0.32 | 0.13 | 0.00 | 0.03 | — | — |
| C07 | –50.72 | 6.94 | 4463.6 | –407318 | 84.52 | 0.45 | 99.06 | 0.32 | 0.13 | 0.00 | 0.03 | — | — |
| C08 | –50.72 | 6.94 | 3966.0 | –411740 | 76.72 | 0.10 | 99.85 | 0.03 | 0.01 | 0.00 | 0.00 | — | — |
| C09 | –47.46 | 70.00 | 3966.0 | –411419 | 77.13 | 0.10 | 99.85 | 0.03 | 0.01 | 0.00 | 0.00 | — | — |
| C10 | –22.00 | 69.70 | 3966.0 | –409219 | 86.36 | 0.10 | 99.85 | 0.03 | 0.01 | 0.00 | 0.00 | — | — |
| C11 | 11.21 | 69.40 | 3966.0 | –405634 | 99.72 | 0.10 | 99.85 | 0.03 | 0.01 | 0.00 | 0.00 | — | — |
| C12 | 16.56 | 110.00 | 3966.0 | –405365 | 99.94 | 0.10 | 99.85 | 0.03 | 0.01 | 0.00 | 0.00 | — | — |
| HR01 | –25.43 | 31.80 | 247.2 | –244539 | 133.45 | 6.06 | 58.70 | 14.75 | 5.48 | 0.00 | 15.01 | — | — |
| HR02 | –25.51 | 31.70 | 247.2 | –244539 | 133.47 | 6.06 | 58.70 | 14.75 | 5.48 | 0.00 | 15.01 | — | — |
| LR01 | –50.72 | 6.94 | 497.6 | –372078 | 146.72 | 3.24 | 92.75 | 2.64 | 1.07 | 0.00 | 0.30 | — | — |
| LR02 | –50.90 | 6.84 | 497.6 | –372078 | 146.83 | 3.24 | 92.75 | 2.64 | 1.07 | 0.00 | 0.30 | — | — |
| MR01 | –32.87 | 17.10 | 339.1 | –315003 | 141.79 | 5.89 | 77.11 | 9.51 | 3.64 | 0.00 | 3.85 | — | — |
| MR02 | –33.01 | 17.00 | 339.1 | –315003 | 141.83 | 5.89 | 77.11 | 9.51 | 3.64 | 0.00 | 3.85 | — | — |
| REC01 | 23.00 | 31.70 | 522.6 | –256736 | 137.15 | 2.60 | 63.68 | 8.35 | 2.91 | 0.00 | 22.45 | — | — |
| REC02 | 23.00 | 17.00 | 522.6 | –256387 | 143.17 | 2.60 | 63.68 | 8.35 | 2.91 | 0.00 | 22.45 | — | — |
| TG01 | 23.00 | 1.10 | 7369.3 | –245773 | 165.91 | 2.40 | 60.93 | 8.66 | 2.99 | 0.26 | 24.75 | — | — |
| TG02 | 116.93 | 3.05 | 7369.3 | –242442 | 167.22 | 2.40 | 60.93 | 8.66 | 2.99 | 0.26 | 24.75 | — | — |
| TG03 | 23.00 | 2.75 | 7369.3 | –245809 | 158.21 | 2.40 | 60.93 | 8.66 | 2.99 | 0.26 | 24.75 | — | — |
| TG04 | 110.65 | 7.14 | 7369.3 | –242727 | 159.44 | 2.40 | 60.93 | 8.66 | 2.99 | 0.26 | 24.75 | — | — |
| TG05 | 23.00 | 6.84 | 7369.3 | –245896 | 150.42 | 2.40 | 60.93 | 8.66 | 2.99 | 0.26 | 24.75 | — | — |
| TG06 | 17.87 | 6.84 | 7866.9 | –253878 | 150.45 | 2.46 | 62.94 | 8.28 | 2.87 | 0.24 | 23.20 | — | — |
| TG07 | 101.80 | 17.30 | 7866.9 | –250982 | 151.63 | 2.46 | 62.94 | 8.28 | 2.87 | 0.24 | 23.20 | — | — |
| TG08 | 23.00 | 17.00 | 7866.9 | –253944 | 142.90 | 2.46 | 62.94 | 8.28 | 2.87 | 0.24 | 23.20 | — | — |
| TG09 | 20.68 | 17.00 | 8728.6 | –256462 | 142.96 | 2.60 | 63.54 | 8.33 | 2.91 | 0.22 | 22.41 | — | — |
| TG10 | 79.87 | 33.00 | 8728.6 | –254496 | 143.80 | 2.60 | 63.54 | 8.33 | 2.91 | 0.22 | 22.41 | — | — |
| TG11 | 23.00 | 32.70 | 8728.6 | –256769 | 136.84 | 2.60 | 63.54 | 8.33 | 2.91 | 0.22 | 22.41 | — | — |
| TG12 | 23.00 | 31.70 | 8186.8 | –256736 | 137.15 | 2.60 | 63.68 | 8.35 | 2.91 | 0.00 | 22.45 | — | — |
| TG13 | 21.54 | 31.70 | 8434.0 | –256378 | 137.07 | 2.70 | 63.53 | 8.54 | 2.99 | 0.00 | 22.24 | — | — |
| TG14 | 74.00 | 56.50 | 8434.0 | –254741 | 137.78 | 2.70 | 63.53 | 8.54 | 2.99 | 0.00 | 22.24 | — | — |
| TG15 | 23.00 | 56.20 | 8434.0 | –256928 | 131.00 | 2.70 | 63.53 | 8.54 | 2.99 | 0.00 | 22.24 | — | — |
| TG16 | –8.40 | 55.90 | 8434.0 | –259051 | 123.33 | 2.70 | 63.53 | 8.54 | 2.99 | 0.00 | 22.24 | — | — |
| TG17 | –19.00 | 55.60 | 8434.0 | –262272 | 110.96 | 2.70 | 63.53 | 8.54 | 2.99 | 0.00 | 22.24 | — | — |
| TG18 | –37.44 | 55.30 | 8434.0 | –265519 | 97.77 | 2.70 | 63.53 | 8.54 | 2.99 | 0.00 | 22.24 | — | — |
| TG19 | –53.00 | 55.00 | 8434.0 | –267322 | 89.89 | 2.70 | 63.53 | 8.54 | 2.99 | 0.00 | 22.24 | — | — |
| VP01 | –53.00 | 55.00 | 3384.1 | –75570 | 107.41 | 5.11 | 15.67 | 18.83 | 6.50 | 0.00 | 53.89 | — | — |
| VP02 | –22.50 | 54.70 | 3384.1 | –74546 | 111.81 | 5.11 | 15.67 | 18.83 | 6.50 | 0.00 | 53.89 | — | — |
| VP03 | –38.03 | 42.31 | 3384.1 | –74969 | 112.13 | 5.11 | 15.67 | 18.83 | 6.50 | 0.00 | 53.89 | — | — |
| VP04 | –22.50 | 42.01 | 3384.1 | –74462 | 114.28 | 5.11 | 15.67 | 18.83 | 6.50 | 0.00 | 53.89 | — | — |
| VP05 | 11.21 | 41.70 | 3384.1 | –73374 | 118.41 | 5.11 | 15.67 | 18.83 | 6.50 | 0.00 | 53.89 | — | — |
| C3-LP01 | –22.00 | 2.27 | 2796.1 | –124068 | 76.46 | — | — | — | — | — | — | 100 | — |
| C3-LP02 | –22.00 | 2.27 | 1150.6 | –124068 | 76.46 | — | — | — | — | — | — | 100 | — |
| C3-LP03 | –19.49 | 2.23 | 1150.6 | –107355 | 143.14 | — | — | — | — | — | — | 100 | — |
| C3-LP04 | –22.00 | 2.27 | 1645.5 | –124068 | 76.46 | — | — | — | — | — | — | 100 | — |
| C3-LP05 | –22.49 | 2.23 | 1645.5 | –107559 | 142.33 | — | — | — | — | — | — | 100 | — |
| C3-LP06 | –21.25 | 2.23 | 2796.1 | –107475 | 142.67 | — | — | — | — | — | — | 100 | — |
| C3-IP01 | –3.82 | 3.46 | 2796.1 | –106440 | 143.25 | — | — | — | — | — | — | 100 | — |
| C3-IP02 | –9.87 | 3.46 | 2796.1 | –124068 | 76.30 | — | — | — | — | — | — | 100 | — |
| C3-IP03 | –9.87 | 3.46 | 3675.6 | –106873 | 141.62 | — | — | — | — | — | — | 100 | — |
| C3-IP04 | 33.21 | 9.50 | 3675.6 | –104430 | 142.82 | — | — | — | — | — | — | 100 | — |
| C3-IP05 | 23.00 | 9.20 | 3675.6 | –120284 | 89.67 | — | — | — | — | — | — | 100 | — |
| C3-IP06 | –9.88 | 3.46 | 3675.6 | –120284 | 90.68 | — | — | — | — | — | — | 100 | — |
| C2-01 | 17.04 | 15.50 | 1488.5 | –86207 | 168.83 | — | — | — | — | — | — | — | 100 |
| C2-02 | –18.71 | 15.20 | 1488.5 | –99126 | 118.88 | — | — | — | — | — | — | — | 100 |
| C2-03 | –55.00 | 4.60 | 1488.5 | –99126 | 120.28 | — | — | — | — | — | — | — | 100 |
| C2-04 | –52.00 | 4.52 | 1488.5 | –88913 | 167.22 | — | — | — | — | — | — | — | 100 |
Table A2.
Efficiencies and power of compressors, pumps and the expander.
| Isentropic efficiency |
Polytropic efficiency |
Shaft power | |
| % | % | kW | |
| Tail gas compressor, stage 1 | 85.0 | 86.6 | 6819.9 |
| Tail gas compressor, stage 2 | 85.0 | 86.5 | 6307.8 |
| Tail gas compressor, stage 3 | 85.0 | 86.5 | 6329.7 |
| Tail gas compressor, stage 4 | 85.0 | 86.1 | 4765.9 |
| Tail gas compressor, stage 5 | 85.0 | 86.0 | 3836.4 |
| Propane compressor, stage 1 | 85.0 | 85.4 | 804.4 |
| Propane compressor, stage 2 | 85.0 | 86.0 | 2495.3 |
| Ethane compressor | 83.0 | 84.9 | 1118.8 |
| Expander | 85.0 | 84.5 | 397.7 |
| LT CO2 pump | 75.0 | 353.6 | |
| HT CO2 pump | 75.0 | 297.0 |
Table A3.
Heat exchanger data.
| Heat exchanger ID | Minimum temperature approach |
Pressure drop per pass |
Thermal duty |
| °C | kPa | kW | |
| MS-HX1 | 3.0 | 30 | 4972.3 |
| AUX-HX1 | 3.0 | 4–30 | 7546.2 |
| MS-HX2 | 3.0 | 30 | 7608.5 |
| AUX-HX2 | 2.0 | 8–30 | 4222.6 |
| C2 Condenser | 3.3 | 4–30 | 5341.5 |
Table A4.
Other assumptions.
| Dehydration, specific power | MJp/kgH2O | 8 |
| Molsieve bed, pressure drop | kPa | 100 |
| Molsieve regeneration recycle ratio | % | 6 |
| Ambient coolers, outlet temperature | °C | 23 |
| Ambient coolers, pressure drop | kPa | 30 |
| Ambient coolers, specific pumping power | MJp/MJth | 0.007 |
References
- Seck, G.S.; Hache, E.; Sabathier, J.; Guedes, F.; Reigstad, G.A.; Straus, J.; Wolfgang, O.; Ouassou, J.A.; Askeland, M.; Hjorth, I.; et al. Hydrogen and the Decarbonization of the Energy System in Europe in 2050: A Detailed Model-Based Analysis. Renew. Sustain. Energy Rev. 2022, 167, 112779. [Google Scholar] [CrossRef]
- Pruvost, F.; Cloete, S.; Arnaiz del Pozo, C.; Zaabout, A. Blue, Green, and Turquoise Pathways for Minimizing Hydrogen Production Costs from Steam Methane Reforming with CO2 Capture. Energy Convers. Manag. 2022, 274, 116458. [Google Scholar] [CrossRef]
- Berstad, D.; Gundersen, T. On the Exergy Efficiency of CO2 Capture: The Relation between Sub-Process and Overall Efficiencies. Carbon Capture Sci. Technol. 2023, 7, 100111. [Google Scholar] [CrossRef]
- Straus, J.; Skjervold, V.T.; Anantharaman, R.; Berstad, D. Novel Approach for Low CO2 Intensity Hydrogen Production from Natural Gas. Sustain. Energy Fuels 2022, 6, 4948–4961. [Google Scholar] [CrossRef]
- Tuinier, M.J.; van Sint Annaland, M.; Kuipers, J.A.M. A Novel Process for Cryogenic CO2 Capture Using Dynamically Operated Packed Beds—An Experimental and Numerical Study. Int. J. Greenh. Gas Control 2011, 5, 694–701. [Google Scholar] [CrossRef]
- Tuinier, M.J.; Hamers, H.P.; van Sint Annaland, M. Techno-Economic Evaluation of Cryogenic CO2 Capture—A Comparison with Absorption and Membrane Technology. Int. J. Greenh. Gas Control 2011, 5, 1559–1565. [Google Scholar] [CrossRef]
- Clodic, D.; Hitti, R.; Younes, M.; Bill, A.; Casier, F. CO2 Capture by Anti-Sublimation Thermo-Economic Process Evaluation. Fourth Annu. Conf. Carbon Capture Sequestration 2005.
- Clodic, D.; Younes, M.; Bill, A. Test Results of CO2 Capture by Anti-Sublimation Capture Efficiency and Energy Consumption for Boiler Plants. In Greenhouse Gas Control Technologies; 2005; pp. 1775–1780 ISBN 978-0-08-044704-9.
- Clodic, D.; Younes, M.; Riachi, Y.; El Hitti, R.; Boulawz Ksayer, E.; Pan, X.; Yu, Y. CO2 Capture by Anti-Sublimation Using Integrated Cascade System. Available online: https://iifiir.org/en/fridoc/co2-capture-by-anti-sublimation-using-integrated-cascade-system-27838 (accessed on 16 January 2024).
- Tuinier, M.J.; van Sint Annaland, M.; Kramer, G.J.; Kuipers, J.A.M. Cryogenic CO2 Capture Using Dynamically Operated Packed Beds. Chem. Eng. Sci. 2010, 65, 114–119. [Google Scholar] [CrossRef]
- Cann, D.; Font-Palma, C.; Willson, P. Moving Packed Beds for Cryogenic CO2 Capture: Analysis of Packing Material and Bed Precooling. Carbon Capture Sci. Technol. 2021, 1, 100017. [Google Scholar] [CrossRef]
- Cann, D.; Font-Palma, C.; Willson, P. Experimental Analysis of CO2 Frost Front Behaviour in Moving Packed Beds for Cryogenic CO2 Capture. Int. J. Greenh. Gas Control 2021, 107, 103291. [Google Scholar] [CrossRef]
- Jensen, M.J.; Russell, C.S.; Bergeson, D.; Hoeger, C.D.; Frankman, D.J.; Bence, C.S.; Baxter, L.L. Prediction and Validation of External Cooling Loop Cryogenic Carbon Capture (CCC-ECL) for Full-Scale Coal-Fired Power Plant Retrofit. Int. J. Greenh. Gas Control 2015, 42, 200–212. [Google Scholar] [CrossRef]
- De, D.K.; Oduniyi, I.A.; Alex Sam, A. A Novel Cryogenic Technology for Low-Cost Carbon Capture from NGCC Power Plants for Climate Change Mitigation. Therm. Sci. Eng. Prog. 2022, 36, 101495. [Google Scholar] [CrossRef]
- Babar, M.; Mukhtar, A.; Mubashir, M.; Saqib, S.; Ullah, S.; Quddusi, A.H.A.; Bustam, M.A.; Show, P.L. Development of a Novel Switched Packed Bed Process for Cryogenic CO2 Capture from Natural Gas. Process Saf. Environ. Prot. 2021, 147, 878–887. [Google Scholar] [CrossRef]
- Song, C.; Liu, Q.; Ji, N.; Deng, S.; Zhao, J.; Li, Y.; Kitamura, Y. Reducing the Energy Consumption of Membrane-Cryogenic Hybrid CO2 Capture by Process Optimization. Energy 2017, 124, 29–39. [Google Scholar] [CrossRef]
- Bouma, R.; Vercauteren, F.; van Os, P.; Goetheer, E.; Berstad, D.; Anantharaman, R. Membrane-Assisted CO2 Liquefaction: Performance Modelling of CO2 Capture from Flue Gas in Cement Production. Energy Procedia 2017, 114, 72–80. [Google Scholar] [CrossRef]
- Anantharaman, R.; Berstad, D.; Roussanaly, S. Techno-Economic Performance of a Hybrid Membrane – Liquefaction Process for Post-Combustion CO2 Capture. Energy Procedia 2014, 61, 1244–1247. [Google Scholar] [CrossRef]
- Song, C.; Fan, Z.; Li, R.; Liu, Q.; Sun, Y.; Kitamura, Y. Intensification of CO2 Separation Performance via Cryogenic and Membrane Hybrid Process — Comparison of Polyimide and Polysulfone Hollow Fiber Membrane. Chem. Eng. Process. - Process Intensif. 2018, 133, 83–89. [Google Scholar] [CrossRef]
- Li, R.; Lian, S.; Zhang, Z.; Deng, S.; Song, C. Simulation of a Novel Hybrid Membrane-Cryogenic Process for Post-Combustion Carbon Capture. Carbon Capture Sci. Technol. 2022, 5, 100075. [Google Scholar] [CrossRef]
- Berstad, D.; Anantharaman, R.; Nekså, P. Low-Temperature CO2 Capture Technologies – Applications and Potential. Int. J. Refrig. 2013, 36, 1403–1416. [Google Scholar] [CrossRef]
- Magli, F.; Spinelli, M.; Fantini, M.; Romano, M.C.; Gatti, M. Techno-Economic Optimization and off-Design Analysis of CO2 Purification Units for Cement Plants with Oxyfuel-Based CO2 Capture. Int. J. Greenh. Gas Control 2022, 115, 103591. [Google Scholar] [CrossRef]
- Jin, B.; Zhao, H.; Zheng, C. Optimization and Control for CO2 Compression and Purification Unit in Oxy-Combustion Power Plants. Energy 2015, 83, 416–430. [Google Scholar] [CrossRef]
- White, V.; Wright, A.; Tappe, S.; Yan, J. The Air Products Vattenfall Oxyfuel CO2 Compression and Purification Pilot Plant at Schwarze Pumpe. Energy Procedia 2013, 37, 1490–1499. [Google Scholar] [CrossRef]
- Font-Palma, C.; Errey, O.; Corden, C.; Chalmers, H.; Lucquiaud, M.; Sanchez del Rio, M.; Jackson, S.; Medcalf, D.; Livesey, B.; Gibbins, J.; et al. Integrated Oxyfuel Power Plant with Improved CO2 Separation and Compression Technology for EOR Application. Process Saf. Environ. Prot. 2016, 103, 455–465. [Google Scholar] [CrossRef]
- Kim, S.; Lee, H.; Lee, Y. woon; Yang, W. Performance Evaluation of a Pressurized Oxy-Combustion Power Plant According to Wet and Dry Flue Gas Recirculation. Int. J. Greenh. Gas Control 2021, 107, 103277. [Google Scholar] [CrossRef]
- van der Spek, M.; Eldrup, N.H.; Skagestad, R.; Ramirez, A. Techno-Economic Performance of State-of-the-Art Oxyfuel Technology for Low-CO2 Coal-Fired Electricity Production. Energy Procedia 2017, 114, 6432–6439. [Google Scholar] [CrossRef]
- Consonni, S.; Viganò, F.; Kreutz, T.; De Lorenzo, L. CO2 Capture in IGCC Plants via Cryogenic Separation. In Proceedings of the Sixth Annual Conference on Carbon Capture & Sequestration, Pittsburgh, PA, USA, 2007; pp. 7–10. [Google Scholar]
- Berstad, D.; Anantharaman, R.; Nekså, P. Low-Temperature CCS from an IGCC Power Plant and Comparison with Physical Solvents. Energy Procedia 2013, 37, 2204–2211. [Google Scholar] [CrossRef]
- Berstad, D.; Skaugen, G.; Roussanaly, S.; Anantharaman, R.; Nekså, P.; Jordal, K.; Trædal, S.; Gundersen, T. CO2 Capture from IGCC by Low-Temperature Synthesis Gas Separation. Energies 2022, 15, 515. [Google Scholar] [CrossRef]
- Kim, D.; Berstad, D.; Anantharaman, R.; Straus, J.; Peters, T.A.; Gundersen, T. Low Temperature Applications for CO2 Capture in Hydrogen Production. In Computer Aided Chemical Engineering; Pierucci, S., Manenti, F., Bozzano, G.L., Manca, D., Eds.; 30 European Symposium on Computer Aided Process Engineering; Elsevier, 2020; Vol. 48, pp. 445–450.
- Kim, D.; Liu, Z.; Anantharaman, R.; Riboldi, L.; Odsæter, L.; Berstad, D.; Peters, T.A.; Polfus, J.M.; Malerød-Fjeld, H.; Gundersen, T. Design of a Novel Hybrid Process for Membrane Assisted Clean Hydrogen Production with CO2 Capture through Liquefaction. In Computer Aided Chemical Engineering; Yamashita, Y., Kano, M., Eds.; 14 International Symposium on Process Systems Engineering; Elsevier, 2022; Vol. 49, pp. 127–132.
- Leclerc, M.; Rodrigues, G.; Dubettier, R.; Ruban, S. Optimized Configuration to Reduce H2 Carbon Footprint in a Refinery. Int. J. Greenh. Gas Control 2022, 118, 103671. [Google Scholar] [CrossRef]
- Berstad, D.; Stang, J.; Nekså, P. Comparison Criteria for Large-Scale Hydrogen Liquefaction Processes. Int. J. Hydrog. Energy 2009, 34, 1560–1568. [Google Scholar] [CrossRef]
- Marmolejo-Correa, D.; Gundersen, T. A Comparison of Exergy Efficiency Definitions with Focus on Low Temperature Processes. Energy 2012, 44, 477–489. [Google Scholar] [CrossRef]
- Dodge, B.F. Chemical Engineering Thermodynamics; Chemical engineering series; McGraw-Hill Book Company, 1944.
- Gjennestad, M.Aa.; Aursand, E.; Magnanelli, E.; Pharoah, J. Performance Analysis of Heat and Energy Recovery Ventilators Using Exergy Analysis and Nonequilibrium Thermodynamics. Energy Build. 2018, 170, 195–205. [Google Scholar] [CrossRef]
- Berstad, D.; Skaugen, G.; Wilhelmsen, Ø. Dissecting the Exergy Balance of a Hydrogen Liquefier: Analysis of a Scaled-up Claude Hydrogen Liquefier with Mixed Refrigerant Pre-Cooling. Int. J. Hydrog. Energy 2021, 46, 8014–8029. [Google Scholar] [CrossRef]
- Wilhelmsen, Ø.; Berstad, D.; Aasen, A.; Nekså, P.; Skaugen, G. Reducing the Exergy Destruction in the Cryogenic Heat Exchangers of Hydrogen Liquefaction Processes. Int. J. Hydrog. Energy 2018, 43, 5033–5047. [Google Scholar] [CrossRef]
- Kotas, T.J. The Exergy Method of Thermal Plant Analysis; Krieger Pub., 1995; ISBN 978-0-89464-946-2.
- Pichot, D.; Granados, L.; Morel, T.; Schuller, A.; Dubettier, R.; Lockwood, F. Start-up of Port-Jérôme CRYOCAPTM Plant: Optimized Cryogenic CO2 Capture from H2 Plants. Energy Procedia 2017, 114, 2682–2689. [Google Scholar] [CrossRef]
- Fandiño, O.; Trusler, J.P.M.; Vega-Maza, D. Phase Behavior of (CO2+H2) and (CO2+N2) at Temperatures between (218.15 and 303.15)K at Pressures up to 15MPa. Int. J. Greenh. Gas Control 2015, 36, 78–92. [Google Scholar] [CrossRef]
- Reyes-Lúa, A.; Straus, J.; Skjervold, V.T.; Durakovic, G.; Nordtvedt, T.S. A Novel Concept for Sustainable Food Production Utilizing Low Temperature Industrial Surplus Heat. Sustainability 2021, 13, 9786. [Google Scholar] [CrossRef]
| 1 | Whereas the kinetic exergy certainly cannot be neglected in the internals of compressors, turbines and ejectors, the functioning of which is based on acceleration and deceleration of velocities, the overall kinetic exergy differences between the inlet and outlet can be neglected in most other cases. |
| 2 | Neglecting kinetic and potential exergy terms, as discussed in Section 3.1. |
Figure 1.
Generic system boundary with m inlet and k outlet exergy flows (material streams, power and heat) as well as n individual irreversibility components inside the control volume.
Figure 1.
Generic system boundary with m inlet and k outlet exergy flows (material streams, power and heat) as well as n individual irreversibility components inside the control volume.
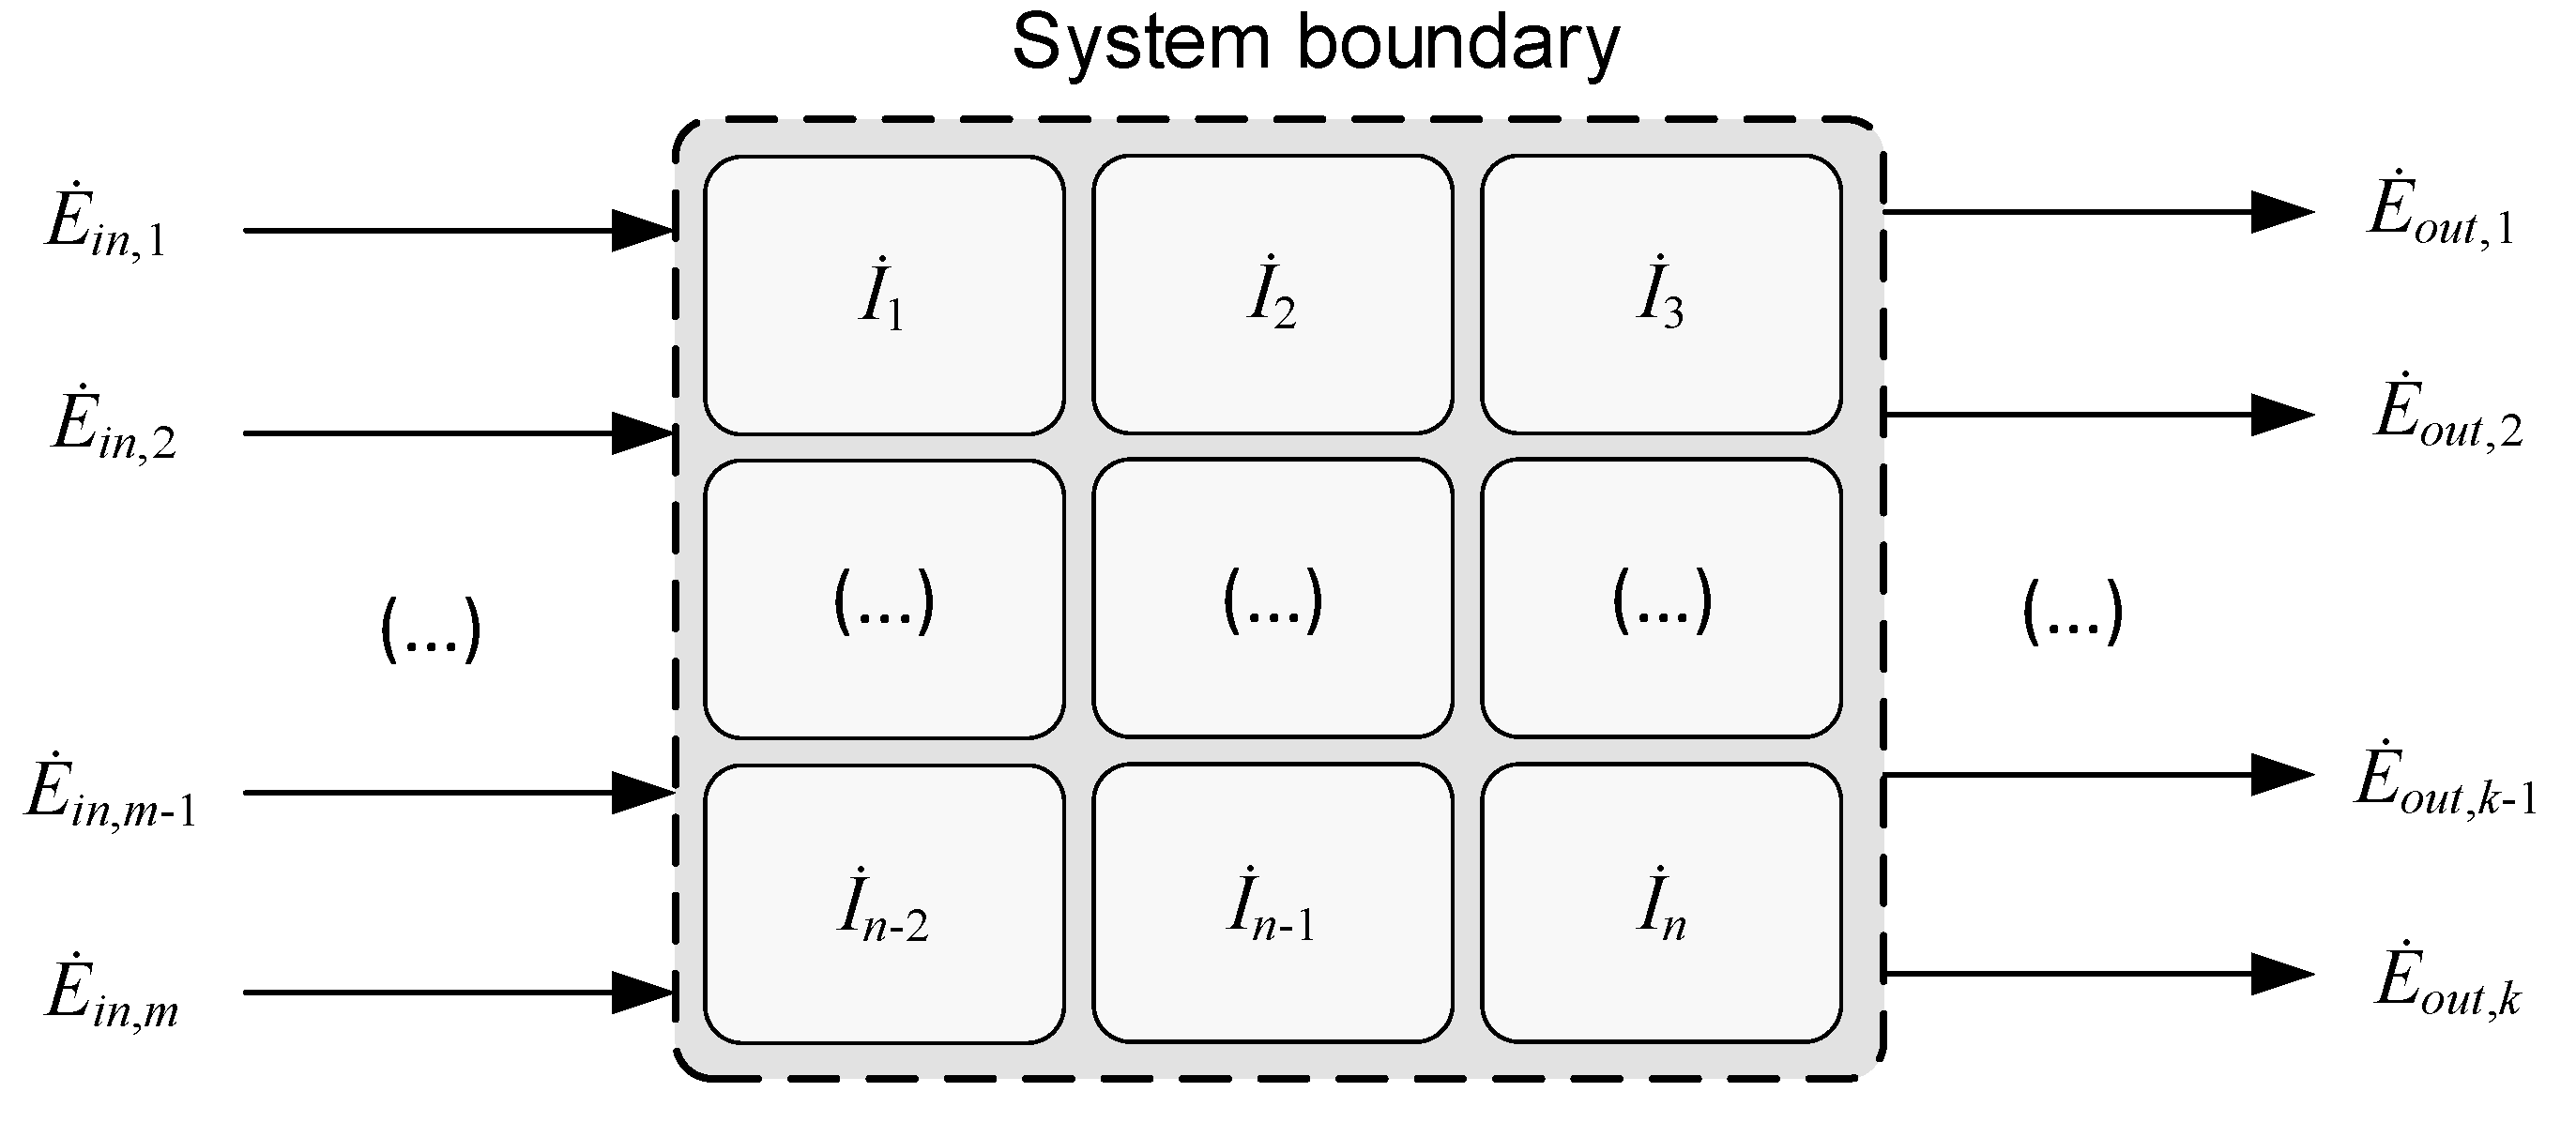
Figure 2.
Reversible separation process.
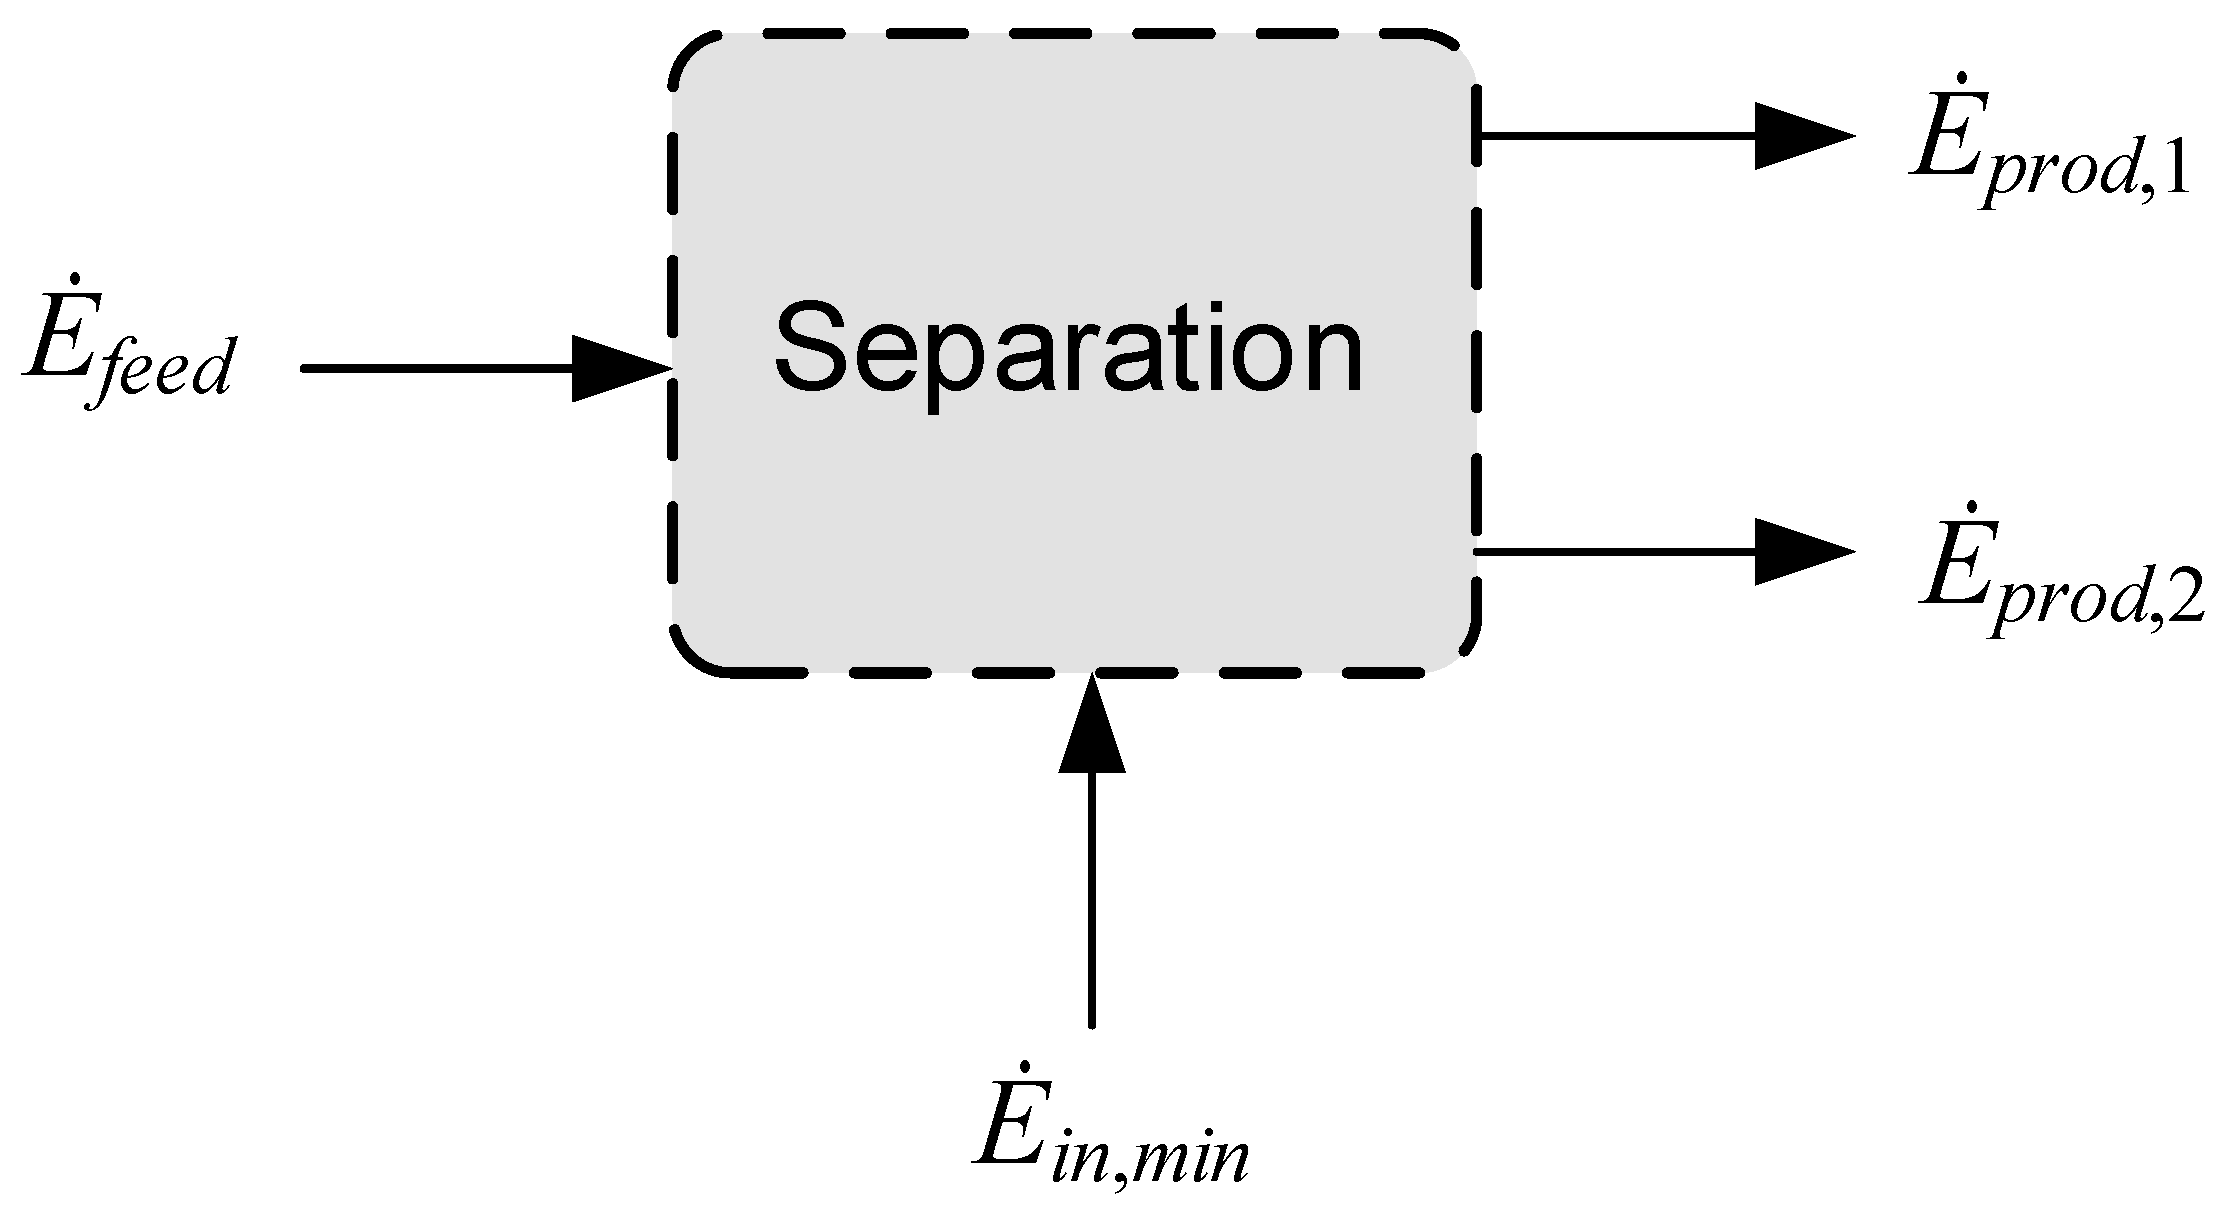
Figure 3.
Control volumes for adiabatic compression and subsequent cooling.
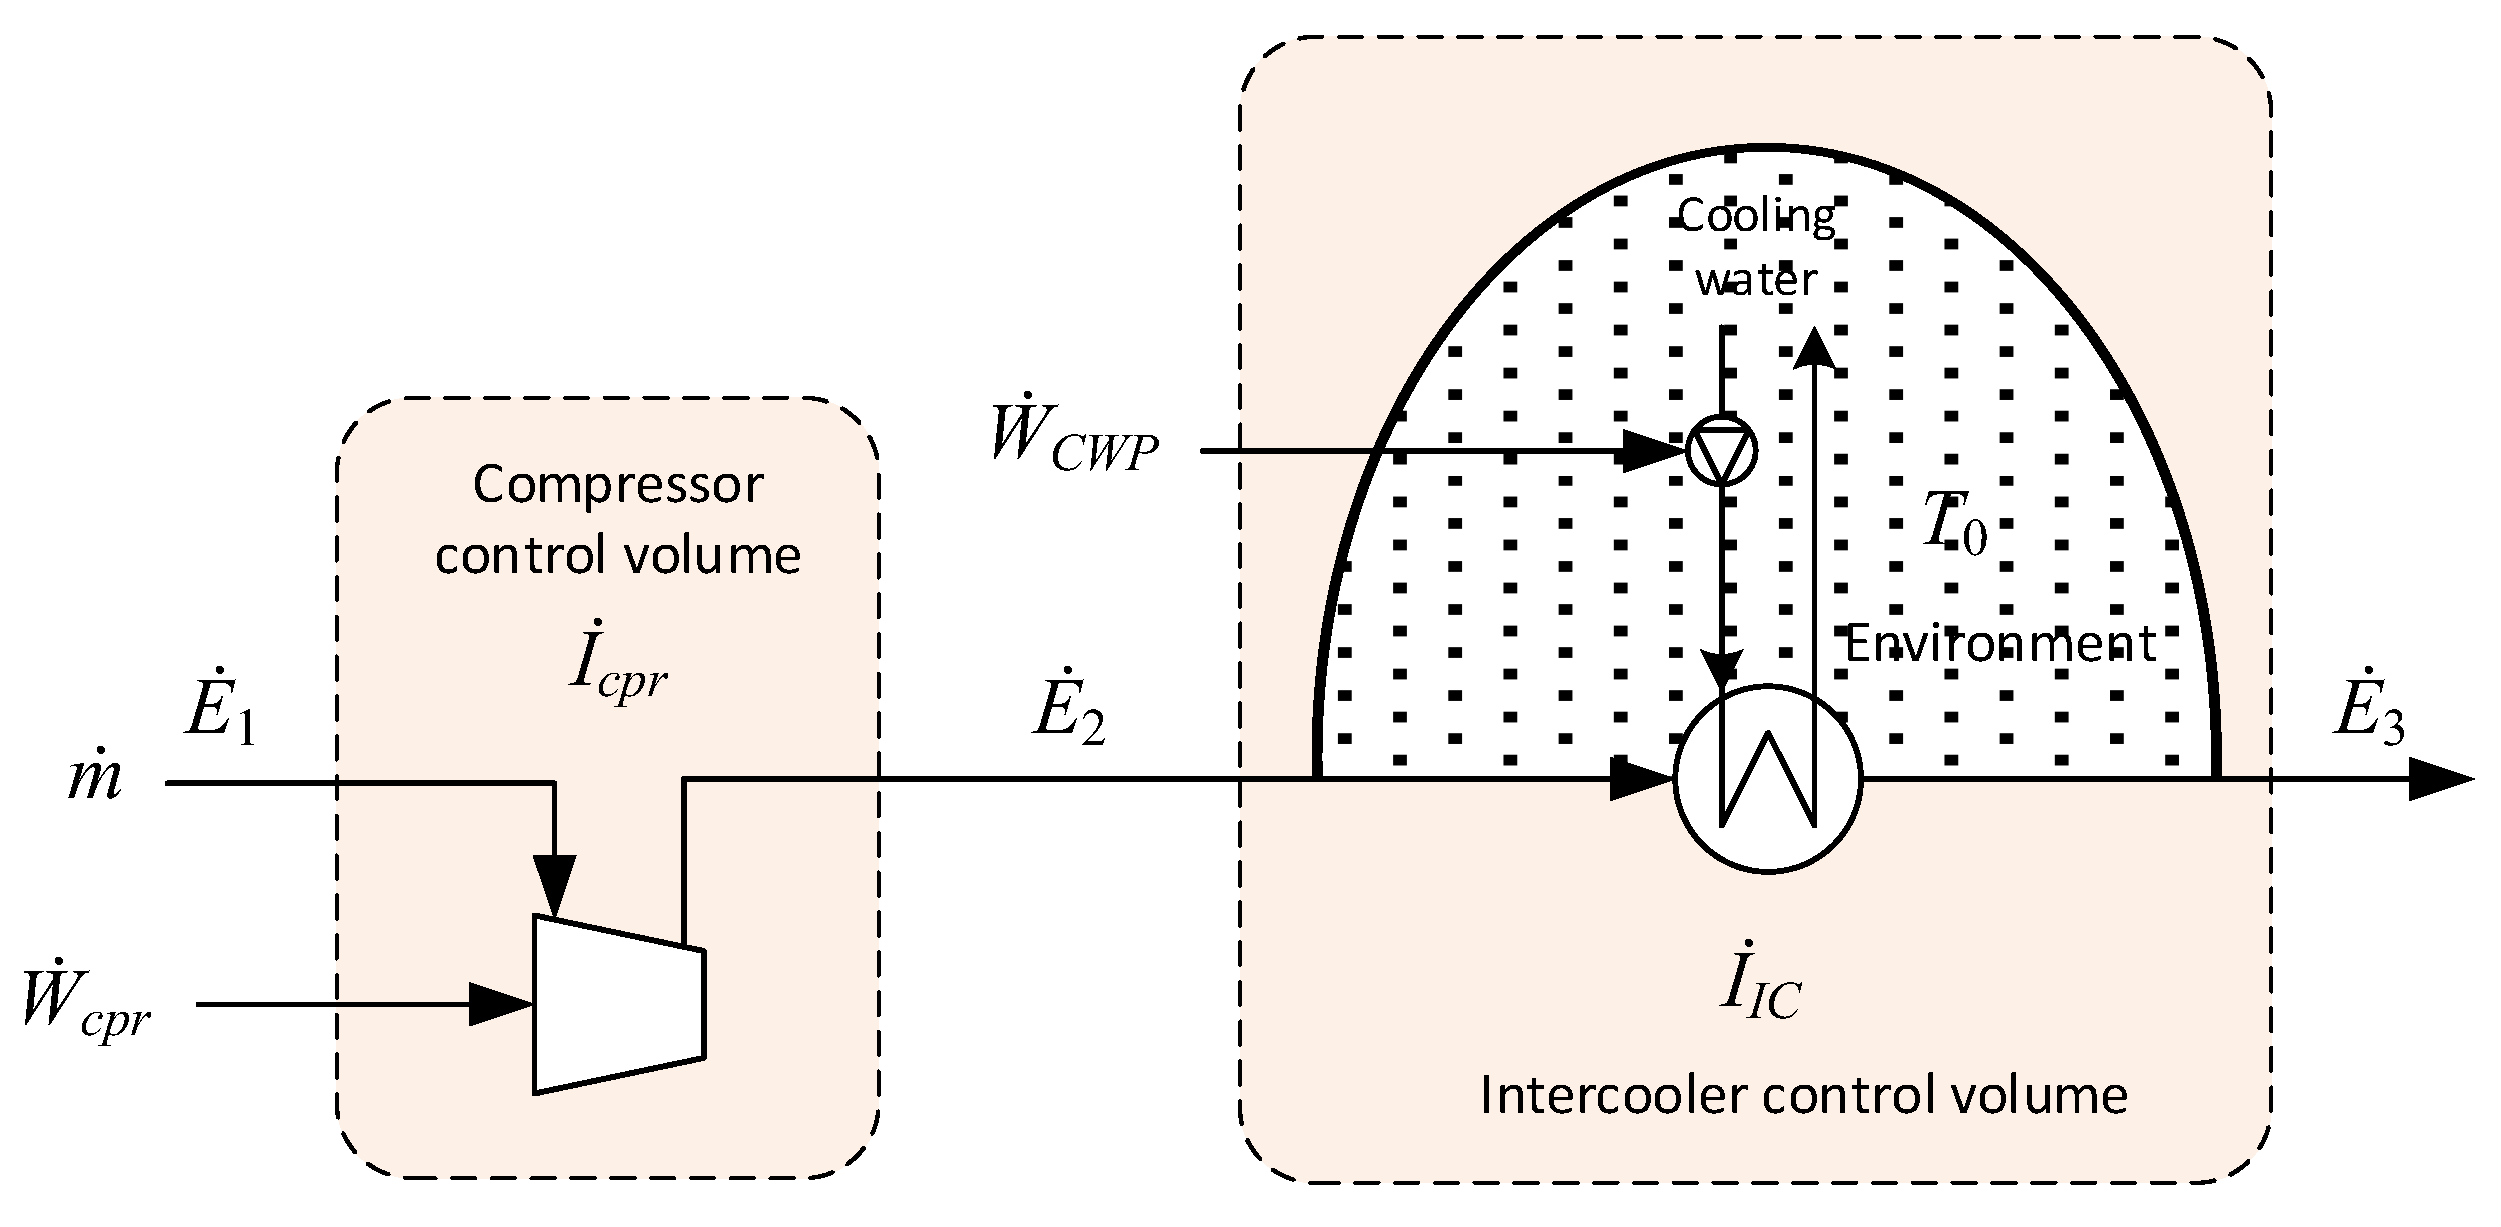
Figure 4.
Control volume for the expander and brake compressor.
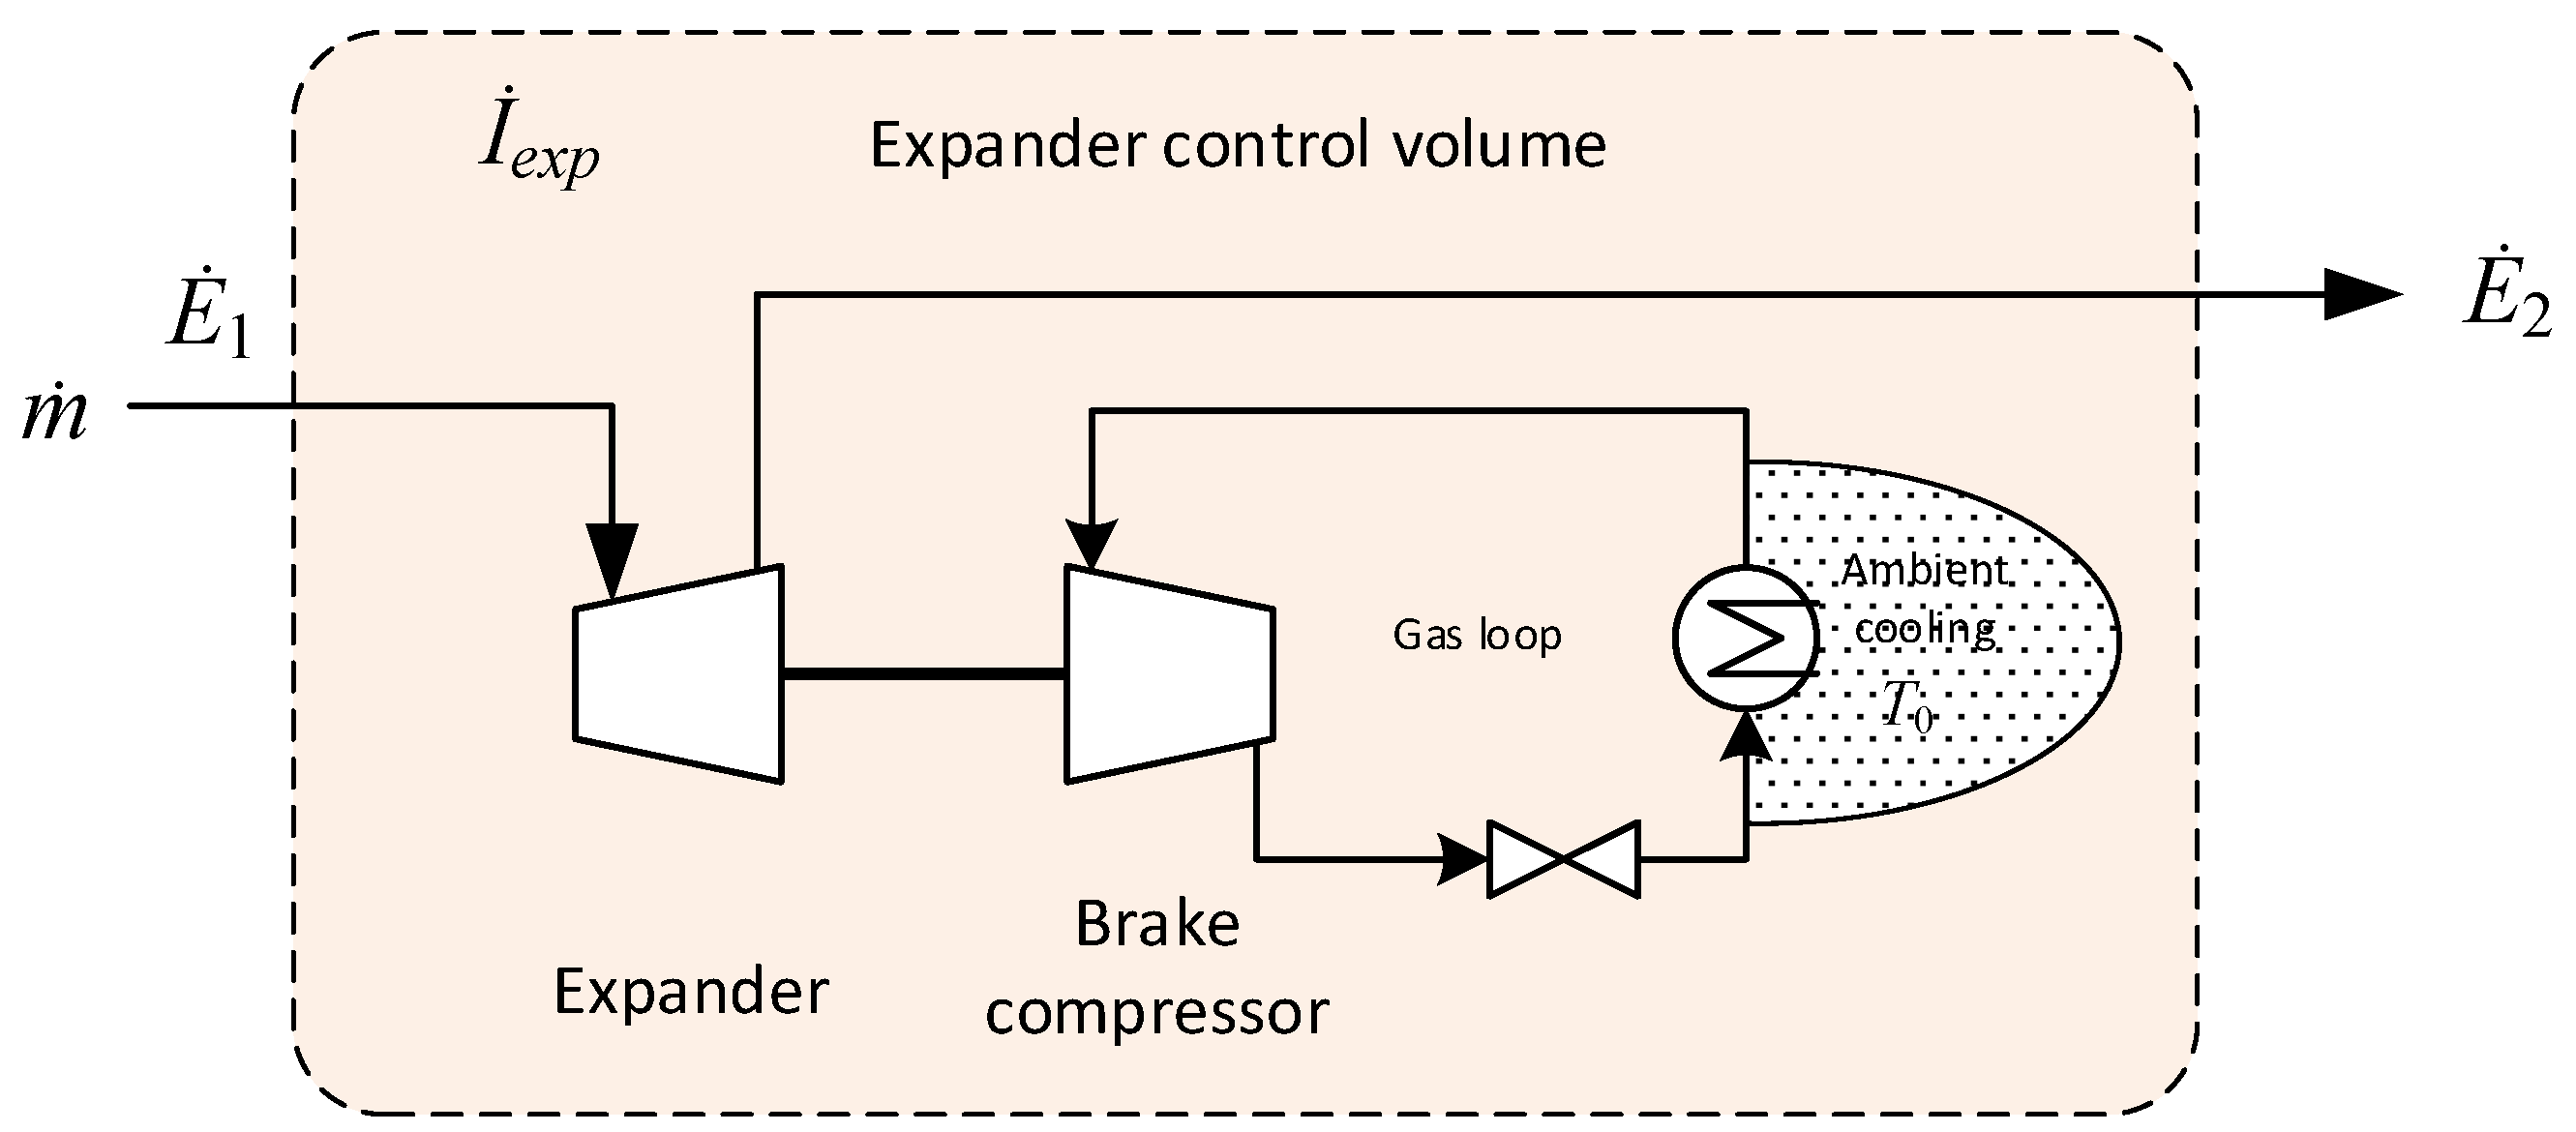
Figure 5.
Control volume for the regenerative solid desiccant drying unit.
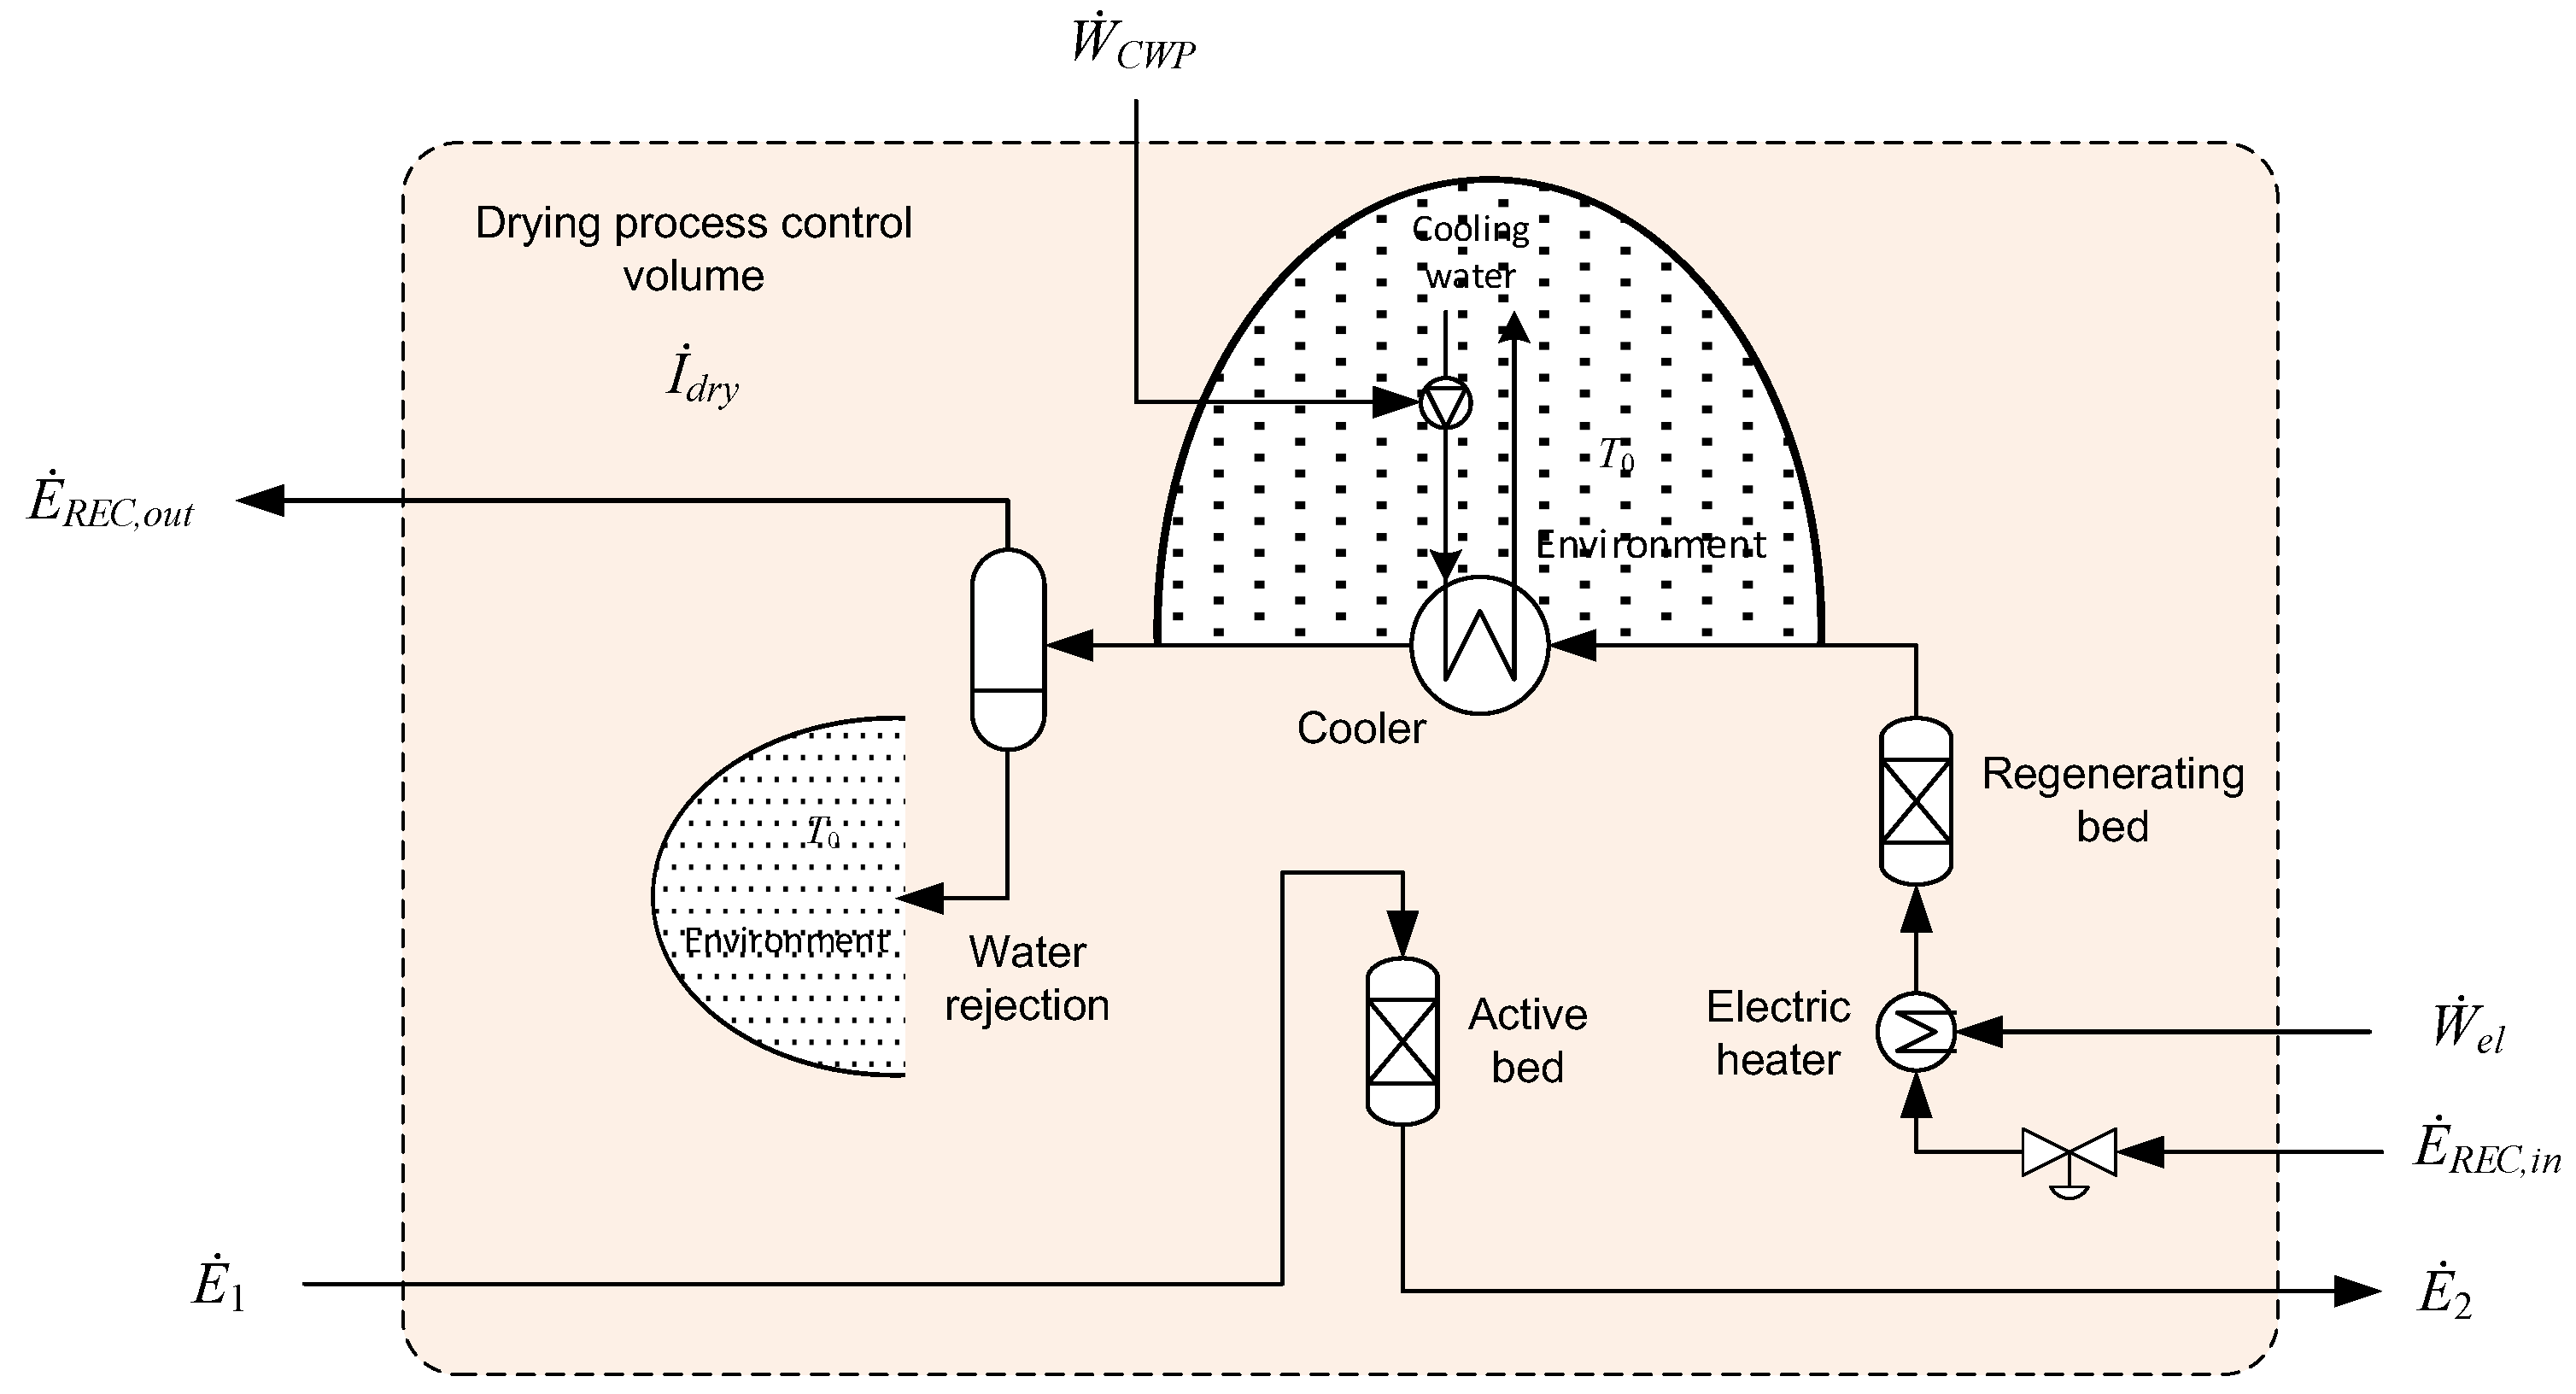
Figure 6.
Process flow diagram for the hydrogen production process based on an autothermal reformer, two water-gas shift reactors, and a PSA unit for hydrogen separation and purification. The sub-process "CO2 separation through liquefaction" is explained in detail in Section 4.2. Coolers are represented in blue while heaters are shown in red. The reader is referred to the web version for the colour coding.
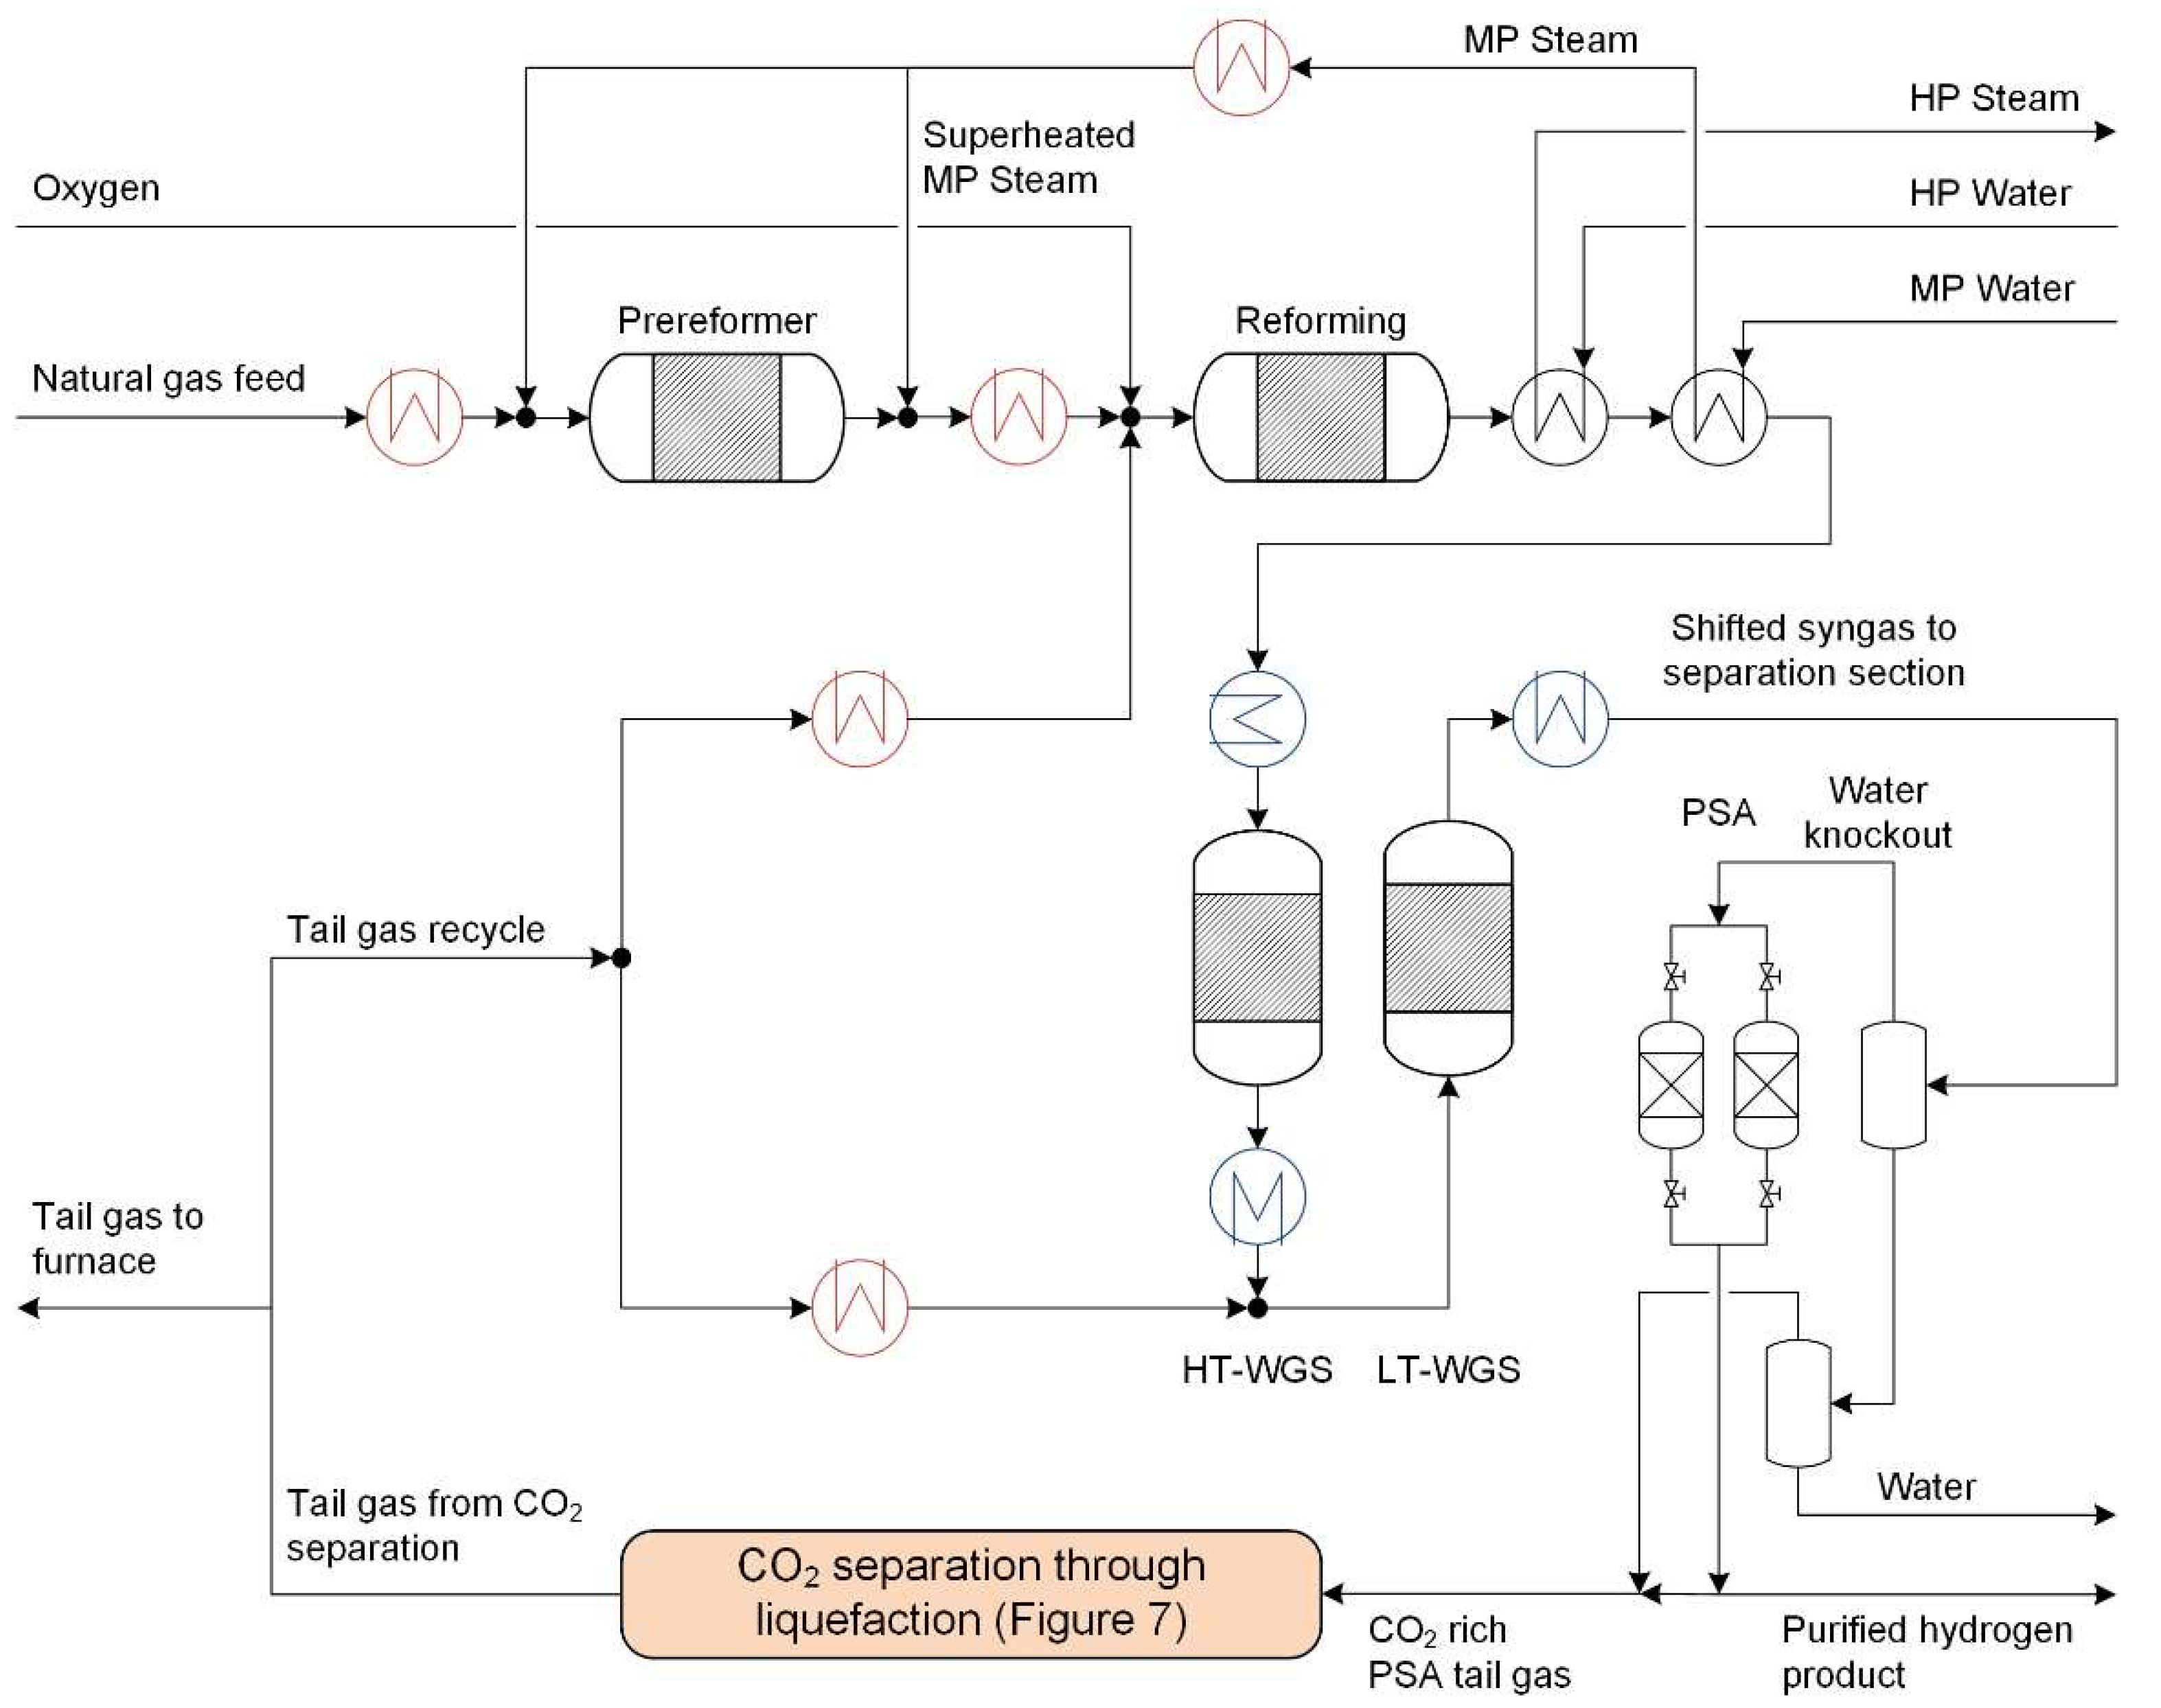
Figure 7.
Process flow diagram for the low-temperature tail gas separation and CO2 capture unit. Also included is the auxiliary refrigeration cycle with propane and ethane as refrigerants in a cascade cycle.
Figure 7.
Process flow diagram for the low-temperature tail gas separation and CO2 capture unit. Also included is the auxiliary refrigeration cycle with propane and ethane as refrigerants in a cascade cycle.
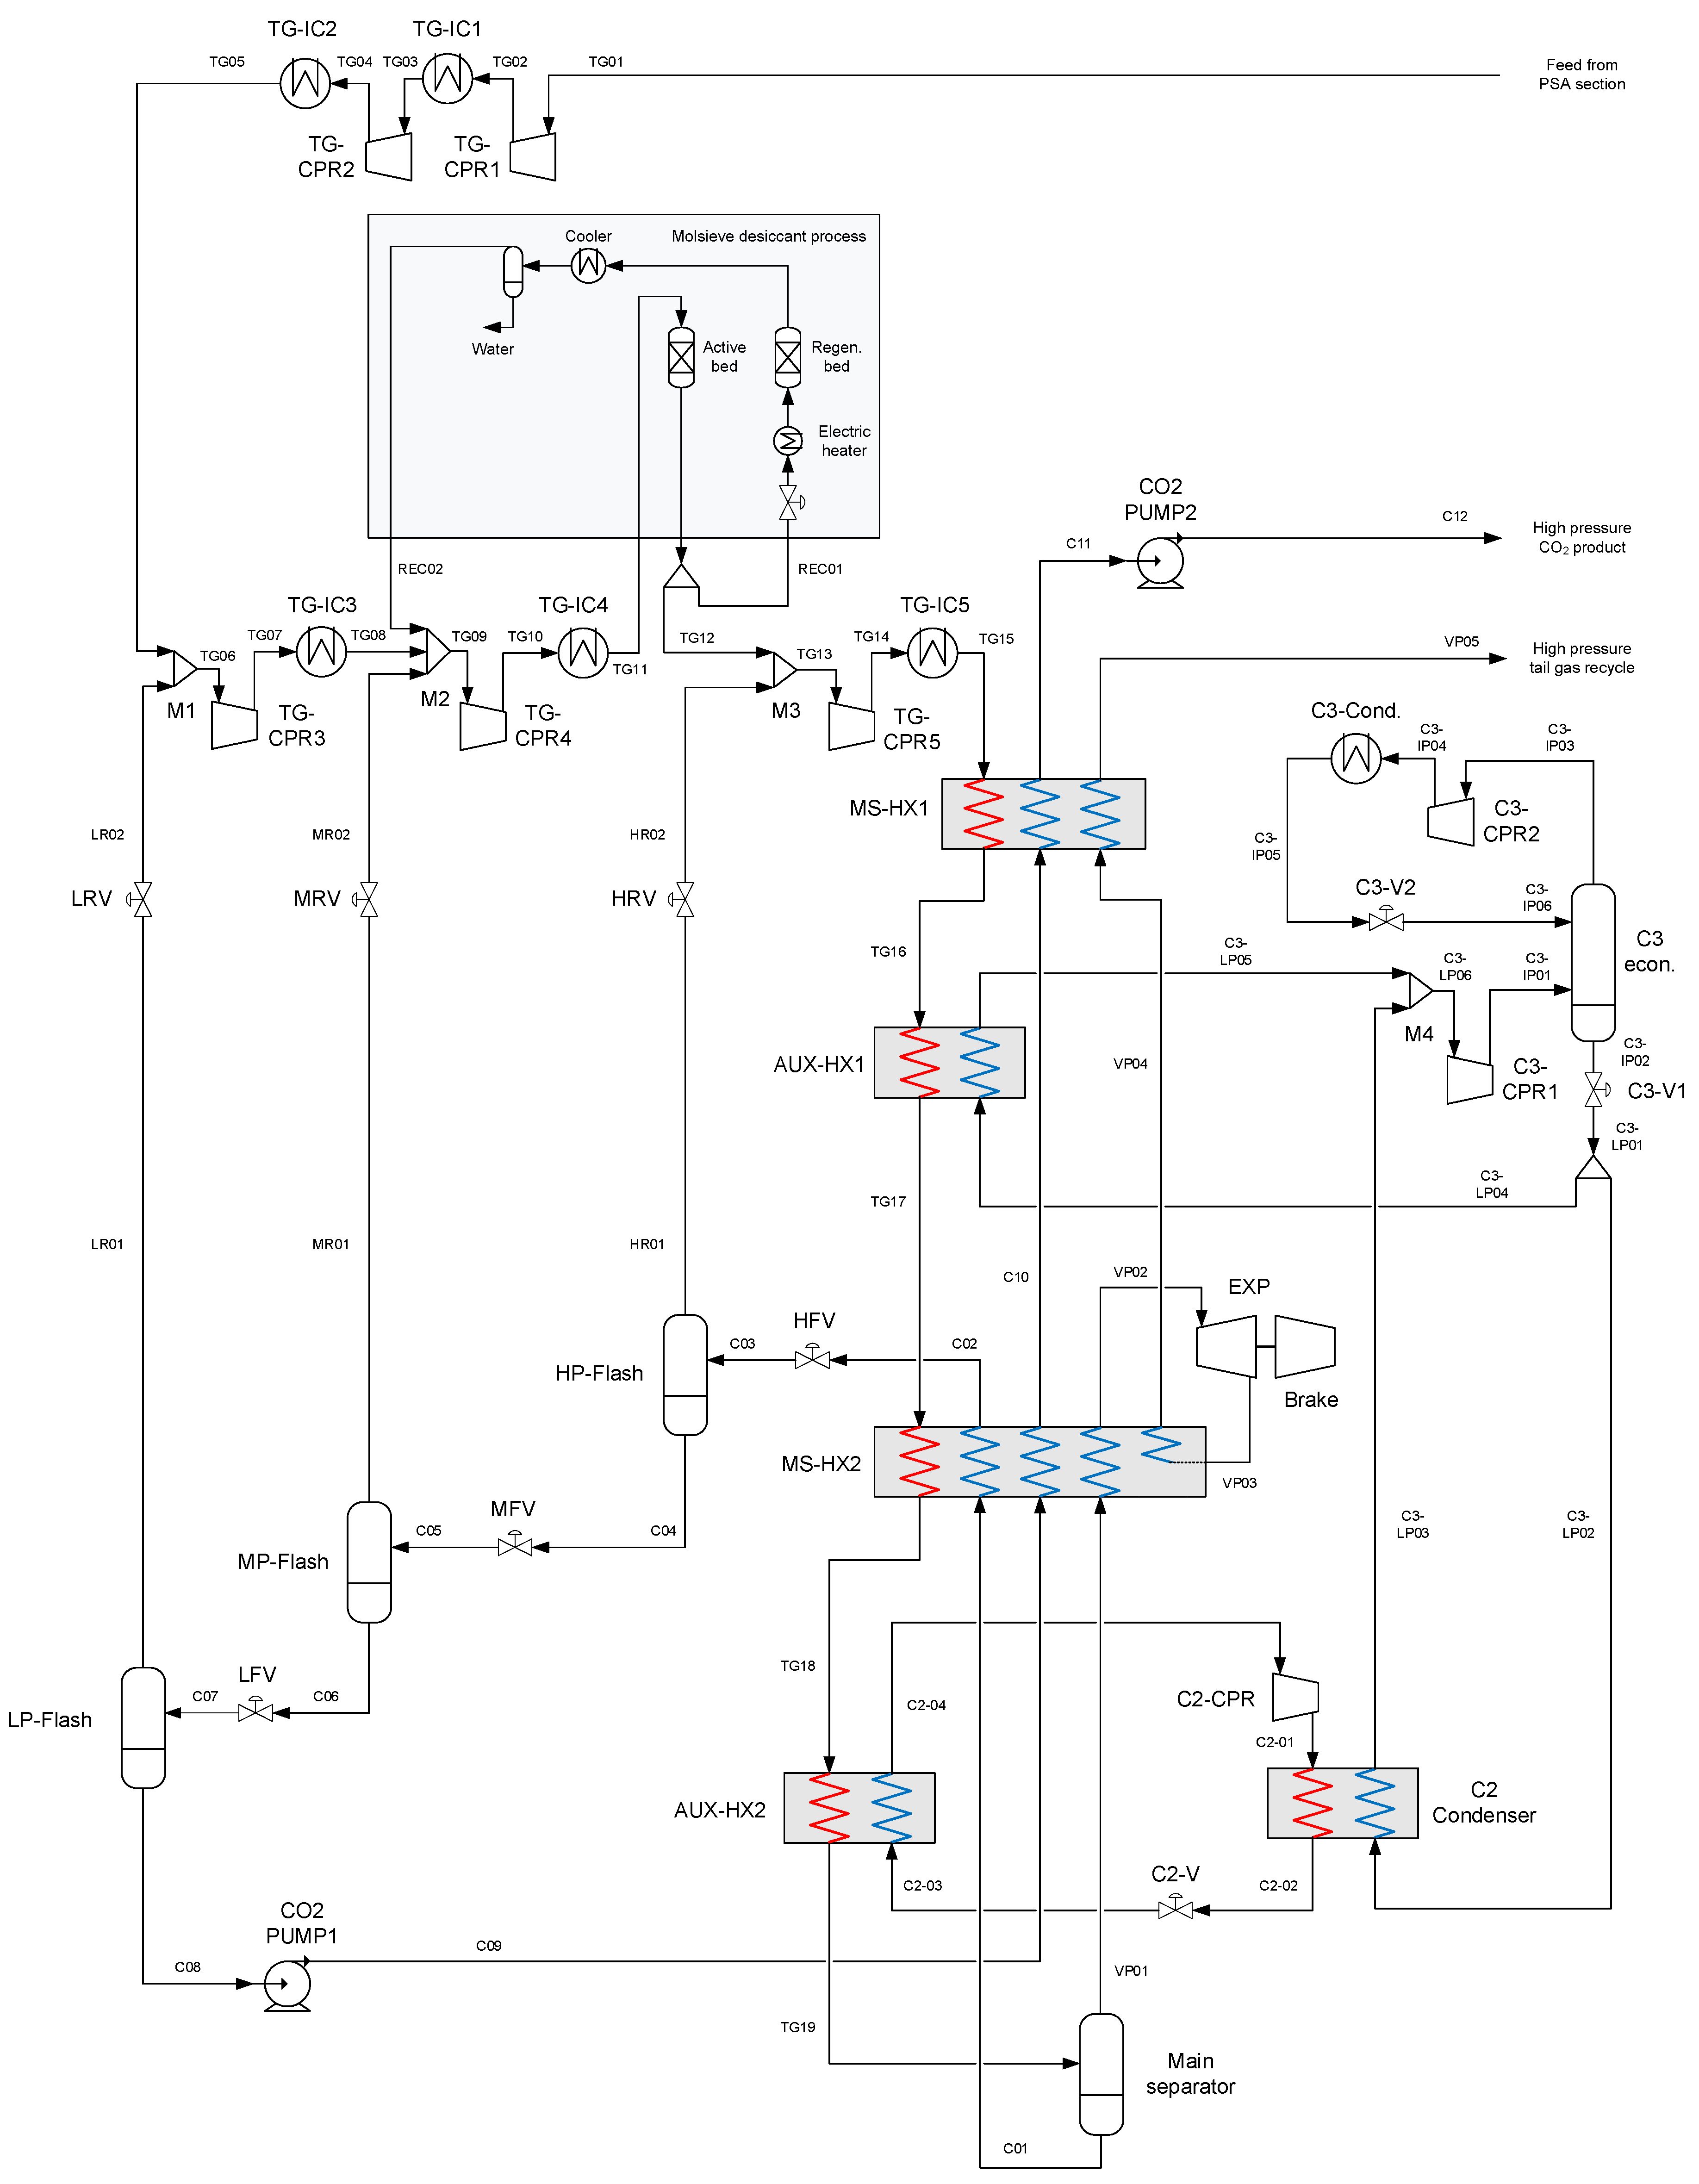
Figure 8.
Temperature composite curves and liquid mass fraction for the four heat exchangers used to cool and partially condense the tail gas stream.
Figure 8.
Temperature composite curves and liquid mass fraction for the four heat exchangers used to cool and partially condense the tail gas stream.
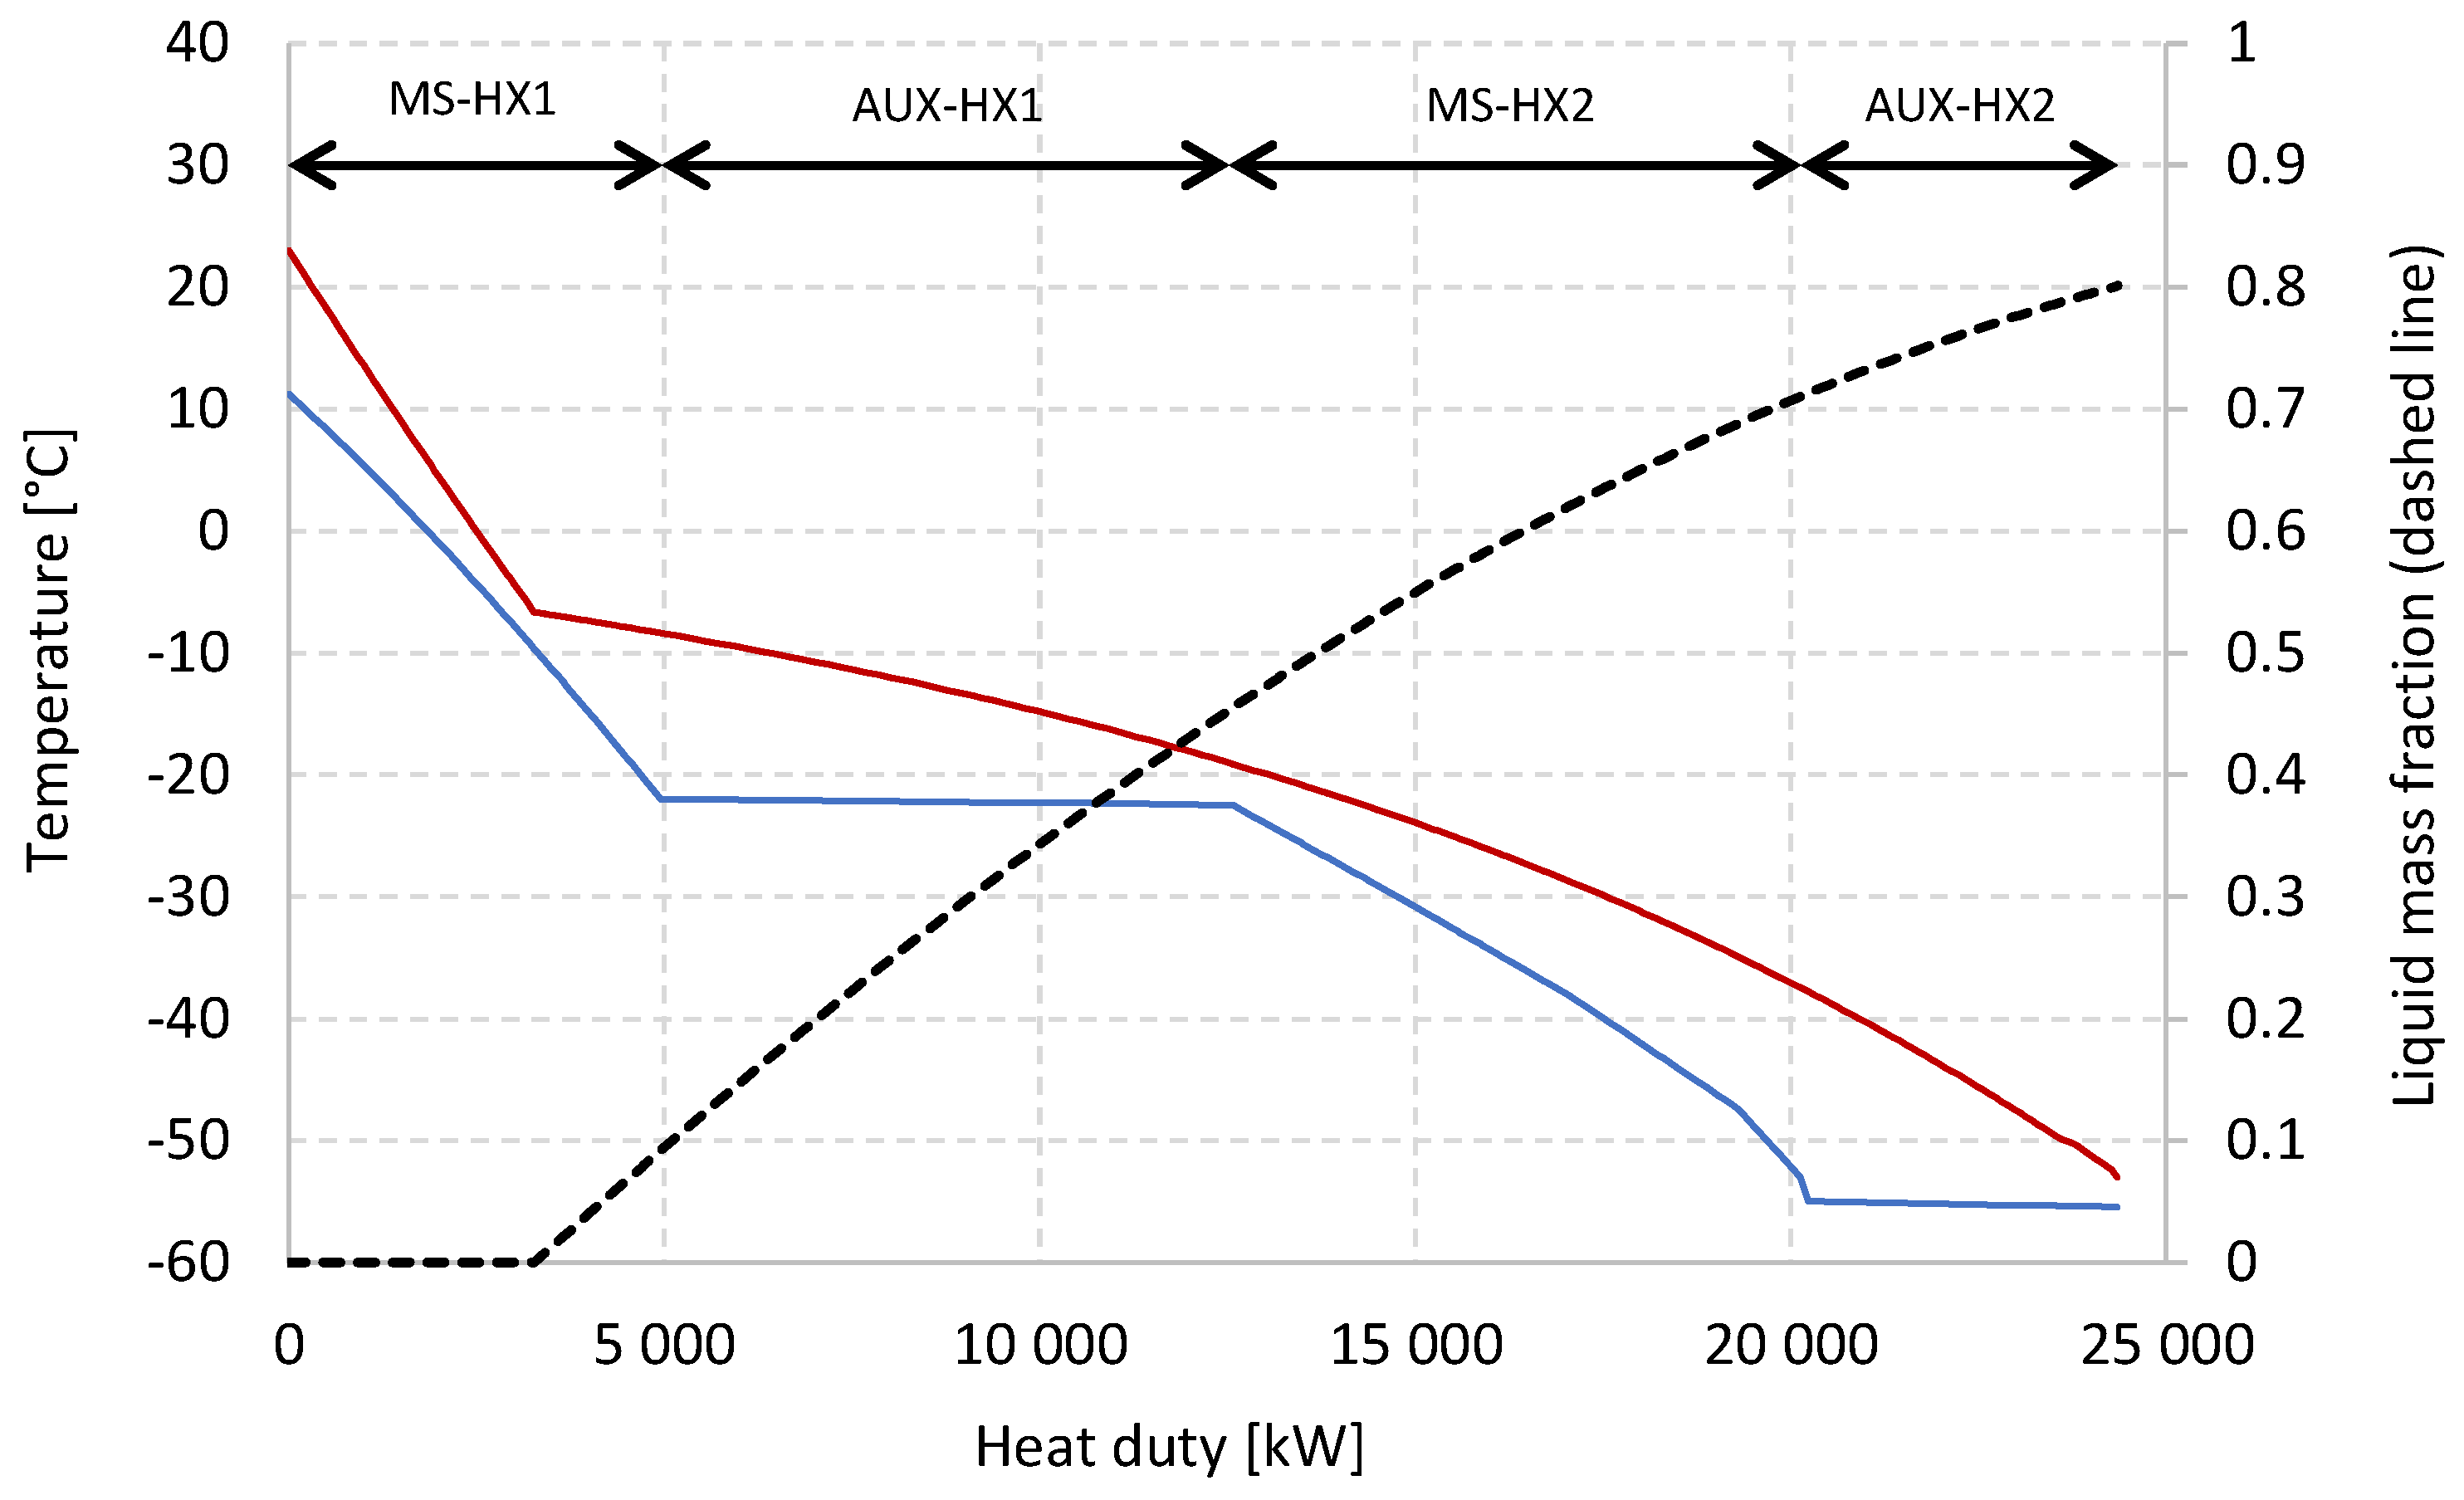
Figure 9.
Thermomechanical (tm) and chemical (ch) exergy flows of the feed stream TG01 and product streams C12 and VP05. The difference in exergy flow equals the minimum exergy requirement for the tail gas separation process.
Figure 9.
Thermomechanical (tm) and chemical (ch) exergy flows of the feed stream TG01 and product streams C12 and VP05. The difference in exergy flow equals the minimum exergy requirement for the tail gas separation process.
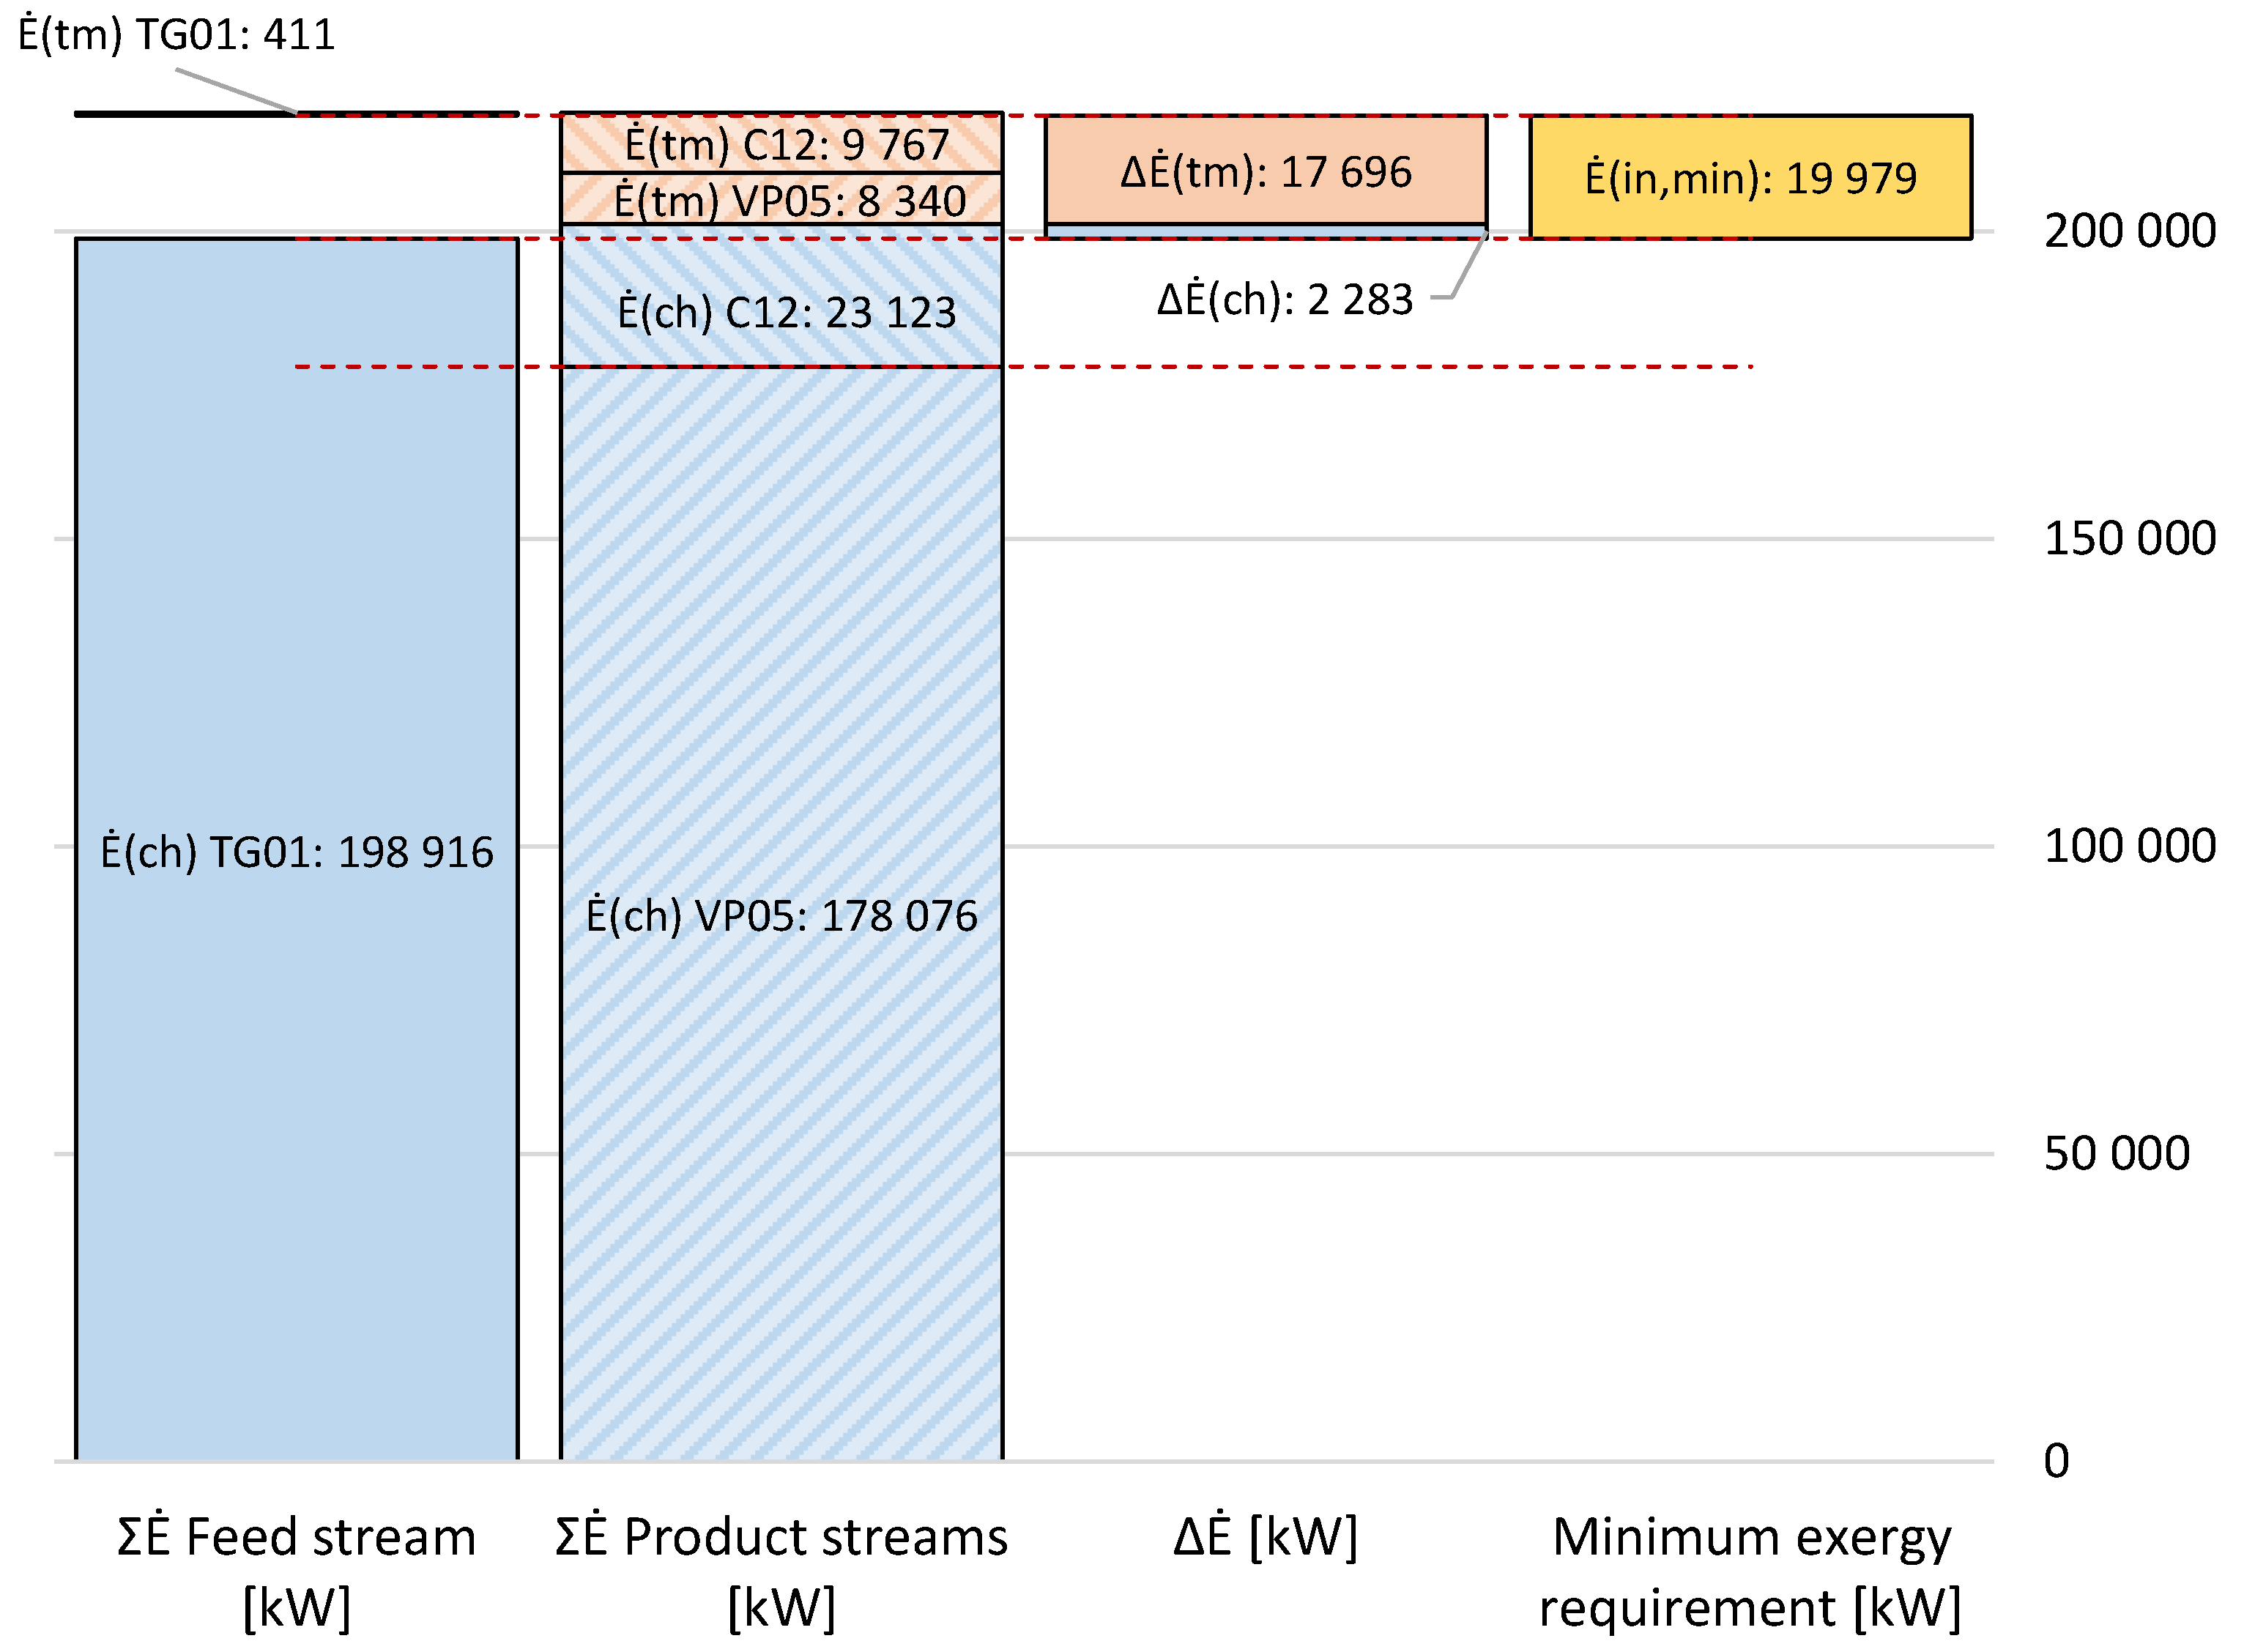
Figure 10.
Total irreversibility rate divided into process units (left hand side) and grouped into sub-processes (right hand side).
Figure 10.
Total irreversibility rate divided into process units (left hand side) and grouped into sub-processes (right hand side).
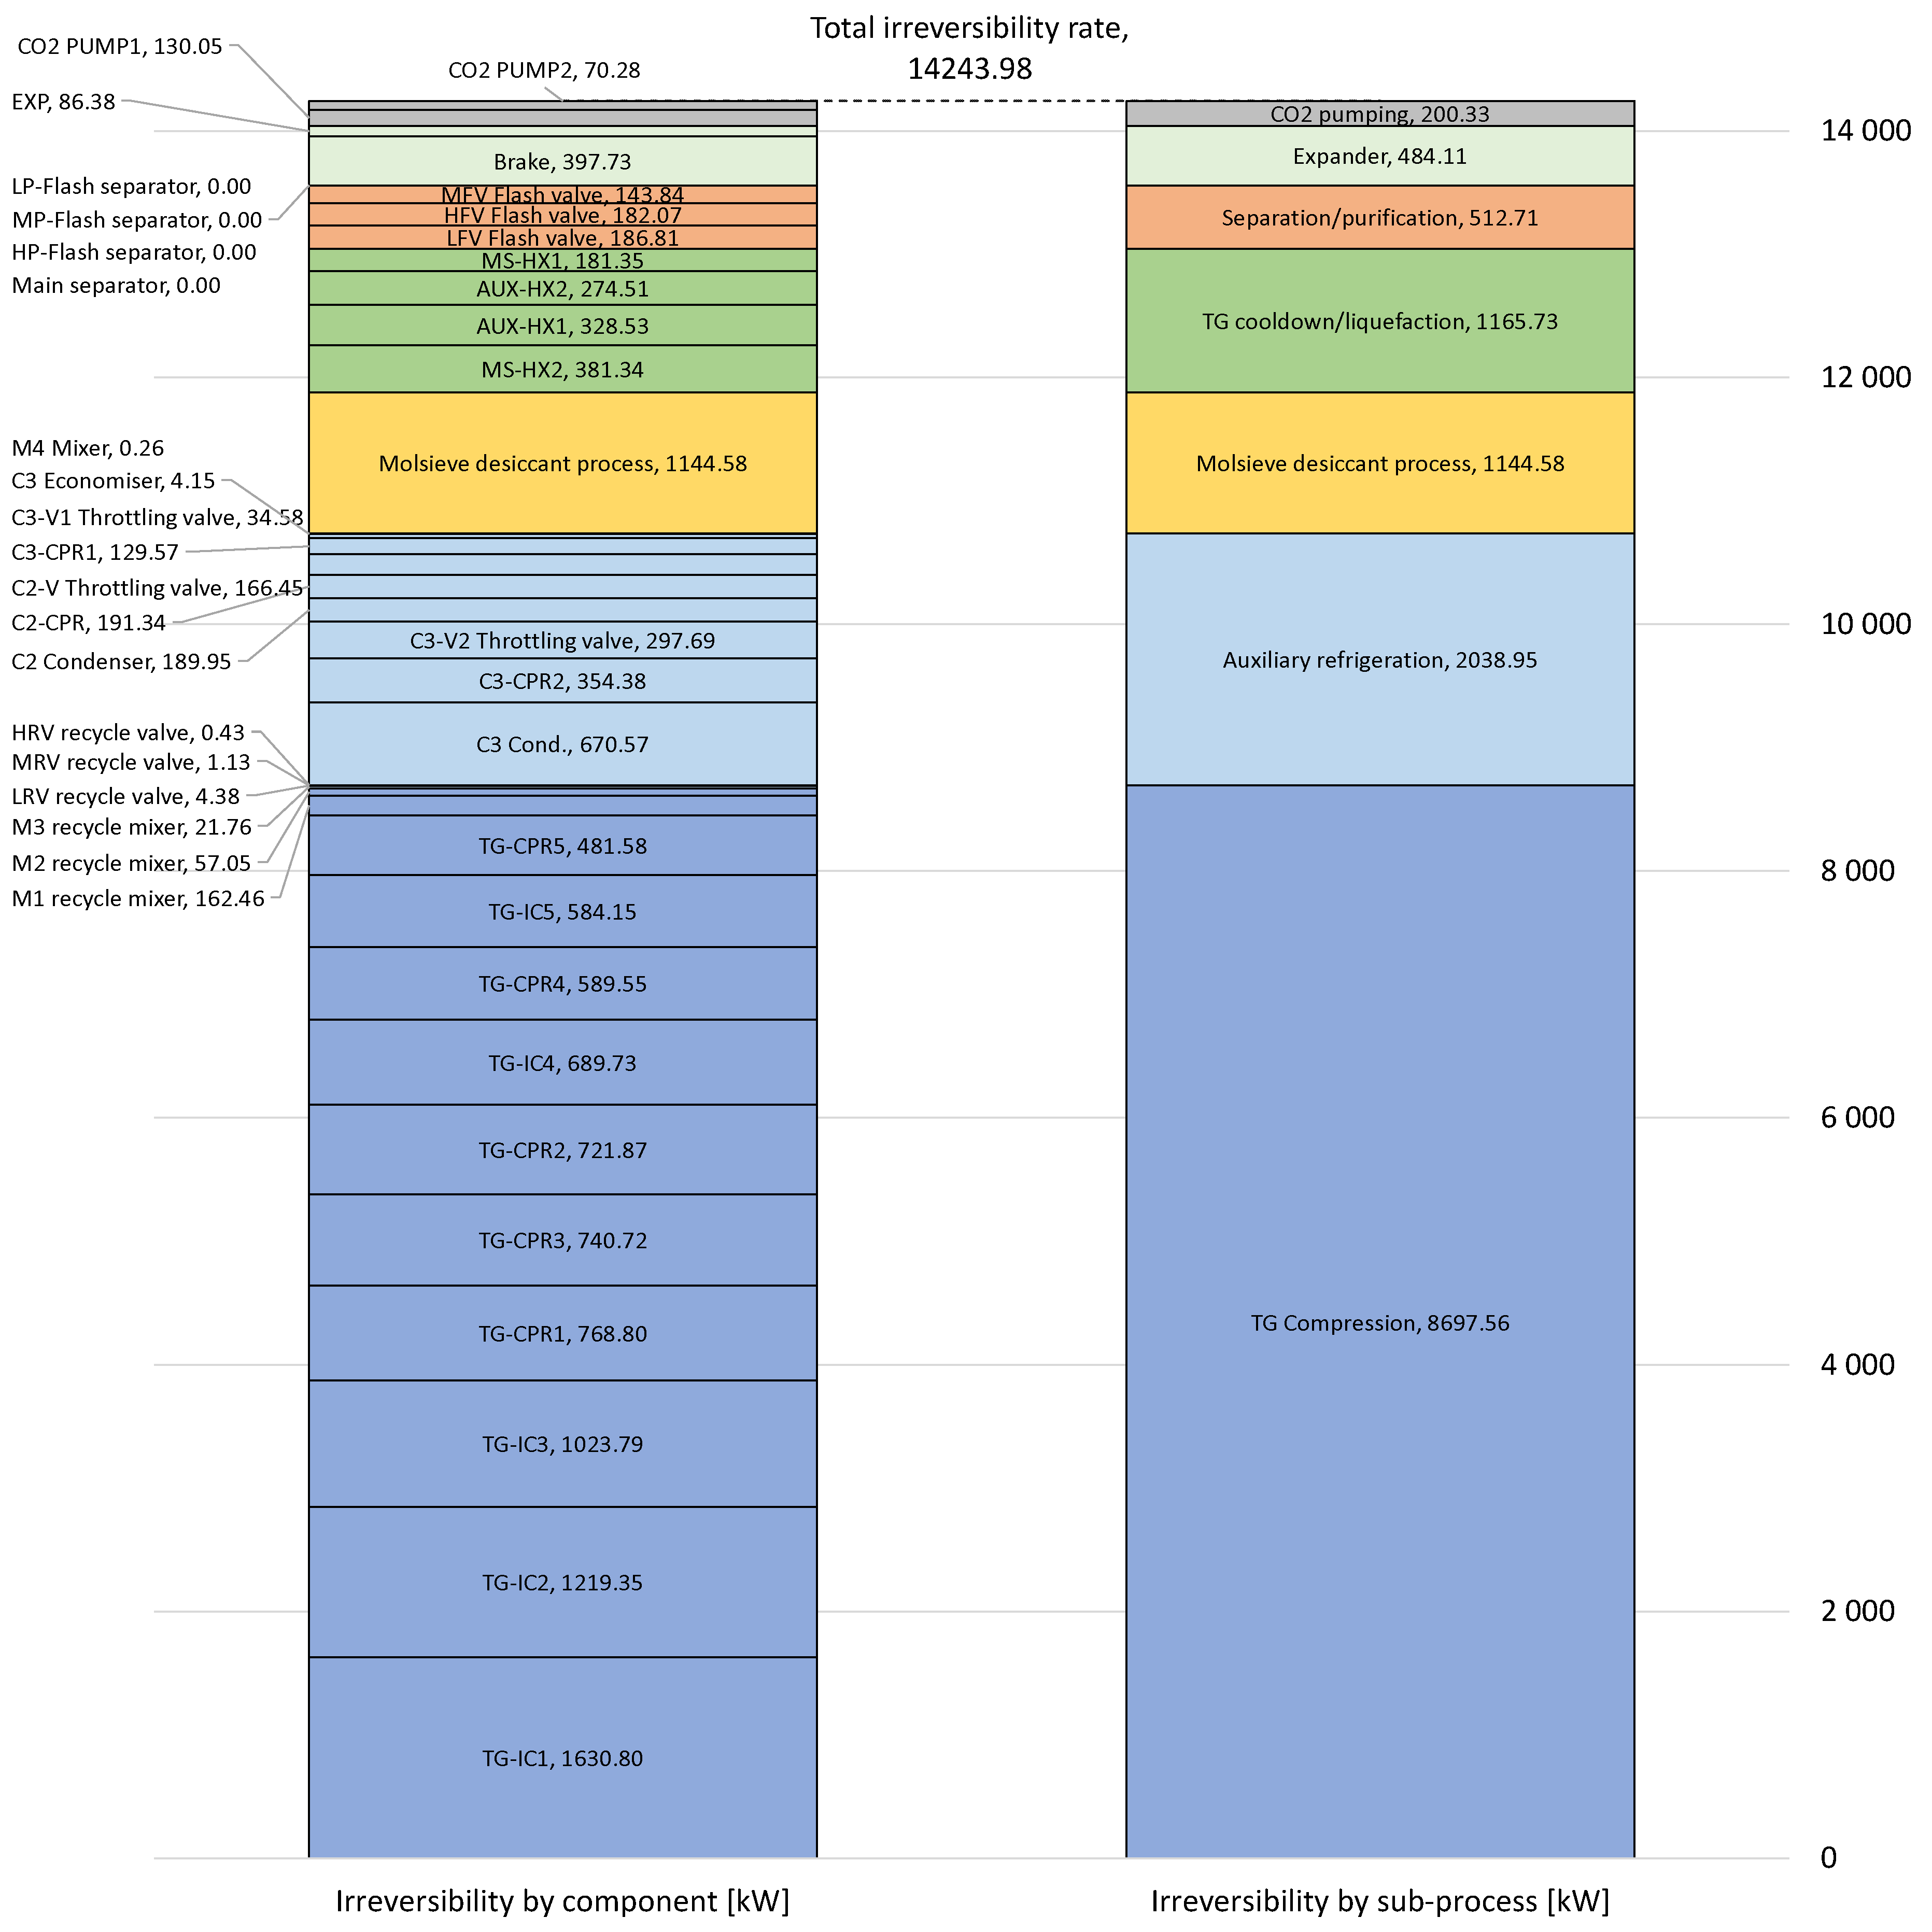
Figure 11.
Temperature composite curves (red and blue lines) and irreversibilities in heat exchanger (a) MSHX-1, (b) MSHX-2, (c) AUX-HX1 and (d) AUX-HX2. Irreversibilities are decomposed into exergy destruction caused by heat transfer (Irrev. Q) and pressure drop (Irrev. Δp).
Figure 11.
Temperature composite curves (red and blue lines) and irreversibilities in heat exchanger (a) MSHX-1, (b) MSHX-2, (c) AUX-HX1 and (d) AUX-HX2. Irreversibilities are decomposed into exergy destruction caused by heat transfer (Irrev. Q) and pressure drop (Irrev. Δp).
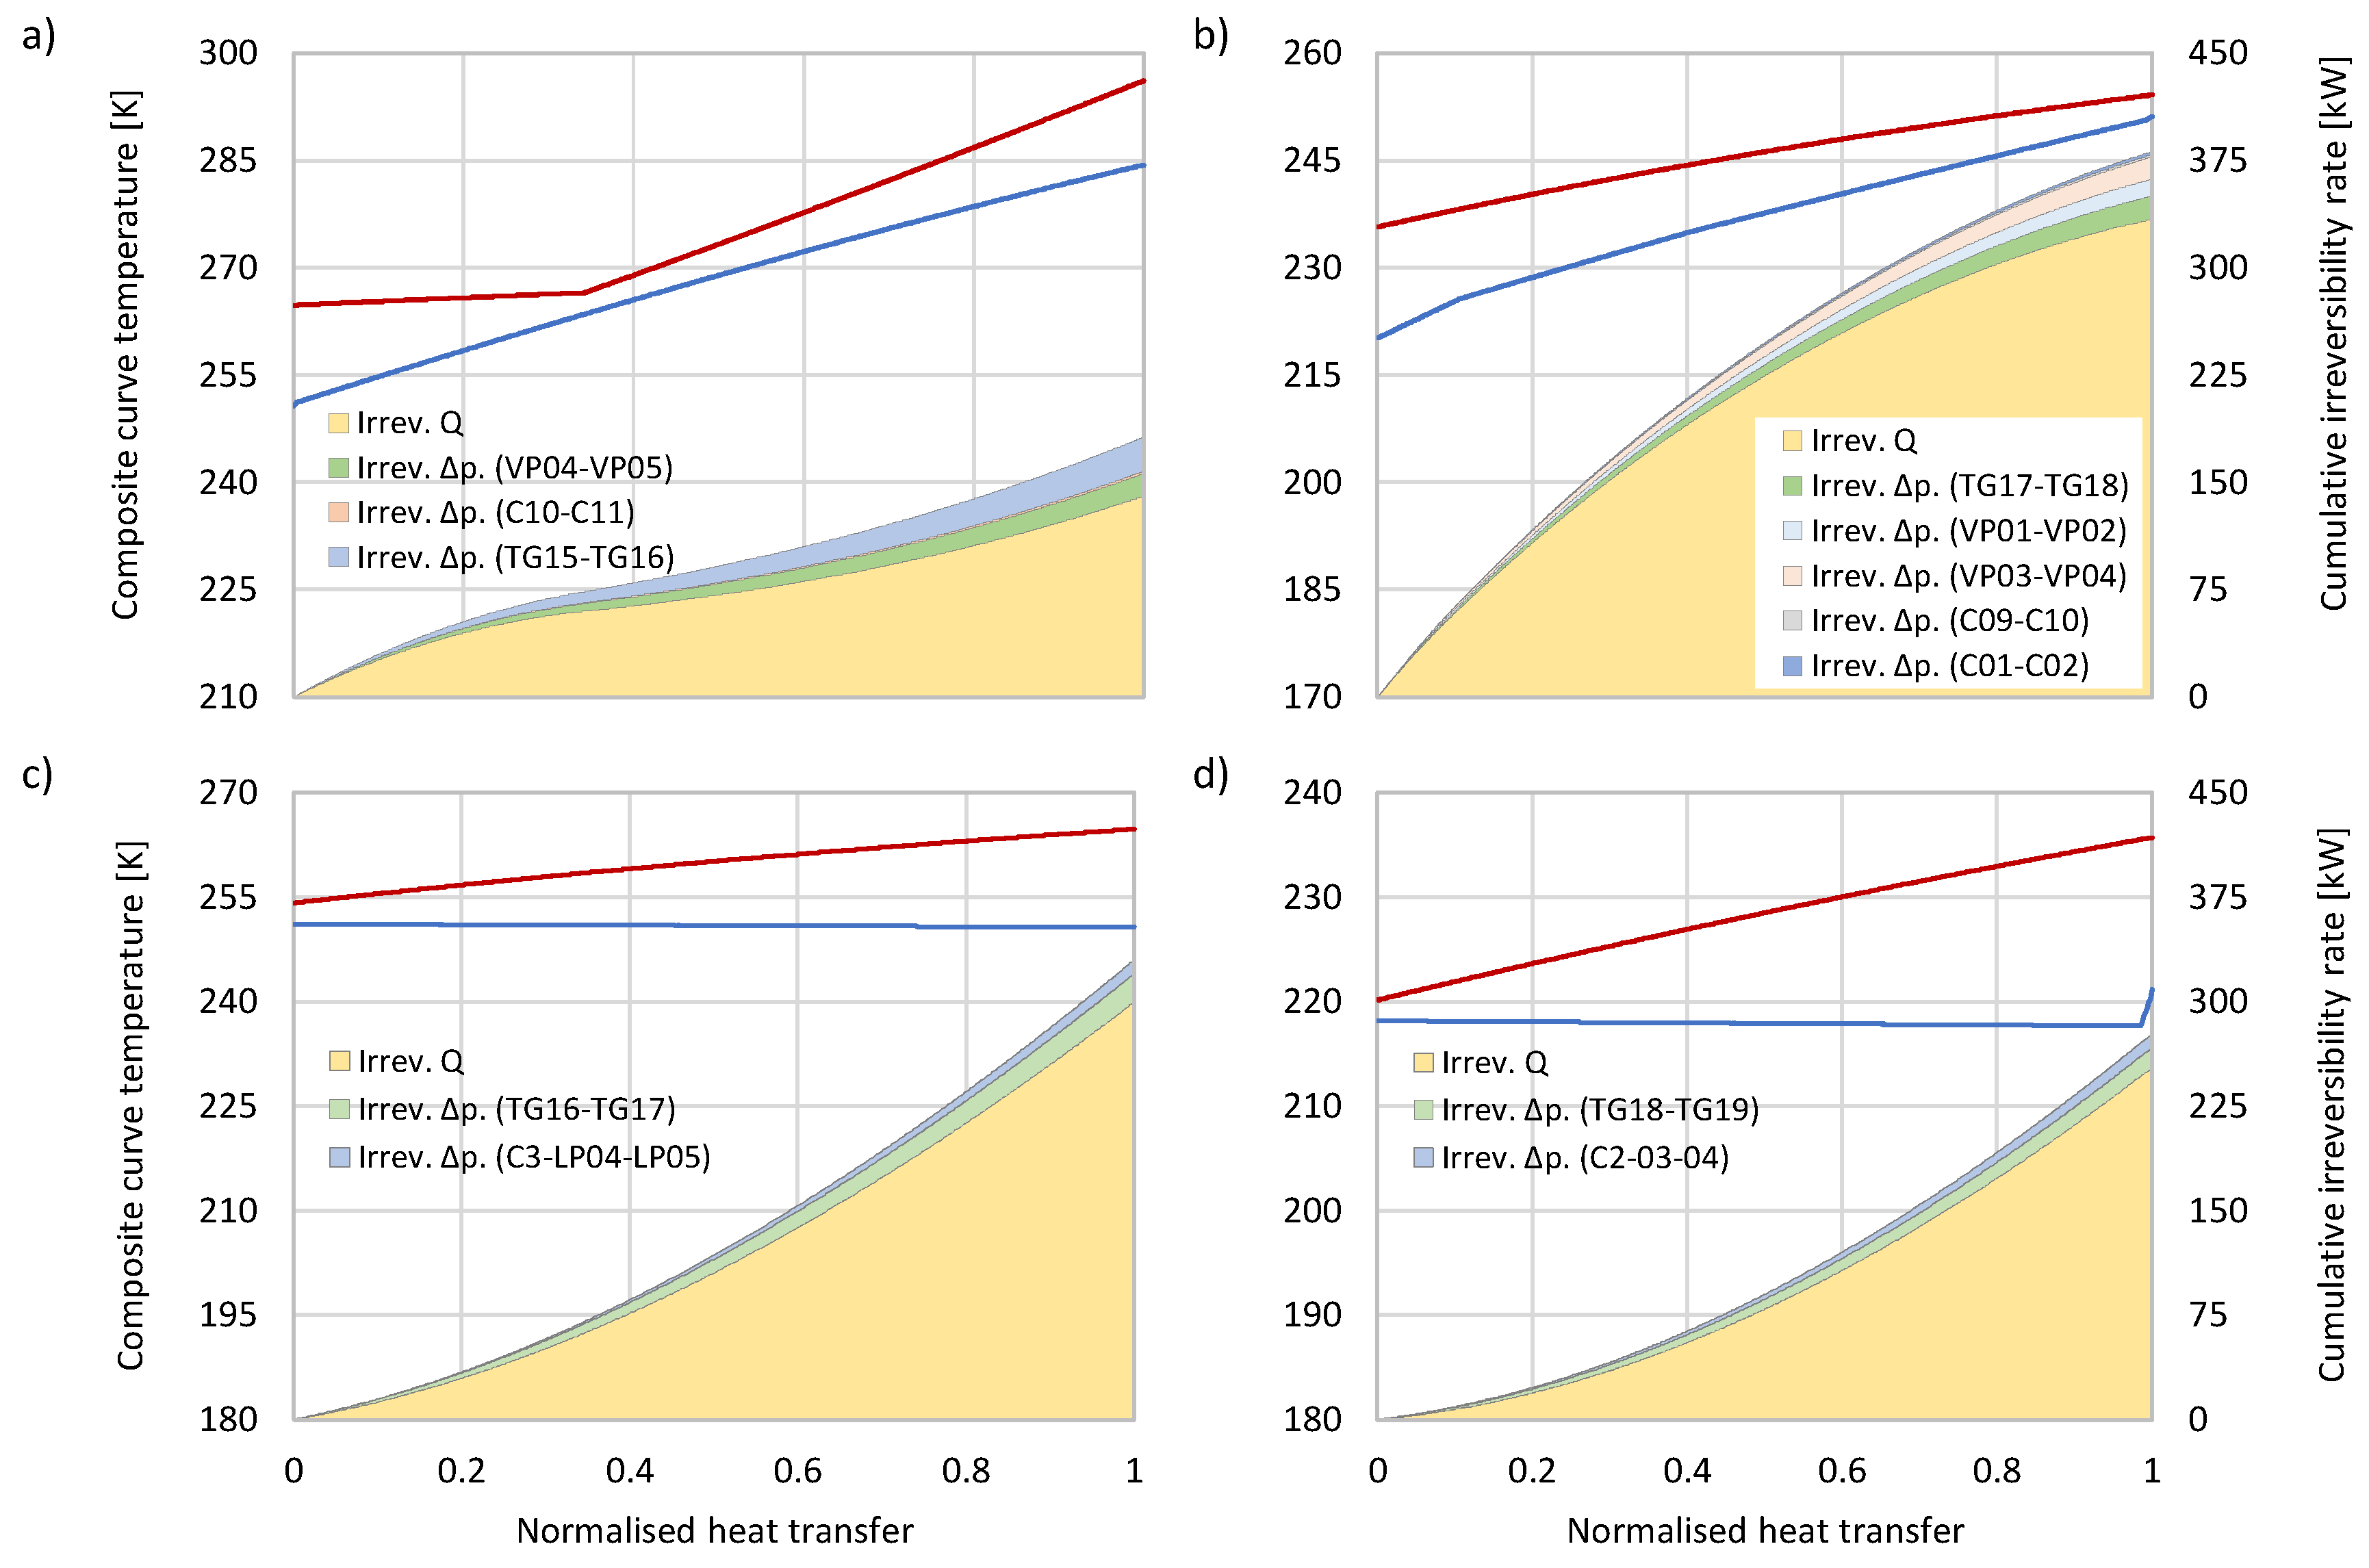
Table 1.
Summary of chosen parameters and the key performance indicators.
| Parameter/KPI | Unit | Value |
|---|---|---|
| Tail gas recycle | % | 93 |
| Fraction of tail gas recycled to ATR | % | 25 |
| TFeed,LT-WGS | °C | 200 |
| Carbon capture rate | % | 98.24 |
| Higher heating value efficiency | % | 84.44 |
| Lower heating value efficiency | % | 78.34 |
Table 2.
Summary of power requirement.
| Power [kW] |
Specific power [MJ/tonCO2 capt.] |
Percentage of total | |
|---|---|---|---|
| Tail gas compression | 28 059.7 | 579.6 | 82.0% |
| Auxiliary refrigeration | 4 418.4 | 91.3 | 12.9% |
| Molsieve regeneration | 767.9 | 15.9 | 2.2% |
| Liquid CO2 pumping | 650.6 | 13.4 | 1.9% |
| Cooling water pumping | 326.7 | 6.7 | 1.0% |
| Total power requirement | 34 223.3 | 706.9 | 100% |
Table 3.
Comparison of irreversibility results from top-down and bottom-up methods.
| Top-down calculation, Equation (6) | Bottom-up calculation, Equation (7) | Relative difference |
|
| Irreversibility [kW] | 14 243.970 | 14 243.975 |
Table 4.
Summary of sensitivity analysis.
| Sensitivity variable | Variable change | Irreversibilities [kW] | Power requirement [kW] | Exergy efficiency |
Consistency of exergy balance convergence 1 |
| Compressor efficiencies [%] | –5 % points | 16 320 | 36 299 | 55.04% | 9·10-10 |
| HX pressure losses | +100% | 15 766 | 35 713 | 55.85% | 2·10-7 |
| HX minimum ΔT [°C] | +2 °C | 14 830 | 34 809 | 57.40% | 1·10-6 |
| Ambient coolers outlet T [°C] | +7 °C | 14 664 | 34 651 | 57.68% | 6·10-7 |
| Dehydration, recycle ratio | +4 % points | 14 460 | 34 439 | 58.01% | 2·10-7 |
| Separator heat leakage [W] | +1000 W 2 | 14 247 | 34 226 | 58.37% | 2·10-7 |
| Baseline results | — | 14 244 | 34 223 | 58.38% | 4·10-7 |
1 Relative deviation in total irreversibility calculated by Equations (6) and (7). 2 Into each separator.
Disclaimer/Publisher’s Note: The statements, opinions and data contained in all publications are solely those of the individual author(s) and contributor(s) and not of MDPI and/or the editor(s). MDPI and/or the editor(s) disclaim responsibility for any injury to people or property resulting from any ideas, methods, instructions or products referred to in the content. |
© 2024 by the authors. Licensee MDPI, Basel, Switzerland. This article is an open access article distributed under the terms and conditions of the Creative Commons Attribution (CC BY) license (http://creativecommons.org/licenses/by/4.0/).
Copyright: This open access article is published under a Creative Commons CC BY 4.0 license, which permit the free download, distribution, and reuse, provided that the author and preprint are cited in any reuse.


