
Submitted:
18 January 2024
Posted:
19 January 2024
You are already at the latest version
Preprints on COVID-19 and SARS-CoV-2
Abstract
SARS-CoV-2 infection remains a global burden. Despite intensive research, the mechanism and dynamics of early viral replication are not completely understood including the kinetics of formation of genomic RNA (gRNA), sub-genomic RNA (sgRNA) and replication centers/organelles (ROs). We employed single-molecule RNA-fluorescence in situ hybridization (smRNA-FISH) to simultaneously detect viral gRNA and sgRNA, immunofluorescence to detect nsp3 protein, a marker for the formation RO, and carried out a time course analysis. We found that single molecules of gRNA are visible within the cytoplasm at 30 minutes post-infection (p.i.). Starting from 2 hr. p.i., most of the viral RNA existed in clusters/speckles, some of which were surrounded by single molecules of sgRNA. These speckles associated with nsp3 protein starting at 3 hr. p.i., indicating that these were precursors to ROs. Furthermore, RNA replication was asynchronous as cells with RNA at all stages of replication were found at any given time point. Our probes detected the SARS-COV-2 variants of concern, and BA.1 strain exhibited slower rate of replication kinetics than the WA1 strain. Our results provide insights into the kinetics of SARS-CoV-2 early post-entry events, which will facilitate identification of new therapeutic targets to early stage replication to combat COVID-19.
Keywords:
SARS-CoV-2
; COVID-19
; gRNA and sgRNA replication
; Replication Organelles (RO)
; nsp3
; Variants of Concern (VOC)
1. Introduction
Coronavirus disease 2019 (COVID-19) is a viral respiratory disease that emerged at the end of 2019 in Wuhan, China, and rapidly extended its devastating effects worldwide. COVID-19 is caused by SARS-CoV-2, a large enveloped, positive-strand RNA virus with a genome approximately 30 kb in length, belonging to the genus Betacoronavirus of the family Coronaviridae [1]. As of 27th September 2023, SARS-CoV-2 continues to spread worldwide, with over 770,875,433 total confirmed cases and 6,959,316 deaths worldwide [2].
SARS-CoV-2 primarily targets the respiratory tract, and the infection begins when the viral spike protein on the surface of the virus binds to the human receptor angiotensin-converting enzyme (ACE2). Cleavage of spike protein by the transmembrane protease serine 2 (TMPRSS2) on the surface of epithelial cells triggers the fusion of the viral and host cell membranes, facilitating the entry of the virus into the host cell [3,4]. In addition to causing acute respiratory distress syndrome, SARS-CoV-2 has other pulmonary and extrapulmonary manifestations in the gastrointestinal tract, hepatobiliary system, cardiovascular, neurological, and renal systems, which often lead to multiorgan failure and shock in severe cases [5,6]. Furthermore, some survivors experience Long COVID or Post-Acute Sequelae of SARS-CoV-2 (PASC), with cardiovascular, neurological, and pulmonary manifestations [7,8,9,10]. The exact pathogenesis of acute and chronic disease in extrapulmonary organs in COVID-19 is unknown. It has been suggested that indirect mechanisms such as co-morbidities and/or other pathophysiological conditions may play a role [11,12]. Understanding the details of the mechanism of replication and cell tropism of SARS-CoV-2 may provide insights into the pathogenesis and tissue tropism of this virus.
SARS-CoV-2 belongs to coronaviridae, which include enveloped, positive sense, single-stranded RNA viruses. These viruses employ an elaborate mechanism for replicating their genome and for transcribing the coding sequences. The replication cycle of SARS-CoV-2, like other coronaviruses, begins with the entry of the virus into the cell and release of viral RNA into the cytoplasm [13]. Within the cytoplasm, the first step is the translation of two large open reading frames (ORFs; ORF1a and ORF1b) present at the 5′ end of the positive-strand gRNA for the expression of polyproteins and proteolytic cleavage of these proteins to form 15-16 nonstructural proteins (nsp) of which 15 compose the viral replication and transcription complex (RTC) including RNA-processing and RNA-modifying enzymes [14]. RTC leads to the generation of negative-strand viral RNA replication intermediates from the positive-strand genomic RNA. Discontinuous transcription of the newly synthesized negative-strand RNAs from the 3′ end leads to the formation of a series of shorter sub-genomic RNAs (sgRNAs), which encode for the structural and accessory proteins [1]. During its replication, the virus modifies the intracellular host endoplasmic reticulum membrane to generate the replication organelles (ROs), which are the powerhouses consisting of double-membrane vesicles (DMVs) enclosing the viral RNAs [15,16]. DMVs are likely to provide a protective environment for the replication of gRNA and sgRNA. Newly synthesized gRNA and sgRNA are thought to translocate from the lumen of the DMVs into the cytoplasm through pores present on DMVs. While the exact composition of DMVs and the pores are not completely understood, it has been established the nsp3 and nsp4 proteins are required for the formation of DMVs and for the biogenesis of DMVs [17].
Many questions remain unanswered about the early replication events of SARS-CoV-2 such as: i) the time it takes for the viral RNA to complete translation and start the replication process after entry into the cytoplasm; ii) the generation, subcellular localization, and function of the ROs; iii) timing of formation of gRNA, sgRNAs and RO; and iv) the mechanism of vRNA synthesis within ROs [13]. Addressing these questions is not only important for obtaining insight about the mechanism of SARS-CoV-2 replication but also for the identification of unexplored drug targets that can be used to curb viral replication at a very early stage of the infection cycle.
Most of the studies aimed at understanding the SARS-CoV-2 replication have generally focused on time-points ~4-5 hours post-infection (p.i.), which is when viral replication is at its midpoint, making it easier for monitoring and visualization of the RNA and ROs [18,19]. However, understanding the replication at time points earlier than 4-5 hours p.i may be required to investigate the initial stages of vRNA replication and the formation of ROs. Studying early time points requires highly sensitive and specific methods to detect SARS-CoV-2 RNA at a single molecule level as large amounts of RNA are unlikely to be present at these stages. Several reports have utilized single-molecule RNA-FISH (smRNA-FISH) to detect an absolute number of SARS-CoV-2 transcripts [18,20]. However, these reports do not investigate the DMVs at early time points before 4-5 p.i.
To detect and visualize SARS-CoV-2 gRNA and sgRNAs with high specificity and sensitivity at early time points, we employed a combination of single molecule RNA-Fluorescence in situ hybridization (smRNA-FISH) using probes for gRNA and sgRNA and immunofluorescence using nsp3. To facilitate the study of replication kinetics of single SARS-CoV-2 RNA molecules after the virus enters a cell, we infected the cells with low m.o.i. of virus. Furthermore, we employed High-Speed High-Resolution Scanning fluorescence microscopy (HSHRS-FM) to scan and visualize the replication of SARS-CoV-2 in a large number of cells to determine the different stages of replication in these cells by using smRNA-FISH analysis. The HSHRS-FM method involves scanning the entire slide to create a single high-resolution digital image by tiling and stitching many high-magnification fields of view together, thus capturing the images of a large number of cells present on the slide. We designed probes to simultaneously detect positive strands of the gRNA and sgRNA and carried out a time course analysis to visualize the cells at time points starting from 0.5 hours to 24 hours p.i. Our analyses have led to the detection of the SARS-CoV-2 gRNA within the infected cells as early as 30 minutes p.i. Subsequent time points indicated that the replicating RNAs were present in distinct spots that contained both gRNA and sgRNAs. We also tested for the formation of DMVs by monitoring nsp3 protein by combining smRNA-FISH with immunofluorescence. Our finding suggests that atleast at the start of the replication (~ 3 hr p.i.) many of the RNA spots were devoid of nsp3 protein, suggesting that some of these RNA spots may represent the direct accumulation of RNA in the cytoplasm without DMV. At later time points, most of the RNA spots became positive for nsp3, suggesting the formation of DMV. We also observed that the replication is asynchronous and cells with various stages of SARS-CoV-2 RNA replication could be found at any given time point. Our studies indicate that combining smRNA-FISH with IF and utilization of HSHRS-FM enables not only the sensitive detection of SARS-CoV-2 RNAs in a large number of infected cells, but also facilitates the studies to address important questions related to the mechanism of early replication events of SARS-CoV-2.
2. Materials and Methods
2.1. Cell Culture
Vero E6 cells (ATCC, CRL-1586) were maintained in Dulbecco’s Modified Eagle Medium (Hyclone; Cat # SH30081.01) supplemented with 10% fetal bovine serum (Atlas Biologicals; Cat # F-0500-A), 2mM L-glutamine (Gibco; Cat # 25030-081), non-essential amino acids, 100 U/ml penicillin and 100 μg/ml streptomycin (Gibco; Cat # 15140-122). All the cell lines were maintained in a standard 5% CO2 in a culture incubator at 37˚ C.
2.2. Infection of Vero E6 Cells with SARS-CoV-2
For infection of Vero E6 cells with SARS-CoV-2 (SARS-CoV-2 USA-WA1/2020), cells were seeded on Nunc™ Lab-Tek™ sterile 4-chambered slides (Thermo Scientific™, Cat # 177399) at a confluency of 50-70% the day before infection. On the day of the infection, medium was replaced with 500 μl of infection medium (DMEM medium supplemented with 2% fetal bovine serum, non-essential amino acids, HEPES and penicillin/streptomycin) and the cells were transferred to the BSL-3 laboratory. The virus was diluted in infection medium and 100 µl/well added to each well to achieve a m.o.i. of 0.5 PFU/cell. After, 0, 0.5, 1, 2, 3, 4, 5, 6,12 and/or 24 hours post-infection, supernatant was removed, and the cells were washed twice with 1 ml of 1x PBS with 5 mM MgCl2. After the second wash, cells were fixed with 4% paraformaldehyde. During fixation, cells were protected from light.
2.3. Immunofluorescence
The fixed cells were washed with 1x PBS, permeabilized with 0.2% Triton X-100 and incubated with a mouse monoclonal antibody that recognizes the NP protein of SARS-CoV-2 (1C7, kindly provided by Dr. Thomas Moran, Icahn School of Medicine at Mount Sinai). Next, cells were washed with 1x PBS and incubated with Alexa fluor 488 conjugated anti-mouse secondary antibody (Invitrogen) and DAPI. The signals were detected using an EVOS M5000 fluorescent microscope.
2.4. smRNA-FISH Probe Design and Specificity Analysis
Forty different 22 nucleotide long smRNA-FISH probes (5’-> 3’) for spike (S) and RdRp (nsp12) genes were generated using LGC Biosearch Technologies’ Stellaris® RNA FISH Probe Designer version 4.2 [21]. Each probe for spike gene was tagged with Quasar 570 and for nsp12 gene with Quasar 670 dyes at 3′ ends, respectively. As a target reference sequence, coding sequences (CDS) of Spike and nsp12 region was selected from the SARS-CoV-2 Wuhan-Hu-1 (NC_045512.2) reference sequence. Each probe sequence was subjected to BLAST and was screened against other coronavirus sequences, human transcriptome, and human intron database. To perform in silico probe sequence specificity analysis, all 40 oligonucleotide sequences of the Spike and nsp12 smRNA-FISH probes were aligned against; SARS-CoV-2 (NC_045512.2); SARS-CoV-1 Tor2 (NC_004718.3); MERS-CoV isolate HCoV-EMC/2012 (NC_019843.3); HCoV-HKU1 (NC_006577.2); HCoV-OC43 strain ATCC VR-759 (AY585228.1); HCoV 229E strain 229E/human/USA/933-40/1993 (KF514433.1); HCoV NL63 strain NL63/human/USA/0111-25/2001 (KF530112.1) and Human hg38_mRNA (AF001540.1), RefSeq genome or transcriptome assembly, using ‘bowtie2′ (2.4.4). To get the minimum edit distance of oligonucleotide sequences to target genome/transcriptome, following bowtie2 v2.4.4 arguments were used; --end-to-end, --no-unal, --align-seed-mm 0, --align-seed-length 5, --align-seed-interval 1-1.15, -- effort-extend 15, --effort-repeat 2 [18]. On the other hand, various variants of concern (VOCs) of SARS-CoV-2 [22], in addition to the WA1 strain, were also considered for in silico probe sequence specificity analysis for both Spike and nsp12 smRNA-FISH probes. For this analysis, the genomes of several SARS-CoV-2 VOCs, including Alpha/B.1.1.7 (OW998408.1), Beta/B.1.351 (OX008586.1), Gamma/P.1 (MZ427312.1), Delta/B.1.617.2 (OX014251.1), Omicron/B.1.1.529 (OW996240.1), and four sub-variants of Omicron, such as BA.1 (OP810428.1), BA.2 (OM617939.1), BA.4 (OP093374.1), and BA.5 (OP093373.1), along with SARS-CoV-2 Wuhan-Hu-1 (NC_045512.2), were selected, and the alignment was performed using ‘bowtie2’ version 2.5.1. To get the minimum edit distance of oligonucleotide sequences to target genome/transcriptome, the following arguments were used; bowtie2 --score-min L,-0.6,-3 --end-to-end -N 0 -L 5 -i S,1,1.15 -D 15 -R 2 -x ${PATH_TO_INDEXED_GENOME} -U ${FASTQ} -S ${OUTPUT_SAMFILE}. In order to determine the specificity of the designed Spike and nsp12 smRNA-FISH probes, the minimum edit distance of oligonucleotide sequences was also calculated for the spike gene of SARS-CoV-2 and the codon-optimized spike gene of SARS-CoV-2. The 40 different smRNA-FISH probe sequences of spike and nsp12 genes are shown as Table 1. The heatmaps were created using R v4.0.2 with Bioconductor package Complex Heatmap v2.9.3 [23].
2.5. smRNA-FISH Analysis
Vero E6 cells (ATCC, CRL-1586) were seeded on a four-chambered slide and inoculated with SARS-CoV-2 (USA-WA1/2020) at an m.o.i. of 0.5 for various time points (0, 0.5, 1, 2, 3, 4, 5, 6,12, and/or 24 hours). In the case of VOC infection, Omicron BA.1 was used to infect the Vero cells expressing high levels of transmembrane serine protease 2 (TMPRSS2) under similar conditions (at 3, 6, and 12 hours). However, Vero E6 cells mock-infected or infected with heat-inactivated SARS-CoV-2 WA1 or SARS-CoV-2 BA.1 at 12 hours post-infection were considered as negative controls, respectively. The cells were fixed with 4% paraformaldehyde post-infection for 30 minutes, followed by smRNA-FISH analysis. After fixation, each well of the four chambered slide was treated with 0.1 M Glycine/PBSM for 10 min at room temperature followed by cell permeabilization with PBSM/0.1% Triton X-100 for 10 min. After washing with 1x PBSM, cells were pre-hybridized in 2x Sodium Chloride-Sodium Citrate (SSC) buffer (G-Biosciences; Cat # R019), 15% formamide (Acros Organics; Cat # 75-12-7) for 30 min at 37˚ C. The cells were incubated overnight with 300 μl hybridization buffer containing SARS-CoV-2 spike and/or RdRp/nsp12 stellaris probes tagged with Quasar 570 and Quasar 670 dyes, respectively. SARS-CoV-2 spike and RdRp/nsp12 stellaris probes (250 nM final concentration, Biosearch Technologies)) were added to hybridization buffer containing, 10% dextran sulfate (Sigma; Cat # D61001), 1mg/mL competitor tRNA from E. coli MRE 600 (Cat No # 10109541001; Millipore Sigma), 15% formamide (Cat # 75-12-7; Acros Organics), 0.2 mg/mL UltraPure BSA (Cat #: AM2616; Ambion™), 2x Sodium Chloride-Sodium Citrate (SSC) buffer (Cat # R019, G-Biosciences), 2 mM Ribonucleoside Vanadyl Complex (Cat # S1402S; New England Biolabs), and 10 U/mL SUPERase•In RNase Inhibitor (Cat # AM2694; Ambion™). When combining RNA-FISH with IF, the primary antibodies, α-rabbit SARS-CoV-2 nsp3 antibody (1:500 dilution, GeneTex; Cat # GTX135589) were added to the hybridization buffer. The slides were incubated in a humid hybridization chamber overnight at 37˚ C. Post-incubation, the next day, samples were washed with prehybridization buffer (2x SSC, 15% formamide) three times and if combining IF, the slides were incubated two times for 20 min. each with the anti-rabbit Alexa Fluor 488 secondary Ab (1:1000 in the pre-hybridization buffer, Invitrogen; Cat # A-11008). Following incubation with the secondary antibody, cells were washed with pre-hybridization buffer (2x SSC, 15% formamide) three times followed by 3-4 times washing with 2x SSC. The cells were stained with DAPI (1.0 μg/ml in 2x SSC) for 2 min at room temperature. After DAPI staining the cells were washed with 2x SSC and mounted using the ProLong Gold antifade mountant (Cat # P10144, Thermo Scientific).
2.6. Whole-Slide Scanning, Microscope Setup and Image Acquisition
Fluorescent scanning of the slides was done in two stages. First, whole-slide scanning of the entire slide was obtained at 20x using PANNORAMIC 250 Flash III Slide Scanner. Automatic focusing (default factory settings) was used for scanning the whole slide. For fluorescence imaging, we used DAPI, Cy5-Q and TRITC-Dendra fluorescence filters. Pannoramic scanner software were used for image acquisition and scanned slides were visualized using CaseViewer 2.4 (64-bit version). For setting the parameters for image acquisition, mock control was used to set the background level of the fluorescence in the test images. After scanning, the same slides were subjected to single cell imaging. Cells were imaged using an upright, wide-field Olympus BX-63 Microscope equipped with a SuperApochromatic 60×/1.35 NA Olympus Objective (UPLSAPO60XO), a SOLA light engine (Lumencor), an ORCA-R2 Digital Interline CCD Camera (C10600-10B; Hamamatsu), and zero-pixel shift filter sets: DAPI-5060C-Zero, Cy3-4040C-Zero (for Quasar 570 detection), and Cy5-4040C-Zero (for Quasar 670 detection) from Semrock, as described [24]. The resulting image pixel dimension was 107.5 nm, and the z-step size (along the optical axis) used for all optical sectioning acquisition was 200 nm. Metamorph software (Molecular Devices) was used for controlling microscope automation and image acquisition. Images were analyzed using ImageJ and/or Fiji software [25].
3. Results
3.1. Design and Optimization of smRNA-FISH Probes to Study the Early Replication Events of SARS-CoV-2 at Single Cell and Single Molecule Resolution
To understand the kinetics and spatio-temporal aspects of the SARS-CoV-2 replication at earlier time points, and to determine the formation of the timing of membrane-bound ROs we adopted the smRNA-FISH combined with IF method to facilitate the sensitive detection of gRNA and sgRNA-S and proteins at the single-cell, single-molecule level. For this purpose, we first optimized the detection of SARS-CoV-2 sgRNA using smRNA-FISH. Forty fluorescently labeled antisense oligonucleotides were synthesized based on the sequence of the Spike gene (referred to as P1 probe), which would detect positive strands of gRNA and sgRNA-S (Figure 1A and Table 1; see Methods).
The specificity of spike oligonucleotide probe set to SARS-CoV-2 sequence was analyzed by determining the edit distance between the oligonucleotides and the genomic sequences of related human coronaviruses, including SARS-CoV-1, MERS-CoV, HCoV-OC43, HCoV-NL63, HCoV-HKU1, HCoV-229E and the human transcriptome, hg38-mRNA (Figure 1B, top panel). Our analysis indicated that the oligonucleotide probes are specific to SARS-CoV-2 with an edit distance of “0” but not to the other coronaviruses or human sequences with a higher edit distance.
To determine the specificity of the probes for detecting replicating SARS-CoV-2 RNA in cells, Vero E6 cells infected with 0.5 m.o.i. of either infectious virus (SARS-CoV-2 USA-WA1/2020, GenBank MN985325.1) or heat-inactivated virus were subjected to smRNA-FISH using sgRNA-S probe, P1 (Figure 1C, panels 3-6). As a positive control, cells were independently analyzed by immunofluorescence (IF) using α-N antibodies to detect viral N protein expression (Figure 1C, panels 1 and 2). RNA-FISH probes and α-N antibodies detected SARS-CoV-2 RNA and N protein, respectively, in infected cells but neither in the uninfected cells nor in the cells infected with heat-inactivated virus, establishing the specificity of the RNA-FISH probes (Figure 1C). As another negative control, we also infected Vero E6 cells with a VSV-spike virus whose genome harbored the codon-optimized Spike gene open reading frame (VSV-Spike) [26]. Since the codon optimization had dramatically altered the coding sequence of the spike gene, we compared the sequences of the 40 different probes with the sequence of the codon-optimized spike gene from VSV-spike, and found a much higher edit distance of >5 between the probes and target (Figure 1B, lower panel). The VSV-spike virus successfully infected Vero cells and replicated well as indicated by immunofluorescence using α-N antibodies (Figure 1D, panels 1 and 2). However, we observed that the P1 probe failed to generate a positive signal in these cells infected with VSV-Spike (Figure 1D, panels 3 and 4). These results indicated that the P1 probe specifically detected wild-type SARS-CoV-2 Spike RNA sequences and not codon-optimized sequences, without any background or false signals (Figure 1D).
Coronaviruses are lytic viruses, and the spreading of infection leads to the formation of plaques that harbor dead cells at the center and newly infected cells at the periphery [27]. To visualize the extent of viral replication, the infected Vero E6 cells were subjected to smRNA-FISH using the P1 probe at 24 hour p.i., and the entire slide containing the infected cells was scanned at 20x magnification using HSHRS-FM. We found that at higher magnification, several small plaques characterized by the presence of groups of brightly fluorescent cells positive for P1 probe surrounding a region of dead cells were visible (Figure 1E). These studies indicated that the P1 probe selectively detects viral RNA in the infected live cells.
3.2. Time Course Analysis of SARS-CoV-2 RNA Replication
Upon viral entry into the cell, the first step is the synthesis of virally encoded critical RTC enzymes required for replication. The question is how much it would take for the synthesis of new RNA molecules from the one that enters the cell. We carried out a time course analysis at several time points starting from 0.5 hour p.i. earlier than that has been reported [18]. We used 0.5 m.o.i. of the SARS-CoV-2 virus to infect cells and the entire slide (>100,000 cells) with infected cells were imaged using HSHRS-FM at 20x to determine the percentage of cells infected (Figure 2A). HSHRS-FM allows for scanning of a large number of cells on the entire slide but the resolution is not at the single molecule level, and hence, only cells with high level of vRNA could be detected using this method. With HSHRS-FM we observed that at ~6 hours p.i. ~7% of the cells were positive for SARS-CoV2 spike RNA detected by P1 probe (Figure 2A; panels 7-8, and see the graph below). At 12 hours p.i. ~23% of the cells were positive for RNA and by 24 hours p.i. >50% of the cells were positive, reaching the numbers close to the estimated m.o.i. (Figure 2A; panels 9-12, and see the graph below). These results suggested that the detectable viral replication can be scored at starting from ~ 6 hr p.i. and at 24 hr. p.i. viral replication can be easily visualized in >50% of the infected cells when using 0.5 m.o.i. of the virus (Figure 2A; panels 11-12).
To visualize SARS-CoV-2 replication at single molecule level, the above samples were imaged using a fluorescence microscope fitted with a wide angled lens and 1.4 numerical aperture (N.A.) at 60x magnification oil objective that allows the detection of single viral RNA molecules as diffraction-limited puncta within the infected cells. Since the Stellaris FISH probe comprises of 40 tandem 22-mer oligonucleotides corresponding to contiguous sequences on an mRNA, each with a fluorescent label, these probes collectively bind along the same target transcript to produce a punctate signal that appears as bright, diffraction-limited, computationally identifiable fluorescent spots [28,29,30]. Furthermore, large number of probes in a Stellaris FISH assay ensures a high level of sensitivity and specificity and minimizes false negatives and background signals. We found that cells at 0.5 and 2 hours p.i. exhibited single molecules of viral RNA, which were not detected either in the uninfected samples, or in the infected samples with heat-inactivated virus when scanned using HSHRS-FM (Figure 2B, panels 1-3, white arrows). Furthermore, positive cells at early time points exhibited the presence of one, two, or occasionally three spots of RNA per cell, suggesting that this is due to random infection and possibly multiple viruses entering the cells (Figure 2B, panels 1-3; white arrows). However, we did not observe any cells that had more than three spots of RNA, suggesting that these RNA spots might represent the earliest viral RNA that entered the cell. Analysis of Z-stacks of images revealed that the RNA signals in these images were detected only in the stacks that corresponded to interior of the cell and not the periphery, suggesting that these spots represent the genomic RNA molecules that had entered the cytoplasm (Figure S1A). Furthermore, we found that some cells exhibited the presence of SARS-CoV-2 RNA within the nucleus at 30 min p.i (Figure S1B). At time points after 6 hr. p.i., RNA spots that represented single molecules as well as larger patches that represent groups of multiple RNA molecules were visible (Figure 2B, panel 4-5; white arrows and yellow arrow heads). Most of the FISH signals within the cells at 6 hr. p.i. corresponded to patches of RNA rather than single RNA molecules (Figure 2B; panels 4 and 5; white arrows and yellow arrow heads). By 12 hours p.i., the size and number of these patches increased, and in most of the cells, the entire cytoplasm was filled with patches of viral RNA (Figure 2B panels 6-7). By 24 hr. p.i. majority of the infected cells exhibited viral RNA that filled the entire cytoplasm (Figure 2B panel 8).
3.3. Replication of gRNA and sgRNA during Early Stages of SARS-CoV-2 Viral Replication
Since spike RNA probe P1 detected both gRNA and sgRNA-S, we tested the ability of a second probe set (P2) derived from nsp12 gene sequences within ORF1b to detect the gRNA alone (Figure 1A and Table 1). The specificity of oligonucleotides to SARS-CoV-2 nsp12 sequences was analyzed by determining the edit distance between the oligonucleotides and the genome sequences of related human coronaviruses, including SARS-CoV-1, MERS-CoV, HCoV-OC43, HCoV-NL63, HCoV-HKU1, HCoV-229E and the human transcriptome, hg38-mRNA (Fig 1B, middle panel). Our analysis indicated that the oligonucleotide probes are specific to SARS-CoV-2 with an edit distance of “0” but not to the other coronaviruses or human sequences with a higher edit distance. The specificity of P1 and P2 probes were tested by carrying out smRNA-FISH analysis using either P1 or P2 probe sets or both probe sets together and images were analyzed in both TritC (P1 probe) and Cy5 (P2 probe) channels (Figure 3A). We found that the probes were specific, and there was no bleeding from one channel to the other (Figure 3A; panels 1-6). When the two probes were used together, signals from both probes were detected in the same set of infected cells (Figure 3A; panels 7-9). Neither of the probes detected any signal in mock-infected cells, confirming probe specificity (Figure 3A; panels 10-12).
We carried out another time-course analysis using the two probes together to determine the early replication kinetics of gRNA and sgRNA-S. As before, we used a low m.o.i. of the virus for infection, aiming to track the replication of a single virus shortly after its entry into the cell at time points of 0, 2, 3, 4, 5 and 6 hours p.i. Scanning of the entire slides containing the infected cells and analyzing the images at low magnification (5x), indicated the presence of strong positive cells at 4 hours p.i but none at 0-3 hr. p.i. (Figure S2; panels 1-15 and 16-18). The infected cells were positive for both gRNA and sgRNA-S (Figure S2, panels 16-18). As time progressed, the number of positive cells increased at 5 and 6 hours p.i. (Figure S2; panels 19-24). We did not observe any positive cells within mock infected samples (Figure S2; panels 25-27). Analysis of the above images at higher magnification (76.3x) indicated that a majority of the infected cells at 2 hours p.i., and many cells at 3 hours p.i. appeared to have single RNA spots positive for both P1 and P2 probe, indicating that these spots represented viral RNA in the process of replication at the early stages (Figure 3B; panels 1-8; white arrows). Because of the resolution limitations of HSHRS-FM, it is likely that the single positive RNA spots we identified are not single RNA molecules, but rather represent groups of RNA molecules. At 3 hours p.i., some cells harbored single RNA cluster/patch that are larger than those at 2 hr p.i. and showed distinct regions of hybridization to P1 and P2 probes (Figure 3B; panels 9-12). Within these single RNA clusters/spots, there was a central area positive for both P1 and P2 probes, which was surrounded by smaller spots that hybridized only to the P1 probe. This indicated that perhaps the central region of these clusters harbor gRNA, and the RNA molecules in the periphery of this central region corresponded to sgRNA-S that hybridized to P1 probe only (Figure 3B; panels 9-12). We surmised that the single spots per cell observed at 2 hours and 3 hours p.i. likely represent the early stages of RNA replication initiated by the SARS-CoV-2 RNA that entered the cell. At 4 and 5 hours p.i., the infected cells harbored multiple viral RNA spots that were visualized as large puncta of varied size and number (Figure 3B; panels 13-20).
To gain further insight into the SARS-CoV-2 RNA positive spots observed at early time points (2-3 hours p.i.), the above samples were subjected to single molecule microscopy analysis, as described earlier (Figure 4). We found that at 2 hours p.i. many cells harbored either one or two RNA spots that hybridized to both P1 and P2 probes, indicating that these are gRNAs (Figure 4 panels 5-8 White arrows). However, the RNA spots hybridized differentially to P1 and P2 probes. The signals for the P1 probe was more intense and exhibited a larger area than that for the P2 probe that was restricted to the center of the same spot. Furthermore, we did not detect sgRNAs that are distinct from the gRNA spots at this point (Figure 4; panels 5-8, White arrows). At 3 hours p.i. we found an increase in the number as well as size of spots that hybridized to both P1 and P2 probes (Figure 4; panels 9-16). The size of the spots within the same cell varied considerably, suggesting that these spots represented clusters of RNA at various stages of replication (Figure 4; Panels 12 and 16). As we had noticed in the low-resolution analysis, the central areas in these spots hybridized to both P1 and P2 probes, representing gRNA, which were surrounded by radiating spots that hybridized to only P1 probe, representing the sgRNA-S (Figure 4; panels 9-16). The size of the peripheral spots around the RNA spots that hybridized to P1 probe were similar in size to that of a single RNA molecule (Figure 4; Panels 14-16, white arrows point to central larger RNA spots and yellow arrowheads points to single molecules of sgRNA-S). These results suggested that the central larger RNA spots that hybridized to both P1 and P2 probe represented replication centers with genomic RNA and the single molecule RNA spots that hybridized to P1 alone around the periphery of these spots represented sgRNA. We observed that the number and size of the RNA spots increased at later time points and the intensity with which these spots hybridized to P1 and P2 probes varied (Figure 4; panels 17-28, and Figure 5; panels 1-8). At later time points of 5-12 hours p.i., the RNA spots spread-out from nuclear periphery, filling the entire cytoplasm (Figure 4; panels 21-28, and Figure 5A; panels 1-4). In some cells we noted that both gRNA and sgRNA were migrating away from the nuclear periphery and had reached the narrow and elongated distal regions of the cells (Figure 5A; panels 5-8; yellow arrow heads).
3.4. Nuclear Localization of SARS-CoV-2 RNA
Despite being a surface transmembrane glycoprotein, the S protein in SARS-CoV-2 has a unique nuclear localization signal (NLS) called “PRRARSV,” absent in other coronaviruses, suggesting its potential translocation into the cell nucleus. In a recent study by Sattar et al., they observed the presence of SARS-CoV-2 spike (S) protein and Spike mRNA within the cell nucleus of SARS-CoV-2-infected airway epithelium, unveiling nuclear co-localization as a novel aspect of SARS-CoV-2 pathogenesis [31]. Interestingly, we also observed both gRNA and sgRNA-S RNA in the nucleus (Figure 4; panels 21-24, White arrows). To ascertain that these spots are within the nucleus, we examined the z-stacks (with step size 200 nm) taken from top to bottom of the cells along the optical axis and found that these RNA signals indeed are present in the stacks that correspond to the interior of the nucleus (Figure 5B, yellow arrow heads). Nevertheless, it remains unclear whether these nuclear viral RNAs have a substantial impact on viral replication.
3.5. Nature of RNA Spots Observed during Early Stages of Viral Replication
To determine if the RNA spots that were larger than single molecules that we observed at time points 3 hr. and later represent the replication center or organelles (ROs), we employed a combination of RNA-FISH and immunofluorescence using α-nsp3 antibodies. The SARS-CoV-2 nsp3 protein, as previously documented, is associated with double-membrane vesicles (DMVs) that surround the viral RNA, a prominent characteristic of the SARS-CoV-2 ROs within the host cell [15,32]. We surmised that colocalization of nsp3 protein with RNA spots could be used to indicate the formation of ROs. To determine if the RNA spots we observed co-localizes with the nsp3, we infected cells with SARS-CoV-2 and carried out combined RNA-FISH with IF using P1 probe to detect sgRNA and α-nsp3 antibodies to detect the protein at three different time points p.i. (Figure 6). Our results indicated that at 3 hr p.i., a few cells were positive for RNA spots. Within these cells, approximately 1/3rd of the RNA spots colocalized with nsp3, whereas the remaining RNA spots were free of nsp3 (Figure 6, panels 1-4; and panels 21-24). Furthermore, nsp3 co-localization was independent of the size of the spots, indicating that lack of colocalization was not due to the limitation in detecting nsp3 signals in smaller spots (Figure 6, panels 1-4 and panels 21-24). By 6-hour p.i., more cells had RNA spots that colocalized with nsp3 (Figure 6, Panels 5-12). Furthermore, there was variability in the number of RNA spots per cell as well as the colocalization of nsp3 with RNA at 6hr p.i. (Figure 6, Panels 5-12). While some cells expressed RNA spots but no nsp3 (Figure 6, Panels 5-8), other cells expressed both RNA spots and nsp3 protein, and most of the RNA spots colocalized with nsp3 (Figure 6, Panels 9-12). By the 12-hour mark, more cells expressed RNA spots and majority of the RNA spots at this time point overlapped with nsp3 (Figure 6, Panels 13-20). These results suggested that there was heterogeneity in the colocalization of nsp3 with RNA spots at early time points. This heterogeneity did not reflect on the expression of nsp3 in the cells, as within the same cells both kinds of RNA spots --with and without nsp3-- were observed. Based on these results we hypothesized that while the individual diffraction limited positive spots at 2 hours p.i. and earlier time points likely represented single gRNA molecules, the larger RNA spots observed at 3 hr p.i. represented clusters of RNA that are likely to be precursors to the formation of RO. Some of these RNA clusters are devoid of nsp3 at early time points. At later points all the RNA spots colocalized with nsp3, suggesting the successful formation of DMVs.
3.6. Heterogeneity in the Replication of SARS-CoV-2 RNA
Previous reports had indicated that within the pool of infected Vero E6 cells, about 10 percent were “super permissive” allowing high degree of replication of virus, based on the observation of the density of SARC-CoV-2 RNA spots per individual cells at 8 hr p.i. [18]. To further examine this information, we took advantage of the ability of HSHRS-FM, to scan a large number of cells on the slides at three different time points p.i. We observed heterogeneity in the replication of the SARS-CoV-2 at any given time point, consistent with the previous report (Supplementary Figure S3). However, we found a random distribution of cells with varying densities of RNA spots at any given time point. At early time points, the majority of the infected cells had either one or a few RNA clusters per cell, and a few cells with large number of RNA spots (Supplementary Figure S3, panel 1). At later time points, a majority of infected cells had a large number of RNA clusters filling the entire cytoplasm (Supplementary Figure S3, panel 2-3). To quantitate the percentage of cells containing varying densities of RNA spots per cell, we used the images obtained in HSHRS-FM with P2 probe to quantitate distribution of cells with differing densities of RNA clusters per cell. We arbitrarily defined various stages of replication as follows: Stage-I when cells harbored 1-5 RNA spots per cell but not much diffused RNA (Figure 7A, panels 1 and 2). Stage-2 and Stage-3 were defined as intermediates, where the number of RNA spots progressively increased (Figure 7A, panels 3-6). Stage-4 was defined as a late stage when the entire cytoplasm was filled with RNA spots and distinct RNA spots could not be quantified (Figure 7A, panels 7 and 8). We analyzed ~1000 cells per time point at 4, 5, and 6 hours p.i. by counting cells in 10 different random fields of view using the images obtained by HSHRS-FM. The percentage of cells at these four stages were determined as the fraction of positive cells that exhibited different densities of RNA spots at a given time point (Figure 7B). The results indicated that at 4 hours p.i., approximately 35% of the infected cells showed viral replication at Stages 1-3, and a few cells (2.5%) at Stage-4. At 5 hours p.i., Stages 1-3 decreased to 14 to 26%, while Stage-4 increased to 43%. At 6 hr post infection the majority of cells exhibited stage 4 replication. While there were very few cells with Stage-4 (2.5%) replication at 4 hours p.i., at 6 hr p.i. 51% of the infected cells were at Stage 4 (Figure 6B). These data suggested that the virus replication is asynchronous and heterogeneous.
3.7. Specificity of SARS-CoV-2 Probes against Variants of Concern (VOCs) of SARS-CoV-2
To determine whether the spike (P1) or nsp12 (P2) probe that we designed using WA1 strain can also detect variants of concern (VOCs) of SARS-CoV-2, we conducted probe sequence alignment against the genomes of several SARS-CoV-2 VOCs, including VOCs Alpha/B.1.1.7, Beta/B.1.351, Gamma/P.1, Delta/B.1.617.2, Omicron/B.1.1.529, and four sub-variants of Omicron (BA.1, BA.2, BA.4, and BA.5), along with SARS-CoV-2 Wuhan-Hu-1 (Figure 8A). This alignment was based on the edit distance, which quantifies the mismatch score between the gene sequence of SARS-CoV-2 WA1 and the genome sequences of other SARS-CoV-2 VOCs, ranging from “0” for a perfect match to “>10,” indicating a significant mismatch (Figure 8A). The Omicron variant, as the fifth designated VOCs, exhibits an extensive spike protein mutation profile, surpassing more than 30 mutations in the spike regions [22]. It has displayed a remarkable 13-fold increase in viral infectivity and is 2.8 times more contagious than the Delta variants [22]. Consequently, our next objective was to confirm the probe’s specificity against Omicron variants [22]. Based on the edit score, one of the first identified Omicron variants (BA.1) of SARS-CoV-2 was found to have the maximum number of probe mismatches for spike probe P1. Specifically, we found that six of the oligonucleotides in a mixture of 40 different oligonucleotides of the P1 probe targeted to spike protein exhibited mismatches, and none of the sequences in the P2 probe that targets the nsp12 sequence exhibited mismatches to the sequences of Omicron BA.1 variant (Figure 8A). To determine if P1 and P2 probes can detect BA.1 VOC gRNA and sgRNA, Vero cells expressing high levels of transmembrane serine protease 2 (TMPRSS2) were infected with 0.5 m.o.i. of SARS-CoV-2 BA.1 strain at 3, 6, and 12 hours post-infection, respectively and probed using P1 and P2 probes (Figure 8B, panels 2, 4 and 6). We found that While P1 probe hybridized with a slight decrease in intensity, both P1 and P2 probes were able to detect the BA.1 VOC and the signals co-localized with each other in the same cells, suggesting that these probe sets can be used for detecting VOC (Figure 8B, panels 2, 4 and 6). It has been reported that Omicron variant exhibits a slower replication kinetics at early time points (12 and 24 hr. p.i.) [33,34,35]. Consistent with these reports, the infectivity of the BA.1 strain was much less when compared to that of the WA1 strain (Figure 8; and compare to Figure 2 and 3). However, the signals were clearly above the background, as neither uninfected mock cells nor infection with heat-inactivated SARS-CoV-2 BA.1 virus used in the same experiment showed any positive signals under similar conditions (Figure 8B; panels 1, 3, 5, and 7). Examination of cell images at higher magnification clearly indicated that both P1 and P2 probes are overlapping and that the RNA is present in patches similar to what we observed with SARS-CoV-2 WA1 strain suggesting that these represents actively replicating centers of viral RNA (Figure 8C; panels 1-16). These results establish that the P1 and P2 probes can be efficiently used to detect gRNA and sgRNAs of VOCs.
4. Discussion
Our studies provide a spatial and temporal characterization of early post-entry events of SARS-CoV-2 RNA replication in Vero E6 cells at a single-cell, single-molecule resolution, and shed light on the formation of replication centers at early time points. Our data complements the previous reports, and in addition, provides information and clear images of very early stages of replication. We visualized cytoplasmically localized single gRNA molecules within cell cytoplasm at 0.5 hours p.i., indicating that these molecules likely represent viral RNA from a particle that has just entered the cell. To our knowledge, these represent the earliest time points of SARS-CoV-2 viral RNA detection in an infected cell. Our studies also indicated that within two hours, single distinct RNA spots/clusters are formed within the cytoplasm that are larger than the diffusion limited single molecules, suggesting that these are results of initial replication of single gRNA that entered the cell. By 3 hr. p.i. we find that some but not all of these RNA clusters are associated with nsp3, which is a marker for the formation of ROs that are characterized by the presence of DMVs, suggesting that these RNA clusters/specles are likely to be precursors for the formation of RO. Eventually, most of the RNA speckles are associated with nsp3 protein at later time points. This temporal association of nsp3 with RNA clusters strongly supports the notion that RNA clusters/speckles that are formed without nsp3 might serve as precursors of ROs during the early phases of SARS-CoV-2 replication. Our results are interesting, as in a previous study conducted by Shu Shi et al., the intracellular localization and timing of expression of the viral nsp3 protein in SARS-CoV-2-infected cells were investigated at multiple time points (2, 3, 4, 6, 8, and 24 hpi), with the first appearance observed at 6 hpi [36]. In our study we were able to distinctly visualize the presence and co-localization of nsp3 in some of the RNA clusters at 3 hpi, possibly attributed to the heightened sensitivity of our RNA-FISH approach. It is intriguing to note that many of the RNA clusters at 3 hr time point were without nsp3. It is not clear if these RNA spots without nsp3 are aggregates or phase separated RNA clusters in the cytoplasm without a membrane. More research is needed to characterize these RNA spots that lack nsp3. It is also intriguing to note that while gRNA and nsp3 appears to reside in the center of the RNA clusters, the sgRNA appears to surround these centralized structures. One possibility is that if the RNA clusters represent RO, then sgRNA at the periphery of these clusters may represent the those that have migrated out of the ROs.
Our studies also indicated that there is cell-to-cell heterogeneity and asynchrony in the rate of RNA replication, which can be observed by quantitating the number and nature of RNA spots/clusters present within cells at a given time point. When infected with low m.o.i. of 0.5, most of the cells have one or a few RNA spots/clusters that appear to be at an early stage of replication. As the time progresses, the percentages of cells with early stages of RNA replication decreases, and those with late stages of replication increases. Thus, the heterogeneity appears to be a random or stochastic event, as all stages of replication are found at any given time point. The reason for the heterogeneity in replication in different cells is not clear and it could be due to differences in the rate of entry of RNA into the cytoplasm, the establishment of the first RO from the RNA that entered the cell, or it could be due to differences in the rate at which the RNA replication progresses within the cells. It is well known that the stage of cell cycle and other cellular factors affect the rate of viral replication [37,38].
Consistent with previous observations [31], we have also identified SARS-CoV-2 gRNA molecules within the nuclei of certain infected cells. Recent evidence has stirred controversy in the field, suggesting that, at least under certain specific conditions, SARS-CoV-2 sequences can undergo retrotranscription and integrate into the host genome as DNA, leading to the formation of chimeric genes [31,39,40]. At this point we do not have any information regarding the integration of SARS-CoV-2 nucleic acid in the nucleus, but we clearly find both gRNA and sgRNA within the nucleus. Interestingly, we did not find the presence of nsp3 protein in the nucleus, suggesting that the replication centers are limited to the cytoplasm. More experiments are needed to establish the role of the viral components in the nucleus during replication of the virus.
In summary, high-resolution early kinetic analysis of SARS-CoV-2 RNA replication provides an understanding of the timing of the formation and arrangement of gRNA, sgRNA and possibly formation of RO and sets the stage for further analysis of these unique organelles in the future. While our manuscript was in preparation, several groups have reported the use of smFISH to study the infection of SARS-CoV-2 in human cell lines [18,20,41,42]. While our data is consistent with these studies, we were able to identify viral RNA within the cells at earlier time points (0.5 hours, and 1 hours p.i.) and were able to determine that the RNA spots could be the precursors to ROs or viral RNA factories at much higher resolution, where we identified the presence of a central region within these ROs filled with gRNAs and sgRNAs that are surrounded by migrating sgRNAs. This central region colocalized with the nsp3 protein, suggesting it is an RO. Interestingly, at early time points p.i. (3 hr p.i.), many RNA spots, which were larger than single RNA molecules, did not colocalize with nsp3, suggesting that either these are aggregates of RNA or represent phase separated RNAs due to the accumulation of newly replicated RNA molecules. Because of this reason, we find that quantitating individual gRNAs or sgRNA after 2 hours p.i. becomes challenging. More studies need to be done to establish the nature of these RNA spots that do not co-localize with nsp3. Our findings open avenues for further investigation into the precise nature of RNA speckles during viral replication and the molecular mechanisms governing their interaction with viral proteins. Understanding the dynamics of these early events in SARS-CoV-2 replication may offer valuable insights for the development of antiviral strategies and the elucidation of the virus’s pathogenesis.
Supplementary Materials
The following supporting information can be downloaded at the website of this paper posted on Preprints.org. Figure S1. Presence of SARS-CoV-2 RNA within the cytoplasm and nuclei of infected cells. Vero cells infected with SARS-CoV-2 at 30 min p.i. indicating RNA in the cytoplasm (A) and in the nucleus (B). The panels represent Z-stack images of an infected cell to demonstrate the presence of the positive RNA spot inside the cell. A total of 41 Z-stacks were acquired (step size 200 nm) using widefield microscopy starting from the bottom of a cell moving upwards. The panel numbers in the figure represent the stack number of the Z-stacks. Blue color represents DAPI staining and magenta represents SARS-CoV-2 spike RNA. The scale bar is 10 µm.; Figure S2. A time course analysis of SARS-CoV-2 replication to simultaneously detect gRNA and sgRNA-S. Vero E6 cells were infected with SARS-CoV-2 and hybridized with probes at 0, 0.5, 1, 2, 3, 4, 5 and 6 hours p.i. The infected cells were probed using both spike RNA probe P1 and nsp12 RNA probe P2. Four chambered slides containing infected cells and uninfected controls (mock), probed with spike RNA probe P1 and nsp12 RNA probe P2, were subjected to high-speed, high-resolution scanning. The panels represent images of an entire well of the infected cells at 5x magnifications. Blue represents DAPI staining, green represents gRNA detected by nsp12 RNA probe P2, and magenta represents sgRNA-S detected by spike RNA probe P1 and the overlay of the two probes shown in white. The scale bar is 500 µm.; Figure S3. Representative images of SARS-CoV-2-infected Vero E6 cells demonstrating various stages of viral replication. Vero E6 cells infected with SARS-CoV-2 WA1 were subjected to RNA-FISH at 4, 5 and 6 hours p.i. using nsp12 RNA probe P2 that detects gRNA. The images were acquired using HSHRS-FM. The illustration is a representative image of a field view of cells at 40x magnification for each of the three time-points, showing different stages of the viral replication. The numbers in the image refer to the stages of replication, stages 1-4, respectively. Blue color refers to DAPI staining to indicate the nucleus, and the green color represents gRNA hybridized with P2 probe. The scale bar is 20 µm.
Author Contributions
Conceptualization, GK; Funding acquisition, GK, AG-S. and CE; Investigation, GK, RP, CE, IM, AG-S. and RS; Methodology, RP, CE, IM and AC; Supervision: GK, RS, CE, and AG-S; Visualization and imaging: RP and CE; Writing-original draft, GK, RP with contribution from other authors, CE, IM, AG-S, AC and RS; Writing-review and editing, GK and RP.
Acknowledgments
We thank Dr. V. Prasad for critically reading the manuscript. We acknowledge Updesh Dixit for help in sample collection for some of the experiments. We also thank Robert Dubin and Xusheng Zhang from the Computational Genomics Core for help with edit distance analysis. The current work was in part funded by NIH grant 1 R01 DA 043169-01 to GVK as MPI; NIH grant R01 DK110063 to CE; and CRIPT (Center for Research on Influenza Pathogenesis and Transmission), a NIAID funded Center of Excellence for Influenza Research and Response (CEIRR, contract # 75N93021C00014) to AG-S. We thank Andrea Briceno at Albert Einstein College of Medicine Analytical Imaging Facility (AIF), for assistance with scanning of images on PANNORAMIC 250 Flash III Slide Scanner. AIF was supported by NIH grant 1S10OD026852-01A1 and Cancer Center Grant P30CA013330. We also thank Randy Albrecht for support with the BSL3 facility and procedures at the Icahn School of Medicine at Mount Sinai (ISMMS) and Richard Cadagan for excellent technical assistance.
Conflicts of Interest
The A.G.-S. laboratory has received research support from GSK, Pfizer, Senhwa Biosciences, Kenall Manufacturing, Blade Therapeutics, Avimex, Johnson & Johnson, Dynavax, 7Hills Pharma, Pharmamar, ImmunityBio, Accurius, Nanocomposix, Hexamer, N-fold LLC, Model Medicines, Atea Pharma, Applied Biological Laboratories and Merck, outside of the reported work. A.G.-S. has consulting agreements for the following companies involving cash and/or stock: Castlevax, Amovir, Vivaldi Biosciences, Contrafect, 7Hills Pharma, Avimex, Pagoda, Accurius, Esperovax, Farmak, Applied Biological Laboratories, Pharmamar, CureLab Oncology, CureLab Veterinary, Synairgen and Pfizer, outside of the reported work. A.G.-S. has been an invited speaker in meeting events organized by Seqirus, Janssen, Abbott and Astrazeneca. A.G.-S. is inventor on patents and patent applications on the use of antivirals and vaccines for the treatment and prevention of virus infections and cancer, owned by the Icahn School of Medicine at Mount Sinai, New York, outside of the reported work.
References
- Kim, D.; Lee, J.Y.; Yang, J.S.; Kim, J.W.; Kim, V.N.; Chang, H. The Architecture of SARS-CoV-2 Transcriptome. Cell 2020, 181, 914-+. [CrossRef]
- Organization, W.H. WHO Coronavirus (COVID-19) Dashboard. Available online: https://covid19.who.int/ (accessed on 16 November).
- Hoffmann, M.; Kleine-Weber, H.; Schroeder, S.; Kruger, N.; Herrler, T.; Erichsen, S.; Schiergens, T.S.; Herrler, G.; Wu, N.H.; Nitsche, A.; et al. SARS-CoV-2 Cell Entry Depends on ACE2 and TMPRSS2 and Is Blocked by a Clinically Proven Protease Inhibitor. Cell 2020, 181, 271-+. [CrossRef]
- Shang, J.; Ye, G.; Shi, K.; Wan, Y.S.; Luo, C.M.; Aihara, H.; Geng, Q.B.; Auerbach, A.; Li, F. Structural basis of receptor recognition by SARS-CoV-2. Nature 2020, 581, 221-+. [CrossRef]
- Sridhar, S.; Nicholls, J. Pathophysiology of infection with SARS-CoV-2-What is known and what remains a mystery. Respirology 2021, 26, 652-665. [CrossRef]
- Mokhtari, T.; Hassani, F.; Ghaffari, N.; Ebrahimi, B.; Yarahmadi, A.; Hassanzadeh, G. COVID-19 and multiorgan failure: A narrative review on potential mechanisms. J Mol Histol 2020, 51, 613-628. [CrossRef]
- Xie, Y.; Bowe, B.; Al-Aly, Z. Burdens of post-acute sequelae of COVID-19 by severity of acute infection, demographics and health status. Nat Commun 2021, 12, 6571. [CrossRef]
- Nolen, L.T.; Mukerji, S.S.; Mejia, N.I. Post-acute neurological consequences of COVID-19: an unequal burden. Nat Med 2022, 28, 20-23. [CrossRef]
- Lam, I.C.H.; Wong, C.K.H.; Zhang, R.; Chui, C.S.L.; Lai, F.T.T.; Li, X.; Chan, E.W.Y.; Luo, H.; Zhang, Q.; Man, K.K.C.; et al. Long-term post-acute sequelae of COVID-19 infection: a retrospective, multi-database cohort study in Hong Kong and the UK. EClinicalMedicine 2023, 60, 102000. [CrossRef]
- Davis, H.E.; McCorkell, L.; Vogel, J.M.; Topol, E.J. Long COVID: major findings, mechanisms and recommendations. Nat Rev Microbiol 2023, 21, 133-146. [CrossRef]
- Gupta, A.; Madhavan, M.V.; Sehgal, K.; Nair, N.; Mahajan, S.; Sehrawat, T.S.; Bikdeli, B.; Ahluwalia, N.; Ausiello, J.C.; Wan, E.Y.; et al. Extrapulmonary manifestations of COVID-19. Nat Med 2020, 26, 1017-1032. [CrossRef]
- Sarkesh, A.; Daei Sorkhabi, A.; Sheykhsaran, E.; Alinezhad, F.; Mohammadzadeh, N.; Hemmat, N.; Bannazadeh Baghi, H. Extrapulmonary Clinical Manifestations in COVID-19 Patients. Am J Trop Med Hyg 2020, 103, 1783-1796. [CrossRef]
- V’Kovski, P.; Kratzel, A.; Steiner, S.; Stalder, H.; Thiel, V. Coronavirus biology and replication: implications for SARS-CoV-2. Nat Rev Microbiol 2021, 19, 155-170. [CrossRef]
- Gorbalenya, A.E.; Enjuanes, L.; Ziebuhr, J.; Snijder, E.J. Nidovirales: evolving the largest RNA virus genome. Virus Res 2006, 117, 17-37. [CrossRef]
- Wolff, G.; Limpens, R.; Zevenhoven-Dobbe, J.C.; Laugks, U.; Zheng, S.; de Jong, A.W.M.; Koning, R.I.; Agard, D.A.; Grunewald, K.; Koster, A.J.; et al. A molecular pore spans the double membrane of the coronavirus replication organelle. Science 2020, 369, 1395-1398. [CrossRef]
- Wolff, G.; Melia, C.E.; Snijder, E.J.; Barcena, M. Double-Membrane Vesicles as Platforms for Viral Replication. Trends Microbiol 2020, 28, 1022-1033. [CrossRef]
- Zimmermann, L.; Zhao, X.; Makroczyova, J.; Wachsmuth-Melm, M.; Prasad, V.; Hensel, Z.; Bartenschlager, R.; Chlanda, P. SARS-CoV-2 nsp3 and nsp4 are minimal constituents of a pore spanning replication organelle. Nat Commun 2023, 14, 7894. [CrossRef]
- Lee, J.Y.; Wing, P.A.; Gala, D.S.; Noerenberg, M.; Jarvelin, A.I.; Titlow, J.; Zhuang, X.; Palmalux, N.; Iselin, L.; Thompson, M.K.; et al. Absolute quantitation of individual SARS-CoV-2 RNA molecules provides a new paradigm for infection dynamics and variant differences. Elife 2022, 11. [CrossRef]
- Acheampong, K.K.; Schaff, D.L.; Emert, B.L.; Lake, J.; Reffsin, S.; Shea, E.K.; Comar, C.E.; Litzky, L.A.; Khurram, N.A.; Linn, R.L.; et al. Subcellular Detection of SARS-CoV-2 RNA in Human Tissue Reveals Distinct Localization in Alveolar Type 2 Pneumocytes and Alveolar Macrophages. mBio 2022, e0375121. [CrossRef]
- Rensen, E.; Pietropaoli, S.; Mueller, F.; Weber, C.; Souquere, S.; Sommer, S.; Isnard, P.; Rabant, M.; Gibier, J.B.; Terzi, F.; et al. Sensitive visualization of SARS-CoV-2 RNA with CoronaFISH. Life Sci Alliance 2022, 5. [CrossRef]
- LGC Biosearch Technologies’ Stellaris® RNA FISH Probe Designer version 4.2. Available online: https://www.biosearchtech.com/stellaris-designer (accessed on.
- Aleem, A.; Akbar Samad, A.B.; Vaqar, S. Emerging Variants of SARS-CoV-2 and Novel Therapeutics Against Coronavirus (COVID-19). In StatPearls; Treasure Island (FL), 2023.
- Gu, Z.; Eils, R.; Schlesner, M. Complex heatmaps reveal patterns and correlations in multidimensional genomic data. Bioinformatics 2016, 32, 2847-2849. [CrossRef]
- Eliscovich, C.; Shenoy, S.M.; Singer, R.H. Imaging mRNA and protein interactions within neurons. Proc Natl Acad Sci U S A 2017, 114, E1875-E1884. [CrossRef]
- Schindelin, J.; Arganda-Carreras, I.; Frise, E.; Kaynig, V.; Longair, M.; Pietzsch, T.; Preibisch, S.; Rueden, C.; Saalfeld, S.; Schmid, B.; et al. Fiji: an open-source platform for biological-image analysis. Nat Methods 2012, 9, 676-682. [CrossRef]
- Dieterle, M.E.; Haslwanter, D.; Bortz, R.H., 3rd; Wirchnianski, A.S.; Lasso, G.; Vergnolle, O.; Abbasi, S.A.; Fels, J.M.; Laudermilch, E.; Florez, C.; et al. A Replication-Competent Vesicular Stomatitis Virus for Studies of SARS-CoV-2 Spike-Mediated Cell Entry and Its Inhibition. Cell Host Microbe 2020, 28, 486-496 e486. [CrossRef]
- Buchrieser, J.; Dufloo, J.; Hubert, M.; Monel, B.; Planas, D.; Rajah, M.M.; Planchais, C.; Porrot, F.; Guivel-Benhassine, F.; Van der Werf, S.; et al. Syncytia formation by SARS-CoV-2-infected cells. EMBO J 2020, 39, e106267. [CrossRef]
- Femino, A.M.; Fay, F.S.; Fogarty, K.; Singer, R.H. Visualization of single RNA transcripts in situ. Science 1998, 280, 585-590. [CrossRef]
- Singer, R.H.; Ward, D.C. Actin gene expression visualized in chicken muscle tissue culture by using in situ hybridization with a biotinated nucleotide analog. Proc Natl Acad Sci U S A 1982, 79, 7331-7335. [CrossRef]
- Raj, A.; van den Bogaard, P.; Rifkin, S.A.; van Oudenaarden, A.; Tyagi, S. Imaging individual mRNA molecules using multiple singly labeled probes. Nature Methods 2008, 5, 877-879. [CrossRef]
- Sattar, S.; Kabat, J.; Jerome, K.; Feldmann, F.; Bailey, K.; Mehedi, M. Nuclear translocation of spike mRNA and protein is a novel feature of SARS-CoV-2. Front Microbiol 2023, 14, 1073789. [CrossRef]
- Ricciardi, S.; Guarino, A.M.; Giaquinto, L.; Polishchuk, E.V.; Santoro, M.; Di Tullio, G.; Wilson, C.; Panariello, F.; Soares, V.C.; Dias, S.S.G.; et al. The role of NSP6 in the biogenesis of the SARS-CoV-2 replication organelle. Nature 2022, 606, 761-768. [CrossRef]
- Kehrer, T.; Cupic, A.; Ye, C.; Yildiz, S.; Bouhaddou, M.; Crossland, N.A.; Barrall, E.A.; Cohen, P.; Tseng, A.; Cagatay, T.; et al. Impact of SARS-CoV-2 ORF6 and its variant polymorphisms on host responses and viral pathogenesis. Cell Host Microbe 2023, 31, 1668-1684 e1612. [CrossRef]
- Hoffmann, M.; Wong, L.R.; Arora, P.; Zhang, L.; Rocha, C.; Odle, A.; Nehlmeier, I.; Kempf, A.; Richter, A.; Halwe, N.J.; et al. Omicron subvariant BA.5 efficiently infects lung cells. Nat Commun 2023, 14, 3500. [CrossRef]
- Zhao, H.; Lu, L.; Peng, Z.; Chen, L.L.; Meng, X.; Zhang, C.; Ip, J.D.; Chan, W.M.; Chu, A.W.; Chan, K.H.; et al. SARS-CoV-2 Omicron variant shows less efficient replication and fusion activity when compared with Delta variant in TMPRSS2-expressed cells. Emerg Microbes Infect 2022, 11, 277-283. [CrossRef]
- Shi, F.S.; Yu, Y.; Li, Y.L.; Cui, L.; Zhao, Z.; Wang, M.; Wang, B.; Zhang, R.; Huang, Y.W. Expression Profile and Localization of SARS-CoV-2 Nonstructural Replicase Proteins in Infected Cells. Microbiol Spectr 2022, 10, e0074422. [CrossRef]
- Roe, T.; Reynolds, T.C.; Yu, G.; Brown, P.O. Integration of murine leukemia virus DNA depends on mitosis. EMBO J 1993, 12, 2099-2108. [CrossRef]
- Feuer, R.; Mena, I.; Pagarigan, R.; Slifka, M.K.; Whitton, J.L. Cell cycle status affects coxsackievirus replication, persistence, and reactivation in vitro. J Virol 2002, 76, 4430-4440. [CrossRef]
- Lafon-Hughes, L. Towards Understanding Long COVID: SARS-CoV-2 Strikes the Host Cell Nucleus. Pathogens 2023, 12. [CrossRef]
- Zhang, L.; Richards, A.; Barrasa, M.I.; Hughes, S.H.; Young, R.A.; Jaenisch, R. Reverse-transcribed SARS-CoV-2 RNA can integrate into the genome of cultured human cells and can be expressed in patient-derived tissues. Proc Natl Acad Sci U S A 2021, 118. [CrossRef]
- Burke, J.M.; St Clair, L.A.; Perera, R.; Parker, R. SARS-CoV-2 infection triggers widespread host mRNA decay leading to an mRNA export block. RNA 2021, 27, 1318-1329. [CrossRef]
- Hu, D.; Wang, T.; Uddin, J.; Greene, W.K.; Hu, D.; Ma, B. Development of a high-sensitivity and short-duration fluorescence in situ hybridization method for viral mRNA detection in HEK 293T cells. Front Cell Infect Microbiol 2022, 12, 960938. [CrossRef]
Figure 1.
Design and optimization of SARS-CoV-2 specific smRNA-FISH probes to detect SARS-CoV-2 infection. (A) Schematic representation of SARS-CoV-2 gRNA and sgRNA-S, indicating the position of the smRNA-FISH probes, P1 (in magenta) and P2 (in green) probes that hybridize to Spike and nsp12 ORF sequences, respectively. (B) Heatmap representing the probe sequence alignment against various coronavirus genomes (including SARS-CoV-1, SARS-CoV-2, MERS-CoV, HCoV-OC43, HCoV-NL63, HCoV-229E) and human transcriptomes (hg38-mrna). Each column represents individual 22 nt spike gene probe sequences from Spike gene (S1-S40, upper panel, represented in the shades of red) and from nsp12 gene (N1-N40, middle panel, represented in shades of green). The lower panel representing the heatmap of the spike probe sequence alignment against spike gene of the SARS-CoV-2 and codon-optimized spike gene of the SARS-CoV-2 (S1-S40, lower panel, represented in the shades of red), showing the specificity of the probe. The minimum edit distance represents mismatch score between the SARS-CoV-2 sequence and the other genome sequences, where ‘0′ indicates a perfect match (in white) and >10 represents the most mismatch (in dark red or green). (C) Specificity of SARS-CoV-2 spike RNA Probe P1 in detecting SARS-CoV-2 viral genome. Vero E6 cells mock- or SARS-CoV-2- infected, at 12 hours p.i. (m.o.i.: 0.5 PFU/cell), were probed with α-NP antibody (green, panels 1 and 2) as positive control for infection and spike RNA probe P1 (magenta, panels 3 and 4), respectively, to test the specificity of the probe. Panel 5 and 6 shows the specificity of spike RNA probe P1 against Vero E6 cells mock- or infected with heat-inactivated SARS-CoV-2 at 12 hours p.i. (magenta, panels 3 and 4), respectively. Blue color indicates nuclei upon DAPI staining. Scale bar, 150 µm. (D) Vero E6 cells, mock-infected or infected with VSV-Spike virus containing codon-optimized spike gene open reading frame, were probed with spike RNA probe P1 after 24 hours p.i. The cells were imaged under FITC channel for expression of GFP (shown in green, panels 1 and 2) or under TritC channel for detecting hybridization with P1 probe (magenta, panels 3 and 4). GFP expression demonstrates the infection of cells (green, panel 2), whereas the absence of a P1 probe signal (panel 4) with cells infected with VSV-Spike, indicates the specificity of SARS-CoV-2 spike RNA probe P1. Scale bar, 150 µm. (E) Photomicrographs of scanned images of infected cells to determine the extent of SARS-CoV-2 infection and plaque formation. Vero E6 cells infected with SARS-CoV-2 virus at 0.5 m.o.i., were probed with spike RNA probe P1 at 24 hours p.i. The entire slide was scanned at high speed and high resolution. The panels 1-3 represent images at 2x, 10x, and 40x magnifications, respectively. The white arrow in the panel 3 represents the dead center of a plaque. Blue color represents DAPI staining of nuclei and Magenta, SARS-CoV-2 RNA. Scale bars, 1000 μm, 200 μm and 50 μm for 2x, 10x, and 40x images, respectively.
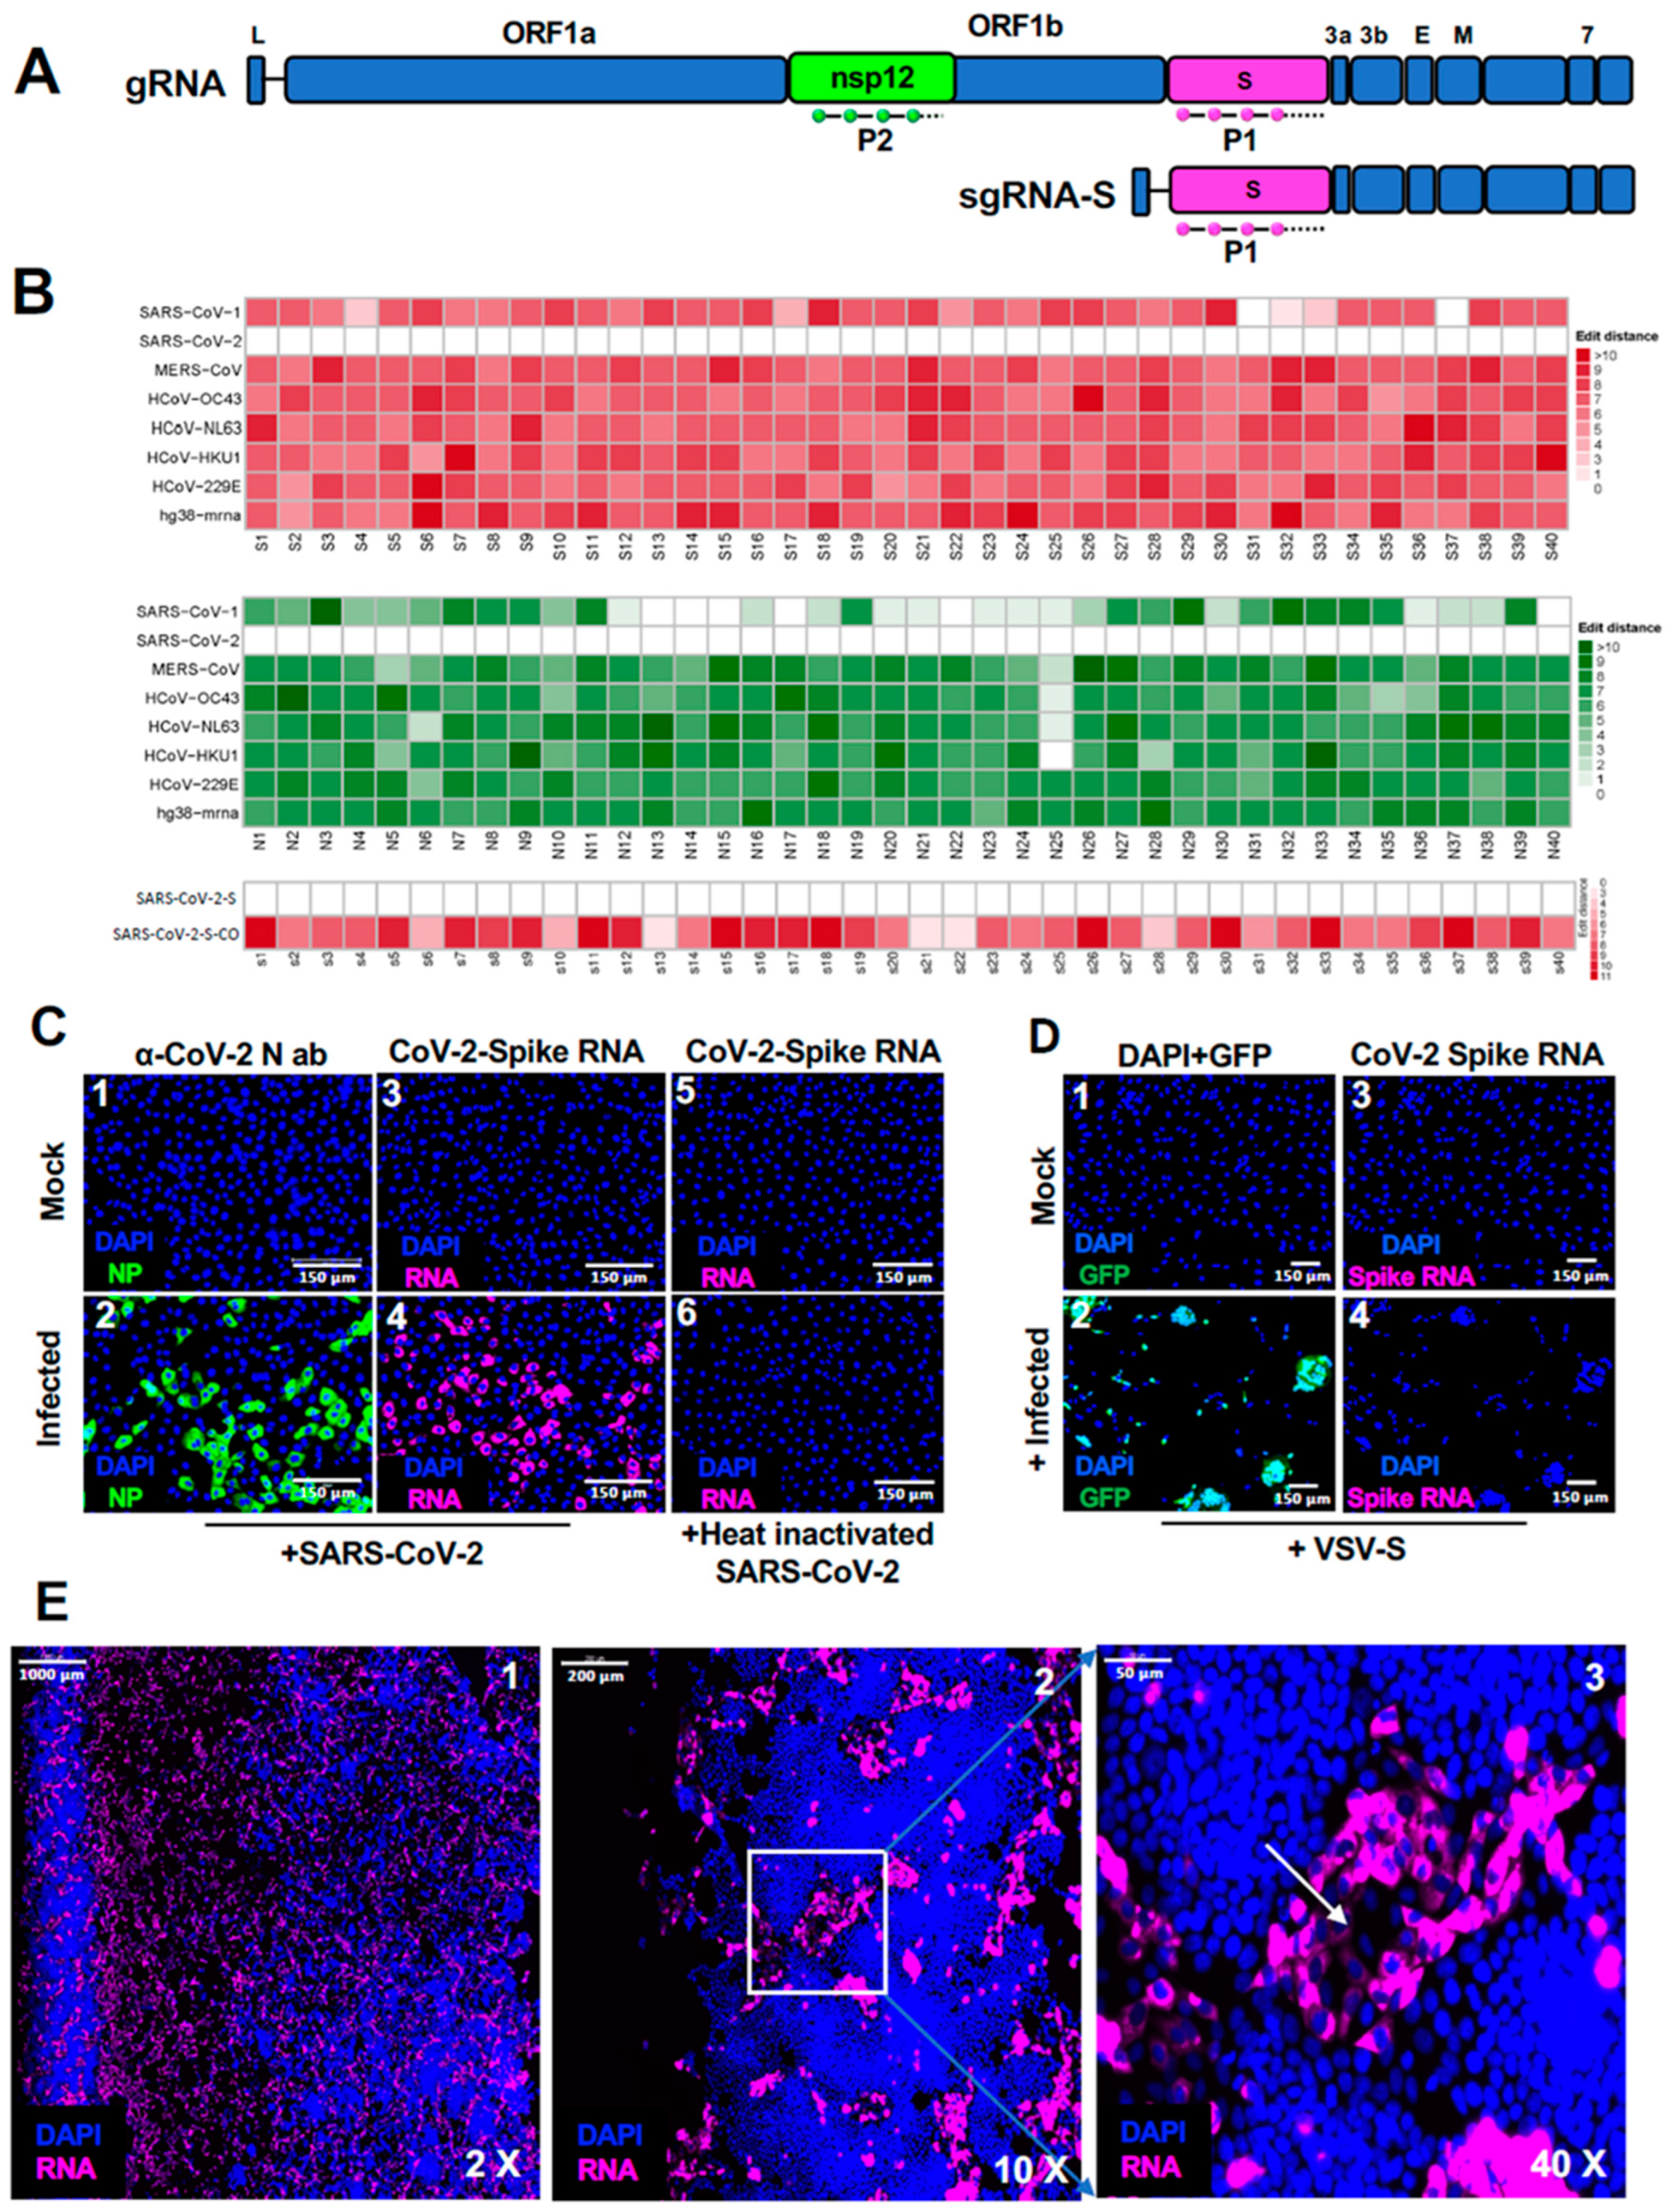
Figure 2.
Time-course analysis of SARS-CoV-2 replication using smRNA-FISH. Cells were infected and hybridized with Quasar 570-labeled P1 probes (magenta) against spike RNA at 0, 0.5, 2, 6, 12, and 24 hours p.i. (A) Photomicrographs representing the images acquired using high resolution-high speed scanning microscopy are represented at 2x (upper panels) and 40x (middle panels) magnifications, respectively. Scale bars, 1000 μm and 50 μm for 2x and 40x images, respectively. Graphical representation showing the quantitation of total percentage of positive cells infected with SARS-CoV-2 at 0, 6, 12, and 24 hours p.i. (lower panel). (B) Photomicrographs representing images of infected cells at single molecule resolution, probed with P1 at 0.5, 2, 6, 12 and 24 hours p.i., acquired using a wide-field Olympus BX-63 Microscope. White arrows point to single molecules of SARS-CoV-2 RNA seen at early time points, 0.5 and 2 hours p.i. DAPI (nucleus, blue). Scale bar, 10 μm.

Figure 3.
Simultaneous detection of SARS-CoV-2 gRNA and sgRNA-S in a time-course analysis. (A) Validation of spike RNA probe P1 and nsp12 RNA probe P2 to simultaneously detect gRNA and sgRNA-S in the infected cells. Cells were infected for 6 hours and hybridized with probes P1 and P2 alone or together and subjected to smRNA-FISH. Images are represented at 20x magnification. Scale bar at 100 μm. (B) A time-course analysis to detect the replication of gRNA and sgRNA in infected cells: The infected cells at 2, 3, 4 and 5 hours p.i. were hybridized with both spike RNA probe P1 and nsp12 RNA probe P2 and subjected to high-speed, high-resolution scanning. The images are represented at 76.3x magnifications. Panels 4, 8, 12,16 and 20 are the zoomed images of insets for indicated time-points. White arrows point to RNA spots that are surrounds by potentially single molecule sgRNA-S. Blue indicates DAPI stained nuclei. Scale bar at 20 μm.
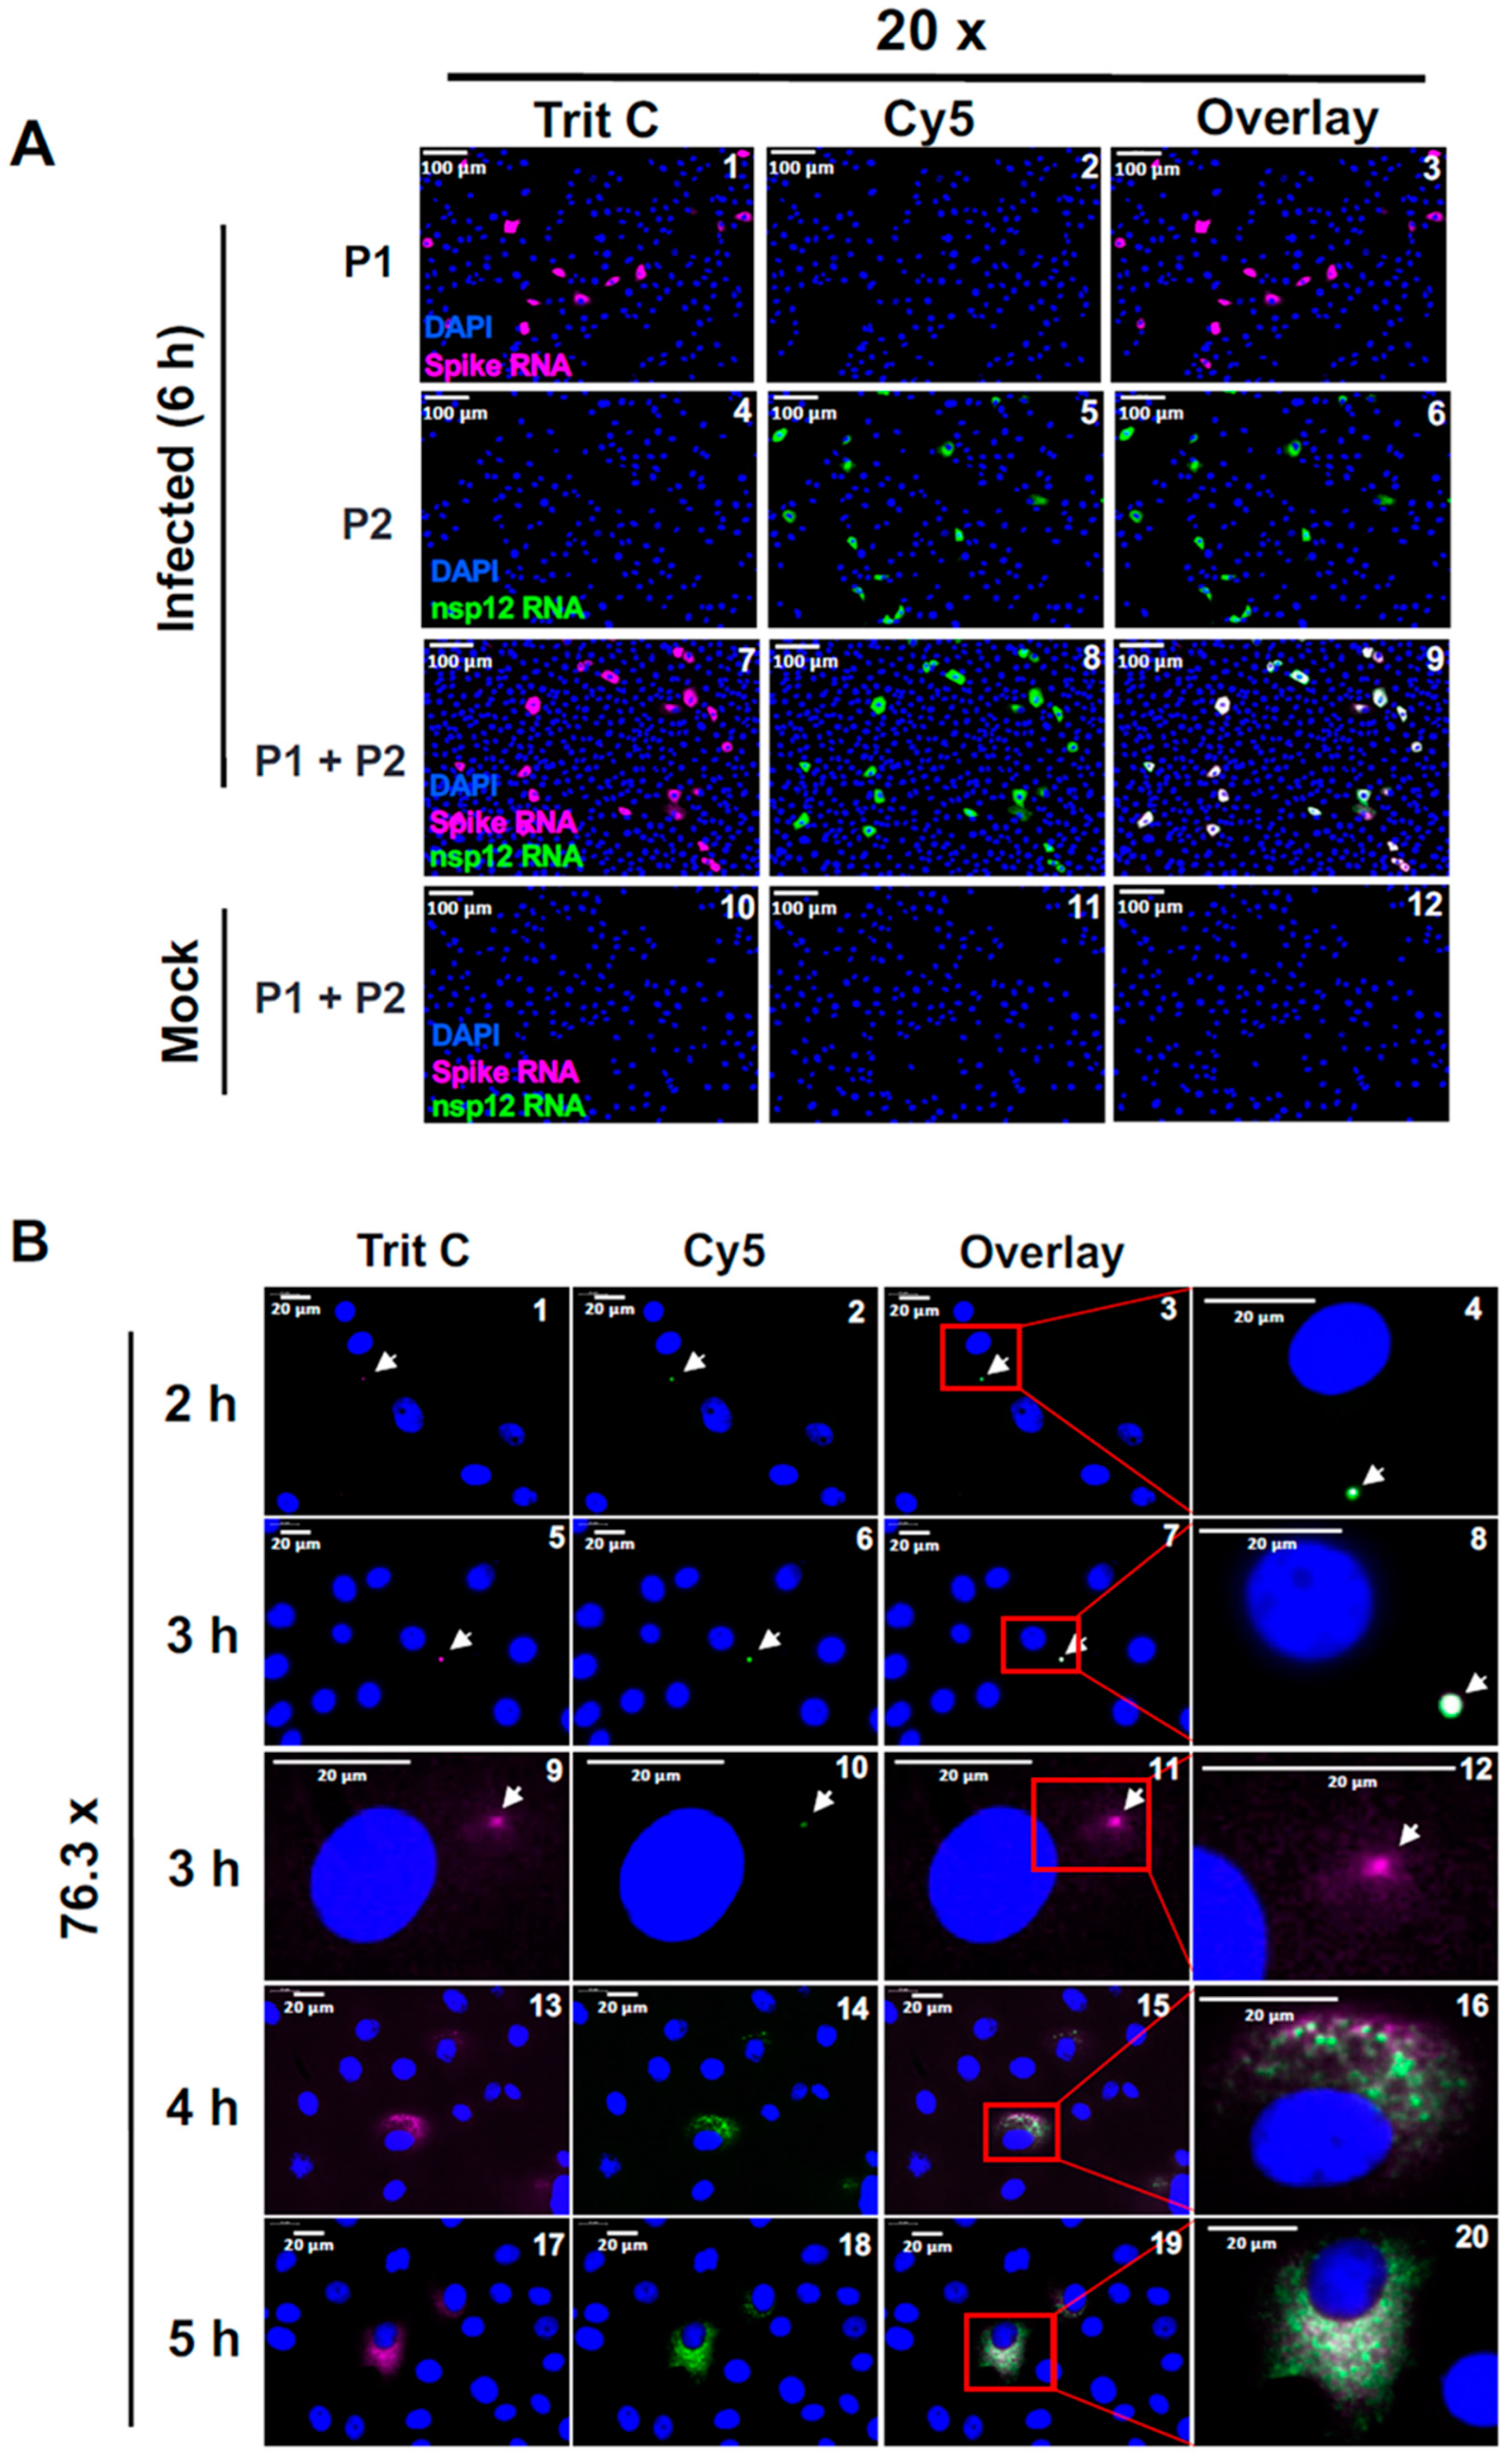
Figure 4.
Single molecule analysis to determine the kinetics of SARS-CoV-2 gRNA and sgRNA replication. Transcript specific visualization of gRNA and sgRNA-S in SARS-CoV-2 infected Vero E6 cells using P1 (spike, represented in magenta) and P2 (nsp12, represented in green) probes. When spike RNA probe P1 and nsp12 RNA probe P2 both hybridize to the same molecule, it is shown in white (overlay). Blue indicates DAPI stained nuclei. Images represent the cells infected with SARS-CoV-2 and hybridized with P1 and P2 probes at 0, 2, 3, 4, 5 and 12 hours p.i. White arrows in panels 6-16 point to replication centers. Yellow arrow heads point to single molecules of sgRNA-S. Panels 13-16 show the magnified area of the corresponding overlay images at 3 hours p.i., illustrating two replication centers (white arrows). The larger RNA spots in these panels harbors gRNA in the center surrounded by the sgRNA-S. Single molecule RNA are indicated by yellow arrow heads (panels 14-16). The white arrows in panels 22-24 point to RNA in the nucleus. The images were acquired using a wide-field microscope to detect the diffraction limited single molecules. Scale bar at 10 μm.
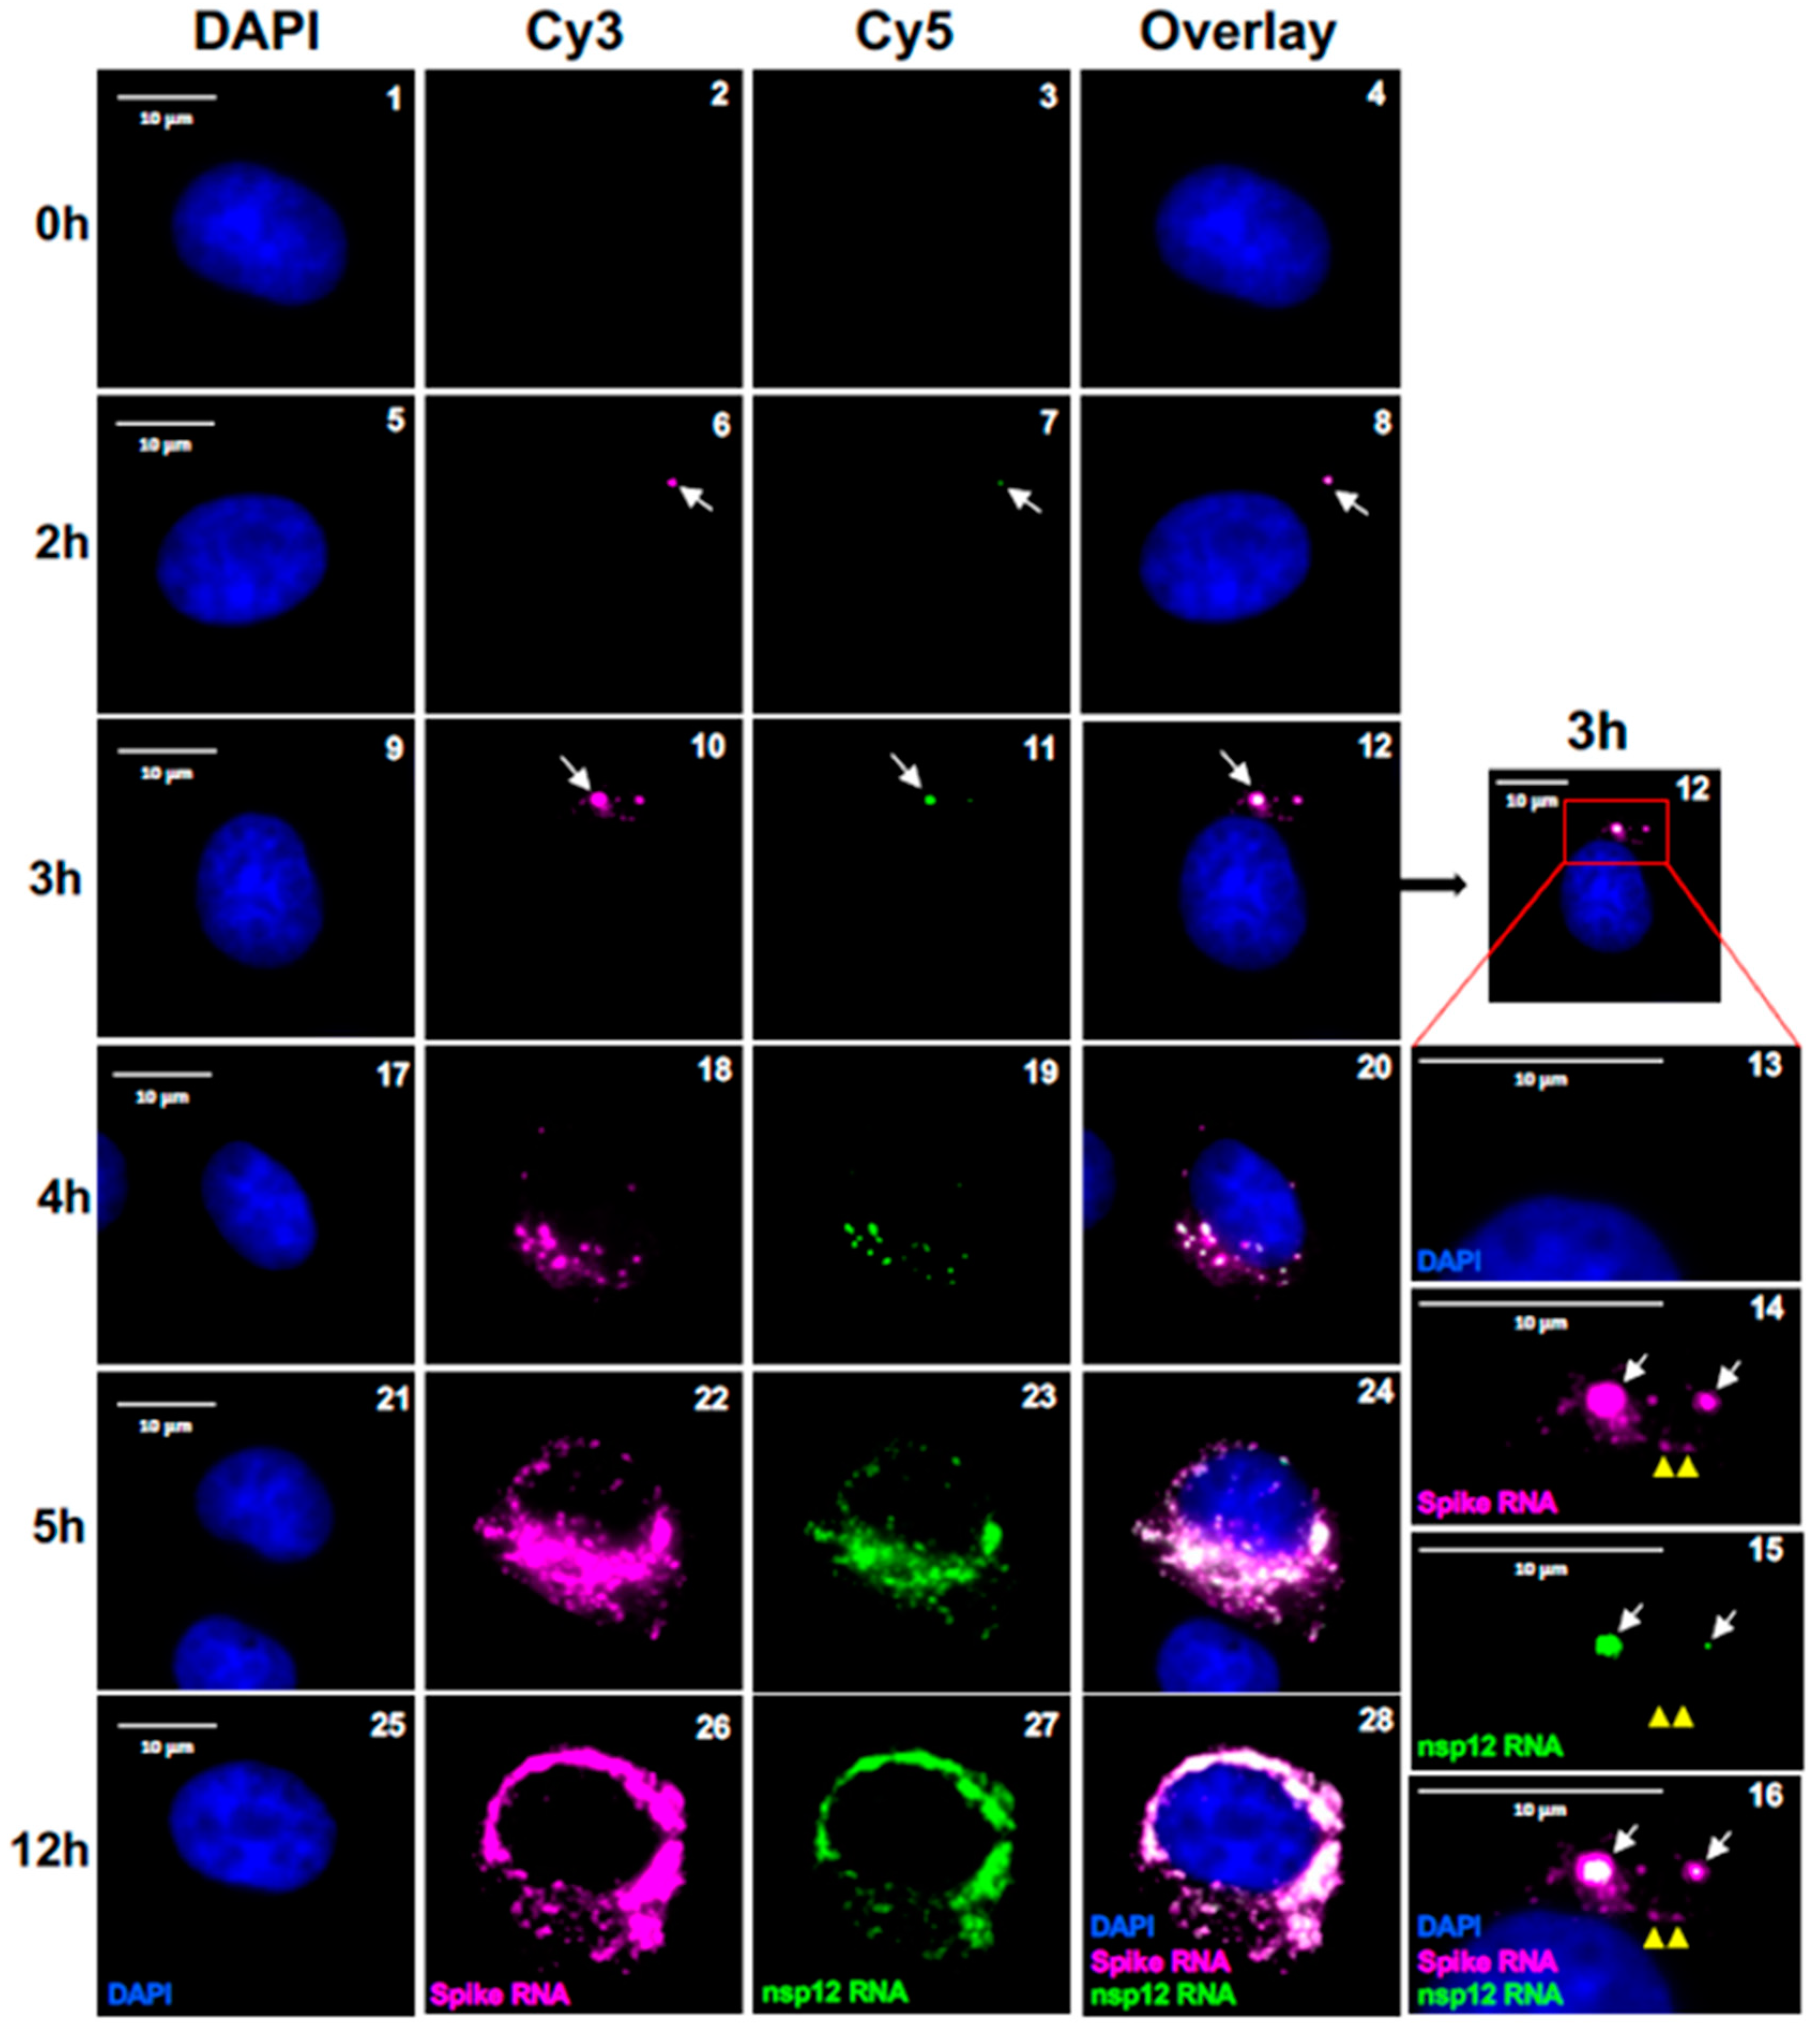
Figure 5.
Images of cells infected with SARS-CoV-2 at 5 hours p.i. (A) Representative cells infected with SARS-CoV-2 at 5 hours p.i. Panels 1-4 represent a cell filled with ROs at 5 hours p.i. Panels 5-8 represent a single cell with migrating gRNA and sgRNA-S to the distal end of the cell (yellow arrow heads). (B) Presence of SARS-CoV-2 RNA in the nucleus. The images from a few of the Z-stack of cell are represented to demonstrate the presence of the positive RNA spot inside the nucleus. The Z-stack images were acquired starting from the bottom of the cell moving upwards. The panel numbers represent the stack number in a total of 41 optical sections (each with a 200 nm Z step size). In both A and B, images were acquired using a wide-field microscope to detect the diffraction limited single molecules. The spike RNA P1 probe signals are colored in magenta (sgRNA-S), nsp12 RNA P2 probe signals are colored in green (gRNA) and when P1 and P2 both hybridize to the same molecule, it is shown in white (overlay). Scale bar, 10 μm. DAPI (nucleus, blue).
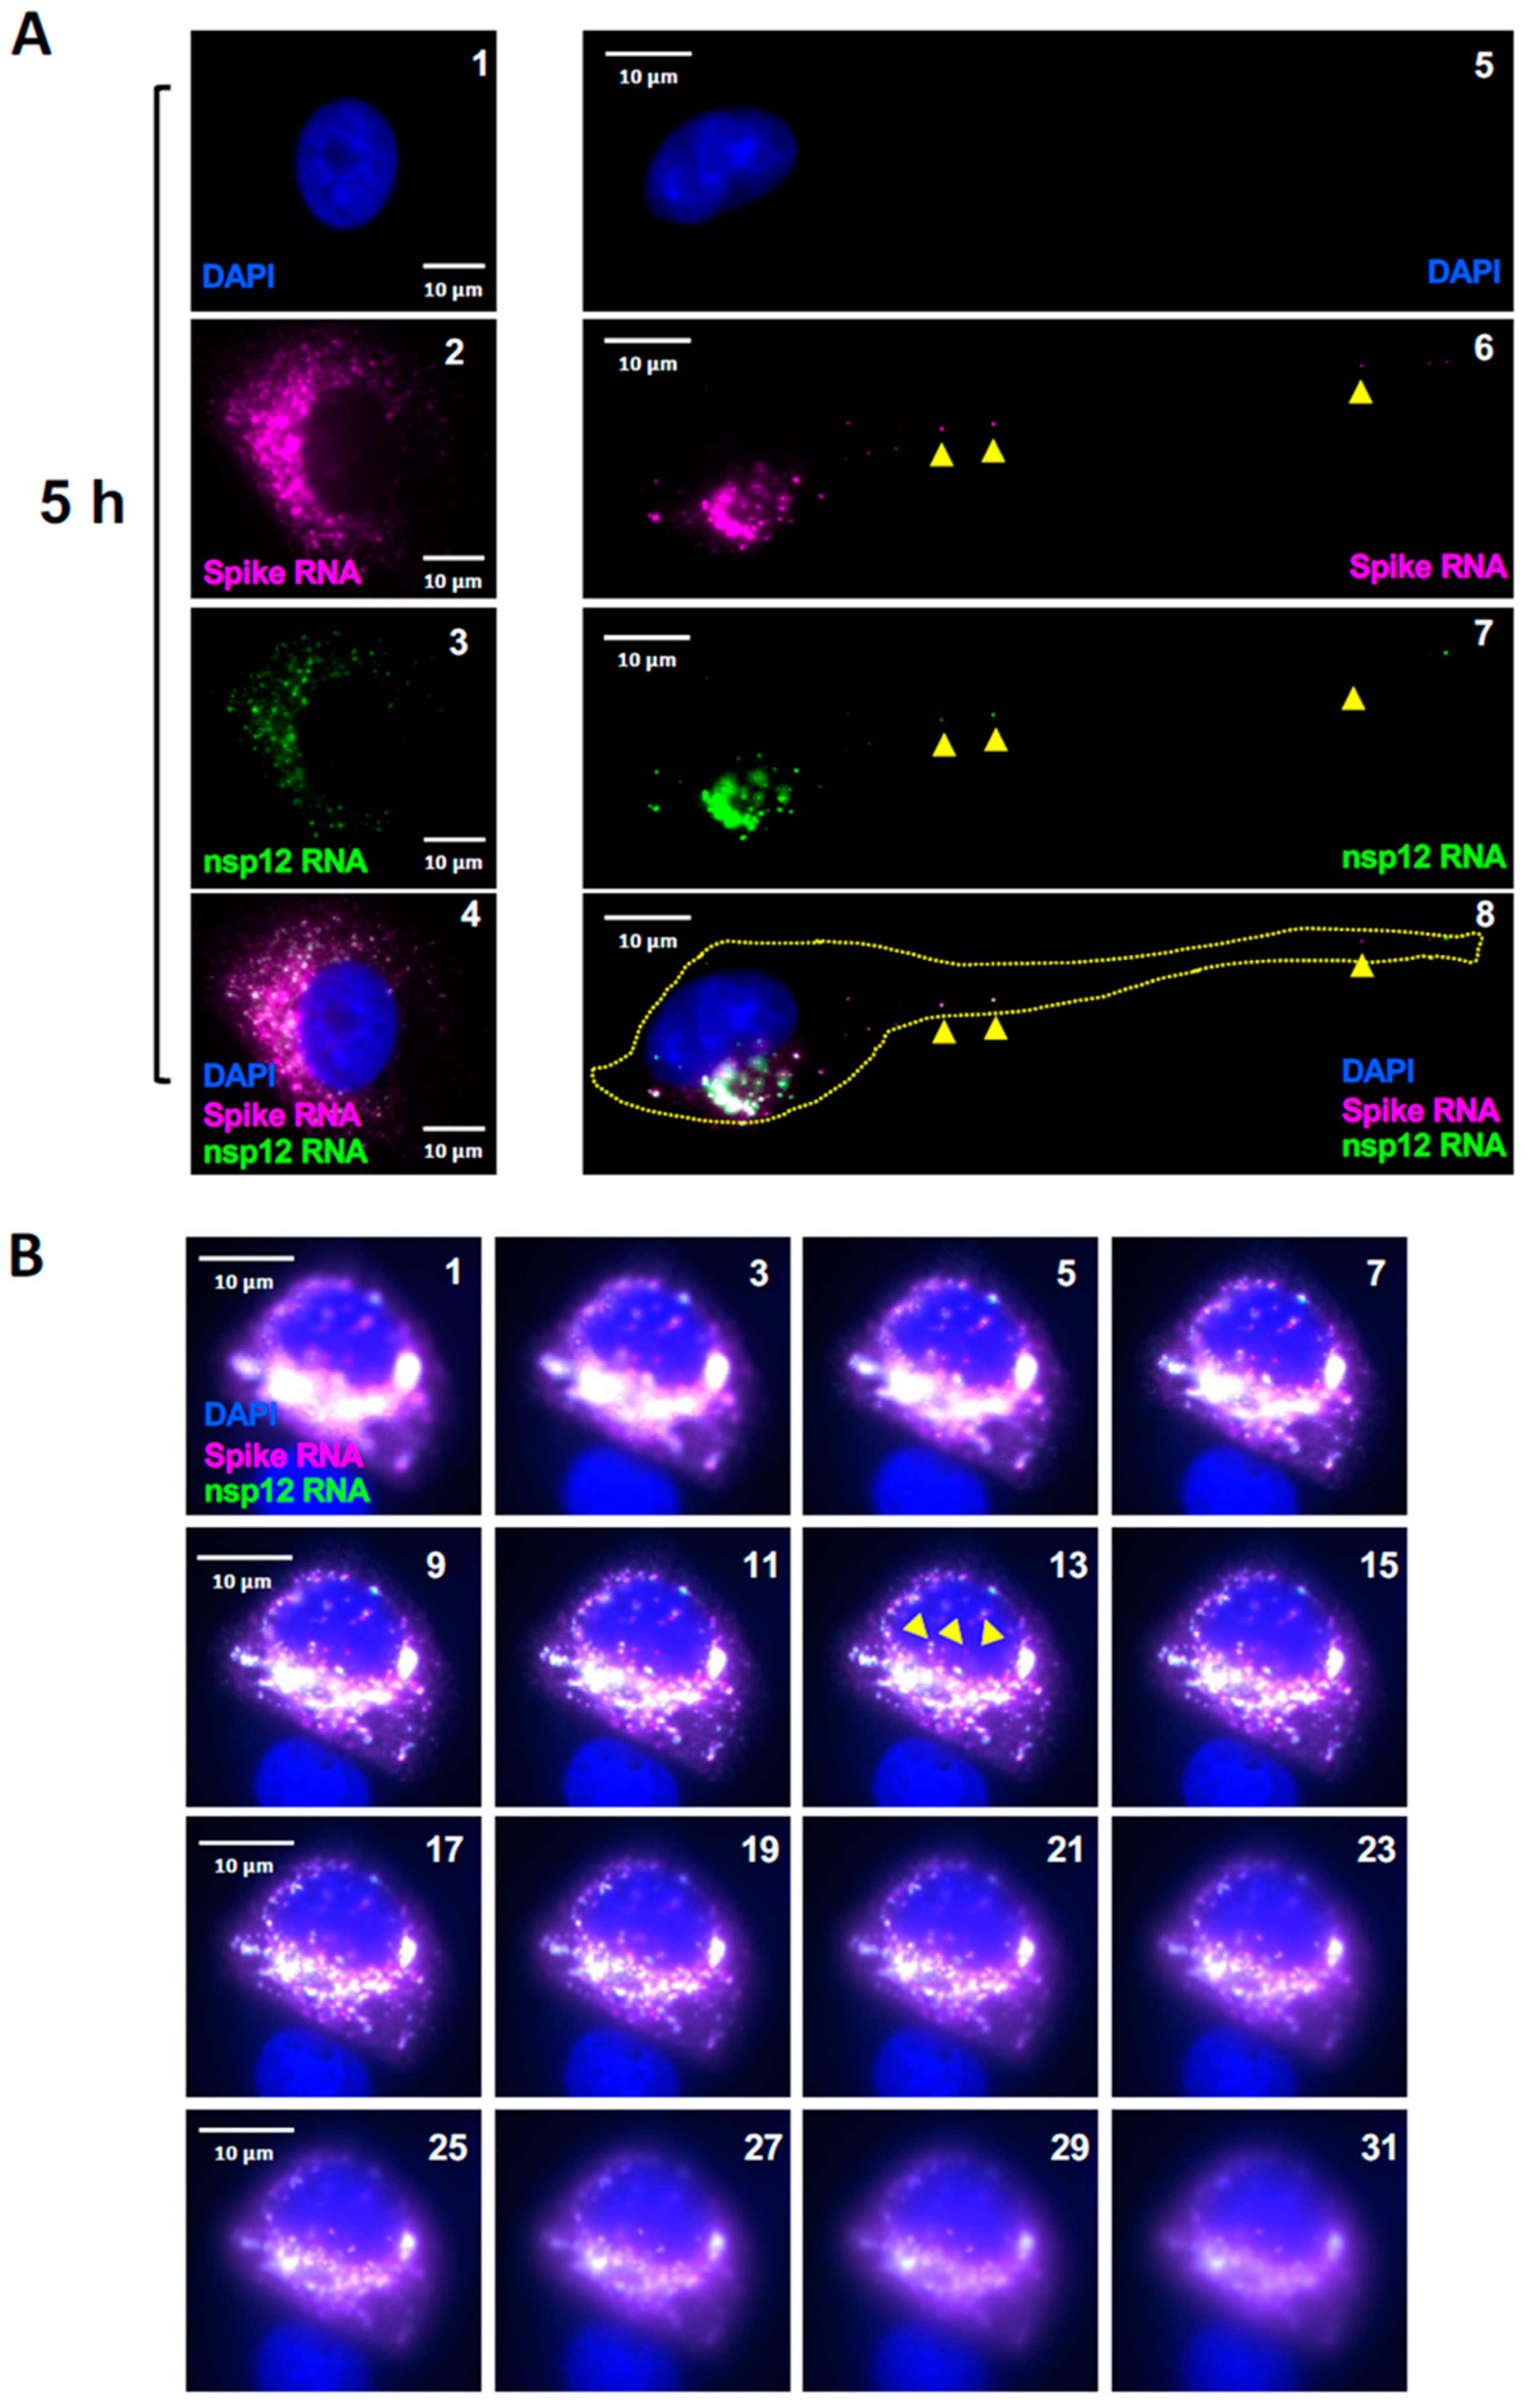
Figure 6.
Co-localization of SARS-CoV-2 RNA speckles with Nsp3 protein. Representative cells showing the co-localization of spike probe P1 and Nsp3 protein within the infected Vero E6 cells with SARS-CoV-2 at 3, 6 and 12 hours p.i., respectively. The images were acquired using a wide-field microscope to detect the diffraction limited single molecules. Blue color represents DAPI nuclear staining; Green color represents Nsp3 protein, magenta color represents SARS-CoV-2 spike RNA. Scale bar, 10 μm. Panels 21-24 show the magnified area of the corresponding images at 3 hours p.i. (Scale bar at 2 μm). White arrows indicate RNA speckles that co-localize with nsp3.
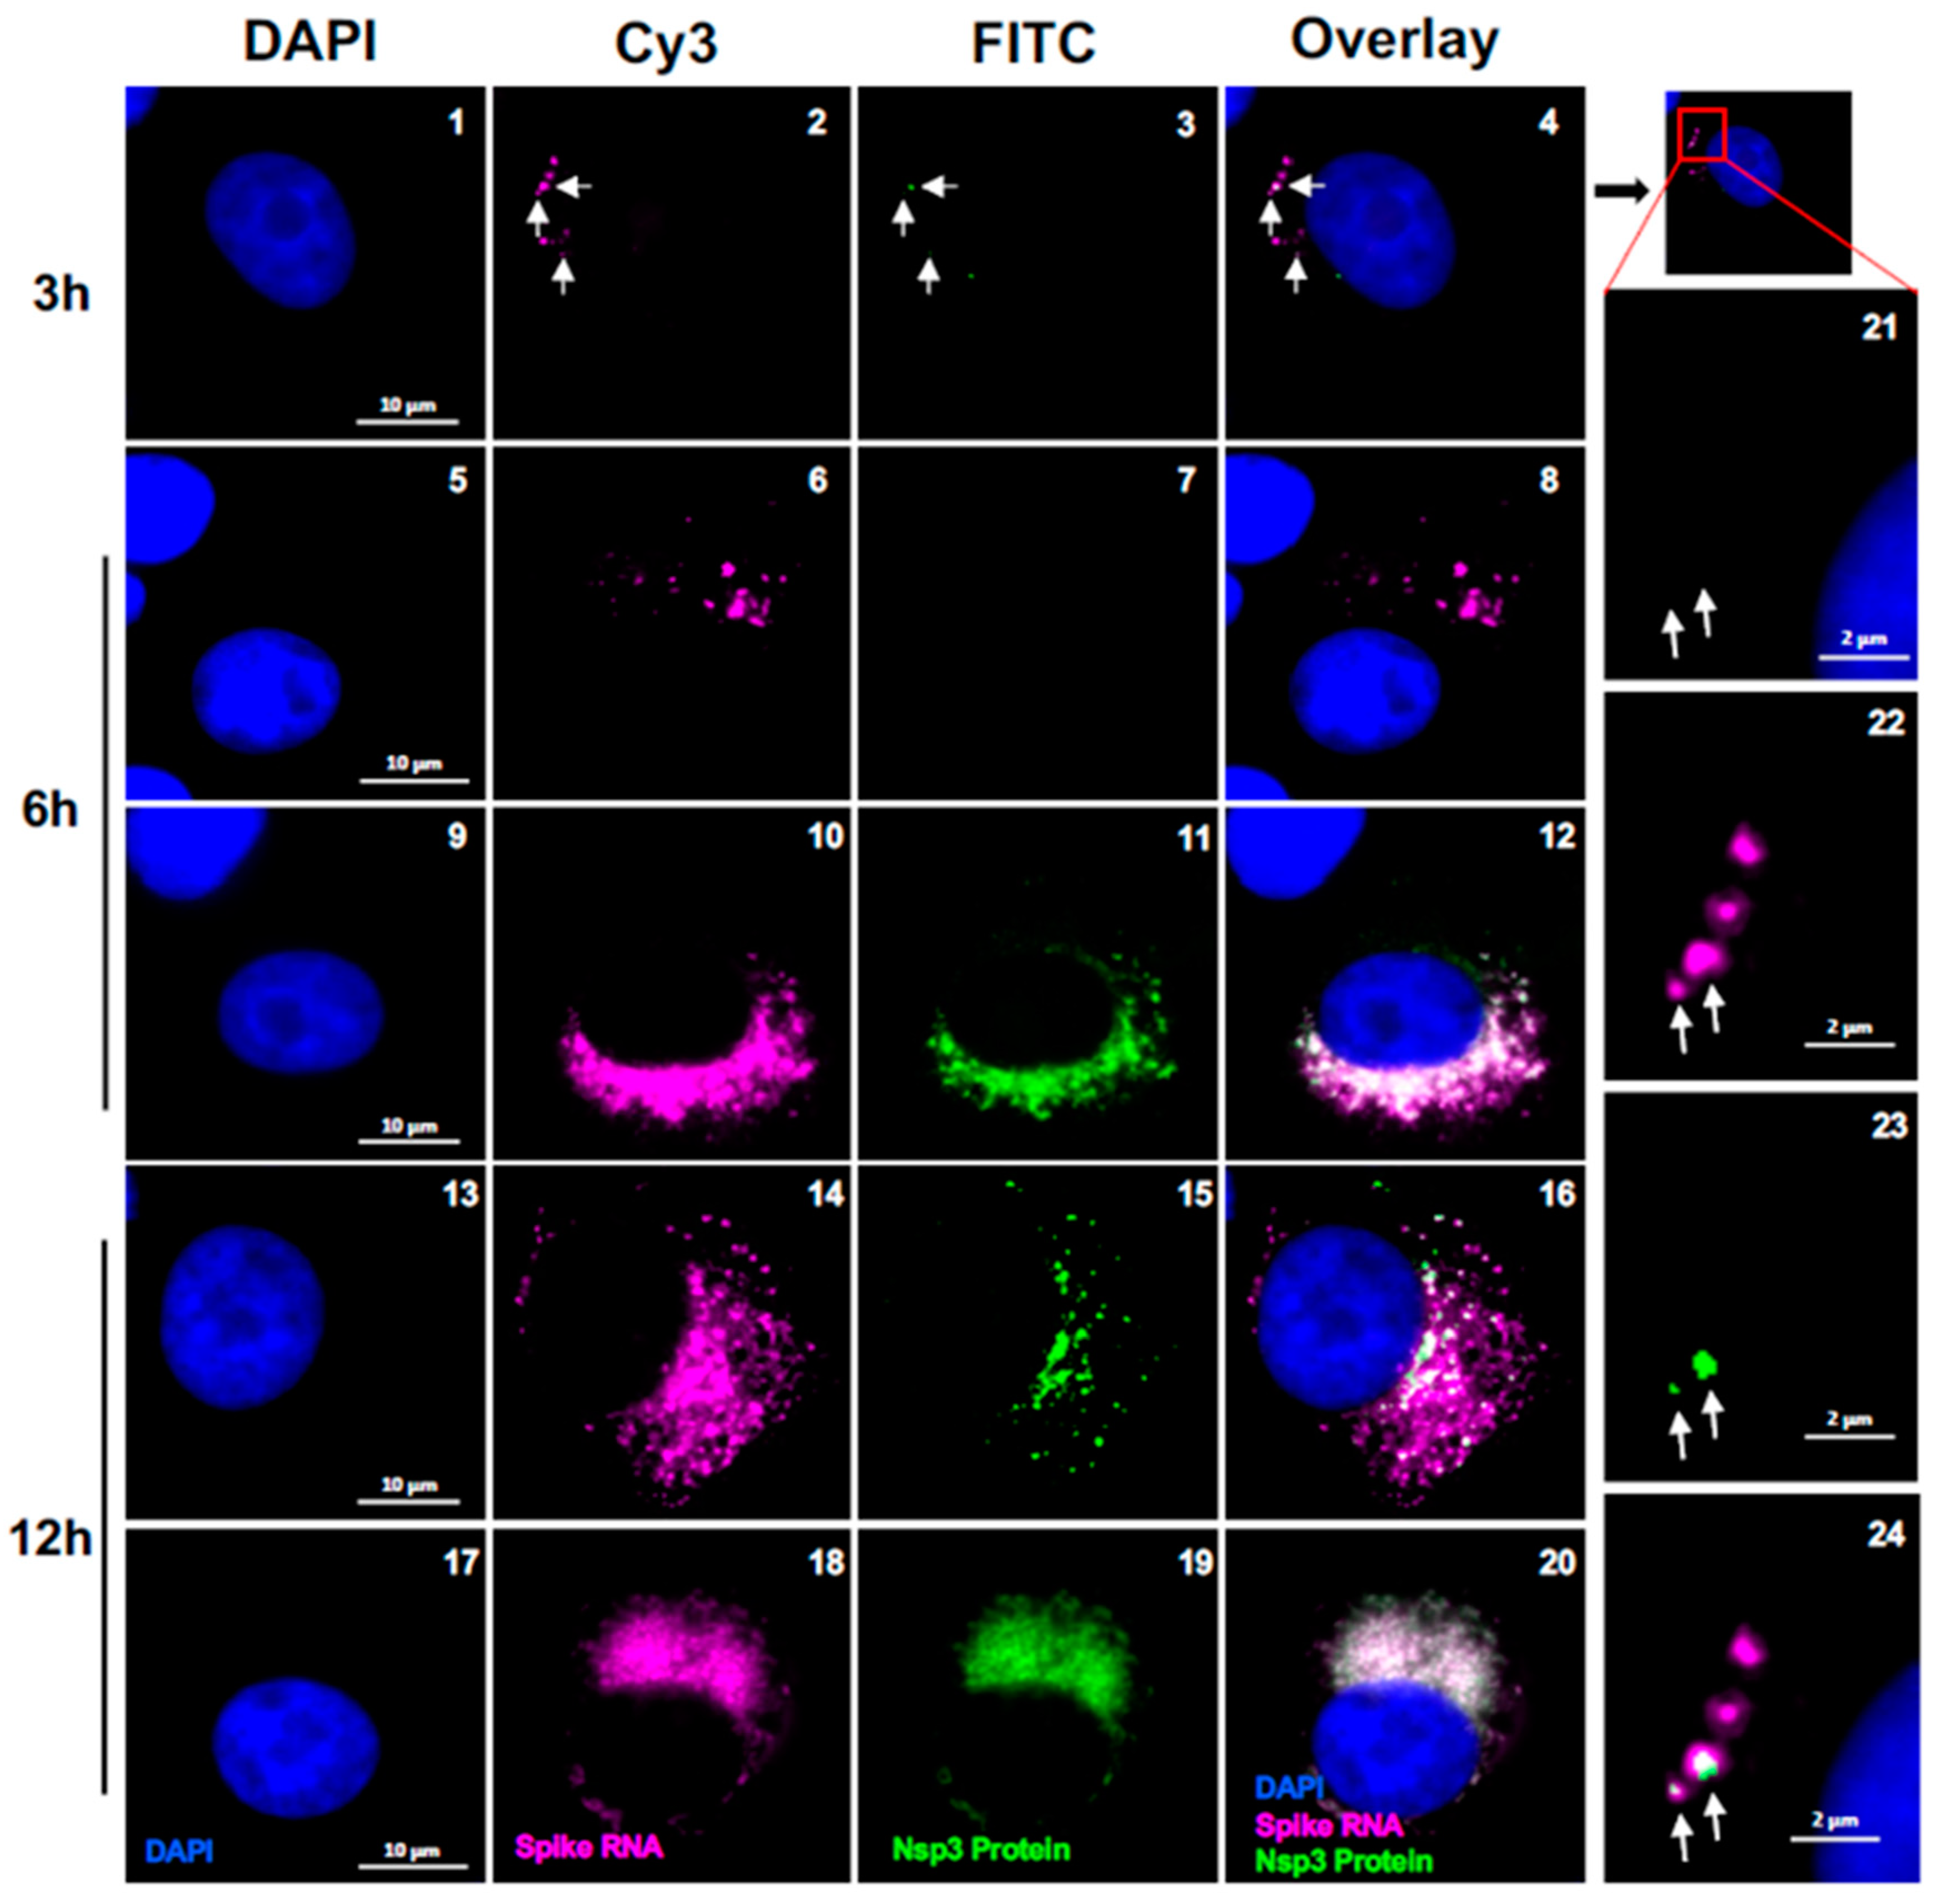
Figure 7.
Quantitation of cells containing viral RNA at different stages of replication. (A) Examples of images of cells with four different stages of viral replication at Stage-1 (panels 1 and 2), Stage-2 (panels 3 and 4), Stage-3 (panels 5 and 6), and Stage-4 (panels 7 and 8). Blue color represents DAPI nuclear staining; and nsp12 RNA (P2 probe) signals are colored in green which represents replication centers containing genomic RNA. Scale bar, 50 μm. (B) Graphical representation of quantitation of percentage of positive cells harboring four different stages of replication at 4, 5 and 6 hours p.i.
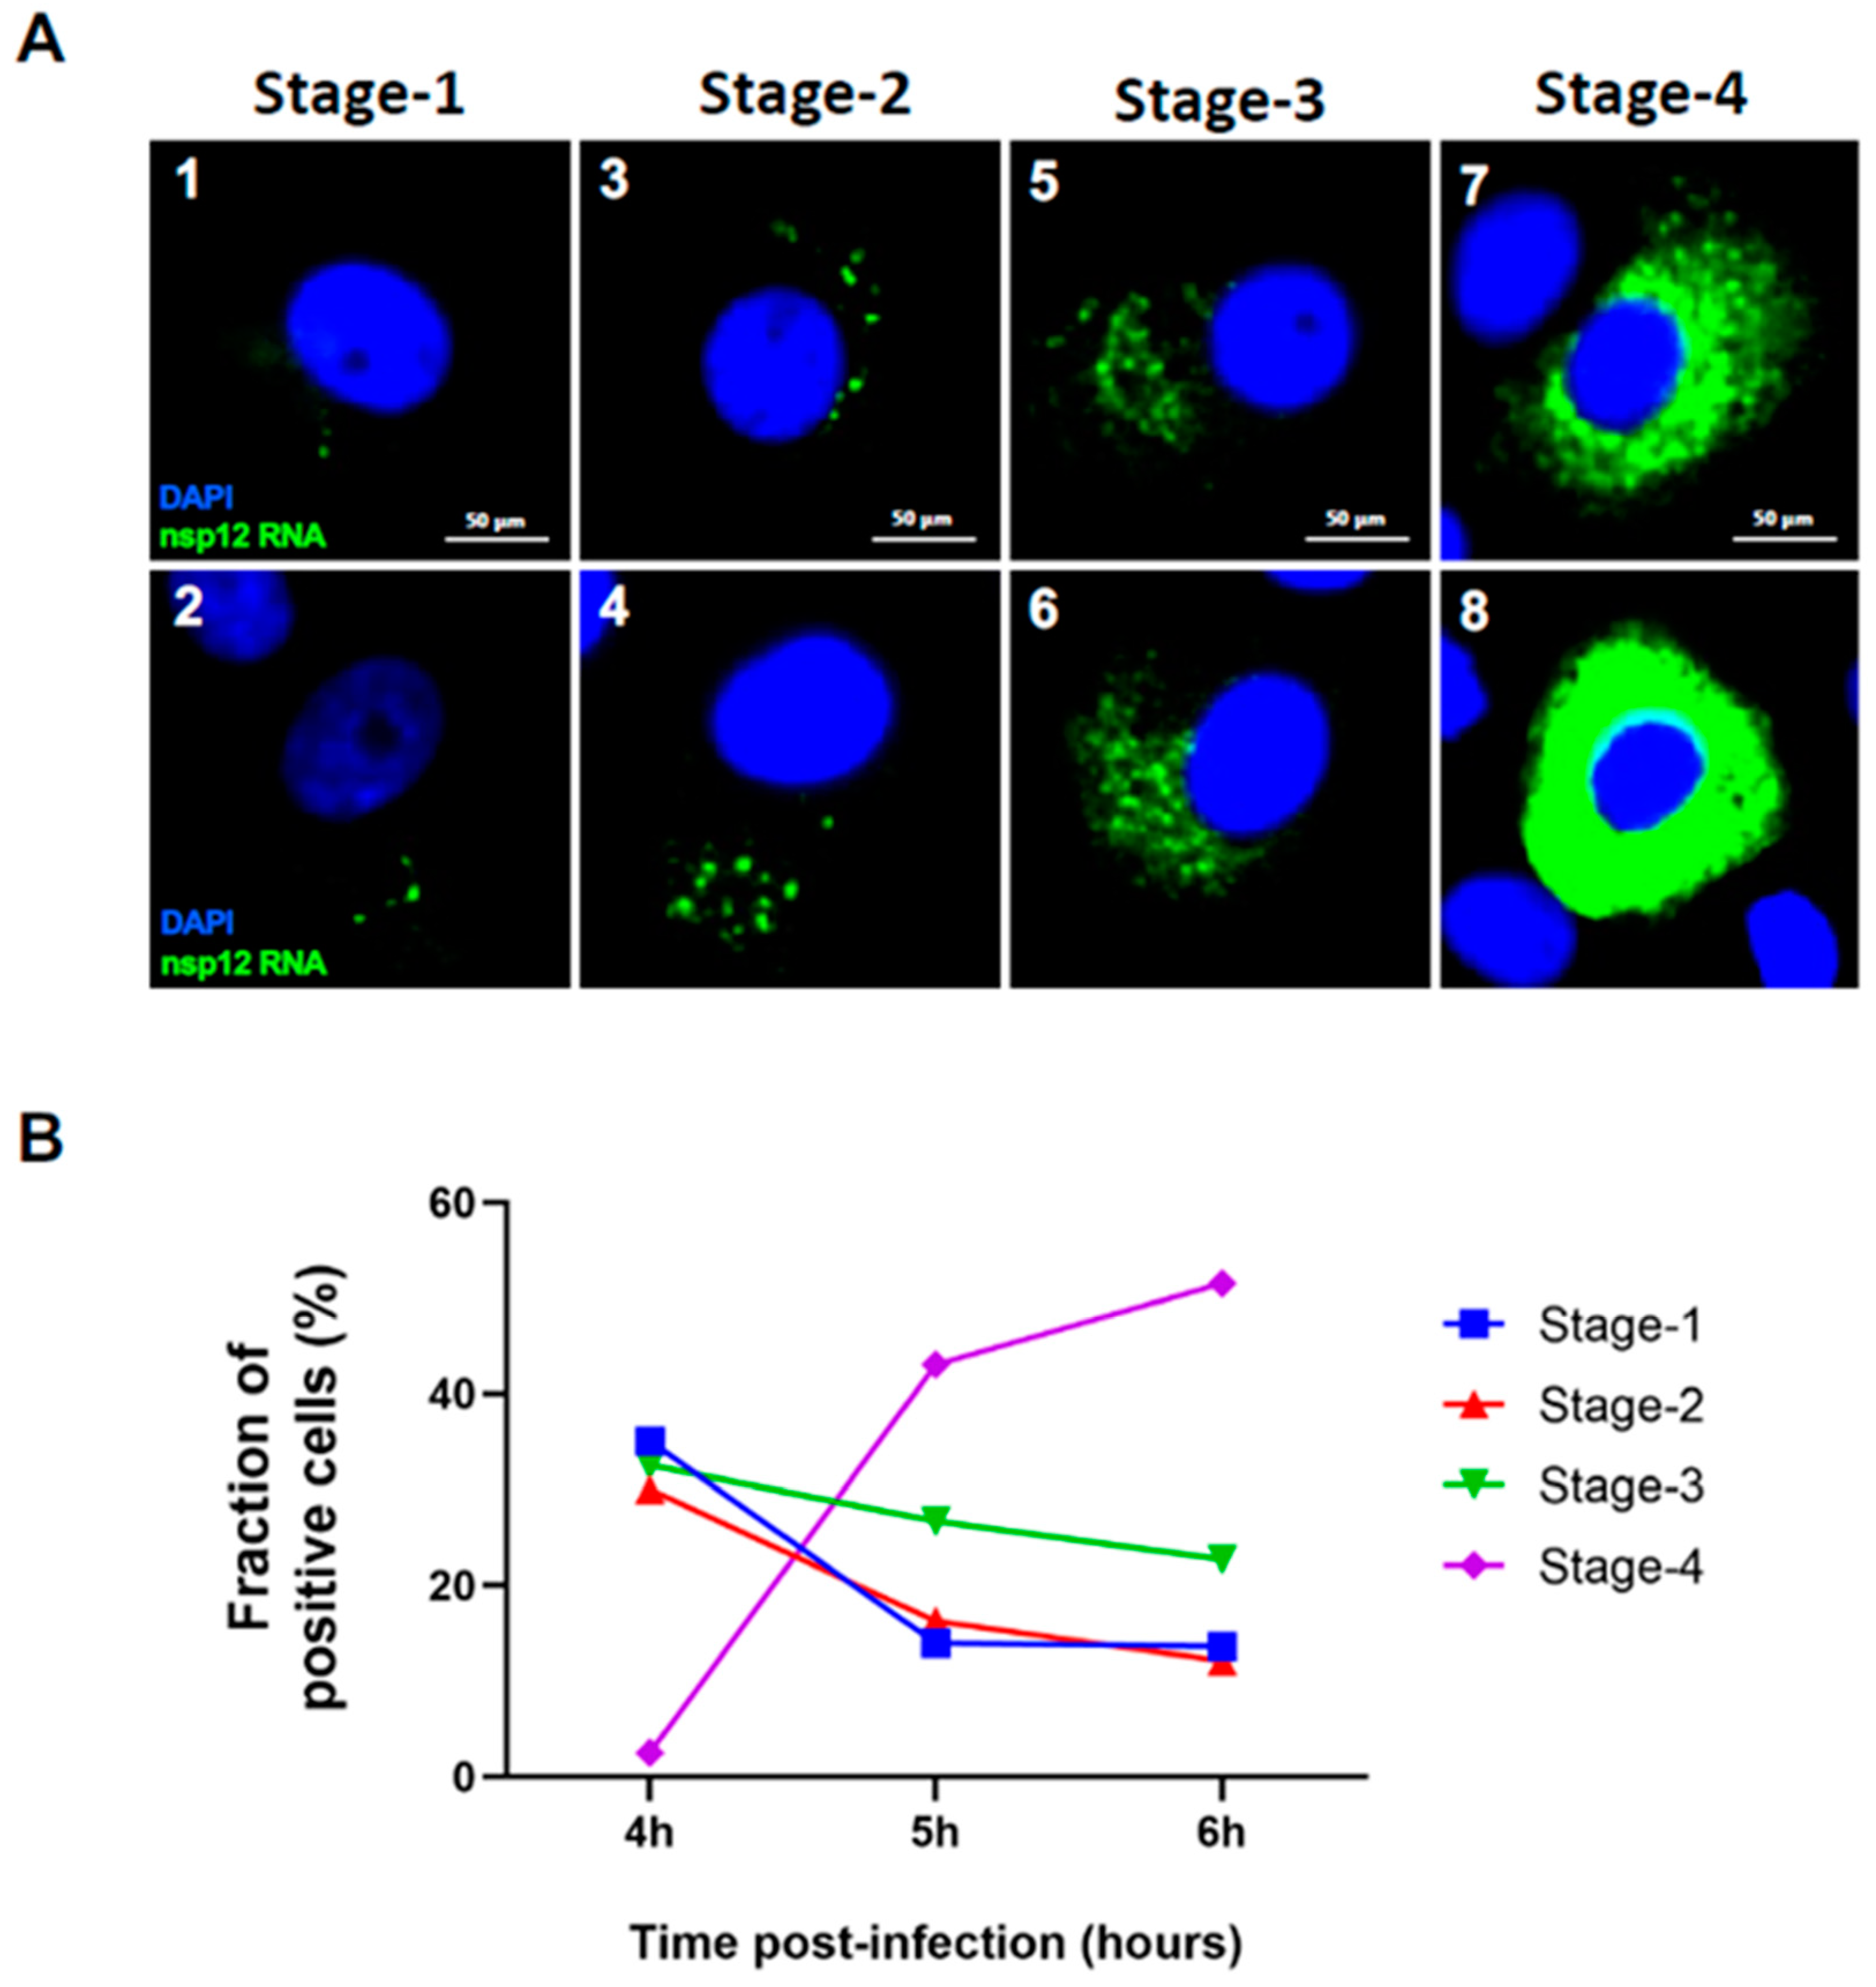
Figure 8.
Ability of SARS-CoV-2 probes to detect variants of concern (VOCs) of SARS-CoV-2. (A) Heatmap representing the probe sequence alignment against various SARS-CoV-2 variants of concern (VOCs) genomes (SARS-CoV-2 B.1.1.7, B.1.351, P.1, B.1.617.2, B.1.1.529, BA.1, BA.2, BA.4, and BA.5) along with SARS-CoV-2 Wuhan-Hu-1. Each column represents individual 22 nt spike gene probe sequences from Spike gene (S1-S40, upper panel, represented in the shades of red) and from nsp12 gene (N1-N40, lower panel, represented in shades of green). The minimum edit distance represents mismatch score between the SARS-CoV-2 Wuhan-Hu-1 gene sequence and the other SARS-CoV-2 VOC’s genome sequences, where ‘0′ indicates a perfect match (in white) and >10 represents the most mismatch (in dark red or green). (B and C) Validation of spike RNA probe P1 and nsp12 RNA probe P2 to simultaneously detect gRNA and sgRNA-S in the Vero-TMPRSS2 cells infected with SARS-CoV-2 BA.1 VOC. Cells were infected at 3h, 6h and 12h, respectively. (B). Panels 2, 4 and 6 indicates infected cells and panels 1, 3, and 5, represent mock infected cells respectively shown at a20x magnification. Panel 7 indicates Vero-TMPRSS2 cells infected with heat-inactivated SARS-CoV-2 BA.1 at 12 hours p.i. under similar conditions. Scale bar at 50 μm. White arrows point to infected cells. (C). Visualization of representative single Vero-TMPRSS2 cells infected with SARS-CoV-2 BA.1 VOCs at 6 hours (Panels 1-8) and 12 hours (Panels: 9-16) post-infection. Scale bar at 20 μm. Magenta = Spike RNA probe P1; Green = nsp12 RNA probe P2; and Blue =DAPI staining.
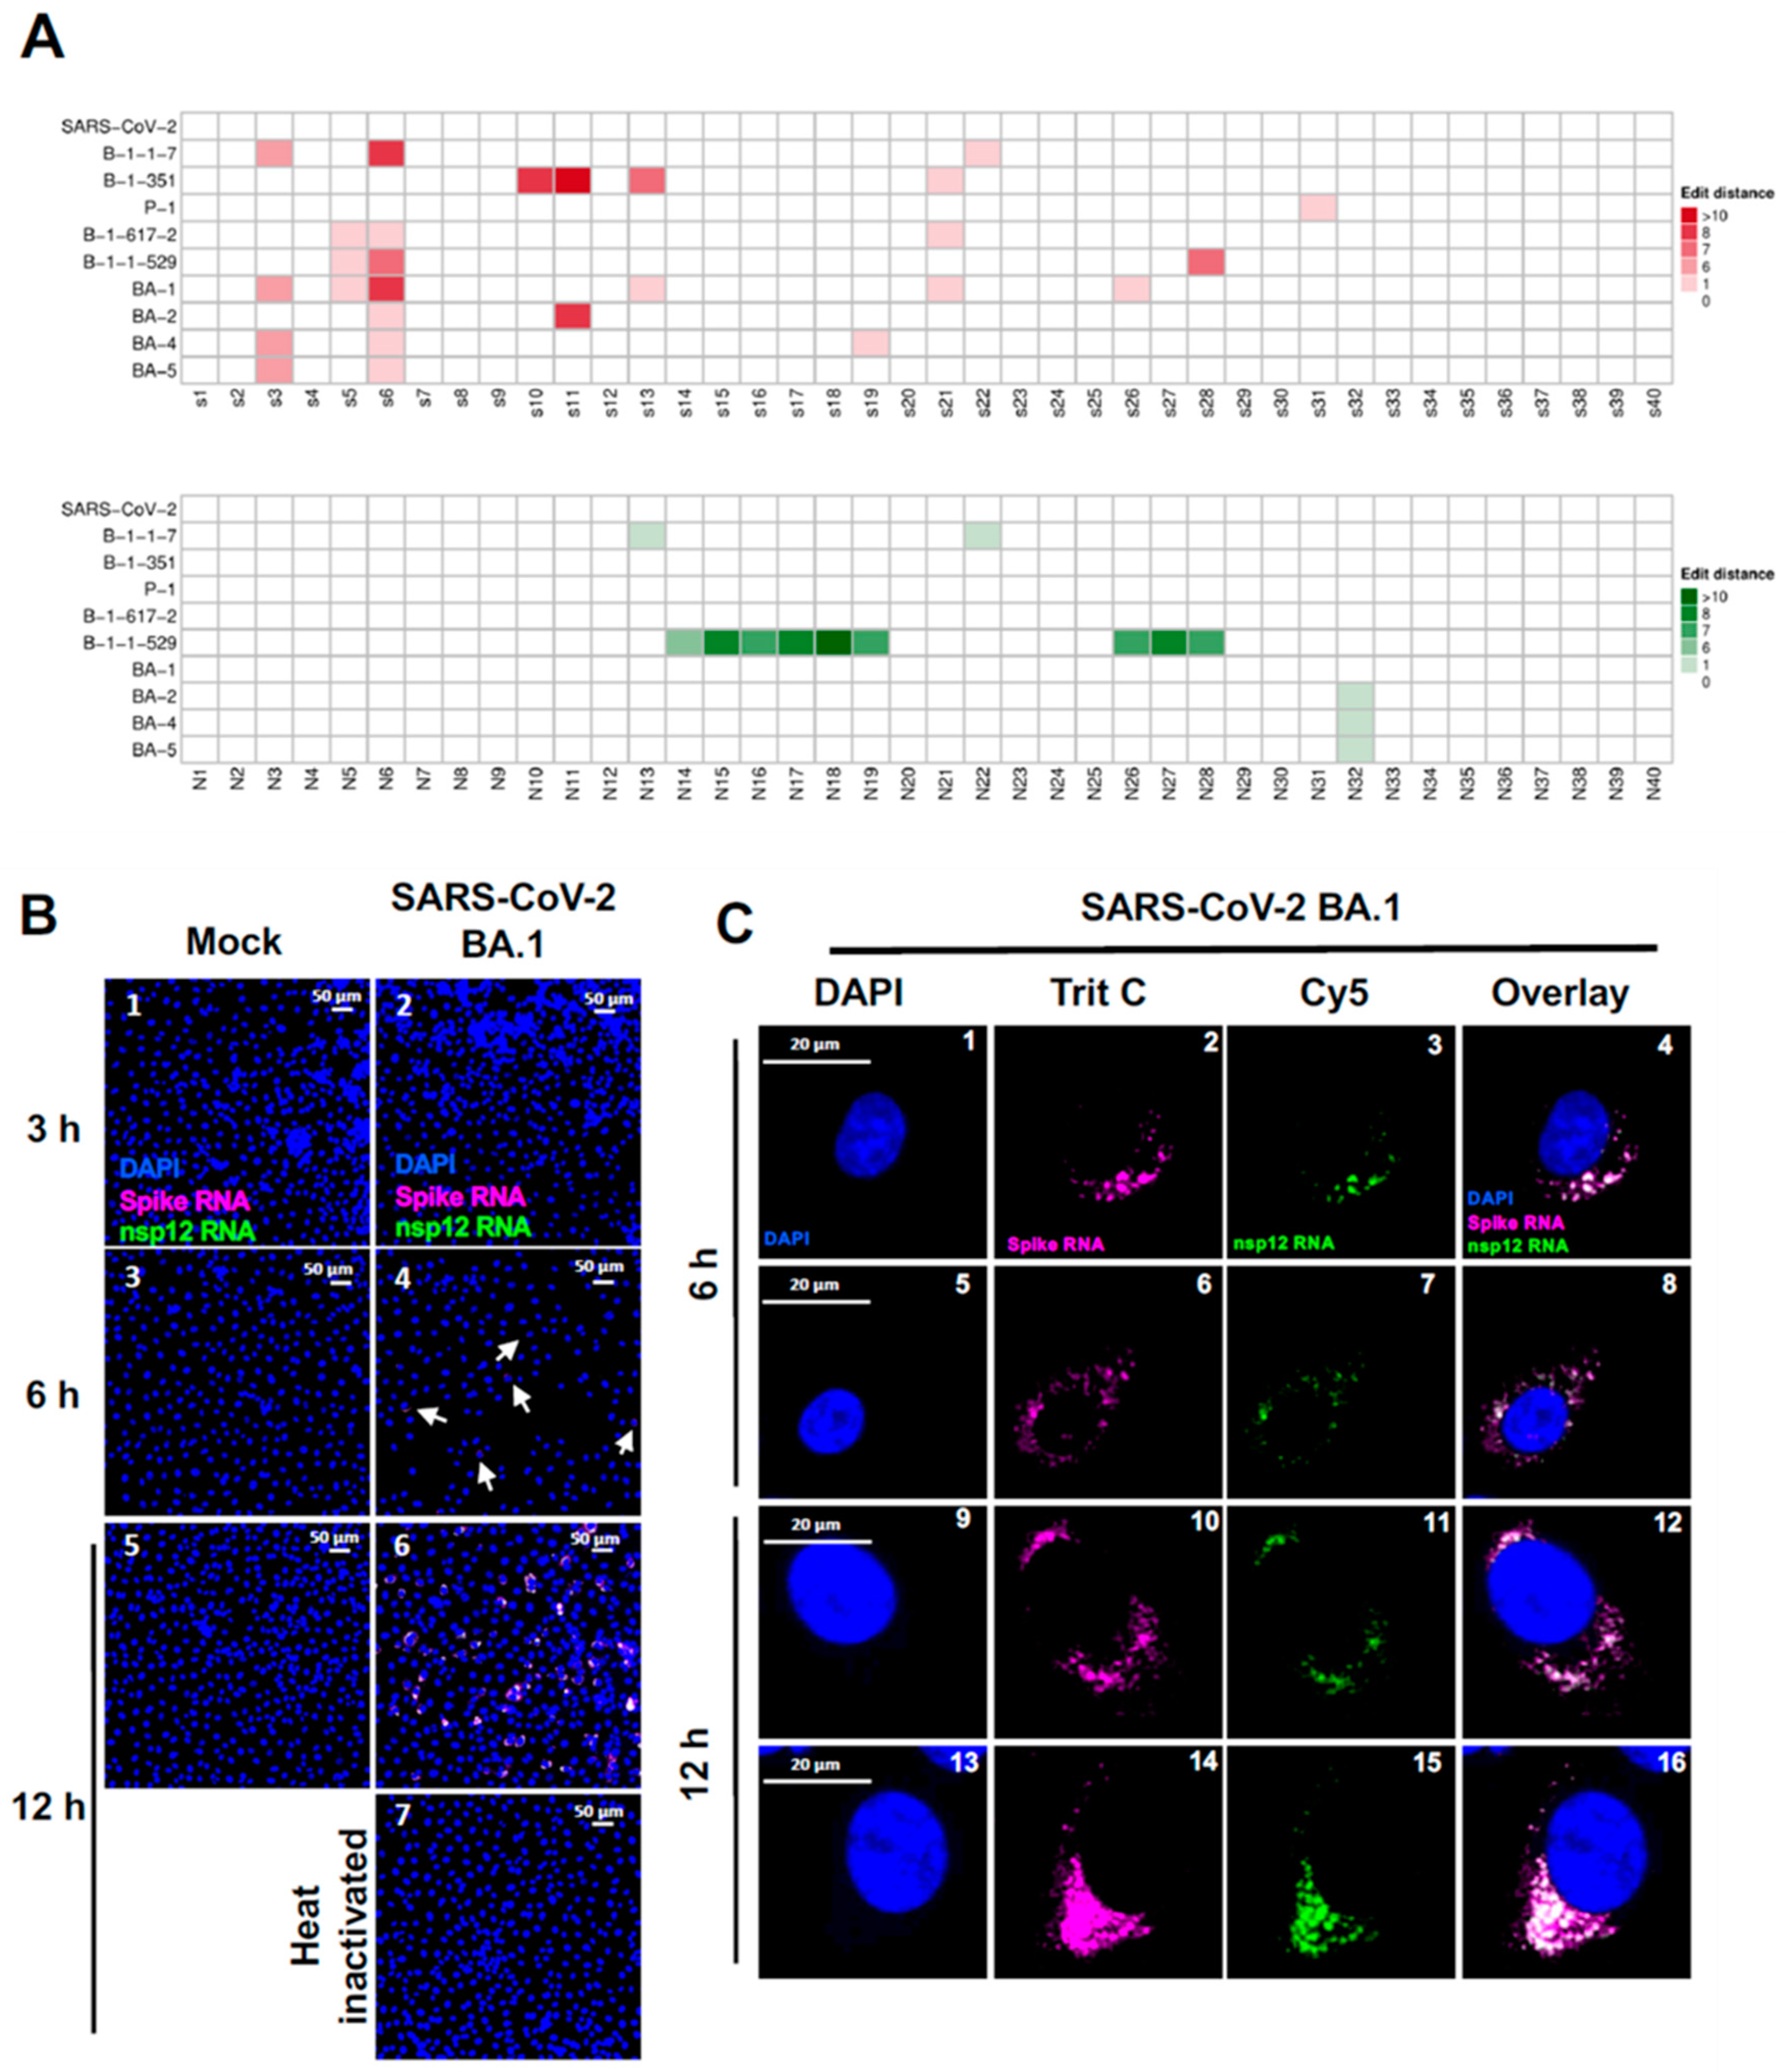

Table 1.
Sequences of SARS-CoV-2 Spike RNA (P1) and nsp12 RNA (P2) probes used for smRNA-FISH analyses.
Table 1.
Sequences of SARS-CoV-2 Spike RNA (P1) and nsp12 RNA (P2) probes used for smRNA-FISH analyses.
| Probe number | smRNA-FISH Spike RNA probe (P1) (5′-> 3′) |
smRNA-FISH nsp12 RNA probe (P2) (5′-> 3′) |
|---|---|---|
| 1 | tgactagagactagtggcaata | gctactttatcattgtagatgt |
| 2 | tttgtcagggtaataaacacca | agttagagaaagtgtgtctctt |
| 3 | atgtatagcatggaaccaagta | aattaccttcatcaaaatgcct |
| 4 | accatcattaaatggtaggaca | ttctacaaaatcataccagtcc |
| 5 | tatgttagacttctcagtggaa | ttttaacaaagcttggcgtaca |
| 6 | tttttgtggtaataaacaccca | agttaccattgagatcttgatt |
| 7 | gtgcaattattcgcactagaat | agaatctacaacaggaactcca |
| 8 | aataggcgtgtgcttagaatat | acatgtgactctgcagttaaag |
| 9 | gcaaatctaccaatggttctaa | ctgtcatccaaacagttaacac |
| 10 | taggttgaagataacccacata | cagcagcatacacaagtaattc |
| 11 | ctacagtgaaggatttcaacgt | gtaatagattaccagaagcagc |
| 12 | agaattccaagctataacgcag | taagtgcagctactgaaaagca |
| 13 | tataattaccaccaaccttaga | aaaattaccgggtttgacagtt |
| 14 | ggcagaaactttttgttagact | caacagaacttccttccttaaa |
| 15 | tgacaccaccaaaagaacatgg | atcctgagcaaagaagaagtgt |
| 16 | tatttgttcctggtgttataac | acgatagtagtcataatcgctg |
| 17 | gttgatctgcatgaatagcaac | ttgtctgatatcacacattgtt |
| 18 | aataaacacgccaagtaggagt | acgatgacttggttagcattaa |
| 19 | cactcatatgagttgttgacat | gaaaaccagctgatttgtctag |
| 20 | atagtgtaggcaatgatggatt | atgcgaaaagtgcatcttgatc |
| 21 | gtaagcaactgaattttctgca | tagtagggatgacattacgttt |
| 22 | agtaaaatttgtgggtatggca | tattctttgcactaatggcata |
| 23 | ggtagaatttctgtggtaacac | ctattggtcatagtactacaga |
| 24 | acttgtgcaaaaacttcttggg | cttgttccaattactacagtag |
| 25 | tggtggtgttttgtaaatttgt | tcacatttaggataatcccaac |
| 26 | aacagtaaggccgttaaacttt | acaagtgaggccataattctaa |
| 27 | agaacattctgtgtaactccaa | gaaacggtgtgacaagctacaa |
| 28 | acttgctgtggaagaaagtgag | atgaccatttcactcaatactt |
| 29 | ggagctaagttgtttaacaagc | acatacttatcggcaattttgt |
| 30 | ttgagtcacatatgtctgcaaa | cactcataaagtctgtgttgta |
| 31 | gacattttagtagcagcaagat | tcacaaagtctgtgtcaacatc |
| 32 | cctttccacaaaaatcaactct | gtcagagagtatcatcattgag |
| 33 | ctgactgagggaaggacataag | actagaccttgagatgcataag |
| 34 | agtcacatgcaagaagactaca | gaaggtacacataatcatcacc |
| 35 | gttgttgacaattcctattaca | atatcatctacaaaacagccgg |
| 36 | tgaagcattaatgccagagatg | gacacgaaccgttcaatcataa |
| 37 | gcggtcaatttctttttgaatg | tagtaagtgggtaagcatctat |
| 38 | taaattcttggcaacctcattg | atgtagctttcttatgtattgt |
| 39 | ttggagatcgatgagagattca | aatacatgtctaacatgtgtcc |
| 40 | gctataaaacctagccaaatgt | gtgtacatagcctcataaaact |
Disclaimer/Publisher’s Note: The statements, opinions and data contained in all publications are solely those of the individual author(s) and contributor(s) and not of MDPI and/or the editor(s). MDPI and/or the editor(s) disclaim responsibility for any injury to people or property resulting from any ideas, methods, instructions or products referred to in the content. |
© 2024 by the authors. Licensee MDPI, Basel, Switzerland. This article is an open access article distributed under the terms and conditions of the Creative Commons Attribution (CC BY) license (http://creativecommons.org/licenses/by/4.0/).
Copyright: This open access article is published under a Creative Commons CC BY 4.0 license, which permit the free download, distribution, and reuse, provided that the author and preprint are cited in any reuse.


