
Submitted:
29 December 2023
Posted:
16 January 2024
You are already at the latest version
Abstract
Soil water infiltration is an important component of the hydrological cycle and it is best evaluated when the raindrop is impacted on the ground surface. For this reason, it is affected by changes in land use and occupation, and by the characteristics and physical-hydric properties of the soil. This study aimed to evaluate soil water infiltration in areas occupied with annual crops (soybean and corn) and pastures, in two watersheds of the Teles Pires River-MT, using simulated rainfall, physical models and principal component analysis. Infiltration rates were evaluated from simulated rainfall with an average intensity of 75 mm h-1, with 4 repetitions per region (upper, middle and lower) of the hydrographic sub-basins of the Caiabi and Renato rivers, and soil use with cover, without cover and disturbed. Soil tillage provided higher water infiltration rates into the soil, especially in pasture areas in the two hydrographic sub-basins. There were significant adjustments of the mathematical models to the infiltration rate data for all land use and land cover conditions. The soil attributes that most interfered with the infiltration rate were microporosity, soil density and total porosity in the crop areas of the middle Caiabi, and microporosity, clay content, total porosity and silt content in the areas farming at the source of the Renato River. The Horton and Philip models presented the best adjustments in the hydrographic sub-basins of the Renato and Caiabi and Renato rivers, being recommended for estimating the rate of water infiltration into the soil in different uses, coverages, and regions.
Keywords:
InfAsper
; simulated rainfall
; soil and water management
; soil and water conservation
; Teles Pires River
; principal component analysis
1. Introduction
A large part of the Brazilian territory is influenced by factors that can lead to soil degradation, such as different forms of contamination, desertification and erosion, mainly associated with changes in soil cover and climatic extremes of precipitation. The changes in land use and occupation also affect hydrological processes, especially those related to water infiltration and surface runoff [1].
Water infiltration into the soil is related to the type of soil, physical properties (texture, porosity, hydraulic conductivity and density), preparation and management of the land, type of vegetation cover, surface roughness, coverings with remaining cultural residues and the water content in the surface layer before rain [2,3]. Soil infiltration capacity offers useful information for water cycling in agricultural systems because it affects both yields (through water availability in the soil) and other ecosystem outcomes, such as pollution and flooding due to surface runoff [4,5,6].
Native or cover vegetation protects the soil, favoring infiltration, as in addition to cushioning the impact of raindrops, it favors the creation of preferential paths originated by root development [7]. Infiltration is also influenced by the water content in the soil profile, precipitation time, erosivity and rainfall pattern [8], soil structure, use and occupation [9], organic matter content [10] and slope, being considered one of the most important parameters for irrigation planning in agricultural production areas [11]. Thus, adopting sustainable management must be based on using techniques that favor water infiltration into the soil, minimizing surface runoff and soil and water losses [4,6].
Water infiltration into the soil can be quantified using different methods, although the concentric ring method is widely used. Sprinkler infiltrometers are more suitable for studies related to soil use and management, as by simulating natural rain, they provide a better representation of the impact of drops and the disaggregation of surface soil particles [12]. Among the different types/models of sprinkler infiltrometers [13], the InfiAsper model [14] is one of the most used equipment in Brazil to simulate rainfall and has been used in erosion, infiltration and runoff studies [3,8,15,16,17].
Studies modeling infiltration rates in different land uses and occupations in the Amazon/Cerrado ecotone are scarce. In this sense, this research can contribute significantly to the knowledge of the effects of changes in land use and occupation on water infiltration into the soil, such as pasture management and conservation, direct planting system and minimum disturbance in soil preparation [7]. Furthermore, using multivariate statistical analyses that associate the physical attributes of the soil with infiltration can help in observing which factors have the greatest influence on water infiltration into the soil [18]. Among the different statistical techniques used in studies linked to soils, main component analysis – ACP [19,20,21,22,23,24,25]. Together with estimates of the infiltration rate obtained by mathematical models, these analyses can contribute to the implementation of soil and water management and conservation techniques, which promote the reduction of soil and water losses in crops and pastures in the North of Mato Grosso, a region with a predominance of Amazon Rainforest and great agricultural expansion.
The objective of this study was to evaluate water infiltration into the soil in areas occupied by annual crops and pastures, in two sub-basins of the Teles Pires-MT river, using simulated rainfall, physical models and analysis of main components.
2. Materials and Methods
2.1. Study area
The study was conducted in two regions of the Teles Pires river basin, located in the north of the state of Mato Grosso, Brazil. The Caiabi River sub-basin (500 km2) is located in the upper Teles Pires region, while the Renato River sub-basin (1,450 km2) is located in the middle Teles Pires and is part of the Amazon biome (Figure 1).
The two river sub-basins have different geomorphological, geological, and pedological characteristics, with the typical dystrophic Red-Yellow Oxisol, medium texture and depth, is the predominant soil class [26]. The Caiabi River sub-basin is inserted in the Cerrado-Amazonia ecotone, with a predominance of monocultures of soy and corn, in succession with emerging cotton production, while in the Renato River sub-basin, native forests (Amazon Forest) predominate, with pasture expansion, followed by soybean production and succession with corn [17,25].
The region’s climate is type Aw according to the Köppen classification [27]. The average annual temperature is 25 ºC, with a minimum below 16 ºC and a maximum above 34 ºC. Average annual precipitation varies around 1,950 mm.
2.2. Treatments and experimental organization
Soil water infiltration tests were carried out in pasture and crop areas, in the upper, middle and lower regions of the two sub-basins, in accordance with the regional agricultural calendar [17]. These land uses were chosen due to the widespread growth of agriculture and livestock in the Teles Pires river basin, concomitantly with the pressure on local biodiversity. Due to the high number of field tests, the areas occupied with crops in the Caiabi sub-basin showed soybean (Glycine max L.) cultivation at the V7 vegetative stage, with and without corn straw (conventional planting and direct planting systems); In the Renato River sub-basin, the crop areas were occupied by corn (Zea mays L.), at vegetative stage V4, in the Renato River sub-basin. The pasture areas in the two sub-basins presented similar conditions, occupied with Brachiaria with an average height of 50 cm. The simulated rainfall in the two sub-basins was applied considering the following treatments: covered soil (with vegetation - CS), without covered soil (removal of plant biomass – crop or pasture - WCS) and soil with disturbance at 0.10 m in depth (SD). This depth was adopted depending on the size of the plot and so that it would not affect the collection of surface runoff. The simulated rains were carried out consecutively, at the same experimental point, considering the sequence above, according to [17]. The soil was turned over manually, after the end of the tests on the plots without cover.
The rains were applied with the InfiAsper simulator [14], and the surface runoff was evaluated in a 0.70 m² (1.0 x 0.7 m) collecting plot installed in areas with medium slopes. of 3rd. Based on the region’s IDF relationship (Sabino et al., 2020) [28], the simulator was adjusted to apply rainfall with an average precipitation intensity (IP) of 75 mm h-1, considering events with a 10-year return period and 42 42-minute average duration.
After installing the runoff collection plot and starting the tests, the ground surface was moistened (pre-wetting) to standardize soil moisture conditions [3,17]. After the flow began, collections were carried out at 1-minute intervals, with the volume of water quantified in graduated cylinders. Considering the area of the collecting plot (0.70 m2), the volume data were transformed into a drained layer, making it possible to determine the infiltrated layer in the same interval based on the difference in the precipitated layer.
In each treatment, the plant mass was characterized by removing the covering close to the ground and subsequently drying in an oven at 65 ºC to obtain the dry mass. Deformed and unformed soil samples were collected close to the simulated rainfall plots, in the 0-10 cm layer (Table 1) to characterize the following attributes: granulometry (sand, silt and clay), soil density, particle density, total porosity, macro and micro porosity and hydraulic conductivity, according to methodologies presented by Teixeira et al. [29].
2.3. Soil water infiltration models
Using the DataFit software (version 9.0.59), the infiltration rate values were adjusted to the Kostiakov-Lewis (K-L) [30,31], Horton [32,33] and Philip [34,35] models, represented by Equations 1, 2 and 3, respectively:
where: Ri = infiltration rate; Rio = initial infiltration rate; and Rif = final infiltration rate.
Ri = Rif + αkRα-1
Ri = Rif + (Rio – Rif) e-βT
Ri = b + 1/2 k R-0.5
The initial and final infiltration rates were calculated by averaging the first three and last three values obtained in each test. The infiltration models were evaluated using the coefficient of determination (R2), Mean Quadratic Error (MSE) and Nash-Sutcliffe Efficiency (NSE). The NSE varies between −∞ and 1.0 (inclusive), with NSE = 1 being the ideal value, while MSE values equal to 0 indicate perfect fit [36,37].
2.4. Statiscal analyses
The experimental arrangement of assessment points for water infiltration into the soil in both sub-basins was 3 x 3, considering three basin regions (source, middle and mouth) and 3 soil coverage/management conditions (covered soil, soil without cover, soil without cover + turning), with 4 repetitions, totaling 144 tests. The initial and final infiltration rate data were subjected to the Kruskal-Wallis test at 5% probability using the Statistica version 14.0 program. Using the same program, Principal Component Analysis (PCA) [18] was carried out to evaluate the influence of physical attributes and soil cover/management on stable infiltration rates (Tif) in the different regions and sub-basins, considering treatments with and without coverage. The PCA did not evaluate soil disturbance treatments because this soil management condition alters the values of the attributes presented in Table 1.
3. Results
3.1. Physical characterization of the soil
The physical characterization of the soil and dry mass of crops and pastures in the sub-basins of the Caiabi and Renato Rivers are presented in Table 1. The region at the source of the sub-basin of the Caiabi River has a higher clay content in the agricultural and pasture areas, with a predominance of sand in the middle and at the mouth.
3.2. Initial and final infiltration rate
The initial (Tio) and final (Tif) infiltration rates in different coverage/management conditions and regions of the Caiabi and Renato River sub-basins showed higher infiltration values at the beginning of runoff collection than the final (Table 2). Even with initial moistening (pre-wetting), the soil pores in the subsurface layers were empty, filled by the infiltrated layer during rain, resulting in reduced infiltration and increased surface runoff.
3.3. Principal component analysis (PCA)
Principal component analyses of the disturbed plots were not carried out in both river basins since the soil structure was altered, and the undisturbed samples would not represent the real condition of the soil at the time of precipitation. Furthermore, parameters such as total porosity, particle density and hydraulic conductivity were not used in the PCA because they were superimposed in all figures with microporosity, total sand and stable final infiltration rate, respectively.
Regarding the grouping of treatments and regions of the sub-basins (Figure 2 and Figure 3), it is observed that all regions of the sub-basin of the Caiabi and Renato Rivers were in different quadrants, highlighting the difference between these regions, especially the physical attributes of the soil. This indicates that the upper, middle and lower soil attributes are not similar in all soil attributes, thus not belonging to the same group.

Table 3.
Summary of the main components of physical attributes and final water infiltration rate into the soil in crop and pasture areas, with and without cover in the Caiabi River sub-basin.
Table 3.
Summary of the main components of physical attributes and final water infiltration rate into the soil in crop and pasture areas, with and without cover in the Caiabi River sub-basin.
| Principal component | CCSSoy | CCSPast | CWSSoy | CWSPast | ||||
|---|---|---|---|---|---|---|---|---|
| PC 1 | PC 2 | PC 1 | PC 2 | PC 1 | PC 2 | PC 1 | PC 2 | |
| Eigenvalues | 4.910 | 2.080 | 3.750 | 3.240 | 5.350 | 1.640 | 4.310 | 2.680 |
| Variation % | 70.160 | 29.830 | 53.610 | 46.390 | 76.510 | 23.490 | 61.600 | 38.390 |
| Attribute | Correlation | |||||||
| Sand | -0.984* | 0.178 | -0.258* | -0.076 | -0.999* | 0.051 | -0.186* | 0.031 |
| Clay | 0.956* | -0.295 | 0.254* | 0.092 | 0.985* | -0.170 | 0.184 | -0.104 |
| Silt | 0.993* | -0.121 | 0.264* | 0.040 | 0.990* | 0.007 | 0.187* | 0.004 |
| Micro | -0.274 | 0.962* | 0.135 | -0.265* | -0.395 | 0.919* | -0.074 | 0.559* |
| Macro | -0.609 | -0.794 | -0.205 | 0.197 | -0.502 | -0.865* | -0.094 | -0.526* |
| Bd | -0.991* | 0.130 | -0.072 | -0.2966* | -0.990* | 0.003 | -0.187* | 0.002 |
| Rif | -0.785* | -0.620 | -0.004 | -0.308* | -0.990* | -0.144 | -0.185* | -0.088 |
Micro – microporosity; Macro – macroporosity; Bd – soil density; Rif – final infiltration rate; CCSSoy – Caiabi with soybean cover; CCP – Caiabi with pasture cover; CWSSoy – Caiabi in a without soybean cover area; CWSPast – Caiabi in a without pasture area.
Table 4.
Summary of the main components of physical attributes and final water infiltration rate into the soil in crop and pasture areas, with and without cover in the Renato River sub-basin.
Table 4.
Summary of the main components of physical attributes and final water infiltration rate into the soil in crop and pasture areas, with and without cover in the Renato River sub-basin.
| Principal component | RCSCorn | RCSPast | RWSCorn | RWSPast | ||||
|---|---|---|---|---|---|---|---|---|
| PC 1 | PC 2 | PC 1 | PC 2 | PC 1 | PC 2 | PC 1 | PC 2 | |
| Eigenvalues | 5.720 | 1.270 | 4.47 | 2.520 | 4.880 | 2.110 | 4.480 | 2.510 |
| Variation % | 81.810 | 18.190 | 63.990 | 33.010 | 69.830 | 30.170 | 64.030 | 35.960 |
| Attribute | Correlation | |||||||
| Sand | 0.975* | 0.223 | -0.984* | -0.177 | 0.930* | 0.367 | -0.728* | -0.068 |
| Clay | -0.821* | -0.570 | 0.938* | 0.347 | -0.726 | -0.688 | 0.638* | 0.176 |
| Silt | -0.936* | 0.352 | -0.242 | -0.970* | -0.978* | 0.207 | -1.116 | -3.260* |
| Micro | -0.528* | 0.849 | 0.629 | -0.777 | -0.650 | 0.760 | 15.968* | -23.576 |
| Macro | -0.996* | -0.092 | -0.971* | -0.237 | -0.971* | -0.241 | -49.408* | -7.670 |
| Bd | -0.989* | 0.150 | -0.485 | 0.874* | -0.990* | -0.001 | -3.593 | 8.025* |
| Rif | -0.989* | -0.150 | 0.999* | -0.052 | -0.417 | 0.909* | 0.089 | –0.003 |
Micro – microporosity; Macro – macroporosity; Bd – soil density; Rif – final infiltration rate; RCSSoy – Renato with corn cover; RCP – Renato with pasture cover; RWSSoy – Renato in a without corn cover area; RWSPast – Renato in a without pasture area.
3.4. Infiltration models
Table 5 and Table 6 show the models with the best adjustments for each treatment in the Caiabi and Renato Rivers sub-basins. In general, the R2, RMSE and NSE values indicated satisfactory model adjustments for estimating the water infiltration rate into the soil. Horton and Philip’s models were better fitted. Almeida et al. [3] evaluated the efficiency of these models in estimating infiltration rates at different levels of vegetation cover under simulated rainfall in Argisols, with results similar to those obtained in this research.
4. Discussion
The physical characterization of the soil highlights the occurrence of spatial variation in attributes in both river basins. The attributes soil density and particle density in the crop area are lower than the mean, and mouth and particle density in the mean in the pasture area follow the same behavior as the spring and the mouth. On the other hand, there was a predominance of sand in the Renato River basin, with the lowest value (73.9%) at the mouth in the agricultural area. There was no significant difference in the dry mass of crops and pasture, except for corn crops in the middle and east of the Renato River, both with little straw from the previous crop in the soil. Soil characteristics such as texture (total sand, clay and silt) and particle density are related to the geology and geomorphology of the region where the soils were formed. In this sense, in the upper Teles Pires, where the studied areas of the Caiabi River sub-basin are located, the most recurrent soil classes are Red-Yellow Oxisols and Quartzarene Neosoils [16,24,37], formed from metasedimentary rocks belonging to the Cuiabá Group and the Raizama and Araras Formations (Alto Paraguai Group) being the fine sandstones of the Bauru Group, Cretaceous sedimentary rocks (sandstones and conglomerates) belonging to the Parecis Group and Cenozoic detritolaterite covers [38]. On the other hand, the middle Teles Pires, where the Renato River sub-basin is located, presents a pedological characterization with Red-Yellow Oxisols, Litholic Ne-osols, Quartzarene Neossolos and Plintossolos [16,37] formed from granitic and rhyolitic rocks of the Juruena Magmatic Arc, with several gold-bearing occurrences: sandstones from the Dardanelos Formation and the Benefficient Group, sandstones, siltstones and mudstones from the Alto Tapajós Basin (Capoeiras Formation) (EPE, 2009) [38]. This justifies the predominance of Sand in the middle and mouth of the Caiabi River sub-basin and practically throughout the Renato River basin.
Regarding infiltration (Table 2), the smallest amplitude between the initial and final rates was observed in areas with pasture in disturbed conditions, in both sub-basins. The constancy of infiltration rates in the disturbed soil is due to the rupture of the surface layer, promoting a reverse effect to that of animal trampling, which increases the levels of compaction, as indicated by the Ds values in Table 1. Animal hooves exert pressure on the soil, capable of compacting it and limiting it to long-term pasture [39,40], disrupting and reorganizing soil particles in a way that is different from the natural formation. According to Castro et al. [41], the upheaval of the surface layer favors infiltration by promoting an increase in surface roughness, reducing the speed and volume of surface runoff. Likewise, when studying water infiltration into the soil in conventional systems of disturbance, minimum cultivation and direct planting systems, Santo et al. [42] concluded that soil disturbance in the conventional system has a favorable effect on reducing surface water runoff and increasing the water infiltration rate due to increased roughness and disruption of the compacted layer.
There were significant variations in Tio and Tif about the regions in the sub-basins, which may be related to the physical characteristics of the soils in each region, despite belonging to the same class, according to Alves et al. [25], who classified 18 soil profiles in the spring, middle and mouth regions of these two aforementioned hydrographic sub-basins. This shows that, in addition to the absence of vegetation cover and disturbance, the physical properties of the soil also play a key role in water infiltration into the soil [3]. Therefore, the lower infiltration capacity in the area with pasture cover and without cover before turning may be related to lower soil permeability, as these are areas of continuous grazing [40]. The lower infiltration rate in crop areas without cover and disturbed soil in the Renato River sub-basin may be the result of the effect of continuous scarification resulting from management, since, in this case, the soil preparation, planting, spraying machinery and harvesting may have compromised the macroporosity of these soils, responsible for the movement of water in the profile. When studying the effect of agricultural machinery on water infiltration into the soil, Fernandes et al. [43] concluded that the stable soil infiltration rate is reduced in places with permanent traffic of agricultural implements. On the other hand, after successive soil disturbances from management systems, the soil structure is disrupted, which can favor greater concentrations of mineral particles in water flows, contributing to erosive processes [16]. However, the effect of disturbance on compacted soils can favor infiltration, as is the case in pasture areas in both hydrographic sub-basins. The rupture of the surface layer increased the capacity for water infiltration into the soil compared to covered and undisturbed soils since in the pastures evaluated, there are no historical records of soil disturbance after pasture implementation, trampled soils, and, consequently, compressed. As a result, the disturbance in the simulated rainfall portion broke this layer and improved the condition of water infiltration into the soil.
It is observed that the fact that the disturbed pasture areas have favored the infiltration of water into the soil does not make this an efficient management to be adopted by all producers. Although smaller, surface runoff in these areas is more concentrated, causing greater soil loss than covered areas with lower infiltration capacity [16]. Even though changes to the surface layer are necessary to improve the physical-water quality of the soil in pasture, these must be accompanied by conservation management to minimize erosion processes [6]. An alternative is to reduce soil compaction through rotational grazing, respecting the support capacity, entry and exit of animals according to pasture height, pH correction, fertilization if necessary and use of cultivars with aggressive root systems to improve soil aggregation. In this sense, Dobert et al. [43] recommend adopting the rotational or rotational grazing technique combined with fallow periods as the best alternative to maintain the health of soils and pastures. In a study of infiltration rates in Cerrado soils, Sone et al. [9] concluded that sustainable pasture management is an opportunity to meet food demand and, at the same time, keep the soil in good condition. When carrying out a meta-analysis comparing infiltration rates in soils managed with conventional and alternative crops, Basche & Delonge [6] concluded that there is a general trend of potential improvement in infiltration rates with the use of alternative agricultural management practices that use soil cover with the presence of live plant roots, in uncompacted soils. In soils with high levels of compaction, before encouraging infiltration, the cover plays a role in making physical, chemical and biological improvements to the management system, whether agricultural or livestock.
Multivariate statistics by PCA explained with more than 95% reliability the relationship between soil physical attributes and stable infiltration rates (Tif) in crop and pasture areas, in treatments with and without cover, and all regions of the Caiabi River sub-basin. All eigenvalues of PC1 and PC2 are above one, considered ideal for using the components to explain the groupings of soil attributes and stable water infiltration rate into the soil (Table 3). The eigenvalues in areas with soybean cover were 4.910 (PC1) and 2.080 (PC2), while in areas with pasture cover, the values were 3.70 (PC1) and 3.240 (PC2). On the other hand, the areas without soybean coverage and without pasture coverage presented eigenvalues of 5.350 and 1.640, and 4.310 and 2.680, respectively, for PC1 and PC2. Regarding the variations (%) of PCs, the areas with coverage, with pasture coverage, without soy coverage and without pasture coverage presented a sum of PC1 and PC2 between 95 and 100%. PC1 correlated significantly with most soil attributes, especially in soybean areas with and without cover, representing more than 70% of the variation (70.16% in soybean areas with cover and 76.51% in soybean areas without cover). coverage) (Figure 2). In pasture areas, the significance of PC1 and PC2 was more distributed among the attributes.
In the Caiabi River sub-basin, the vectors of final infiltration rates followed the direction of the attributes macroporosity, total sand and soil density, especially in the mouth and middle regions, where these attributes are statistically greater than at the source (Table 3). This grouping of data in the same quadrant or belonging to the same component highlights the relationship between the factors, serving as a basis for understanding the process of water infiltration in sandier soils when compared to clayey soils. Similarly, in the Renato River sub-basin, the eigenvalues are also above one. The accumulated variation in the areas of corn coverage, with pasture coverage and without coverage in both crops are between 95 and 100% (Table 4 and Figure 3). The PC1 of the corn areas with coverage significantly correlated negatively with all soil attributes and stable infiltration rate, except total sand, which showed a positive correlation. It is worth highlighting that this component alone retained 81.81% of the variation, justifying the correlation with all soil attributes.
Regarding the models of water infiltration into the soil, it is observed that in the Renato River sub-basin, the Horton model was the one that best adjusted in most treatments and by region, followed by the Philip model (Table 5). When studying the performance of the models above, Santos et al. [42] concluded that Horton’s model is the most appropriate to represent the infiltration rate in Cerrado soils under conditions of minimum cultivation, direct planting system, and conventional planting and can be recommended regardless of the preparation system of the soil used. Panachuki et al. [14] evaluated the effect of different management systems (minimum cultivation and disturbed soils) on water infiltration in a Red Oxisol. They concluded that Horton’s model provided a good fit to the data with coefficient of determination values greater than 90 %. The same occurred with Carvalho et al. [45], who observed that Horton’s model was the most suitable to represent the water infiltration rate in Argisol. These results corroborate those found in this research.
5. Conclusions
Pasture areas presented better conditions for water infiltration into the soil when disturbed about plots with cover and without cover that were not disturbed, regardless of the sub-basin or the topological region in which they were located.
Crop areas influenced soil infiltration rates through macroporosity and bulk density in the average position of the Caiabi River sub-basin. At the same time, microporosity, clay, total porosity and silt were more influential in the source of the Renato River sub-basin.
The models for estimating water infiltration into the soil presented good adjustments in sub-basins of the Cerrado-Amazon transition, regardless of soil use and coverage and the region of the sub-basin. However, the Horton and Philip models provided better adjustments in the sub-watersheds of the Renato and Caiabi rivers, being recommended for estimating this variable regardless of the soil management system used and the regions of both sub-basins.
Author Contributions
Data collection, laboratory analysis, writing, methodology, formal analysis, and figures—M.A.B.A.; data collection, and laboratory analysis - M.A.B.A.; data collection, laboratory analysis and figures – D.R.B.; data collection and laboratory analysis – R.S.D.P.; data collection, review, editing, supervision, and financial support—A.P.S. and F.T.A.; supervision, writing, review, editing, supervision, and financial support—D.F.C.; All authors have read and agreed to the published version of the manuscript.
Funding
This study was financed by the Coordenação de Aperfeiçoamento de Pessoal de Nível Superior—Brasil (CAPES) and the Agência Nacional de Águas e Saneamento Básico (ANA), Finance Code—001 and Process 88887.144957/2017-00. The authors wish to thank the Conselho Nacional de Desenvolvimento Científico e Tecnológico (CNPq) for their support with scientific initiation grants and a productivity grant.
Institutional Review Board Statement
Not applicable.
Informed Consent Statement
Not applicable.
Data Availability Statement
Study data can be obtained upon request to the corresponding author or the second author, via e-mail. The data are not available on the website as the research project is still under development.
Acknowledgments
The authors also thank all the students of the Tecnologia em Recursos Hídricos no Centro-Oeste” research group (dgp.cnpq.br/dgp/espelhogrupo/2399343537529589, accessed on 10 December 2023). The authors would also like to thank the owners of the farms that allowed and supported the collection of samples, with the following highlights: i) in Vera-MT: Fazenda Vó Maria, Agropecuária Taguá, Fazenda São José and Fazenda Jaboticabal; ii) in Claúdia-MT: Fazenda Continental, Fazenda Aremisa III and Agropecuária Bedin.
Conflicts of Interest
The funders had no role in the design of the study; in the collection, analyses, or interpretation of data; in the writing of the manuscript; or in the decision to publish the results.
References
- Rápalo, L.M.C.; Uliana, E.M.; Moreira, M.C.; Da Silva, D.D.; De Melo Ribeiro, C.B.; Da Cruz, I.F.; Dos Reis Pereira, D. Effects of land-use and-cover changes on streamflow regime in the Brazilian Savannah. Journal of Hydrology: Regional Studies 2021, 38, e100934. [Google Scholar] [CrossRef]
- Bertol, I.; Barbosa, F.T.; Berto, C.; Luciano, R.V. Water infiltration in two cultivated soils in Southern Brazil. Revista Brasileira de Ciência do Solo 2015, 39, 573–588. [Google Scholar] [CrossRef]
- Almeida, W.S.; Panachuki, E.; De Oliveira, P.T.S.; Da Silva Menezes, R.; Alves Sobrinho, T.; De Carvalho, D.F. Effect of soil tillage and vegetal cover on soil water infiltration. Soil and Tillage Research 2018, 175, 130–138. [Google Scholar] [CrossRef]
- Hunke, P.; Roller, R.; Zeilhofer, P.; Schröder, B.; Mueller, E.N. Soil changes under different land-uses in the Cerrado of Mato Grosso, Brazil. Geoderma Regional 2015, 4, 31–43. [Google Scholar] [CrossRef]
- Niu, F.; Gao, Z.; Lin, Z.; Luo, J.; Fan, X. Vegetation influence on the soil hydrological regime in permafrost regions of the Qinghai-Tibet Plateau, China. Geoderma 2019, 354, e113892. [Google Scholar] [CrossRef]
- Basche, A.D.; Delonge, M.S. Comparing infiltration rates in soils managed with conventional and alternative farming methods: A meta-analysis. PLoS ONE 2019, 14, e0215702. [Google Scholar] [CrossRef] [PubMed]
- Fuentes-Llanillo, R.; Telles, T.S.; Junior, D.S.; De Melo, T.R.; Friedrich, T.; Kassam, A. Expansion of no-tillage practice in conservation agriculture in Brazil. Soil and Tillage Research 2021, 208, e104877. [Google Scholar] [CrossRef]
- Carvalho, D.F.; Macedo, P.M.S.; Pinto, M.F.; Almeida, W.S.; Schultz, N. Soil loss and runoff obtained with customized precipitation patterns simulated by InfiAsper. Soil loss and runoff obtained with customized precipitation patterns simulated by InfiAsper. International Soil and Water Conservation Research 2022, 10, 407–413. [Google Scholar] [CrossRef]
- Sone, J.S.; Oliveira, P.T.S.; Euclides, V.P.B.; Montagner, D.B.; De Araujo, A.R.; Zamboni, P.A.P.; Sobrinho, T.A. Cienceationtrogen fertilization and stocking rates on soil erosion and water infiltration in a Brazilian Cerrado farm. Agriculture, Ecosystems & Environment 2020, 304, e107159. [Google Scholar] [CrossRef]
- Andrade, E.M.; Guerreiro, M.J.S.; Palácio, H.A.Q.; Campos, D.A. Ecohydrology in a Brazilian tropical dry forest: thinned vegetation impact on hydrological functions and ecosystem services. Journal of Hydrology: Regional Studeis 2020, 27, e100649. [Google Scholar] [CrossRef]
- Chari, M.M.; Poozan, M.T.; Afrasiab, P. Modelling soil water infiltration variability using scaling. Biosystems Engineering 2020, 196, 56–66. [Google Scholar] [CrossRef]
- Sidiras, N.; Roth, C.H. Infiltration measurements with double-ring infiltrometers and a rainfall simulator under different surface conditions on an Oxisol. Soil and tillage research 1987, 9, 161–168. [Google Scholar] [CrossRef]
- Luz, C.C.S.; Almeida, W.S.; Souza, A.P.; Schultz, N.; Anache, J.A.A.; Carvalho, D.F. Simulated rainfall in Brazil: an alternative for the assessment of soil surface processes and opportunity for technological development. International Soil and Water Conservation Research 2024, 12, 29–42. [Google Scholar] [CrossRef]
- Alves Sobrinho, T.; Gómez-Macpherson, H.; Gómez, J.A. A portable integrated rainfall and overland flow simulator. Soil Use and Management 2008, 24, 163–170. [Google Scholar] [CrossRef]
- Panachuki, E.; Bertol, I.; Alves Sobrinho, T.; Oliveira, P.T.S.D.; Rodrigues, D.B.B. Perdas de solo e de água e infiltração de água em Latossolo Vermelho sob sistemas de manejo. Revista Brasileira de Ciência do solo 2011, 35, 1777–1786. [Google Scholar] [CrossRef]
- Falcão, K.D.S.; Panachuki, E.; Monteiro, F.D.N.; Silva, R.; Rodrigues, D.B.; Sone, J.S.; Oliveira, P.T.S. Surface runoff and soil erosion in a natural regeneration area of the Brazilian Cerrado. International Soil and Water Conservation Research 2020, 8, 124–130. [Google Scholar] [CrossRef]
- Alves, M.A.B.; Souza, A.P.; Almeida, F.T.; Hoshide, A.K.; Araújo, H.B.; Silva, A.F.; Carvalho, D.F. Effects of Land Use and Cropping on Soil Erosion in Agricultural Frontier Areas in the Cerrado-Amazon Ecotone, Brazil, Using a Rainfall Simulator Experiment. Sustainability 2023, 15, 4954. [Google Scholar] [CrossRef]
- Johnson, R.A.; Wichern, D.W. Applied multivariate statistical analysis, 4th ed.; Prentice-Hall: Upper Saddle River, NJ, USA, 1999; 815p. [Google Scholar]
- Fox, G.A.; Metl, A.R. Soil property analysis using principal components analysis, soil line, and regression models. Soil Science Society of America Journal 2005, 69, 1782–1788. [Google Scholar] [CrossRef]
- Jolliffe, I.T.; Cadima, J. Principal component analysis: a review and recent developments. Philosophical transactions of the Royal Society A: Mathematical, Physical and Engineering Sciences 2016, 374, e20150202. [Google Scholar] [CrossRef] [PubMed]
- Tajik, S.; Ayoubi, S.; Khajehali, J.; Shataee, S. Effects of tree species composition on soil properties and invertebrates in a deciduous forest. Arabian Journal of Geosciences 2019, 12, 1–11. [Google Scholar] [CrossRef]
- Abdel-Fattah, M.K.; Abd-Elmabod, S.K.; Aldosari, A.A.; Elrys, A.S.; Mohamed, E.S. Multivariate analysis for assessing irrigation water quality: A case study of the Bahr Mouise Canal, Eastern Nile Delta. Water 2020, 12, 2537. [Google Scholar] [CrossRef]
- Abdel-Fattah, M.K.; Mohamed, E.S.; Wagdi, E.M.; Shahin, S.A.; Aldosari, A.A.; Lasaponara, R.; Alnaimy, M.A. Quantitative evaluation of soil quality using Principal Component Analysis: The case study of El-Fayoum depression Egypt. Sustainability 2021, 13, 1824. [Google Scholar] [CrossRef]
- Martín-Sanz, J.P.; De Santiago-Martín, A.; Valverde-Asenjo, I.; Quintana-Nieto, J.R.; González-Huecas, C.; López-Lafuente, A.L. Comparison of soil quality indexes calculated by network and principal component analysis for carbonated soils under different uses. Ecological Indicators 2022, 143, e109374. [Google Scholar] [CrossRef]
- Moratelli, F.A.; Alves, M.A.B.; Borella, D.R.; Kraeski, A.; Almeida, F.T.D.; Zolin, C.A.; Hoshide, A.K.; Souza, A.P. Effects of Land Use on Soil Physical-Hydric Attributes in Two Watersheds in the Southern Amazon, Brazil. Soil Systems 2023, 7, 103. [Google Scholar] [CrossRef]
- Alves, M.A.B.; Borella, D.R.; Silva Luz, C.C.; Castagna, D.; Da Silva, W.C.; Silva, A.F.; Souza, A.P. Classes de solos nas bacias hidrográficas dos rios Caiabi e Renato, afluentes do rio Teles Pires, no sul da Amazônia. Nativa 2022, 10, 431–448. [Google Scholar] [CrossRef]
- Alvares, C.A.; Stape, J.L.; Sentelhas, P.C.; Gonçalves, J.L.M.; Sparovek, G. Köppen’s climate classification map for Brazil. Meteorologische Zeitschrift 2013, 22, 711–728. [Google Scholar] [CrossRef] [PubMed]
- Sabino, M.; Souza, A.P.; Uliana, E.M.; Lisboa, L.; Almeida, F.T.; Zolin, C.A. Intensity-duration-frequency of maximum rainfall in Mato Grosso State. Revista Ambiente Água 2020, 15, e2373. [Google Scholar] [CrossRef]
- Teixeira, P.C.; Donagemma, G.K.; Fontana, A.; Teixeira, W.G. Manual de métodos de análise de solo. 2017. 3 ed. Rio de Janeiro: Embrapa Solos, 573p. Available online: https://www.infoteca.cnptia.embrapa.br/handle/doc/1085209.
- Kostiakov, A.N. On the dynamics of the coefficient of water percolation in soils and on the necessity of studying it from a dynamic point of view for purposes of amelioration. Transactions of the Sixth Commission of the International Society of Soil Science. 1932. Part A (Moscow) p.17–21.
- Lewis, M.R. The rate of infiltration of water in irrigation practice. Trans. Am. Geophys. Union 1937, 18, 361–368. [Google Scholar] [CrossRef]
- Horton, R.E. Analysis of runoff plat experiments with varying infiltration capacity. Trans. Am. Geophys. Union 1939, 20, 693–711. [Google Scholar] [CrossRef]
- Horton, R.E. The role of infiltration in the hydrological cycle. Trans. Am. Geophys. Union 1933, 14, 446–460. [Google Scholar] [CrossRef]
- Philip, J.R. Theory of infiltration. Adv. Hydrosci. 1969, 5, 215–296. [Google Scholar] [CrossRef]
- Philip, J.R. The theory of infiltration Sorptivity and algebraic infiltration equations. Soil Science 1957, 84, 257–264. [Google Scholar] [CrossRef]
- Moriasi, D.N.; Arnold, J.G.; Van Liew, M.W.; Bingner, R.L.; Harmel, R.D.; Veith, T.L. Model evaluation guidelines for systematic quantification of accuracy in watershed simulations. Trans. ASABE 2007, 50, 885–900. [Google Scholar] [CrossRef]
- Nash, J.E.; Sutcliffe, J.V. River flow forecasting through conceptual models: part 1. A discussion of principles. Journal of Hydrology 1970, 10, 282–290. [Google Scholar] [CrossRef]
- IBGE_Instituto Brasileiro de Geografia e Estatística. Estado do Mato Grosso: Pedologia (Mapa Exploratório de Solos); 2009. Available online: https://geoftp.ibge.gov.br/informacoes_ambientais/pedologia/mapas/unidades_da_federacao/mt_pedologia.pdf (accessed on 29 December 2023).
- EPE_Empresa de Pesquisa Energética. Avaliação Ambiental Integrada da Bacia Hidrográfica do Rio Teles Pires; 2009; 67p. Available online: https://www.epe.gov.br/sites-pt/publicacoes-dados-abertos/publicacoes/PublicacoesArquivos/publicacao-248/topico-292/AAI%20Teles%20Pires%20-%20Relat%C3%B3rio%20Final%20-%20Sum%C3%A1rio%20Executivo[1].pdf#search=teles%20pires> (accessed on 29 December 2023).
- Centeri, C. Effects of grazing on water erosion, compaction and infiltration on Grasslands. Hydrology 2022, 9, 34. [Google Scholar] [CrossRef]
- Baronti, S.; Ungaro, F.; Maienza, A.; Ugolini, F.; Lagomarsino, A.; Agnelli, A.E.; Calzolari, C.; Pisseri, F.; Robbiati, G.; Vaccari, F.P. Rotational pasture management to increase the sustainability of mountain livestock farms in the Alpine region. Regional Environmental Change 2022, 22, e50. [Google Scholar] [CrossRef]
- Castro, L.G.; Cogo, N.P.; Volk, L.B.D.S. Alterations in soil surface roughness by tillage and rainfall in relation to water erosion. Revista Brasileira de Ciência do Solo 2006, 30, 339–352. [Google Scholar] [CrossRef]
- Santos, M.A.D.N.D.; Panachuki, E.; Alves Sobrinho, T.; Oliveira, P.T.S.D.; Rodrigues, D.B.B. Water infiltration in na ultisol after cultivation of common bean. Revista Brasileira de Ciência do Solo 2014, 38, 1612–1620. [Google Scholar] [CrossRef]
- Fernandes, B.B.; Marasca, I.; Martins, M.B.; Sandi, J.; Da Silva, K.G.P.; Lanças, K.P. Effect of traffic in agricultural soil water infiltration and the physical atributes of the soil. Irriga 2022, 27, 343–356. [Google Scholar] [CrossRef]
- Döbert, T.F.; Bork, E.W.; Apfelbaum, S.; Carlyle, C.N.; Chang, S.X.; KhaI-Chhetri, U.; Silva Sobrinho, L.; Thompson, R.; Boyce, M.S. Adaptive multi-paddock grazing improves water infiltration in Canadian grassland soils. Geoderma 2021, 401, e115314. [Google Scholar] [CrossRef]
- Carvalho, D.F.; Eduardo, E.N.; Almeida, W.S.; Santos, L.A.; Alves Sobrinho, T. Water erosion and soil water infiltration in different stages of corn development and tillage systems. Revista Brasileira de Engenharia Agrícola e Ambiental 2015, 19, 1072–1078. [Google Scholar] [CrossRef]
Figure 1.
Location of the Teles Pires river basin and the sub-basins of the Renato and Caiabi rivers, in the Cerrado-Amazon transition.
Figure 1.
Location of the Teles Pires river basin and the sub-basins of the Renato and Caiabi rivers, in the Cerrado-Amazon transition.
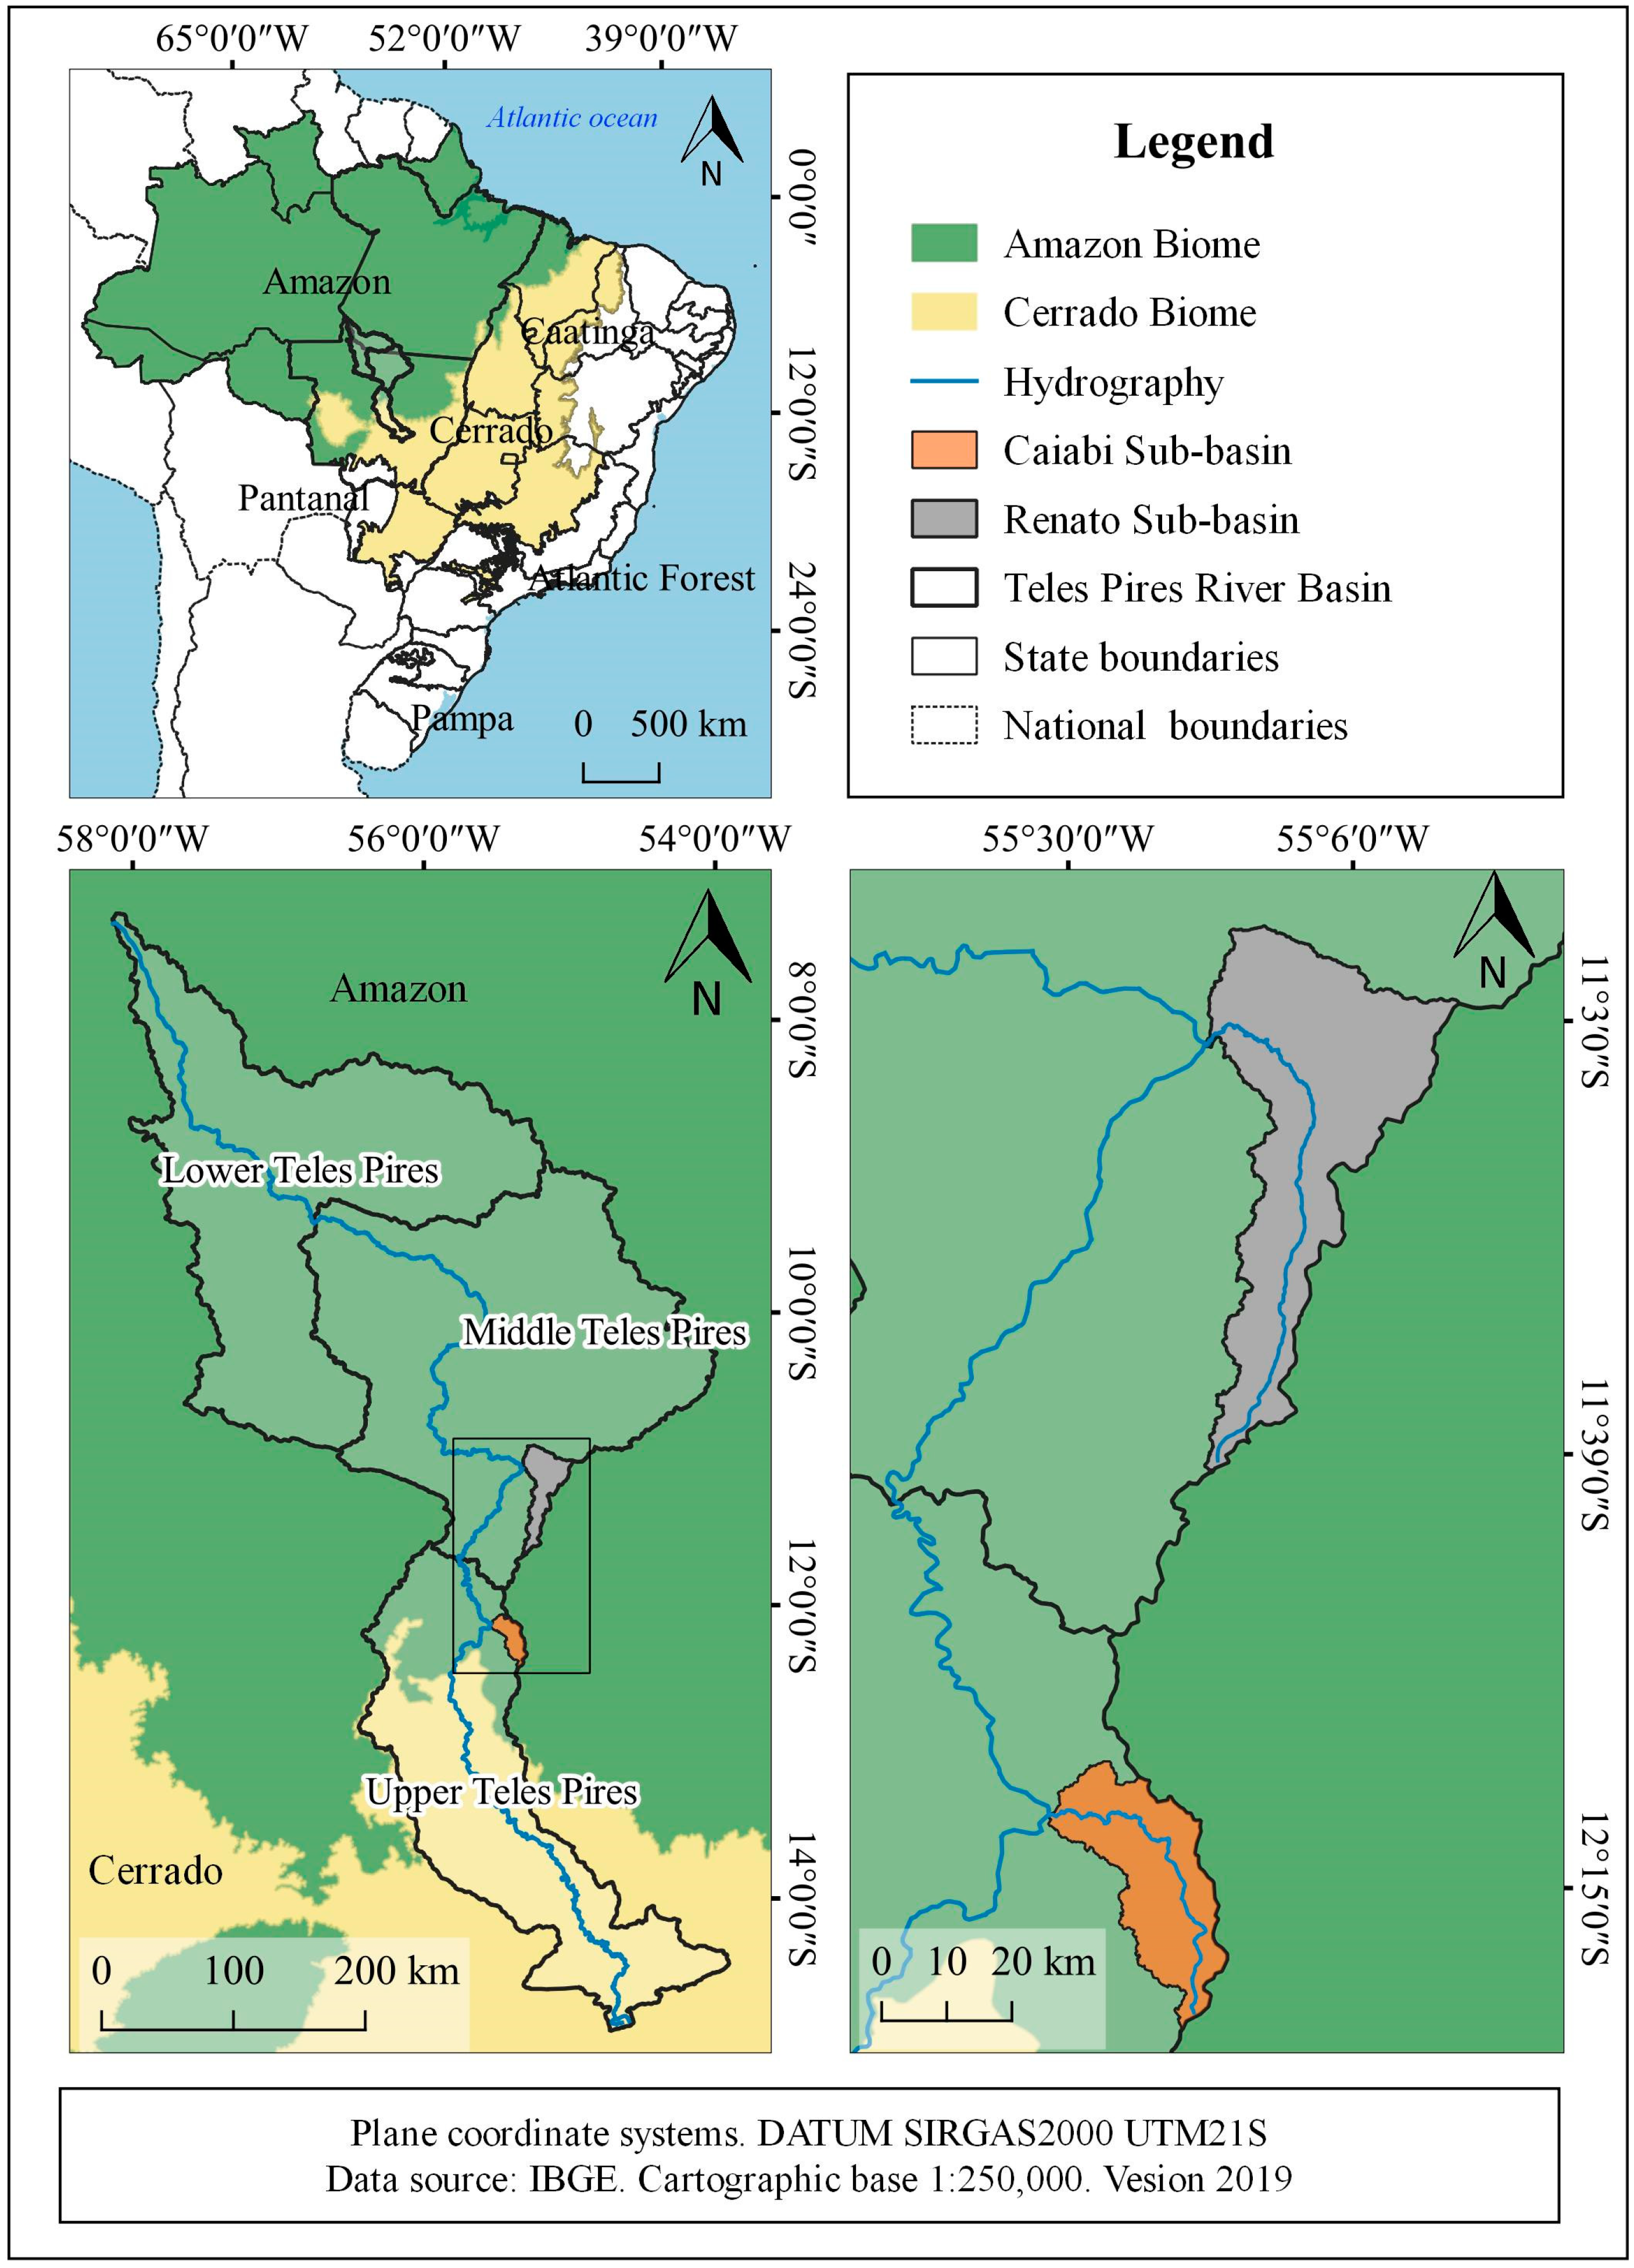
Figure 2.
Analysis of main components in the Caiabi River sub-basin in areas of cropland with cover (A): Crop without cover (B): pasture with cover (C) and pasture without cover (D). Micro - microporosity; Macro - macroporosity; Bd - soil density; Tif - final infiltration rate; UC-CSSoy - upper of the Caiabi River with soybean cover; MC-CSSoy - middle of the Caiabi River with soybean cover; LC-CSSoy - lower of the Caiabi river with soybean cover; UC-CSPast - upper of the Caiabi River with pasture cover; MC-CSPast - middle Caiabi River with pasture cover; LC-CSPast - lower of the Caiabi River with pasture cover; UC-CWSSoy - upper of the Caiabi River in an uncovered soybean area; MC-CWSSoy - middle of the Caiabi River in an area of soybeans without cover; LC-CWSSoy - lower of the Caiabi river in an uncovered soybean area; UC-CWSPast - upper of the Caiabi River in an area of pasture without cover; MC-CWSPast - middle of the Caiabi River in an area of pasture without cover; LC-CWSPast - lower of the Caiabi river in an area of pasture without cover.
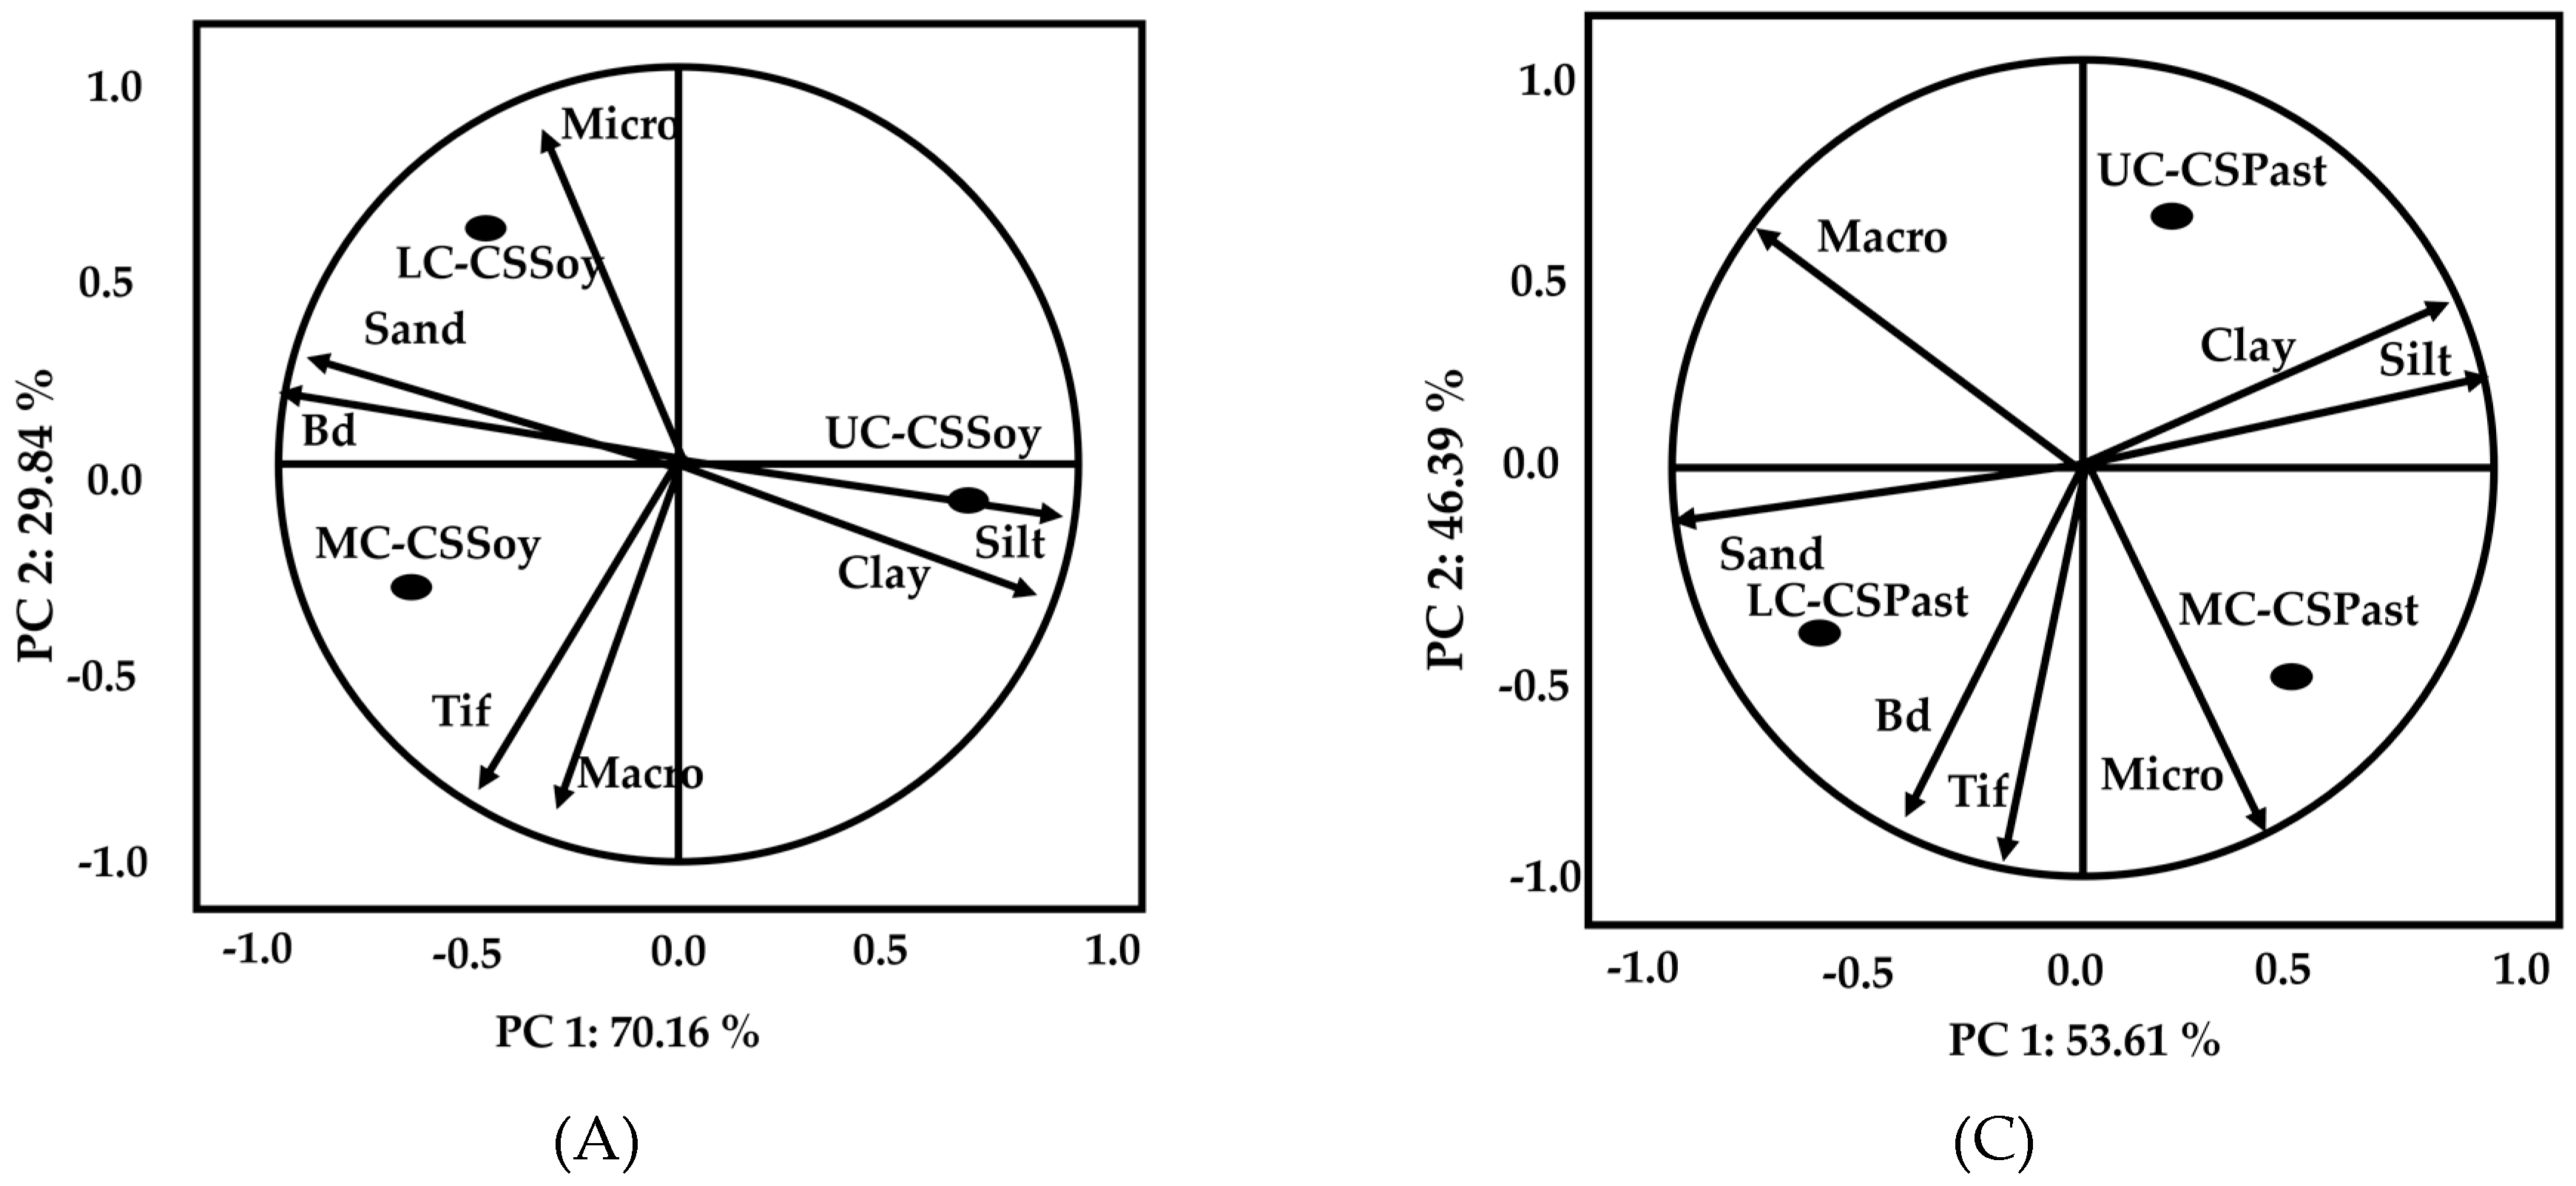
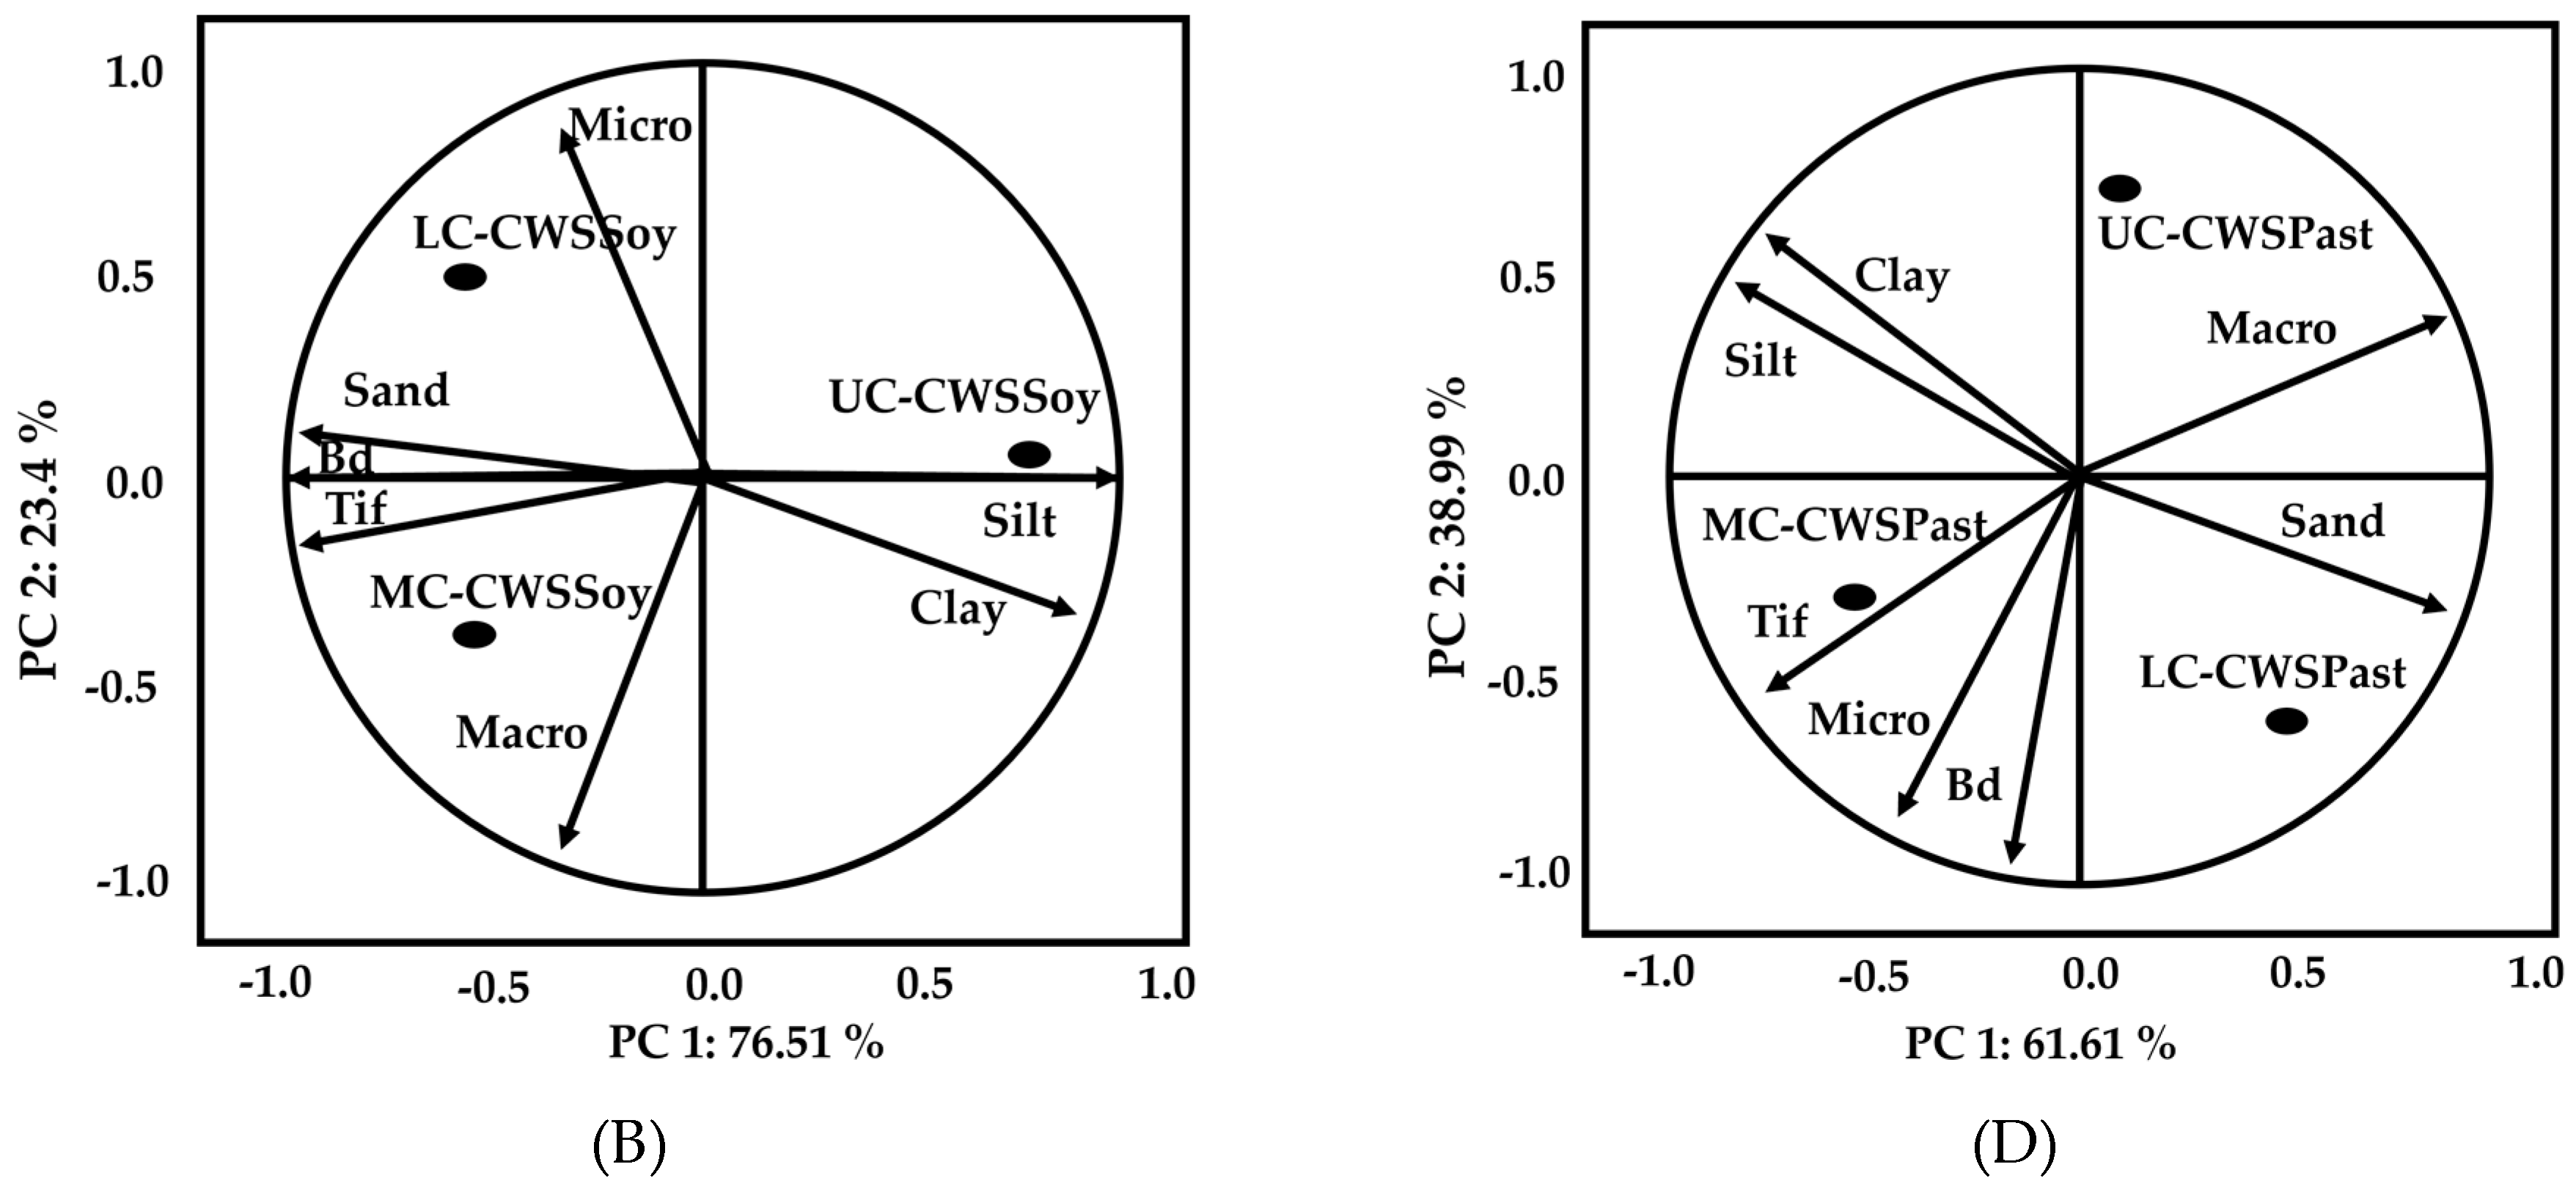
Figure 3.
Analysis of main components in the Renato River sub-basin in areas of cropland with cover (A): Crop without cover (B): pasture with cover (C) and pasture without cover (D). Micro - microporosity; Macro - macroporosity; Bd - soil density; Tif - final infiltration rate; UR-CSSoy - upper of the Renato River with soybean cover; MR-CSSoy - middle of the Renato River with soybean cover; LR-CSSoy - lower of the Renato river with soybean cover; UR-CSPast - upper of the Renato River with pasture cover; MR-CSPast - middle Renato River with pasture cover; LR-CSPast - lower of the Renato River with pasture cover; UR-CWSSoy - upper of the Renato River in an uncovered soybean area; MR-CWSSoy - middle of the Renato River in an area of soybeans without cover; LR-CWSSoy - lower of the Renato river in an uncovered soybean area; UR-CWSPast - upper of the Renato River in an area of pasture without cover; MR-CWSPast - middle of the Renato River in an area of pasture without cover; LR-CWSPast - lower of the Renato river in an area of pasture without cover.
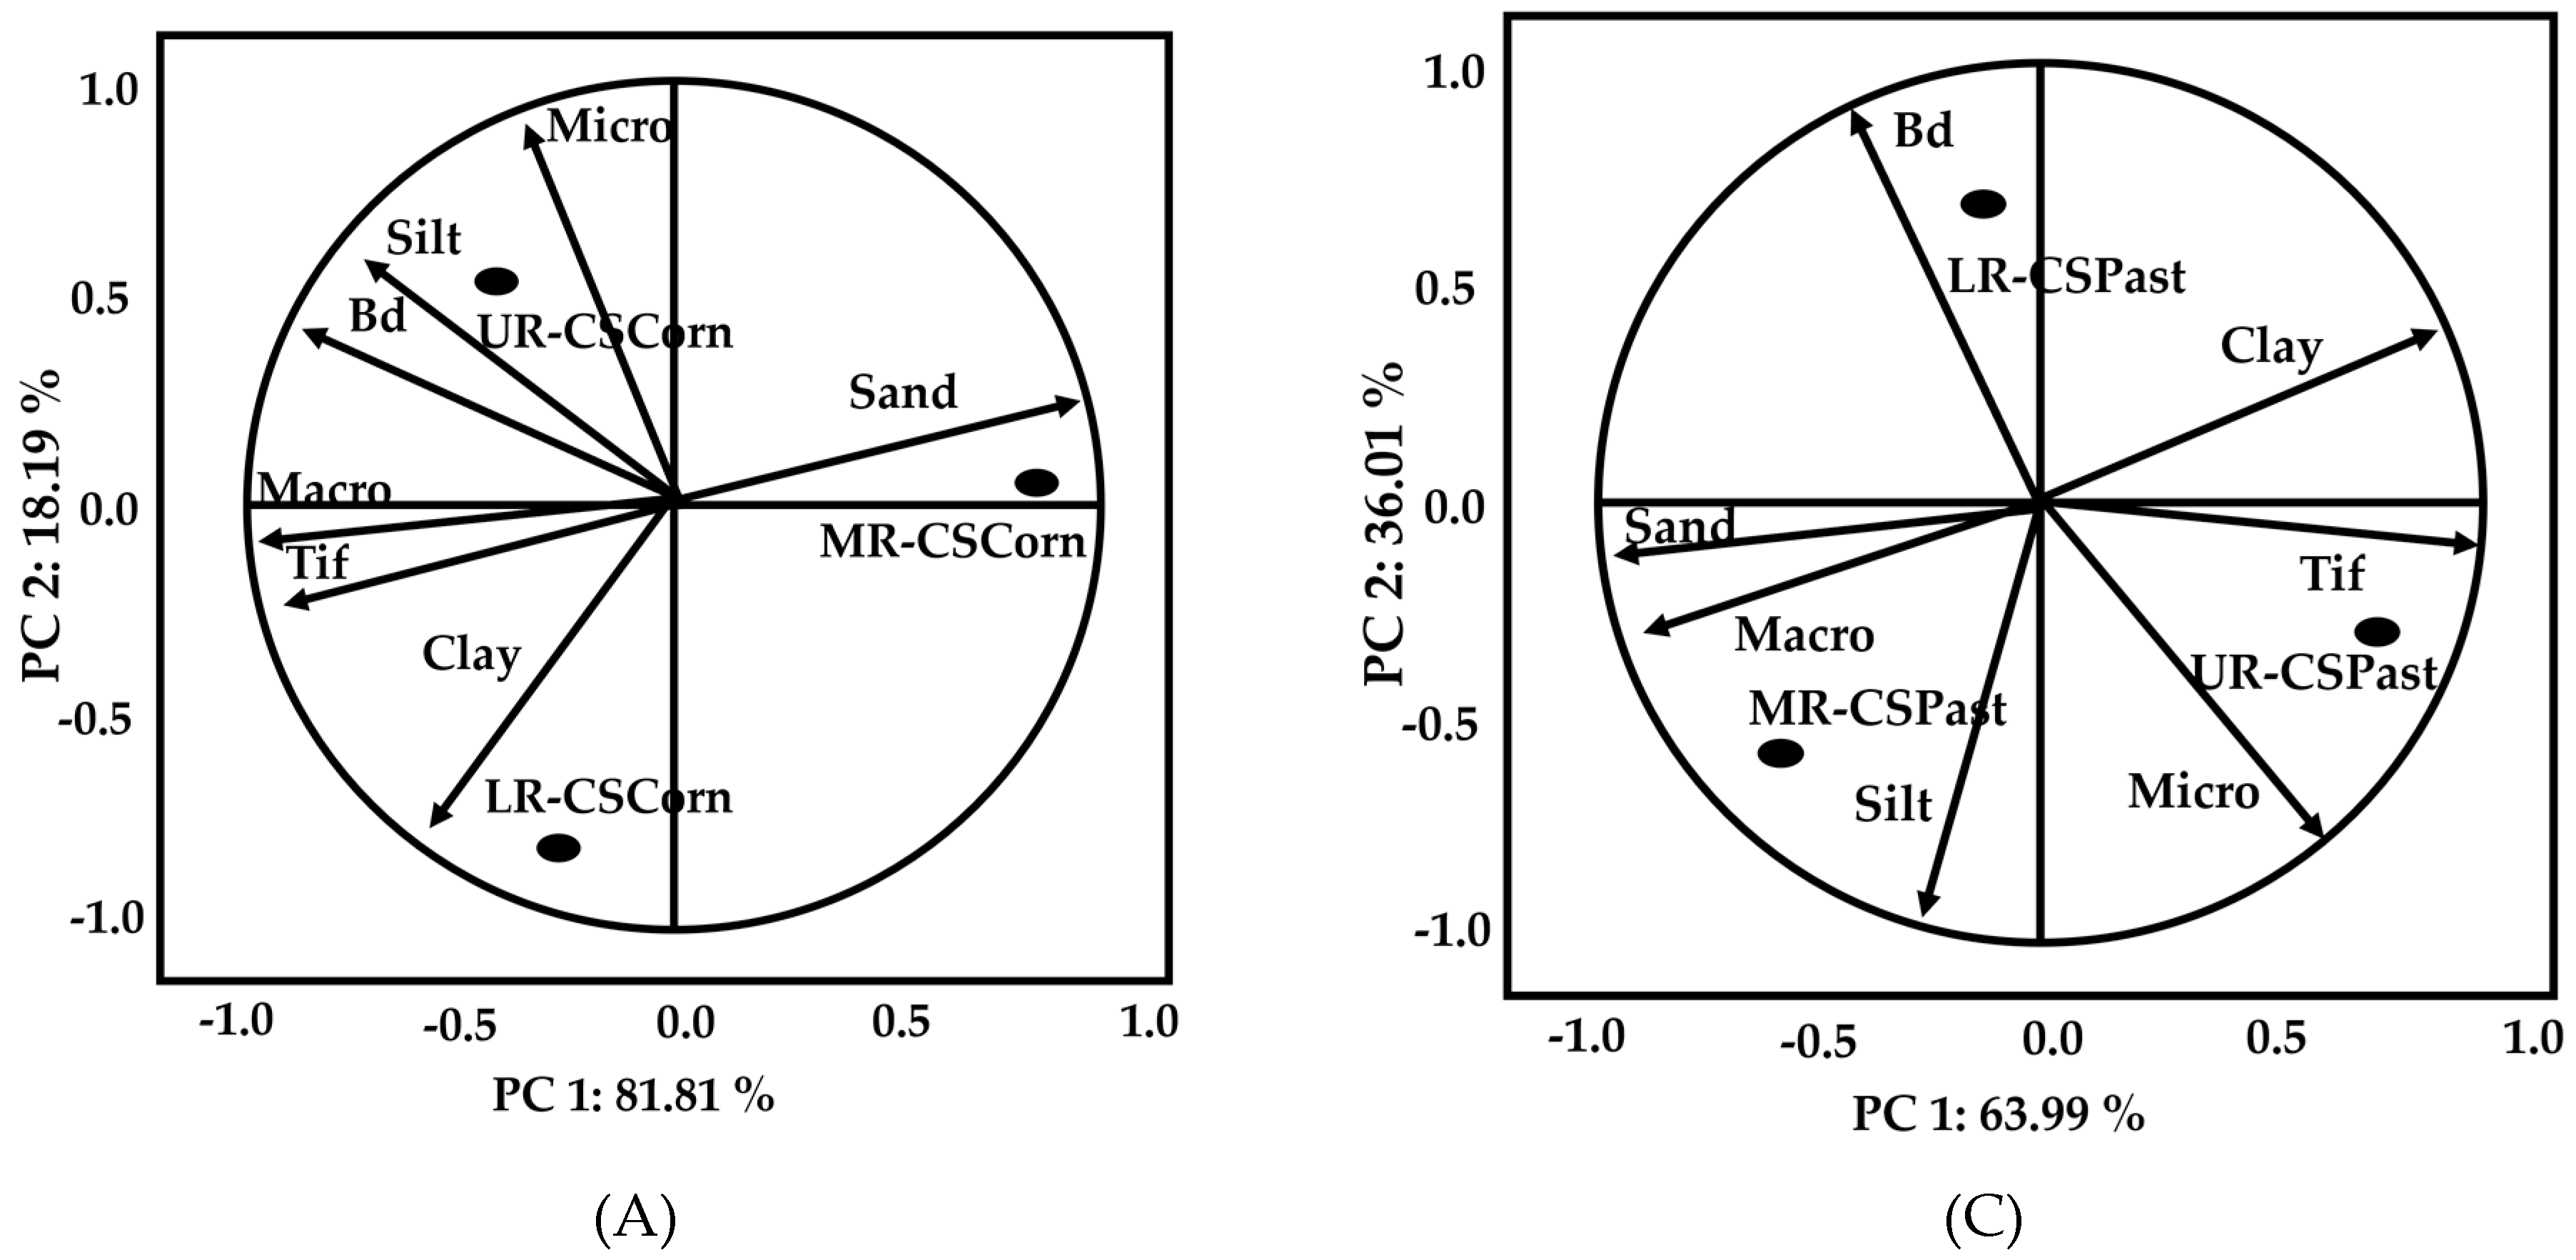
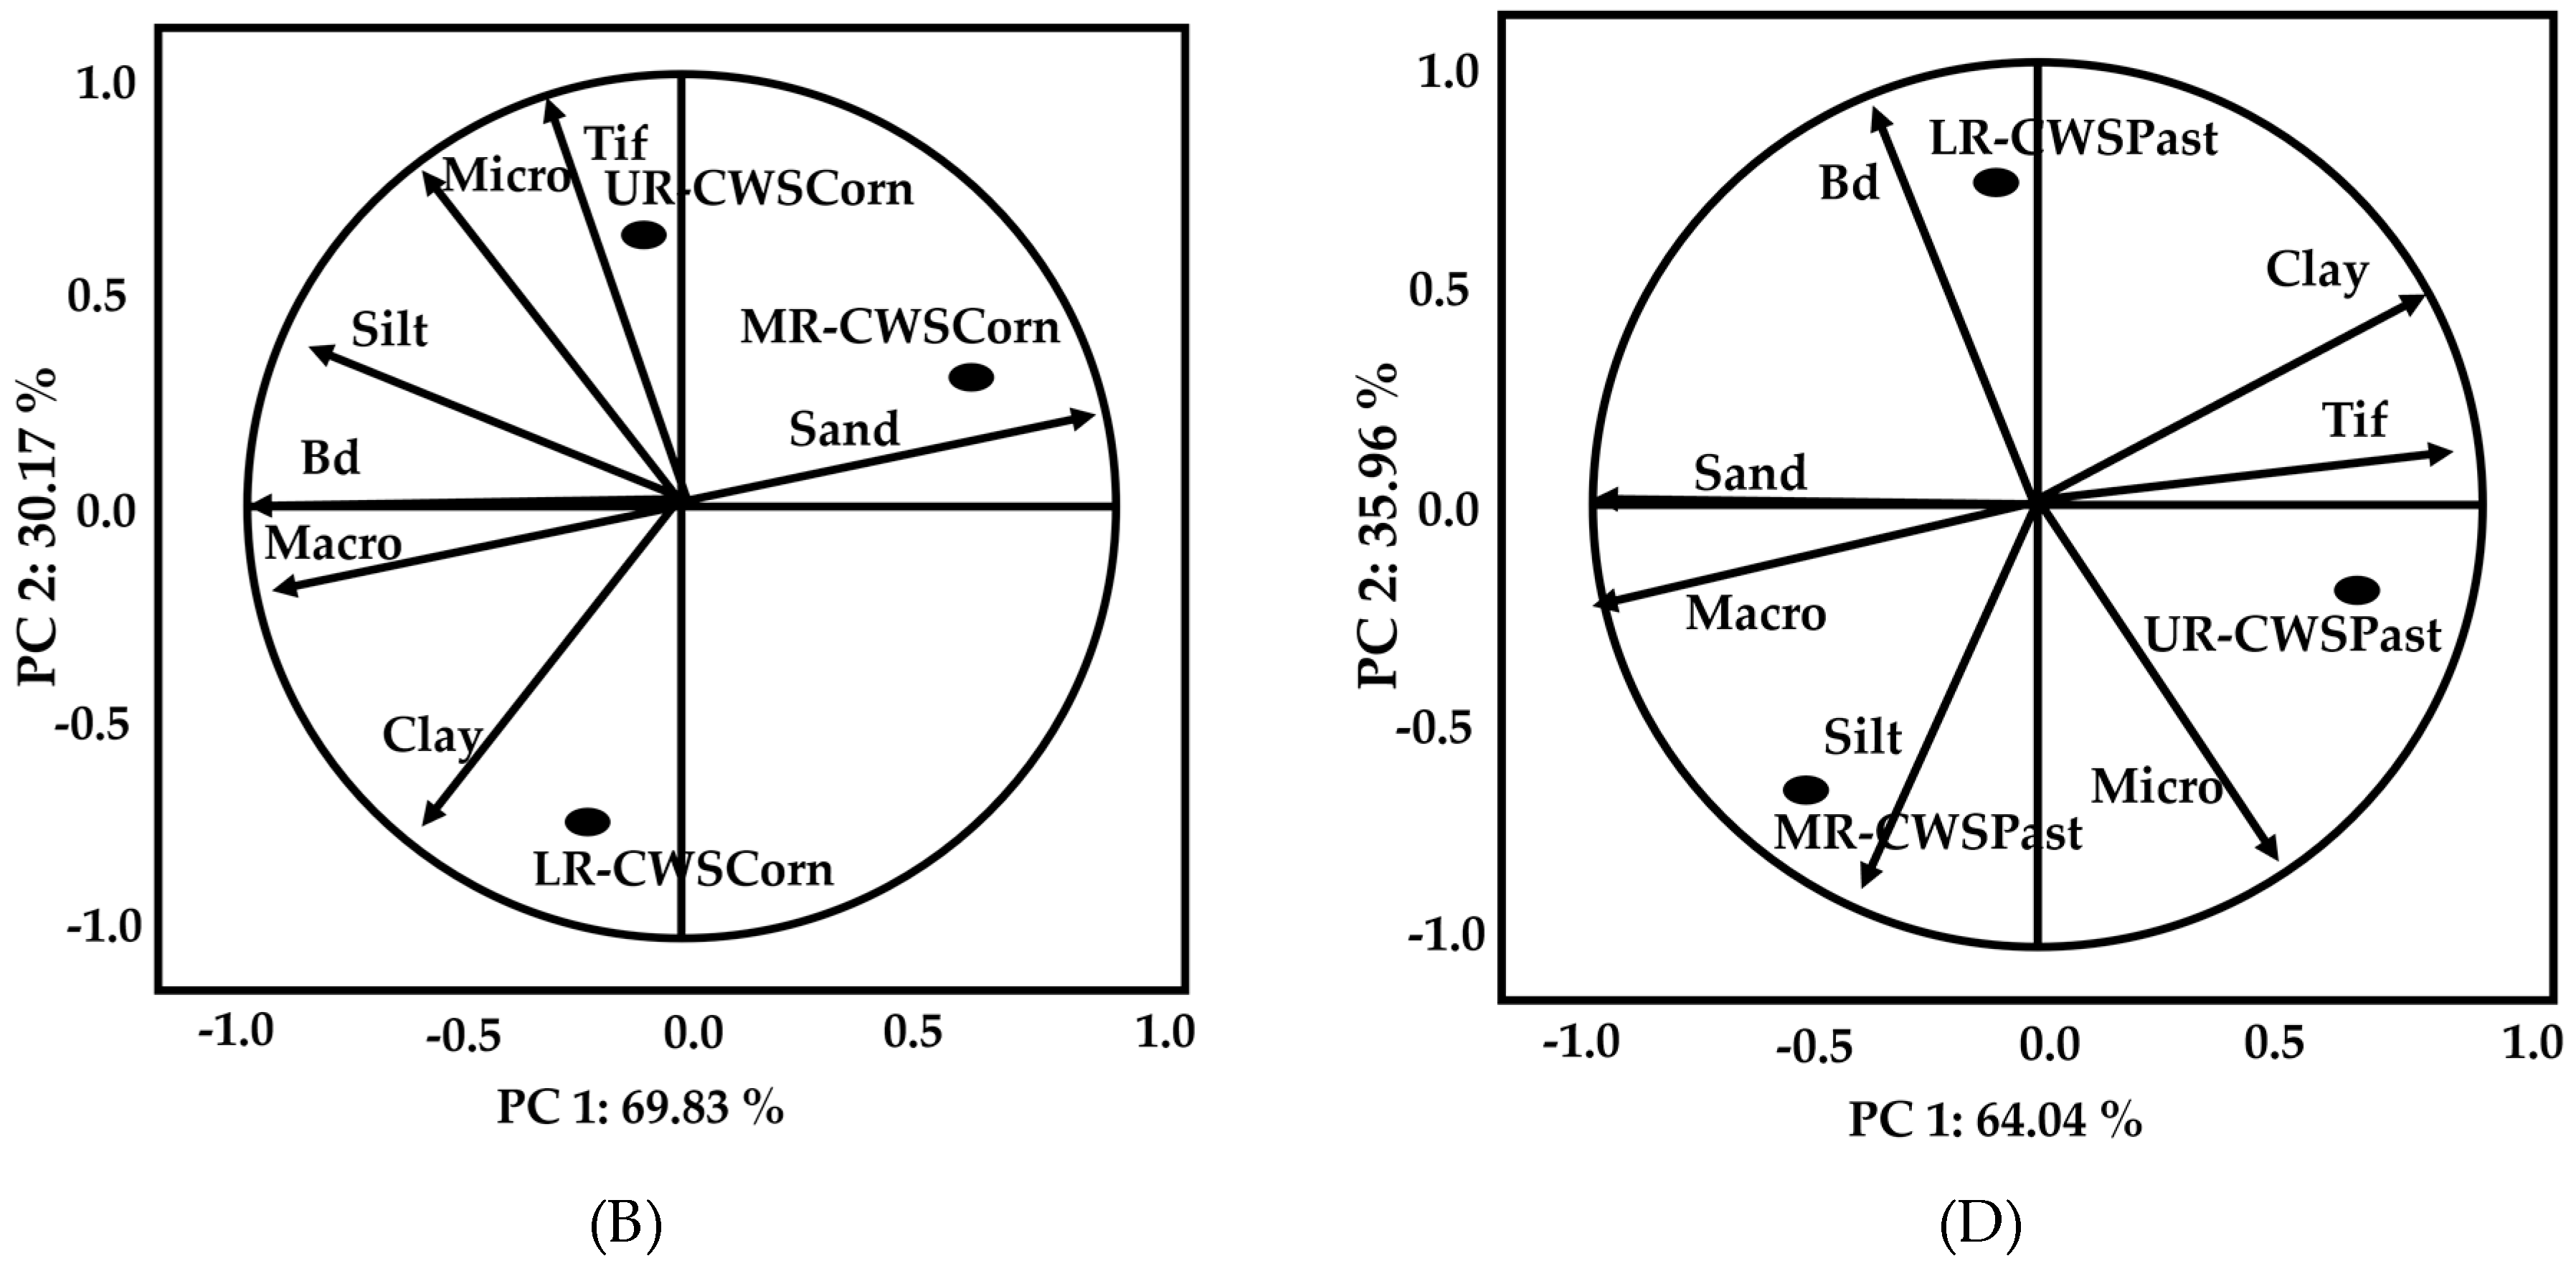
Table 1.
Physical-water characterization of soils and cover dry mass in different regions of the Caiabi and Renato Rivers sub-basins in the 0-10 cm layer.
Table 1.
Physical-water characterization of soils and cover dry mass in different regions of the Caiabi and Renato Rivers sub-basins in the 0-10 cm layer.
| Sub-basin Region | Sand | Clay | Silt | Micro | Macro | TPo | Pd | Bd | K0 | Pdm |
| .............%........... | .........m3 m-3........... | ..... g cm-3...... | cm h-1 | Mg ha-1 | ||||||
| Caiabi River – Cultivated (soybean) | ||||||||||
| Upper | 42.49B | 27.9A | 29.61A | 0.28A | 0.08A | 0.36A | 2.14B | 1.02B | 1.21A | 11.91A |
| Middle | 76.56A | 17.8B | 5.64B | 0.27A | 0.11A | 0.38A | 2.54A | 1.50A | 1.12A | 10.20A |
| Lower | 78.5A | 15.6B | 5.9B | 0.35A | 0.08A | 0.43A | 2.52A | 1.50A | 1.28A | 10.99A |
| Caiabi River – Pasture | ||||||||||
| Upper | 49.24B | 36.1A | 14.66A | 0.27A | 0.10A | 0.38A | 2.44A | 1.41A | 0.33A | 8.24A |
| Middle | 49.21B | 34.6A | 16.19A | 0.35A | 0.02A | 0.37A | 2.33B | 1.58A | 0.67A | 8.90A |
| Lower | 84.37A | 11.0B | 4.63B | 0.29A | 0.11A | 0.39A | 2.61A | 1.58A | 1.70A | 7.26A |
| Renato River – Cultivated (corn) | ||||||||||
| Upper | 75.18B | 16.2A | 8.62A | 0.43A | 0.09A | 0.52A | 2.71A | 1.57A | 0.79A | 5.21B |
| Middle | 82.87A | 12.9B | 4.23A | 0.29B | 0.08A | 0.37B | 2.73A | 1.53A | 1.22A | 6.48B |
| Lower | 73.90B | 19.4A | 6.7A | 0.28B | 0.09A | 0.37B | 2.65A | 1.56A | 0.68A | 12.07A |
| Renato River – Pasture | ||||||||||
| Upper | 80.43A | 15.9A | 3.67A | 0.40A | 0.02A | 0.42A | 2.78A | 1.53B | 1.22A | 8.07A |
| Middle | 83.16A | 12.9A | 3.94A | 0.37A | 0.06A | 0.43A | 2.63A | 1.59B | 0.57A | 8.29A |
| Lower | 81.94A | 14.7A | 3.36A | 0.33A | 0.04A | 0.37A | 2.69A | 1.75A | 0.90A | 6.65A |
Micro = microporosity, Macro = macroporosity, TPo = total porosity, Pd = particle density, Bd = bulk density, K0 = hydraulic conductivity, Pdm = plant dry mass. Means followed by equal capital letters on the same line do not differ significantly from each other using the Kruskal-Wallis test at 5% probability.
Table 2.
Initial and final infiltration rates (Tio and Tif) (mm h-1) in the Caiabi and Renato sub-basins.
Table 2.
Initial and final infiltration rates (Tio and Tif) (mm h-1) in the Caiabi and Renato sub-basins.
| Sub-basin | Trat | Upper | Middle | Lower | |||
|---|---|---|---|---|---|---|---|
| Rio | Rif | Rio | Rif | Rio | Rif | ||
| Caiabi | Cultivated | ||||||
| CS | 66.46Aa | 31.57Ab | 65.31Aa | 45.64Aa | 65.31Aa | 35.16Bb | |
| WCS | 61.82Aa | 15.04Bb | 63.51Aa | 35.67Aa | 44.77Bb | 32.41Ba | |
| SD | 68.54Aa | 34.39Ab | 61.34Aa | 30.98Bb | 71.06Aa | 60.22Aa | |
| Pasture | |||||||
| CS | 34.57Ba | 2.67Cb | 40.62Ba | 15.64Ba | 42.90Ba | 12.23Aba | |
| WCS | 44.14Ba | 3.96Cc | 55.57Aa | 21.29Ba | 40.59Ba | 5.94Bc | |
| SD | 69.86Aa | 56.71Aa | 61.34Aa | 30.98Ab | 61.20Aa | 18.70Ac | |
| Renato | Cultivated | ||||||
| CS | 61.63Aa | 17.92Aa | 39.00Bb | 11.77Ab | 58.38Ab | 18.35Aa | |
| WCS | 61.93Aa | 19.40Aa | 17.40Cc | 11.83Ab | 22.37Bc | 8.00Bb | |
| SD | 63.21Aa | 11.2ABa | 67.11Aa | 5.43Ab | 63.43Aa | 13.43Ba | |
| Pasture | |||||||
| CS | 68.14Aa | 38.64Ba | 26.79Cb | 4.19Cc | 54.01Aa | 12.46Bc | |
| WCS | 63.30Aa | 23.30Ba | 42.43Bb | 1.00Cc | 61.61Ac | 9.76Bb | |
| SD | 69.86Aa | 62.51Aa | 62.57Aa | 37.29Ab | 68.43Aa | 36.26Ab | |
CS = with coverage; WCS = without coverage; SD = soil disturbed. Means followed by equal capital letters in the same column and equal lowercase letters in the same line do not differ significantly from each other using the Kruskal-Wallis test at 5% probability.
Table 5.
Parameters and statistical indices of the best mathematical infiltration models generated for the Caiabi River sub-basin.
Table 5.
Parameters and statistical indices of the best mathematical infiltration models generated for the Caiabi River sub-basin.
| Land cover | Soil management | Model | R2 | RMSE | NSE | |
|---|---|---|---|---|---|---|
| Cultivated (soybean) | Upper | |||||
| CS | Ti = 31.57 +(66.46 – 31.57) e-0.14 t | Horton | 0.84 | 3.79 | 0.85 | |
| WCS | Ti = 4.55+ 116.70 t -0.5 | Philip | 0.86 | 3.27 | 0.86 | |
| SD | Ti = 34.39 +(68.54 – 34.39) e -7.52 t | Horton | 0.51 | 15.68 | -0.66 | |
| Middle | ||||||
| CS | Ti = 42.39+ 46.77t -0.5 | Philip | 0.78 | 1.37 | 0.79 | |
| WCS | Ti = 29.24+ 69.06 t -0.5 | Philip | 0.90 | 1.27 | 0.90 | |
| SD | Ti = 24.16+ 80.08 t -0.5 | Philip | 0.78 | 2.90 | 0.78 | |
| Lower | ||||||
| CS | Ti = 26.98+ 70.23 t -0.5 | Philip | 0.83 | 1.78 | 0.83 | |
| WCS | Ti = 28.58+ 18 t -0.5 | Philip | 0.66 | 1.91 | 0.66 | |
| SD | ------- | ------ | ||||
| Pasture | Upper | |||||
| CS | Ti = 2.67 +(34.57 – 2.67) e-0.15 t | Horton | 0.90 | 2.83 | 0.90 | |
| WCS | Ti = 3.96 + (2.70). 145.19 t -2.70 1 | KL | 0.85 | 3.79 | 0.84 | |
| SD | Ti = 56.71 +(69.86 – 56.71) e -0.13 t | Horton | 0.77 | 2.12 | 0.77 | |
| Middle | ||||||
| CS | Ti = 10.73+ 57.47 t -0.5 | Philip | 0.76 | 3.01 | 0.76 | |
| WCS | Ti = 13.80+ 84.91 t -0.5 | Philip | 082 | 3.71 | 0.82 | |
| SD | Ti = 30.98 +(61.34 -30.98) e -0.15 t | Horton | 0.79 | 3.86 | 0.79 | |
| Lower | ||||||
| CS | Ti = 0.82 + 121.34 t-0.5 | Philip | 0.87 | 3.56 | 0.87 | |
| WCS | Ti = 5.45 + 125.68 t-0.5 | Philip | 0.91 | 2.93 | 0.92 | |
| SD | Ti = 18.70 +(61.20 – 18.70) e-0.18 t | Horton | 0.91 | 2.47 | 0.91 | |
R2 = coefficient of determination; RMSE = mean squared error; NSE = Nash-Sutcliffe efficiency; CS = soil with cover; WCS = soil without cover; SD = soil disturbed.
Table 6.
Parameters and statistical indices of the best mathematical infiltration models generated for the Renato River sub-basin.
Table 6.
Parameters and statistical indices of the best mathematical infiltration models generated for the Renato River sub-basin.
| Land cover | Soil management | Model | R2 | RMSE | NSE | |
|---|---|---|---|---|---|---|
| Cultivated (corn) | Upper | |||||
| CS | Ti = 17.92 +(61.63 – 17.92) e -0.11 t | Horton | 0.72 | 6.77 | 0.72 | |
| WCS | Ti = 19.40 +(61.93 – 19.40) e -0.85 t | Horton | 0.85 | 6.60 | 0.55 | |
| SD | Ti = 11.20+(63.21 – 11.20) e -0.90 t | Horton | 0.90 | 13.68 | 0.20 | |
| Middle | ||||||
| CS | Ti = 6.95+ 62.40 t -0.5 | Philip | 0.83 | 2.57 | 0.84 | |
| WCS | Ti = 9.96+ 12.74 t -0.5 | Philip | 0.23 | 2.12 | 0.24 | |
| SD | Ti = 11.35+ 116.40 t -0.5 | Philip | 0.87 | 5.07 | 0.90 | |
| Lower | ||||||
| CS | Ti = 11.26+ 101.87 t 0.5 | Philip | 0.94 | 2.38 | 0.94 | |
| WCS | Ti = 3.66+ 71.69 t 0.5 | Philip | 0.83 | 2.63 | 0.87 | |
| SD | Ti = Tif +(63.43 – 13.43) e-0.10 t | Horton | 0.92 | 4.13 | 0.92 | |
| Pasture | Upper | |||||
| CS | Ti = 38.64 +(68.14 – 38.64) e -0.27 t | Horton | 0.81 | 3.03 | 0.81 | |
| WCS | Ti = Tif + (0.05) 756.35 t -0.051 | KL | 0.91 | 2.42 | 0.92 | |
| SD | Ti = 62.51 +(69.86 – 62.51) e-0.04 t | Horton | 0.45 | 1.86 | 0.47 | |
| Middle | ||||||
| CS | Ti = 4.19 +(26.79 – 4.19) e-0.13 t | Horton | 0.82 | 2.50 | 0.82 | |
| WCS | Ti = 1.00 + (42.43 – 1.00) e-0.13 t | Horton | 0.82 | 4.48 | 0.85 | |
| SD | Ti = 37.29 + (0.38)79.05 t -0.381 | KL | 0.60 | 5.94 | 0.97 | |
| Lower | ||||||
| CS | Ti = Tif + (0.08) 509.14 t-0.081 | KL | 0.89 | 2.88 | 0.95 | |
| WCS | Ti = 9.76 +(61.61 -9.76) e-0.24 t | Horton | 0.88 | 4.67 | 0.86 | |
| SD | Ti = 36.26 +(68.43 -36.26) e-0.10 t | Horton | 0.84 | 4.69 | 0.84 | |
R2 = coefficient of determination; RMSE = mean squared error; NSE = Nash-Sutcliffe efficiency; CS = soil with cover; WCS = soil without cover; SD = soil disturbed.
Disclaimer/Publisher’s Note: The statements, opinions and data contained in all publications are solely those of the individual author(s) and contributor(s) and not of MDPI and/or the editor(s). MDPI and/or the editor(s) disclaim responsibility for any injury to people or property resulting from any ideas, methods, instructions or products referred to in the content. |
© 2024 by the authors. Licensee MDPI, Basel, Switzerland. This article is an open access article distributed under the terms and conditions of the Creative Commons Attribution (CC BY) license (http://creativecommons.org/licenses/by/4.0/).
Copyright: This open access article is published under a Creative Commons CC BY 4.0 license, which permit the free download, distribution, and reuse, provided that the author and preprint are cited in any reuse.


