

Submitted:
06 June 2024
Posted:
07 June 2024
You are already at the latest version
Abstract
The rapid urban expansion requires an effective management of water resources in small basins, where data are often limited. This article addresses a combination of an empirical hydrological model and Steven Method, a flow extrapolation method that considers the morphological char-acteristics of the cross-section. It also proposes an approach for overcoming the challenges asso-ciated with the lack of information on small water basins in rural to urban transition. A rain-fall event occurred in Pau de Caixeta stream basin (33,7 km²), in the Federal District (DF), in De-cember 2022, was evaluated. The simulation was carried out on the decision support system, Analysis of Complex Basins (ABC), using the rainfall registred by the rain gauge instaled within the monitered area with 3 hours duration and 38 mm of total rainfall, in addiction to the mor-phological and hydraulics characteristics of the study section. The basin presented in this study, has a classification regarding land use: i) urban area: horizontal and vertical residential neigh-borhoods (in the study phase) and rapidly expanding urban infrastructure, ii) rural areas and iii) environmental preservation areas. The results were within the acceptable range of flow extrap-olation errors (16%), indicating the integration of the proposed approaches can guide the devel-opment of impact mitigation strategies and promote sustainable practices in sub-basins.
Keywords:
urban-to-rural transition
; hydrological modeling
; urban water management
1. Introduction
Managing water resources in small river basins has become an urgent priority due to rapid urbanization and lack of hydrological data; therefore, understanding and predicting the effects of urbanization on water systems often require an integrated solution. Potential impacts can be simulated and assist the development of adaptive management strategies.
Hydrological modeling is an important tool for efficient analyses and planning of problems related to water resources. Tucci (2008) emphasized the hydrological modeling of sub-basins is fundamental for the understanding and prediction of the hydraulic effects of interactions between flow regimes and local geomorphological characteristics. According to the author, the lack of representative flow series and other significant hydro-meteorological information interfere with both calibration and validation of models and turn their ability to represent the hydrological conditions of river basins limited. An approach based on the morphological and hydraulic characteristics of the site under analysis is, therefore, required for overcoming the shortage of quantitative data.
Apart from those flow extrapolation methods, the use of empirical rainfall-flow hydrological models is another way of estimating volumes over time, for they are simpler and can be adopted in scenarios where not much information is available. They consider the relationship among precipitation, surface runoff, and morphological parameters of the section, providing a good approximation and helping to understand the hydrological behavior of the sub-basin, which is essential for planning and managing water resources during urban expansion.
This paper proposes a strategy that estimates the maximum flow in an experimental sub-basin in the Federal District (DF). A combination of information on the characteristics of the basin (bathymetric profile and hydraulic conditions of the section, level x flow, automatic level record, automatic rain gauge record, and land use), rain-flow hydrological model, and simplified flow extrapolation methods, such as Stevens-Manning, were considered for the initial estimation of the key curve in the Pau de Caixeta stream, the monitored section
2. Materials and Methods
Figure 1 shows the methodological framework used for the development of the proposal.
2.1. Field of Study
The Hydrographic Unit (UH) of the Ribeirão Santana, a tributary sub-basin managed by the CBH Afluentes Distritais do Rio Paranaíba, has approximately 180 km², spread between the Federal District (147 km²) and Goiás (32 km²). The Ribeirão Santana is the main waterbody in that UH and is classified as a federal watercourse. According to the 2012 study (Classification of critical federal sections) conducted by the Agência Nacional de Águas e Saneamento Básico (ANA), the UH Santana is considered critical regarding quantitative water balance, i.e., the demand for water is greater than its availability.
According to Silva (2023), the strategic relevance of water resource management at the UH Santana is due to the critical state of the water balance and the intensification of water and land use. Consequently, the multiple uses of water must be ensured for current and future generations and conflicts between agricultural uses (irrigation) and urban sanitation must be prevented.
During the monitoring, the sub-basin of the Pau de Caixeta stream, which is an area of great relevance for both implementation and improvement of water resources tools was identified. Table 1 shows the hydrographic categorization and study scales:
Figure 2 displays the location of the study area and the monitoring points used in the Pau de Caixeta stream.
The Pau de Caixeta stream sub-basin has mixed land use involving i) urban areas (horizontal and vertical residential neighborhoods (in study phase) and urban infrastructure expanding rapidly), ii) rural areas with agricultural activities, pasture, and family farming and cattle breeding, and iii) environmental preservation areas (two conservation units are linked by the Pau de Caixeta stream; the parks and the riparian vegetation play an important role in conserving biodiversity, maintaining water quality, bank stability, and protection against erosion). The stream also offers recreational activities at the Cachoeira do Tororó, formed by waters of that watercourse.
The sub-basin has predominant plateau relief in an area of 33.7 km², with some very hilly terrain and a pedology composed mainly of latosol and cambisol soils (SILVA,2023).
The climate, characterized as tropical savannah, changes according to the Federal District region and has two well-defined seasons, namely dry and rainy. During the rainy season, which lasts from October to April, most of the annual rainfall is recorded, with an average of 1,500 mm – the monthly rainfall commonly ranges between 200 and 300 mm. On the other hand, during the dry season, which extends from May to September, the monthly rainfall is significantly lower, with less than 50 mm accumulated rainfall (INMET, 2021).
During the monitoring of the stream, a weighbridge pluviograph obtained rainfall data and a pressure linigraph measured the water level in a section close to the outlet - both devices were installed in September 2022.
A monitoring system has been set up for water level/flow x rate pairs, bathymetric profiles, and water quality. The monitoring was conducted in an experimental fluviometric station near the outlet of the Pau de Caixeta stream sub-basin, Point 02 — Downstream Interference. The flow current meter (FCM) and other materials were used for flow measurements, as shown in Figure 3. The data discretization adopted for the pluviograph and linigraph operation was 15 minutes.
The primary data and measured flows were obtained from January to December 2022 and a data consistency analysis identified problems, possible isolated or systematic operational errors, and existence of flaws and their possible causes. The analytical values are provided in the results section.
Information on the automatic records was obtained from September 2022 to January 2023, with the largest event occurring in December 2022.
The cross-section profiles of the experimental section were surveyed exclusively in the year 2022. No survey information on cross-section, flow, and water quality was available for the place prior to the study. Figure 4 shows the bathymetric profiles surveyed for the point of interest.
Although no significant change was observed in the cross-section over the reference period, unauthorized interference was detected upstream of the point of interest, a dam used for irrigation purposes.
2.2. Event Selection
The choice of the event on December 9, 2022, was based on a preliminary analysis of the level and hyetographs of the rainy season under analysis. Some peaks recorded by the level sensor were identified, as shown in Figure 5.
The rainfall event lasted for 3 hours, with 38 mm of rain and the overflow of the gutter of the Pau de Caixeta stream, set at 4.0 meters on the right bank, was observed (Figure 4).
2.4. Key Curve
Discharge curves provide an efficient method for estimating flows in various scenarios, even in locations with limited data, establishing the ratio between drainage area and flow. On the other hand, flow extrapolation enables predictions of extreme hydrological conditions, thus providing a more comprehensive view of the potential impact of urbanization on water flows. (Collinchonn & Dornelles, 2013)
The aforementioned authors also claimed the great difficulty in constructing the curve of interest at lower levels arises from changes in the shape of the cross-section caused by the frequent deposition and erosion of sediments. Regarding higher levels, the main obstacle is the difficult measurements of maximum flow due to either the safety of the hydrometry equipment, or the speed at which the flood wave occurs. Therefore, several methods of extrapolating key curves (e.g., Stevens e Manning) have been developed over the years.
Stevens e Manning method is the most suitable for extrapolating the key curve in cross-sections with limited data (level x flow), since it considers the morphological characteristics of the place, such as wetted perimeter and wetted area of the bathymetric profile studied (Jaccon e Cudo, 1989). It was based on the Chézy equation and limited to application in pseudo-uniform flows, where the water speed may vary along the length of the river, but remains relatively uniform in each segment of the section. The Chézy equation is represented by the following expression (Jaccon e Cudo, 1989):
where Q = flow (m³/s), Am = wetted area (m²), Rh = hydraulic radius (m), C = Chézy coefficient, and Io = slope of the piezometric line (m/m).
AmRh1/2 and CIo1/2 refer to geometric factor and slope factor, respectively. If the first member of the equation is equal to a constant, function Q can be represented by a line passing through the origin, up to the maximum level (Jaccon e Cudo, 1989).
The Manning method, on the other hand, uses the equations for uniform flow in river channels. In such a case, a variation of the Chézy formula can be used, as claimed by Santos et al. (2001):
where Q = flow (m³/s) and μ = Manning’s roughness coefficient.
According to Jaccon e Cudo (1989), Sefione (2002), and Collinchonn & Dornelles (2013), the extrapolation of the key curve should be conducted using the largest number of methods whose conditions and information allow, comparing the results obtained. They indicate the best curves consider normal calculated flow variations of 5 to 10% in the measured flow range and 10 to 20% in the extrapolated range. They also highlight in cases of over 50% variations in the extrapolation, the curve of interest can no longer be accepted, since the sources of changes, such as failure in the flow measurements, inadequate extrapolation methodology, influence of backwater, and instability of the cross-section must be verified.
2.5. Hydrological Modeling
The ABC — Analysis of Complex Basins — rainfall-flow model was used. This decision support system does not require many input data and uses empirical formulas that help quantify peak flows, making it a suitable model for places with limited hydrological data. Oliveira et al. (1999) claimed ABC6 is a model of adjusted parameters; therefore, information is obtained according to the physical characteristics of the basin and, in particular, drainage area, river length, slope, time of concentration, and precipitation.
Curve Number (CN) infiltration method and the dynamic wave model for flow propagation, which represents watercourses, were adopted in the simulation.
The area of the Pau de Caixeta stream sub-basin was subdivided into four territorial units, namely, urban area, cerrado, agriculture, and pasture, representing soil use and cover. The average CN considered for the basin was 73 and the entire study area was classified as latosol, since it represents more than 70% of the total area.
The rainfall was obtained from the pluviograph and served as input data for modeling in ABC 6. The real situation of the event recorded by the monitoring equipment was simulated.
The model was not calibrated, since its calibration in the ABC model was not the scope of this study. Consequently, the physical characteristics and parameters previously determined for the basin were adopted.
The hydrograph in the empirical rainfall-flow model (ABC6) was generated towards an estimate of the flow discharges in the sub-basin. The results were compared with the flows calculated by a preliminary key curve for the same event for verification of a possible adherence of the data for the construction of a future curve of interest.
2.5.1. Preparation of Hydrographs and Separation of Base Flow
The hydrographs were developed from the flow results and discretized every 15 minutes. The simulated hydrograph is the result produced by the ABC 6 model, where the characteristics of interest were added, such as thalweg length, basin area, slope, delay roughness, difference between levels, manning roughness, CN, and others.
The adjusted hydrograph is the result from the estimated key curve of the experimental section. However, for comparisons with the flows simulated by the model, the base flow must be separated so that only the portion of surface runoff is considered. For such a purpose, the mathematical filter described by Arnold and Allen (1999) was applied to the event’s flow series.
2.6. Method for Extrapolating Flows
The methodological procedure conducted by Gomes (2017) was adopted for the extrapolation of flows, i.e., the curve was extended to the levels of the cross-section by the Stevens method, adjusting an equation for the relationship between the level and the product of the geometric terms of the Manning formula (Am∙Rh⅔).
Initially, the existence of a linear relationship between AmRh2/3 x Q was verified for the section data and the fit of an equation was the checked. The equation calculated the flows for the extrapolated levels.
The preliminary key curve equation was adjusted to the measured level and flow values and calculated the flows up to 230 cm (maximum level of flow measured during the reference period), from which they were calculated by the extrapolation methodology presented.
After that stage, a graphical check was performed between the results of the initial adjustment to the key curve in the range of measured levels and flows. The same check was conducted on the extrapolated range and compared with the flow discharges simulated by the empirical rainfall-flow model.
Finally, the relative error was calculated by the following expression for comparisons of the flows adjusted by the extrapolation curve and the simulated/measured flows:
where Er: Mean relative error (%), Abs: Absolute value, Q1: measured/simulated flow rate, and Q2: flow rate calculated by extrapolations.
The Materials and Methods should be described with sufficient details to allow others to replicate and build on the published results. Please note that the publication of your manuscript implicates that you must make all materials, data, computer code, and protocols associated with the publication available to readers. Please disclose at the submission stage any restrictions on the availability of materials or information. New methods and protocols should be described in detail while well-established methods can be briefly described and appropriately cited.
Research manuscripts reporting large datasets that are deposited in a publicly available database should specify where the data have been deposited and provide the relevant accession numbers. If the accession numbers have not yet been obtained at the time of submission, please state that they will be provided during review. They must be provided prior to publication.
Interventionary studies involving animals or humans, and other studies that require ethical approval, must list the authority that provided approval and the corresponding ethical approval code.
3. Results/Discussion
The model was applied for the rain event recorded by the pluviograph on 12/09/22, with a 3-hour duration and a 38 mm accumulated volume of rain, leading to a 17.03 m³/s simulated peak flow approximately 2 hours after the start of the rainfall. Figure 7 shows the result of the simulated hydrograph for the Pau de Caixeta stream during the event.
The 73 average CN used for the simulation indicates the basin is less permeable and more subject to surface runoff in response to rainfall.
The data collected during monitoring (e.g., bathymetric profile of the section (Figure 4) were used by the method for extrapolating flows in the cross-section. The results of the interactions adopted in the method applied (Stevens by Manning) are shown in Table 2. Figure 8 displays the fit of the lines for the ratio between level and flow and the product of the calculated geometric terms of the section under study.
The result of the preliminary fit of the key curve, using the ratio between measured flow discharges and observed levels, is provided in Figure 9.
The R² between measured and adjusted flow rates was R² = 0.9807. The relative errors between the flows were lower than 11%, showing the existing high correlation. Table 3 shows the results of the comparative evaluation.
In this sense, adopting the researched literature as a standard: Jaccon e Cudo (1989), Sefione (2002), and Collinchonn & Dornelles (2013), the flow rates preliminarily estimated for the Pau de Caixeta stream cross-section are within the permitted 5 to 10% variation in the range of measured flow rates, except for the measurement carried out on June 22nd.
In Jun/22, the relative error was 0.66% higher than the one permitted. However, when evaluating the order of magnitude, it can be seen that the difference is less than 3 L, and is associated with the change in the hydrometric windlass (the micro-windlass was used in this campaign), so it does not indicate an error in the extrapolation method, but an expected difference due to the change in measuring equipment.
Figure 10 shows the results of the hydrographs of the flows adjusted by extrapolation with the flows simulated by the ABC model and the hyetograph of the event on 09/12/22 in the cross-section.
As addressed elsewhere, the maximum bathymetric level established in the field was 4.0 meters, corresponding to a lower than 15 m³/s flow, according to the adjustment of the initial key curve for the extrapolation of flow discharges.
The maximum level was extended to 4.40 m so that the effects of the water column measured by the linigraph could be calculated. Above 4.0m, the flows associated with the overflow of the cross-section are verified, and their occurrence constitutes a critical situation.
An evaluation of the flows calculated for the cross-section with the level records from the linigraph revealed the same characteristic observed in the hydrograph from the rainfall-flow model, i.e., the discharge peak occurs approximately 2 hours after the start of the rainfall.
When only the curve calculated by the adjustment is considered, the linigraph records show a smoother decay associated with the interference verified (impoundment of the water body).
The impoundment was not considered in the modeling due to the unavailability of data on the structure, thus leading to shorter time of the flood wave in the model. For numerical comparison purposes (simulated flow x adjusted flow), the level records of the linigraph were substituted in the adjusted equation, obtaining the real-time flow estimate of the section. Table 4 shows the quantitative differences in the comparison.
The runoff curves up to the peak are similar; however, the adjusted hydrograph of the key curve (data on the linigraph) shows the peak flow and the transit time of the flood are longer. Therefore, peak flow was used as the criterion for comparison.
In this sense, adopting the researched literature: Jaccon e Cudo (1989), Sefione (2002), and Collinchonn & Dornelles (2013), the maximum flows preliminarily estimated for the Pau de Caixeta stream cross-section are within the admitted error range of 10 to 20% for flows in the extrapolated range. Despite adherence to the variation criterion, nothing replaces the flow and level measured in the field, so these values are just an estimation based on the morphological and hydraulic characteristics of the cross-section.
4. Conclusion
The flow estimates determined by the Stevens extrapolation method through the geometric product of Manning’s formula were close to the values observed in loco. In the range of flow rates measured, the difference between the flow rate adjusted by the curve was 5% on average.
Since the flow during the monitoring period could not be measured in the extrapolated range, the flows simulated by a simplified rainfall-flow model were used and the results were within the accepted range for relative key curve errors.
The results of the comparison between simulated and extrapolated flows was 16%, which is within the acceptable limit. However, measurements of the level x flow pairs covering the maximum levels of the bathymetry of the watercourse must be obtained for confirming the trend observed.
This study explored the extrapolation of flows towards anticipating extreme flooding situations. The approach provided valuable data for guiding urban planning and hydrological risk management, especially in areas of limited information, such as the Pau de Caixeta stream.
The results highlighted the benefits of combining hydrological monitoring (level, flow, bathymetric profile, pluviograph, and linigraph), simplified hydrological models, and extrapolation of flows in small basins.
The case study presented has proved essential for guiding decisions in environments of urban expansion, where the impacts on water resources are significant and information is scarce.
The high slope stands out in the sub-basin of the Pau de Caixeta stream and, combined with the criteria of limited infiltration and the advance of urbanization, makes the region more vulnerable to problems arising from surface runoff. It is Therefore, the flooding potential of that water body must be understood and measures must be evaluated for mitigating impacts before the total urban densification planned, which will affect around 1 million people.
The case study has also highlighted the urgent need for improvements in water resource management instruments in the sub-basin and continued hydrological monitoring is essential for a proper planning of water resources in the area. Effective rainwater management, erosion control practices, and sustainable urban planning are crucial for the minimization of negative impacts on the area.
Author Contributions
Conceptualization; methodology; validation; formal analysis; writing—original draft preparation; writing—review and editing; visualization: Eliza C. B. Silva, Carlos Tadeu C. Nascimento, Renato B. Miranda and Frederico F. Mauad; Software; investigation; resources; data curation: Eliza C. B. Silva, Carlos Tadeu C. Nascimento; Supervision: Carlos Tadeu C. Nascimento and Frederico F. Mauad. All authors have read and agreed to the published version of the manuscript.
Acknowledgments
We would also like to thank the Universidade de Brasília (UNB) and the Escola de Engenharia da Universidade de São Paulo (USP) for their technical and scientific support during the study, especially the Núcleo de Hidrometria and the Centro de Recursos Hídricos e Estudos Ambientais. This research was funded by the Conselho Nacional de Desenvolvimento Científico e Tecnológico (CNPq).
References
- COLLISCHONN, W., & DORNELLES, F. “Hidrologia para Engenharias e Ciências Ambientais”. Porto Alegre: ABRH. 2013.
- GOMES, J. “Investigação sobre métodos de extrapolação da Curva de Descarga”. In: Simpósio Brasileiro de Recrusos Hídricos. 1997, Vitório-ES. ABRH. v1.1.p.509-515.
- JACCON, G.; CUDO, K. J. “Curva-chave: Análise e Traçado”. Brasília: DNAEE, 1989.
- OLIVEIRA, C. P. M.; PORTO, R. L.; ZAHED FILHO, K; ROBERTO, A. N. “ABC 6, um sistema de suporte a decisões para análise de cheias em bacias 79 complexas” in Anais do XIII Simpósio Brasileiro de Recursos Hídricos, Belo Horizonte, dez. 1999, 1, pp.56-65.
- SEFIONE, A. L.” Estudo comparativo de métodos de extrapolação superior de curvas-chave”. Dissertação de Mestrado. Universidade Federal do Rio Grande do Sul, 2002 (IPH/UFRGS).
- SILVA, E.C.B., 2023. “Aplicação do Modelo Hidrológico WEAP como Subsídio à Gestão de Recursos Hídricos e Acompanhamento de Indicadores Hidroambientais na Bacia Hidrográfica do Ribeirão Santana DF/GO”. Dissertação de Mestrado. Programa de Gestão e Regulação de Recursos Hídricos – PROFÁGUA - Universidade de Brasília, 2023.176 p.
- TUCCI, C.E.M.(Org.). “Hidrologia: ciência e aplicação”. 4ª ed. UFRGS/ABRH, Porto Alegre, 2012 943p.
Figure 1.
Methodological framework.
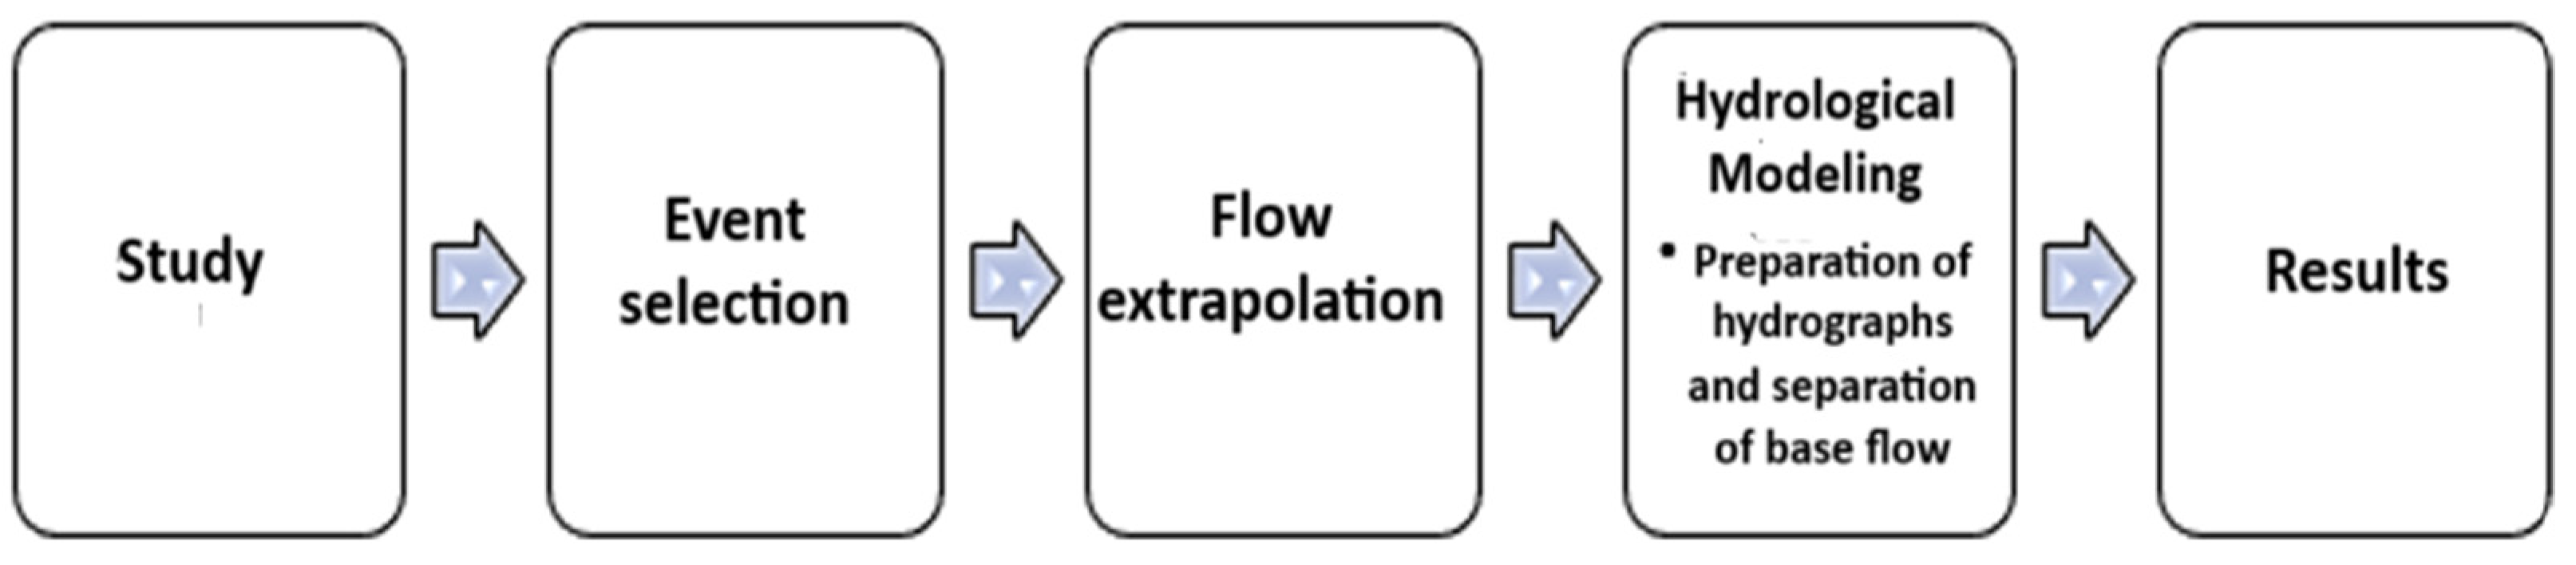
Figure 2.
Location of the sub-basin of the Pau de Caixeta stream (DF) and the monitoring point at the outlet of the basin under study.
Figure 2.
Location of the sub-basin of the Pau de Caixeta stream (DF) and the monitoring point at the outlet of the basin under study.
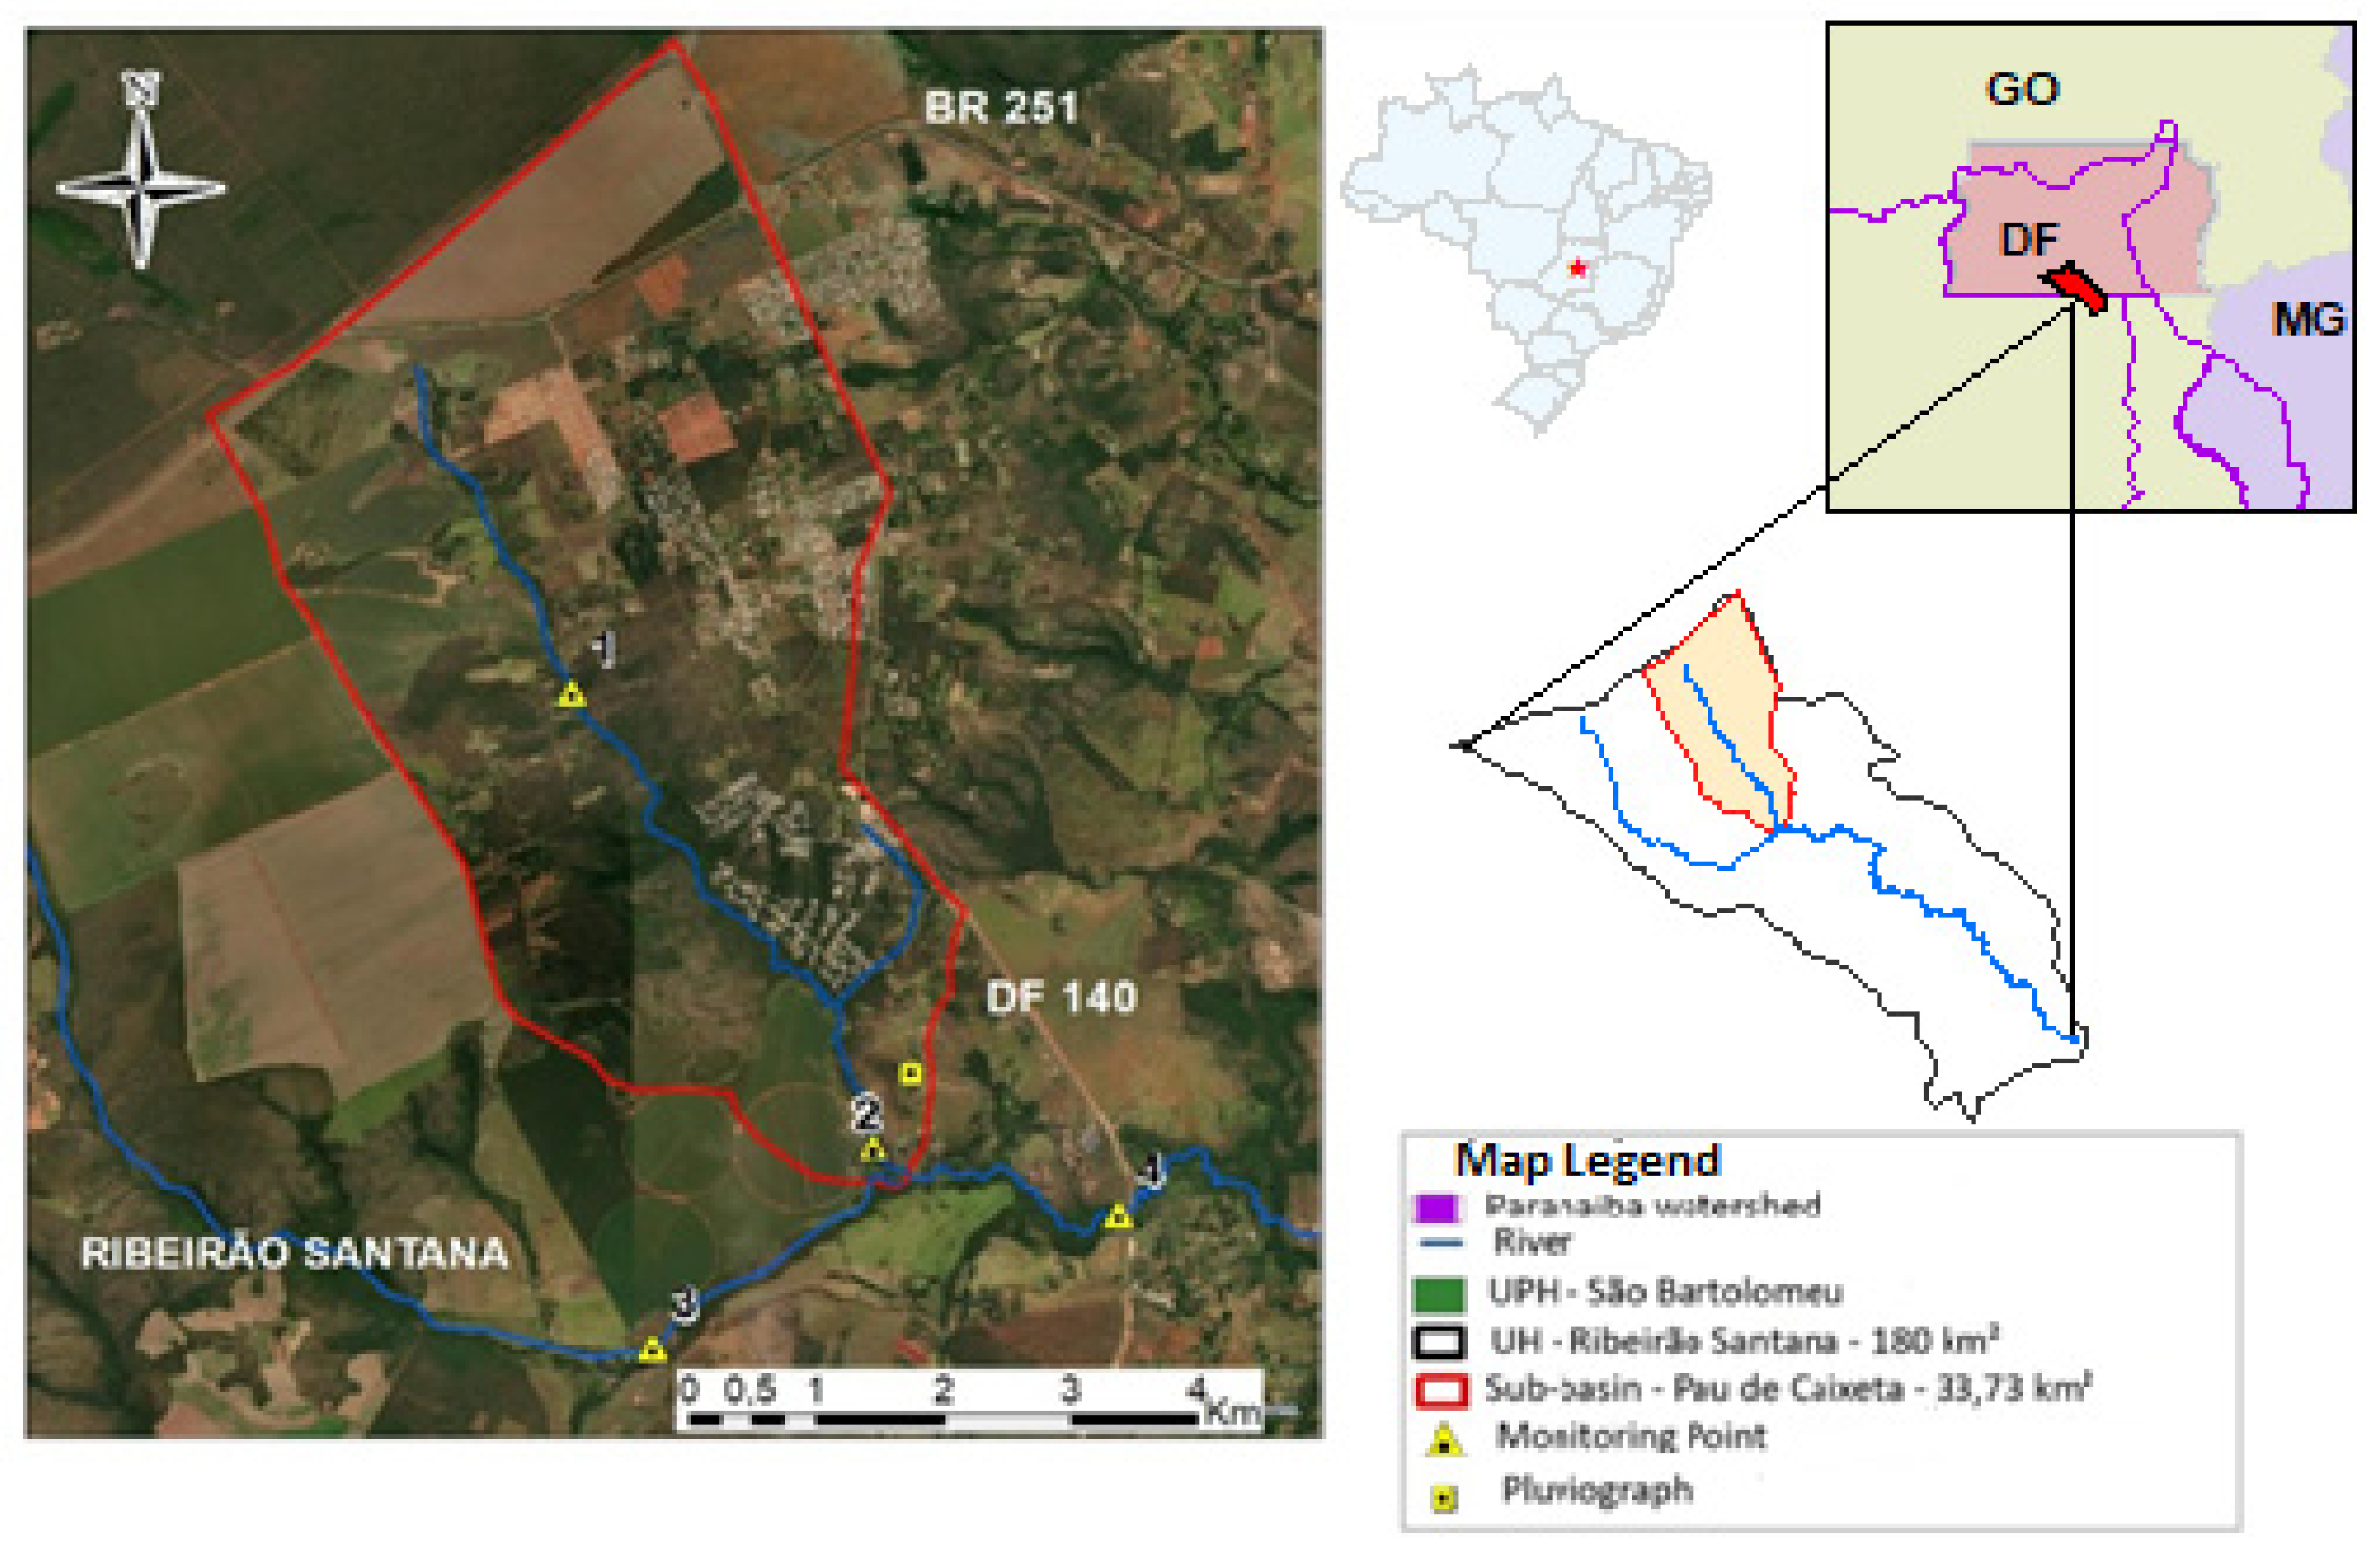
Figure 3.
Equipment used in the monitoring of the sub-basin of the Pau de Caixeta stream. a) hydrometric windlass; b)river bathymetry; c) river flow measurement; d) pluviograph and linigraph.
Figure 3.
Equipment used in the monitoring of the sub-basin of the Pau de Caixeta stream. a) hydrometric windlass; b)river bathymetry; c) river flow measurement; d) pluviograph and linigraph.
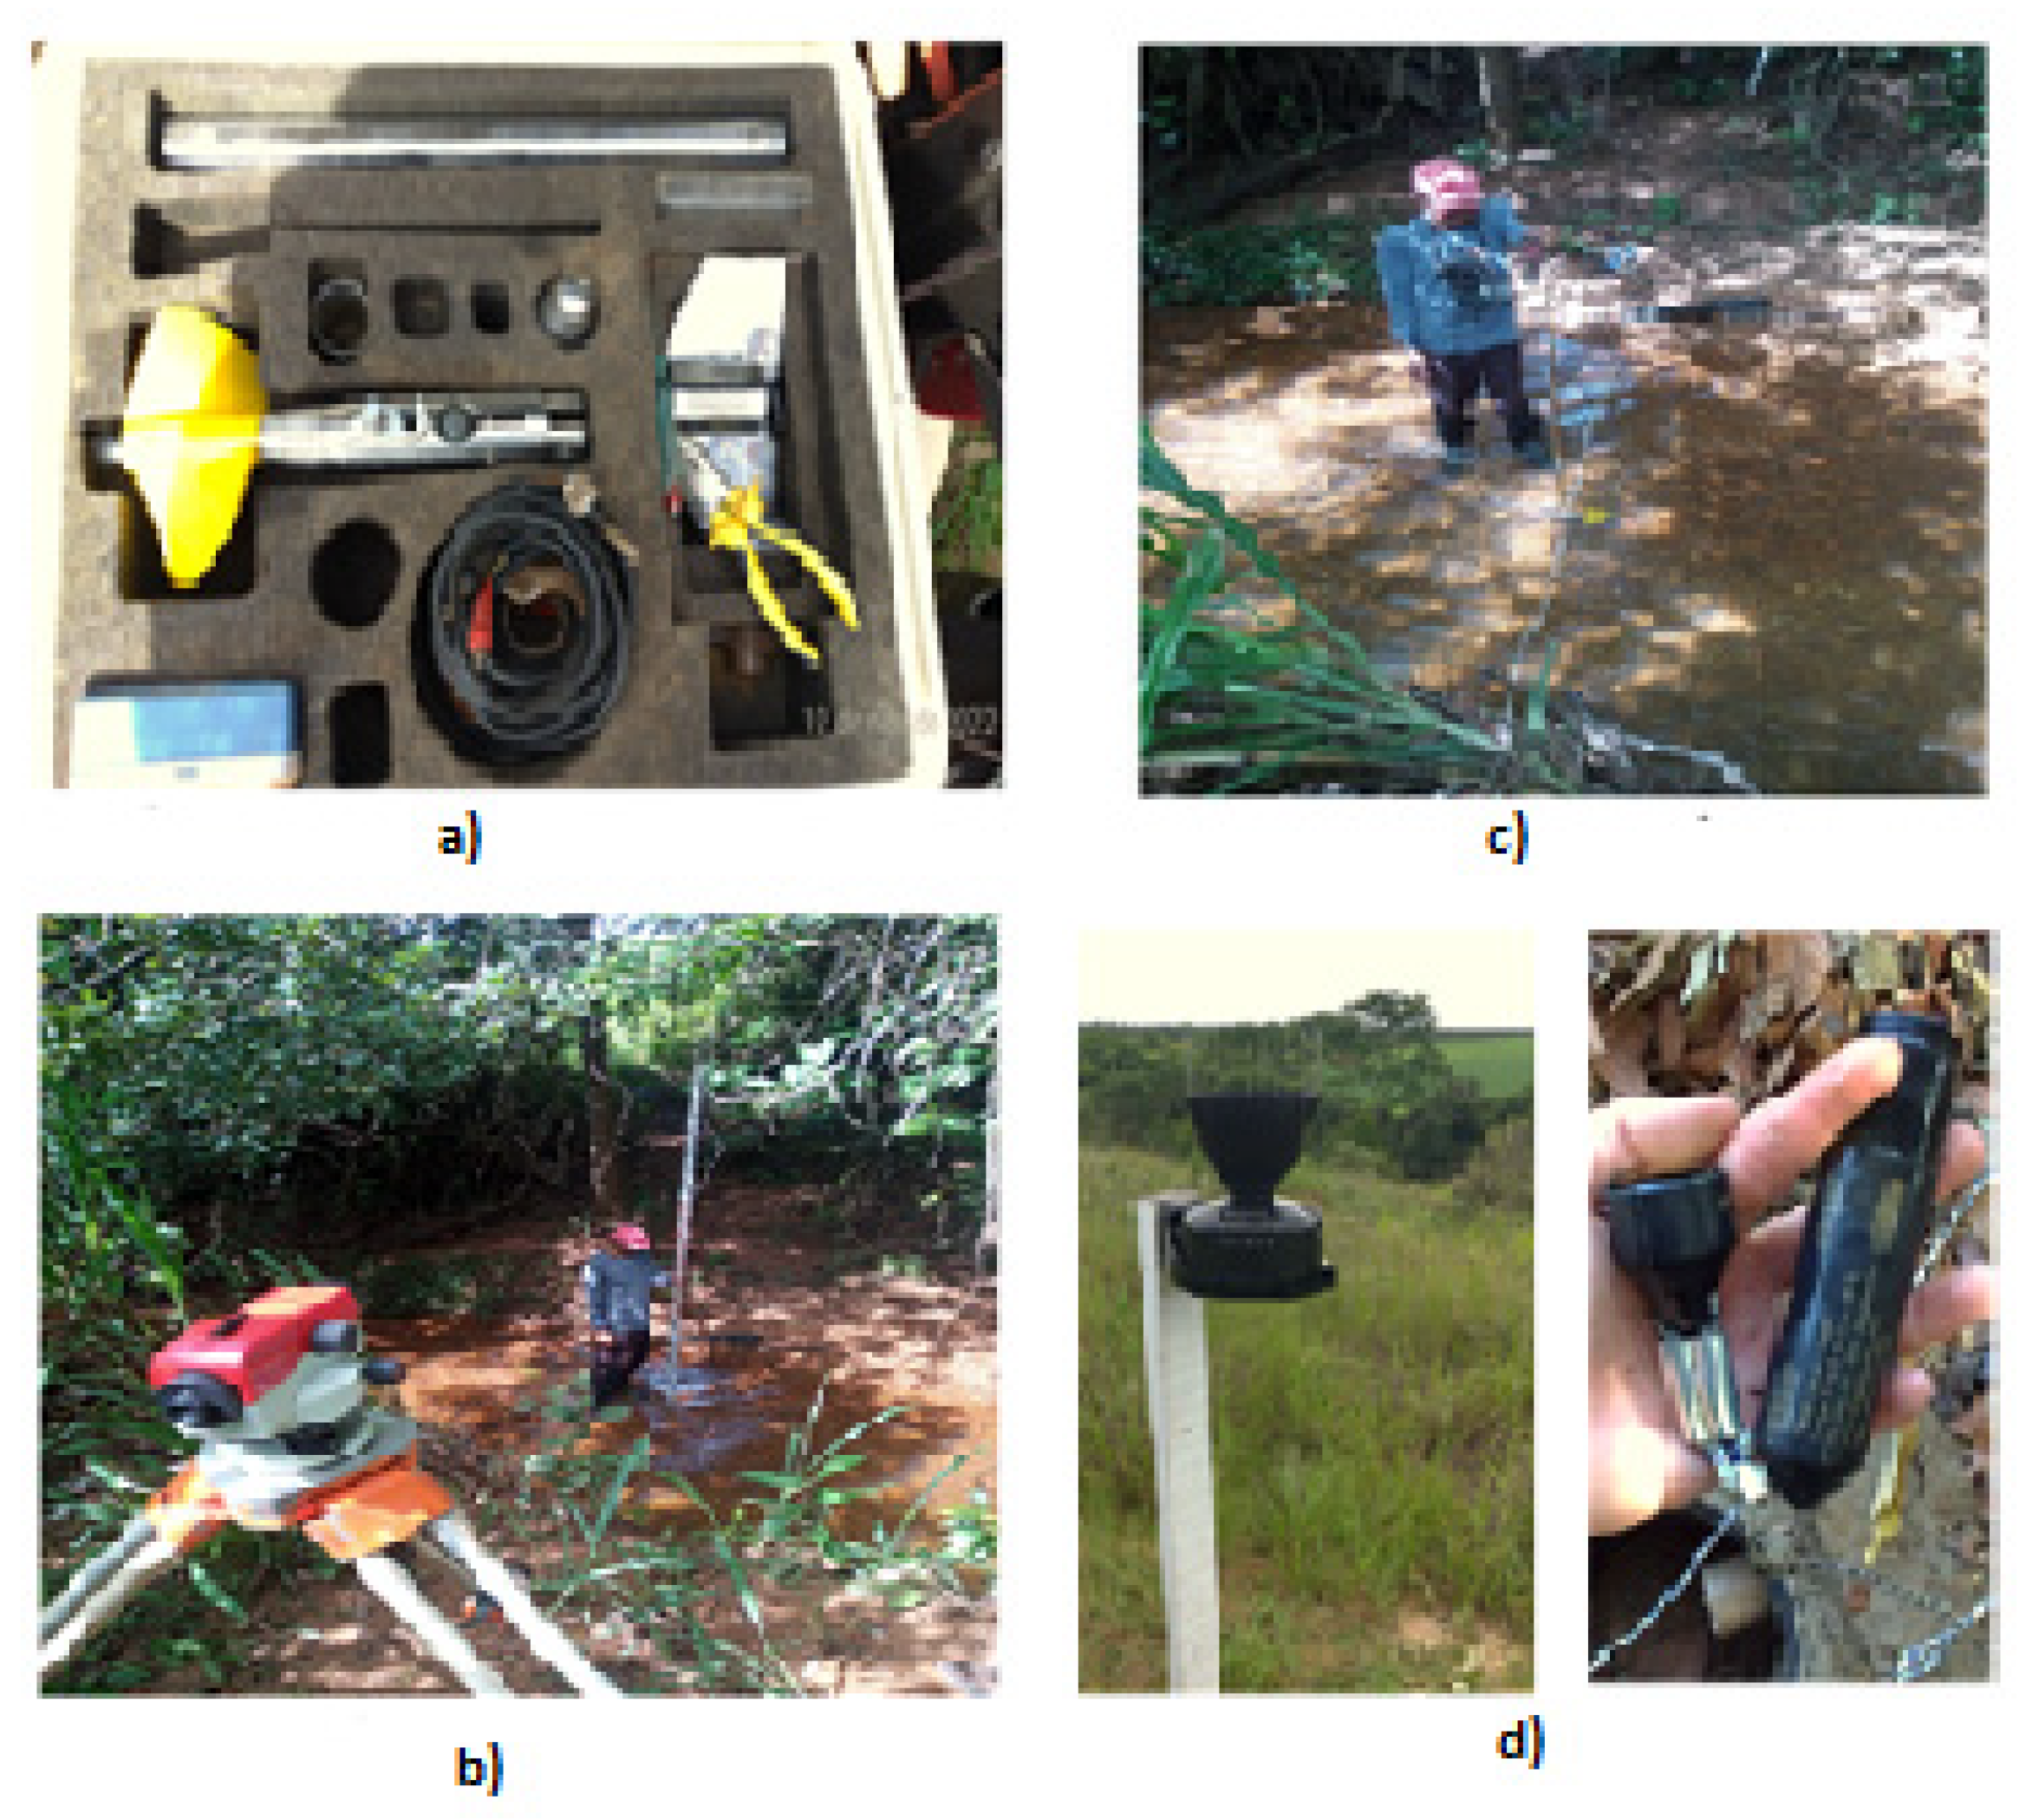
Figure 4.
Cross-sectional profiles of the Experimental Station, Pau de Caixeta 02 — Downstream Interference.
Figure 4.
Cross-sectional profiles of the Experimental Station, Pau de Caixeta 02 — Downstream Interference.
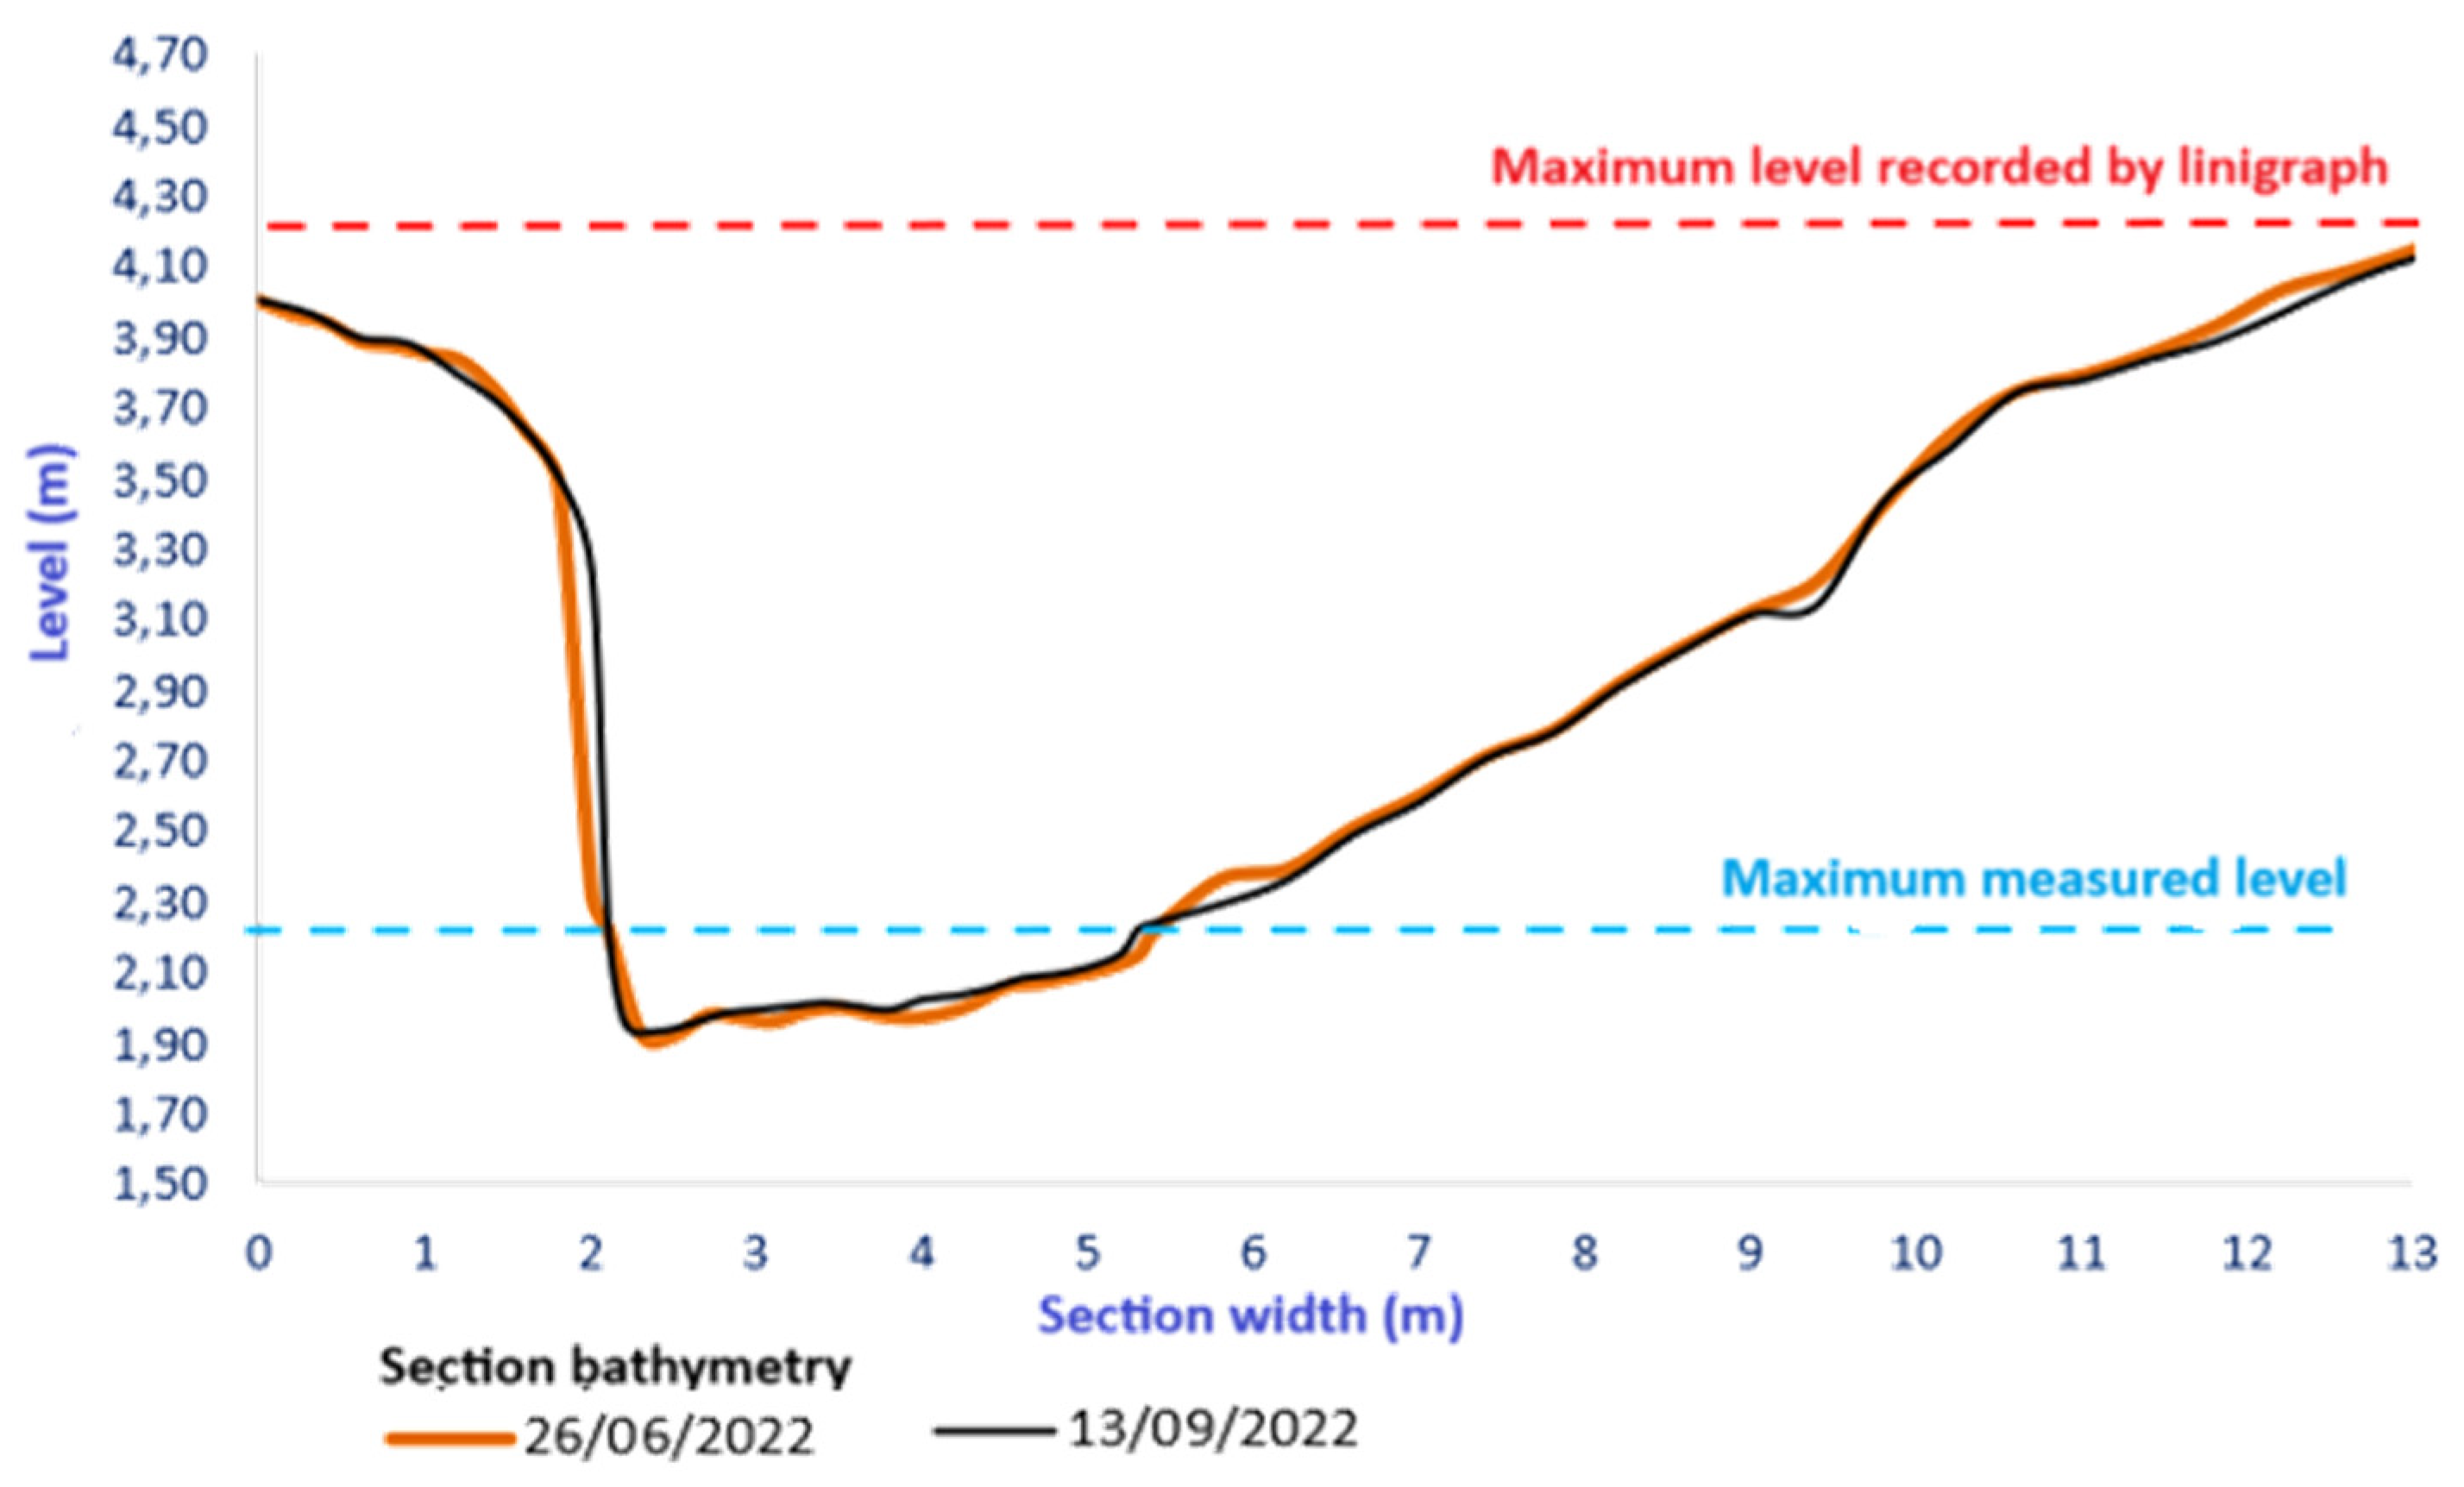
Figure 5.
Pressure Sensor Registers (Linigraph).
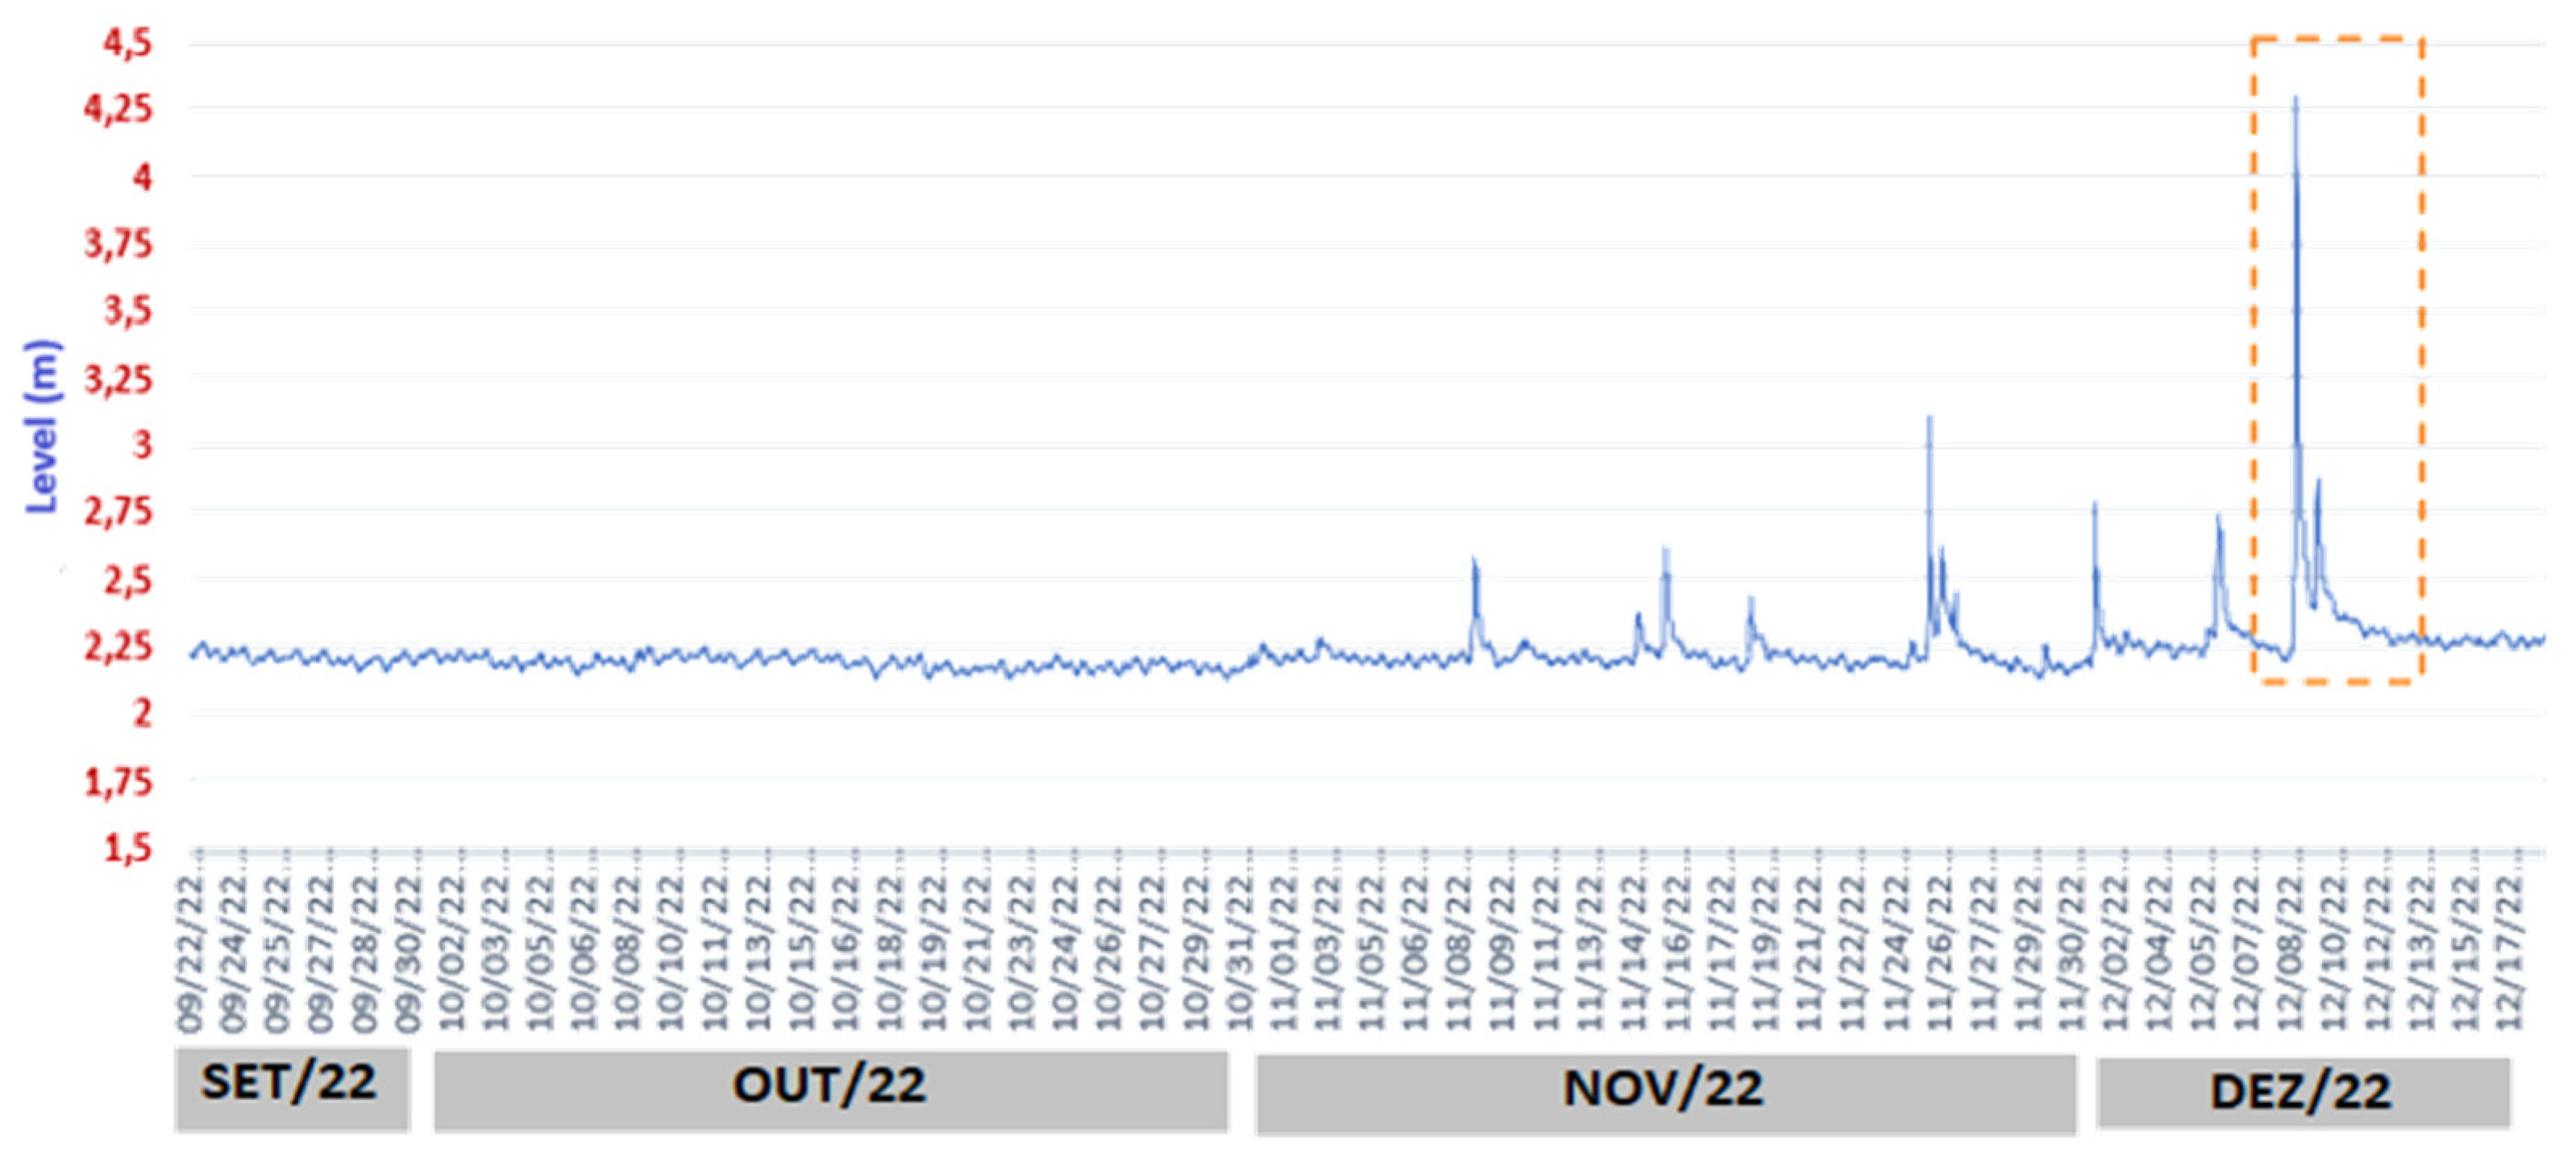
Figure 7.
Input hyetograph and simulated hydrograph for the event on 12/09/22.
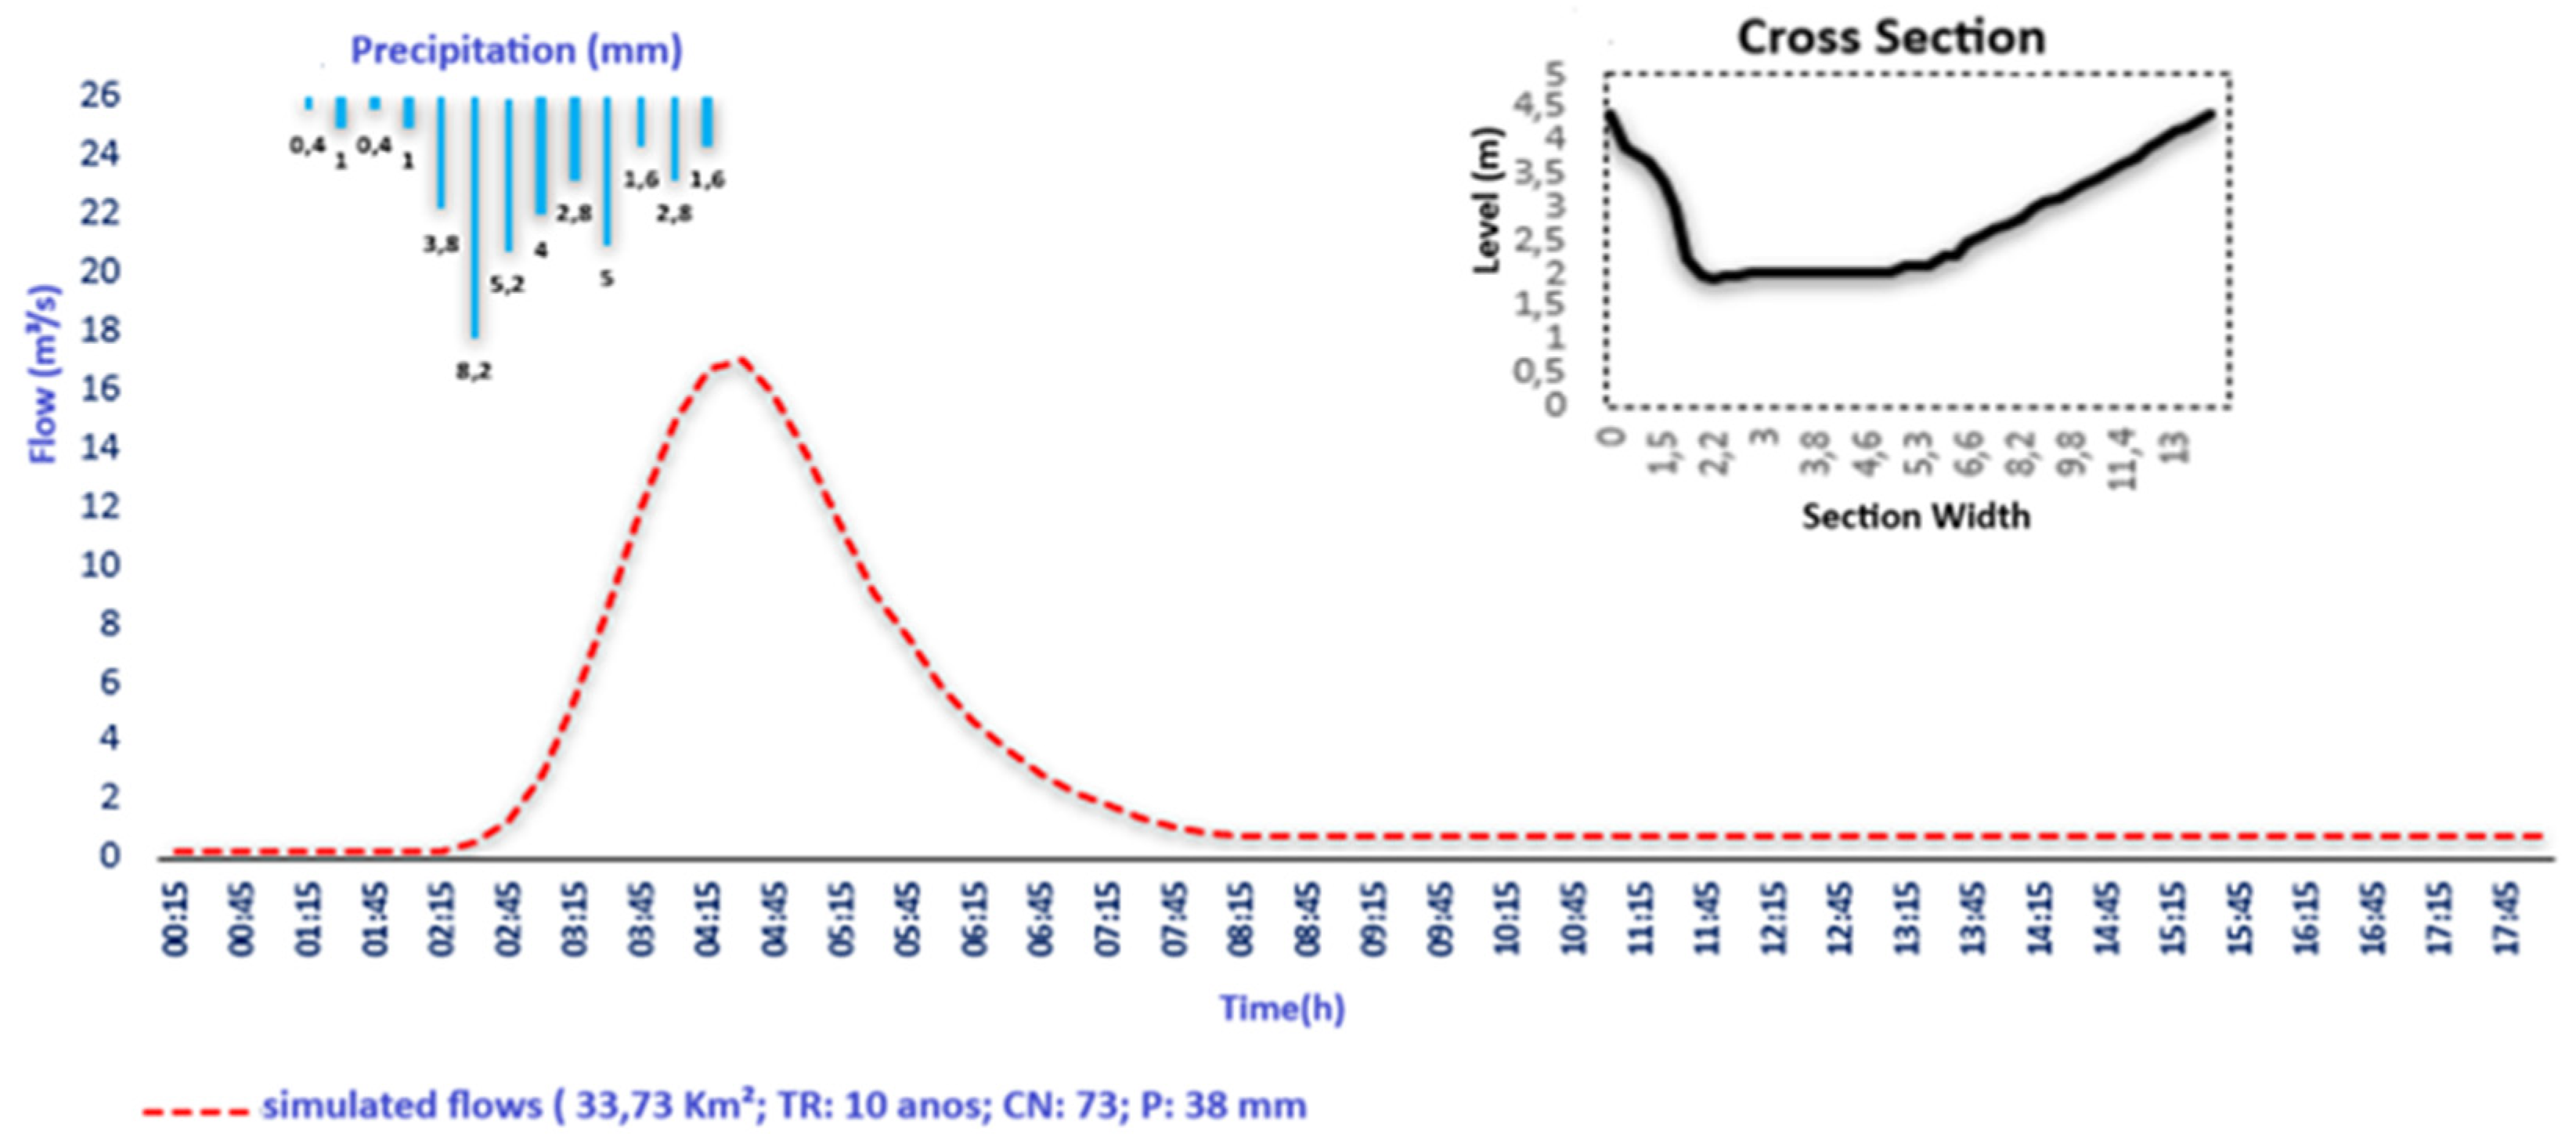
Figure 8.
Initial extrapolation of the level (h) x flow (Q) key curve using the Stevens method by Manning, Pau de Caixeta stream.
Figure 8.
Initial extrapolation of the level (h) x flow (Q) key curve using the Stevens method by Manning, Pau de Caixeta stream.
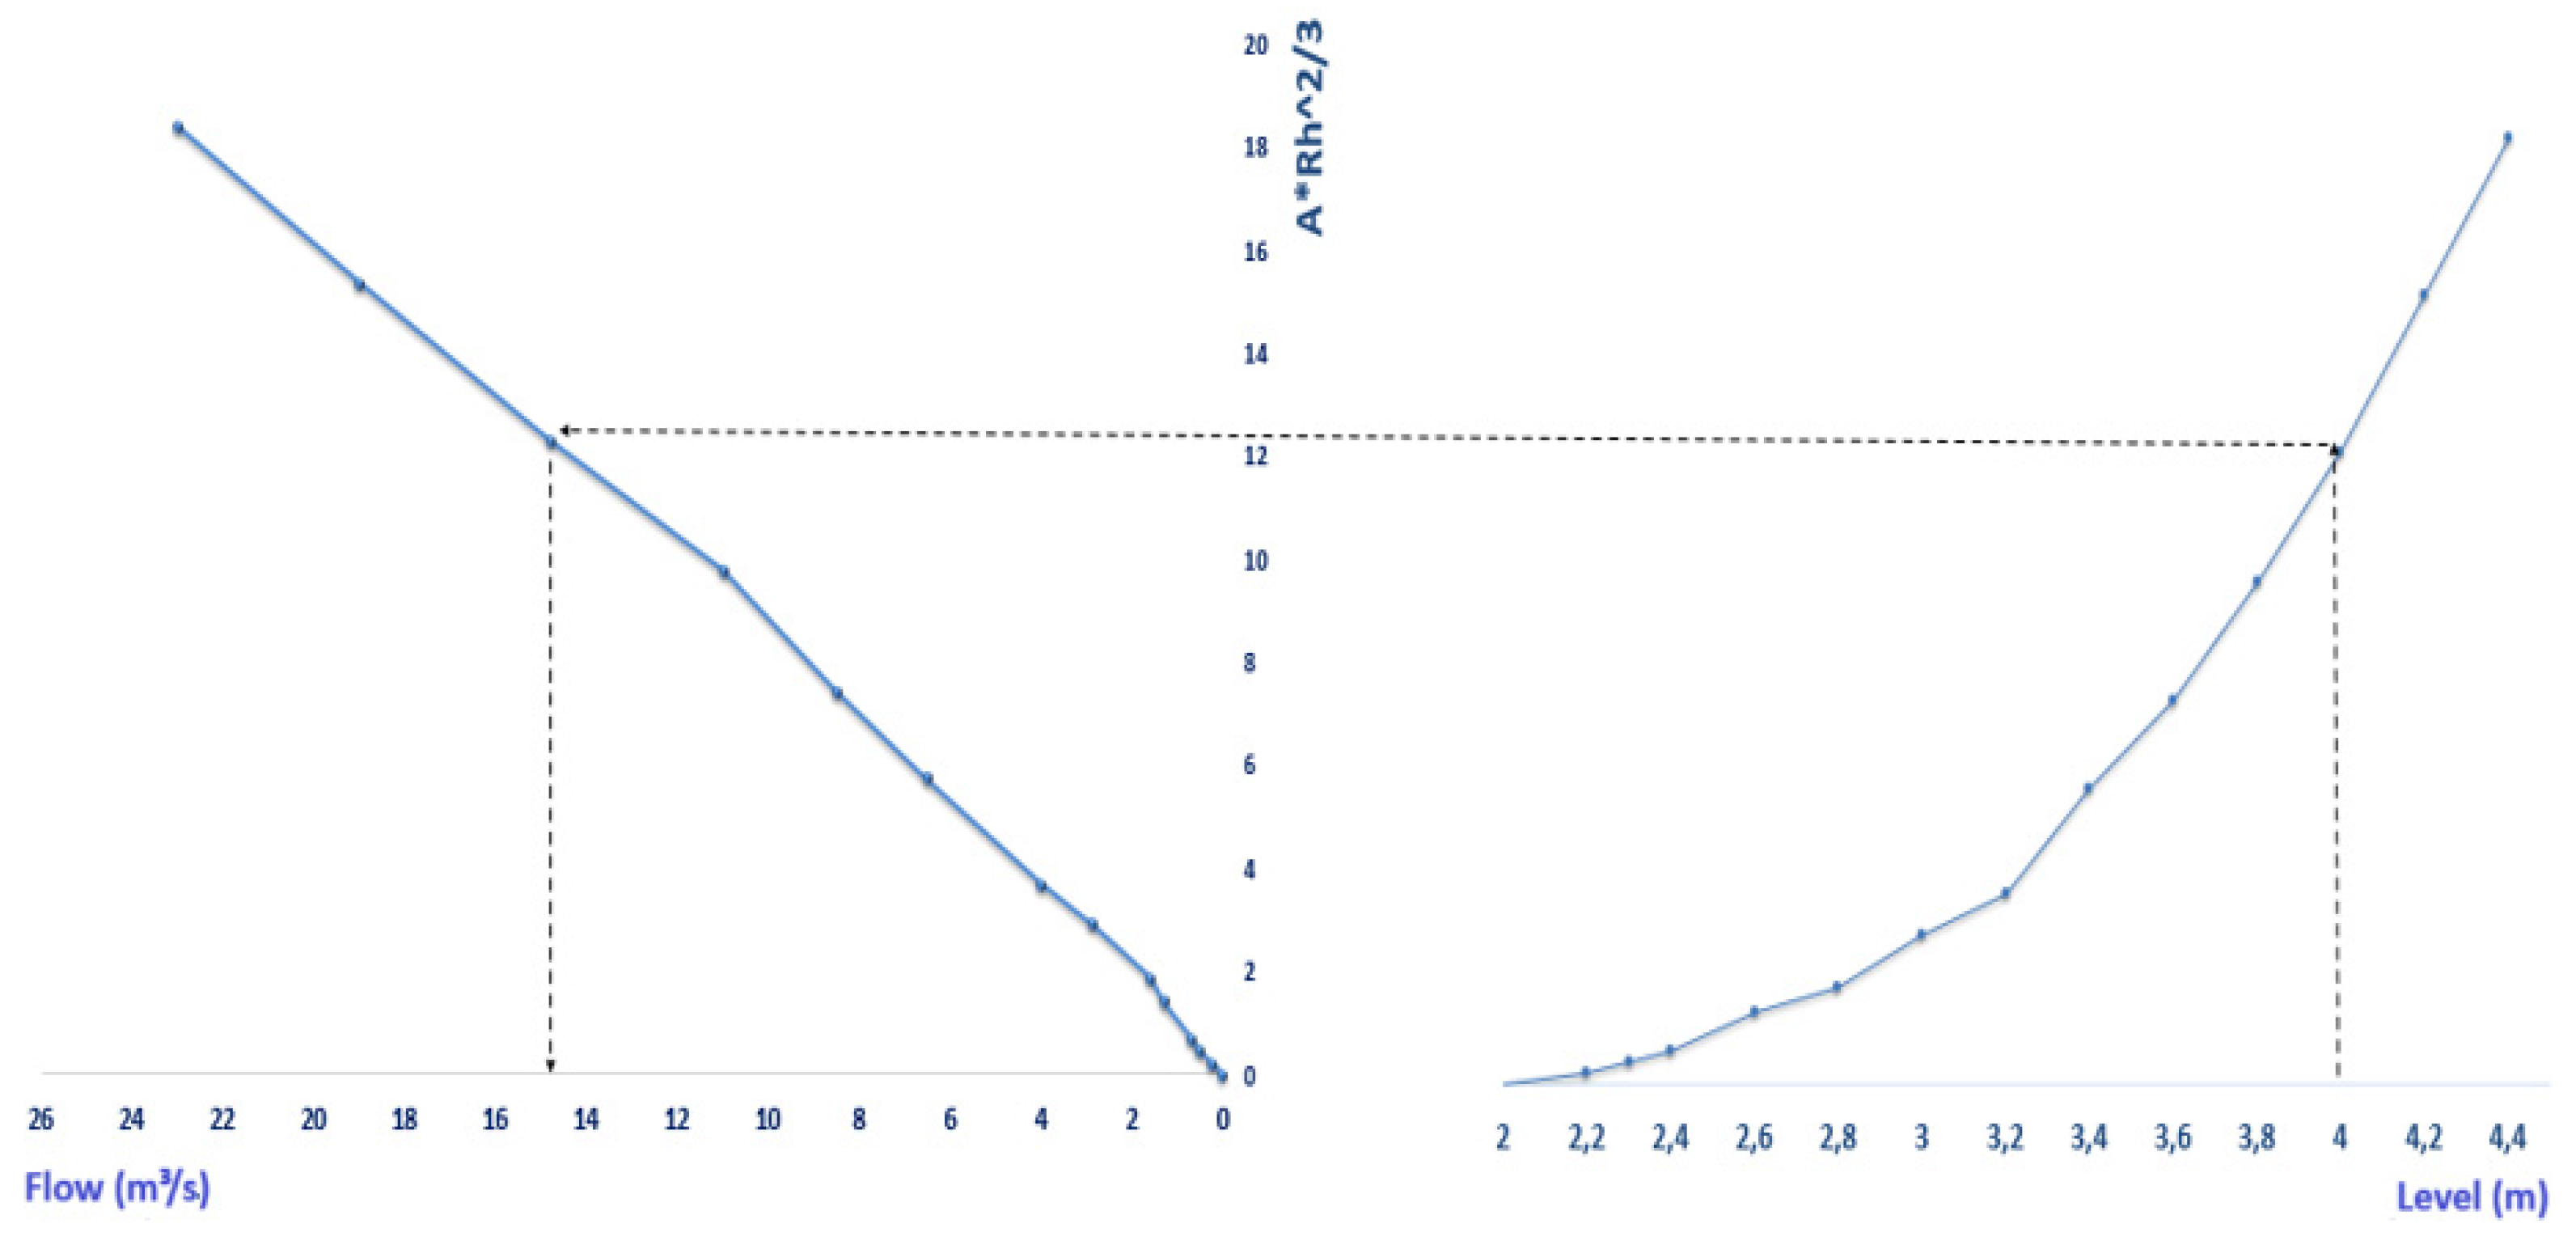
Figure 9.
Key curve fit (range of measured data) and coefficient of determination R².
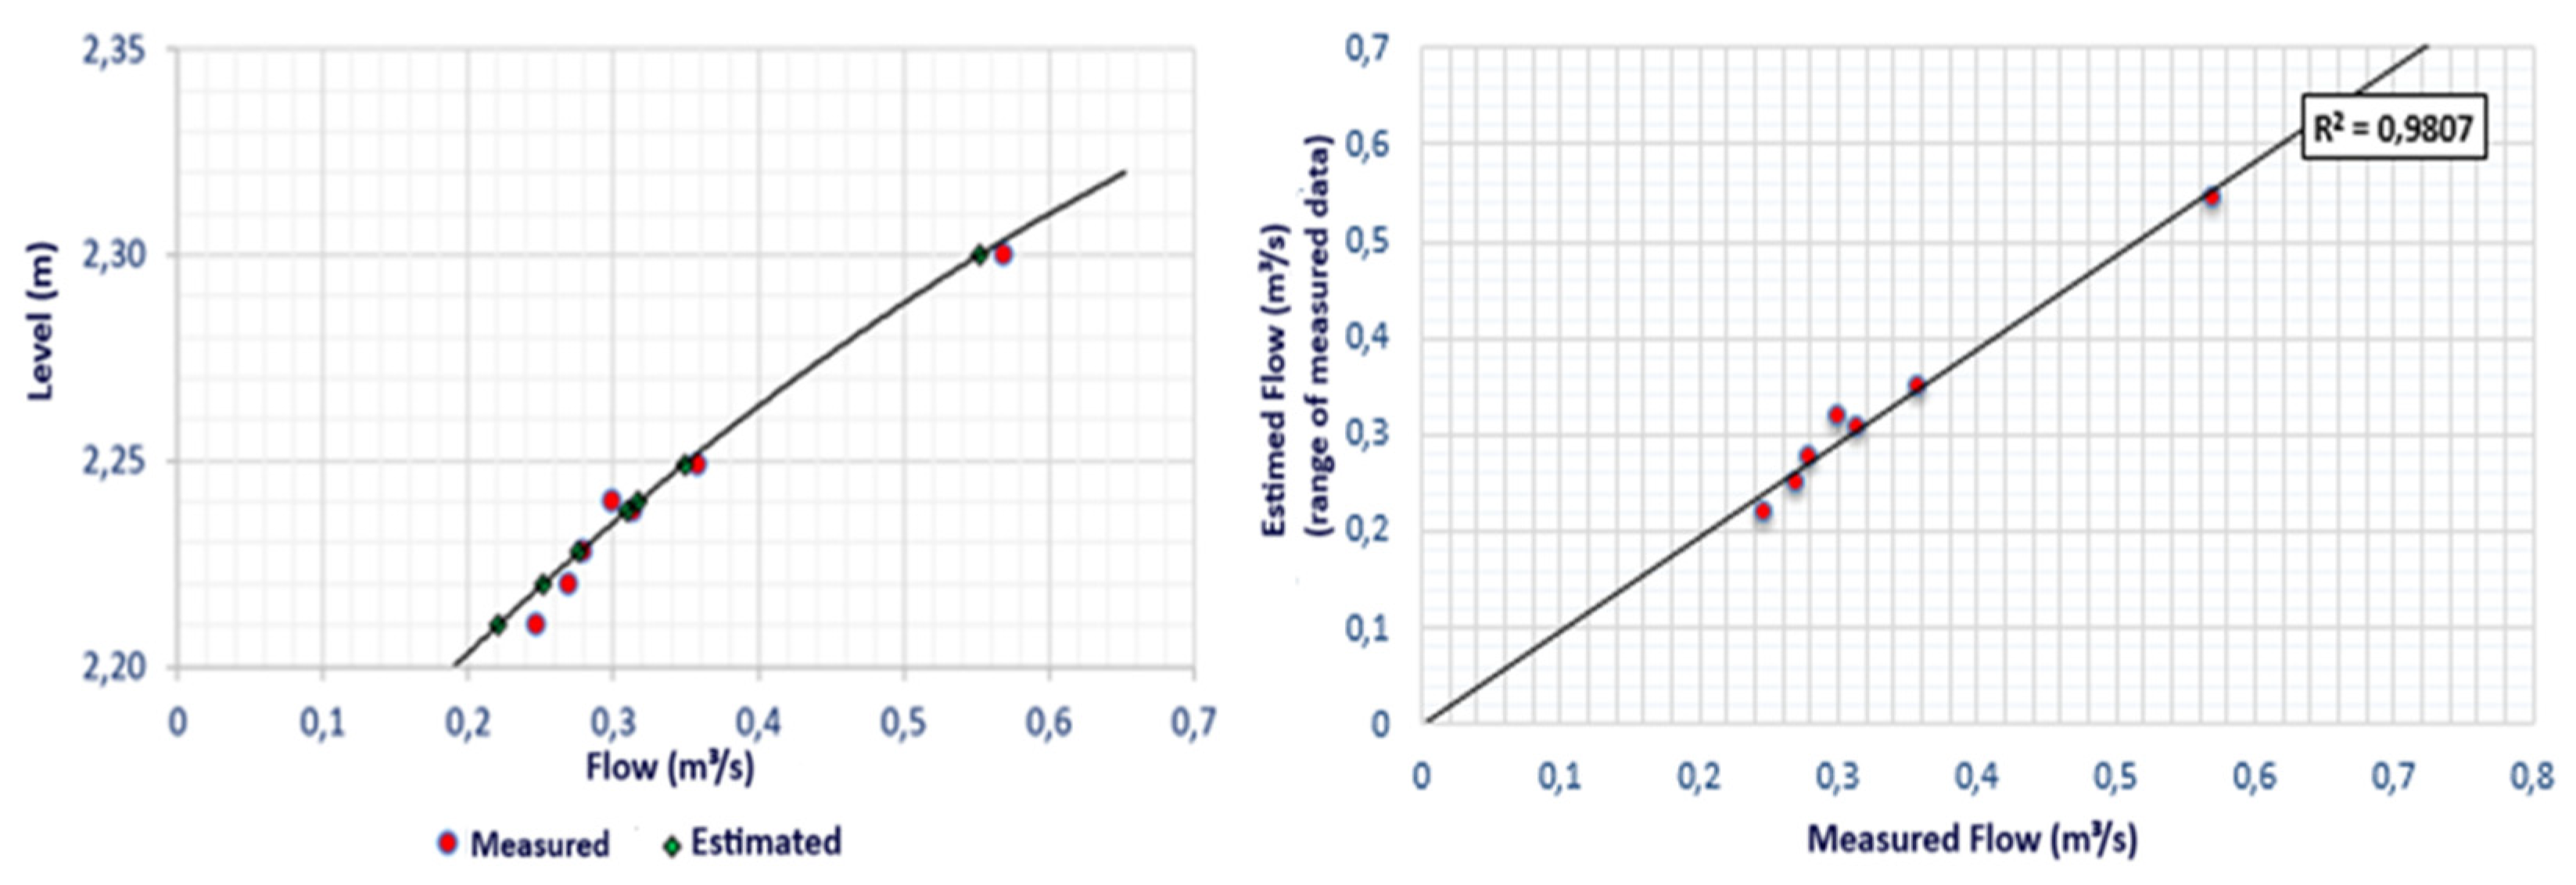
Figure 10.
Input hyetograph and calculated and simulated flow hydrographs for the event on 12/09/2022.
Figure 10.
Input hyetograph and calculated and simulated flow hydrographs for the event on 12/09/2022.
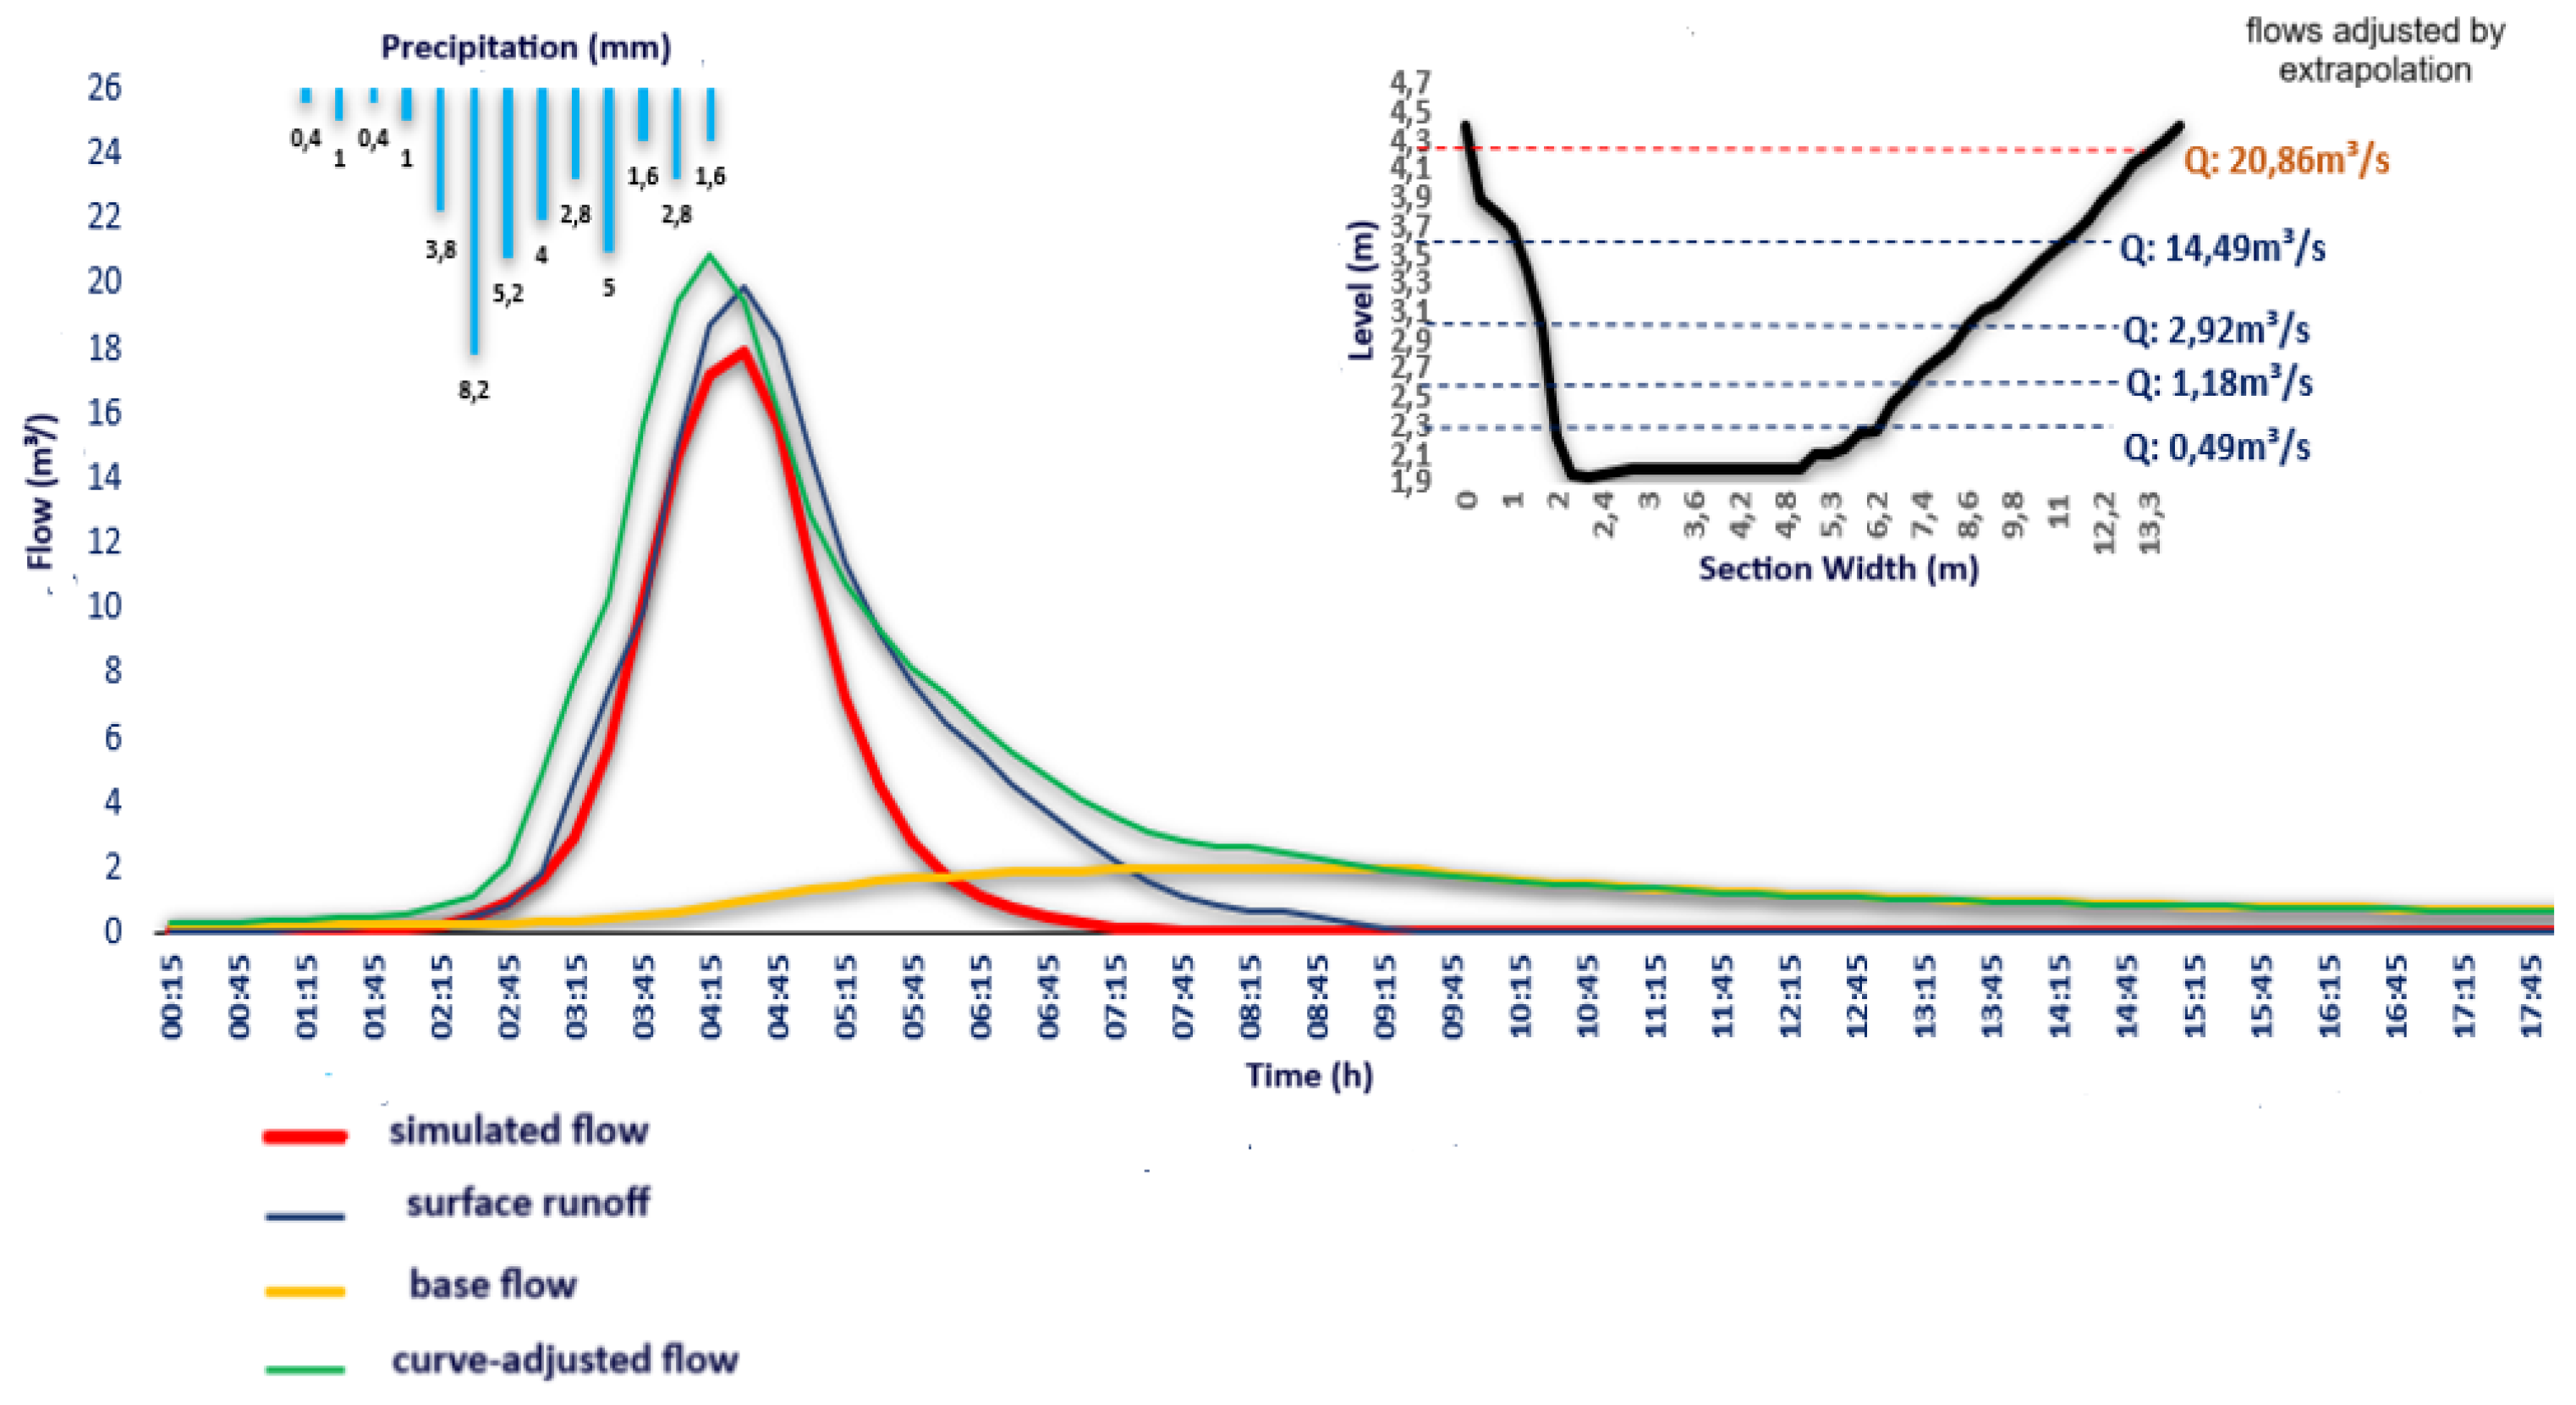

Table 1.
Evaluated Hydrographic Categorization.
| Categories | Study Area | Area (km²) | Area (%) | ||
|---|---|---|---|---|---|
| River basin committee | District tributaries of the Paranaíba river | 3708 | 100 | ||
| Management unit (UG) | UG São Bartolomeu | 1909 | 52 | ||
| Hydrographic unit (UH) | UH Santana | 180 | 5 | ||
| Hydrographic sub-basin | Pau de Caixeta1 | 33.7 | 0.8 |
1 Area of special interest.
Table 2.
Calculations for the application of the Flow Extrapolation Method.
| Level (m) | Am (m²) | Rh (m) | Rh2/3 (m) | A*Rh2/3 (m² x m) | Q — m³/s |
|---|---|---|---|---|---|
| 2,0 | 0,00 | 0,00 | 0,00 | 0,00 | 0,01 |
| 2,2 | 0,70 | 0,17 | 0,30 | 0,21 | 0,25 |
| 2,4 | 1,50 | 0,30 | 0,45 | 0,68 | 0,70 |
| 2,6 | 2,55 | 0,41 | 0,55 | 1,41 | 1,30 |
| 2,8 | 3,60 | 0,52 | 0,65 | 2,33 | 1,60 |
| 3,0 | 5,00 | 0,62 | 0,72 | 3,62 | 2,80 |
| 3,2 | 6,30 | 0,62 | 0,73 | 4,60 | 4,00 |
| 3,4 | 8,40 | 0,79 | 0,86 | 7,19 | 6,50 |
| 3,6 | 10,16 | 0,87 | 0,91 | 9,29 | 8,50 |
| 3,8 | 12,60 | 0,95 | 0,97 | 12,22 | 11,00 |
| 4,0 | 15,00 | 1,04 | 1,02 | 15,37 | 14,80 |
| 4,2 | 17,82 | 1,12 | 1,08 | 19,19 | 19,00 |
| 4,4 | 20,40 | 1,20 | 1,13 | 22,99 | 23,00 |
Table 3.
Flow comparison.
| Month | mai/22 | jun/22 | jul/22 | ago/22 | set/22 | nov/22 | dez/22 |
| Level (m) | 20,25 | 20,21 | 20,25 | 20,23 | 20,22 | 20,24 | 20,30 |
| Qmeasured (m³/s) | 00,358 | 00,247 | 00,314 | 00,279 | 00,270 | 00,299 | 00,569 |
| Qestimed (m³/s) | 00,349 | 00,221 | 00,309 | 00,276 | 00,251 | 00,317 | 00,544 |
| Relative error (%) | 22,59 | 110,66 | 11,43 | 11,08 | 66,86 | 55,97 | 44,27 |
Table 4.
Comparison between simulated and calculated flows using the preliminary key curve.
| Comparative | Peak Flow | Base runoff at the end od the event |
|---|---|---|
| Qsimulated (m³/s) | 17.04 | 0.71 |
| Qajustted (m³/s) | 19.80 | 0,68 |
| Relative error (%) | 16.20 | 4,23 |
Disclaimer/Publisher’s Note: The statements, opinions and data contained in all publications are solely those of the individual author(s) and contributor(s) and not of MDPI and/or the editor(s). MDPI and/or the editor(s) disclaim responsibility for any injury to people or property resulting from any ideas, methods, instructions or products referred to in the content. |
© 2024 by the authors. Licensee MDPI, Basel, Switzerland. This article is an open access article distributed under the terms and conditions of the Creative Commons Attribution (CC BY) license (http://creativecommons.org/licenses/by/4.0/).
Copyright: This open access article is published under a Creative Commons CC BY 4.0 license, which permit the free download, distribution, and reuse, provided that the author and preprint are cited in any reuse.


