
Submitted:
26 December 2023
Posted:
10 January 2024
You are already at the latest version
Abstract
This study identifies the facies and degrees of hydrothermal alteration related to the low sulphida-tion epithermal Kestanelik Au deposit in the Biga Peninsula metallogenic province through petro-graphic studies and analysis of geochemical characteristics, such as mass changes, molar element ratios, and alteration indices. The gold mineralization is located in silicified zones containing veins and stockwork veinlets of quartz. These zones are found within the Permian-Upper Cretaceous aged Çamlıca basement metamorphics and Eocene aged Kestanelik granodiorite of the Karabiga Massif on the Biga Peninsula. The mineralization is influenced by tectonic structures such as quartz veins and faults. In the Kestanelik Au deposit, common hydrothermal alteration occurs mainly in the metamorphics and granodiorite, and less often in volcanic rocks. Based on miner-alogical and geochemical studies conducted on altered samples, four different alteration facies were defined as silicic, sericitic, argillic and propylitic, which show remarkable differences in the behaviour of REE, Si, K, Al, Na and Ca elements. The characterization of rocks subjected to hy-drothermal alteration that are most influenced by diverse K metasomatism with the largest K gains and losses of Na-Ca, is illustrated by molar element ratio plots. Depending on the severity of K-metasomatism, gold mineralization rises with increasing K trends towards gold ore veins. In the Kestanelik Au field, the alteration types of argillic, sericitic, propylitic and adularia from the alter-ation zones enclosing the Au ore veins, were revealed by the alteration index and chlo-rite-carbonate-pyrite index. Mass changes in the altered rocks indicate that there are gains in Si, K, Al, and losses in Na and Ca with the increasing intensity of alteration towards the Kestanelik ore veins. The results confirm the presence of silicic and K-metasomatic (sericite and argillic) propylit-ic (Fe-rich chloride) alteration zoning extending from the inner regions to the outer regions, which characterize the epithermal ore systems. It has been revealed from the data obtained in this study that the intensity of potassium metasomatism that occurs in acidic rocks is greater than that found in intermediate and mafic rocks. The hydrothermal fluids that cause alteration in Kestanelik Au mineralization and host rocks had low contents of REE due to REE mobilization, and the kaolini-zation of feldspars and micas, and the chloritization of biotite and feldspars, may cause negative Eu anomalies.
Keywords:
Biga Yarımadası
; düşük sülfidasyonlu epitermal tip
; hidrotermal alterasyon
; değişiklik indeksleri
; kütle değişimi
; molar element oranı
; REE hareketliliği
1. Introduction
Hydrothermal alteration is common around epithermal mineral deposits, and its types are similar to those found in characteristic epithermal deposits worldwide and in Turkey [1,2,3,4,5,6,7,8,9,10,11,12,13,14,15]. One of the most crucial features of epithermal gold deposits is that they are always included in the host rock alterations. Alteration occurs as siliceous and clayey zones. Silicification is commonly observed in the upper part of epithermal veins and in its immediate vicinity, while argillization and propylitization are observed in the outer zones [16]. The alteration products present are usually quartz, adularia, illite, chlorite, alunite, kaolinite, and/or dickite and sericite [17,18].
Hydrothermal alteration is one of the most significant components controlling the exploration of epithermal deposits. Alteration mineralogy could provide valuable contributions to determining the spatial distribution of hydrothermal regions that can be a guide for mineralization [19,20]. Therefore, it is important to investigate the mineralogy in alteration zones and specify the relationship between alteration types and mineralization. Various alteration minerals are formed in an epithermal system; the alteration mineral association of quartz ± calcite ± adularia ± illite in low-sulphidation deposits, including Au-Ag, Ag-Au or Ag-Pb-Zn ores [21,22] and the alteration mineral paragenesis of quartz ± alunite ± pyrophyllite ± dickite ± kaolinite in high sulphidation deposits, containing Au ± Ag ± Cu ores [23]. Hydrothermal alteration styles have been defined using alteration mineral assemblages [24,25]. The alterations in low and high sulphidation epithermal deposits are arranged as propylitic, argillic, advanced argillic, silicic, sericitic (phyllic), respectively [18]. In the world, the alterations occur at different intensities in the quartz vein [26,27,28,29], monzonite [30], diorite porphyry [8,9], granite-granodiorite porphyry [28,31,32], metamorphic [28,33], and volcanic rocks [11,27,34]. Compared to the wealth of publications in the literature on origin research of epithermal Au-Ag deposits, it can be seen that there are very few detailed clay mineralogy studies on the alteration zones of epithermal deposits [34,35,36,37,38,39,40,41,42]. In their mineralogical research on the argillic alteration zone in the low sulphidation epithermal type Ovacık-Bergama Au-Ag deposit, [34] noted that telescoping resulted in the four-stage alteration formation. In the Cerro Rubio kaolin deposit, it was emphasized that identification of the genesis of weathering or hydrothermal alteration is important in gold or kaolin searches, considering the presence of Au-Ag epithermal deposits showing argillic alteration in the same type rocks of nearby areas [36]. [43,44] reported that the volcanic rocks forming the residual kaolin deposits also hosted significant Au-Ag mineralization, and are structurally controlled by tectonism in which mainly silicification, argillic (kaolinisation?), sericitic, and propylitic alterations. Phyllosilicate mineralogy is described as a key element in understanding hydrothermal processes within adopted epithermal deposit models and the impact of the mineralogy of phyllosilicates, which are hydrothermal alteration assemblages associated with ore mineralization, on ore formation was discussed [35]. Hydrothermal alterations were investigated in detail in terms of major-minor oxides, trace and rare earth element (REE) contents, mass gain and loss, molar ratio, alteration indices on some epithermal Au deposits in the world [8,9,11,45,46,47,48,49,50,51,52,53,54,55,56,57,58,60,61,62,63,64]. It has been suggested by some researchers [65,66,67,68,69,70,71] that molar ratio plots are effective in the calculation of mass transfer related to hydrothermal alteration systems. According to the K2O+Na2O sericitization index, Sipahi and Sadıklar (2010) stated that volcanic samples generally indicate the hydrothermal alteration in the Zigana, NE Turkey. In the K2O+Na2O and CaO diagrams, carbonation in andesite samples was the dominant alteration type in the Arzular-Gümüşhane (NE Turkey) epithermal gold mineralization is reported [64]. [9] stated that pyrite, sericite, and chlorite-carbonate tended to be primarily argillic and sericite-carbonate-clay minerals in the Siah Jangal-Sar Kahno epithermal Au vein samples. In the Tarom-Hashtjin (NW Iran) precious-base metal epithermal deposit, illite-smectite, illite, K-mica, K-feldspar-biotite areas indicated argillic, sericitic, and propylitic alteration types, with the existence of K-Al acquisition being pointed out [11].
With the opening and closing of the Neotethys ocean basin, the Tethyan-Eurasian Metallogenic Belt occurred as a result of the development of the Alpine-Himalayan orogeny during the Mesozoic-Cenozoic periods [72]. This belt, extending from Southern Europe in the west to the Western Pacific in the east, is known as one of the richest metal-producing belts in the world [73]. Turkey forms a part of the western region of this large magmatic-origin metallogenic zone and hosts many precious (Au, Ag) and base metal (Pb, Zn, Cu) deposits (Figure 1).
Biga Peninsula is the richest Au-Ag and base metal (Pb, Zn, Cu) mineralization region in Anatolia. The epithermal mineralization is associated with Cenozoic-aged volcanic rocks and Eocene-aged granodiorites belonging to the Sakarya Zone. The study area covers the Kestanelik low-sulphidation epithermal gold deposit and its near surroundings, occurring in the Karabiga Massif at the Biga Peninsula (NW Turkey). Based on the mass changes, molar element ratios, alteration indices, and alteration facies in the quartz vein, quartz feldspar porphyry, and quartz mica schist host rocks, the mineralogy and geochemistry of hydrothermal alterations related to Kestanelik gold mineralization were characterized in detail for the first time in the current study.
2. Regional Geology
The west Anatolia, which occupies a significant position in the Alpine-Himalayan orogenic system, is a critical zone where collisional magmatism is abundant, crust-mantle interaction can be observed, and magmatic-tectonic occurrences occur collectively [74,75]. In Turkey, from the east-west trending orogenic belts, there are four primary tectonic blocks - Pontides (the Laurasian part), Anatolides, Taurides, and Border folds (the Gondwana part), from north to south. The northwest of Turkey is bounded by the Intra-Pontide in the north and the Izmir-Ankara-Erzincan suture zone in the south (Figure 1). The north of this zone is known as the Pontides or Sakarya Zone [72,77]. Biga Peninsula is one of the areas with the best view of the mixed basement rocks of the Alpine tectonic belt, known as the Sakarya Continent [72,78], Sakarya Zone [79], and/or Sakarya Composite Belt [80]. The geology of the Sakarya zone is generally comprised of Kazdağ, Karadağ, Çamlıca, and Karabiga Massifs [79]. The crystalline basement of the zone is broadly divided into three parts. i) High-grade Variscan metamorphic succession consisting of gneiss, amphibolite, marble, and rarely metaperidotite. This metamorphism was determined as Carboniferous (330-310 Ma) with zircon and monazite ages obtained from Pulur, Kazdağ, and Gümüşhane Massifs [81,82,83], ii) Paleozoic granitoids of Devonian, Carboniferous, and Permian crystallization age [82,83,84,85,86], iii) Permo-Triassic aged and lower grade Lower Karakaya Complex dominated by metabasite, phyllite, and marble [87]. This complex, which contains Late Triassic blueschist and eclogite, expresses the Permo-Triassic subduction-accumulation complex [86,88]. The complex basement is unconformably covered by a sedimentary and volcanic succession in the Early Jurassic age, which is represented by shallow marine sandstone, shale, and conglomerate [79].
3. Local Geology
The study area is located within the Karabiga Massif, which is developed in the Sakarya zone of the Biga Peninsula. In the massif, the Çamlıca metamorphic basement rocks of Permian to Upper Cretaceous and Çetmi Melange of Upper Cretaceous with tectonic contact, are cut by the Kestanelik granodiorite and quartz veins of Eocene. The Eocene Soğucak formation and Şahinli formation, and Quaternary aged alluviums unconformably overlie these units (Figure 2).
The Çamlıca metamorphics, named by [79], are found in the Karabiga Massif, which is developed in the Sakarya zone on the Biga Peninsula. At the bottom of the study area, the metamorphics include sericite schist, chlorite schist, and slate-marble levels. Çamlıca Metamorphics crop out in a wide area to the west and south of Kovanlık hill, and to the east and southeast of Kara Tepe (Figure 2). The metamorphics start with white, brown and grey coloured, well foliated, and coarse-medium grained mica-schists at the bottom and continue with the brown-green coloured phyllites upwards to the top [79,89,90]. They also include the basic rocks, marble lenses, and quartz veins. The degree of metamorphism of the metamorphics, formed by regional metamorphism in greenschist facies of clastic sedimentary rocks, decreases towards the upper levels of the unit and passes into cover schists and phyllites in low-grade greenschist facies [79,90]. Based on the phengite mineral in quartz mica schists in the Çamlıca Metamorphics, the ages of 65-69 My (Late Cretaceous) were detected by the Rb/Sr method. This result shows that Çamlıca metamorphics are also affected by eclogite facies metamorphism [89]. The metamorphics were intersected by the Middle-Late Eocene aged Kestanelik granodiorite, and display a tectonic connection with the Maastrichtian aged Çetmi mélange.
The intrusive mass, which was effective in the formation of the gold deposit, was emplaced as a stock into the Çamlıca metamorphics, named by [79]. This granodiorite, named as Kestanelik granodiorite by [91], was identified as quartz-feldspar-hornblende porphyry. It is observed in the central part of the field with N-S trending (Figure 2). The granodiorite has a brecciated structure as the mine field contains many cracks and fractures due to tectonism. In the study area, the Kestanelik granodiorite intersects with the Çamlıca metamorphite and the Çetmi mélange, and is unconformably observed over the Soğucak formation (Figure 2). The Laledağ granodiorite located near the study area was determined to be Middle-Late Eocene by [92] using the Ar/Ar method (biotite 42.08±00.9 and hornblende 39.21±0.11 Ma). Due to the similarities of the field observations, petrographical and geochemical features of the Laledağ granodiorite and the Kestanelik granodiorite, the age of the Kestanelik granodiorite is considered to be Middle-Late Eocene.
4. Materials and Methods
Numerous exploration drillings were carried out in the alteration zones and mineralizations in the study area, and core samples were taken from some selected drillings including KED 02, KED 06, KED 17, KED 44, KED 70, and KED 135. A total of thirty-one core samples taken from these drillings consist of eleven quartz veins, twelve quartz-feldspar porphyries, and eight quartz mica schists (Figure. 3).
In order to determine the mineral assemblages and alteration types of these samples, thin section analysis for 15 samples, and X-ray diffraction (XRD)-detailed clay analysis and geochemical analysis for 31 samples were carried out. Thin section samples were prepared at the laboratory in the Department of Geological Engineering, Süleyman Demirel University. At the Water, Rock and Mineral Analysis laboratory belonging to the same department, the mineralogical-petrographic descriptions of the sections were examined under an Olympus BX-51 polarising microscope, with a 5.1 mega-pixel camera. Their images have been taken by using the Image Pro Plus 5.1v image analysis system.
XRD analyses of the investigated alteration samples were carried out using a Shimadzu XRD-6000 model X-ray diffractometer with a Ni filter, CuKα radiation, and CuKα X-ray with a 1.544Å wavelength at the Technology Application and Research Center Laboratory-TUAM, Afyon Kocatepe University, Turkey. For the analysis, 40 kV and 30 mA diffraction values were chosen. Alteration samples were scanned at 20/min and analyzed at a peak intensity of 2000 cps (intensity) in the ganiometer diffraction angle range of 2o-70o (2Φ). The mineralogy of these samples was performed by a thorough analysis of the mineral composition of whole rocks, air-dried (AD), ethylene glycol (EG) and 550°C XRD clay. For XRD analysis of the samples, guide samples were prepared from the clay-sized crushed samples and about 20-30 grams of samples with a grain size of 250 µm were used. The sample is placed in a 1000 cc glass or polyethylene weighing container and weighed. 55 cc of distilled water are added and mixed with a mechanical mixer for approximately 10 minutes and allowed to settle for 1 hour at 20°C. 5-10 ml solution is pipetted to a depth of 5 cm from the surface of the suspension and stored for analysis. In this way, maximum richness is achieved in respect to only <2µm grains and clay minerals. After performing a series of standard secondary procedures on the prepared samples, artificial changes were created in the basal diffraction of clay minerals, particularly in the low 2 theta angle region. The diffraction profiles of these artificial changes were examined systematically, and similar clay minerals were distinguished and defined precisely. The guide samples underwent standard processes before acquiring XRD graphs. The sample is treated with ethylene glycol in an open container at 60°C for at least 1 hour. After treatment, the sample is kept in a temperature-sensitive oven (± 5°C) for at least 1 hour and then heat-treated at 550°C. XRD analysis should be performed immediately after the sample has cooled for 15-20 minutes following heat treatment.
Thirty-one samples were ground to 200 mesh at the Mineral laboratories of Bureau Veritas (BVM) Canada. The element contents were dissolved by lithium borate fusion, and major oxide, minor-oxide, trace, and rare earth element analyses were performed using Inductively Coupled Plasma-Mass Spectrometry (ICP-MS) and Emission Spectrometry (ICP-ES) methods.
5. Results
5.1. Hydrothermal Alteration and Au Mineralization
Hydrothermal alteration is a common feature of in epithermal mineral deposits and exhibits similar characteristics to typical epithermal deposits the worldwide [11,14,15]. The hydrothermal system that forms the Au mineralization in the Kestanelik deposit occurs extensively in varying thicknesses and intensities, creating vein-type hydrothermal alteration zones. Kestanelik deposit exhibits various alteration associations based on cut-off relations, mineralogy, and distance from ore bodies. Quartz-mica schists in the Çamlıca metamorphics, Kestanelik granodiorite, and andesite-basalt rocks in the Şahinli formation, which crop out in the Kestanelik gold mine area, have undergone sever alteration. Different alteration zones are clearly visible in the mine field, distinguished by their greenish-yellowish, brownish, claret red, grayish, and whitish colours (Figure 4). In the field, the dominant minerals in silicified, hematitized, limonitized, and argillized zon are quartz (including amethyst), hematite, limonite, goethite, opal, chalcedony and clay minerals.The gold-bearing veins in the Kestanelik deposit, exhibit predominantly argillic, sericitic, and propylitic alteration zones, with lesser K-silicate, chloritization and carbonation-type alteration zones observed from the inside to the outside (Figure 4).
The Kestanelik Au deposit is located in and around Lapseki-Şahinli village, 45 km from Çanakkale in the northwest of Turkey. The deposit occurred in a low sulphidation environment [5,28,93,94,95] within the Karabiga massif observed along the Sakarya zone on the Biga peninsula. The gold- bearing ore body at Kestanelik is emplaced within silicified zones, quartz veins, and stockwork veinlets that cut through the Maastrichtian aged Çamlıca metamorphites and the Eocene aged Kestanelik granodiorite. The Kestanelik deposit’s gold mineralization is comprised of four primary quartz veins: Karakovan (KK1, KK2, KK3, KK4), Kara Tepe (KT), Kestanelik (K1, K2, K3) and S veins. The quartz veins’ lengths are approximately 500 meters for the Karakovan (KK1, KK2, KK3, KK4) veins, 850 meters for the Kara Hill (KT) vein, 2480 meters for the Kestanelik vein (K1 vein 480 meters, K2 vein 350 meters, K3 vein 1650 meters), and 500 meters for the S vein. The deposit has an average gold grade of 2.27 g/t in the KK vein, 1.37 g/t in the KT vein, 1.61 g/t in the K1 vein, 2 g/t in the K2 vein, 2.87 g/t in the K3 vein, and 2.06 g/t in the S vein [95].
The Kestanelik epithermal gold deposit is mainly accumulated in the veins controlled by tectonic lines, which are represented by quartz veins and faults in the mine field (Figure 25). The area contains normal faults that trend NW-SE, NE-SW, and E-W, with the Meydan and Kestanelik faults being the most significant. The ore-bearing quartz veins are intersected by NW-SE and E-W trending faults, as well as NE-SW trending faults (Figure 2). Fault breccia and fault clay are present in the areas of fault deformation. Additionally, brecciated structures are visible in the Çamlıca metamorphites, Kestanelik granodiorite, and ore-bearing quartz veins as a result of cataclastic deformation. According to [95], the Kestanelik gold deposit’s host rocks and early quartz underwent cataclastic deformation and exhibited tectonic brecciation. Additionally, hydrothermal fractured breccias were present, and the pre-existing vein filling displayed matrix-supported chaotic breccias. The two primary permeable enrichment mechanisms responsible for the reactivation of blocked permeable pathways are co-seismic and hydraulic fracturing.
Quartz veins in the study area are typically found in the form parallel or intersecting veins and veinlets within a silicified zone. In quartz veins and silicified zones, quartz occurs in both fine and coarse crystals, while chalcedonic quartz, chalcedony, and amethyst have a fine grained texture. The silicified zones often manifest as resistant knobs, ledges, and carapaces, with the original rock texture rarely preserved. Epithermal systems exhibit primary growth structures in the form of massive, comb, and banded open void fillings, breccia and substitutional thrust structures (Figure 5). The origin of the gold metal deposit in Şahinli and Tespih Dere is defined as intermediate sulphidation [5]. The deposit contains plumose quartz, vugy fillings, comb and cockade, and matrix-supported brecciated epithermal textures. Gold, along with base metal minerals, occurs in relatively deep seated epithermal quartz veins.
5.2. Petrography-Mineralogy of Alteration Deposits
5.2.1. Polarizing Microscope Investigations
The thin sections of core samples from quartz veins, Kestanelik granodiorite and Çamlıca micaschists were examined under a polarizing microscope, and their microphotographs were taken (Figure 6a–h). Coarse-crystalline quartz typically presents the comb structure observed vein style for epithermal gold deposits (Figure 6a). The relationship between vein-shaped quartz, locally chloritized feldspar crystals, and siliceous micro-crystalline texture is clearly observed in the sections (Figure 6b). Figure 6c–d shows cataclastic textured and coarse-grained quartz, muscovite, less biotite, and opaque minerals. Another examined thin section sample has a rhyolitic composition, with coarse crystalline quartz and locally corroded opaque minerals present (Figure 6f). In certain sections of the area, feldspars and amphiboles undergo chloritization, while micas experience sericitization in certain areas (Figure 6e–h).
5.2.2. X-ray Diffraction-Mineralogy of Alteration Deposits
X-ray diffraction (XRD) clay analysis was conducted on core samples taken from Kestanelik gold ore deposit area, specially from altered quartz vein, quartz feldspar porphyry and quartz mica-schist. The results of the analysis and representative patterns of all rocks can be found in Figure 7 and Table 1. The mineral composition of the quartz vein, quartz feldspar porphyry, and quartz-mica-schist rocks at the Kestanelik mine site are listed separately in Table 1. The main mineral phases identified chlorite, illite/mica, and kaolinite in the quartz vein; feldspar, chlorite/smectite, and illite/mica in the quartz feldspar porphyry; and chlorite, illite mica, feldspar and kaolinite in the quartz mica schist.
The samples taken from the quartz vein contain quartz (1.37-4.26 Å), smectite (4.48-16.89 Å), illite (2.48-10.36 Å), kaolinite (7.19-2.99 Å), chlorite (3.53-14.29 Å), smectite-chlorite (14.27 Å), kaolinite-chlorite (7.07-7.12 Å). Calcite; dolomite, feldspar, hematite, and hornblende are some of the minerals with varying inter atomic distances, ranging from 2.70 to 7.94 Å. The samples from the quartz feldspar porphyry contain various minerals, including quartz (1.37-4.26 Å), smectite (1.49-17.47 Å), illite (2.58-10.23 Å), illite-smectite (10.00 and 10.06 Å), kaolinite (3.54-7.18 Å), chlorite, 3.58-14.52 Å); chlorite-smectite (14.14 Å), opal CT/cristobalite (4.02-4.04 Å), cristobalite (4.02 Å), calcite (2.91-3.03 Å), dolomite (2.85-2.98 Å), feldspar (2.99-6.54 Å), hematite (2.76 and 2.77 Å), and alunite (3, 00 and 5.03 Å). The samples from the quartz mica schist contain various mineral phases, including quartz (1.37-4.26 Å), smectite (3.47-17.08 Å), illite (2.57-10.06Å, smectite-illite (4.99 Å), kaolinite (3.57- 7.22Å), chlorite (2.52-14.49Å), chlorite-smectite (12.93 Å), calcite (2.99-3.04 Å), dolomite (2.86 Å), feldspar (2, 20-6.67 Å), hematite (2.70 Å) phases were determined by using XRD patterns.
The goldfield contains four alteration zones related to mineralization: silicic, sericitic (illite ± smectite), argillic (smectite ±illite ± kaolinite), and propylitic (chlorite ± sericite ± carbonate) types. These zones are present in all lithological units in the central part of the field and around the central silicic zone.
5.3. Geochemical Composition and REE Pattern
Thirty-one samples were taken from quartz vein, quartz-feldspar porphyry and quartz micaschist. The samples were collected from seven drillings selected from the drilling cores in the Kestanelik gold mine field. Table 2 presents the results of the analysis of major-minor oxides, trace, and rare earth elements in the alteration samples.
The major oxide contents of quartz vein samples range from 57.74-98.02wt.% SiO2, 0.50-14.33wt.% Al2O3, 0.60-8.03wt.% Fe2O3, 0.03-3.59wt.% K2O and 0.04-4.13wt.% MgO, according to the results. The altered quartz-feldspar porphyry samples have values ranging from 64.79-89.52wt.% SiO2, 3.34-16.61wt.% Al2O3, 2.10-3.61wt.% Fe2O3, 0.38-1.51wt.% MgO, 0.07-8.00wt.% Na2O and 2.06-9.21wt.% K2O. The altered quartz-micaschist samples had element contents ranging from 52.92-95.78wt.% SiO2, 1.19-14.85wt.% Al2O3, 0.65-14.06wt.% Fe2O3, 0.09-4.78wt.% MgO, 0.01-3.61wt.% K2O and 0.01-1.63wt.% TiO2. Other major oxide concentrations were below 1% and insignificant (Table 2). When comparing all three rock types in terms of major oxides, SiO2 in the quartz vein, Al2O3, K2O, Na2O in the quartz feldspar porphyry, and Fe2O3, MgO, TiO2 in the quartz micaschist showed higher values.
Au, Ag, Sb, As, Hg, Bi, Se, Te, and base metals (Pb, Zn, Cu) are trace elements commonly found in epithermal gold deposits. The study compared the trace element contents in different rock types associated with gold mineralization in the investigated area. The quartz veins were found to have slightly higher concentrations of Au (average 784 ppb), Sb (average 40.05 ppm), and Pb (average 54.11 ppm). The quartz micaschist samples show slightly higher levels of Ag (average 1.84 ppm), As (average 158.64 ppm), Cu (average 28.9 ppm), and Zn (average 62 ppm) compared to the reference values presented in Table 2. The Kestanelik field; samples show an average Au grade of 2.27 g/t in the KK vein samples, 2 g/t in the K2 vein samples, and 2.87 g/t in the K3 vein samples [96]. In contrast, the gold content of the core samples taken from the quartz vein (KK1, K2, K3) in this study was determined to be 0.784 g/t.
According to some researchers, rare earth elements (REE), particularly those found in K-silicate, sericitic, argillic and propylitic alteration types, may be reactivated during the alteration process [9,97,98,99,100,101]. Figure 8 shows separate plots of chondrite-normalized [102] REE models for the samples of quartz vein, quartz-feldspar porphyry, and quartz micaschist. The (∑REE) values of the mineralized epithermal quartz vein and quartz-micaschist rock samples were depleted and similar (65.95 and (63.24 ppm). In contrast, the quartz feldspar porphyry rock samples had the highest ∑REE values (81.06 ppm) and were enriched in total REE contents. However, the REE patterns in rocks indicating LREE enrichment show similar trends, as the average LREE/HREE ratio is 2.85, 4.04 and 3.12 for quartz vein, quartz-feldspar porphyry, and quartz-mica schist, respectively (Table 3). The concentration of REE in all rocks tends to decrease with increasing hydrothermal alteration intensity (Figure 8). The mean of (La/Yb)n and (La/Sm)n values of samples from quartz vein, altered quartz-feldspar porphyry, and quartz-micaschist were 5.87-3.30, 9.84-4.41 and 7.49-3.21, respectively. Table 3 shows that the (La/Yb)n and (La/Sm)n values of quartz feldspar porphyry are slightly higher than the others.
The REE distribution patterns of epithermal quartz vein, quartz feldspar porphyry and quartz micaschist samples, normalized to chodrite, exhibit negative Eu anomalies. The mean Eu/Eu*values for these samples are 0.72, 0.82 and 0.66, respectively. Negative Eu anomalies indicate the presence of Eu2+, while positive Eu anomalies suggest the presence of Eu3+. As Eu+2 has the same radius as Ca+2, it must naturally exist in Ca+2 minerals [103,104]. These negative Eu+2 anomalies indicate a low oxygen fugacity during plagioclase precipitation from solution. The positive correlation between ΣREE and P2O5, Al2O3, TiO2, K2O values suggests an increase in REE-containing minerals from least altered rocks to strongly altered rocks (Figure 9).
5.4. Hydrothermal Alteration Indices
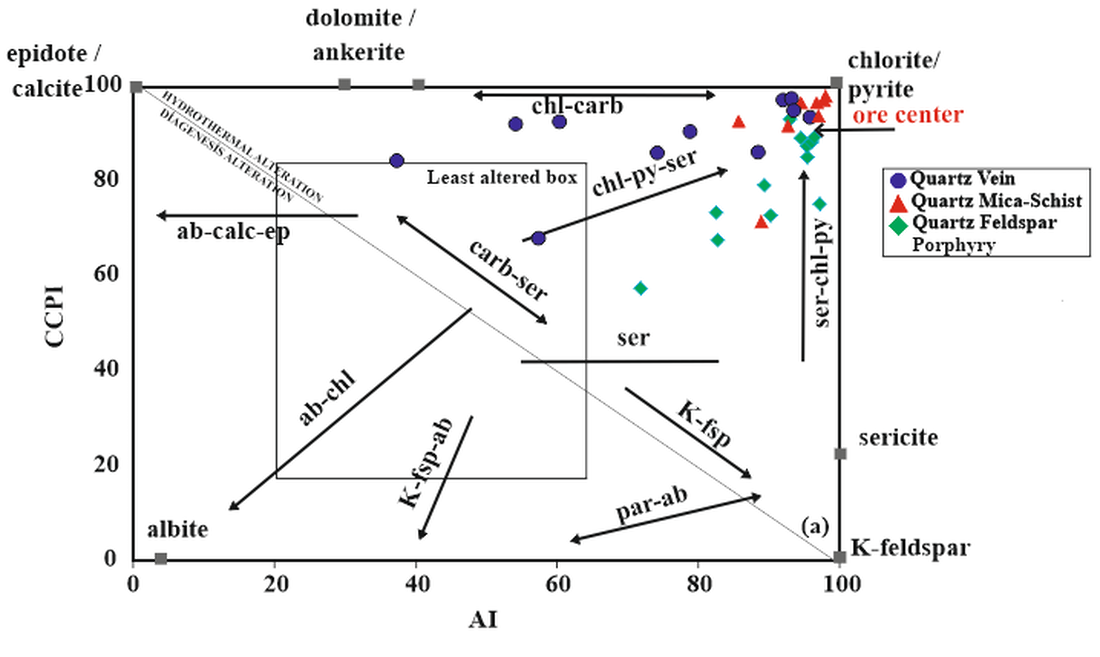
To determine the alterations in quartz vein, quartz feldspar porphyry and quartz mica schist samples in the study area, were used to the Ishikawa alteration index (AI), chlorite-carbonate-pyrite index (CCPI), sericite index (SI), and the chemical altering index (CIA). The Ishikawa alteration index (AI), as described by [46], is one of the most widely used and most important indices for determining of hydrothermal alterations. The purpose of this index is to calculate to ratio of the basic rock-forming elements gained during the chlorite and sericite exchange (MgO+K2O) to the elements lost and gained (Na2O+CaO+MgO+K2O). The index ranges from 20 to 60 for unaltered rocks and 50 to 100 for hydrothermally altered rocks. When AI equals 100, it indicates the complete alteration of feldspars and glass with sericite and/or chlorite. There is a strong correlation between Ishikawa AI and sodium depletion, as sodium loss is the main chemical change involved in the breakdown of sodic plagioclase.
The chlorite-carbonate-pyrite index (CCPI) is calculated as CCPI=100* MgO+FeO)/(MgO+FeO+Na2O+K2O) [60] and is used as the second index for determining alterations. The rock’s FeO is the total content (FeO+Fe2O3). The purpose of the index is to measure the increase of MgO and FeO resulting from the development of Mg-Fe chloride in igneous rock. This process often replaces albite, K feldspar or sericite, leading to a loss of Na2O and K2O. In addition to measuring chlorite exchange, the exchange of Mg-Fe carbonates (such as dolomite, ankerite or siderite) and the enrichment of pyrite, magnetite or hematite are positively affected [60].
In the study area, the alteration index (AI) values range from 54.17 to 95.90, while the chlorite-carbonate-pyrite index (CCPI) values range from 57.67 to 98.08 in geochemical studies. The Ishikawa alteration index (AI) and chlorite-carbonate-pyrite index (CCPI) diagrams indicate that the samples’ hydrothermal decomposition and alteration trend in the following order of abundance: chlorite-pyrite, sericite-chlorite-pyrite, chlorite-pyrite-sericite, and chlorite-carbonate. Figure 10a shows the areas of the diagram where the alteration samples fall. All rock samples exhibit hydrothermal alteration types mainly argillic and chlorite type alterations. Propylitic alteration is only present in the quartz vein (Figure 10b).
The study area’s alteration samples show a dominant presence of chlorite-sericite and sericite alteration minerals, with fewer samples falling in adularia-sericite mineral assemblage field (Figure 11). The relationship between the Na2O, K2O, Al2O3, CaO, MgO, and FeO values of the samples and the Ishikawa weathering index was also analyzed. This paragenesis indicates the existence of sericitic, argillic, propylitic and adularia alterations that are characteristic of epithermal deposits with low sulphidation. As a result of the increase in the alteration index towards the ore veins, the potassium and aluminum contents, as well as the sericite-clay minerals, increase in quartz mica schist rocks compared to other rock groups due to K-Al metasomatism. Conversely, the sodium, calcium, magnesium, and iron contents decrease (Figure 11).
The efficiency of sericitization alteration in rocks was indicated by calculating the sericitization index (SI), defined as SI=K2O/(K2O+Na2O) [48]. Plotting the SI values versus (K2O+Na2O) values on a diagram shows that all the alteration samples in the study area fall within the hydrothermal alteration area. SI index values of most of the quartz vein and quartz mica schist samples, as well as all samples of quartz feldspar porphyry in the hydrothermal alteration area, are above 1.0 and exhibit a linear relationship (Figure 12a). The SI values versus the CaO values increase in quartz feldspar porphyry, but there is an increase and decrease in quartz veins and quartz mica schists, indicating weak carbonation (Figure 12b).
Triangular diagram for Al2O3-MgO-(CaO+Na2O+K2O) and the K2O versus CaO+Na2O variation diagram clearly show evidence of sericitization in all rocks due to plagioclase weathering (Figure 13a). The distribution of the samples indicates a transition from feldspar to sericite. In the graph of K2O versus CaO+Na2O, CaO+Na2O values decrease in quartz vein and quartz feldspar porphyry, while K2O values increase in quartz micaschist samples. This suggests that sericite formation began with the decomposition of plagioclase (Figure 13b). According to [104], this is the alkali change in the sericitization process and the addition of K+ from hydrothermal fluids.
The chemical weathering index (CIA) and the Al2O3-(CaO+Na2O)-K2O (A-CN-K) triangle diagram [47] are used to assess alteration trends. The diagram shows that quartz veins in the study area mostly contain illite and smectite, quartz feldspar porphyries with muscovite, biotite, and smectite, and quartz-micaschists with illite, muscovite, biotite, and smectite (Figure 14).
Based on Al2O3-(Na2O+K2O) - (Fe2O3+MgO) - K2O triple diagram [24], the quartz vein and quartz micaschist samples are classified as falling within the K-silicate, propylitic, sericitic areas. The quartz feldspar porphyry samples, on the other hand, are mostly classified as falling within the propylitic area and to a lesser extent, the K-silicate area (Figure 15).
5.5. Molar Ratio and Mass Gain-Loss
Molar ratio graphs are useful in calculating mass loss and gain resulting from alteration in magmatic rocks [51,52,53] and mineral deposits, particularly in relation to large hydrothermal systems [65,66,67,68,69,70,71]. Several methods have used to calculate mass loss and gain in ore deposits [28,45,49,56,59,61,62]. The study area’s altered rock samples were analyzed using the techniques described in [57,67]. The resulting data was used to plot the (2Ca+Na+K)/Al and K/Al molar element ratios as shown in Figure 16. The process of mass exchange by hydrothermal alteration minerals was also explained. These methods offer a graphical means of evaluating the extent of K and Ca-metasomatism, as well as Ca and Na depletion, in altered rocks. It also provides the comparisons of mineralogical tendency focused on epithermal ore bodies with the compositions of hydrothermal minerals and altered rocks for geochemical assessment.
In the study area, the quartz-feldspar porphyry samples fall into the category of feldspar composition and biotite mixes on the left side of the vertical line where the 2Ca+Na+K/Al value is 1.0 on the x-axis. This suggests the presence of severe alteration, with an increase in K-metasomatism and a decrease in Ca and/or Na metasomatism. The quartz vein and quartz-mica schist samples fall into the K-mica area. This data indicates the presence of sericitic and argillic alteration types. In the study area, both a quartz vein and a quartz feldspar porphyry sample fall within the range to the right of the vertical line on the x-axis where the 2Ca+Na+K/Al value is 1.0 (Figure 16). This suggests an increase in Na, Ca, and K in these samples, with propylitic alteration in the quartz feldspar porphyry and silicic alteration in the quartz vein.
The study area’s alteration samples’ data were plotted using the molar K2O/Al2O3-Na2O/Al2O3 diagram of [52]. The quartz vein is observed on the left side of the albite-muscovite line, on the right side of the quartz feldspar porphyry line, and on both sides (left side strong to medium argillic alteration, right side strong to medium sericitic alteration). Additionally, quartz micaschists are located on the albite-muscovite line (Figure 17a). The examined samples exhibit argilic, sericitic, and propylitic alteration, as evidenced by the presence of chlorite, adularia, clay minerals, muscovite (sericite), and epidote mineral associations. Additionally, silicic alteration is observed in quartz veins located near the Na2O/Al2O3 y-axis. All samples analyzed fall below the plagioclase-K-feldspar (biotite) line, indicating a depletion in Na2O and an enrichment in K2O.
The plot showing the molar ratio of K2O/Al2O3 versus MgO/Al2O3 [52] demonstrates the relationship between muscovite and chlorite (Figure 17b). This suggests that muscovite (sericite) and minerals rich in K and Al (such as clay minerals, adularia, and alunite), as well as Al-enriched chlorite (low Mg-chloride), are the most abundant minerals in altered rocks. As shown in Figure 17b, the quartz vein is located in the low Mg chloride area, while the quartz feldspar porphyry muscovite and the quartz mica schist are mostly found in the low Mg chloride, less muscovite area. The TiO2-Al2O3 graph [45] indicates a single alteration trend from weak to strong for the quartz vein, quartz feldspar porphyry, and quartz mica schist altered rocks (see Figure 18a). The graph of Al2O3-Zr, which has procedures outlined by [49], indicates the presence of strongly altered mafic, intermediate, and felsic rocks in the mass gain area (Figure 18b).
6. Discussion and Conclusions
The study area is located in the Biga Peninsula, which is the richest region in Anatolia for Au-Ag and base metal (Pb-Zn, Cu) mineralization. The gold epithermal mineralization is associated with Eocene granodiorites and volcanic rocks from the Cenozoic volcanism of the Sakarya Zone. The Kestanelik Au-Ag mineralization in the Karabiga massif of the Biga Peninsula occurs in silicified zones containing individual quartz veins and stockwork quartz veinlets within the Eocene-aged Kestanelik granodiorite and the Maastrichtian-aged Çamlıca metamorphics. The Çamlıca metamorphics including quartz-sericite schists, Kestanelik granodiorite, and the Şahinli formation (andesite-basalt rocks) are found in and around the Kestanelik Au mine deposit. These rocks have undergone intense alteration. The alteration samples taken from the study area were analyzed using XRD and detailed clay analysis. The results showed the presence of mainly quartz, illite/muscovite, chlorite, less calcite/dolomite, kaolinite, smectite, hematite, cristobalite and alunite mineral associations in all samples. This paragenesis is similar to that of low sulfidation epithermal deposits. The host rocks of the Kestanelik Au deposit were found to have undergone hydrothermal alterations, including silicification, argilization, propylitization, sericitization, chloritization, limonitization, and hematitization. These findings were based on field observations, mineral contents and mineral associations from polarizing microscope studies, and XRD definite [28]. The alteration minerals and Kestanelik Au-silica in the alteration zone are believed to have formed due to hydrothermal processes within the hydrothermally altered Çamlıca metamorphics and Kestanelik granodiorite rocks. These processes were controlled by faults and fractures under specific temperature and pH conditions. [5] reported the presence of argillic (illite/muscovite) and advanced argillic alunite+dickite/nacrite+pyrophyllite) alteration in the vicinity of the study area. According to petrographic observations, [105] noted that silicification occurs in and around the main proximal alteration veins in Karatepe, located to the north of the study area. Additionally, a quartz-sericite/illite±adularia alteration occurs as an envelope around the silicification zone. Furthermore, they describe a distal to proximal change in the silica ± smectite ± kaolinite ± Fe-Mg chlorite assemblage away from the mineralized veins. The outermost part of the alteration halo contains relatively less smectite and more Fe-Mg chlorite. [34] reported that in the argillic alteration zone of the Ovacık-Bergama Au-Ag deposit in Turkey, biotite was transformed into Fe-Mg chlorite and smectite between 300-250°C in the first stage. In the second stage, pure illite was formed at 200°C (5-6 pH). In the third stage, to form the siliceous cap in and around the deposit, the path to the hydrothermal system was opened by providing silica. Smectite-illite mixed layers formed under acidic conditions (200-80°C). Furthermore, during this stage, the Ag-Mo-Tl sulphide-arsenite combination, which was a deep and concealed porphyry system during the Oligocene period, became shallower. This allowed for the Ovacık Au-silica mineralization. In the fourth stage, as the temperature decreased to 130°C and the pH decreased to 3, it affected the mineralized parts of the epithermal system and the non-ore main rocks.
According to [39], the precipitation of a silica cap in the kaolin deposit of Karaçayır (Turkey) is caused by the release of silica during silicification processes, which indicate hydrothermal activity within the rhyolitic tuffs and schists. The silicified zones and Fe-oxyhydroxides were formed by alteration processes that occurred within kaolinized Miocene volcanics and Paleozoic shales. These processes were controlled by faults and fractures under the influence of the extensional tectonic regime and geothermal activity, and were associated with kaolinite phases. According to [41], the origin, temperature conditions, and hydrothermal activity of mineralization fluids were determined in the Koru, Tesbihdere, and Kumarlar mineralization areas near the Kestanelik gold field. The Kübler Index values of illites indicate low temperature (high-grade diagenesis) for the Koru deposit and high temperature (anchizone) for the Tesbihdere and Kumarlar deposits. Moreover, it was stated that the major trace element composition and low octahedral Mg+Fe contents are compatible with hydrothermal illites. The Çöpler Cu-Au deposit exhibits hydrothermal alteration zones of potassic, phyllic, propylitic, and argillic in the Middle Eocene plutonic rocks (granodiorite and diorite porphyries) and in the Late Paleozoic-Mesozoic metapelite and metacarbonate rocks. The samples of the argillic zone exhibit the advanced argillic zone (quartz+illite-smectite, quartz+crandallite+jarosite, and cristobalite) inside close to the phyllic zone and the argillic zone (quartz+smectite+kaolinite) outside [42].
Hydrothermal alteration results in significant variations in the elemental content and mineralogical composition of the host rocks through which hydrothermal fluids circulated. These metasomatic exchange reactions can be calculated using various methods, such as mass exchange computations, alteration indices, and molar element ratios. Some researchers have frequently used molar element ratios to identify the dominant alteration minerals, which form through the replacement of primary minerals, mainly in magmatic rocks [11,63,64,106]. In a low-sulphidation epithermal system in New Zealand, [106] used the molar ratios of rock-forming elements in feldspars and phyllosilicate alteration minerals to determine the abundance of alteration minerals. Molar elemental ratios indicate the presence of unaltered rocks, K gain, and Na-Ca loss, as well as the existence of illite-smectite-kaolinite associations. The ratios suggest the existence of illite-smectite-kaolinite when K/Al is between 0.2-0.33, less than 0.2, and equals zero, respectively.
The quartz feldspar porphyry samples in the Kestanelik gold field fell within the range of 2Ca+Na+K/Al and K/Al values of the feldspar compositions and biotite mixtures. Meanwhile, the quartz vein and quartz mica schist samples fell into the K-mica area (Figure 16). The presence of alteration samples in these areas indicates sericitic and argillic alteration types. Additionally, there are propylitic alterations in quartz feldspar porphyry and silicic alterations in quartz veins due to the gain of Na, Ca, and K.
According to [11], illite-smectite, illite, K-mica, and K-feldspar-biotite areas are found in the NW Iran Tarom-Hashtjin precious and base metal epithermal deposits, indicating propylitic and argillic alteration types. Additionally, there are propylitic alterations in quartz feldspar porphyry and silicic alterations in quartz veins due to the gain of Na, Ca, and K.
Ishikawa alteration index, chlorite-carbonate-pyrite index, sericite index and chemical weathering index were used to determine the hydrothermal alterations in quartz vein, quartz feldspar porphyry and quartz micaschist samples around the Kestanelik Au deposit. The Ishikawa alteration index and chlorite-carbonate-pyrite index diagram were used to determine the hydrothermal decomposition and alteration tendencies of the samples. The results showed that the most abundant alterations were chlorite-pyrite, sericite-chlorite-pyrite, chlorite-pyrite-sericite, and chlorite-carbonate, in that order (Figure 10a). The indices also revealed the presence of argillic, chlorite, and propylitic alterations (Figure 10b). Comparison of major oxide (Na2O, K2O, Al2O3, CaO, MgO, FeO) values of hydrothermal alteration samples in the Kestanelik gold deposit with the Ishikawa weathering index revealed mainly chlorite-sericite, sericite, and less adularia-sericite mineral associations (Figure 11). This association indicates sericitic (argillic), propylitic, and adularia alteration types and these alteration types are characteristic of epithermal deposits with low sulphidation. According to [9], the pyrite, sericite, and chlorite-carbonate in the epithermal vein samples of the Siah Jangal-Sar Kahno gold deposit in SE Iran tended to be argillic, sericite-carbonate and clay minerals in most of the samples.
The diagram plots sericitization index values against K2O+Na2O and CaO values. All samples for K2O+Na2O were located in the hydrothermal alteration area. The increase and decrease of sericitization index, according to the rock types for CaO values, indicate weak carbonation (Figure 12a-b). [63] reported that the samples in the hydrothermal alteration area on the Zigana-NE Turkey volcanics generally fell into the hydrothermal alteration area, according to the K2O+Na2O sericitization index. [64] stated that carbonation is the dominant alteration type in the NE Turkey Arzular (Gümüşhane) epithermal gold mineralization area, based on the K2O+Na2O and CaO diagrams made on andesite samples.
Chemical weathering index, Al2O3-(CaO+Na2O)-K2O (A-CN-K) in the triangle diagram, quartz veins in the Kestanelik gold field are mostly located in the illite and smectite areas, quartz feldspar porphyries in the muscovite, biotite, smectite areas, and quartz mica schists in the illite, muscovite, biotite, smectite areas (Figure 14). The Al2O3-(Na2O+K2O) - (Fe2O3+MgO)-K2O triple diagram indicates that the quartz vein and quartz micaschist samples are located in the K-silicate, propylitic and sericitic areas, while the quartz feldspar porphyry is mainly in the propylitic and slightly K-silicate area (refer to Figure 15). The quartz feldspar porphyry samples in the Kestanelik gold field fell within the range of 2Ca+Na+K/Al and K/Al values of the feldspar compositions and biotite mixtures. Meanwhile, the quartz vein and quartz mica schist samples fell into the K-mica area (Figure 16). The presence of alteration samples in these areas indicates sericitic and argillic alteration types. Additionally, there are propylitic alterations in quartz feldspar porphyry and silicic alterations in quartz veins due to the gain of Na, Ca, and K. The diagram displaying the molar K2O/Al2O3-Na2O/Al2O3 ratio indicates moderate to strong argillic and sericitic, silicic, and propylitic alterations (Figure 17a). The K2O/Al2O3 vs. MgO/Al2O3 molar ratio plot shows the recovery of K and Al after the relationship between muscovite and chlorite (Figure 17b). The TiO2-Al2O3 graph shows a single trend from weak to strong for all rock groups in terms of hydrothermal alterations (Figure 18a). On the Al2O3-Zr graph, the presence of intensely altered mafic, intermediate, and felsic rocks is observed due to mass gain (Figure 18b). The molar ratio graph of the porphyry unit in the Karatepe Sector shows that the majority of the data is concentrated in interlayered illite-smectite, illite, and K-mica with high Na and Ca loss. The gain and loss of K depend on the proximity to Au mineralization [105].
[11] identified the main types of alteration in the Tarom-Hashtjin epithermal deposits in NW Iran as argillic, sericitic, and propylitic using this method. They also suggested that K and Al recovery could be achieved with the ratio graph. Similarly, [9] detected a single alteration trend from dioritic rocks and weakly altered rocks to heavily altered flysch host rocks and epithermal veins in the Siah Jangal-Sar Kahno epithermal gold deposit in SE Iran. The study found a trend from mafic to acidic composition in severely altered igneous rocks in the Tarom-Hashtjin (NW Iran) precious and base metal epithermal deposits. Additionally, [9] reported moderate composition and mass gain using this method in the epithermal gold deposit in SE Iran.
Rare earth elements (REE) play an important role in interpreting the origin of hydrothermal solutions that form alterations in and around mineralization. Although previously considered immobile, recent studies have shown that they can be mobilized through the circulation of hydrothermal fluid [96,107,108]. The alteration (hydrothermal and supergene) of granitic rocks from SW England may cause mobility of REE, particularly trivalent REE extracted from the system during K-silicate alteration, Eu lost during sericitic alteration, and light REE removed from hydrothermal system throughout chloritization and argillic alteration [96]. The analysis of the separated minerals revealed significant negative Eu anomalies in the micas and a positive Eu anomaly in the K-feldspar.
The distribution patterns of rare earth elements (REE) in various rocks, as well as the abundance of light rare earth elements (LREE) compared to heavy rare earth elements (HREE), and the concentration of REE in all rocks, tend to decrease with increasing hydrothermal alteration intensity. It appears that the hydrothermal fluids responsible for alteration in the Kestanelik Au deposit and host rocks had a low content of REE, which were mobilized. Negative Eu anomaly is caused by the kaolinization of feldspars and micas, and chloritization of biotite and feldspars. [41] reported that illites from the Tesbihdere and Kumarlar deposits near the Kestanelik deposit have low chondrite-normalized abundances and negative europium anomalies similar to the samples from Kestanelik. According to [109], REE is mobilized and fractionated during the supracrustal alteration of the Torrongo granodiorite, and the initial and moderately altered rocks are especially enriched in heavy REE, whereas the strongly altered components are particularly depleted in heavy REE. Furthermore, the mobility of REE is likely due to pH variations in soil and groundwater. As different chemical environments are encountered, fractionation may also occur due to mineralogical controls.
The distribution of REE in the Dartmoor pluton and the effects of hydrothermal alteration on REE mobility have occurred regionally in all types of granite. During sericitization, chloritization, and tourmalinization, rare earth elements were mobilized over short distances and redistributed into secondary alteration products such as sericite, chlorite, tourmaline, allanite, and sphene [99]. It has been suggested that granites with large negative Eu anomalies, high REE concentrations, and high LREE/HREE ratios require sources containing abundant plagioclase and fewer amounts of garnet, amphibole, or pyroxene [110].
Low-sulphidation epithermal deposits form under near-neutral pH conditions when liquid is reduced to H2S of the S types and magmatic components are entrained within deep circulating groundwater [111,112,113,114]. Most of epithermal gold deposits are associated with contemporary calc-alkaline volcanic rocks and plutonic rocks as well as quartz diyorite, monzonite and granodiorite [7,115,116]. Kestanelik gold deposit is hosted by porphyry and metamorphic rocks. Faults are involved in the deposition of the Kestanelik gold mineralization, where hydrothermal activity is effective in altering the host rocks.
The mineralization in the area is characterized by intense hydrothermal activity observed in epithermal vein systems associated with fault zones, quartz veins and stockwork veinlets. The mineralized quartz vein and breccia system is situated at the center of the chlorite-pyrite zone. Outwardly, there are zones of sericite-chlorite-pyrite, chlorite-pyrite-sericite, and chlorite-carbonate. The Kestanelik gold deposit exhibits noticeable hydrothermal alteration zones surrounding the ore- bearing quartz veins, extending from the inside out to the halos. These zones contain silicic, less evolved sericitic alteration, more common argillic alteration, and lastly propylitic alteration. Limonitization and hematitization are also commonly observed in the field. These hydrothermal alterations are extensive and widespread in porphyry rocks and around metamorphic rocks. Kestanelik gold ore deposit exhibits various types of hydrothermal alterations, including silicification, argillization, propylitization, sericitization, chloritization, limonitization, and hematitization. Silicic alteration and/or breccia, which are commonly found near fluid channels, are the most prevalent types of alteration. These channels facilitate gold precipitation throughout the deposit, which may explain the formation of natural gold and the high gold grade in quartz veins. According to the third phase of the alteration minerals and gold formation processes in the Ovacık field [34], the hydrothermal system was likely formed by the provision of silica to create the siliceous cover in and around the deposit. Additionally, smectite-illite mixed layers were formed under acidic conditions. The silica alteration is associated with the replacement of plagioclase by fine-grained quartz or the formation of quartz veins. Intensively silicified rocks are the most suitable areas for gold precipitation and generally occur in the inner alteration zone of Kestanelik mineralization. Argillization is commonly found on the upper and side walls of the Kestanelik ore body. Primary alteration minerals consist of illite and sericite, as well as small amounts of chlorite. Illite may have formed from sericite, a mineral that occurs at moderate to low temperatures under epithermal conditions (200°C, pH 5-6) as noted by [34]. Sericitic and chloritic alterations represent local alteration and are commonly found in metamorphic and quartz-feldspar porphyry rocks. These alterations are chiefly the result of the replacement of plagioclase by sericite and chlorite, indicating that residual phenocrysts of plagioclase are preserved to varying degrees of hydrothermal metasomatism. These alterations are mostly a result of hydrothermal processes and generally characterize the outer zone of the Kestanelik ore body. Propyllitic alteration, containing illite, smectite and chlorite minerals, represents the outermost region of the ore body.
Funding
This research was part of D. Kıray’s doctoral study and was funded by Süleyman Demirel University Scientific Research Project Office (BAP, project no: 3574-D2-13).
Data Availability Statement
Data are contained within the article.
Acknowledgments
The authors are also thanked Tümad-Mining Inc. and Chesser Resources Inc. due to helping field studies and suppling drilling core sample. The authors are deeply grateful to the reviewers for allowing us to make this paper better.
Conflicts of Interest
The authors declare no conflict of interest.
References
- Berger, B.R.; Bonham, H.F., Jr. Epithermal gold-silver deposits in the western United States: time-space products of evolving plutonic, volcanic and tectonic environments. Journal of Geochemical Exploration 1990, 36, 103–142. [Google Scholar] [CrossRef]
- Camus, F. The geology of hydrothermal gold deposits in Chile. Journal of Geochemical Exploration 1990, 36, 197–232. [Google Scholar] [CrossRef]
- Dong, G.; Morrison, G.; Jaireth, S. Quartz textures in epithermal veins, Queensland: classification, origin and implication. Economic Geology 1995, 90, 1841–1856. [Google Scholar] [CrossRef]
- Yılmaz, H.; Oyman, T.; Arehart, G.A.; Çolakoğlu, R.; Billor, Z. Low-sulfidation type Au–Ag mineralization at Bergama, Izmir, Turkey. Ore Geology Reviews 2007, 32, 81–124. [Google Scholar] [CrossRef]
- Yılmaz, H.; Oyman, T.; Sönmez, F.N.; Arehart, G.B.; Billor, Z. Intermediate sulfidation epithermal gold-base metal deposits in Tertiary subaerial volcanic rocks Şahinli/Tespih Dere (Lapseki/Western Turkey). Ore Geology Reviews 2010, 37, 236–258. [Google Scholar] [CrossRef]
- Ünal İmer, E.; Güleç, N.; Kuşcu, İ.; Fallick, A.E. Genetic investigation and comparison of Kartaldag and Madendag epithermal gold deposits in Çanakkale, NW Turkey. Ore Geology Reviews 2013, 53, 204–222. [Google Scholar] [CrossRef]
- Liu, L.; Richards, J.P.; DuFrane, S.A.; Rebagliati, M. Geochemistry, geochronology, and fluid inclusion study of the Late Cretaceous Newton epithermal gold deposit, British Columbia. Canadian Journal of Earth Sciences 2016, 53, 10–33. [Google Scholar] [CrossRef]
- Liu, Z.; Mao, X.; Deng, H.; Li, B.; Zhang, S.; Lai, J.; Bayless, R.C.; Pan, M.; Longjiao, L.; Shang, Q. Hydrothermal processes at the Axi epithermal Au deposit, Western Tianshan: insights from geochemical effects of alteration, mineralization and trace elements in pyrite. Ore Geology Reviews 2018, 102, 368–385. [Google Scholar] [CrossRef]
- Najaran, M.; Mehrabi, B.; Siani, M. G. Mineralogy, hydrothermal alteration, fluid inclusion, and O–H stable isotopes of the Siah Jangal-Sar Kahno epithermal gold deposit, SE Iran. Ore Geology Reviews 2020, 125, 103689. [Google Scholar] [CrossRef]
- Novruzov, N.; Valiyev, A.; Bayramov, A.; Mammadov, S.; Ibrahimov, J.; Ebdulrehimli, A. Mineral composition and paragenesis of altered and mineralized zones in the Gadir low sulfidation epithermal deposit (Lesser Caucasus, Azerbaijan). Iranian Journal of Earth Sciences 2019, 11, 14–29. [Google Scholar]
- Siani, M.G.; Lentz, D.R. Lithogeochemistry of various hydrothermal alteration types associated with precious and base metal epithermal deposits in the Tarom-Hashtjin metallogenic province, NW Iran: implications for regional exploration. Journal of Geochemical Exploration 2022, 232, 106903. [Google Scholar] [CrossRef]
- Simpson, M.P.; Christie, A.B. Hydrothermal alteration, mineralogical footprints for New Zealand epithermal Au-Ag deposits. New Zealand Journal of Geology and Geophysics 2019, 62, 483–512. [Google Scholar] [CrossRef]
- Simpson, M.P.; Gazley, M.F.; Stuart, A.G.; Pearce, M.A.; Birchall, R.; Chappell, D.; Christie, A.B.; Stevens, M.R. Hydrothermal alteration at the Karangahake epithermal Au-Ag deposit, Hauraki Goldfield, New Zealand. Economic Geology 2019, 114, 243–273. [Google Scholar] [CrossRef]
- Taylor, B. E. Epithermal gold deposits, Mineral deposits of Canada: a synthesis of major deposits-types, district metallogeny, the evolution of geological provinces, and exploration methods. Goodfellow, W.D., (ed.), Geological Association of Canada, Mineral Deposits Division 2007, Special Publication N. 5, pp. 113–139.
- White, N.C.; Hedenquist, J.W. Epithermal gold deposits: styles, characteristics and exploration. SEG Newsletter 1995, 23, 9–13. [Google Scholar] [CrossRef]
- Evans, A.M. Ore geology and industrial minerals: an introduction. Blackwell Publ., Oxford, 1993; pp. 389.
- Deb, M. Epithermal gold deposits: their characteristics and modeling, (online), available, psdg.bgl.esdm.go.id/makalah/Bandung-Gold-Mihir.pdf, August 23, 2023. 23 August.
- Hedenquist, J.W.; Arribas, R.A.; Gonzalez-Urien, E. Exploration for epithermal gold deposits. Society of Economic Geology Reviews 2000, 13, 245–277. [Google Scholar]
- Duba, D.; Williamsjones, A.E. The application of illite crystallinity, organic-matter reflectance, and isotopic techniques to mineral exploration-A case-study in southwestern Gaspé, Quebec. Economic Geology 1983, 78, 1350–1363. [Google Scholar] [CrossRef]
- Kelley, D.L.; Kelley, K.D.; Coker, W.B.; Caughlin, B.; Doherty, M.E. Beyond the obvious limits of ore deposits: The use of mineralogical, geochemical, and biological features for the remote detection of mineralization. Economic Geology 2006, 101, 729–752. [Google Scholar] [CrossRef]
- Guo, N.; Guo, W.; Shi, W.; Huang, Y.; Guo, Y.; Lian, D. Characterization of illite clays associated with the Sinongduo low sulfidation epithermal deposit, Central Tibet using field SWIR spectrometry. Ore Geology Reviews 2020, 120, 103228. [Google Scholar] [CrossRef]
- Yoneda, T.; Mokko, H.; Matsumoto, A.; Sato, T. Comparison of smectite–corrensite–chlorite series minerals in the Todoroki and Hishikari Au–Ag deposits: applicability of mineralogical properties as exploration index for epithermal systems. Natural Resources Research 2021, 30, 2889–2908. [Google Scholar] [CrossRef]
- Simmons, S.F.; White, N.C.; John, D.A. Geological characteristics of epithermal precious and base metal deposits. Society of Economic Geologists 2005, Inc., 485–522. [Google Scholar]
- Meyer, C.; Hemley, J.J. Wall rock alteration in geochemistry of ore deposits (ed. H.L. Barnes) (M). New York, 1967; pp. 166–235.
- Rose, A.W.; Burt, D.M. Hydrothermal alteration. In Barnes, H. L. (Ed.), Geochemistry of Hydrothermal Ore Deposits, John Wiley & Sons. New York, 1979; p. 173-235.
- Chen, M.T.; Wei, J.H.; Li, Y.J.; Shi, W.J.; Liu, N.Z. Epithermal gold mineralization in Cretaceous volcanic belt, SE China: insight from the Shangshangang deposit. Ore Geology Reviews 2020, 118, 103355. [Google Scholar] [CrossRef]
- Prihatmoko, S.; Idrus, A. Low sulfidation epithermal gold deposits in Java, Indonesia: characteristic and linkage to the volcano-tectonic setting. Ore Geology Reviews 2020, 121, 103490. [Google Scholar] [CrossRef]
- Kıray, D. Determination of the origin of Kestanelik Au-Ag mineralization in Şahinli (Lapseki-Çanakkale, Western Turkey) region by geological, mineralogical and geochemical investigations. PhD. Thesis, Süleyman Demirel University, 2021; pp. 217.
- Bakhsh, R.A.; Ahmed, A. H, The Umm Matierah gold prospect: Mineralogical and geochemical characteristics of a potential low-sulfidation epithermal gold deposits, southeastern Arabian Shield, Saudi Arabia. Journal of Asian Earth Sciences 2023, X 9, 100153. [Google Scholar] [CrossRef]
- Mikaeili, K.; Hosseinzadeh, M.R.; Moayyed, M.; Maghfouri, S. The Shah-Ali-Beiglou Zn-Pb-Cu (-Ag) deposit, Iran: an example of intermediate sulfidation epithermal type mineralization. Minerals 2018, 8, 148. [Google Scholar] [CrossRef]
- Imer, A.; Richards, J.P.; Muehlenbachs, K. Hydrothermal evolution of the Çöpler porphyry-epithermal Au deposit, Erzincan Province, central eastern Turkey. Economic Geology, 1619. [Google Scholar]
- Kıray, D.; Cengiz, O. Petrographical and geochemical characteristics of the Kestanelik granitoid (Çanakkale, Biga Peninsula). Geological Bulletin of Turkey 2023, 66, 127–148. [Google Scholar]
- Gürler, Z. Karadere low sulphidation gold deposit (İvrindi, Balıkesir): an example for detachment fault-related epithermal gold deposits in Western Turkey. M.Sc. Thesis, Balıkesir University, 2019; p. 100.
- Dill, H.G.; Dohrmann, R.; Kaufhold, S.; Çiçek, G. Mineralogical, chemical and micromorphological studies of the argillic alteration zone of the epithermal gold deposit Ovacik, Western Turkey: tools for applied and genetic economic geology. Journal of Geochemical Exploration 2015, 148, 105–127. [Google Scholar] [CrossRef]
- Carrillo-Rosúa, J.; Morales-Ruano, S.; Esteban-Arispe, I.; Hach-Ali, P.F. Significance of phyllosilicate mineralogy and mineral chemistry in an epithermal environment. Insights from the Palaı-Islica Au-Cu deposit (Almeria, SE Spain). Clays and Clay Minerals.
- Cravero, F.; Domınguez, E.; Iglesias, C. Genesis and applications of the Cerro Rubio kaolin deposit, Patagonia Argentina. Applied Clay Science 2001, 18, 157–172. [Google Scholar] [CrossRef]
- Dill, H.G.; Fricke, A.; Henning, K. H.; Theune, C.H. Aluminium phosphate mineralization from the hypogene La Vanguardia kaolin deposit (Chile). Clay Minerals 1995, 30, 249–256. [Google Scholar] [CrossRef]
- Dill, H.G.; Bosse, H.-R.; Henning, K.H.; Fricke, A.; Ahrendt, H. Mineralogical and chemical variations in hypogene and supergene kaolin deposits in a mobile fold belt the Central Andes of northwestern Peru. Mineralium Deposita 1997, 32, 149–163. [Google Scholar] [CrossRef]
- Kadir, S.; Erkoyun, H. Genesis of the hydrothermal Karaçayır kaolinite deposit in Miocene volcanics and Palaeozoic metamorphic rocks of the Uşak-Güre Basin, western Turkey. Turkish Journal of Earth Sciences 2013, 22, 444–468. [Google Scholar] [CrossRef]
- Marfil, S.A.; Maiza, P.J.; Montecchiari, N. Alteration zonation in the Loma Blanca kaolin deposit, Los Menucos, Province of Rio Negro, Argentina. Clay Minerals 2010, 45, 157–169. [Google Scholar] [CrossRef]
- Bozkaya, Ö.; Bozkaya, G.; Uysal, İ.T.; Banks, D.A. Illite occurrences related to volcanic-hosted hydrothermal mineralization in the Biga Peninsula, NW Turkey: Implications for the age and origin of fluids. Ore Geology Reviews 2016, 76, 35–51. [Google Scholar] [CrossRef]
- Bozkaya, Ö.; Bozkaya, G.; Hanilçi, N.; Güven, A.S.; Banks, D.A.; Uysal, İ.T. Mineralogical evidences on argillic alteration in the Çöpler porphyry-epithermal gold deposit (Erzincan, East-Central Anatolia). Geological Bulletin of Turkey 2018, 31, 335–358. [Google Scholar]
- Schalamuck, I.B.; Zubia, M.; Genini, A.; Fernandez, R.R. Jurassic epithermal Au–Ag deposits of Patagonia, Argentina. Ore Geol. Rev. 1997, 305, 57–71. [Google Scholar] [CrossRef]
- Sillitoe, R.H. Exploration and discovery of base- and precious-metal deposits in the Circum-Pacific region during the last 25 years. Resource Geology Special Issue no. 19. Society of Resource Geology 1995, pp.
- Gresens, R.L. Composition volume relationships of metasomatism. Chem. Geol. 1967, 2, 47–65. [Google Scholar] [CrossRef]
- Ishikawa, Y.; Sawaguchi, T.; Iwaya, S.; Horiuchi, M. Delineation of prospecting targets for Kuroko deposits based on models of volcanism of underlying dacite and alteration haloes. Mining Geology 1976, 26, 105–117. [Google Scholar]
- Nesbitt, H.W.; Young, G.M. Early Proterozoic climates and plate motions inferred from major element chemistry of lutites. Nature 1982, 299, 299,715–717. [Google Scholar] [CrossRef]
- Myers, R.E.; MacLean, W.H. The geology of the New Insco copper deposit, Noranda District, Quebec. Canadian Jour. Earth Sci. 1983, 20, 1291–1304. [Google Scholar] [CrossRef]
- MacLean, W.H.; Kranidiotis, P. Immobile elements as monitors of mass transport in hydrothermal alteration: Phelps Dodge massive sulfide deposit, Matagomi. Econ.Geol. 1987, 82, 951–962. [Google Scholar] [CrossRef]
- MacLean, W.H.; Hoy, L.D. Geochemistry of hydrothermally altered rocks at the Horne mine, Noranda, Quebec. Economic Geology 1991, 86, 506–528. [Google Scholar] [CrossRef]
- Davies, J.F.; Whitehead, R.E. Molar ratios in the study of unaltered and hydrothermally altered greywackes and shales. Chemical Geology 1994, 111, 85–100. [Google Scholar] [CrossRef]
- Davies, J.F.; Whitehead, R.E. Alkali-alumina and MgO-alumina molar ratios of altered and unaltered rhyolites. Exploration and Mining Geology 2006, 15, 75–88. [Google Scholar] [CrossRef]
- Davies, J.F.; Whitehead, R.E. Alkali/alumina molar ratio trends in altered granitoid rocks hosting porphyry and related deposits. Exploration and Mining Geology 2010, 19, 13–22. [Google Scholar] [CrossRef]
- Leitch, C.H.B.; Lentz, D.R. The gresens approach to mass balance constraints of alteration systems,11, Geological Association of Canada, 1994; pp.161-192.
- Lentz, D. R.; Gregoire, C. Petrology and mass-balance constraints on major-, trace-, and rare-earth-element mobility in porphyry-greisen alteration associated with the epizonal True Hill granite, southwestern New Brunswick, Canada. Journal of Geochemical Exploration 1995, 52, 303–331. [Google Scholar] [CrossRef]
- Lentz, D.R. Recent advances in lithogeochemical exploration for massive-sulphide deposits in volcano-sedimentary environments: petrogenetic, chemostratigraphic, and alteration aspects with examples from the Bathurst Camp, New Brunswick. In Current Research 1995, Edited by B.M.W. Carroll. New Brunswick Department of Natural Resources and Energy, Minerals and Energy Division, Mineral Resources Report 1996; 96, 73–119.
- Madeisky, H.E. Quantitative analysis of hydrothermal alteration: applications in lithogeochemical exploration (Doctoral Dissertation, PhD., University of London, 1996.
- Franklin, J.M.; Duke, J.M. Lithogeochemical and mineralogical methods for base metal and gold exploration A.G. Gubins (Ed.), Proceedings of Exploration 97: Fourth Decennial International Conference on Mineral Exploration, 1997; pp.191-208.
- Aiuppa, A.; Allard, P.; D’Alessandro, W.; Michel, A.; Parello, F.; Treuil, M.; Valenza, M. Mobility and fluxes of major, minor and trace metals during basalt weathering and groundwater transport at Mt. Etna Volcano (Sicily). Geochimimica et Cosmochimica Acta 2000, 64, 1827–1841. [Google Scholar]
- Large, R.R.; Gemmell, J.B.; Paulick, H.; Huston, D.L. The alteration box plot: asimple approach to understanding the relationship between alteration mineralogy and lithogeochemistry associated with volcanic-hosted massive sulfide deposits. Economic Geology 2001, 96, 957–971. [Google Scholar]
- Grant, J.A. Isocon analysis: a brief review of the method and applications. Phys. Chem.Earth. 2005, 30, 997–1004. [Google Scholar] [CrossRef]
- Kirschbaum, A.; Martinez, E.; Pettinari, G.; Herrero, S. Weathering profiles in granites, Sierra Notre (Cordoba, Argentina). J. S. Am. Earth. Sci. 2005, 19, 479–493. [Google Scholar] [CrossRef]
- Sipahi, F.; Sadıklar, M.B. The alteration mineralogy and mass change of the Zigana (Gümüşhane) volcanics of NE Turkey. Geological Bulletin of Turkey 2010, 53, 97–128. [Google Scholar]
- Akaryalı, E.; Tüysüz, N. The genesis of the slab window-related Arzular low-sulfidation epithermal gold mineralization (Eastern Pontides, NE Turkey). Geoscience Frontiers 2013, 4, 409–421. [Google Scholar] [CrossRef]
- Giggenbach, W.F. Mass transfer in hydrothermal alteration systems-a conceptual approach. Geochimica et Cosmochimica Acta 1984, 48, 2693–2711. [Google Scholar] [CrossRef]
- Giggenbach, W.F. Geothermal solute equilibria: derivation of Na-K-Mg-Ca geoindicators. Geochimica et Cosmochimica Acta 1988, 52, 2749–2765. [Google Scholar] [CrossRef]
- Stanley, C.R.; Madeisky, H.E. Lithogeochemical exploration for hydrothermal ore deposits using Pearce element ratio analysis. Geological Association of Canada, 1994; Short Course Notes 11.
- Stanley, C.R.; Madeisky, H.E. Lithogeochemical exploration for metasomatic zones associated with hydrothermal mineral deposits using Pearce element ratio analysis. Short Course Notes on Pearce Element Ratio Analysis, 1996.
- Stanley, C.R. Graphical investigation of lithogeochemical variations using molar element ratio diagrams: theoretical foundation. In lithogeochemical exploration for metasomatic zones associated with hydrothermal mineral deposits using molar element ratio analysis. Edited byC, 1998; 63-103.
- Stanley, C.R. Molar element ratio analysis of lithogeochemical data: a toolbox for use in mineral exploration and mining. Geochem. Explor. Environ. Anal. 2020, 20, 233–256. [Google Scholar] [CrossRef]
- Weihed, P. Lithogeochemistry, metal and alteration zoning in the Proterozoic Tallberg porphyry-type deposit, northern Sweden. Journal of Geochemical Exploration.
- Şengör, A.M.C.; Yılmaz, Y. Tethyan evolution of Turkey: a plate tectonic approach. Tectonophysics 1981, 75, 181–241. [Google Scholar] [CrossRef]
- Richards, J.P. Tectonic, magmatic, and metallogenic evolution of the Tethyan Orogen: from subduction to collision. Ore Geology Reviews 2015, 70, 323–345. [Google Scholar] [CrossRef]
- Aldanmaz, E.; Pearce, J.A.; Thirlwall, M.F.; Mitchell, J.G. Petrogenetic evolution of late Cenozoic, post collision volcanism in western Anatolia, Turkey. Journal of Volcanology and Geothermal Research 2000, 102, 67–95. [Google Scholar] [CrossRef]
- Altunkaynak, Ş.; Genç, Ş.C. Petrogenesis and time-progressive evolution of the Cenozoic continental volcanism in the Biga Peninsula, NW Anatolia. Lithos 2008, 102, 316–340. [Google Scholar] [CrossRef]
- Ketin, İ. Anadolu’nun tektonik birlikleri. Bulletin of the Mineral Research and Exploration 1966, 66, 20–34. [Google Scholar]
- Yılmaz, Y. Comparision of young volcanic associations of western and eastern Anatolia under compressional regime: a review. Journal of Volcanology and Geothermal Research 1990, 44, 69–87. [Google Scholar] [CrossRef]
- Şengör, A.M.C.; Lom, N.; Sunal, G.; Zabcı, C.; Sancar, T. The Phanerozoic palaeotectonics of Turkey. Part I: an inventory. Mediterranean Geoscience Reviews.
- Okay, A.İ.; Siyako, M.; Bürkan, K.A. Geology and tectonic evolution of the Biga Peninsula (in Turkish with English Abstract). Turkish Assoc. Petrol Geol Bull 1990, 2, 83–121. [Google Scholar]
- Göncüoğlu, M.C. Introduction to the geology of Turkey: geodynamic evolution of the pre-Alpine and Alpine terranes. MTA Monographs Series, 4075; -74. [Google Scholar]
- Topuz, G.; Altherr, R.; Kalt, A.; Satır, M.; Werner, O.; Schwartz, W. H, Aluminous granulites from the Pulur complex, NE Turkey: acase of partial melting, efficient melt extraction and crystallisation. Lithos 2004, 72, 183–207. [Google Scholar] [CrossRef]
- Topuz, G.; Altherr, R.; Schwartz, W.H.; Dokuz, A.; Meyer, H.P. Variscan amphibolites-facies rocks from the Kurtoğlu metamorphic complex (Gümüşhane area, Eastern Pontides, Turkey). Int. J. Earth Sci. 2007, 96, 861–873. [Google Scholar] [CrossRef]
- Okay, A.I.; Satir, M.; Siebel, W. Pre-Alpide Palaeozoic and Mesozoic orogenic events in the eastern Mediterranean region. In: Gee, D.G., Stephenson, R.A. (eds), European Lithosphere Dynamics. Geological Society, London, 2006; Memoirs 32, pp. 389–405.
- Delaloye, M.; Bingöl, E. Granitoids from western and nortwestern Anatolia: Geochemistry and modeling of geodynamic evolution. International Geology Review 2000, 42, 241–268. [Google Scholar] [CrossRef]
- Okay, A.İ.; Satır, M. Coeval plutonism and metamorphism in a Latest Oligocene metamorphic core complex in northwest Turkey. Geol. Mag. 137, 495–516. [CrossRef]
- Okay, A.İ.; Monod, O.; Monie, P. Triassic blueschists and eclogites from northwest Turkey: Vestiges of the Paleo-Tethyan subduction. Lithos 2002, 64, 155–178. [Google Scholar] [CrossRef]
- Okay, A.İ.; Göncüoğlu, C. The Karakaya complex: a review of data and concepts. Turkish Journal of Earth Sciences (Turkish J. Earth Sci.).
- Okay, A.İ.; Monie, P. Early Mesozoik subduction in the Eastern Mediterranean evidence from Triassic eclogite in northwest Turkey. Geology 1997, 25, 595–598. [Google Scholar] [CrossRef]
- Okay, A.İ.; Satır, M. Upper Cretaceous eclogite-facies metamorphic rocks from the Biga Peninsula, northwest Turkey. Turkish Journal of Earth Sciences (Turkish J. Earth Sci.).
- Dönmez, M.; Akçay, A.E.; Genç, Ş.C.; Acar, Ş. Middle-upper Eocene volcanism and marine ignimbrites in the Biga Peninsula. Bulletin of the Mineral Research and Exploration 2005, 131, 49–61. [Google Scholar]
- Chesser Resources. Chesser Resources Limited. Annual Report, Çanakkale, 2012.
- Erenoğlu, O. Chrono-stratigraphic position of Eocene, Oligo-Miocene volcanics around Dededag (Beyçayır-Çanakkale) and their importance for regional volcanism in the Biga Peninsula. Ph. D. Thesis, Çanakkale Onsekiz Mart University, Çanakkale, 2014; pp. 217.
- Hedenquist, J.W. Observations on the Kestanelik and Karaayi prospects, Biga Peninsula, Turkey. Unpublished annual report for Chesser Resources, Çanakkale, 2012.
- Gülyüz, N.; Shipton, Z.K.; Kuşcu, İ.; Lord, R.A.; Kaymakcı, N.; Gülyüz, E.; Gladwell, D.R. Repeated reactivation of clogged permeable pathways in epithermal gold deposits: Kestanelik epithermal vein system, NW Turkey. Journal of the Geological Society 2018, 175, 509–524. [Google Scholar] [CrossRef]
- Tümad Mining. Tümad Mining Industry and Trade Inc., Annual Report, 10, Çanakkale, 2020.
- Alderton, D.H.M.; Pearce, J. A.; Potts, P. J. Rare earth element mobility during granite alteration: evidence from southwest England. Earth and Planetary Science Letters 1980, 49, 149–165. [Google Scholar] [CrossRef]
- Schneider, H.J.; Özgür, N.; Palacios, C.M. Relationship between alteration, rare earth element distribution, and mineralization of the Murgul Copper deposit, northeastern Turkey. Economic Geology 1988, 83, 1238–1246. [Google Scholar] [CrossRef]
- Yongliang, X.; Yusheng, Z. The mobility of rare-earth elements during hydrothermal activity: areview. Chinese Journal of Geochemistry 1991, 10, 295–306. [Google Scholar] [CrossRef]
- Ward, C.D.; McArthur, J.M.; Walsh, J.N. Rare earth element behaviour during evolution and alteration of the Dartmoor granite, SW England. Journal of Petrology 1992, 33, 785–815. [Google Scholar] [CrossRef]
- Poitrasson, F.; Pin, C.; Duthou, J.L. Hydrothermal remobilization of rare earth elements and its effect on Nd isotopes in rhyolite and granite. Earth and Planetary Science Letters 1995, 130, 1–11. [Google Scholar] [CrossRef]
- Boynton, W.V. Cosmochemistry of the rare earth elements: meteorite studies. Chapter 3, Development of Geochemistry 1984; 2, 63-114.
- Sverjensky, D.A. Europium redox equilibria in aqueous solution. Earth and Planetary Science Letters 1984, 67, 70–78. [Google Scholar] [CrossRef]
- Şaşmaz, A.; Yavuz, F. REE geochemistry and fluid inclusion studies of fluorite deposits from the Yaylagözü area (Yıldızeli-Sivas) in central Turkey. N. Jb. Geol. Paläont (Abh).
- Barrett, T.; Cattalani, S.; MacLean, W.H. Volcanic lithogeochemistry and alteration at the Dalbridge massive sulphide deposits, Noranda Quebec. Journal of Geochemical Exploration 1993, 48, 135–173. [Google Scholar] [CrossRef]
- Dilekler, G. Mineralization, Textural and Alteration Characteristics of the Şahinli (Sırakayalar and Karatepe) Low Sulfidation Epithermal Deposit (Lapseki, NW Turkey). Master Thesis, Middle East Technical University, Ankara, 2022; p. 148. [Google Scholar]
- Warren, I.; Simmons, S. F.; Mauk, J. L. Whole-rock geochemical techniques for evaluating hydrothermal alteration, mass changes, and compositional gradients associated with epithermal Au-Ag mineralization. Economic Geology 2007, 102, 923–948. [Google Scholar] [CrossRef]
- Michard, A.; Albarede, F. The REE content of some hydrothermal fluids. Chemical Geology 1986, 55, 51–60. [Google Scholar] [CrossRef]
- Palacios, C.M.; Hein, U.F.; Dulski, P. Behaviour of rare earth elements during hydrothermal alteration at the Buena Esperanza copper–silver deposit, northern Chile. Earth Planetary Science Letter 1986, 80, 208–216. [Google Scholar] [CrossRef]
- Nesbitt, H.W. Mobility and fractionation of rare earth elements during weathering of a granodiorite. Nature 1979, 279, 206–210. [Google Scholar] [CrossRef]
- Henderson, P. General geochemical properties of the rare earth elements. In: Henderson, P. (ed.) Rare Earth Element Geochemistry. Amsterdam: Elsevier 1984;1-32.
- Corbett, G.J. Structural controls to porphyry Cu-Au and epithermal Au-Ag deposits in applied structural geology for mineral exploration. Australian Institute of Geoscientists Bulletin 2002, 36, 32–35. [Google Scholar]
- Corbett, G.J.; Leach, T.M. Southwest pacific rim gold-copper systems: structure, alteration and mineralization. Workshop manual, 1998; p. 185.
- White, N.C.; Hedenquist, J.W. Epithermal environments and styles of mineralization: variations and their causes, and guidelines for exploration. Journal of Geochemical Exploration 1990, 36, 445–474. [Google Scholar] [CrossRef]
- White, N.C.; Leake, M.J.; McCaughey, S.N.; Parris, B.W. Epithermal deposits of the southwest Pacific. Journal of Geochemical Exploration 1995, 54, 87–136. [Google Scholar] [CrossRef]
- Sillitoe, R.H.; Hedenquist, J.W. Linkages between volcanotectonic settings, ore-fluid compositions, and epithermal precious-metal deposits. In Simmons SF, Graham I (eds) Soc. Econ. Geol. Spec. Pub. 2003, 10, 315–343. [Google Scholar]
- Zhong, J.; Chen, Y.J.; Qi, J.P.; Chen, J.; Dai, M.C.; Li, J. Geology, fluid inclusion and stable isotope study of the Yueyang Ag-Au-Cu deposit, Zijinshan ore field, Fujian province, China. Ore Geology Reviews 2017, 86, 254–270. [Google Scholar] [CrossRef]
- Okay, A.İ.; Tüysüz, O. Tethyan sutures of northern Turkey. In: Durand, B, Jolivet, L., Horvath, F. and Seranne, M. Eds. Mediterranean basins: Tertiary extension within the Alpine Orogen. Geological Society, London, 1999; Special Publication 156, 475-515.
- MTA. General and economic geology of the Biga Peninsula. Special Publication Series 28, 2012; p. 326 (in Turkish).
- Tunç, O.; Yiğitbaşı, E.; Şengün, F.; Wazeck, J.; Hofmann, M.; Linnemann, U. U-Pb zircon geochronology of northern metamorphic massifs in the Biga Peninsula (NW Anatolia-Turkey): new data and a new approach to understand the tectonostratigraphy of the region. Geodinamica Acta 2012, 25, 202–225. [Google Scholar] [CrossRef]
- Van Gerven, M. Nebengesteins alterationen and erfassung signifikanter zonierungen im Bereich des Jade-Erzfeldes. Dipl-Geol., Freir Universitate, Rohstoff and Umweltgeologie, Berlin, 1995; pp. 186.
Figure 1.
Location and regional geological map of the study area [modified from 117; 118; 119; 28].
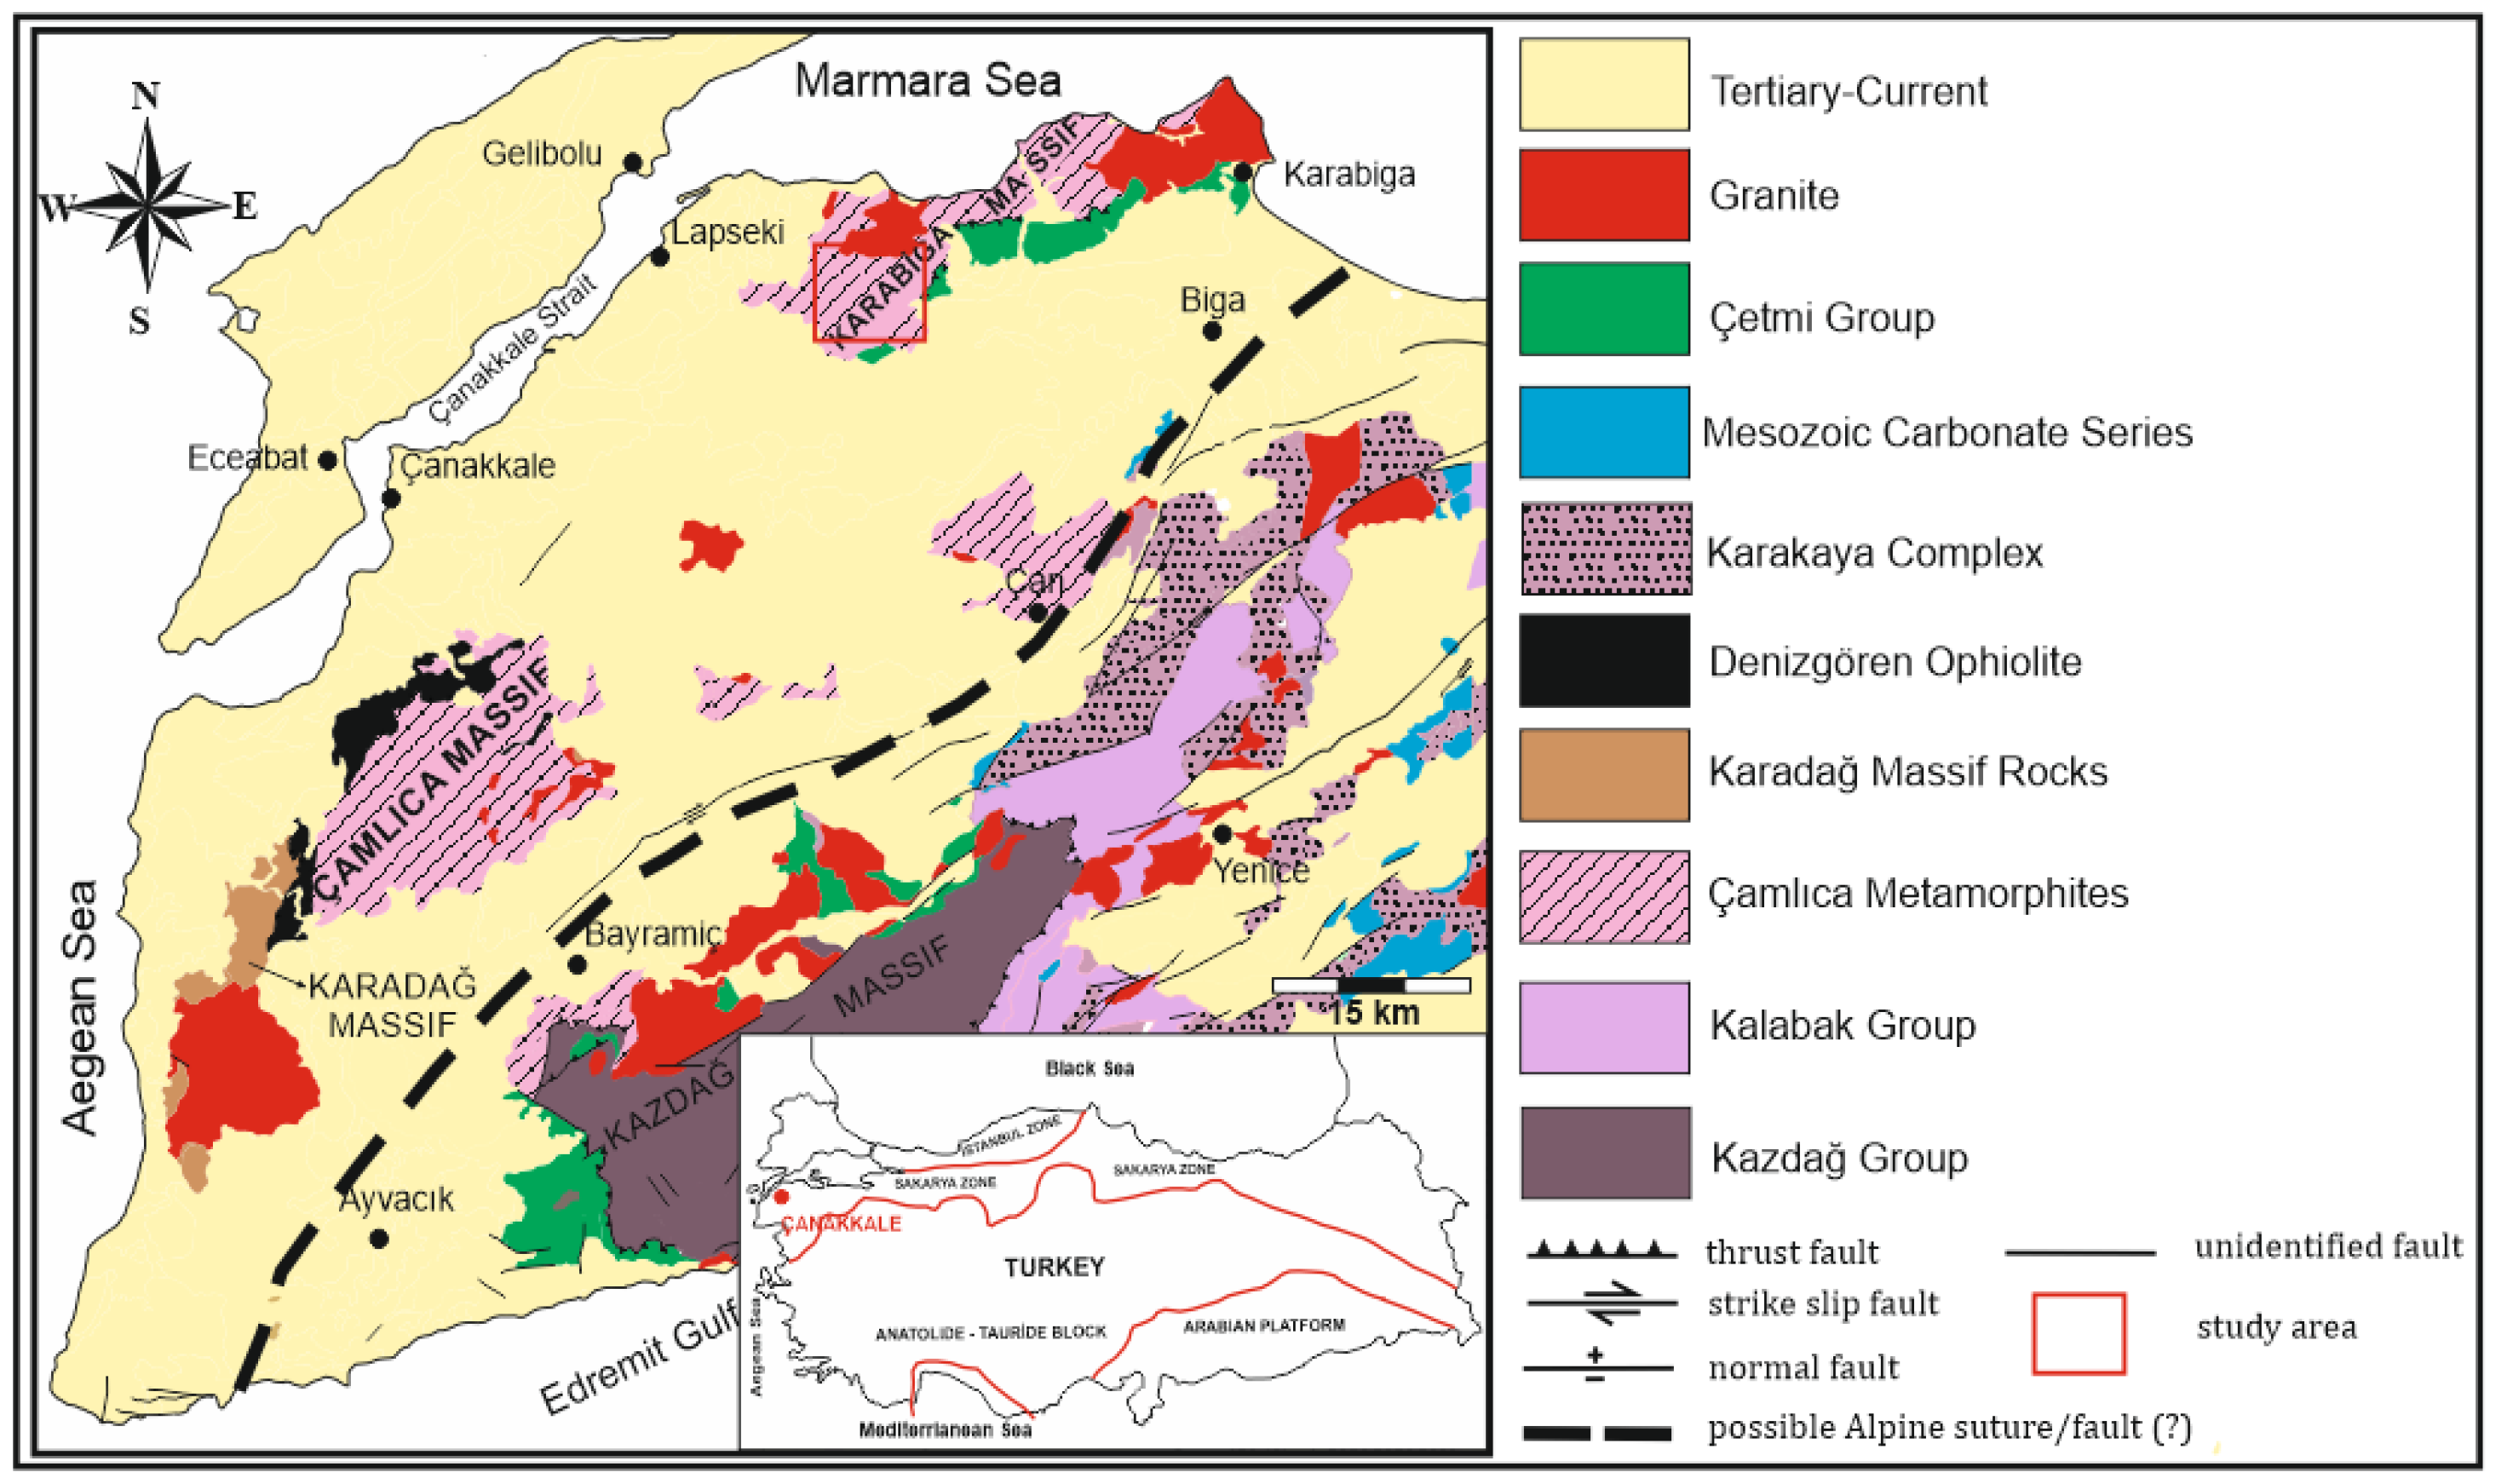
Figure 2.
Geological map and cross section of the study area [modified from 90, 95] and A-A’ geological cross section [28].
Figure 2.
Geological map and cross section of the study area [modified from 90, 95] and A-A’ geological cross section [28].
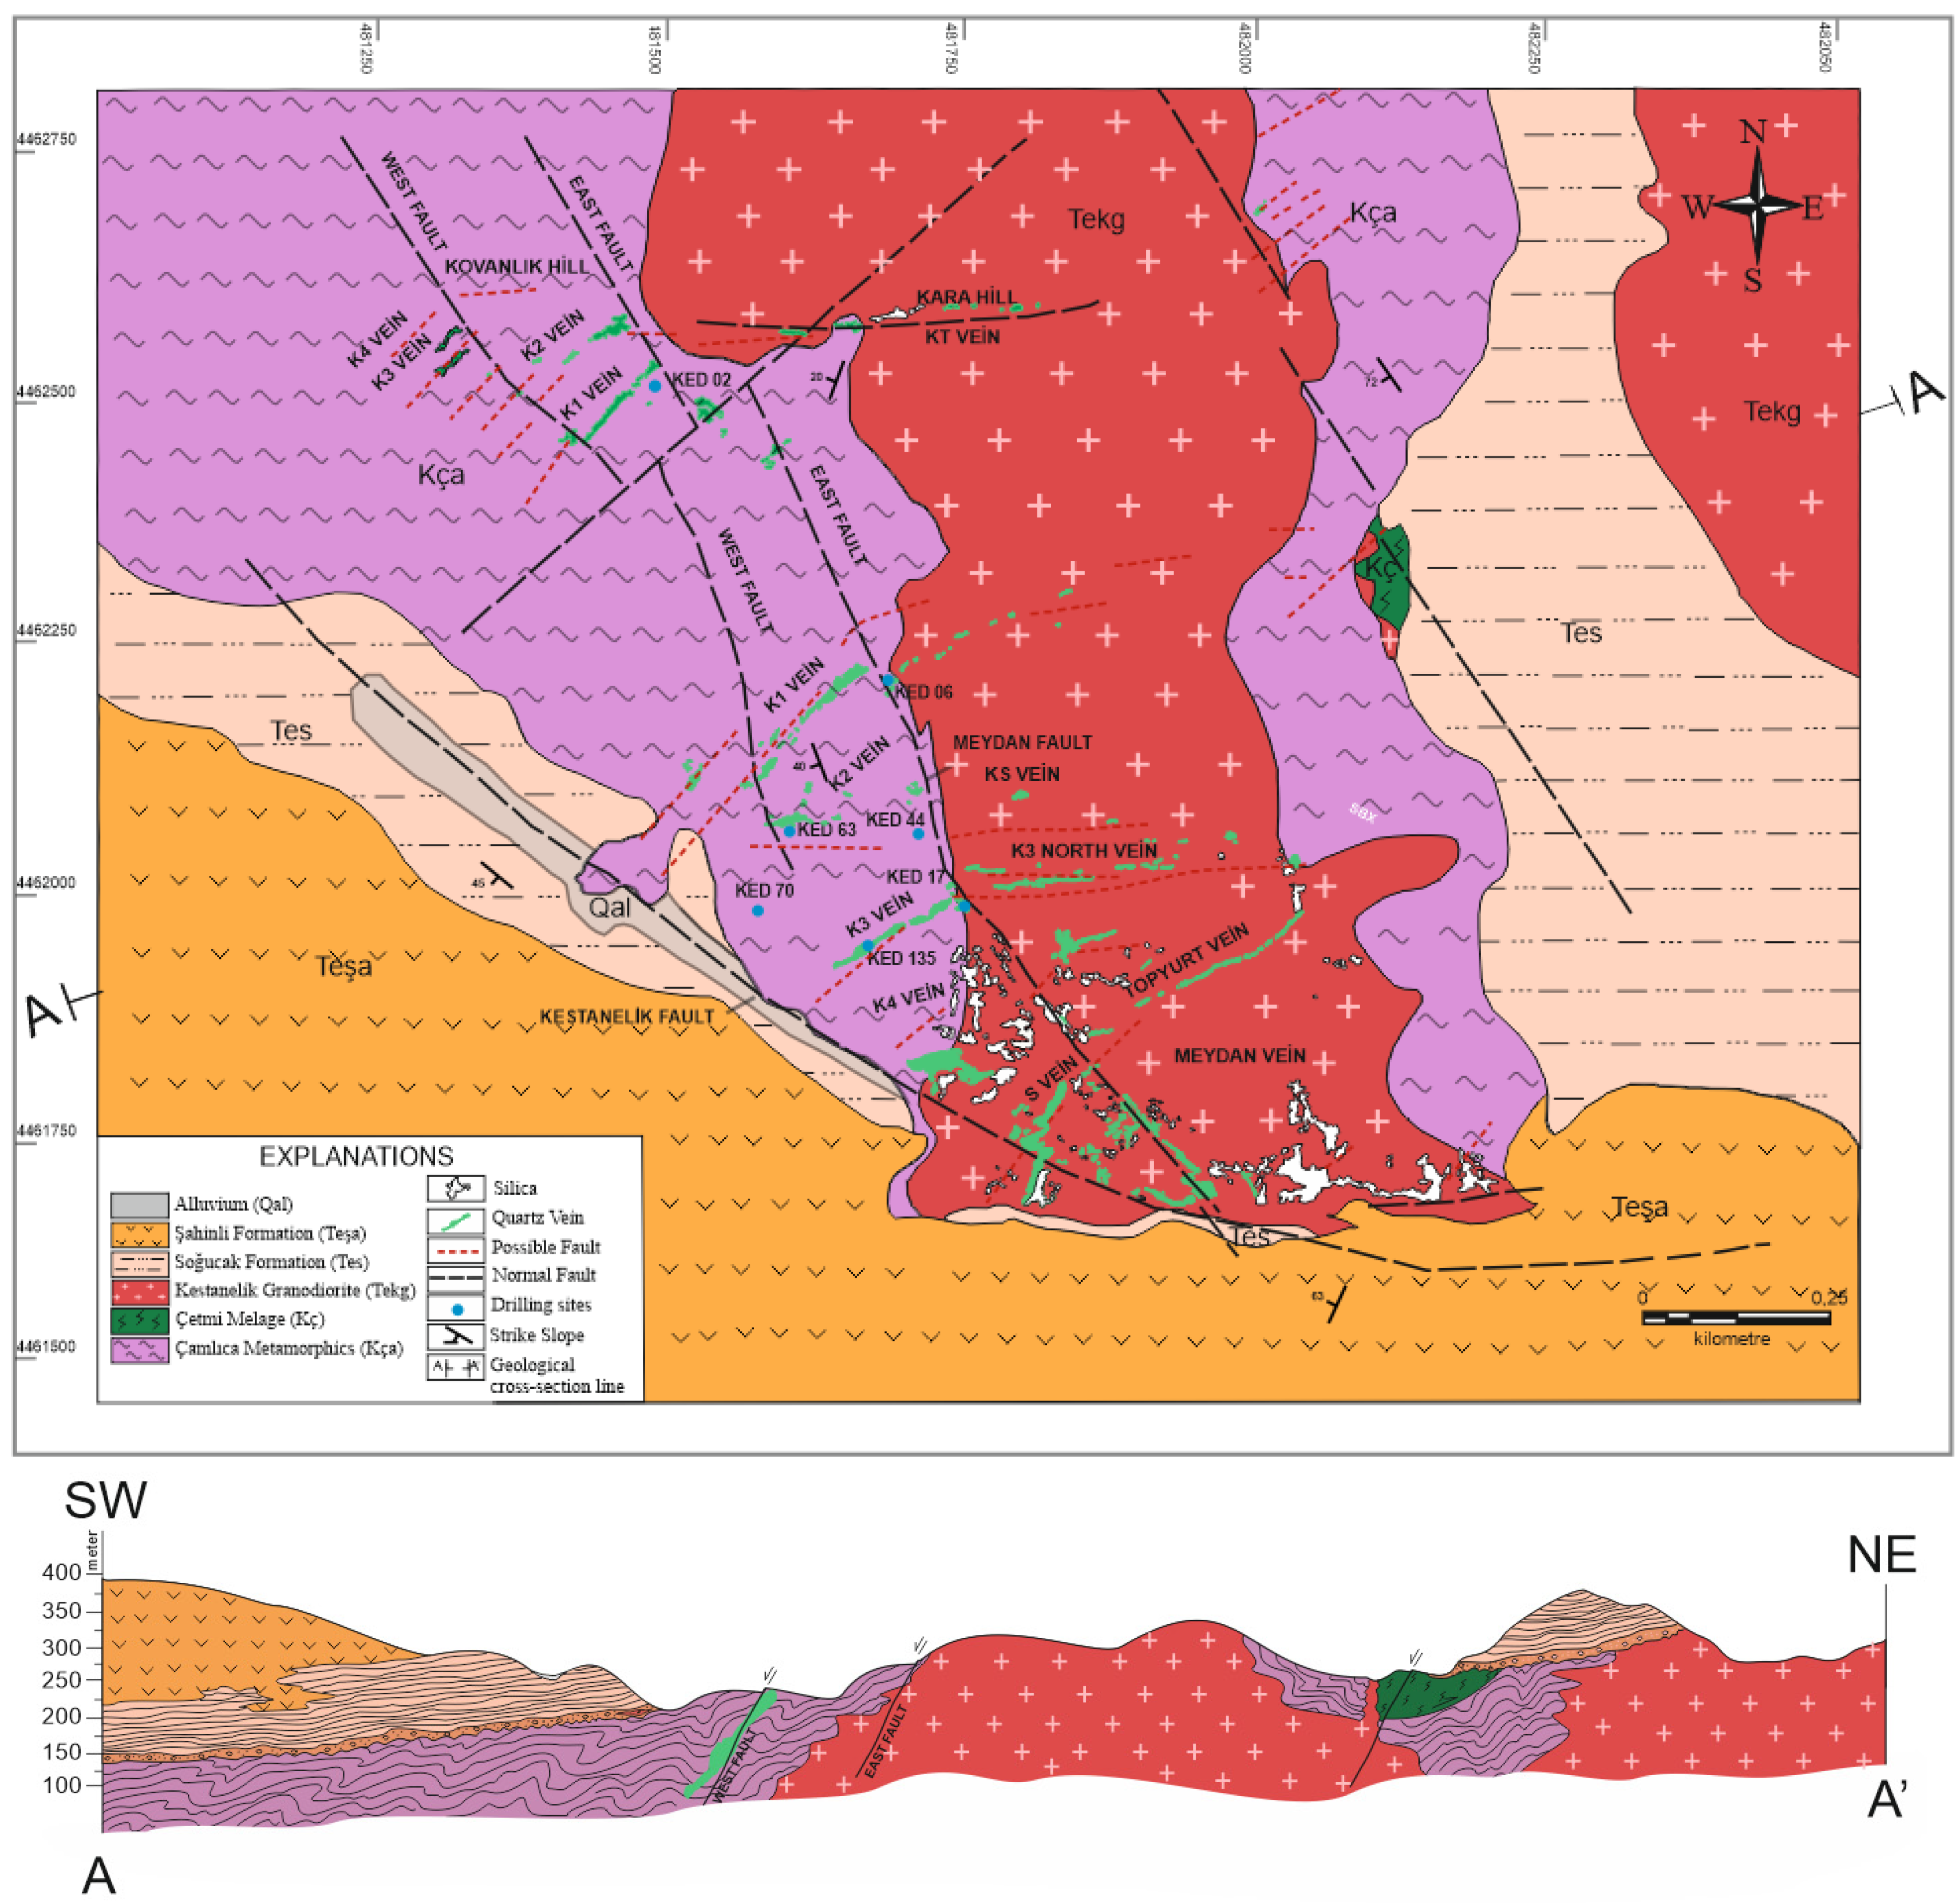
Figure 3.
(a) fault breccia taken from the quartz vein (KED 02-06; 26,30meter depth), (b) quartz feldspar porphyry (KED 06-04; 115,30meter depth), c) oxidized mica schist (KED 44- 02; 3.80meter depth) [28].
Figure 3.
(a) fault breccia taken from the quartz vein (KED 02-06; 26,30meter depth), (b) quartz feldspar porphyry (KED 06-04; 115,30meter depth), c) oxidized mica schist (KED 44- 02; 3.80meter depth) [28].
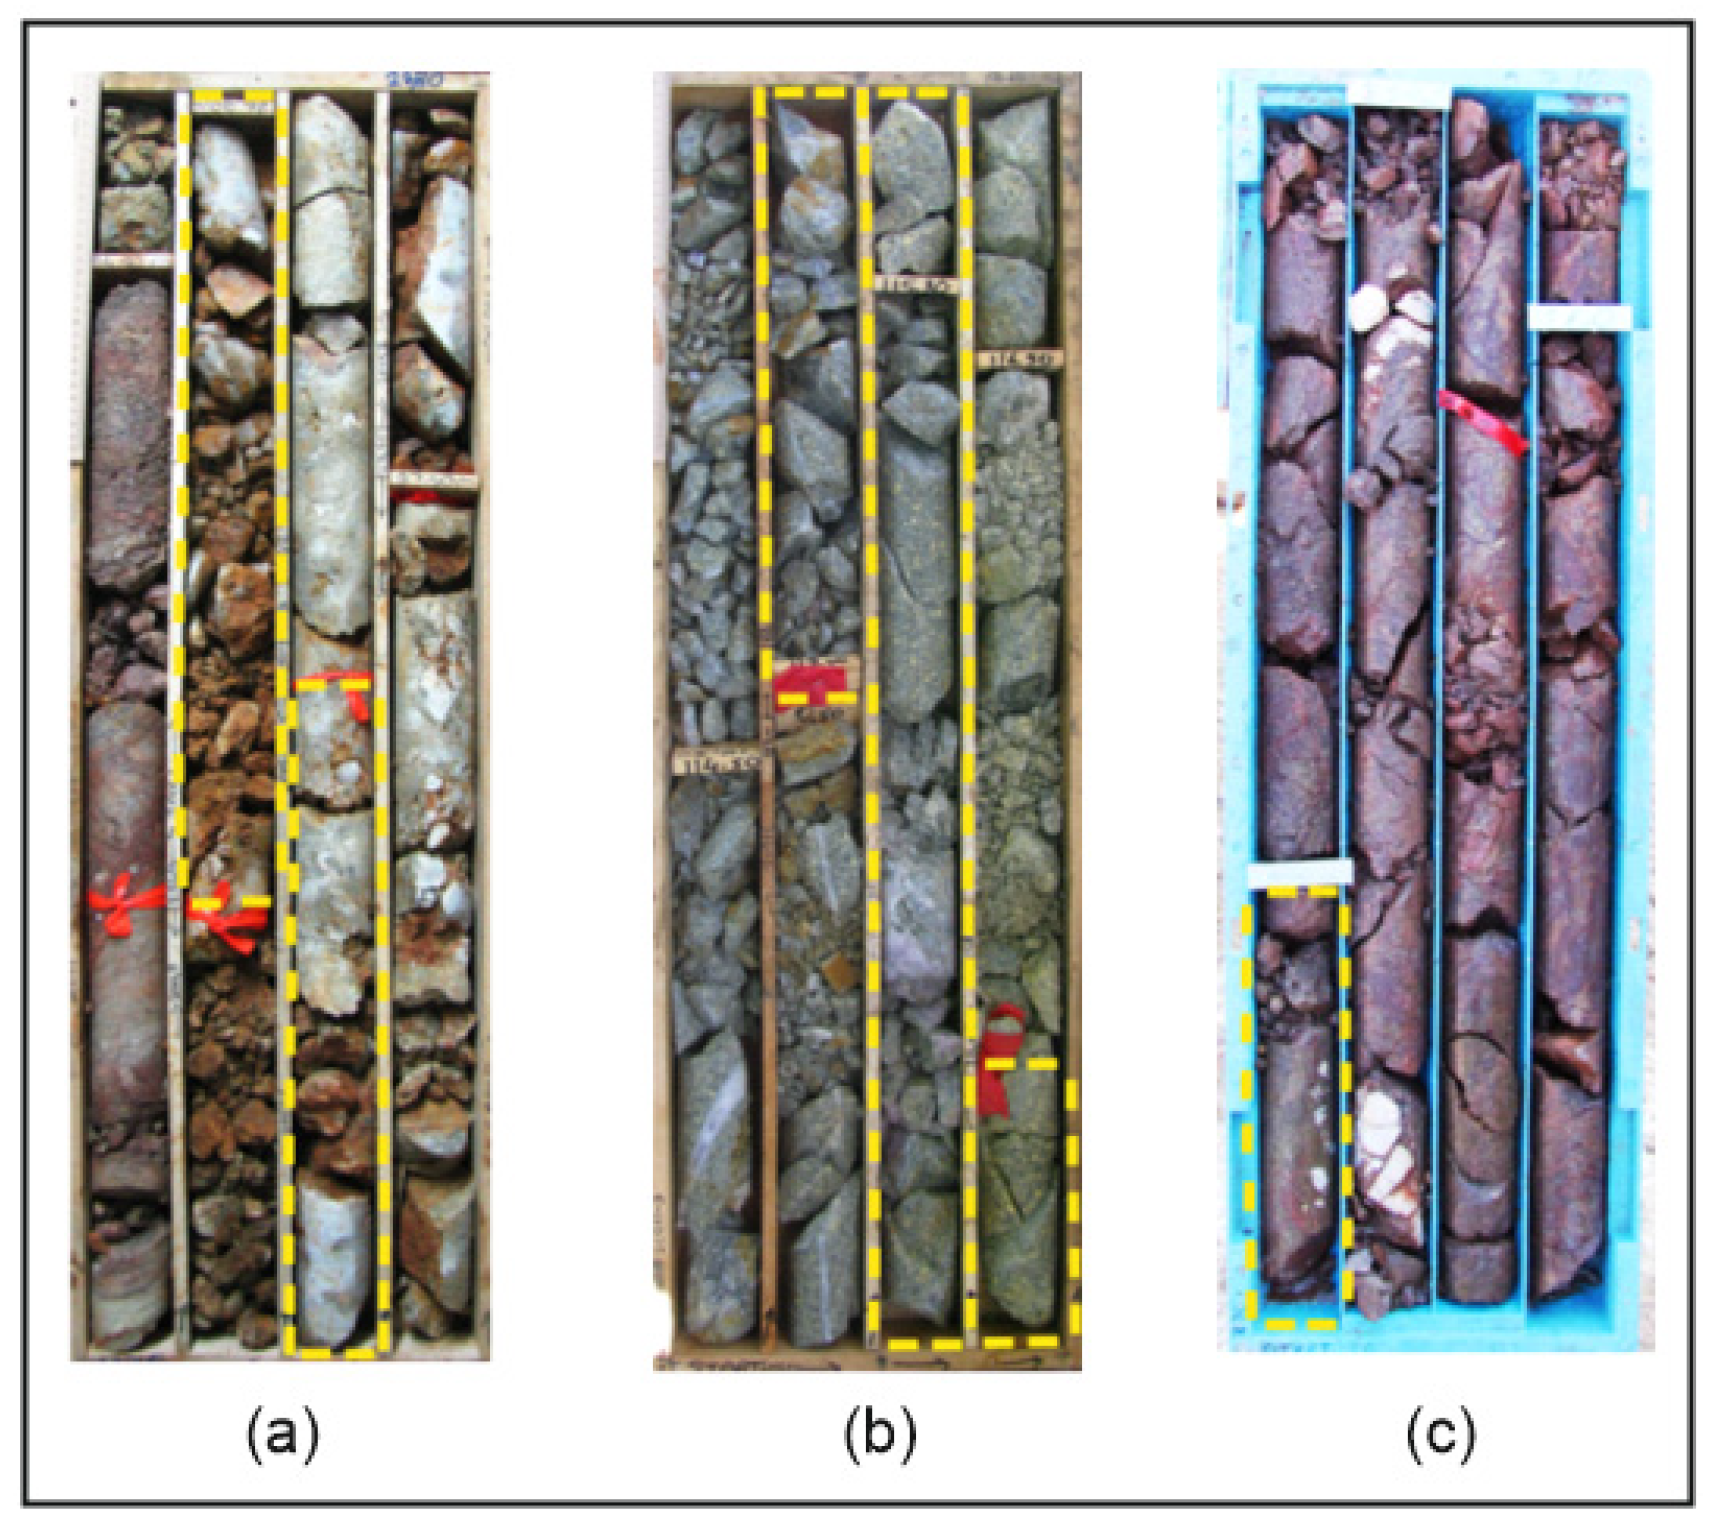
Figure 4.
General view of hydrothermal alterations in the study area (arg: argillization, fe: iron alteration, si: silicification, lim: limonitization, hm: hematitization) [28].
Figure 4.
General view of hydrothermal alterations in the study area (arg: argillization, fe: iron alteration, si: silicification, lim: limonitization, hm: hematitization) [28].

Figure 5.
Ore structures indicating low-sulphidation epithermal systems in the study area.
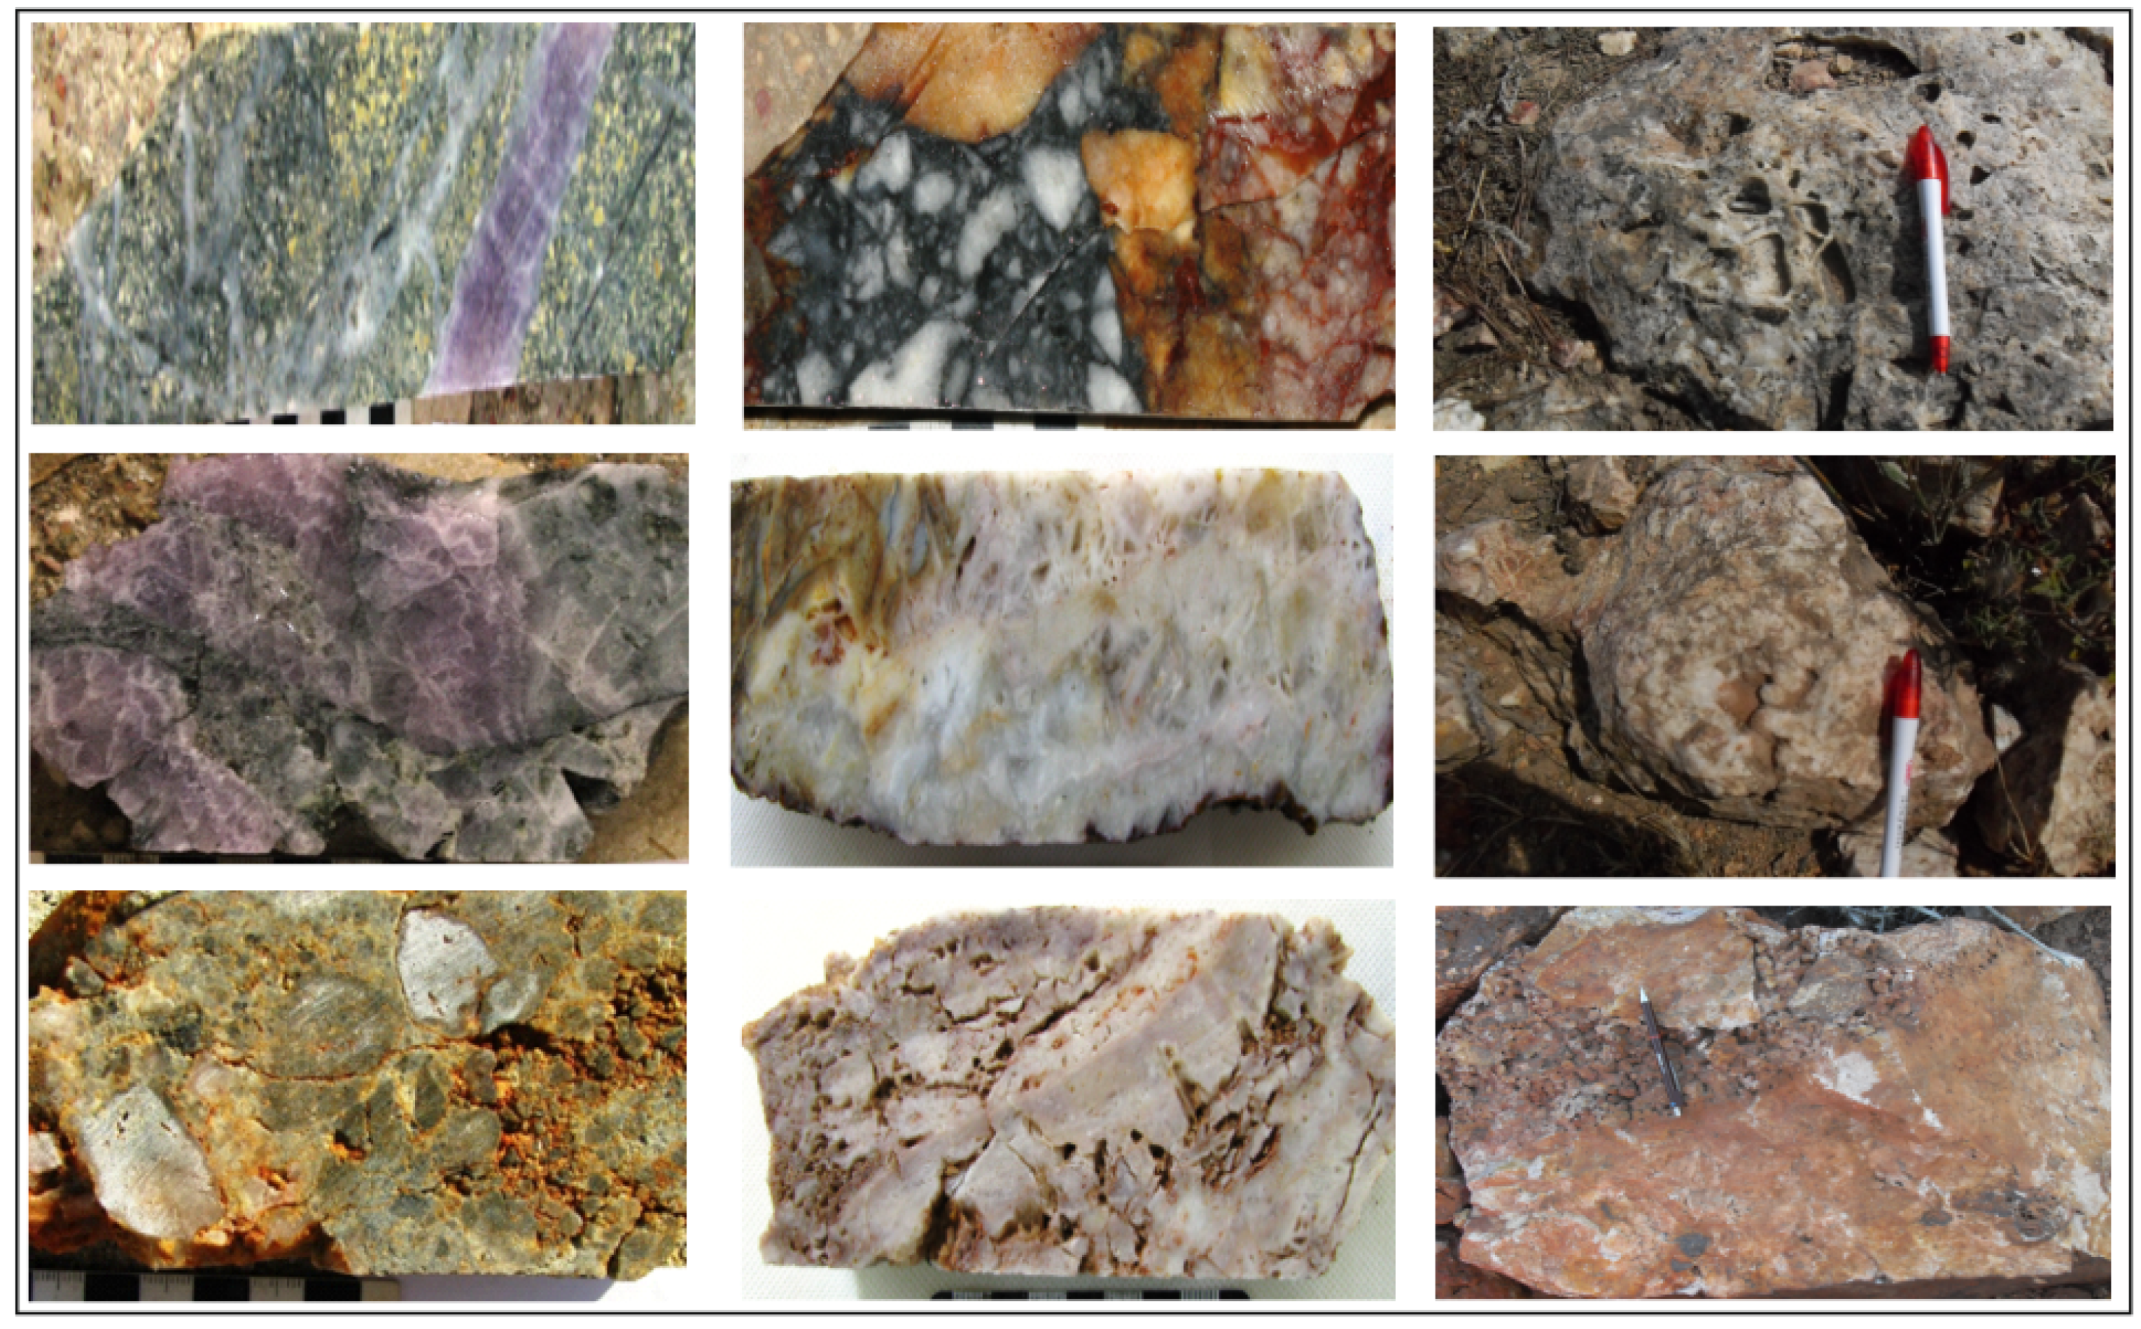
Figure 6.
Microscopy images of various rock samples. a) Quartz (qz1, qz2) with two stage and comb structure, b) Feldspar (fsp) and vein quartz (qz1), c) The relationship between quartz (qz1, qz2) and muscovite (mu)-biotite (bi), d) Coarse crystalline quartz (qz1) and muscovite (mus), e) Chloritization (chl) and sericitization (ser), f) Coarse-grained quartz (qz1), feldspar (fsp) and euhedral opaque mineral (op), g-h) Feldspar (fsp), amphibole (amp), sericitization (ser) and chloritization (chl) [modified from 28].
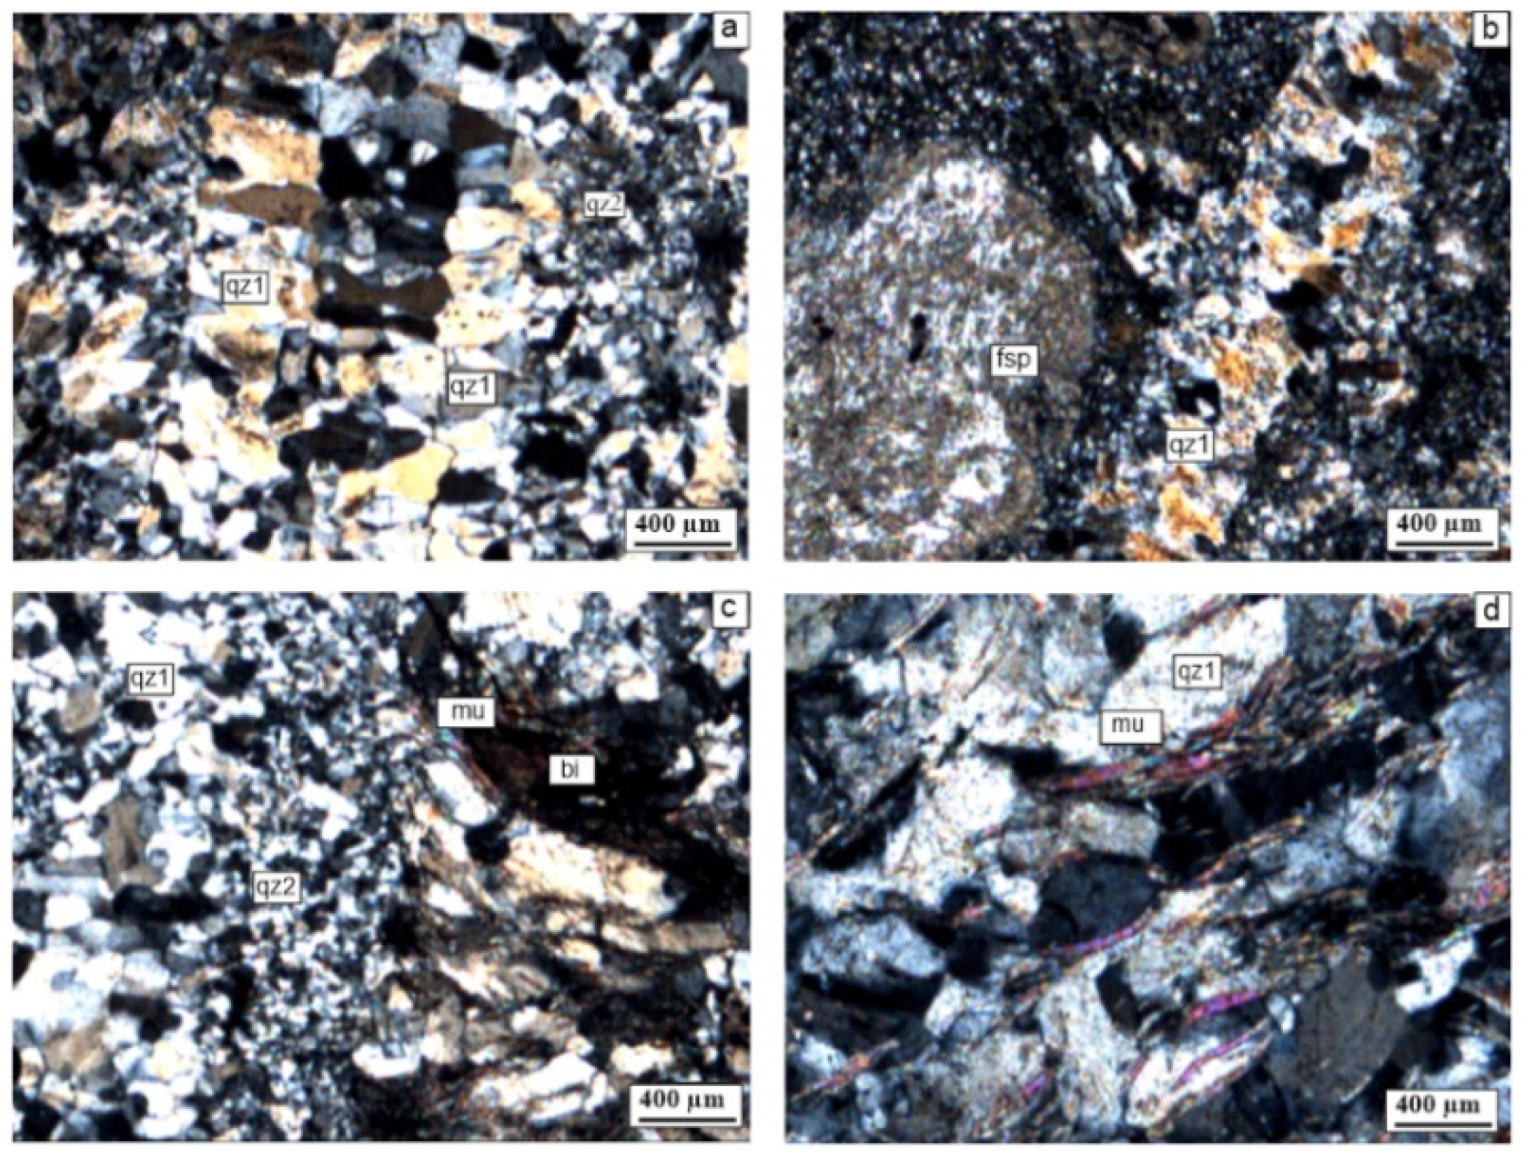
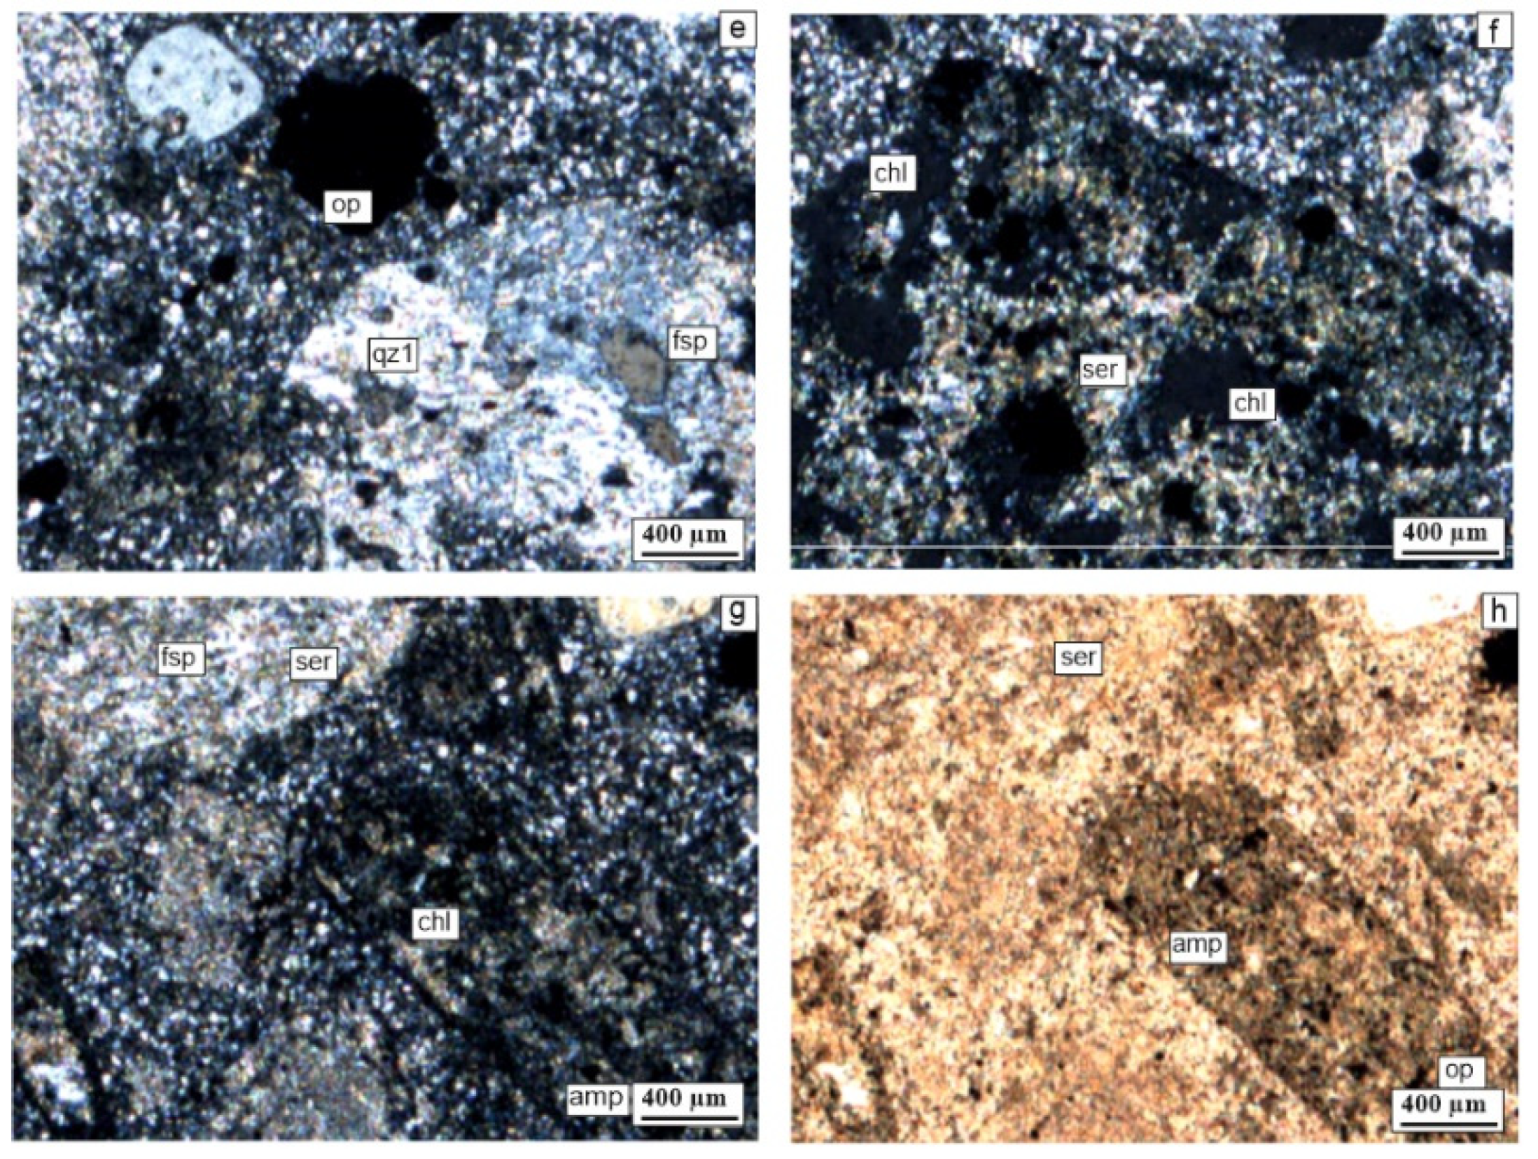
Figure 7.
Representative XRD patterns of bulk samples of quartz veins (KED 02-06), quartz feldspar porphyry (KED 06-04), and quartz micashist (KED 44-02) [28].
Figure 7.
Representative XRD patterns of bulk samples of quartz veins (KED 02-06), quartz feldspar porphyry (KED 06-04), and quartz micashist (KED 44-02) [28].
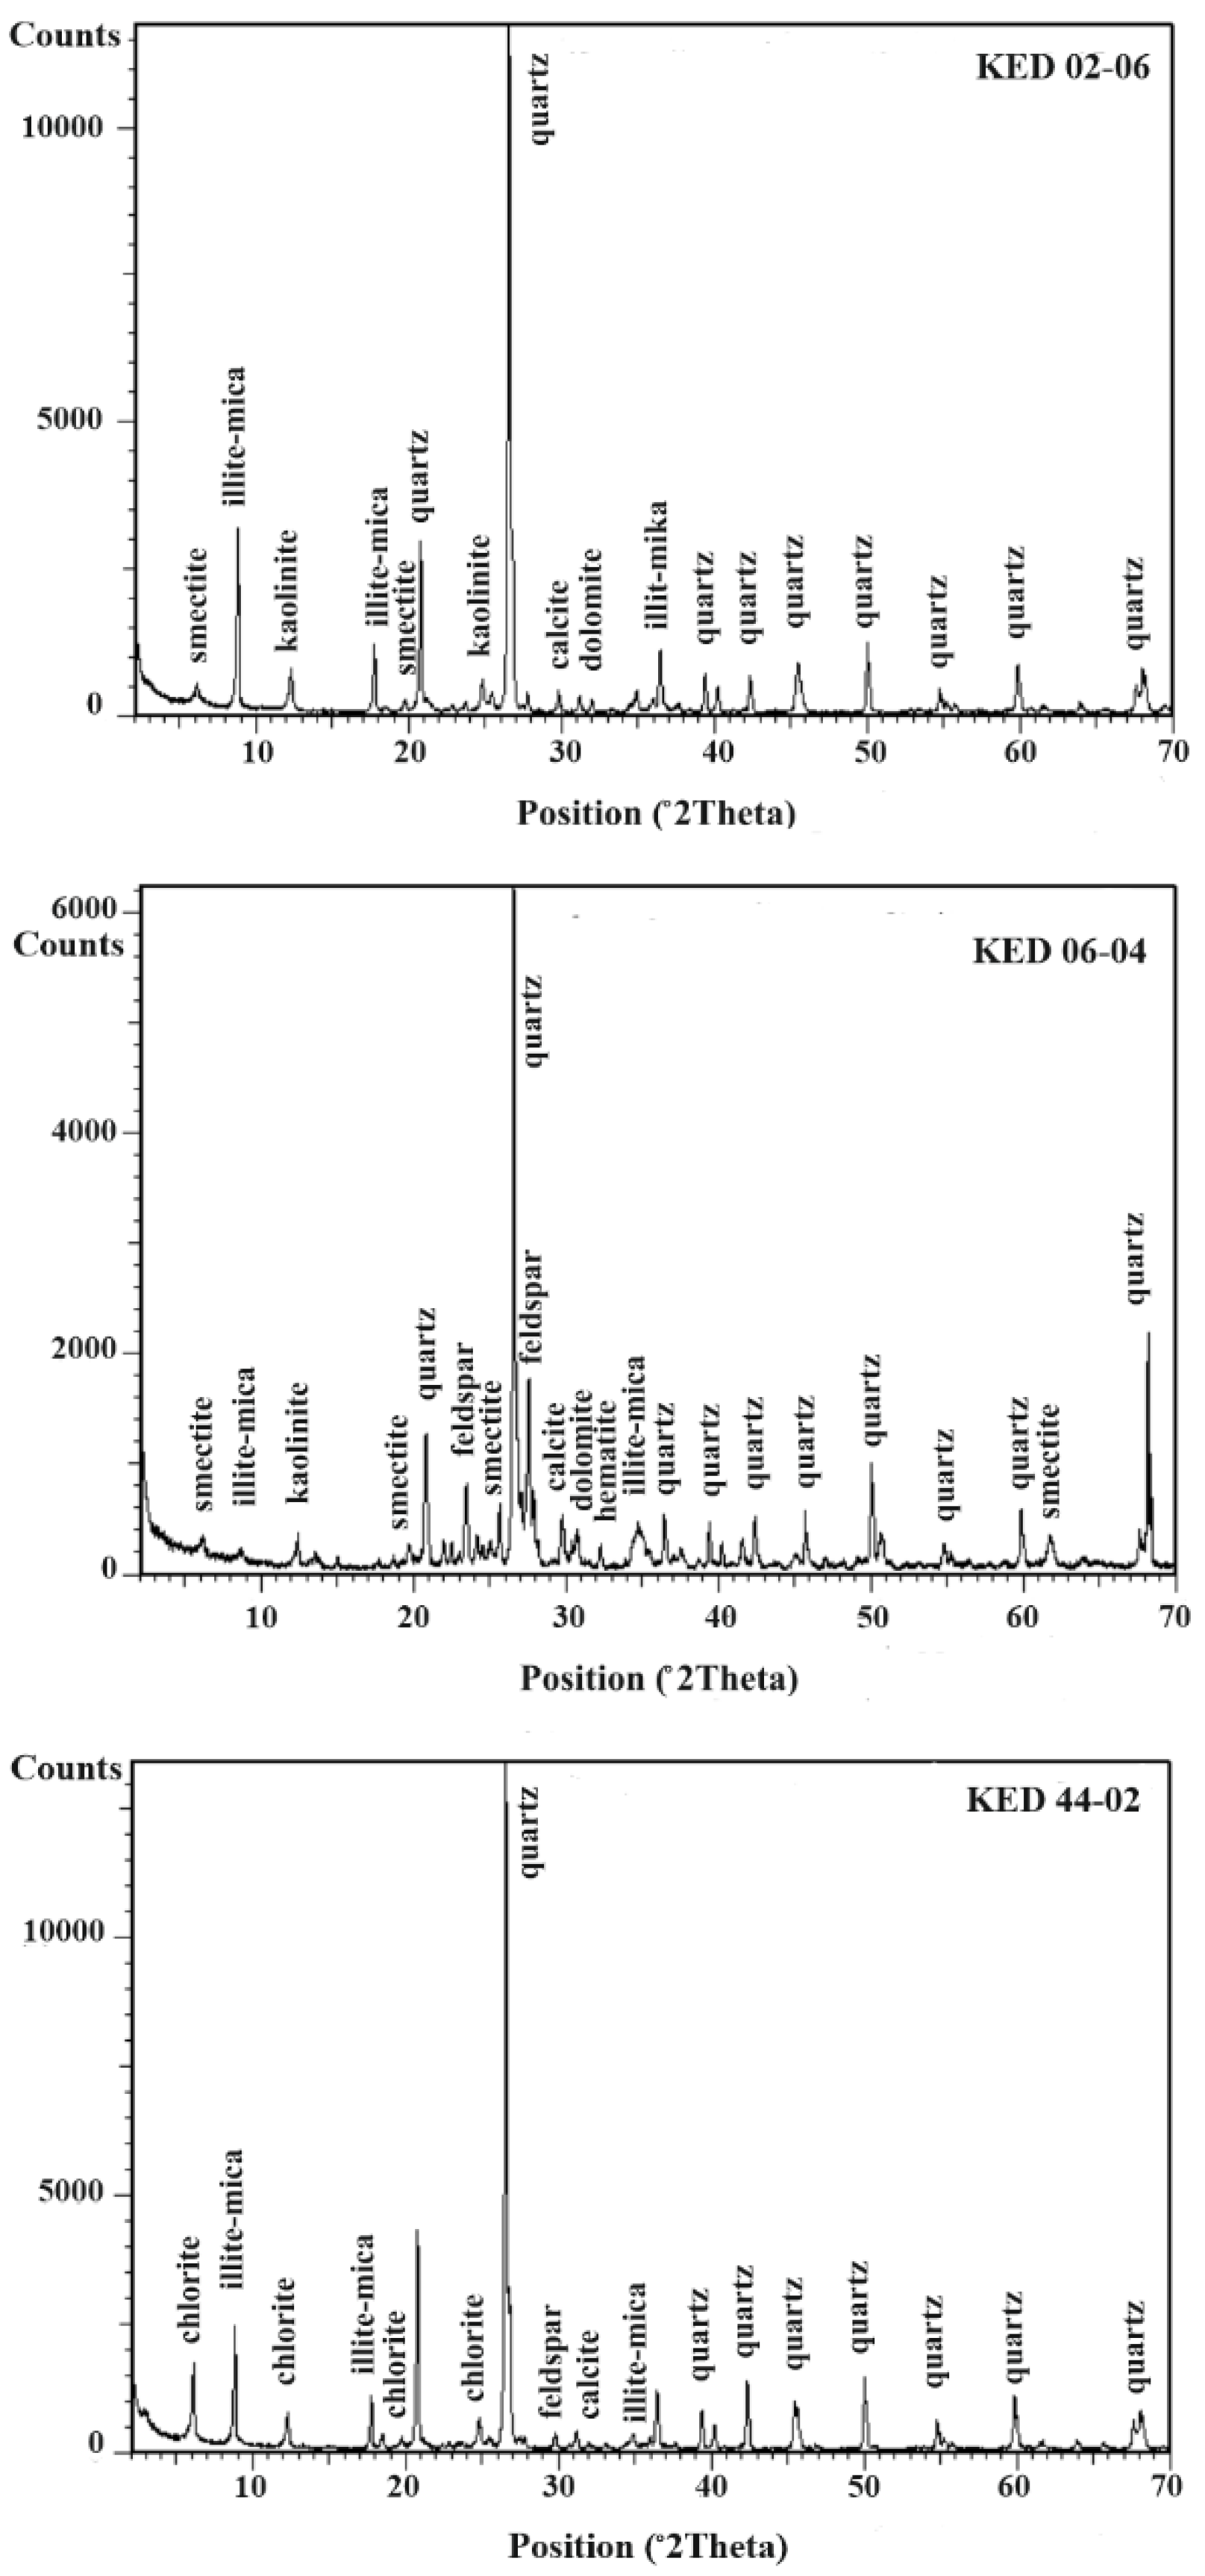
Figure 8.
Comparison of chondrite-normalized REE patterns of quartz vein (a), quartz-feldspar porphyry (b) and quartz-mica schist (c) samples in the study area and average REE patterns of all samples (d) [Chondrite normalized values from 102].
Figure 8.
Comparison of chondrite-normalized REE patterns of quartz vein (a), quartz-feldspar porphyry (b) and quartz-mica schist (c) samples in the study area and average REE patterns of all samples (d) [Chondrite normalized values from 102].
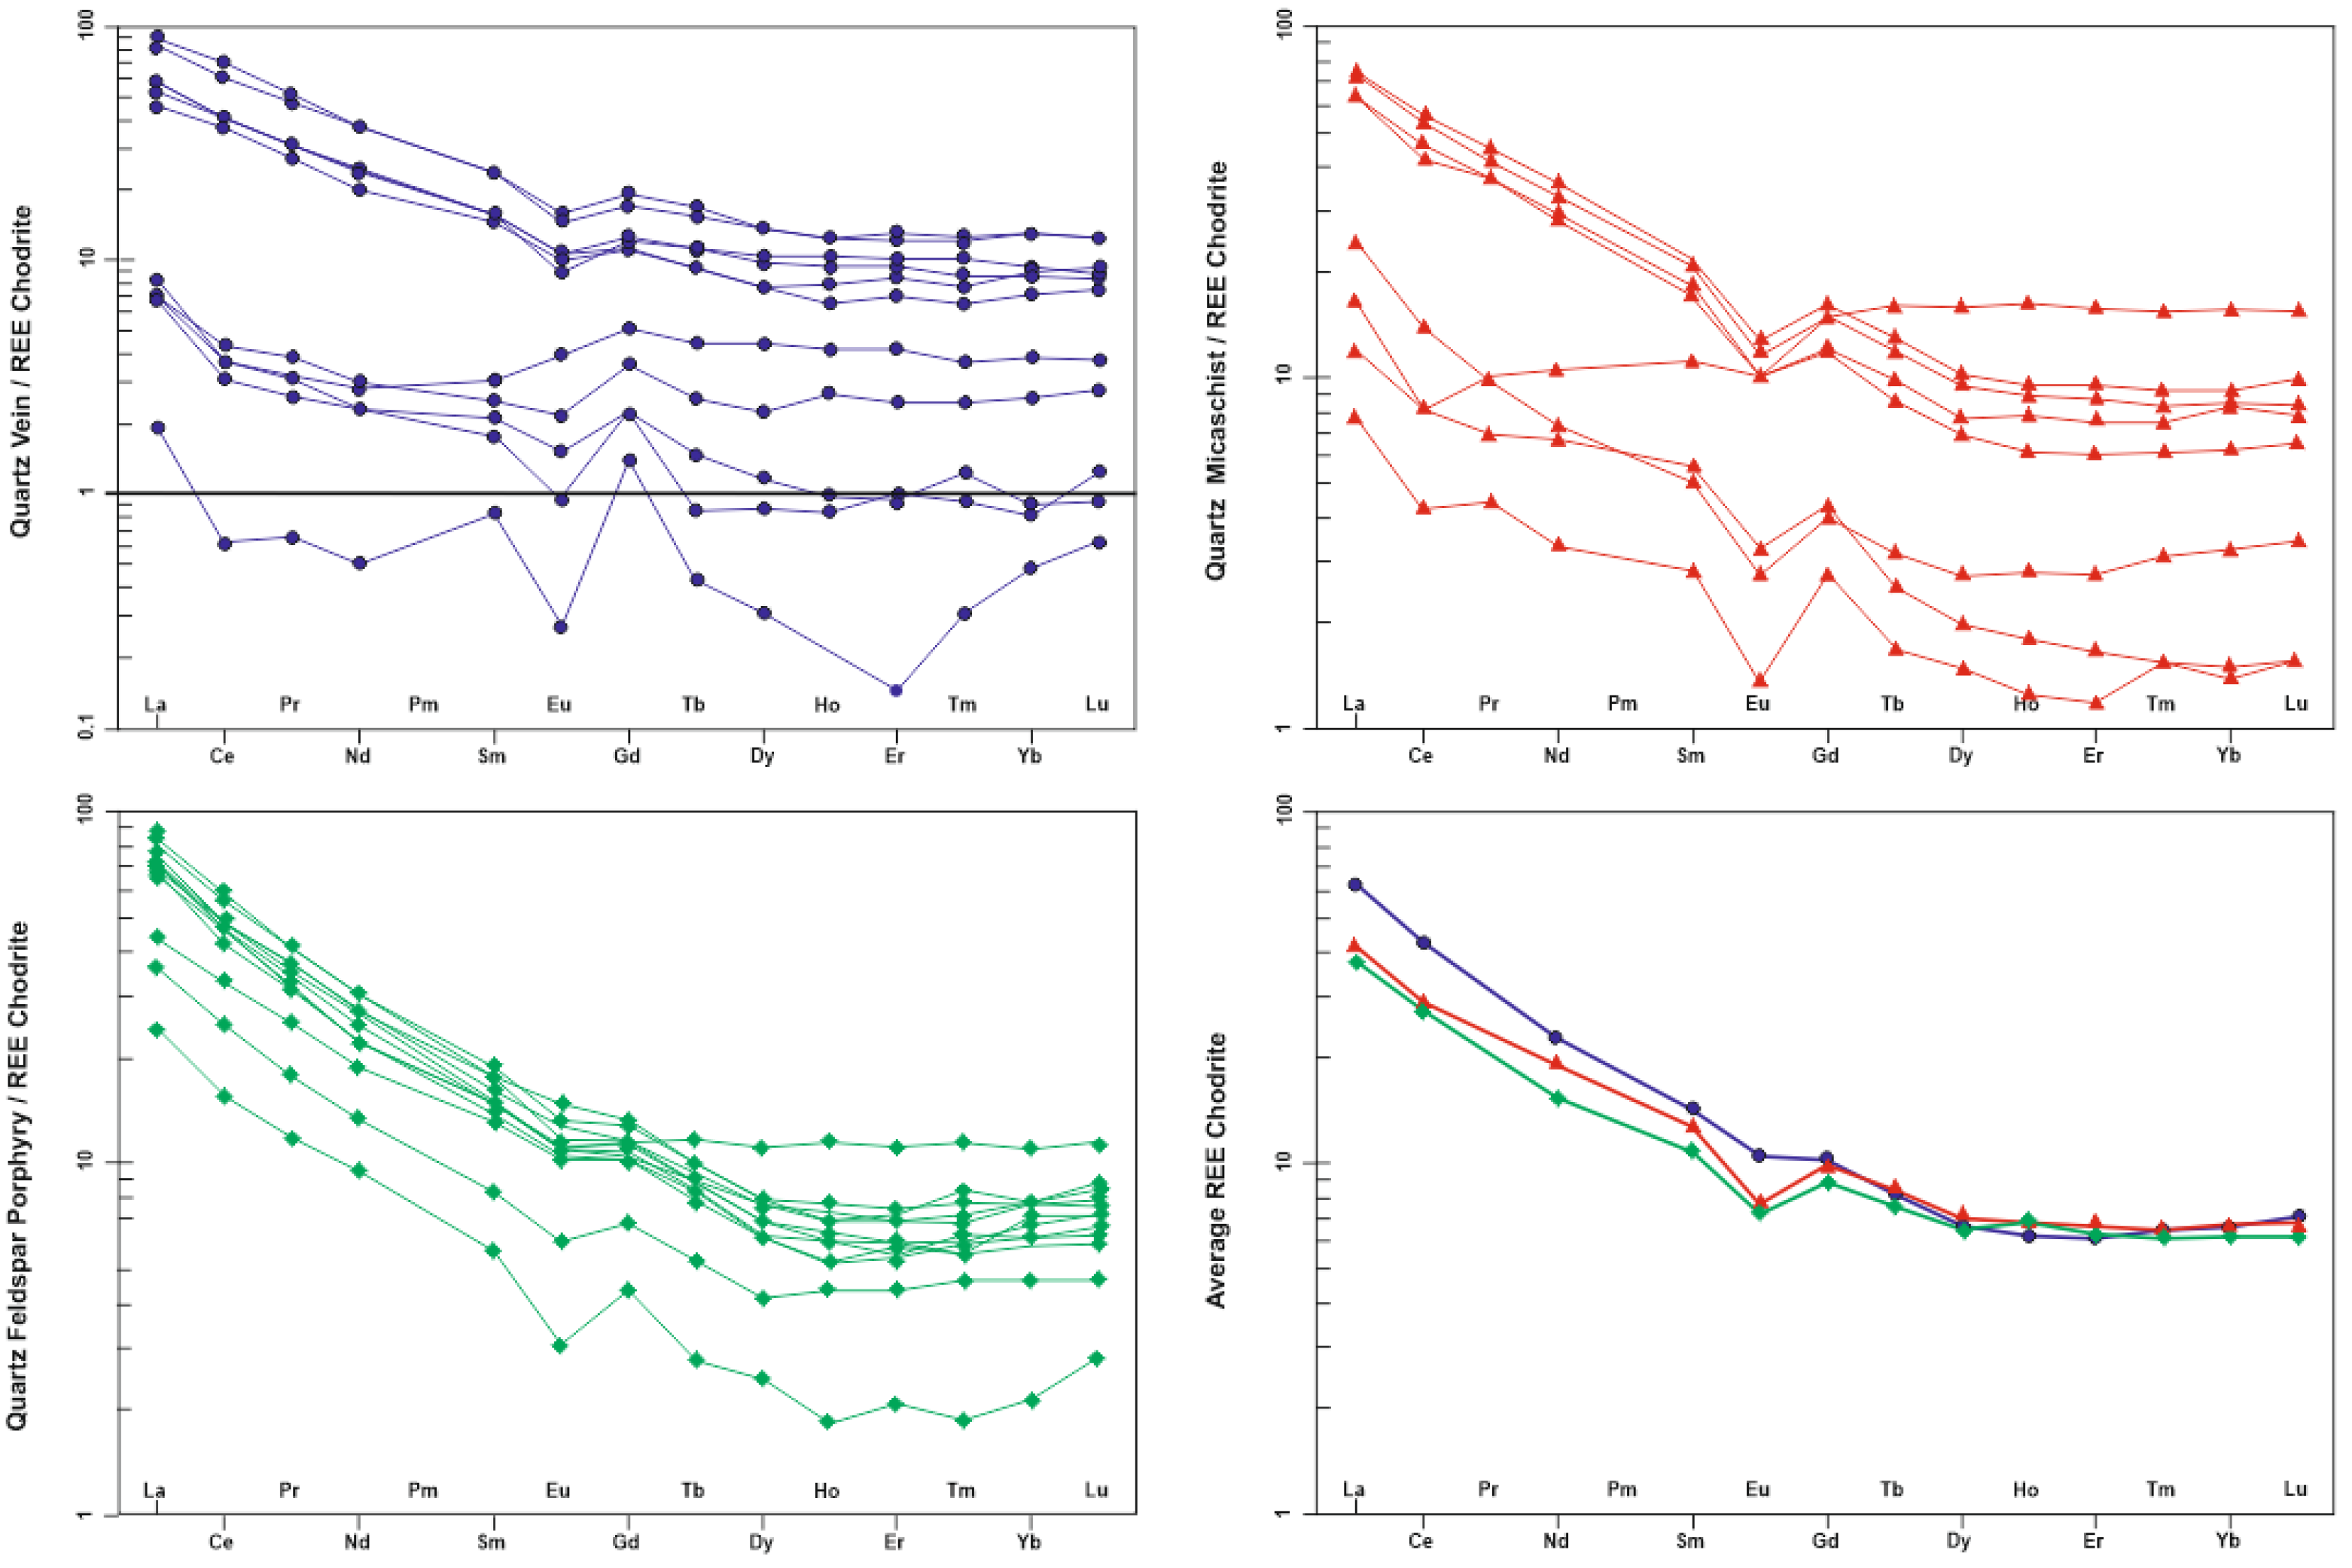
Figure 9.
Distribution graphs showing relation between ΣREE and P2O5 (a), Al2O3 (b), TiO2 (c) and K2O (d) for quartz vein, quartz feldspar porphyry and quartz micaschist samples in the study area.
Figure 9.
Distribution graphs showing relation between ΣREE and P2O5 (a), Al2O3 (b), TiO2 (c) and K2O (d) for quartz vein, quartz feldspar porphyry and quartz micaschist samples in the study area.
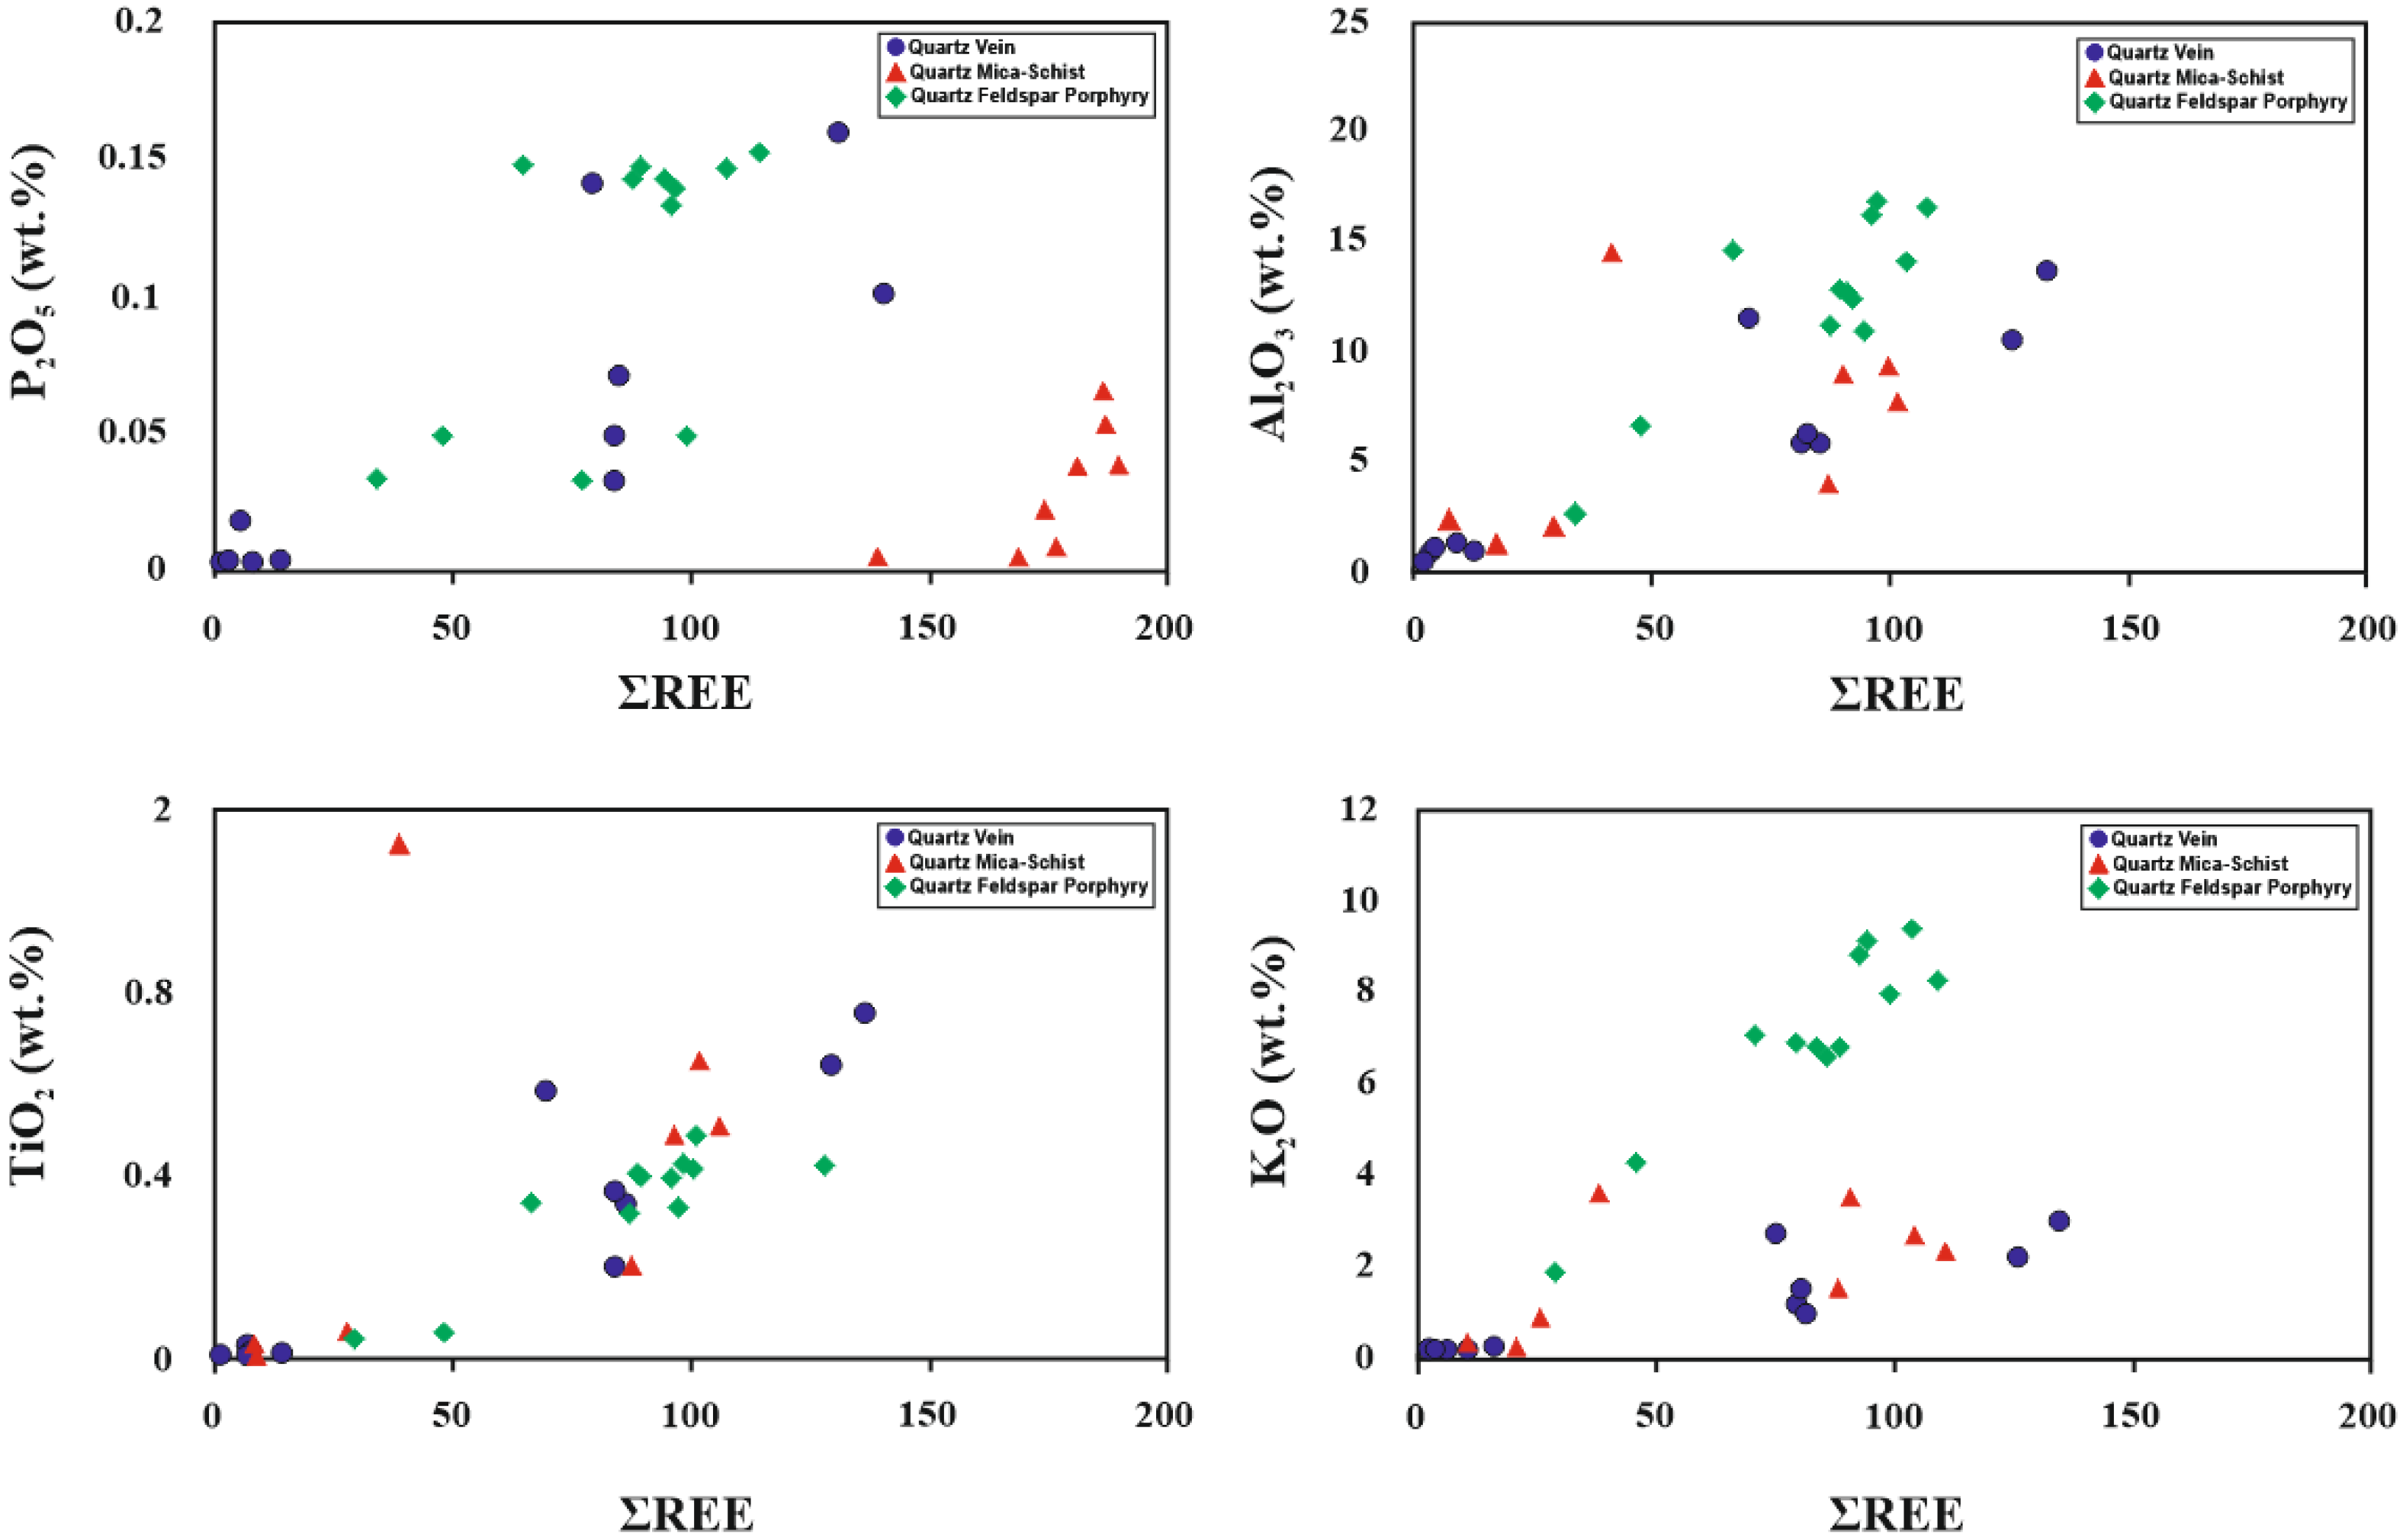
Figure 10.
(a) Ishikawa alteration index (AI) and (b) chlorite-carbonate-pyrite index (CCPI) trend diagrams [modified from 60].
Figure 10.
(a) Ishikawa alteration index (AI) and (b) chlorite-carbonate-pyrite index (CCPI) trend diagrams [modified from 60].
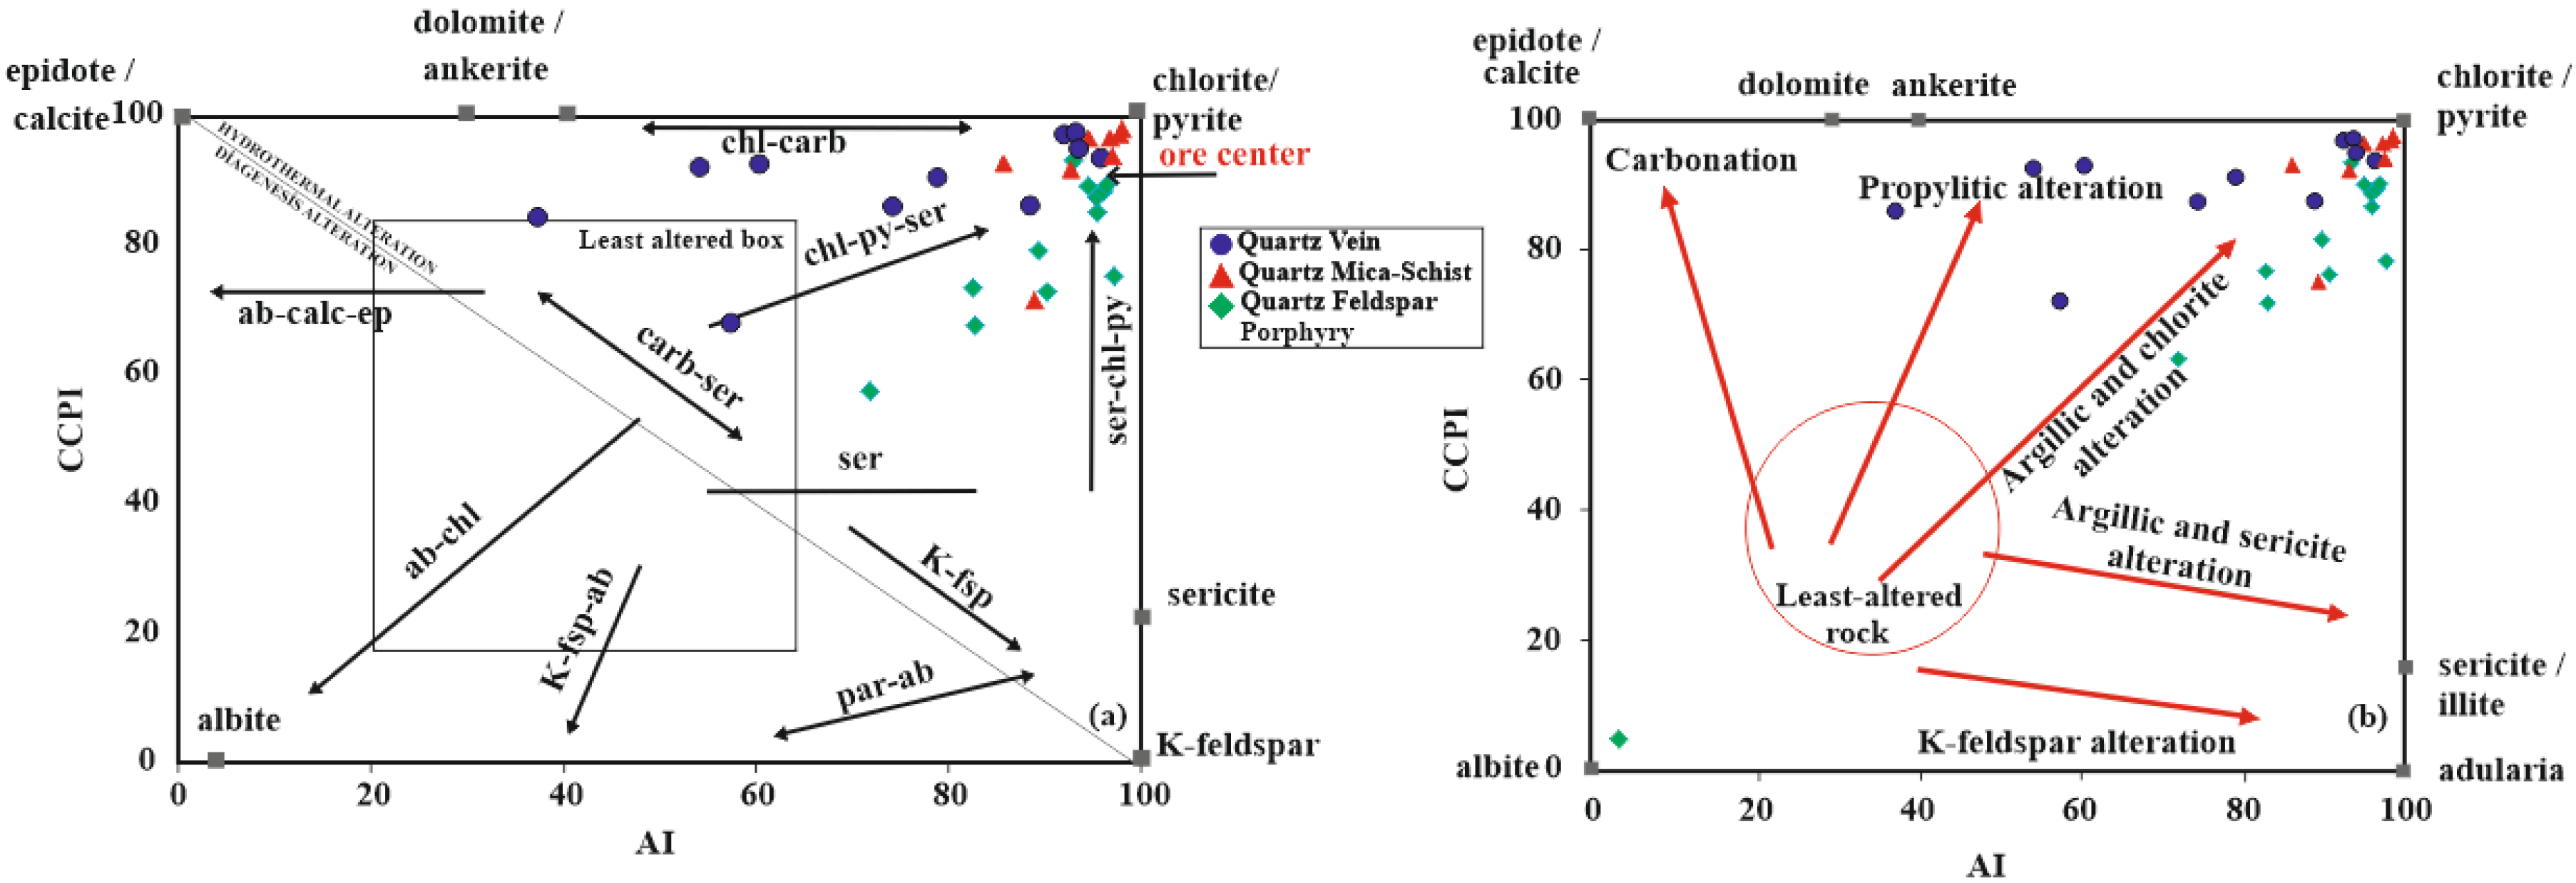
Figure 11.
The relationship diagram between the alteration index (AI) and mainly major oxide contents [modified from 60].
Figure 11.
The relationship diagram between the alteration index (AI) and mainly major oxide contents [modified from 60].
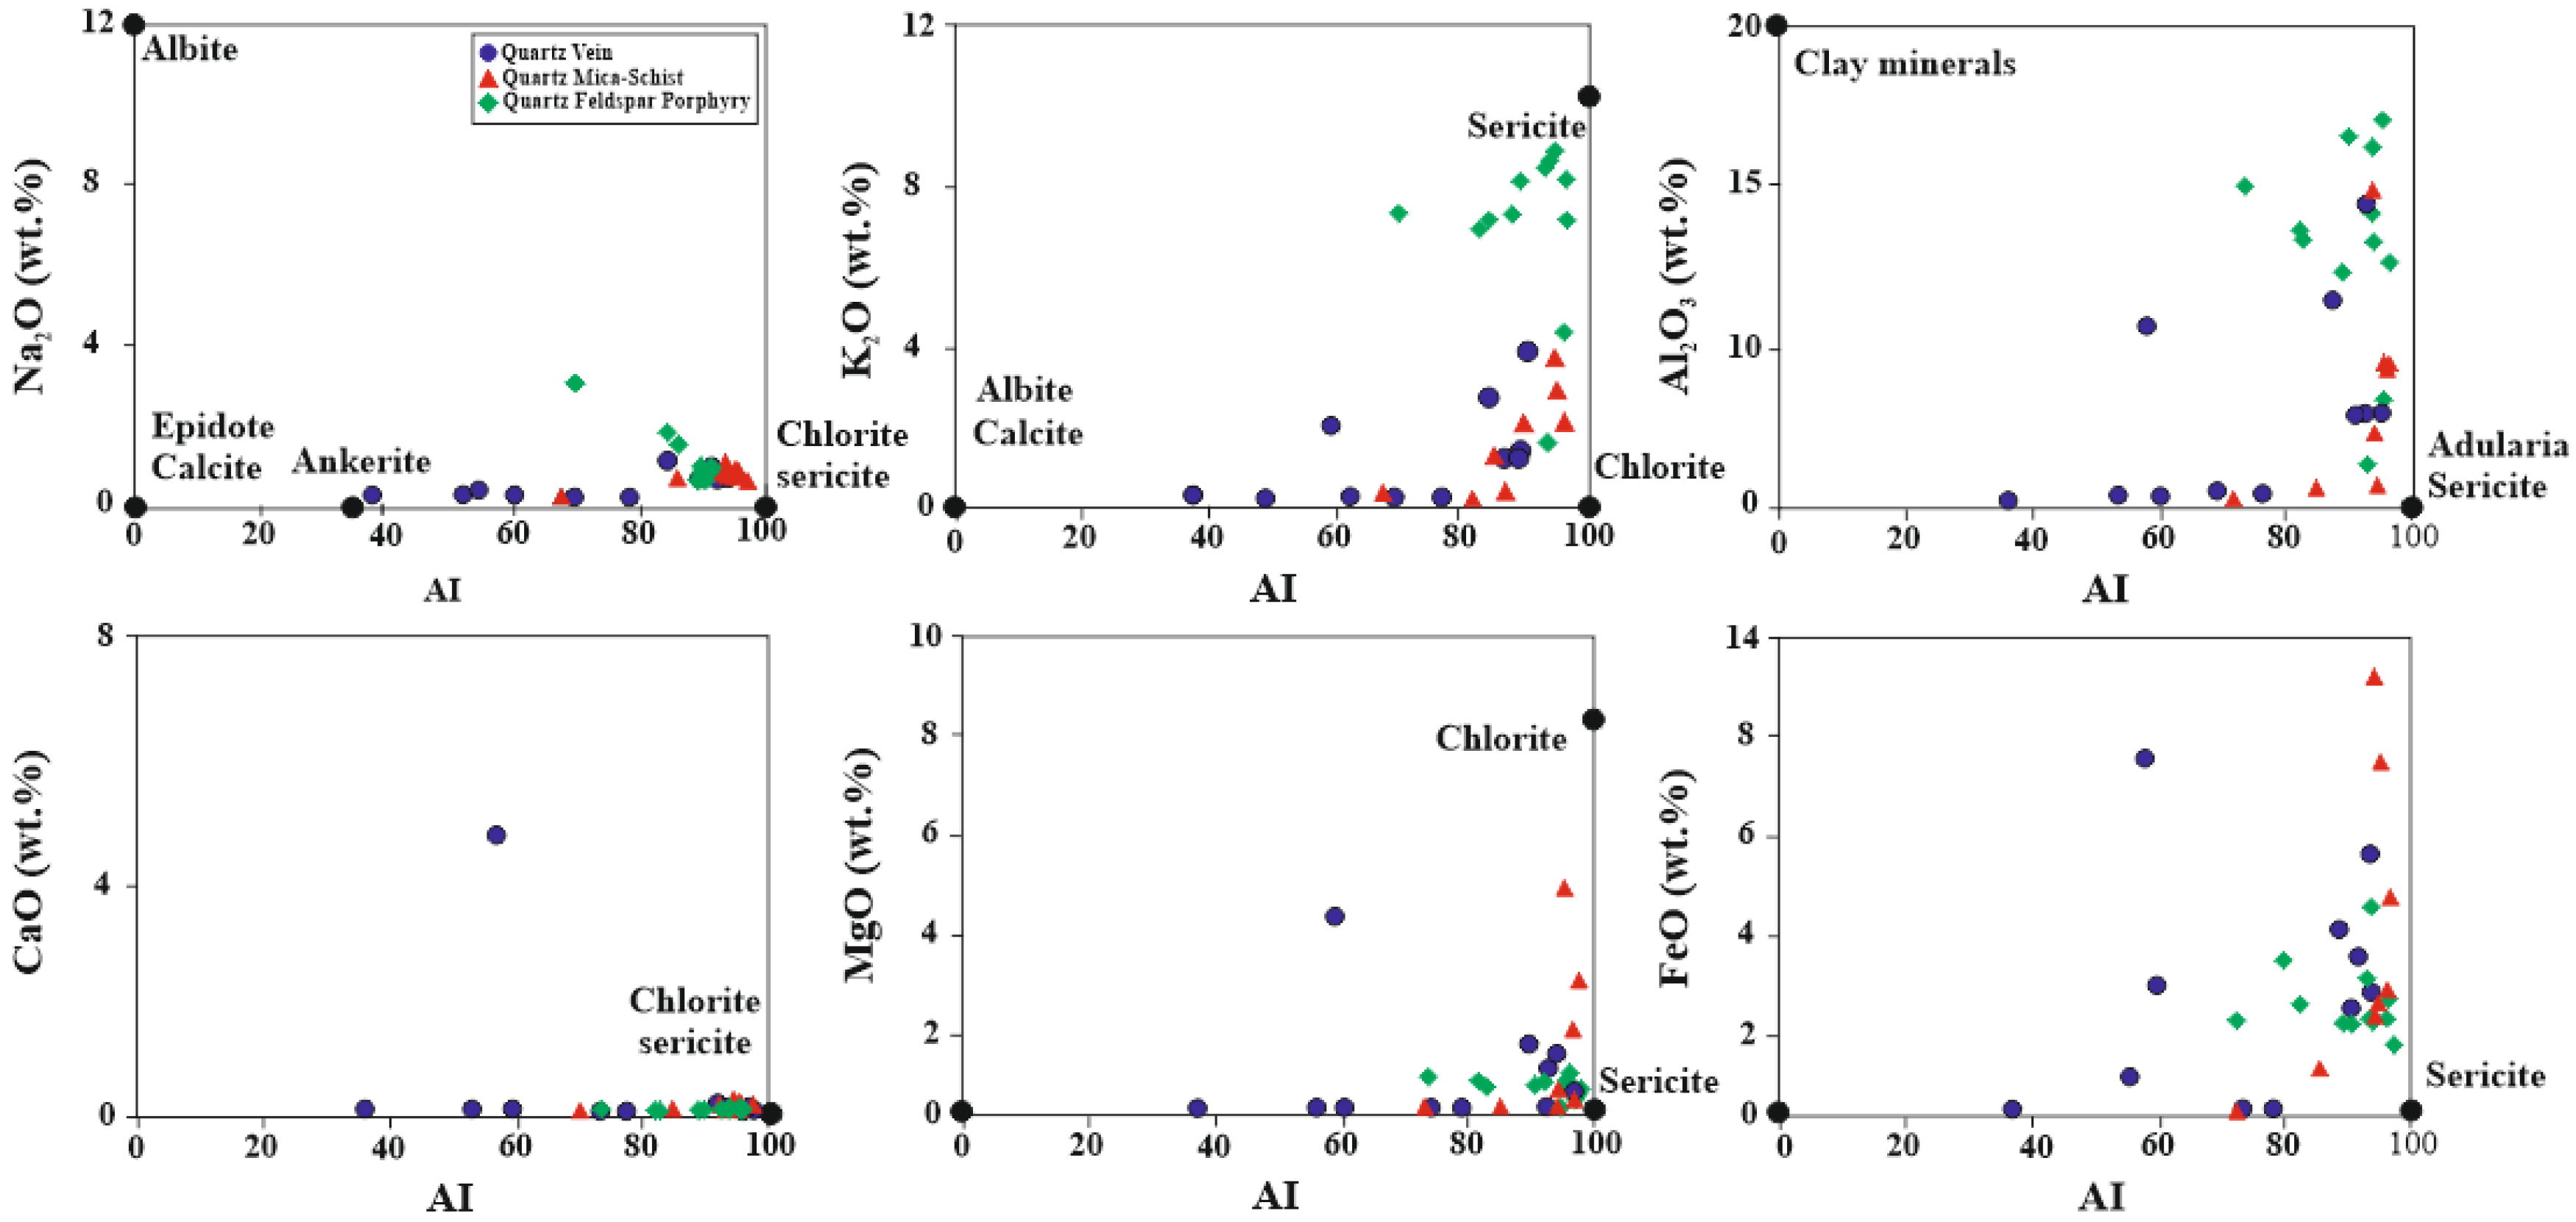
Figure 12.
Sericitization index (SI) versus (K2O+Na2O) and CaO distribution diagrams of altered samples in the study area [modified from 50].
Figure 12.
Sericitization index (SI) versus (K2O+Na2O) and CaO distribution diagrams of altered samples in the study area [modified from 50].
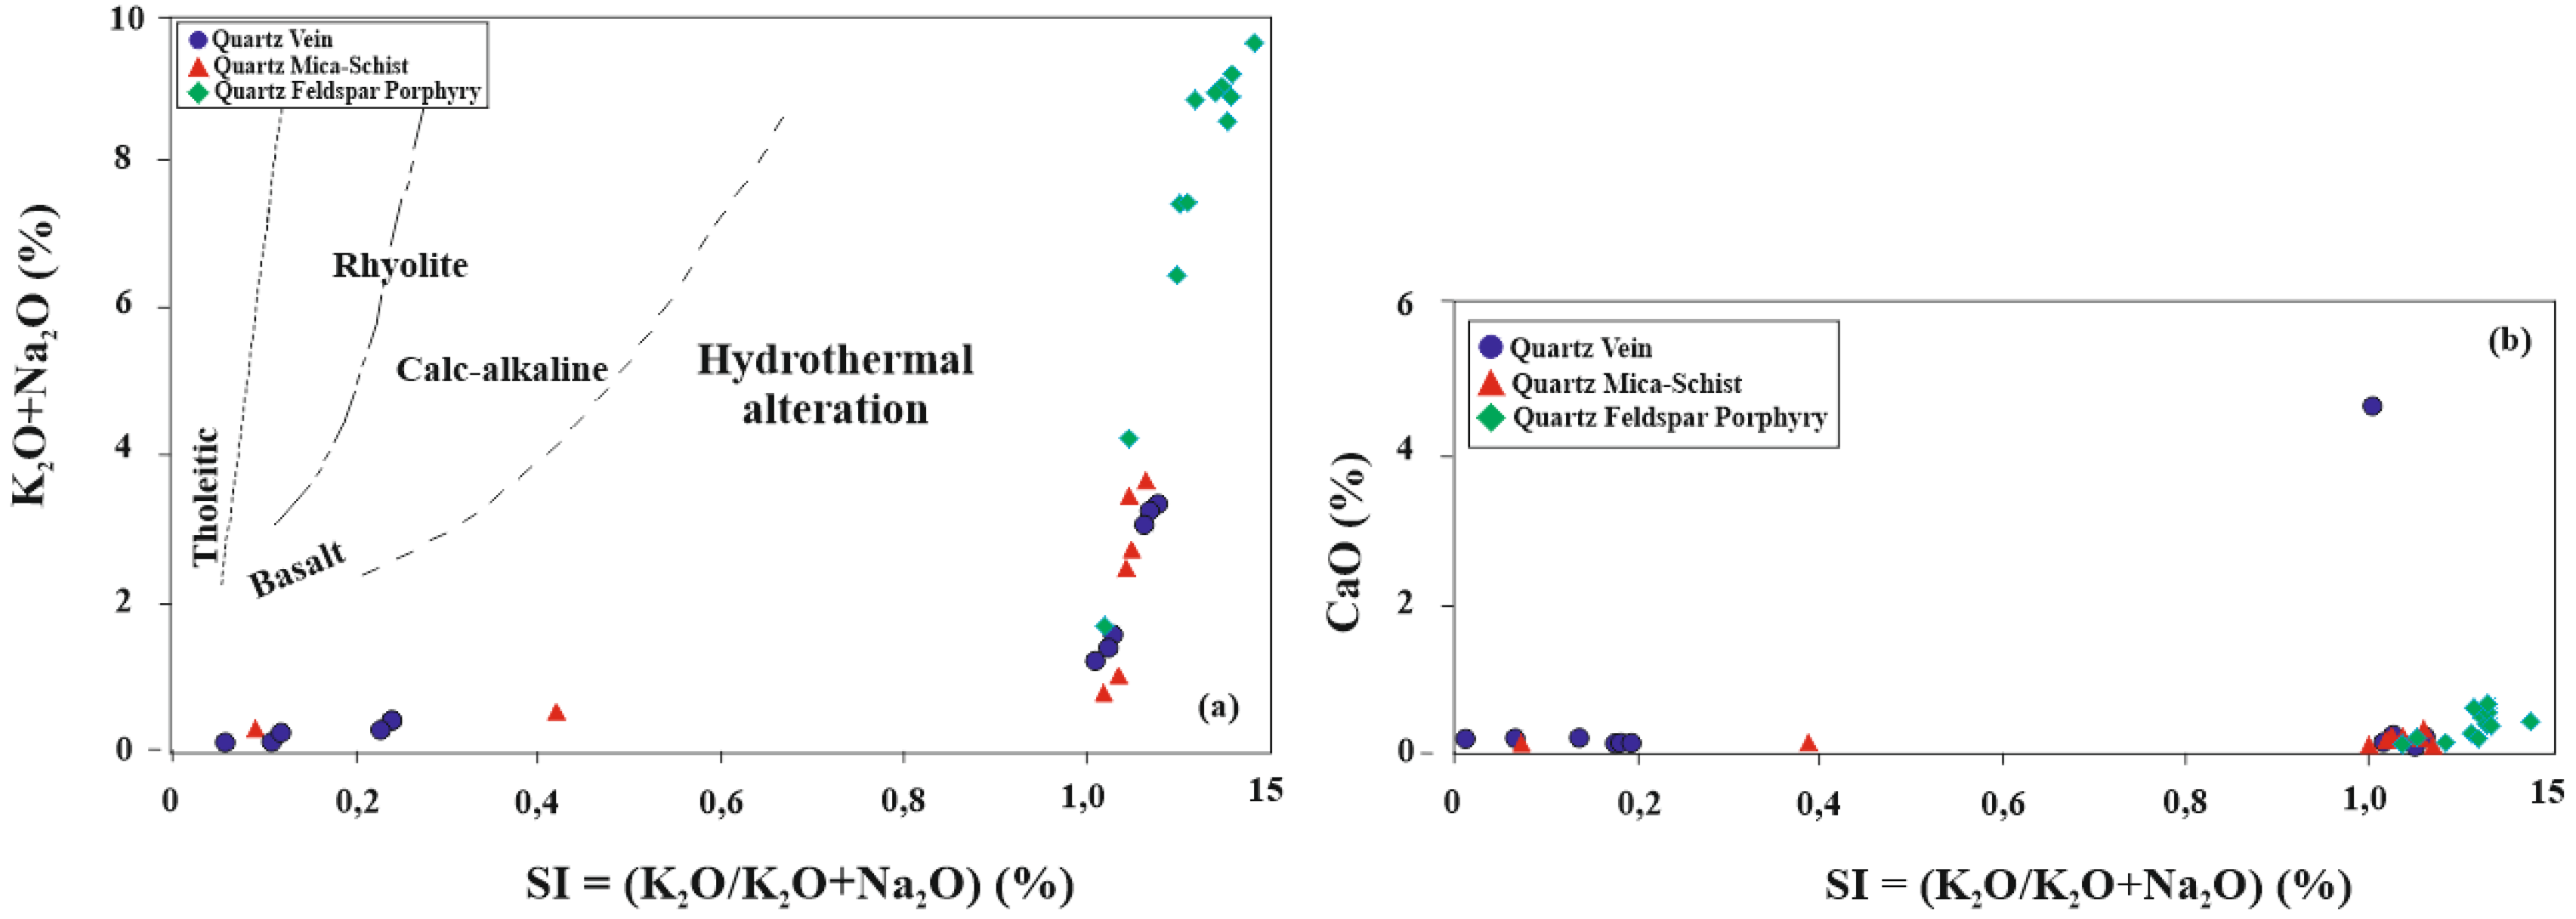
Figure 13.
Distribution of samples in the study area in (a) Al2O3-MgO-(CaO+Na2O+K2O) triangular diagram [modified from 120], (b) K2O versus CaO+Na2O diagram [modified from 104].
Figure 13.
Distribution of samples in the study area in (a) Al2O3-MgO-(CaO+Na2O+K2O) triangular diagram [modified from 120], (b) K2O versus CaO+Na2O diagram [modified from 104].
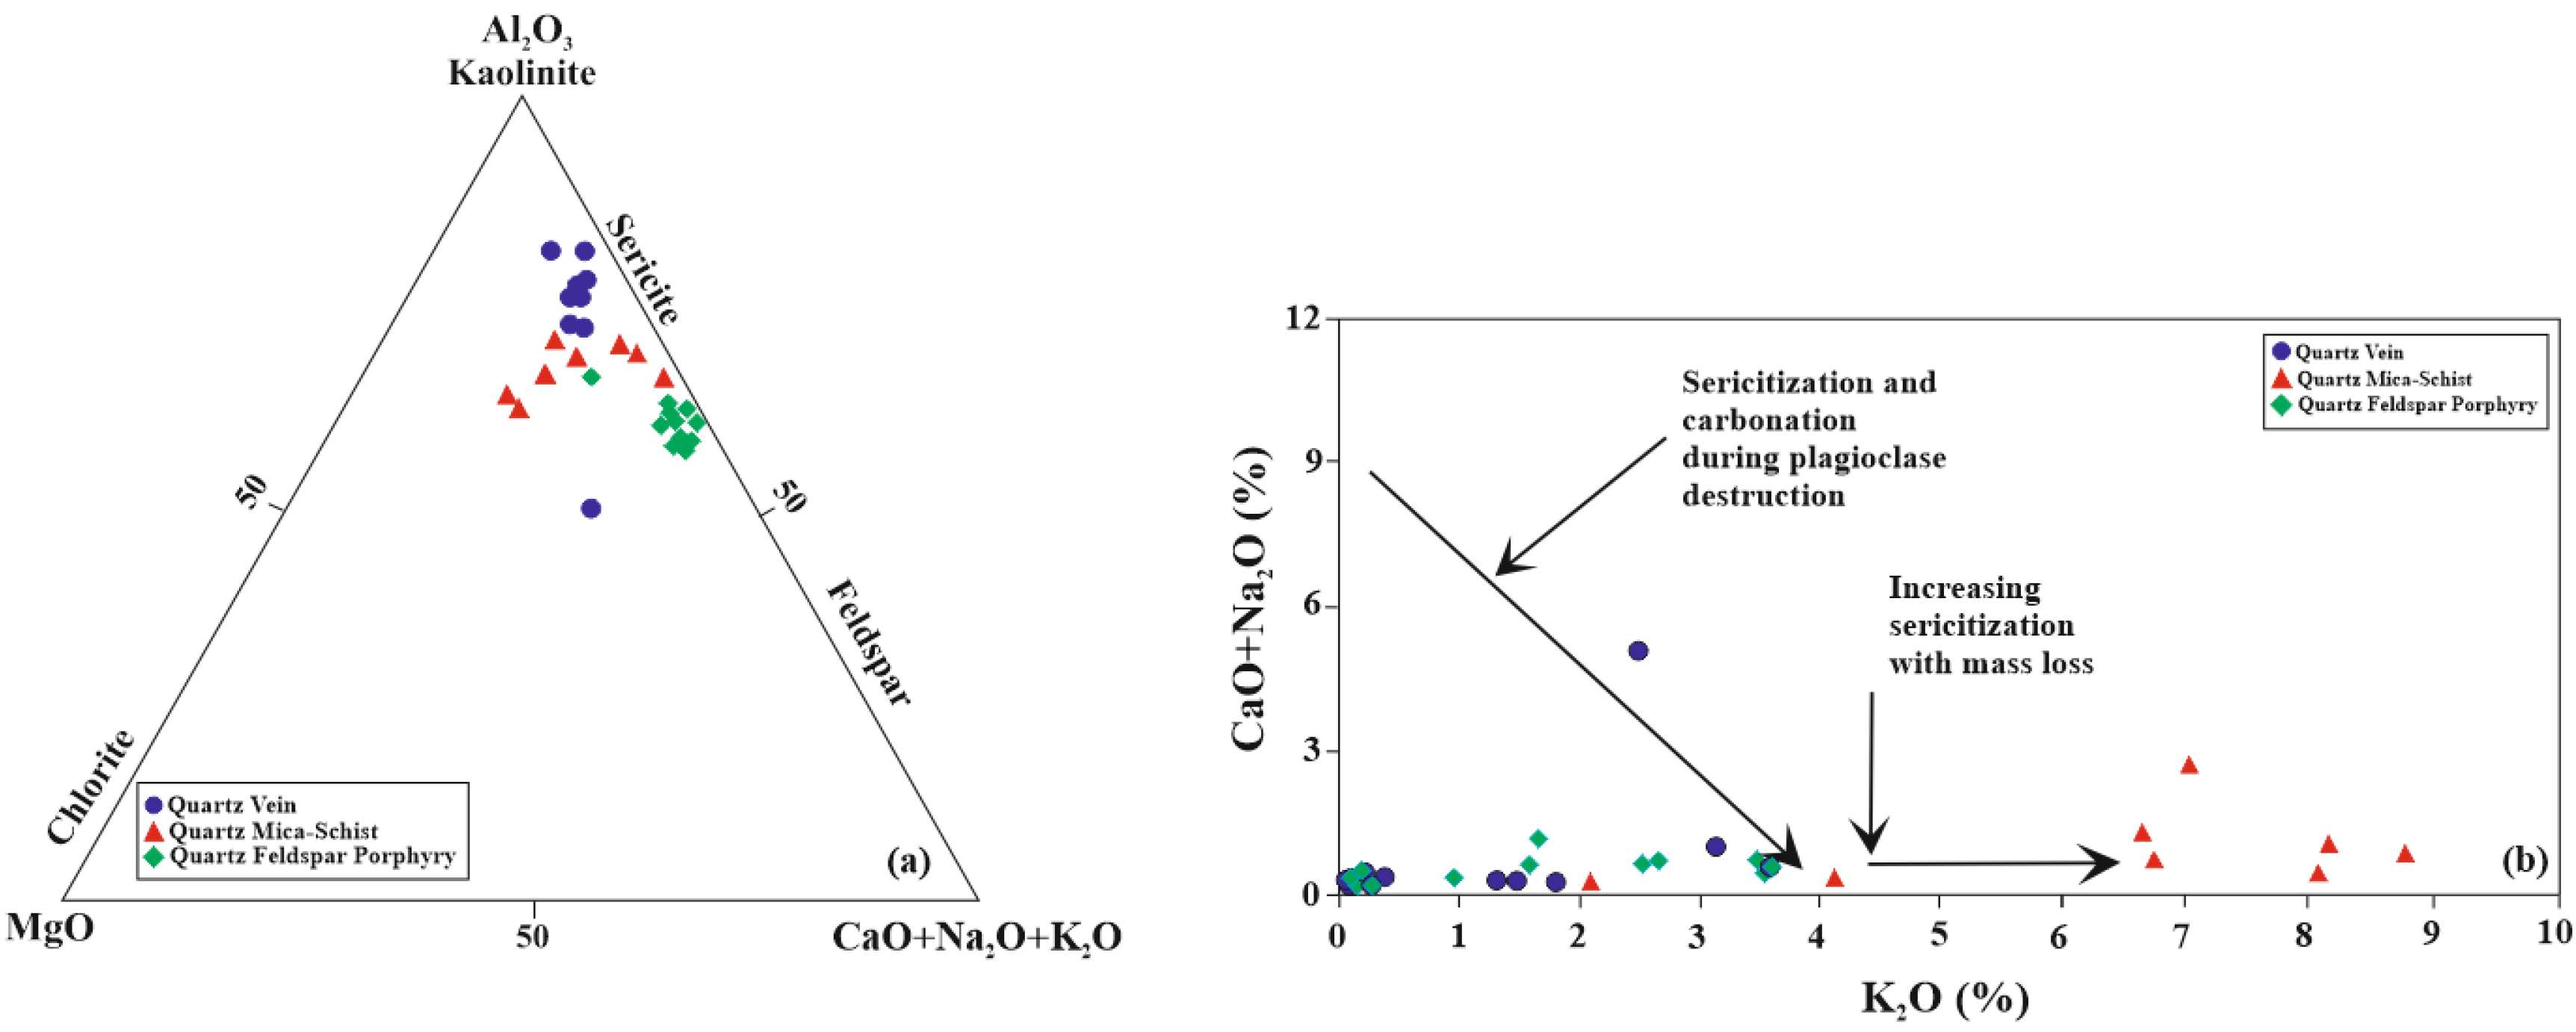
Figure 14.
Distribution of samples in ACNK diagram and classification according to CIA (Chemical dissociation index) value [modified from 47].
Figure 14.
Distribution of samples in ACNK diagram and classification according to CIA (Chemical dissociation index) value [modified from 47].
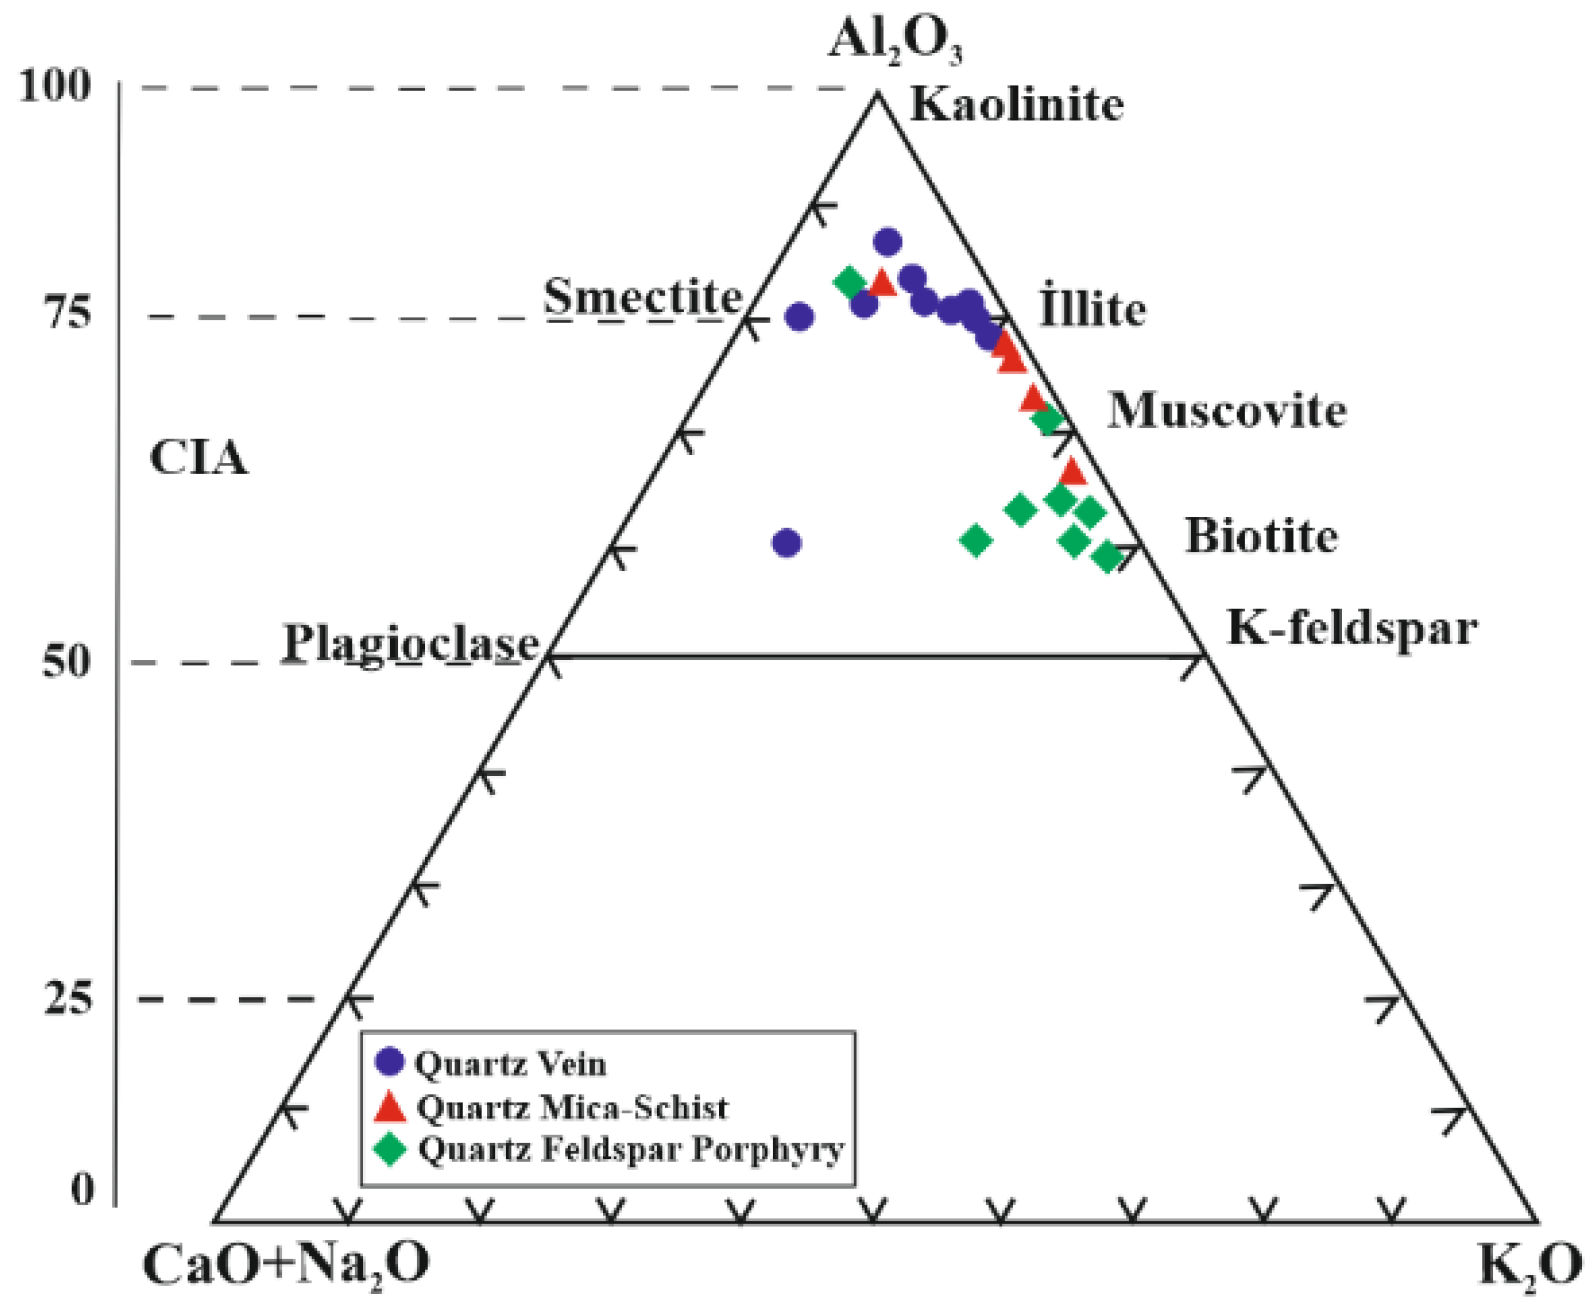
Figure 15.
Al2O3-(Na2O+K2O)-(Fe2O3+MgO)-K2O ternary diagram [modified from 24].
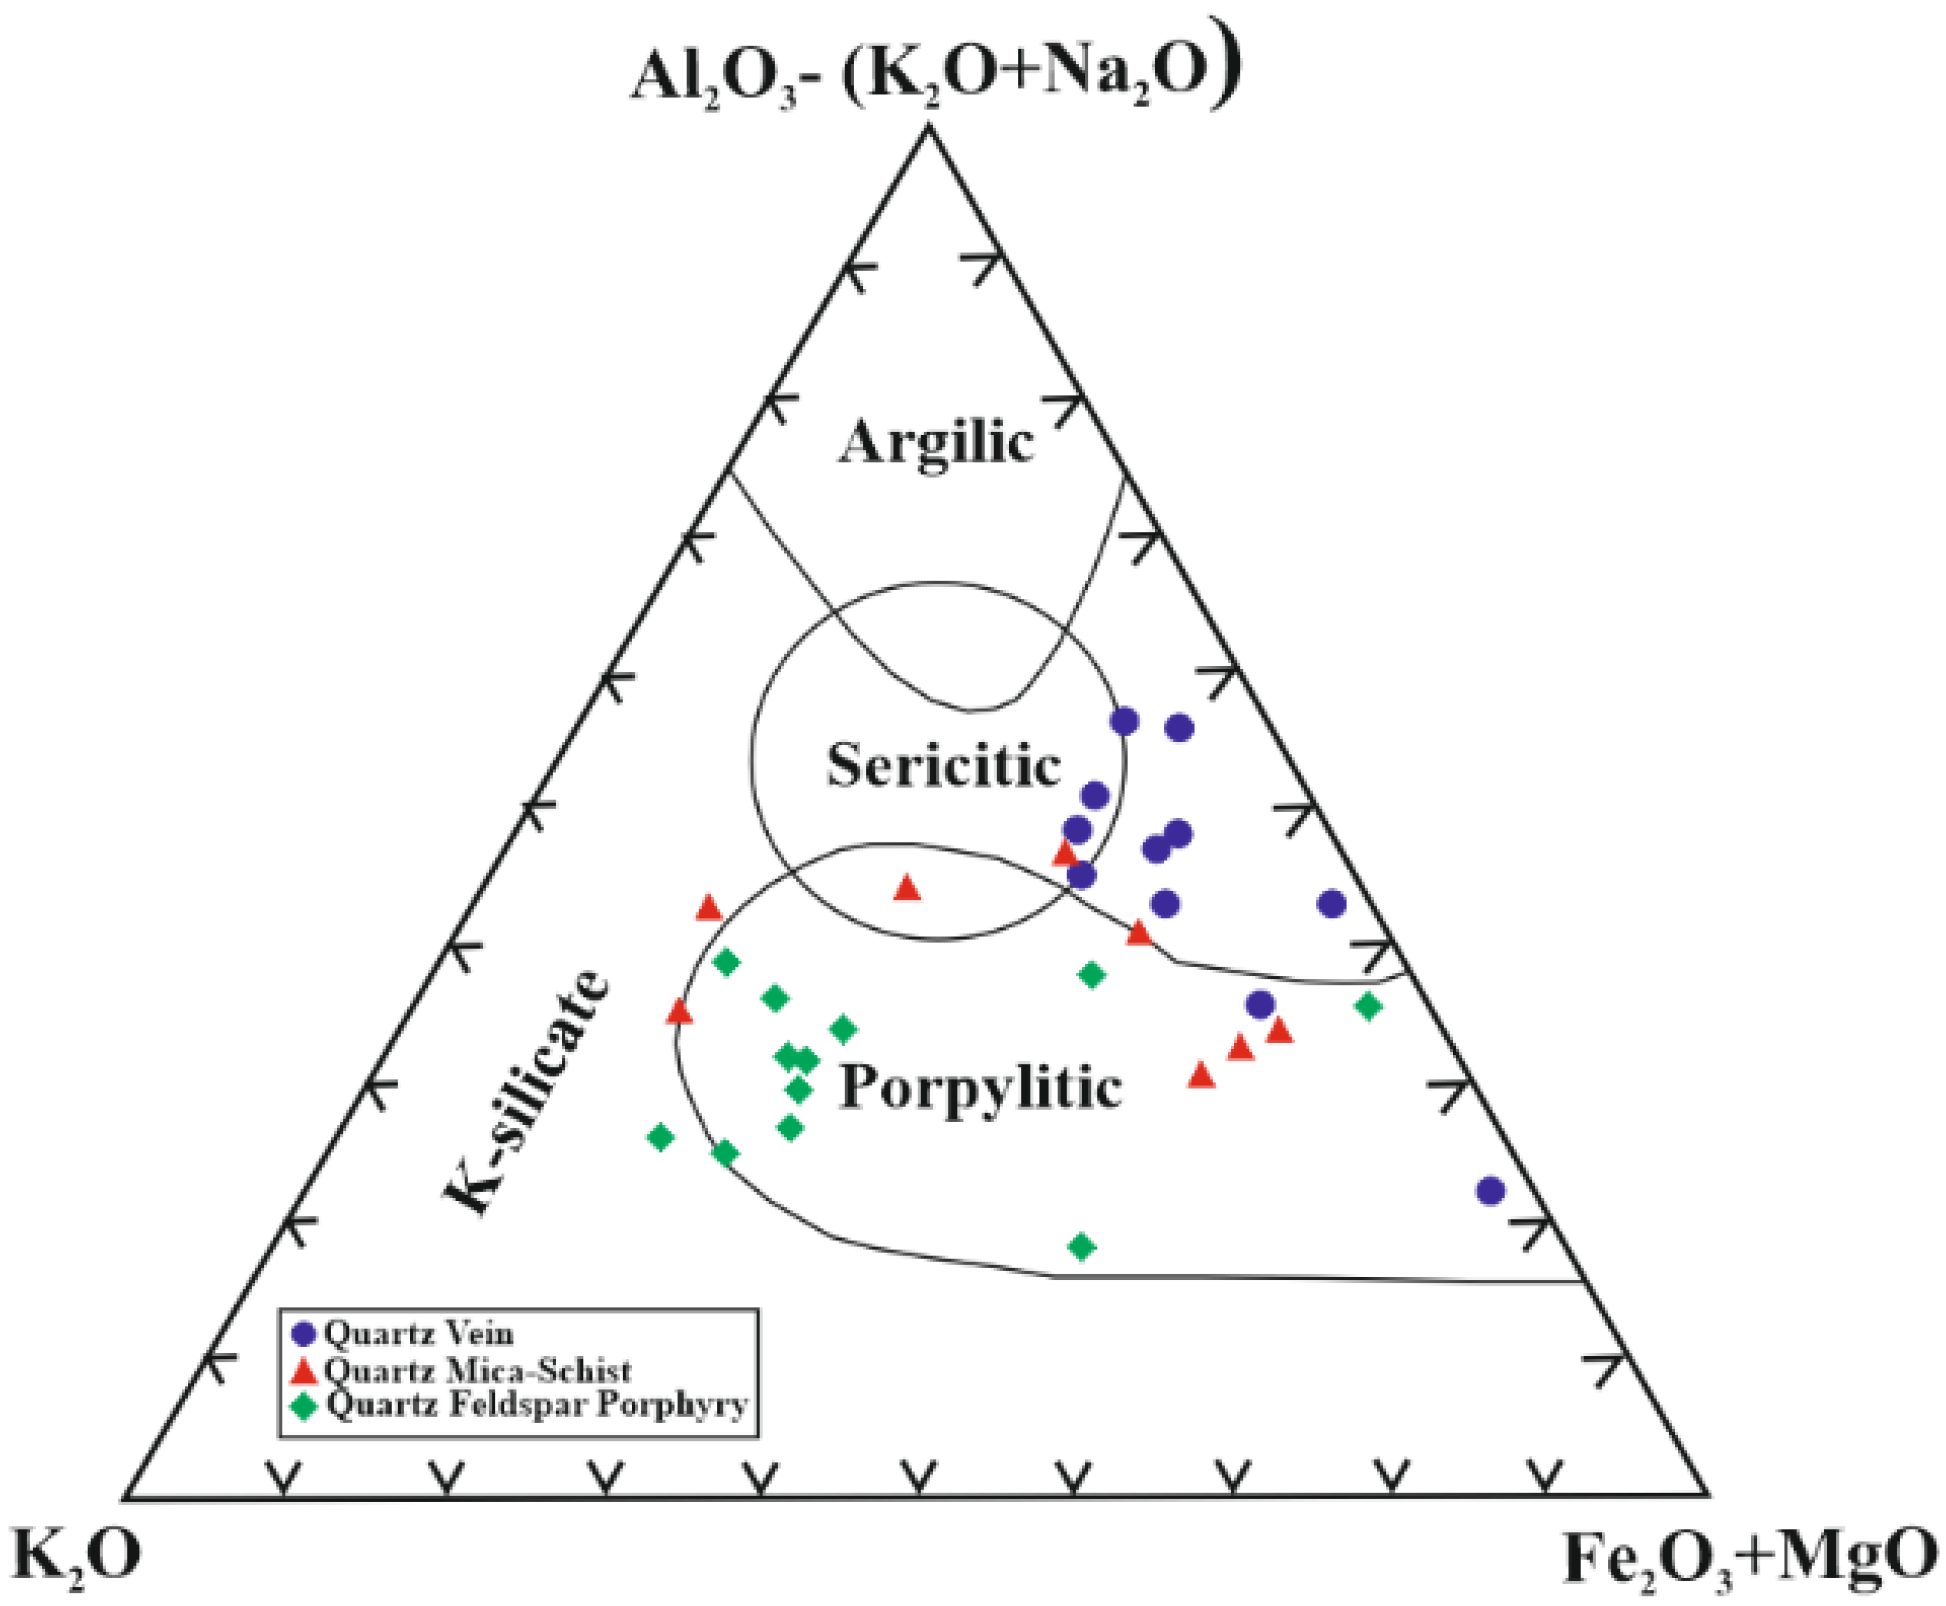
Figure 16.
Quartz vein, quartz feldspar porphyry and quartz micaschists (2Ca+Na+K)/Al-K/Al molar element ratio graph, mass transfer and related alteration minerals [modified from 57].
Figure 16.
Quartz vein, quartz feldspar porphyry and quartz micaschists (2Ca+Na+K)/Al-K/Al molar element ratio graph, mass transfer and related alteration minerals [modified from 57].
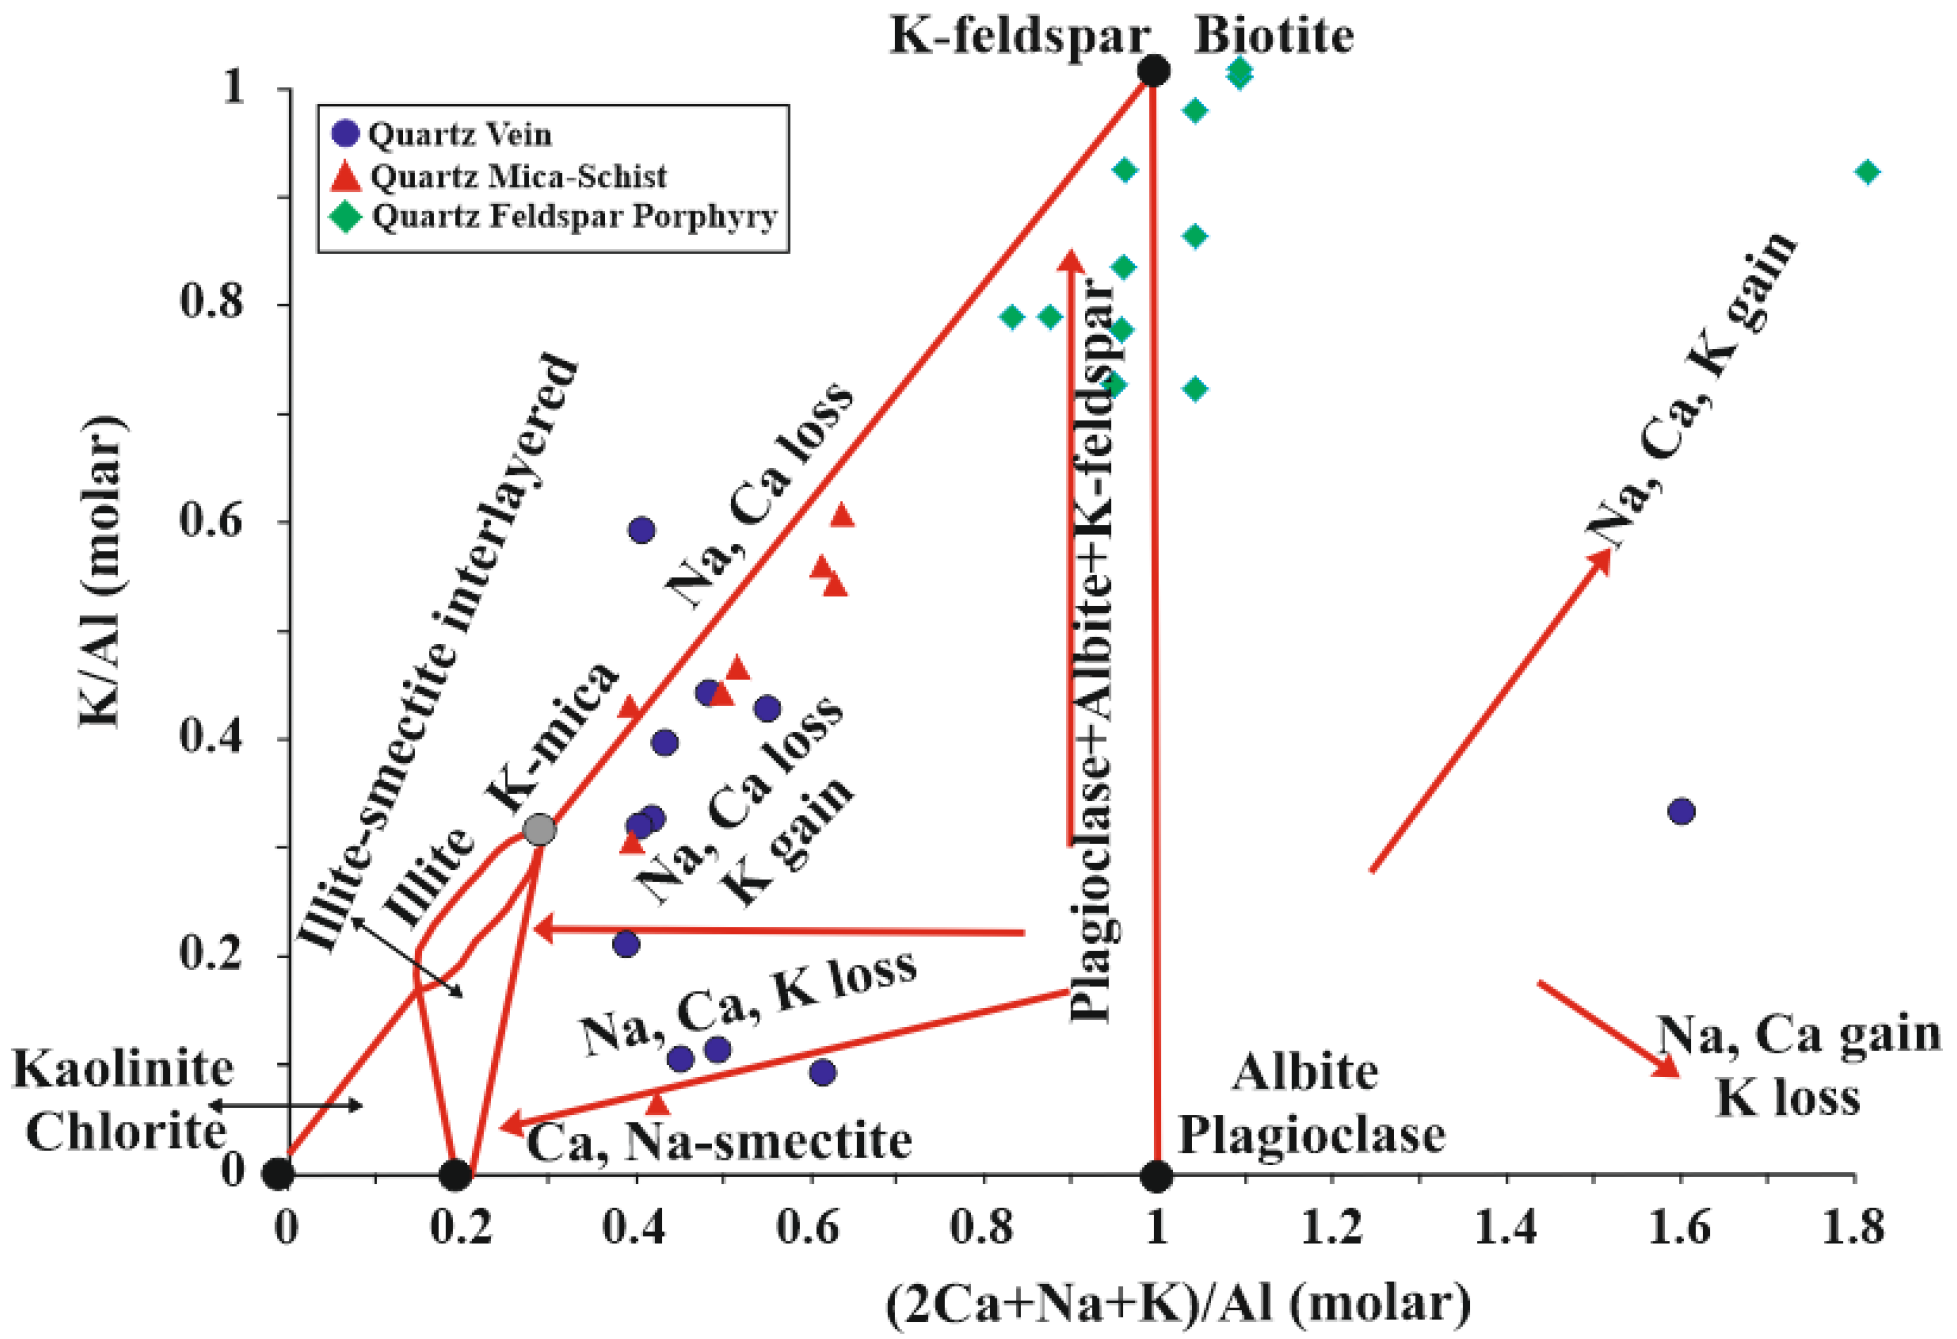
Figure 17.
(a) Na2O/Al2O3-K2O/Al2O3, b) MgO/Al2O3-K2O/Al2O3 molar ratio plots [modified from 52].

Figure 18.
(a) TiO2-Al2O3 binary graph trends of least weathered and weathered rocks [modified from 45], (b) Al2O3 versus Zr plot, mass gain-loss and Zr change in stationary Al [modified from 49].
Figure 18.
(a) TiO2-Al2O3 binary graph trends of least weathered and weathered rocks [modified from 45], (b) Al2O3 versus Zr plot, mass gain-loss and Zr change in stationary Al [modified from 49].
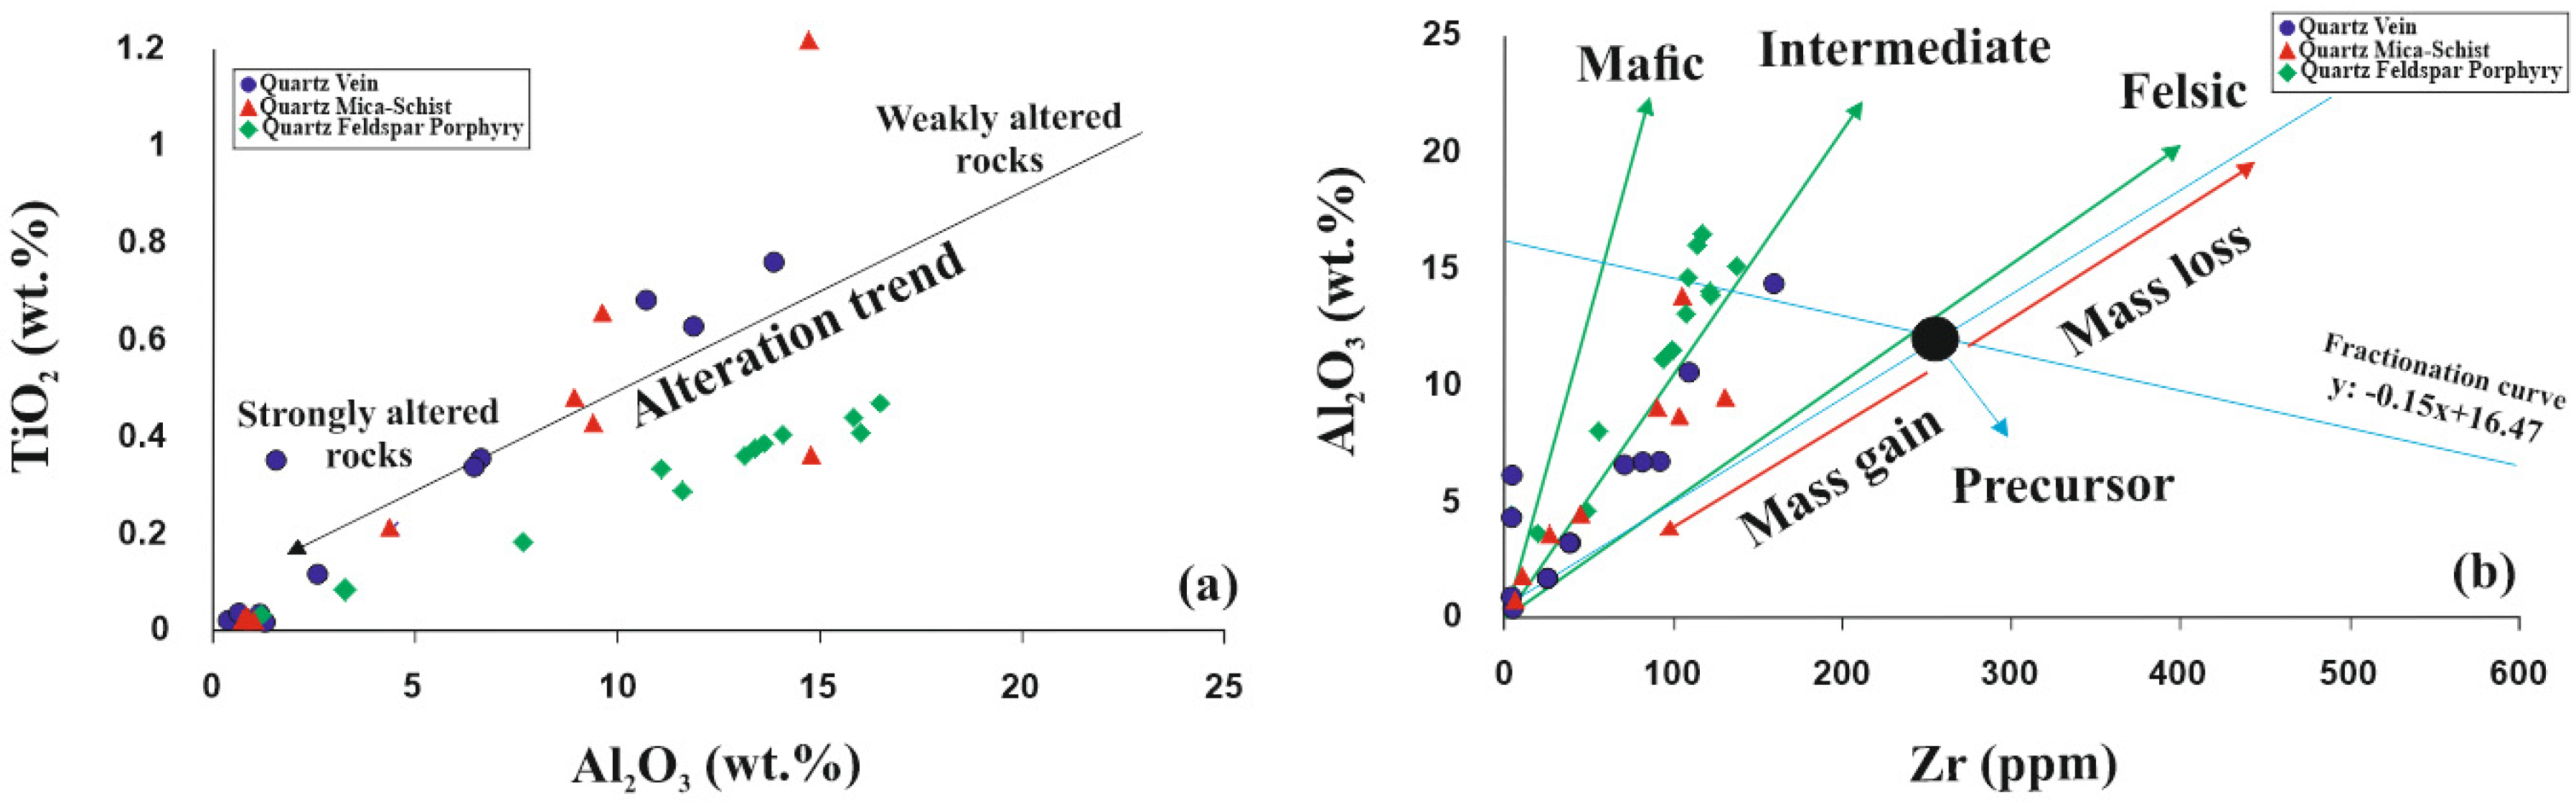

Table 1.
Mineral abundances of core alteration samples in the study area [modified from 28].
| Sample Number | Sample Type | Qz | Ilt | Sme/Ilt/ | Kln | Fsp | Chl | Kln/Chl | Sme/Kl | Sme | Cal | Dol | Hm | Crist | Alu | Hbl |
|---|---|---|---|---|---|---|---|---|---|---|---|---|---|---|---|---|
| KED 02-02 | Quartz vein | 16 | 3 | 0 | 2 | 0 | 0 | 0 | 0 | 0 | 2 | 0 | 0 | 0 | 0 | 0 |
| KED 02-05 | Quartz mica schist | 16 | 8 | 0 | 2 | 0 | 0 | 0 | 0 | 0 | 3 | 0 | 0 | 0 | 0 | 0 |
| KED 02-06 | Quartz vein | 16 | 10 | 0 | 3 | 0 | 6 | 0 | 0 | 2 | 3 | 1 | 0 | 0 | 0 | 1 |
| KED 02-07 | Quartz vein | 16 | 6 | 0 | 4 | 0 | 0 | 0 | 0 | 0 | 1 | 0 | 0 | 0 | 0 | 0 |
| KED 02-11 | Quartz mica schist | 16 | 8 | 0 | 2 | 0 | 0 | 0 | 0 | 0 | 2 | 0 | 0 | 0 | 0 | 0 |
| KED 02-13 | Quartz vein | 17 | 0 | 0 | 0 | 0 | 0 | 0 | 0 | 0 | 1 | 0 | 0 | 0 | 0 | 0 |
| KED 06-03 | Quartz feldspar porphyry | 15 | 0 | 0 | 2 | 5 | 7 | 0 | 0 | 3 | 2 | 1 | 1 | 1 | 0 | 0 |
| KED 06-04 | Quartz feldspar porphyry | 16 | 7 | 0 | 1 | 13 | 9 | 0 | 0 | 4 | 3 | 1 | 1 | 3 | 0 | 0 |
| KED 06-05 | Quartz feldspar porphyry | 14 | 6 | 0 | 2 | 11 | 6 | 0 | 0 | 5 | 3 | 1 | 1 | 1 | 0 | 0 |
| KED 06-06 | Quartz feldspar porphyry | 15 | 6 | 1 | 1 | 12 | 6 | 0 | 1 | 9 | 1 | 1 | 0 | 0 | 0 | 0 |
| KED 06-07 | Quartz feldspar porphyry | 18 | 3 | 0 | 1 | 11 | 5 | 0 | 1 | 7 | 2 | 1 | 0 | 0 | 0 | 0 |
| KED 06-08 | Quartz feldspar porphyry | 13 | 4 | 0 | 2 | 9 | 4 | 0 | 0 | 3 | 0 | 0 | 0 | 0 | 0 | 0 |
| KED 06-10 | Quartz feldspar porphyry | 15 | 4 | 0 | 1 | 11 | 9 | 0 | 0 | 4 | 1 | 1 | 0 | 0 | 0 | 0 |
| KED 06-11 | Quartz mica schist | 14 | 9 | 0 | 6 | 8 | 0 | 0 | 0 | 2 | 3 | 0 | 0 | 0 | 0 | 0 |
| KED 17-01 | Quartz feldspar porphyry | 11 | 7 | 0 | 0 | 9 | 0 | 0 | 0 | 3 | 1 | 0 | 1 | 0 | 0 | 0 |
| KED 17-02 | Quartz feldspar porphyry | 12 | 6 | 0 | 0 | 10 | 0 | 0 | 0 | 0 | 0 | 0 | 0 | 0 | 0 | 0 |
| KED 17-06 | Quartz feldspar porphyry | 16 | 0 | 0 | 0 | 3 | 0 | 0 | 0 | 0 | 0 | 0 | 0 | 0 | 0 | 0 |
| KED 17-07 | Quartz feldspar porphyry | 15 | 3 | 0 | 0 | 8 | 0 | 0 | 0 | 0 | 2 | 0 | 0 | 0 | 0 | 0 |
| KED 17-08 | Quartz vein | 15 | 0 | 0 | 2 | 0 | 0 | 0 | 0 | 0 | 3 | 0 | 0 | 0 | 0 | 0 |
| KED 44-02 | Quartz mica schist | 16 | 6 | 3 | 2 | 3 | 8 | 0 | 1 | 2 | 2 | 0 | 0 | 0 | 0 | 0 |
| KED 44-03 | Quartz mica schist | 17 | 9 | 0 | 0 | 1 | 7 | 0 | 0 | 0 | 3 | 1 | 0 | 0 | 0 | 0 |
| KED 44-12 | Quartz mica schist | 15 | 2 | 0 | 0 | 5 | 13 | 0 | 0 | 0 | 3 | 1 | 1 | 0 | 0 | 0 |
| KED 63-02 | Quartz vein | 17 | 8 | 1 | 2 | 4 | 11 | 2 | 1 | 1 | 0 | 0 | 0 | 0 | 0 | 0 |
| KED 63-03 | Quartz vein | 8 | 9 | 0 | 2 | 1 | 10 | 2 | 0 | 0 | 3 | 1 | 0 | 0 | 0 | 0 |
| KED 63-05 | Quartz vein | 17 | 8 | 1 | 5 | 1 | 0 | 0 | 0 | 4 | 2 | 1 | 0 | 0 | 0 | 0 |
| KED 63-09 | Quartz vein | 15 | 3 | 0 | 0 | 0 | 0 | 0 | 0 | 0 | 2 | 0 | 0 | 0 | 0 | 0 |
| KED 63-10 | Quartz vein | 17 | 8 | 0 | 6 | 1 | 0 | 0 | 0 | 0 | 2 | 0 | 1 | 0 | 0 | 0 |
| KED 63-11 | Quartz vein | 16 | 8 | 0 | 2 | 1 | 9 | 2 | 0 | 0 | 4 | 1 | 0 | 0 | 0 | 0 |
| KED 70-01 | Quartz mica schist | 18 | 0 | 0 | 2 | 0 | 0 | 0 | 0 | 0 | 2 | 0 | 0 | 0 | 0 | 0 |
| KED 70-02 | Quartz mica schist | 15 | 9 | 0 | 0 | 2 | 12 | 0 | 0 | 0 | 4 | 1 | 0 | 0 | 0 | 0 |
| KED 135-03 | Quartz feldspar porphyry | 17 | 7 | 1 | 4 | 12 | 0 | 0 | 0 | 9 | 3 | 0 | 1 | 0 | 2 | 0 |
Abbrevitaons: Qz: quartz, Ilt: illite, Sme/Ilt: smectite/illite, Kln: kaolinite, Fsp: feldspar, Chl: chlorite, Kln/Chl: kaolinite/chlorite, Sme/Kl: smectite/kaolinite, Sme: smectite, Cal: calcite, Dol: dolomite, Hm: hematite, Crist: cristobalite, Alu: alunite, Hbl: hornblende.
Table 2.
Major-minor oxides, trace and rare earth element contents of the drilling samples from the study area modified from [28].
Table 2.
Major-minor oxides, trace and rare earth element contents of the drilling samples from the study area modified from [28].
| DL | Quartz Vein | Quartz Feldspar Porphyry | Quartz Micaschists | |||||||
|---|---|---|---|---|---|---|---|---|---|---|
| Major oxides (w.%) | Min. | Max | Mean | Min. | Max | Mean | Min. | Max | Mean | |
| SiO2 | 0,01 | 57,74 | 98,02 | 85,00 | 64,79 | 89,52 | 72,26 | 52,92 | 95,78 | 81,56 |
| Al2O3 | 0,01 | 0,55 | 14,33 | 5,60 | 3,34 | 16,61 | 12,75 | 1,19 | 14,85 | 6,59 |
| Fe2O3 | 0,04 | 0,60 | 8,03 | 3,24 | 2,10 | 3,61 | 3,02 | 0,65 | 14,06 | 4,61 |
| MgO | 0,01 | 0,04 | 4,13 | 0,94 | 0,38 | 1,51 | 0,84 | 0,09 | 4,78 | 1,44 |
| CaO | 0,01 | 0,06 | 4,75 | 0,54 | 0,07 | 0,35 | 0,24 | 0,04 | 0,44 | 0,14 |
| Na2O | 0,01 | <0,01 | 0,42 | 0,11 | 0,07 | 8,00 | 1,34 | 0,01 | 0,09 | 0,04 |
| K2O | 0,01 | 0,03 | 3,59 | 1,32 | 2,06 | 9,21 | 6,99 | 0,11 | 3,61 | 1,93 |
| TiO2 | 0,01 | <0,01 | 0,75 | 0,34 | 0,08 | 0,48 | 0,36 | 0,01 | 1,63 | 0,46 |
| P2O5 | 0,01 | <0,01 | 0,16 | 0,07 | 0,03 | 0,13 | 0,10 | 0,02 | 0,16 | 0,07 |
| MnO | 0,01 | <0,01 | 0,47 | 0,1 | <0,01 | 0,07 | 0,04 | <0,01 | 0,07 | 0,03 |
| Cr2O3 | 0,002 | <0,002 | 0,015 | 0,01 | <0,002 | 0,004 | 0,004 | <0,002 | 0,036 | 0,02 |
| Sc (ppm) | 1 | <1 | 17 | 9 | 1 | 7 | 4,83 | <1 | 43 | 12,14 |
| Toplam/C | 0,02 | 0,02 | 2,54 | 0,27 | <0,02 | 0,06 | 0,03 | <0,02 | 0,79 | 0,15 |
| Toplam/S | 0,02 | <0,02 | 0,45 | 0,29 | <0,02 | 1,22 | 0,58 | <0,02 | 0,07 | 0,07 |
| Ateş Kaybı | -5,1 | 0,6 | 10,3 | 2,77 | 1,3 | 4,5 | 2,59 | 1 | 7,2 | 3 |
| Toplam | 0,01 | 99,98 | 99,81 | 99,92 | 99,82 | 99,96 | 99,86 | 99,79 | 99,97 | 99,91 |
| Trace-rare earth elements (ppm) | ||||||||||
| Ba | 1 | 21 | 428 | 216,36 | 142 | 866 | 572,67 | 36 | 281 | 150,13 |
| Rb | 0,1 | 4 | 173,6 | 60,31 | 97,2 | 442,2 | 344,45 | 10,2 | 191,1 | 95,44 |
| Sr | 0,5 | 10 | 59,2 | 24,06 | 30,8 | 171,8 | 98,68 | 16,2 | 149,6 | 51,06 |
| Nb | 0,1 | 0,5 | 13,3 | 5,03 | 2,00 | 7,1 | 5,54 | 0,4 | 11 | 4,88 |
| Hf | 0,1 | 0,1 | 4,5 | 1,76 | 0,6 | 3,5 | 2,73 | 0,2 | 3,3 | 1,76 |
| Th | 0,2 | 0,2 | 9,8 | 4,74 | 2,4 | 11,1 | 8,24 | 0,1 | 6,7 | 3,87 |
| Ta | 0,1 | 0,1 | 1,9 | 0,76 | 0,1 | 0,8 | 0,56 | 0,1 | 0,9 | 0,48 |
| V | 8 | <8 | 125 | 65,11 | 23 | 83 | 62,5 | 10 | 319 | 82,75 |
| Zr | 0,1 | 2 | 165 | 58,96 | 19,6 | 134,9 | 98,37 | 6 | 129,7 | 67,64 |
| Y | 0,1 | 0,2 | 25,4 | 12,87 | 4,1 | 26 | 12,47 | 2,7 | 30,1 | 13,48 |
| Cu | 0,1 | 6,8 | 75,9 | 23,09 | 6,6 | 34,6 | 15,63 | 13,9 | 54,6 | 28,9 |
| Pb | 0,1 | 16,6 | 171,3 | 54,11 | 7,2 | 102,1 | 43,11 | 13,7 | 128,1 | 46,68 |
| Zn | 1 | 18 | 88 | 51 | 22 | 97 | 47,75 | 16 | 128 | 61,88 |
| As | 0,5 | 9,7 | 615,2 | 120,07 | 2,3 | 413,7 | 137,95 | 10,9 | 422,4 | 158,64 |
| Sb | 0,1 | 3,1 | 258 | 40,05 | 1 | 28,8 | 11,36 | 3,6 | 58,9 | 22,7 |
| Ag | 0,1 | <0,1 | 2,9 | 0,9 | 0,1 | 2,6 | 0,46 | <0,1 | 10,4 | 1,84 |
| Au (ppb) | 0,5 | 2,5 | 7060,7 | 783,93 | 26,1 | 1376,5 | 389,39 | 18,7 | 903,1 | 267,5 |
| Hg | 0,01 | 0,02 | 0,11 | 0,05 | <0,01 | 0,66 | 0,16 | <0,01 | 2,87 | 0,44 |
| La | 0,1 | 0,6 | 27,7 | 11,76 | 7,5 | 23,6 | 19,53 | 2,4 | 23,3 | 13,03 |
| Ce | 0,1 | 0,5 | 56,6 | 22,37 | 12,6 | 47,8 | 34,85 | 3,4 | 45,4 | 23,56 |
| Pr | 0,02 | 0,08 | 6,33 | 2,6 | 1,43 | 5,08 | 3,84 | 0,54 | 5,54 | 2,93 |
| Nd | 0,3 | 0,3 | 22,6 | 9,73 | 5,7 | 18,3 | 13,85 | 2 | 21,8 | 11,61 |
| Sm | 0,05 | 0,16 | 4,66 | 2,11 | 1,09 | 3,65 | 2,78 | 0,55 | 4,29 | 2,51 |
| Eu | 0,02 | 0,02 | 1,16 | 0,53 | 0,22 | 1,09 | 0,77 | 0,1 | 0,94 | 0,57 |
| Gd | 0,05 | 0,36 | 5,01 | 2,3 | 1,12 | 3,4 | 2,69 | 0,72 | 4,19 | 2,63 |
| Tb | 0,01 | 0,02 | 0,81 | 0,36 | 0,13 | 0,55 | 0,39 | 0,08 | 0,76 | 0,4 |
| Dy | 0,05 | 0,1 | 4,43 | 2,11 | 0,78 | 3,55 | 2,16 | 0,48 | 3,3 | 2,27 |
| Ho | 0,02 | <0,02 | 0,9 | 0,49 | 0,13 | 0,82 | 0,45 | 0,09 | 1,17 | 0,49 |
| Er | 0,03 | 0,03 | 2,76 | 1,32 | 0,43 | 2,32 | 1,29 | 0,25 | 3,31 | 1,4 |
| Tm | 0,01 | 0,01 | 0,41 | 0,2 | 0,06 | 0,37 | 0,21 | 0,05 | 0,5 | 0,21 |
| Yb | 0,05 | 0,1 | 2,74 | 1,31 | 0,44 | 2,3 | 1,39 | 0,29 | 3,27 | 1,41 |
| Lu | 0,01 | 0,03 | 0,28 | 0,2 | 0,09 | 0,37 | 0,23 | 0,05 | 0,5 | 0,22 |
Table 3.
Total REE chondrite values of quartz vein, porphyry and micaschists.
| Sample Type | Mean Eu/Eu* | La/Yb | La/Sm | LREE/HREE | Ʃ REE |
|---|---|---|---|---|---|
| Quartz vein | 0,72 | 5,87 | 3,30 | 2,85 | 65,95 |
| Quartz feldspar porphyry | 0,82 | 9,84 | 4,41 | 4,04 | 81,06 |
| Quartz micaschist | 0,66 | 7,49 | 3,21 | 3,12 | 63,24 |
Disclaimer/Publisher’s Note: The statements, opinions and data contained in all publications are solely those of the individual author(s) and contributor(s) and not of MDPI and/or the editor(s). MDPI and/or the editor(s) disclaim responsibility for any injury to people or property resulting from any ideas, methods, instructions or products referred to in the content. |
© 2024 by the authors. Licensee MDPI, Basel, Switzerland. This article is an open access article distributed under the terms and conditions of the Creative Commons Attribution (CC BY) license (http://creativecommons.org/licenses/by/4.0/).
Copyright: This open access article is published under a Creative Commons CC BY 4.0 license, which permit the free download, distribution, and reuse, provided that the author and preprint are cited in any reuse.


