
Submitted:
26 December 2023
Posted:
27 December 2023
You are already at the latest version
Abstract
The paper describes and analyzes the performance of a new thermoelectric generation system based on the use of Peltier cells inserted in the ducts of the air conditioning equipment. The hot and cold air streams that flow in the two separated sections of an air conditioning system are used to create a thermal gradient between the two faces of the Peltier cells. Hot and cold air flow inside the A/C unit are driven to a built in thermal chamber where the Peltier cells are placed. Peltier cells are incrusted into an insulation wall that separates the two sections of the chamber through which hot and cold air streams are flowing. The so designed configuration allows the Peltier cells to generate electric current. The study has been run for constant cold air temperature and variable hot air temperature, resulting in a variable performance of the thermoelectric generator. Theoretical study has been completed with experimental tests to determine real performance of the thermoelectric unit. Efficiency of the thermoelectric generator has been found to be linearly dependent on the temperature difference between hot and cold air subsections of the chamber. Maximum efficiency, however, is limited by the hot air stream temperature, since in real conditions ambient temperature cannot overpasses a specific value. For standard operational conditions, 5º C and 45º C for the cold and hot air streams, the thermoelectric generator operates at 44% of the maximum efficiency attainable.
Keywords:
Thermoelectric generation
; Peltier cells
; Air conditioning equipment
; Energy efficiency
; Thermal performance
Introduction
Thermoelectric generation is a well-known phenomenon that has been used for long time in power generation [1,2,3,4] as well as in specific applications such as dehumidifiers [5], automotive industry [6,7], building construction materials [8], electrochemical systems [9], heat flow in thermodynamics [10] or temperature detection [11]. However, the main application of thermoelectric systems is the cooling and refrigeration and the cooling process control [12,13,14,15,16].
Despite the many applications it is being used in, still there are some new ones where thermoelectric power generation can be applied to like in air conditioning devices, either in passive mode for testing [17], or in active mode to generate energy for radiant cooling [18]. Other operating modes of the thermoelectric effect in the field of air conditioning can be found in portable units in dual heating and cooling mode [19], in heat pumps applied to the automobile industry [20] or simply as cooling active units [21].
Nevertheless, the idea of using a thermoelectric generator combined with an air conditioning unit to produce electricity has never been considered in spite of its many advantages. Indeed, thermoelectric generator can be benefitted from thermal difference between heat and cool air streams that flow in air conditioning units to create an electric generator basing on the well-known Seebeck effect [22,23,24]. Therefore, the feasibility of adapting thermoelectric cells to an air conditioning unit is not in doubt, but its performance must be tested, this is the main goal of this project.
Theoretical Background
The Seebeck effect [25,26,27], which is the base of the use of thermoelectric cells in air conditioning units to generate electric energy, shows that the electromotive force developed by a thermoelectric cell is proportional to the thermal gradient between the opposite faces of the cell as in:
Where α is the Seebeck coefficient of the cell and ΔT the temperature difference across the cell section, with the sub-indexes A and B accounting for the two kind of materials that are used in the cell structure [28].
Equation 1 is fundamental in the comprehension of the performance of a Peltier cell since it allows the study and characterization of the materials intervening in the composition of the Peltier cell.
Analyzing equation 1 it looks like the electromotive force increases proportionally to the thermal gradient across the Peltier cell with no limits; however, thermodynamic principles avoid this situation imposing a physical limit [29,30,31] that depends on the type of material used for the making up of the cell [32,33,34,35,36].
The power generation in a Peltier cell requires the presence of an electric current that is delivered by the cell as a function of the kind of materials used in the making up as well as of the effective cross section of the cell itself [37,38,39].
According to these premises, the power generation of a Peltier cell can be expressed as:
Where I is the generated current by the Peltier cell, and πAB the Peltier coefficient, which can be obtained as the difference between the Peltier coefficients of the two materials of the cell as shown in equation 2.
Peltier coefficient, π, is related to Seebeck coefficient, α, through the expression:
That shows the reversibility of the Peltier cell operation, supplying heat or current depending on how the cell is operated, either as a heat generator (THG) or as thermoelectric generator (TEG).
Since the Peltier cell plays the role of a THG or TEG, the electromotive force is closely related to the temperature gradient across the cell; mathematically:
Where T is the average operating temperature of the cell.
The use of a Peltier cell as THG or TEG requires the conversion of electric energy into heat or vice versa; the effectiveness of any of these two processes gives us reliable information about the quality of the materials of the cell and their global performance. This performance is characterized by a parameter known as “figure of merit” and is determined through the expression [40]:
Where σ, κ and ρ account for thermal and electric conductivity and electric resistivity, respectively.
The figure of merit is a characteristic parameter of every Peltier cell, and expresses its performance as for the energy conversion, heat to electric current, or vice versa, is concerned. The higher the ZT, the higher the Peltier cell efficiency. Figure 1 shows the characteristic values of the thermal and electric conductivity, as well as the Seebeck and Peltier coefficient for different type of materials, insulators, semiconductors and metals. The figure of merit for these kinds of materials is also included.
The parameters κL and κe shown in Figure 1 correspond to the network and electronic thermal conductivity. The value of the parameter Z can be obtained from equation 5, having:
Equation 6 shows that the Z-parameter depends on thermal and electric characteristic conductivity of the cell, thus indicating how good is the heat to electric current conversion or vice versa.
The reason why the figure of merit includes the operating temperature, T, is because the cell performance is heavily influence by this temperature, as thermal and electric conductivity depend on such temperature.
If we consider the Peltier cell as a thermodynamic energy conversion device, the efficiency of the heat to electric current conversion, or vice versa, is given by its performance, which can be expressed as:
Where TH and TC account for the hot and cold side temperature of the Peltier cell, and M is a parameter related to the figure of merit through the expression:
Where Tav is the average temperature of the cell, given by:
It has been assumed that the temperature evolves linearly from cold to hot side of the cell.
First term of the right hand of equation 7 corresponds to the Carnot efficiency, and because the second term into brackets is always lower than 1, the efficiency of the Peltier cell is always below Carnot efficiency, a prove that validates the statement of considering the Peltier cell as a thermodynamic device.
Equation 7 can be rearranged as:
Analyzing equation 10 we observe that the Peltier cell efficiency approaches the Carnot one as the figure of merit TMZ increases. Today, technological advances have achieved values of the figure of merit much higher than 1 although these values correspond to laboratory tests for materials in development phase.
In practice, material with a figure of merit lower than 1 are currently discarded since they cause a very low efficiency in the Peltier cell. For those with a figure of merit close to the unity, the Peltier cell efficiency depends on the TH/TC ratio, what for standard operational temperatures results in an efficiency of 20% to 30%.
Figure 2 shows characteristic values of the figure of merit for some synthetized materials and their combinations, as well as other typical parameters.
Simulation study of the Peltier cell
To analyze in depth the importance of the type of material that must be used in the configuration of a Peltier cell, a simulation has been carried out where the value of the figure of merit has been varied for different temperature jumps between the hot face and cold of the Peltier cell, obtaining the efficiency value for each case. The results of the simulation are presented in Figure 3.
The simulation results match with previously developed studies [43], what validates the simulation procedure. Analyzing the results from the simulation, we notice the efficiency of the Peltier cell is low, much lower than the Carnot one, even for high values of the figure of merit (ZT=2), corresponding to high quality materials. This indicates that thermoelectric generation is not a very efficient system of energy conversion compared with ideal thermodynamic cycles that operate with the same temperature gap.
Comparing the efficiency obtained in the simulation study with conventional plants of energy conversion like power plants operating with gas or vapor turbines, whose efficiency is in the range of 20% to 30%, we can also observe the Peltier cell efficiency continues having a lower value, what makes this system not competitive with conventional energy conversion processes.
According to equation 7 and simulation data from Figure 3, the improvement of the Peltier cell efficiency goes through the increase of the figure of merit; to do so, we should increase the power factor of the figure of merit (α2σ), what results very complicated since electric conductivity and Seebeck coefficient are inversely proportional, or reducing thermal conductivity through the implementation of defects at specific sites of the crystalline structure of the material or the use of dispersion mechanisms like resonance, charge carriers or grain frontiers [44].
Nevertheless, thermoelectric conversion can be considered good enough if applied to systems where heat is dissipated to the environment, such as, among some others, in industry processes where hot fluid circulates inside ducts, or in geothermal facilities where the very hot geothermal fluid is also carried from the underground reservoir to the power plant through insulated ducts.
The two above mentioned cases represent a situation where hot fluid losses thermal energy through insulation to the surroundings with no contribution to the efficiency improvement. On the other hand, if wasted thermal energy is used to generate electricity through thermoelectric conversion, the efficiency is increased at minimum cost, thus obtaining an improvement of the global performance of the entire system. This type of configuration is the one we have studied, applied to air conditioning system ducts.
To operate at optimum conditions, we have selected the materials with the highest value of the figure of merit that corresponds to the second listed group, 2D materials: quantum or superlattices. Among the materials included in this group we have chosen the one that operates at standard temperature, 300 K, with the minimum thermal conductivity and no synthetized process requirements. The selected combination is, therefore, Bi2Te3/Sb2Te3, that has a figure of merit of ZT=2.4 and reaches a maximum efficiency of 20% for a temperature gap of 350 K.
The application of a Peltier cell of the selected type to an air conditioning device does not produce the maximum efficiency at any time since it operates at much lower temperature difference than the optimum. In current situations, an air conditioning device operates at a temperature of 5º C (41º F) for the cold side, and at 40º C-45º C (104º F-113º F) for the hot one; this configuration generates a maximum temperature gap of 40º C (104º F), which is far from the optimum operating one of 350º C (662º F). in these conditions, the efficiency of the Peltier cell is reduced to an expected value of about 4%.
Experimental Device
For the development of this project, a system like the one shown in Figure 7 has been designed, where the configuration of said system is observed. The system will be made up of a thermally insulated wooden container divided into two chambers, front and rear, through which a current of hot and cold air circulates, respectively. Regarding the generation of hot and cold air, these will be generated thanks to an air conditioning device and an industrial air heating system, operating in cooling and heating mode, respectively.
Figure 4.
Schematic representation of the embedded Peltier cell system.
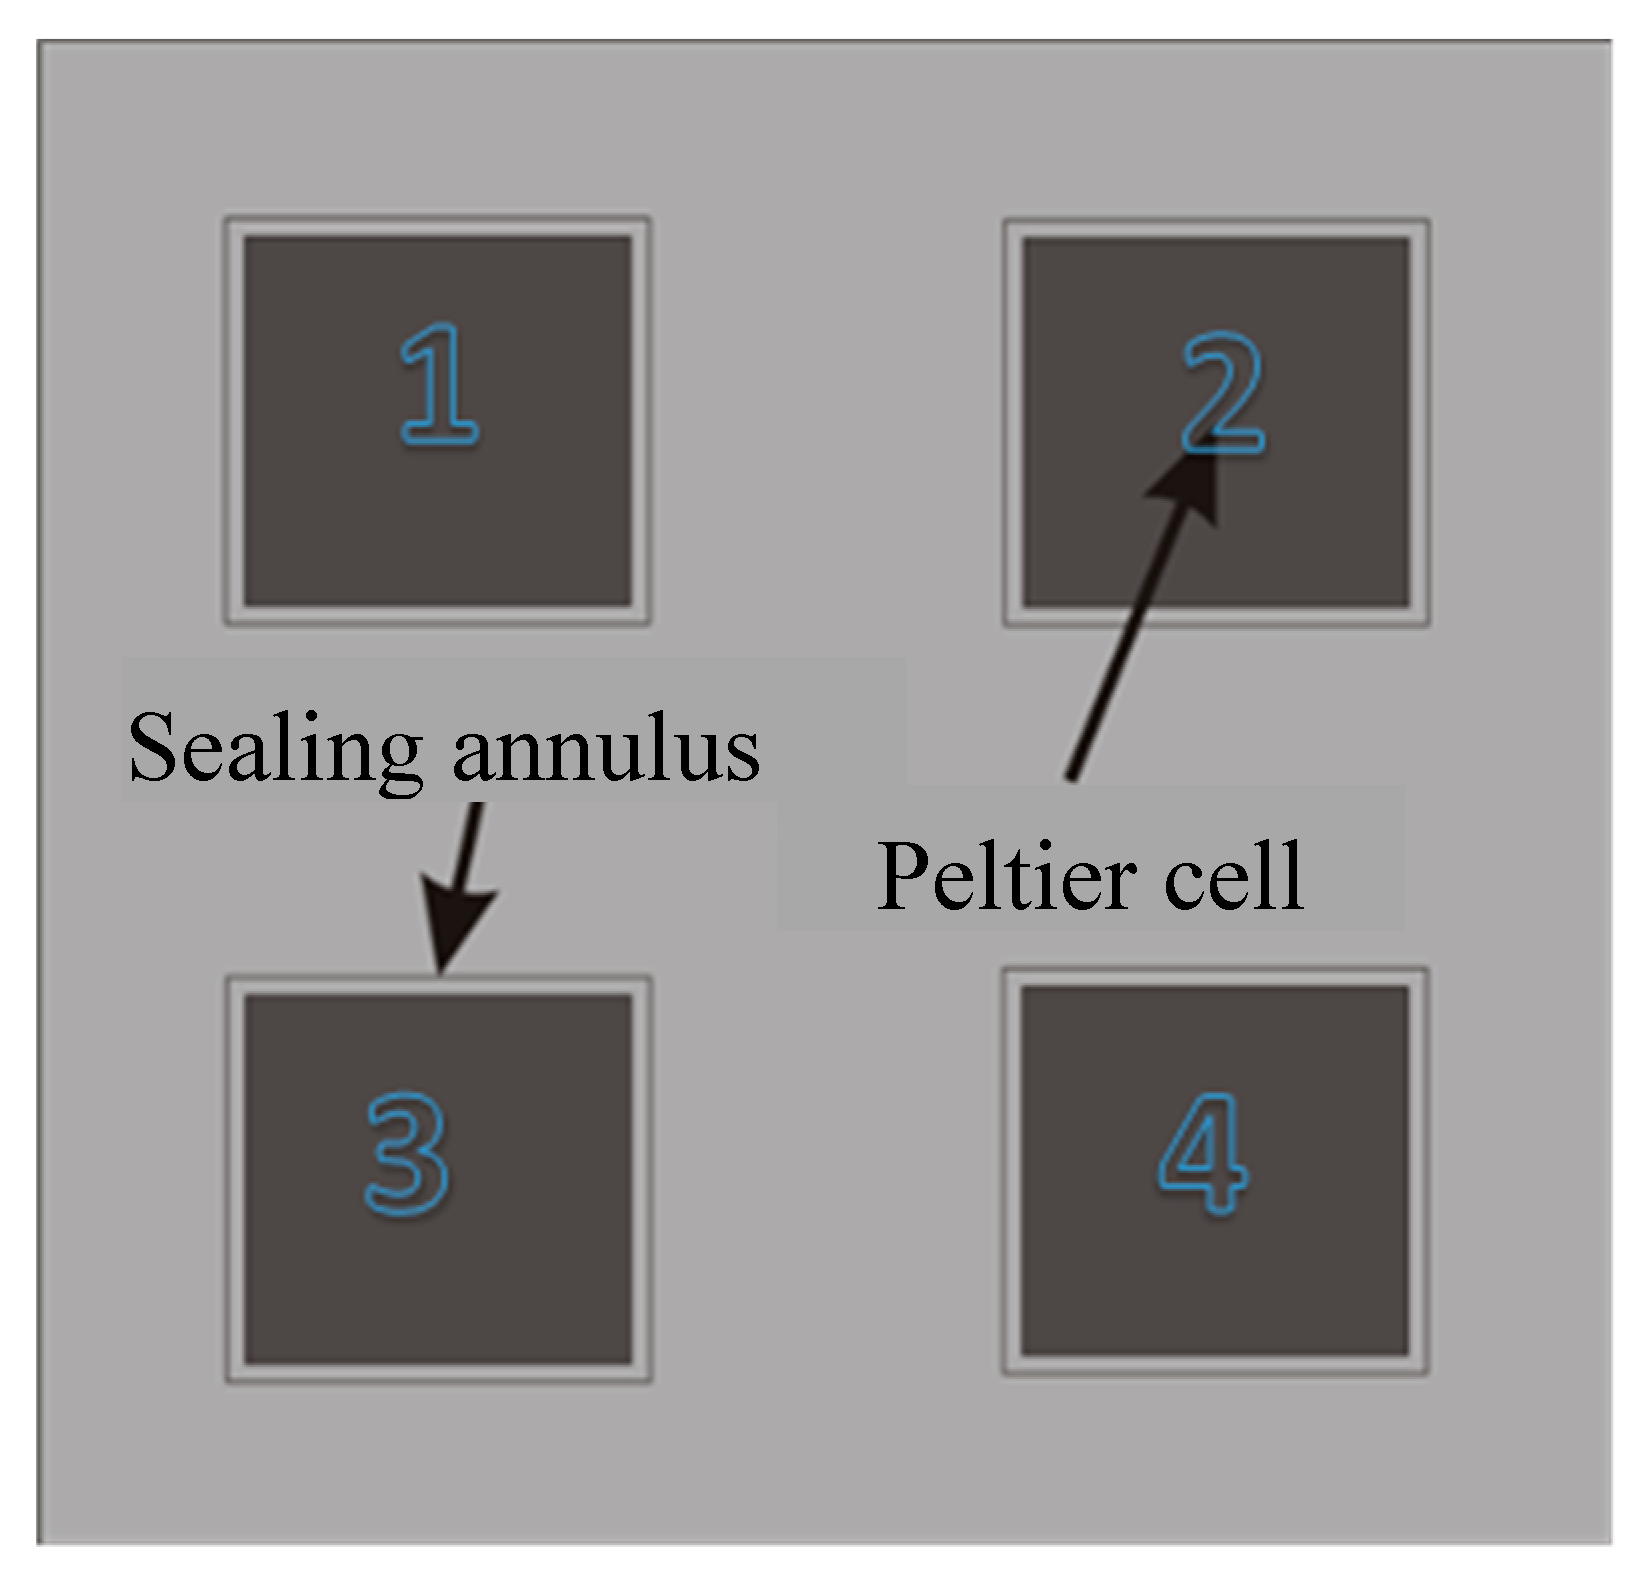
The system carried out aims at simulating the circulation of air in an air conditioning unit, where the cold air will be the one that is injected into the room to be cooled, while the hot air will be the one that is expelled to the outside environment. In the following figure, you can see the dividing wall between both chambers, where the witness Peltier cells will be embedded:
The dividing wall has been built in low density conglomerated wood that has a very low thermal conductivity (0.055 W/m·K). A sealing annulus warranties thermal insultation and avoid air flow between the cold and hot air chambers. Figure 5 shows an schematic view of the prototype used for testing.
Cold air stream has been provided by a commercial portable air conditioning system whose outlet is directly connected to the inlet of the cold air chamber; hot air stream is supplied by a commercial convection heater whose outlet is connected directly to the inlet of the hot air chamber. Minimum and maximum operating temperatures of the cold and hot air sources are 2º C and 140º C, although we have set up the operating conditions to 5º C and 45º C to faithfully reproduce real operating conditions of commercial and industrial air conditioning units.
The Peltier cells used in the experimental device are of the model TEC1-12710 from the company Hebei I.T; This particular model has 127 highly doped thermocouples (P-N junctions) which operate with a limit current of 10.5 A. The dimensions of the cells are 40x40x3.8 mm, and they are manufactured using telluride as a semiconductor. bismuth (Bi2Te3), this being a very efficient material for refrigeration/thermoelectric generation; likewise, the Peltier cell is covered with alumina (Al2O3) which constitutes the ceramic material. The referenced maximum output power is of 182.7 W at a temperature gap of 350º C, operating at 20% of maximum efficiency [45].
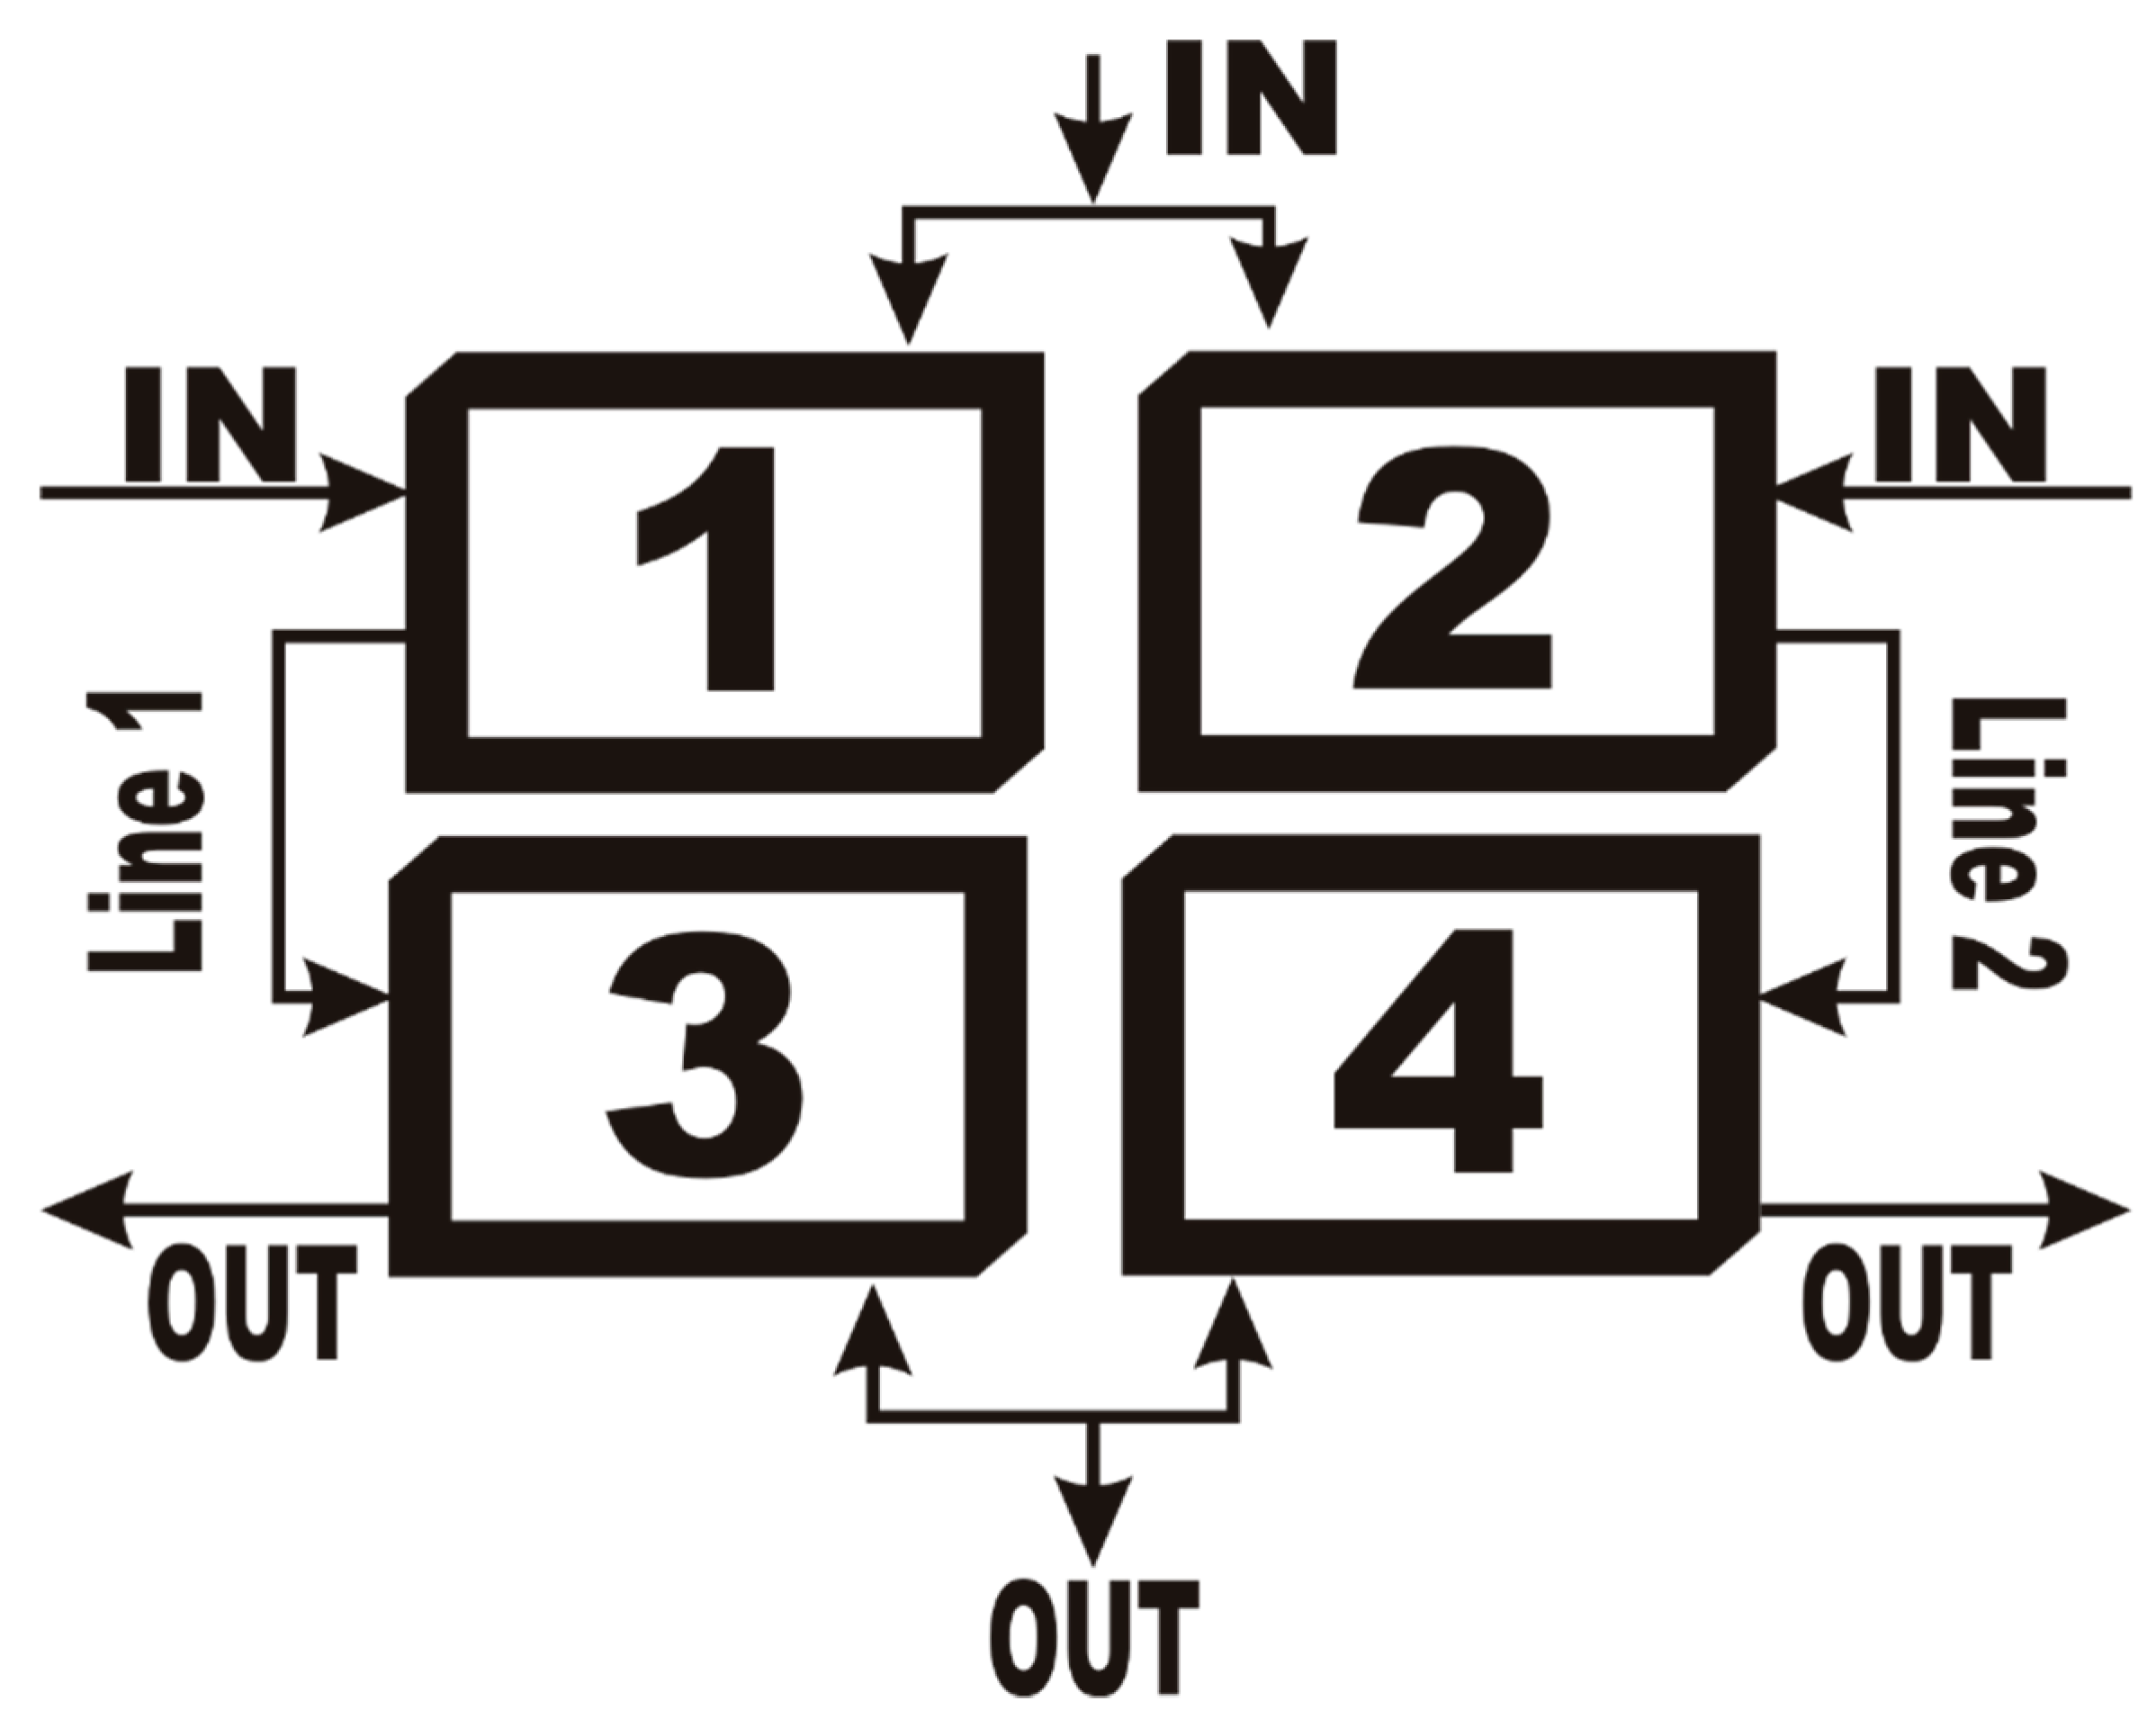
The four Peltier cells set has been designed in this way to verify the performance of a multicombination system where different cells are connected either in series or in parallel to increase voltage and current, thus power. To this goal, the wiring of the Peltier cells system has been configured to allow series, parallel or hybrid series-parallel combination of the cells. The following scheme shows the different combinations adopted for testing.
Figure 6.
a. Layout of the different combinations in series of Peltier cells.

Figure 6.
b. Layout of the different combinations in parallel of Peltier cells.
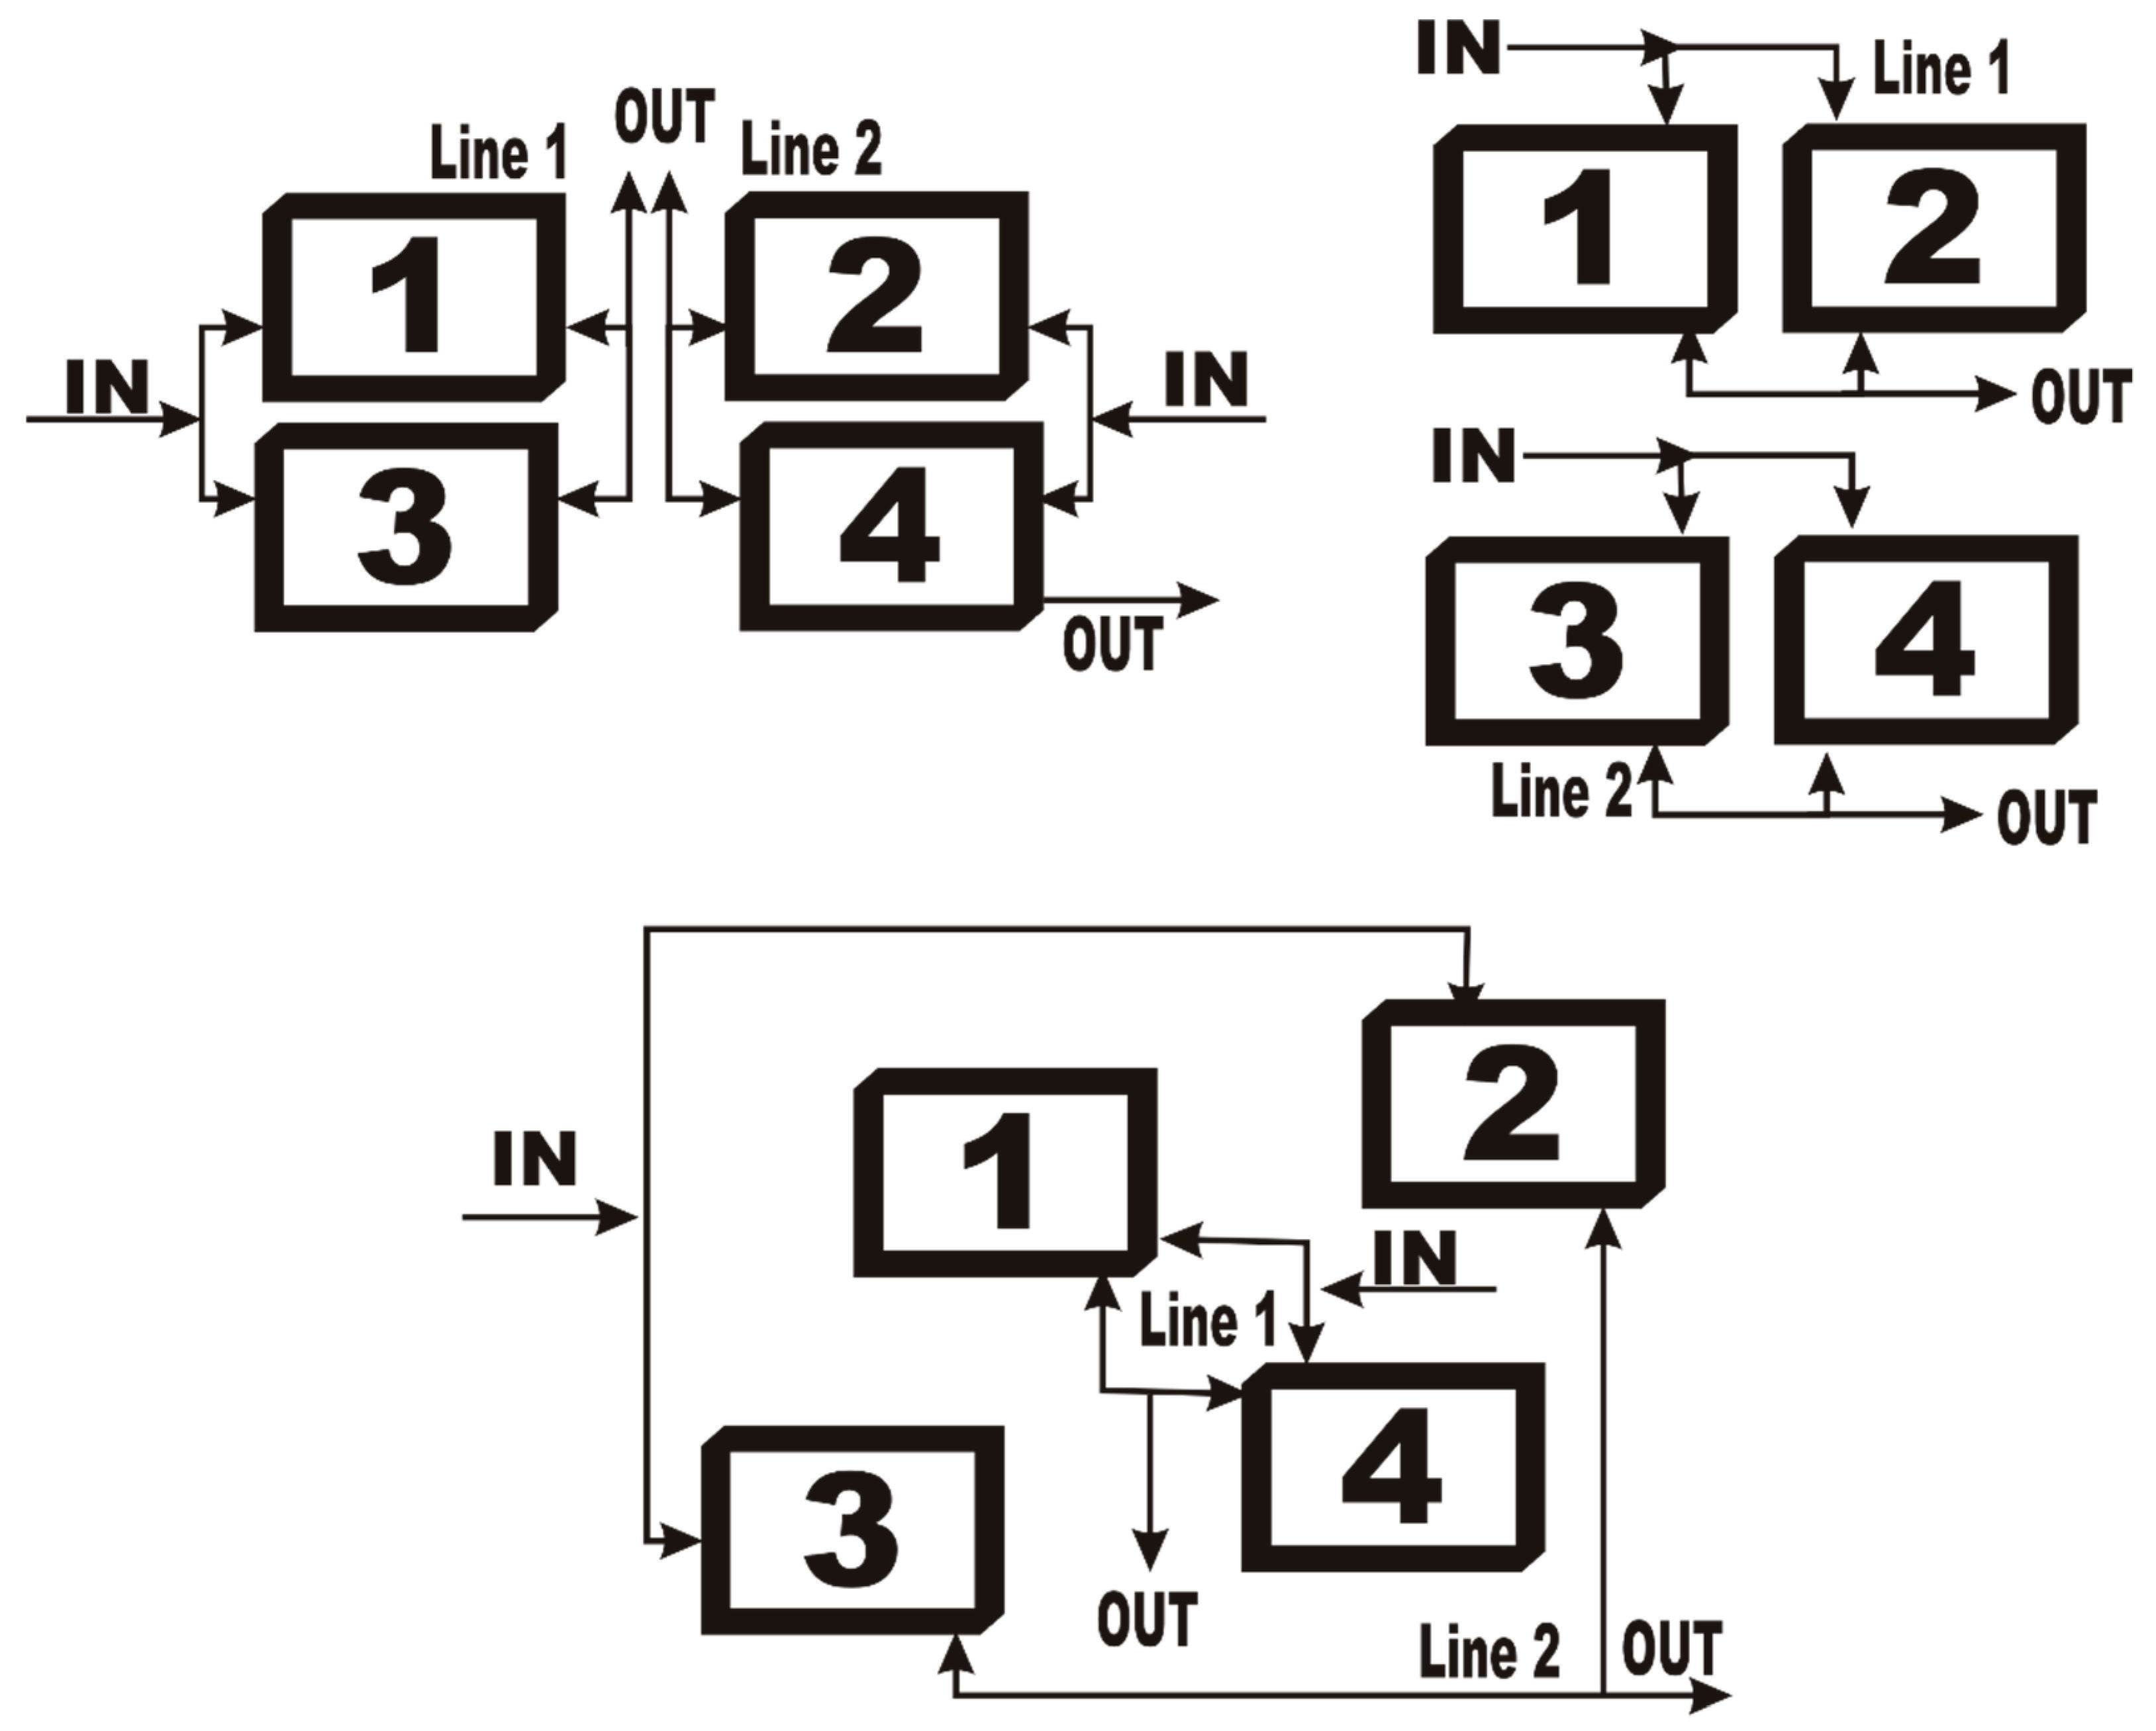
Figure 6.
c. Layout of the hybrid mode configuration of Peltier cells.
Assuming the prototype operates at the steady state, temperatures of hot and cold side of the Peltier cells are in thermodynamic equilibrium wit the air of the respective chamber; therefore, we consider the following statement:
Where sub-index ch accounts for chamber, and H and C correspond to hot and cold section.
TH,cell=TH,ch TC,cell=TC,ch
Nevertheless, due to heat transfer through the cross section of the cell, cold side is heated up and its temperature tends to raise above the one corresponding to the cold air chamber. This heating up can be compensated by convective flow from the cold air stream flowing across the cold air chamber. To determine if the convective flow removes the heat from the cold side of the cell and temperature remains unchanged, we have proceeded to analyze the thermal balance at the cold side of the Peltier cell. This study is critical since a continuous heating up trend would result in a reduction of the temperature gap, thus of the efficiency of the cell and of the power generation.
Considering that heat transfer through the Peltier cell is produced by conduction, and that heat removal from the cold side of the cell is due to forced convection, we can establish:
Where κc is the thermal conductivity of the material of the cell, e is the thickness of the cell, h the convection coefficient of the forced cold air flow, and Ti the real temperature of the cold side of the Peltier cell.
Operating in equation 12:
Thermal conductivity of the Peltier cell material at the operating temperature is 0.104 W/m·K [44]. Convection coefficient depends on the geometry of the cell, on the air speed and on the type of flow, laminar or turbulent; to determine the type of flow regime we apply the expression [46]:
Where H is the height of the wall, in our case the Peltier cell, and Re* is a normalized value of the Reynolds number. The condition for laminar or turbulent flow regime is [45]:
Applying data to equation 14 we obtain:
Which clearly corresponds to a laminar regime.
In this case, the corresponding expression to determine the convection coefficient is [47]:
Which for our case it results:
Applying data for the prototype:
The result from the thermal transfer analysis shows that the cold side of the Peltier cell is a higher temperature then the cold air flow from the air conditioning system, what reduces the temperature gap, thus the efficiency.
Using the resulting temperature gap, 24.3º C, and efficiency data from Figure 3, the new value of the Peltier cell efficiency is 2.3%.
Experimental Results
Testing has been carried out to determine the output power of the Peltier cell system for different configurations:
- a)
- Single Peltier cell
- b)
- Series
- c)
- Parallel
- d)
- Hybrid mode (series-parallel)
To verify if the single Peltier cell performance is consistent, the first test consisted in determining the output power of every single cell for the following operating conditions:

Table 1.
Operating conditions.
| Hot air temperature | Cold air temperature | Temperature gap | Cell efficiency |
|---|---|---|---|
| 45º C | 5º C | 40º C | 2.3% |
The results of the tests are:
Table 2.
Output power (W) of single Peltier cell.
| Cell 1 | Cell 2 | Cell 3 | Cell 4 |
|---|---|---|---|
| 21.101 | 20.924 | 21.032 | 20.964 |
Averaging the output power from the four cells we obtain a characteristic power of 21.005 W, which produces a deviation lower than 0.3%, which validates the consistency of the output power values.
The difference between the resulting output power from the tests and the referenced value from the manufacturer is due to the difference in the operating temperature and in the temperature gap between the hot and cold side of the cells.
Second group of tests corresponding to the series configuration produced the following results (Table 3):
Experimental results in Table 3 correspond to the direct values obtained from testing while theoretical data are the sum of the single values of each cell. Difference in values between experimental and theoretical results are due to electric losses because contact resistance, which produces an average deviation of 2.4%. Experimental average value of output power for the series configuration is of 40.951 W, what represents a reduction of 1.014 W as for the theoretical value.
Third group of tests is for the parallel configuration, which has given the results shown in Table 4.
We observe the parallel configuration produces similar results to those of the series set up, with an average value for the output power of 40.664 W, slightly lower than in the series configuration, and with an average deviation of 3.10% as for the theoretical values.
Difference between average values of the output power for the series and parallel configuration is only of 0.287 W (0.7%), which can be considered negligible; therefore, the two configurations can be used indistinctively.
The fourth and last group of tests has been developed under the hybrid mode, combining series and parallel configurations; the results of these tests are shown in Table 5.
Row S corresponds to the series configuration while P accounts for the parallel grouping of the series configuration.
It can be noticed the good matching between experimental and theoretical values for the hybrid mode except for the last configuration (1-4)+(2-3), where cells from upper and lower side have been grouped in a cross configuration; the lowering in the output power may be due to existing different thermal conditions from the two rows and columns in the set up configuration shown in Figure 4, since there is a temperature decay along the flow direction as well as an upwards thermal gradient.
Implementation
Prototype has been implemented in a commercial air conditioning unit to verify the feasibility of the system in real conditions. The prototype has been enlarged to achieve an output power that matches the energy consumption of the air conditioning system. The testing air conditioning unit is a MIRAGE model MACC1221L whose main characteristics are shown in Table 6.
Since the average effective output power of the tested prototype is 81.889 W, to match the required power by the commercial air conditioning unit we must enlarge the prototype 13.4 times, what means to insert a set of 54 cells. To minimize the space used by the enlarged prototype the hybrid mode grouping in parallel two sets of 27 cells in series is the most appropriate. The corresponding length and width of the enlarged prototype using this configuration is of 1.35 m x 0.1 m, which can be fitted in the ducts of a commercial air conditioning if the selected unit is of large size.
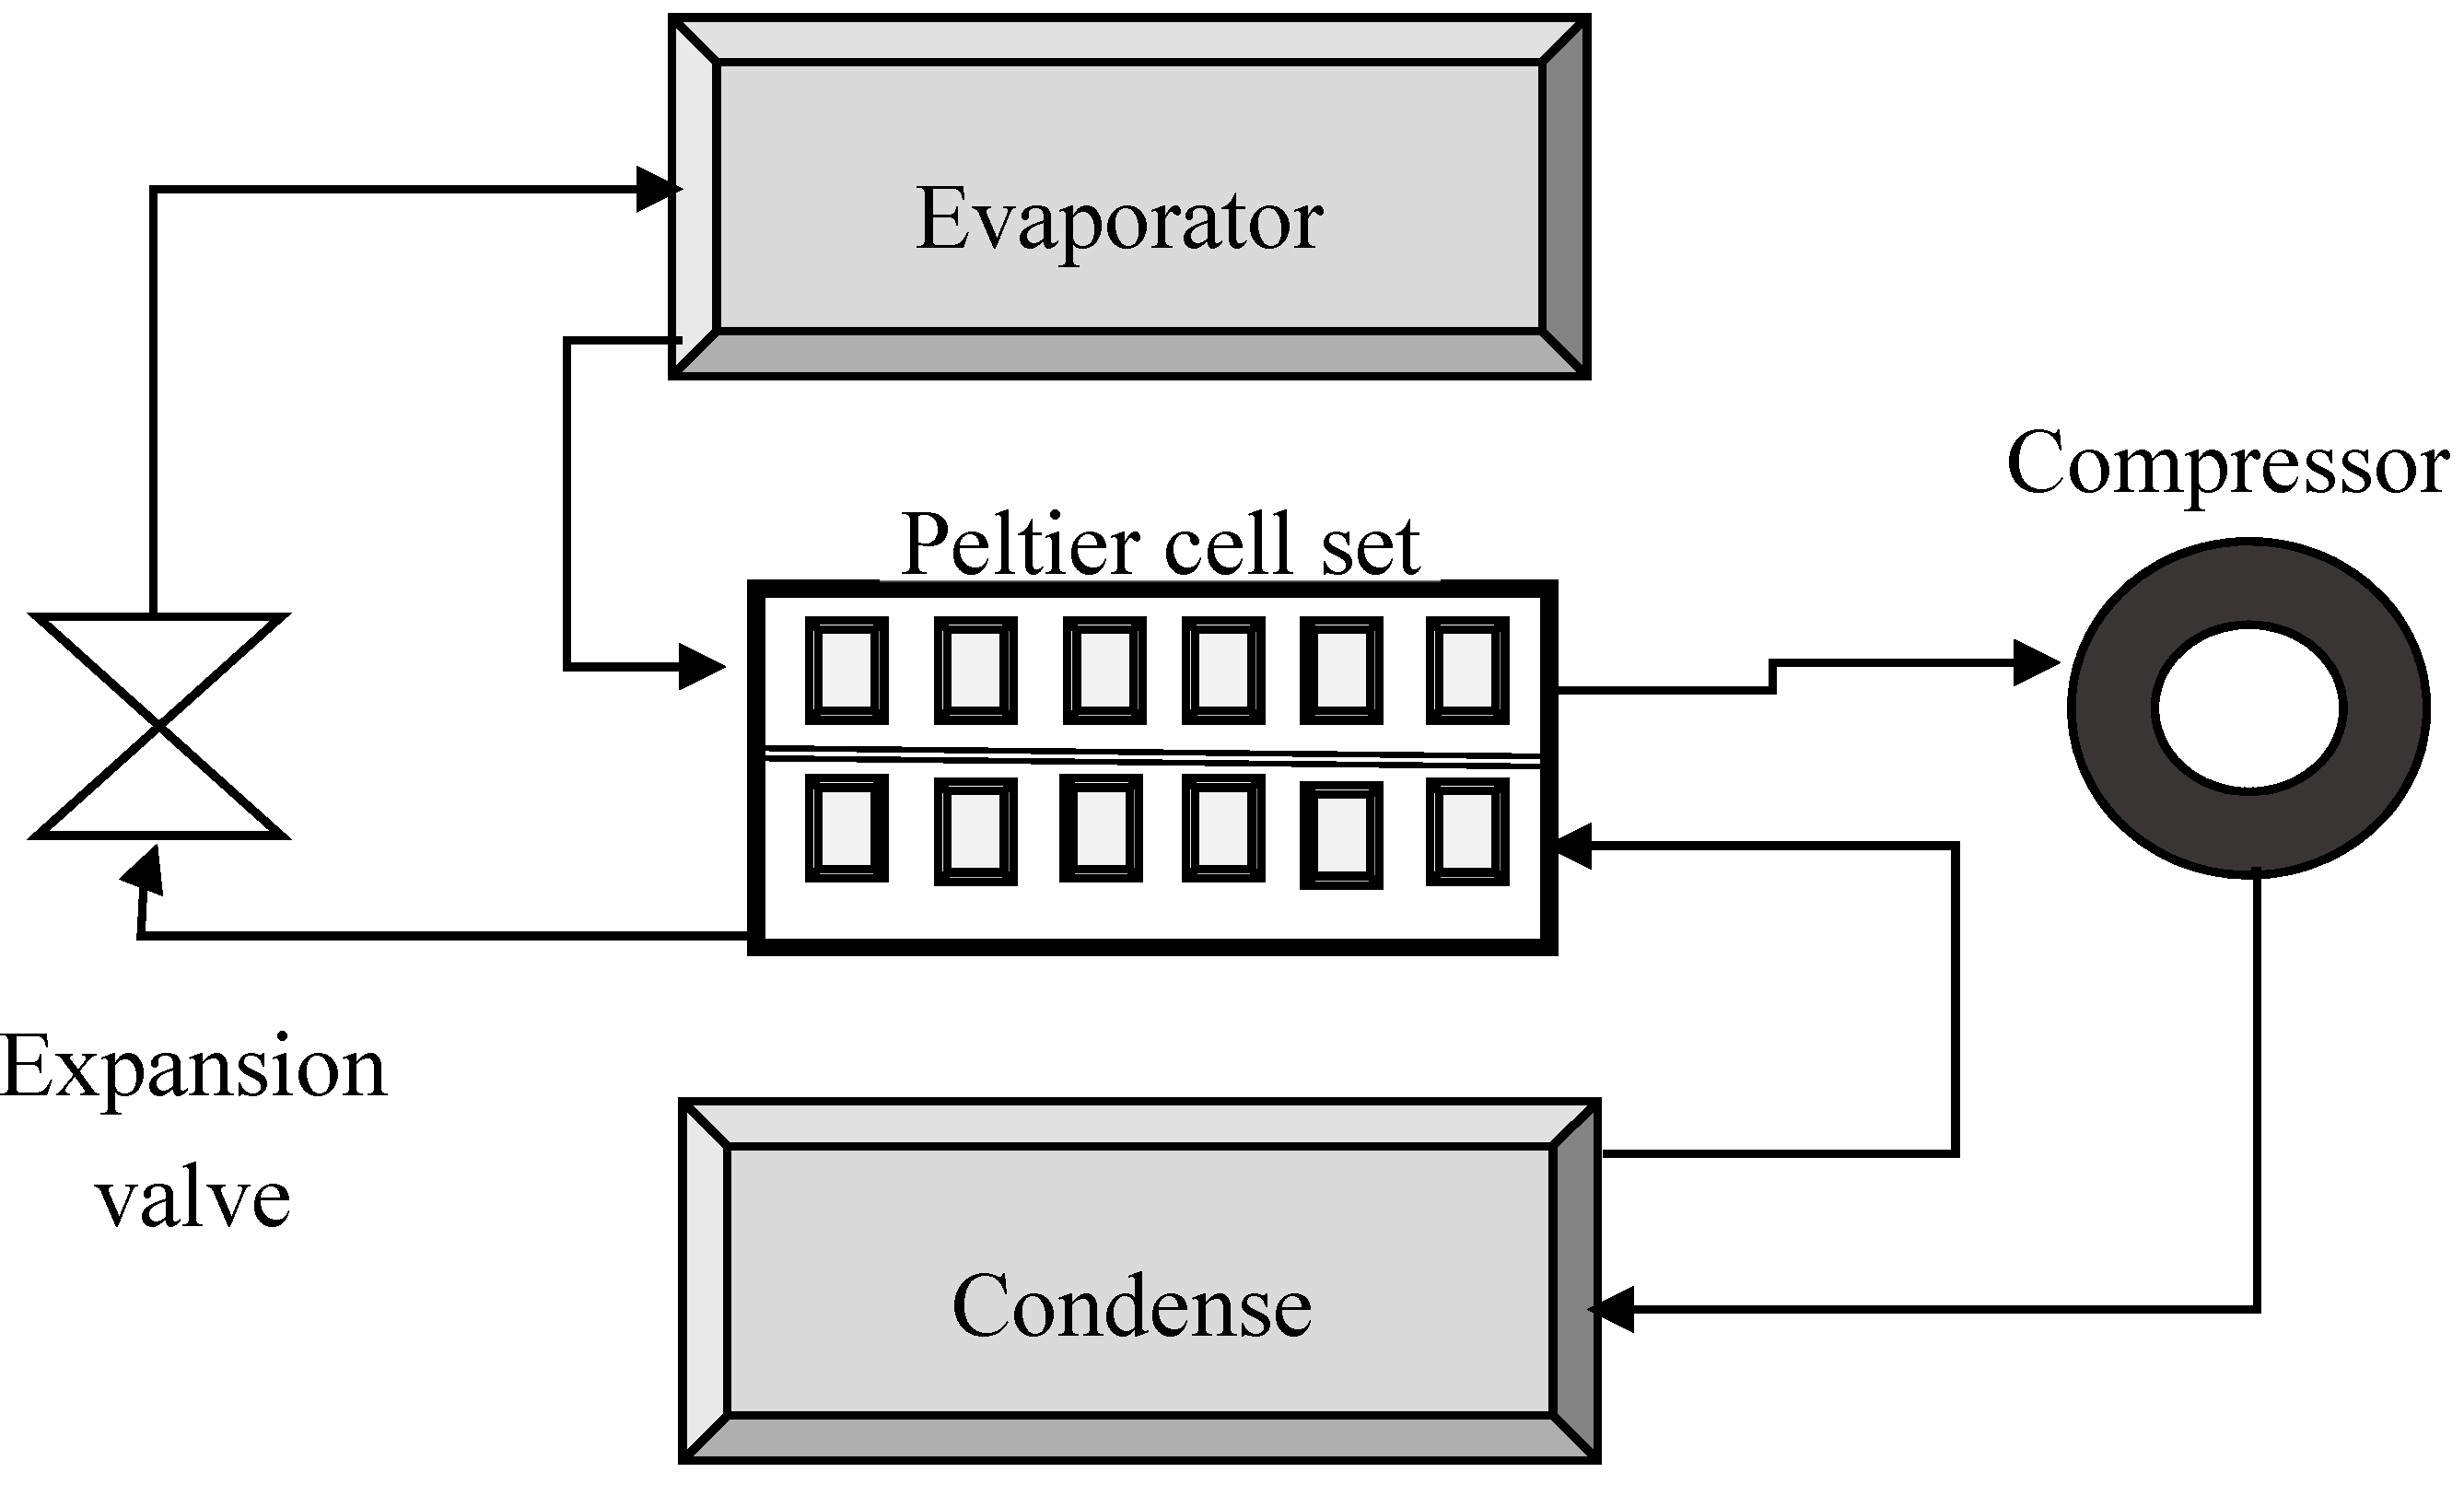
Because the commercial unit is a compact equipment, some modifications have been introduced in the layout of the unit to adapt the prototype; to this goal, the double chamber has been connected to the outlet of the evaporator and to the inlet of the condenser. In this way, the cold and hot air streams coming out from the evaporator and the condenser enter the cold and hot air chamber of the prototype (Figure 7).
Figure 7.
Schematic view of the layout of the commercial air conditioning unit with the attached Peltier cell system.
Figure 7.
Schematic view of the layout of the commercial air conditioning unit with the attached Peltier cell system.
The new device has been tested under similar thermal characteristics to those used in the previous tests. Outlet temperature at the evaporator and condenser were measured 43.8º C and 4.1º C, which produces a temperature gap of 39.7º C, almost identical to the one used in the experimental tests (40º C).
The selected unit, operating with the new layout, only has a maximum distance between the evaporator and the compressor of 1.1 m, which allows a maximum number of 22 cells in series. The number of parallel rows is kept at 2 since the ducts have 0.12 m of diameter.
The reduction in the number of cells in series also reduces the output power of the prototype, which will lower than the expected value to cover the power requirements of the air conditioning unit.
Output power from the Peltier cell set was of 0.876 kW, 79.6% of the expected value of 1.1 kW required by the air conditioning unit. The lack of prototype output power is not, however, a critical point, since the air conditioning unit can be refurbished enlarging the distance between evaporator and compressor so the required 27 cells in series could take place.
Conclusions
A new system, based on a Peltier cell configuration, has been designed and tested to generate electric energy from the thermal gradient produced by the hot and cold air streams in an air conditioning unit.
The new prototype has been verified through experimental tests in three types of cell configuration, series, parallel and hybrid mode (series-parallel). Series and parallel configuration have produced comparable results with minimum differences in the output power, which allows the use of any of the two configurations indistinctively. Hybrid mode has produced almost the double output power than series or parallel configuration when cells from the same row or column are connected; nevertheless, if a cross configuration is used, connecting cells from different rows or columns, a slight energy loss is detected.
Despite the Peltier cells operate at low efficiency, only 2.3%, the prototype is able to generate enough power to cover air conditioning requirements if the system has enough space to place the required number of cells in series between the evaporator and the compressor.
The enlarged prototype has covered almost 80% of the required power by the selected air conditioning unit; the lack of power has been due to a reduced distance between evaporator and compressor in the tested unit. The proposed configuration can be easily adapted with minimum changes to obtain a factor coverage of 100%.
The tested Peltier cell set up has proven its feasibility of being adapted to air conditioning units of low capacity, around 3.5 kWh, but it can also be adapted to larger units by simply enlarging the size of the Peltier cell system, increasing the number of cells in series or in parallel.
The proposed system reveals as a sustainable power unit to operate at moderate power requirements in air conditioning systems, reducing the dependence of external sources, and limiting the consumption of electric energy from the grid.
References
- Junior, O. A. , Maran, A. L. O., & Henao, N. C. A review of the development and applications of thermoelectric microgenerators for energy harvesting. Renewable and Sustainable Energy Reviews 2018, 91, 376–393. [Google Scholar] [CrossRef]
- Zhu, B. , Chen, Q., Jiang, S., Holt, M., Zhu, W., Akinwande, D., & Tao, L. Thermoelectric effect and devices on IVA and VA Xenes. InfoMat 2021, 3, 271–292. [Google Scholar] [CrossRef]
- Jangonda, C. , Patil, K., Kinikar, A., Bhokare, R., & Gavali, M. D. Review of various application of thermoelectric module. Intl. J. Innovative Research in Science, Engineering and Technology 2016, 5, 3393. [Google Scholar] [CrossRef]
- Goldsmid, H. J. Application of the transverse thermoelectric effects. Journal of electronic materials 2011, 40, 1254–1259. [Google Scholar] [CrossRef]
- Srivastava, R. S. , Kumar, A., Sharma, S., Thakur, H., Patel, S., & Vaish, R. Development and applications of thermoelectric based dehumidifiers. Energy and Buildings 2021, 252, 111446. [Google Scholar] [CrossRef]
- Yang, J. , & Stabler, F. R. Automotive applications of thermoelectric materials. Journal of electronic materials 2009, 38, 1245. [Google Scholar] [CrossRef]
- Yang, J. (2005, June). Potential applications of thermoelectric waste heat recovery in the automotive industry. In ICT 2005. 24th International Conference on Thermoelectrics, 2005. (pp. 170-174). IEEE.
- Yiwei, C. U. I. , & Ya, W. E. I. A review of thermoelectric effect of cement-based composites: Mechanism, material, factor and application. Journal of Composite Materials 2020, 37, 2077–2093. [Google Scholar] [CrossRef]
- Newman, J. Thermoelectric effects in electrochemical systems. Industrial & engineering chemistry research 1995, 34, 3208–3216. [Google Scholar] [CrossRef]
- Leephakpreeda, T. Applications of thermoelectric modules on heat flow detection. ISA transactions 2012, 51, 345–350. [Google Scholar] [CrossRef]
- Rebenklau, L. , Gierth, P., Paproth, A., Irrgang, K., Lippmann, L., Wodtke, A.,... & Bechtold, F. (2015, September). Temperature sensors based on thermoelectric effect. In 2015 European Microelectronics Packaging Conference (EMPC) (pp. 1-5). IEEE.
- Sharma, S. , Dwivedi, V. K., & Pandit, S. N. A review of thermoelectric devices for cooling applications. International journal of green energy 2014, 11, 899–909. [Google Scholar] [CrossRef]
- Guo, D. , Sheng, Q., Dou, X., Wang, Z., Xie, L., & Yang, B. Application of thermoelectric cooler in temperature control system of space science experiment. Applied Thermal Engineering 2020, 168, 114888. [Google Scholar] [CrossRef]
- Miner, A. , Majumdar, A., & Ghoshal, U. (1999, November). Thermo-electro-mechanical refrigeration based on transient thermoelectric effects. In ASME International Mechanical Engineering Congress and Exposition (Vol. 16509, pp. 69–74). American Society of Mechanical Engineers.
- Pourkiaei, S. M. , Ahmadi, M. H., Sadeghzadeh, M., Moosavi, S., Pourfayaz, F., Chen, L.,... & Kumar, R. Thermoelectric cooler and thermoelectric generator devices: A review of present and potential applications, modeling and materials. Energy 2019, 186, 115849. [Google Scholar] [CrossRef]
- Moria, H. , Ahmed, M., Alghanmi, A., Mohamad, T. I., & Yaakob, Y. Experimental study of solar based refrigerator using thermoelectric effect. Energy Procedia 2019, 158, 198–203. [Google Scholar] [CrossRef]
- Yildiz, F. , & Coogler, K. L. (2014, June). Low-Power Energy Harvesting with a Thermoelectric Generator through an Air Conditioning Condenser. In 2014 ASEE Annual Conference & Exposition (pp. 24-877).
- Shen, L. , Xiao, F., Chen, H., & Wang, S. Investigation of a novel thermoelectric radiant air-conditioning system. Energy and buildings 2013, 59, 123–132. [Google Scholar] [CrossRef]
- Shafiei, N. , Harun, M. H., Annuar, K. A. M., Halim, M. F. A., Aras, M. S. M., & Azahar, A. H. Development of portable air conditioning system using peltier and seebeck effect. Journal of Telecommunication, Electronic and Computer Engineering (JTEC) 2016, 8, 97–100. [Google Scholar]
- Qi, Z. Advances on air conditioning and heat pump system in electric vehicles–A review. Renewable and Sustainable Energy Reviews 2014, 38, 754–764. [Google Scholar] [CrossRef]
- Benziger, B. , Anu Nair, P., & Balakrishnan, P. Review paper on thermoelectric airconditioner using peltier modules. IJME 2015, 4. [Google Scholar]
- Stecanella, P. A. , Faria, M. A., Domingues, E. G., Gomes, P. H., Calixto, W. P., & Alves, A. J. (2015, June). Eletricity generation using thermoelectric generator-TEG. In 2015 IEEE 15th International Conference on Environment and Electrical Engineering (EEEIC) (pp. 2104-2108). IEEE.
- Jouhara, H. , Żabnieńska-Góra, A., Khordehgah, N., Doraghi, Q., Ahmad, L., Norman, L.,... & Dai, S. Thermoelectric generator (TEG) technologies and applications. International Journal of Thermofluids 2021, 9, 100063. [Google Scholar] [CrossRef]
- Qasim, M. A. , Velkin, V. I., & Hassan, A. K. Seebeck Generators and Their Performance in Generating Electricity. K. Seebeck Generators and Their Performance in Generating Electricity. Journal of Operation and Automation in Power Engineering 2022. [Google Scholar]
- Kok, S. Kok S. Ong, Liben Jiang, Koon C. Lai,4.20 Thermoelectric Energy Conversion, Editor(s): Ibrahim Dincer, Comprehensive Energy Systems, Elsevier, 2018, Pages 794-815, ISBN 9780128149256. [CrossRef]
- Drebushchak, V. A. The peltier effect. Journal of Thermal Analysis and Calorimetry 2008, 91, 311–315. [Google Scholar] [CrossRef]
- Goldsmid, H. J. (2017). The seebeck and peltier effects. In The Physics of Thermoelectric Energy Conversion. Morgan & Claypool Publishers.
- Energy conversion devices. Peltier modules [Thermoelectric modules]. Basic structure. KYOCERA Global. Peltier module (Thermoelectric module) - Energy Conversion Devices - KYOCERA [Accessed online: 22/12/2022].
- Thomson, W. 4. on a mechanical theory of thermo-electric currents. Proceedings of the Royal society of Edinburgh 1857, 3, 91–98. [Google Scholar] [CrossRef]
- Lodge, O. J. XX. On the seat of the electromotive forces in the voltaic cell: To the editors of the Philosophical Magazine and Journal. The London, Edinburgh, and Dublin Philosophical Magazine and Journal of Science 1885, 19, 153–190. [Google Scholar] [CrossRef]
- Lampinen, M. J. Thermodynamic analysis of thermoelectric generator. Journal of applied physics 1991, 69, 4318–4323. [Google Scholar] [CrossRef]
- Caswell, A. E. Determination of Peltier Electromotive Force for Several Metals by Compensation Methods. Physical Review (Series I) 1911, 33, 379. [Google Scholar] [CrossRef]
- Amezawa, K. , Yamamoto, N., Tomii, Y., & Ito, Y. Thermodynamic Properties and Single-Electrode Peltier Heats of a Li-Al Alloy in a LiCl-KCl Eutectic Melt. Journal of The Electrochemical Society 1999, 146, 1069. [Google Scholar]
- Wittrock, H. J. (1949). The Electromotive Force and Current Density of the Copper-copper Sulfate Thermocell. University of Wisconsin--Madison.
- Hansen, E. M. , Egner, E., & Kjelstrup, S. Peltier effects in electrode carbon. Metallurgical and Materials Transactions B 1998, 29, 69–76. [Google Scholar]
- Chukwu, G. U. Thermoelectric Study of Peltier Effect Using Cu-Fe, Pb-Fe and Cu-Constantan Couples. International Journal of Innovative Scientific & Engineering Technologies Research 2016, 4, 1–12. [Google Scholar]
- Freire, L. O. , Navarrete, L. M., Corrales, B. P., & Castillo, J. N. Efficiency in thermoelectric generators based on Peltier cells. Energy Reports 2021, 7, 355–361. [Google Scholar] [CrossRef]
- Mannella, G. A. , La Carrubba, V., & Brucato, V. Peltier cells as temperature control elements: Experimental characterization and modeling. Applied thermal engineering 2014, 63, 234–245. [Google Scholar] [CrossRef]
- Mardini-Bovea, J. , Torres-Díaz, G., Sabau, M., De-la-Hoz-Franco, E., Niño-Moreno, J., & Pacheco-Torres, P. J. A review to refrigeration with thermoelectric energy based on the Peltier effect. Dyna 2019, 86, 9–18. [Google Scholar] [CrossRef]
- Altenkirch, EÜber den nutzeffekt der thermosäule. Physikalische Zeitschrift 1909, 10, 12.
- Rodríguez, J.E., 2010. La recuperación termoelectrica del calor residual, una fuente de energia ambientalmente amigable. MOMENTO, (41), pp.1-23.
- Chen, Z.G. , Han, G., Yang, L., Cheng, L. and Zou, JNanostructured thermoelectric materials: Current research and future challenge. Progress in Natural Science: Materials International 2012, 22, 535–549. [Google Scholar] [CrossRef]
- Champier, DThermoelectric generators: A review of applications. Energy Conversion and Management 2017, 140, 167–181. [CrossRef]
- Perry’s Chemical Engineer’s Handbook. 9th edition. Don W. Green and Marylee Z. Southard (Ed’s). Ed. McGraw-Hill. ISBN-10: 0071834087, ISBN-13: 978-007183408.
- TEC1-12710 Datasheet (PDF) - HB Electronic Components. https:// pdf1.alldatasheet.com/datasheet-pdf/view/313843/HB/TEC1-12710.
- Coeficientes de convección en paredes de edificios (Convection coefficients in building walls). Curso Calor Apuntes y Cálculos (Heat Course Notes and Calculations). Aula Digital (Digital Classroom). Coeficientes de Conveccion en Paredes de Edificios - Calor Apuntes y Calculos (google.com) [Accessed online: 24/12/2022].
- Yunus A. Çengel and Afshin J. Ghajar. Heat and Mass Transfer. Fundamentals and Applications. Fifth Edition. Ed. McGraw-Hill. ISBN / EAN: 9789814595278.
- Mirage. Aire Acondicionado. Modelo de Ventana. De Ventana (mirage.mx) [Accessed online: 27/12/2022].
Figure 1.
Characteristic values of the most relevant parameters of a Peltier cell [41].
Figure 1.
Characteristic values of the most relevant parameters of a Peltier cell [41].
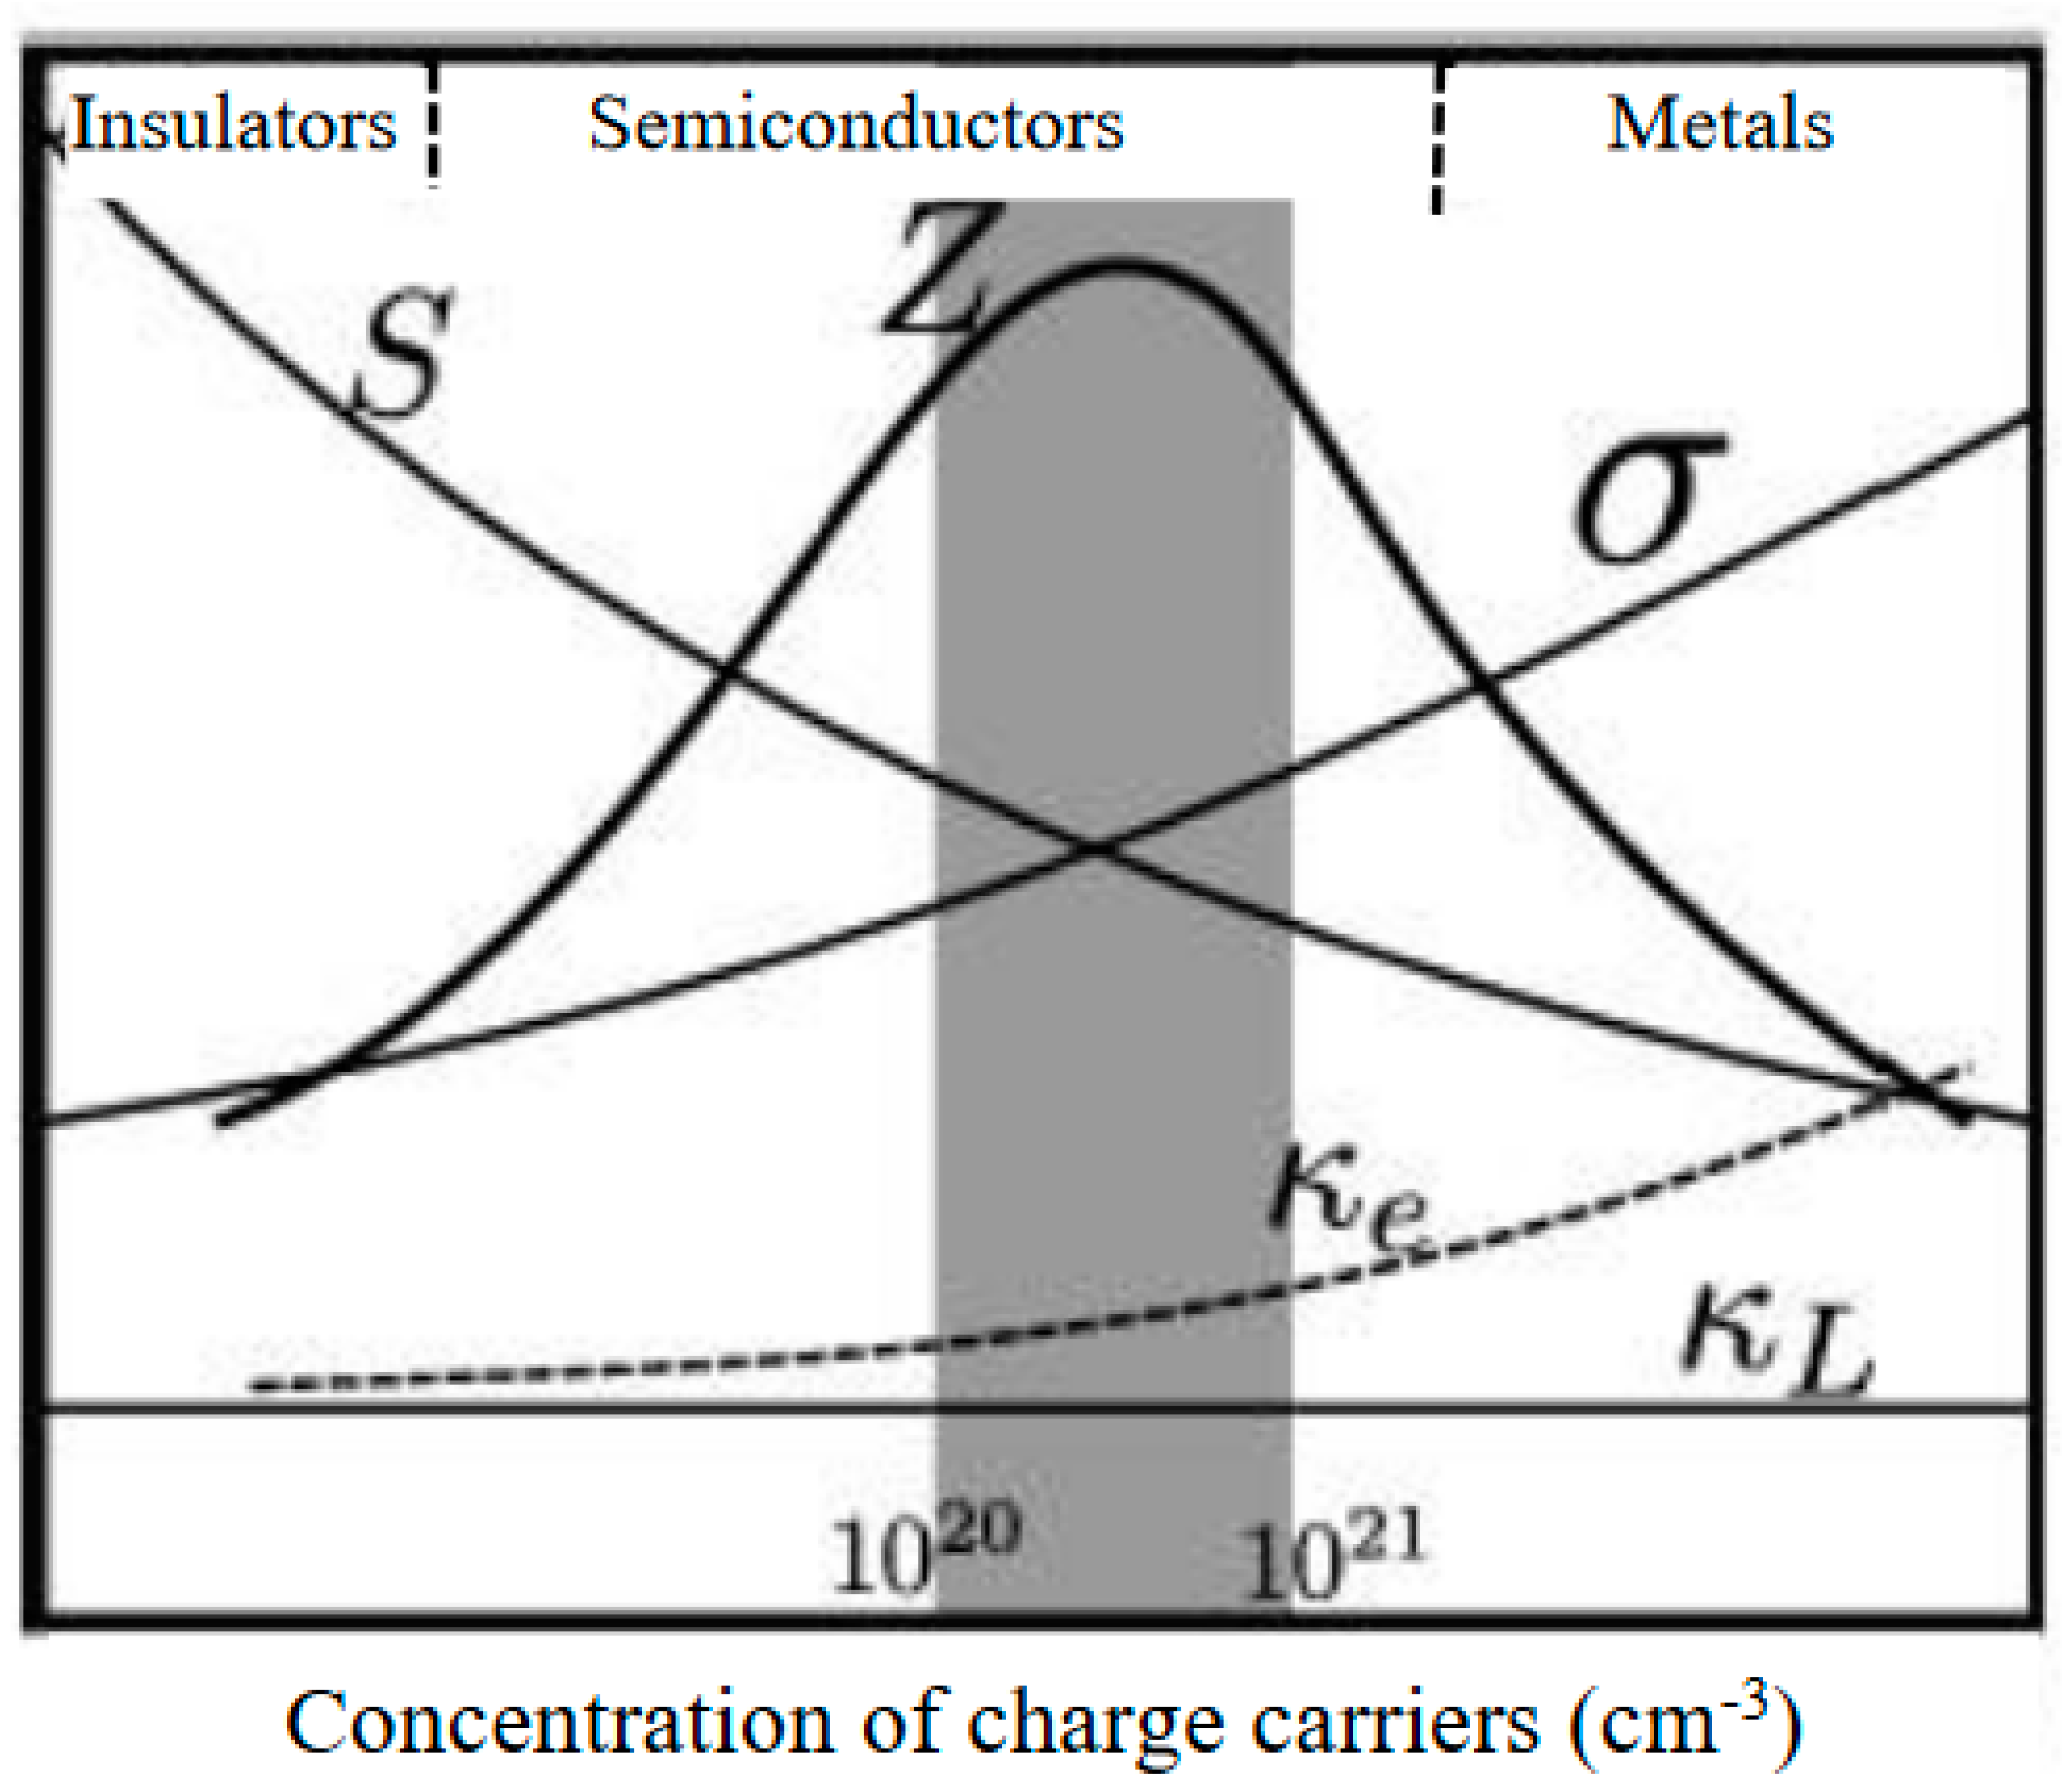
Figure 2.
Typical values of the figure of merit and characteristic parameters for different type of materials and combinations used in the making up of Peltier cells [42].
Figure 2.
Typical values of the figure of merit and characteristic parameters for different type of materials and combinations used in the making up of Peltier cells [42].
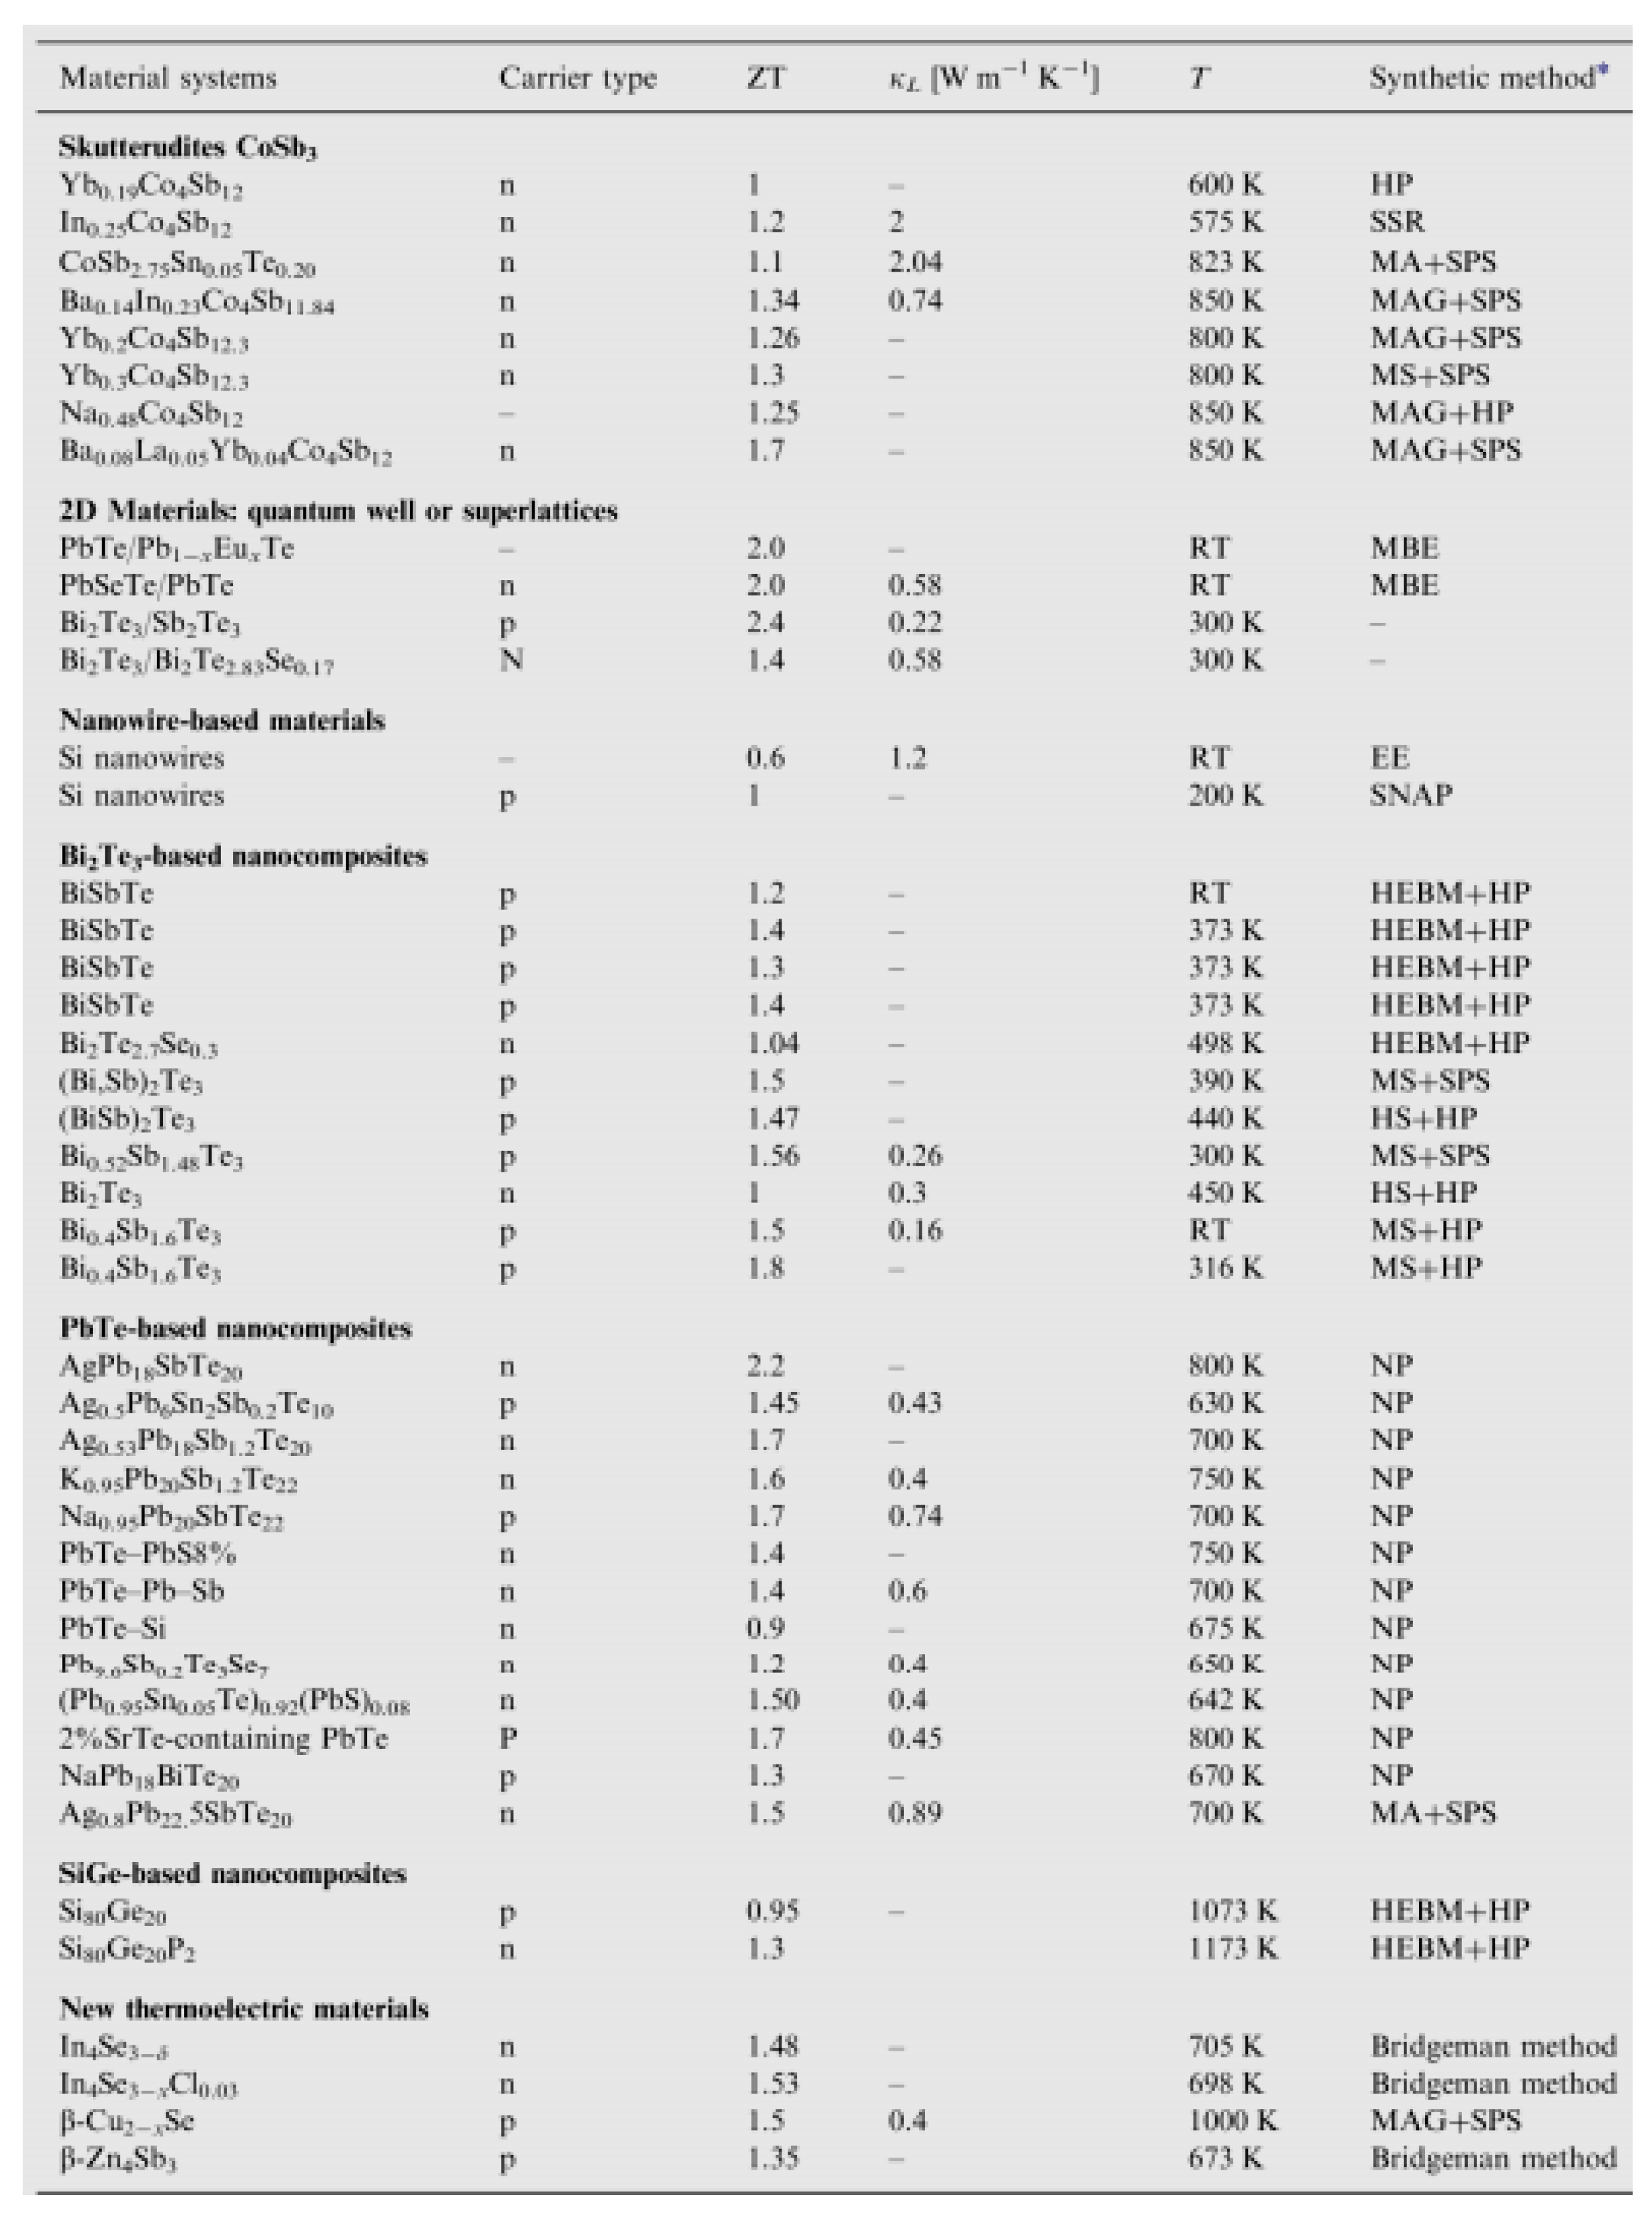
Figure 3.
Simulation results of the efficiency of a Peltier cell as a function of the temperature gap for different values of the figure of merit.
Figure 3.
Simulation results of the efficiency of a Peltier cell as a function of the temperature gap for different values of the figure of merit.
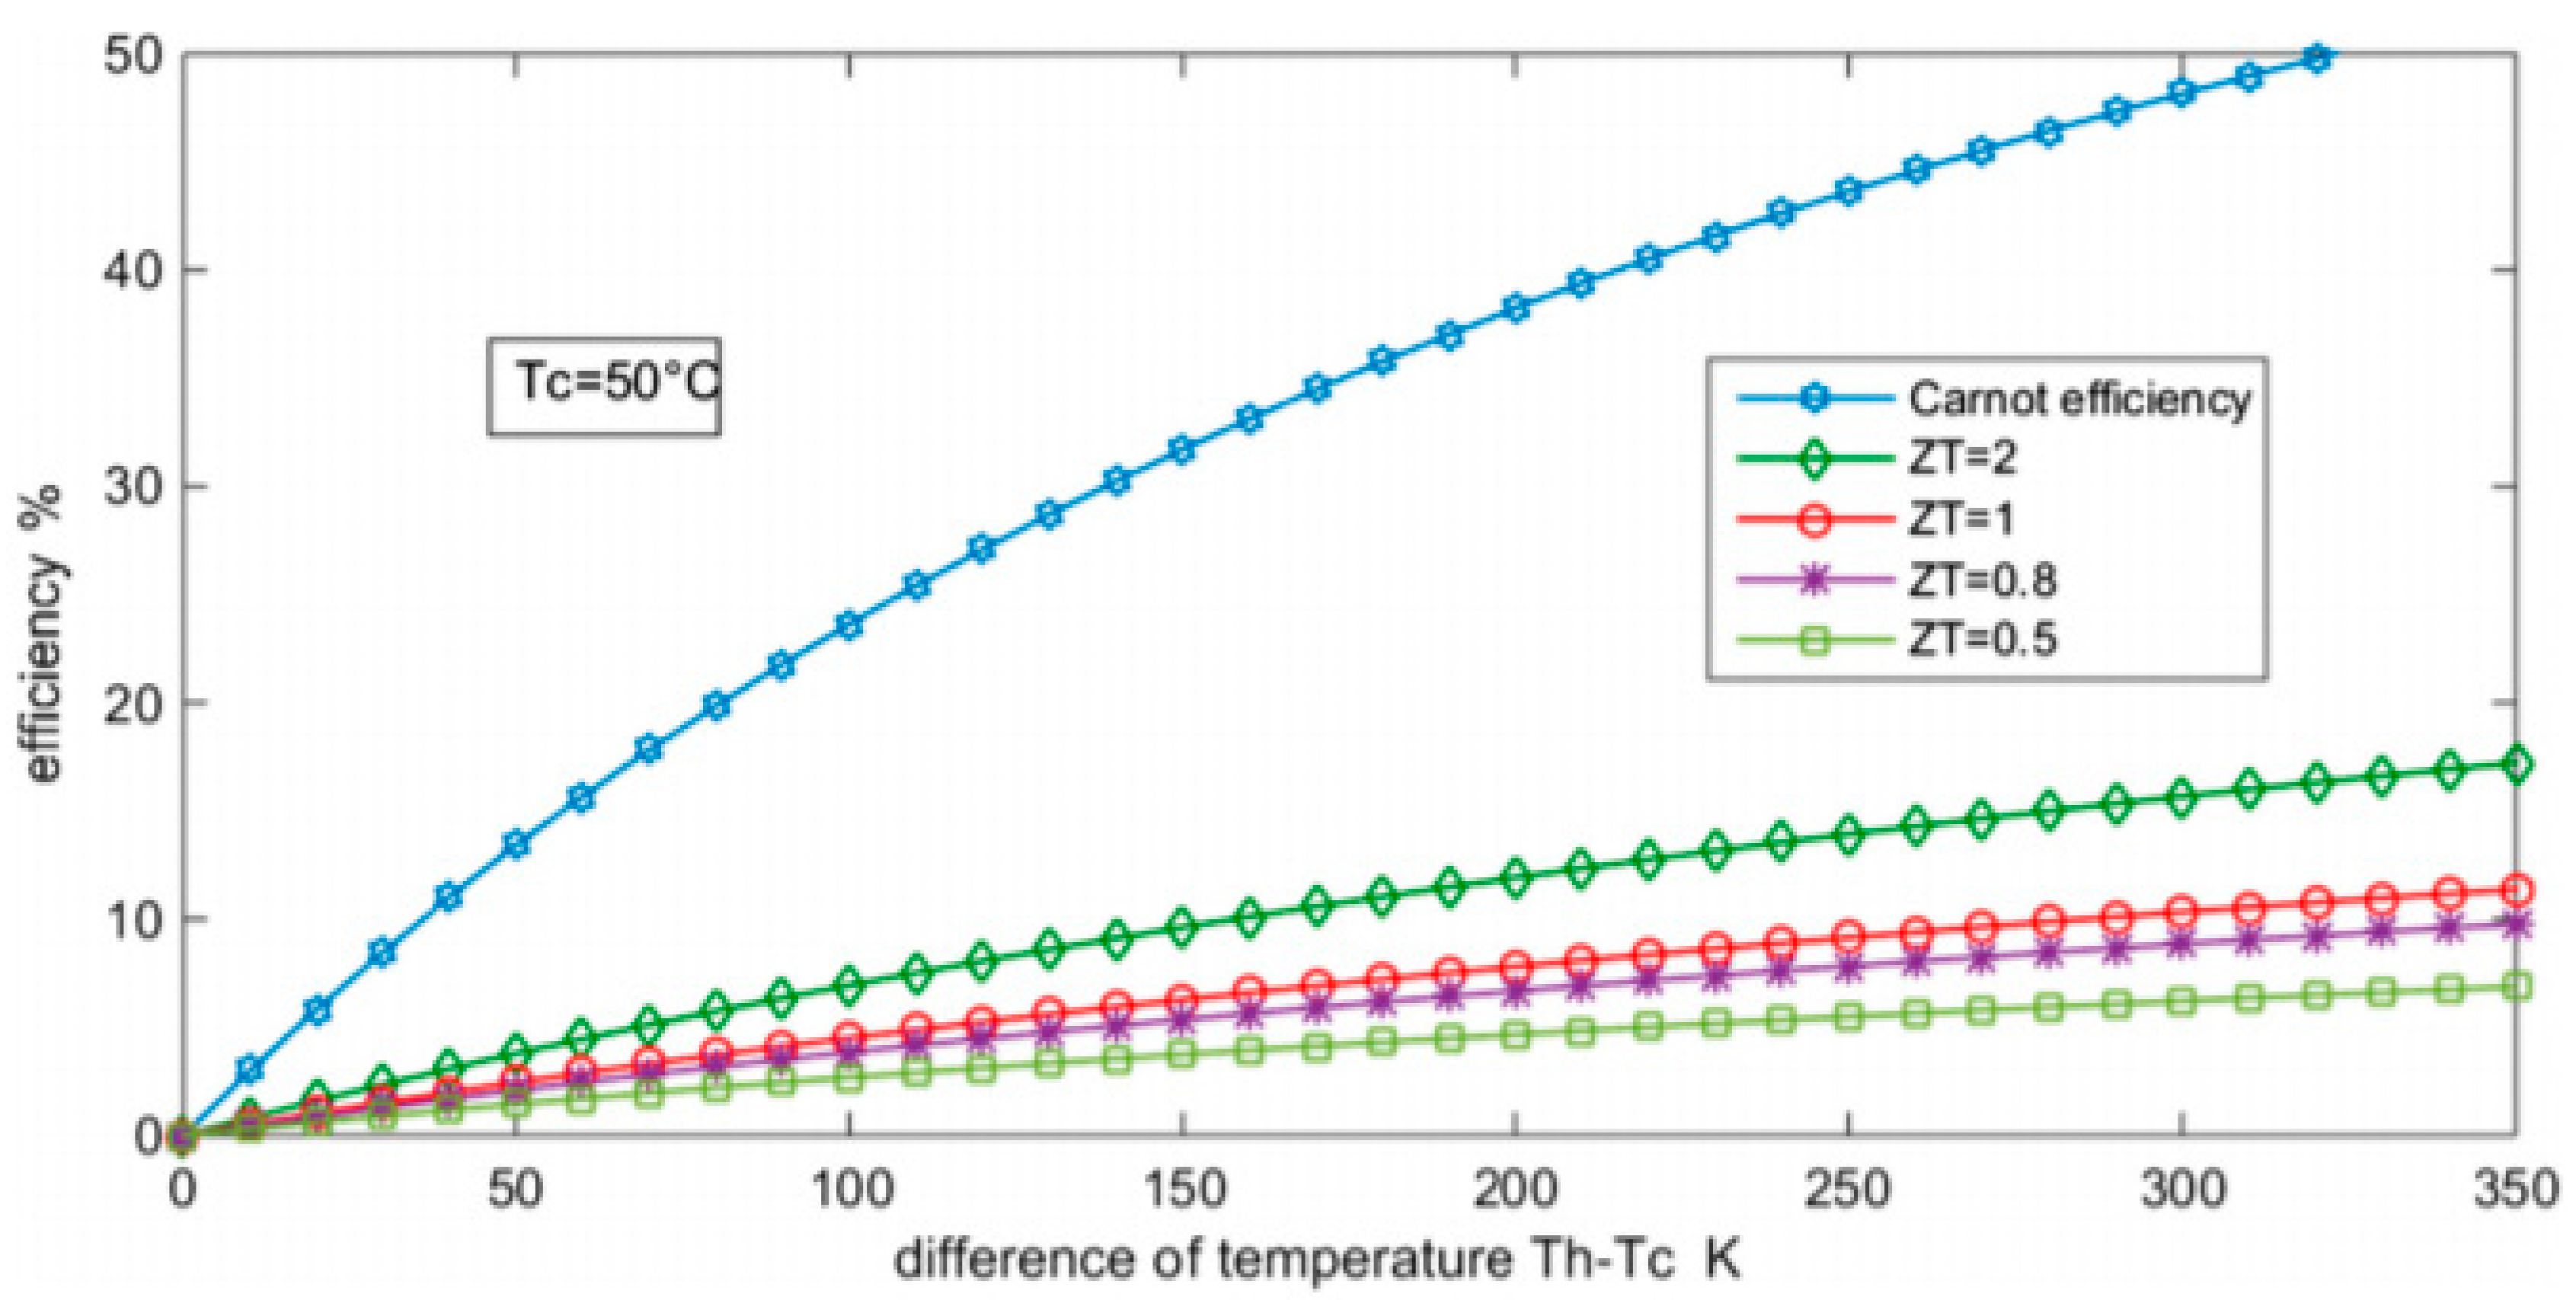
Figure 5.
Schematic representation of the Peltier cell system for testing.
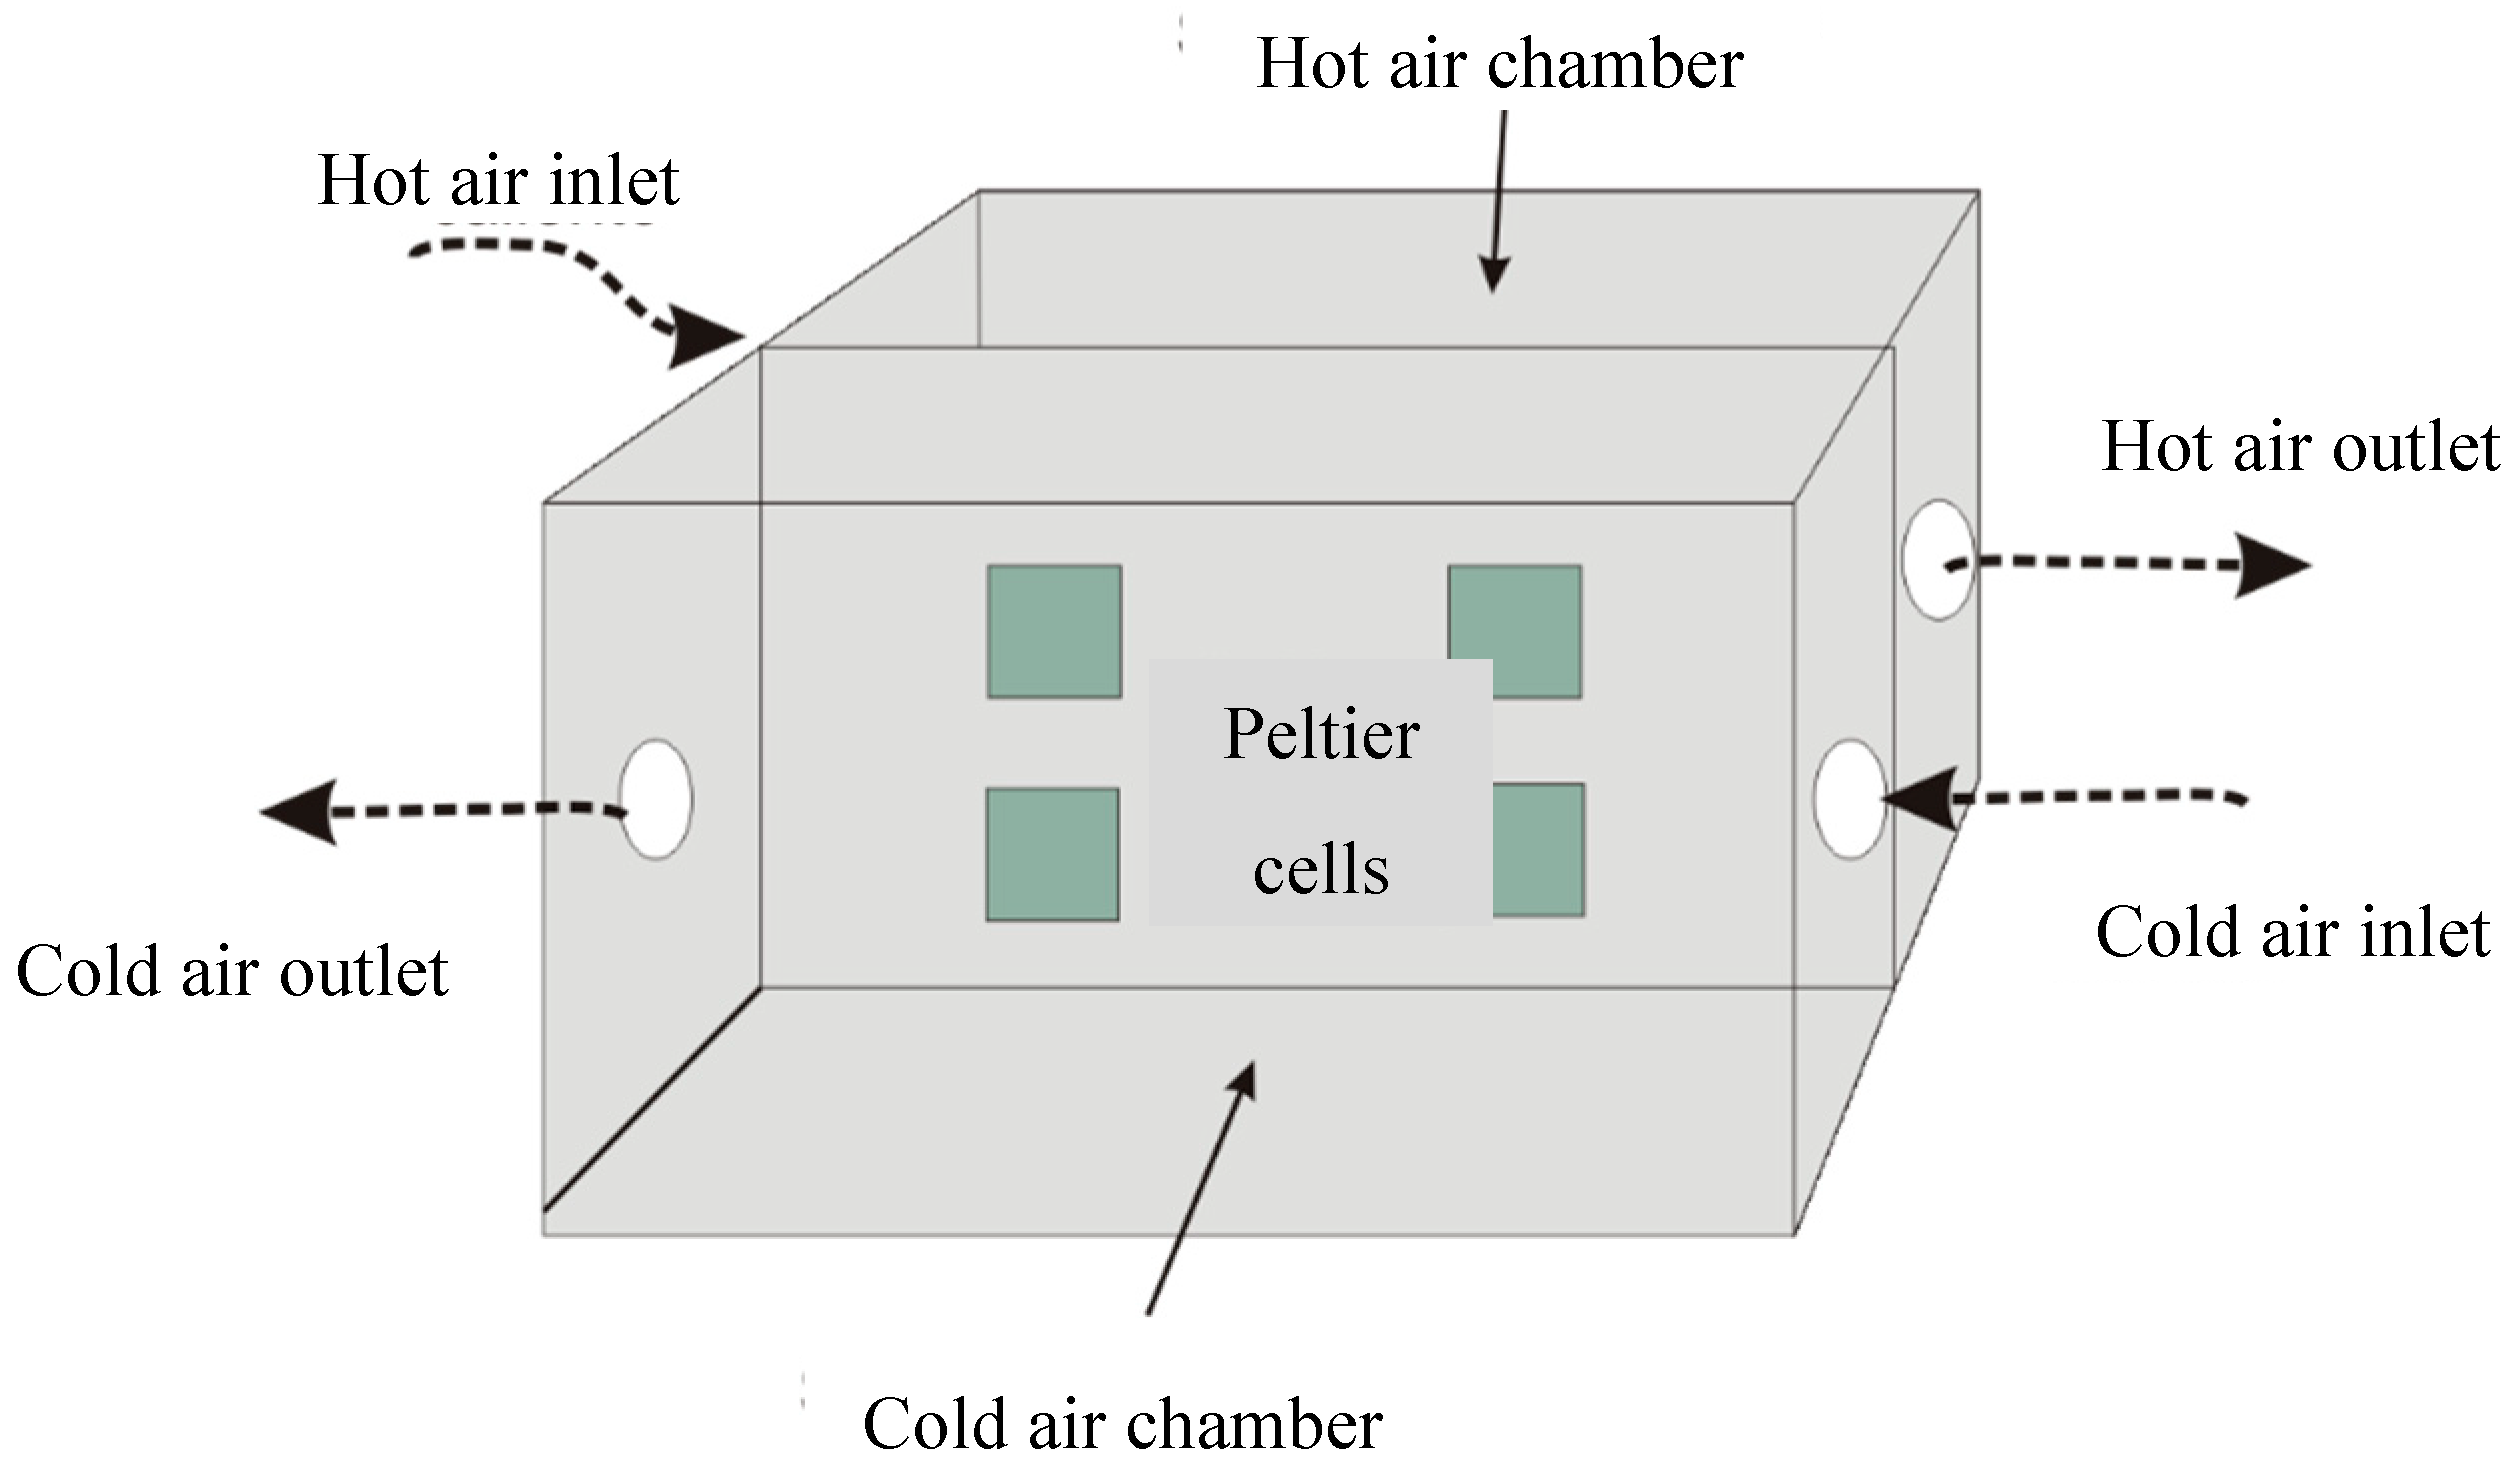
Table 3.
Output power (W) for the series configuration.
| Config. | 1-2 | 1-3 | 1-4 | 2-3 | 2-4 | 3-4 |
| Exp. | 40.929 | 40.949 | 40.968 | 40.949 | 40.883 | 40.988 |
| Theor. | 41.935 | 42.042 | 41.975 | 41.956 | 41.889 | 41.996 |
| Dev.(%) | 2.31 | 2.60 | 2.40 | 2.40 | 2.40 | 2.40 |
Table 4.
Output power (W) for the parallel configuration.
| Config. | 1-2 | 1-3 | 1-4 | 2-3 | 2-4 | 3-4 |
| Exp. | 40.886 | 40.697 | 40.674 | 40.865 | 40.799 | 40.946 |
| Theor. | 41.935 | 42.042 | 41.975 | 41.956 | 41.889 | 41.996 |
| Dev.(%) | 2.50 | 3.20 | 3.10 | 2.60 | 2.60 | 2.50 |
Table 5.
Output power (W) for the hybrid mode.
| Config. | S | 1-3 | 2-4 | 1-2 | 3-4 | 1-4 | 2-3 |
| P | (1-3)+(2-4) | (1-2)+(3-4) | (1-4)+(2-3) | ||||
| Exp. | 81.749 | 81.413 | 79.819 | ||||
| Theor. | 81.833 | 81.917 | 81.917 | ||||
| Dev.(%) | 0.1 | 0.6 | 2.6 | ||||
Table 6.
Characteristics of the air conditioning unit [48].
Table 6.
Characteristics of the air conditioning unit [48].
| Refrigerant | Voltage (V) | Capacity (Btu/h) (kWh) | Electric consumption (kW) | COP |
|---|---|---|---|---|
| R410a | 220 | 12000/3.517 | 1.1 | 3.197 |
Disclaimer/Publisher’s Note: The statements, opinions and data contained in all publications are solely those of the individual author(s) and contributor(s) and not of MDPI and/or the editor(s). MDPI and/or the editor(s) disclaim responsibility for any injury to people or property resulting from any ideas, methods, instructions or products referred to in the content. |
© 2023 by the authors. Licensee MDPI, Basel, Switzerland. This article is an open access article distributed under the terms and conditions of the Creative Commons Attribution (CC BY) license (http://creativecommons.org/licenses/by/4.0/).
Copyright: This open access article is published under a Creative Commons CC BY 4.0 license, which permit the free download, distribution, and reuse, provided that the author and preprint are cited in any reuse.


