Submitted:
16 December 2023
Posted:
21 December 2023
You are already at the latest version
Abstract
In the context of inclusive education, digitalization in higher education is designed to promote the ideals of cultural diversity, social inclusivity, and sustainable development through technological means. This study explores the strategies and practices of digitalization in achieving inclusive education goals in higher education, aiming to provide theoretical and empirical foundations for education policymakers, teachers, and technology developers. This study adopts a mixed-methods research design, combining quantitative and qualitative data analysis to assess the current state of digitalization in higher education from various perspectives, particularly its effectiveness in advancing educational inclusivity. Through surveys, in-depth interviews, and case studies, data were collected from teachers, students, and administrative personnel to reveal opportunities and challenges in digital education resources and practices. The results show that while digitalization has improved the accessibility of educational resources, facilitated information sharing and cultural exchange, there are still numerous challenges, such as unequal technology access, insufficient cultural sensitivity in content, and issues related to the depth and quality of online interactions. Furthermore, the study identifies key factors supporting inclusive education, including cross-cultural curriculum design, teacher professional development, and students' critical use of digital tools. Finally, the paper presents a series of strategic recommendations, including the development of multicultural education platforms, strengthening teacher training, and building an inclusive digital environment. These recommendations aim to promote a more coordinated and inclusive higher education digital ecosystem that emphasizes not only technological innovation but also humanistic care and social responsibility. Through these measures, digitalization in higher education can better serve individual growth and comprehensive societal development.
Keywords:
Symbiotic Education
; Higher Education
; Digitalization
; Cultural Diversity
; Sustainability
1. Introduction
In an era shaped by the confluence of globalization and the digital revolution, the world is witnessing unprecedented levels of cultural exchange and dissemination of knowledge. As international exchanges become increasingly frequent, higher education systems are faced with the challenge of adapting to multiculturalism, diverse values, and their interplay. Against this backdrop, the concept of symbiotic education has emerged and gradually become a focal point in the realm of education.
1.1. The Meaning of Symbiosis
It is generally believed that the concept of symbiosis in the humanities and social sciences has been adapted from biology, where it originally referred to the cohabitation of two species, evolving later into a respect for and mutual coexistence among different entities within human society. Biological symbiosis, or cohabitation, emphasizes physiological and behavioral connections between different species without necessitating mutual benefit; thus, parasitism is also a form of symbiosis. In contrast, symbiosis in the humanities and social sciences leans towards coexistence, focusing on the equality and mutual benefit of diverse entities rather than unidirectional benefit. This form of symbiosis is not merely biological but implies a duality that can denote oppression as well as mutual assistance.
1.2. The Concept of Symbiotic Education Symbiotic
Education refers to the process of cultivating students’ ability to understand, respect, and appreciate different cultures in a multicultural context, thereby promoting harmonious coexistence among people of diverse cultural backgrounds. Symbiotic education reflects a new trend in the evolution of international education. In the 1970s, UNESCO defined the purpose of education in “Learning to Be” as “combining the elements of a person in physical, intellectual, emotional, and ethical aspects to become a complete person.” Entering the 21st century, UNESCO’s “Rethinking Education: Towards a global common good?” expanded the dimension of “learning to live together,” extending from the social and cultural aspects of human interaction to the relationship between humanity and the natural environment. In 2020, UNESCO, from the perspective of sustaining the viability of humanity and the planet, advocated for “learning to coexist with the world.”
Symbiotic education involves several aspects: In terms of multicultural understanding, it entails teaching students about the history, culture, arts, and social customs of different countries and regions. It analyzes the barriers to communication and understanding brought about by cultural differences and explores how to overcome them; in language education, it encourages the learning of a second language or foreign language, enhancing understanding and communication with other cultures; in respect and inclusiveness, it fosters respect for individuals of different races, genders, religions, and cultural backgrounds. Students are taught to identify and oppose unfair phenomena such as racism and gender discrimination; in exchange and interaction, students are encouraged to communicate and cooperate with peers from different cultural backgrounds. International exchange programs, such as student exchanges and cultural festivals, are organized; in critical thinking, students are cultivated to analyze and evaluate different cultural perspectives. Discussions on cultural relativism and universal values, and their impact on society and policy are encouraged; in symbiotic practice, the concept of symbiosis is translated into action through community service and participation. Exploring and implementing sustainable lifestyles promotes harmonious coexistence with the natural environment; in educational policy and curriculum development, the concepts of multiculturalism and symbiosis are integrated into the curriculum. Corresponding educational policies are formulated to support and encourage cultural diversity; in faculty training and development, teachers are provided with training on multicultural and symbiotic education. Teachers are supported in applying multicultural teaching methods and materials in educational practice.
When implementing cultural and symbiotic education, it is important to note that this is not solely the task of school education but requires the joint efforts of families, communities, and the entire society. Through such education, dialogue and understanding between different cultures can be promoted, building a more harmonious and inclusive society.
1.3. The Relationship Between Symbiotic Education and the Digitalization of Higher Education
Symbiotic education not only focuses on creating an environment for students from different cultural backgrounds to learn and live together but also emphasizes the diversity of knowledge, mutual respect and learning from different cultures, and the harmonious development of ecosystems. It advocates for dialogue and coexistence among different cultures on the basis of mutual respect and equal exchange, thereby achieving the common prosperity of knowledge and culture.
However, the realization of the symbiotic education concept is inseparable from the support of modern information technology, especially in the field of higher education. Digitalization has become a significant force driving educational innovation, extending the reach of educational resources through the internet, cloud computing, big data, and other technological means, and providing a platform for educational participants from different cultural backgrounds to communicate and coexist.
Currently, the digitalization of higher education presents a diverse development trend. On the one hand, the application of digital technology has enriched educational resources and diversified teaching methods; on the other hand, the issue of the digital divide is becoming increasingly prominent, posing a challenge to the widespread adoption of the symbiotic education concept. Additionally, how to handle the relationship between technology and humanistic care within digital education, to ensure the ‘warmth’ of education, is a matter requiring deep reflection in the process of digitalizing higher education.
This study aims to explore the pathways to constructing digital higher education under the purview of symbiotic education. Specifically, it seeks to analyze how the digital environment can promote the concept and practice of symbiotic education and, in this process, how to balance technological applications with humanistic care to ensure the diversity and inclusivity of education. By assessing existing digital education practices, the study will propose strategies and suggestions for the effective implementation of symbiotic education, with the hope of providing feasible references for higher education institutions.
To achieve the above research objectives, this paper will answer the following research questions:
How does the current state of digitalization in higher education support or limit the realization of the symbiotic education concept? How can technology and platforms that support symbiotic education be constructed in the digitalization process of higher education?How can teachers and students who are adapted to the digital symbiotic environment be cultivated within higher education institutions? In the context of digitalization, how can the coexistence of cultural diversity and academic freedom be ensured in higher education?
Through the exploration of these research questions, we will gain a deeper understanding of the development trends of symbiotic education in the digital age and how it shapes the future of higher education. This constitutes not only an academic exploration within the field of education but also an enlightenment to practitioners, encouraging them to be creative in the digitalization process, optimizing the allocation of educational resources, and maximizing educational outcomes.
2. Literature Review
2.1. Theoretical Foundations of Symbiotic Education
The concept of symbiotic education, first proposed by Japanese scholars, centers on achieving harmonious coexistence between different cultures and life forms. Its application in the field of education emphasizes the inclusiveness and diversity of the educational system, as well as the manifestation of ecological ethics in educational practices. Scholars often draw on principles from ecology to discuss how to create a symbiotic environment in educational practices that foster cultural exchange and mutual enlightenment. Research indicates that symbiotic education enhances students’ cross-cultural understanding, critical thinking, and global citizenship awareness.
The connection between symbiotic education and cultural transformation starts with the concept of “symbiosis”: culture itself is a product of symbiosis. As a human creation, culture is one of the results of the coexistence between humans and nature, and so is education, which is the result of a symbiotic relationship between education and people, society, nature, technology, etc. Symbiotic education strives to address two issues: first, the symbiotic interaction system formed by human growth and the benign development of the external world; second, the “cultural symbiosis” that forms in dealing with other nations, cultures, and one’s own cultural and modern developmental issues. Resolving these issues of natural and cultural symbiosis is essential to addressing educational concerns.
2.2. Digitalization as a Trend in Higher Education
Digitalization in higher education has evolved from initial courseware and multimedia teaching to high-tech applications such as online courses, virtual reality, and AI teaching assistants. The literature extensively discusses how digitalization is changing the ways of teaching and learning, such as offering more flexible and personalized learning experiences through online educational platforms like MOOCs (Massive Open Online Courses). However, these changes also bring a series of challenges, including the digital divide, academic dishonesty, and issues of educational equity.
2.3. Discussion of Problems and Deficiencies
Existing research points out that one of the main obstacles to promoting symbiotic education in higher education is the lack of effective educational strategies and support systems. Moreover, although digital education provides unprecedented convenience, its effectiveness in enhancing cultural exchange and understanding is still to be verified. For instance, the unequal distribution of educational technology may exacerbate the educational disparities between different social groups. Additionally, cultural symbiosis within digital education often lacks depth and permanence, necessitating further consideration of how to use technology to promote genuine cultural integration and interaction.
Theoretical Framework of the Study This research adopts an interdisciplinary theoretical framework, combining pedagogy, sociology, and information technology, to analyze the intersection of symbiotic education and digitalization in higher education. The framework includes ecosystem theory, cross-cultural communication theory, and the technology acceptance model, aimed at exploring how to construct and maintain symbiotic education systems in a digital environment.
Research Contribution By conducting an in-depth analysis of the existing literature, this study has identified gaps and areas not fully explored in symbiotic education practice. In particular, on how to use digital tools and strategies to overcome cultural barriers and foster a true symbiotic environment, this study aims to provide new insights and empirical research results. Furthermore, this research will assess the efficacy and limitations of existing digital education practices in advancing the concept of symbiotic education, providing guidance for future educational policies and practices.
3. Methodology
3.1. Research Design
This study employs a mixed-methods research design, integrating both quantitative and qualitative approaches to comprehensively investigate the digitalization of higher education within the context of symbiotic education. The quantitative research component aims to evaluate the prevalence of digital tools and their effectiveness in facilitating symbiotic education. The qualitative research, on the other hand, seeks to delve into teachers’ and students’ perceptions, experiences, and needs regarding digital education and how these influence the practice of symbiotic education.
3.2. Participants
The subjects of the study include teachers and students from two higher education institutions, ensuring representativeness and diversity of the research results. The institutions are Qingdao Agricultural University, located in Qingdao (a sub-provincial city), and Haidou College in Laixi (a county-level city of Yantai). Within each school, 100 students and 20 teachers were randomly selected to participate in the questionnaire survey. To gain a deeper understanding of the participants’ perspectives, 10 students and 5 teachers were selected for semi-structured interviews.
3.3. Data Sources
Quantitative data were derived from a self-designed questionnaire survey, which included questions about participants’ basic information, frequency of use of digital educational resources, satisfaction, and perception of the implementation of the symbiotic education concept. Qualitative data were collected through semi-structured interviews, covering participants’ experiences with digital education, challenges encountered in the practice of symbiotic education, and strategies for overcoming these challenges. The questionnaire survey was conducted using an online survey tool, Wenjuanxing, to enhance the efficiency and convenience of data collection. The semi-structured interviews were recorded using digital recording devices and transcribed into text afterward.

Table 1.
This is a table. Frequency Analysis Results.
| Frequency Analysis Results | ||||
| Variable | Category | Frequency | Percentage (%) | Cumulative Percentage (%) |
| Age | 18-25 | 82 | 32.54 | 32.54 |
| 26-35 | 75 | 29.76 | 62.30 | |
| 36-45 | 55 | 21.83 | 84.13 | |
| 46- | 40 | 15.87 | 100.00 | |
| Gender | Male | 125 | 49.60 | 49.60 |
| Female | 127 | 50.40 | 100.00 | |
| Educational Background | Undergraduate Students | 42 | 16.67 | 16.67 |
| Graduate Students | 6 | 2.38 | 19.05 | |
| Teachers | 184 | 73.02 | 92.06 | |
| Administrative Staff | 9 | 3.57 | 95.63 | |
| Others | 11 | 4.37 | 100.00 | |
| How do you typically use digital educational tools? | Learning New Knowledge | 29 | 11.51 | 11.51 |
| Completing Assignments | 70 | 27.78 | 39.29 | |
| Course Teaching | 108 | 42.86 | 82.14 | |
| Curriculum Design | 20 | 7.94 | 90.08 | |
| Others | 25 | 9.92 | 100.00 | |
| What is the frequency of your weekly use of digital educational tools? | Daily | 135 | 53.57 | 53.57 |
| Several times a week | 73 | 28.97 | 82.54 | |
| Occasionally | 25 | 9.92 | 92.46 | |
| Rarely used | 19 | 7.54 | 100.00 | |
| To what extent do you believe that digital educational tools contribute to the realization of symbiotic education? | Extremely helpful | 108 | 42.86 | 42.86 |
| Helpful | 107 | 42.46 | 85.32 | |
| Neutral | 15 | 5.95 | 91.27 | |
| Unhelpful | 8 | 3.17 | 94.44 | |
| Extremely unhelpful | 14 | 5.56 | 100.00 | |
| What are the main challenges you encounter when using digital educational tools? | Technical issues | 44 | 17.46 | 17.46 |
| Resource issues | 78 | 30.95 | 48.41 | |
| Access to resources | 33 | 13.10 | 61.51 | |
| Language barriers | 31 | 12.30 | 73.81 | |
| Cultural understanding | 30 | 11.90 | 85.71 | |
| Others | 36 | 14.29 | 100.00 | |
| What is your level of satisfaction with the current digital educational tools? | Extremely satisfied | 224 | 88.89 | 88.89 |
| Satisfied | 6 | 2.38 | 91.27 | |
| Neutral | 12 | 4.76 | 96.03 | |
| Dissatisfied | 7 | 2.78 | 98.81 | |
| Extremely dissatisfied | 3 | 1.19 | 100.00 | |
| Total | 252 | 100.0 | 100.0 | |
3.3. Data Sources
Quantitative data were derived from a self-designed questionnaire survey, which included questions about participants’ basic information, frequency of use of digital educational resources, satisfaction, and perception of the implementation of the symbiotic education concept. Qualitative data were collected through semi-structured interviews, covering participants’ experiences with digital education, challenges encountered in the practice of symbiotic education, and strategies for overcoming these challenges. The questionnaire survey was conducted using an online survey tool, Wenjuanxing, to enhance the efficiency and convenience of data collection. The semi-structured interviews were recorded using digital recording devices and transcribed into text afterward.
3.4. Data Analysis
From the table presented,, it can be discerned that within the age range of the sample, the “18-25” category is the most represented, constituting 32.54%. The gender distribution within the sample is relatively balanced, with females comprising 50.40% and males 49.60%. A significant majority of the sample, 73.02%, identified themselves as “teachers.”
Regarding the typical use of digital educational tools, “course teaching” was the prevalent application, reported by 42.86% of the sample. Daily usage of digital tools was noted by 53.57% of the respondents. When asked to what extent digital educational tools are considered helpful in facilitating symbiotic education, over 40% of the sample indicated “very helpful,” with an additional 42.46% deeming them “helpful.”
Concerning the main challenges encountered when using digital educational tools, more than 30% of the sample identified “resource issues.” A substantial majority, 88.89%, expressed “very satisfaction” with the current digital educational tools.
Table 2.
This is a table.Age.
| Age | |||
| Category | Frequency | Percentage (%) | Cumulative Percentage (%) |
| 18-25 | 82 | 32.54% | 32.54% |
| 26-35 | 75 | 29.76% | 62.30% |
| 36-45 | 55 | 21.83% | 84.13% |
| 46- | 40 | 15.87% | 100.00% |
| Total | 252 | 100.0% | |
Figure 1.
This is a figure. Age.
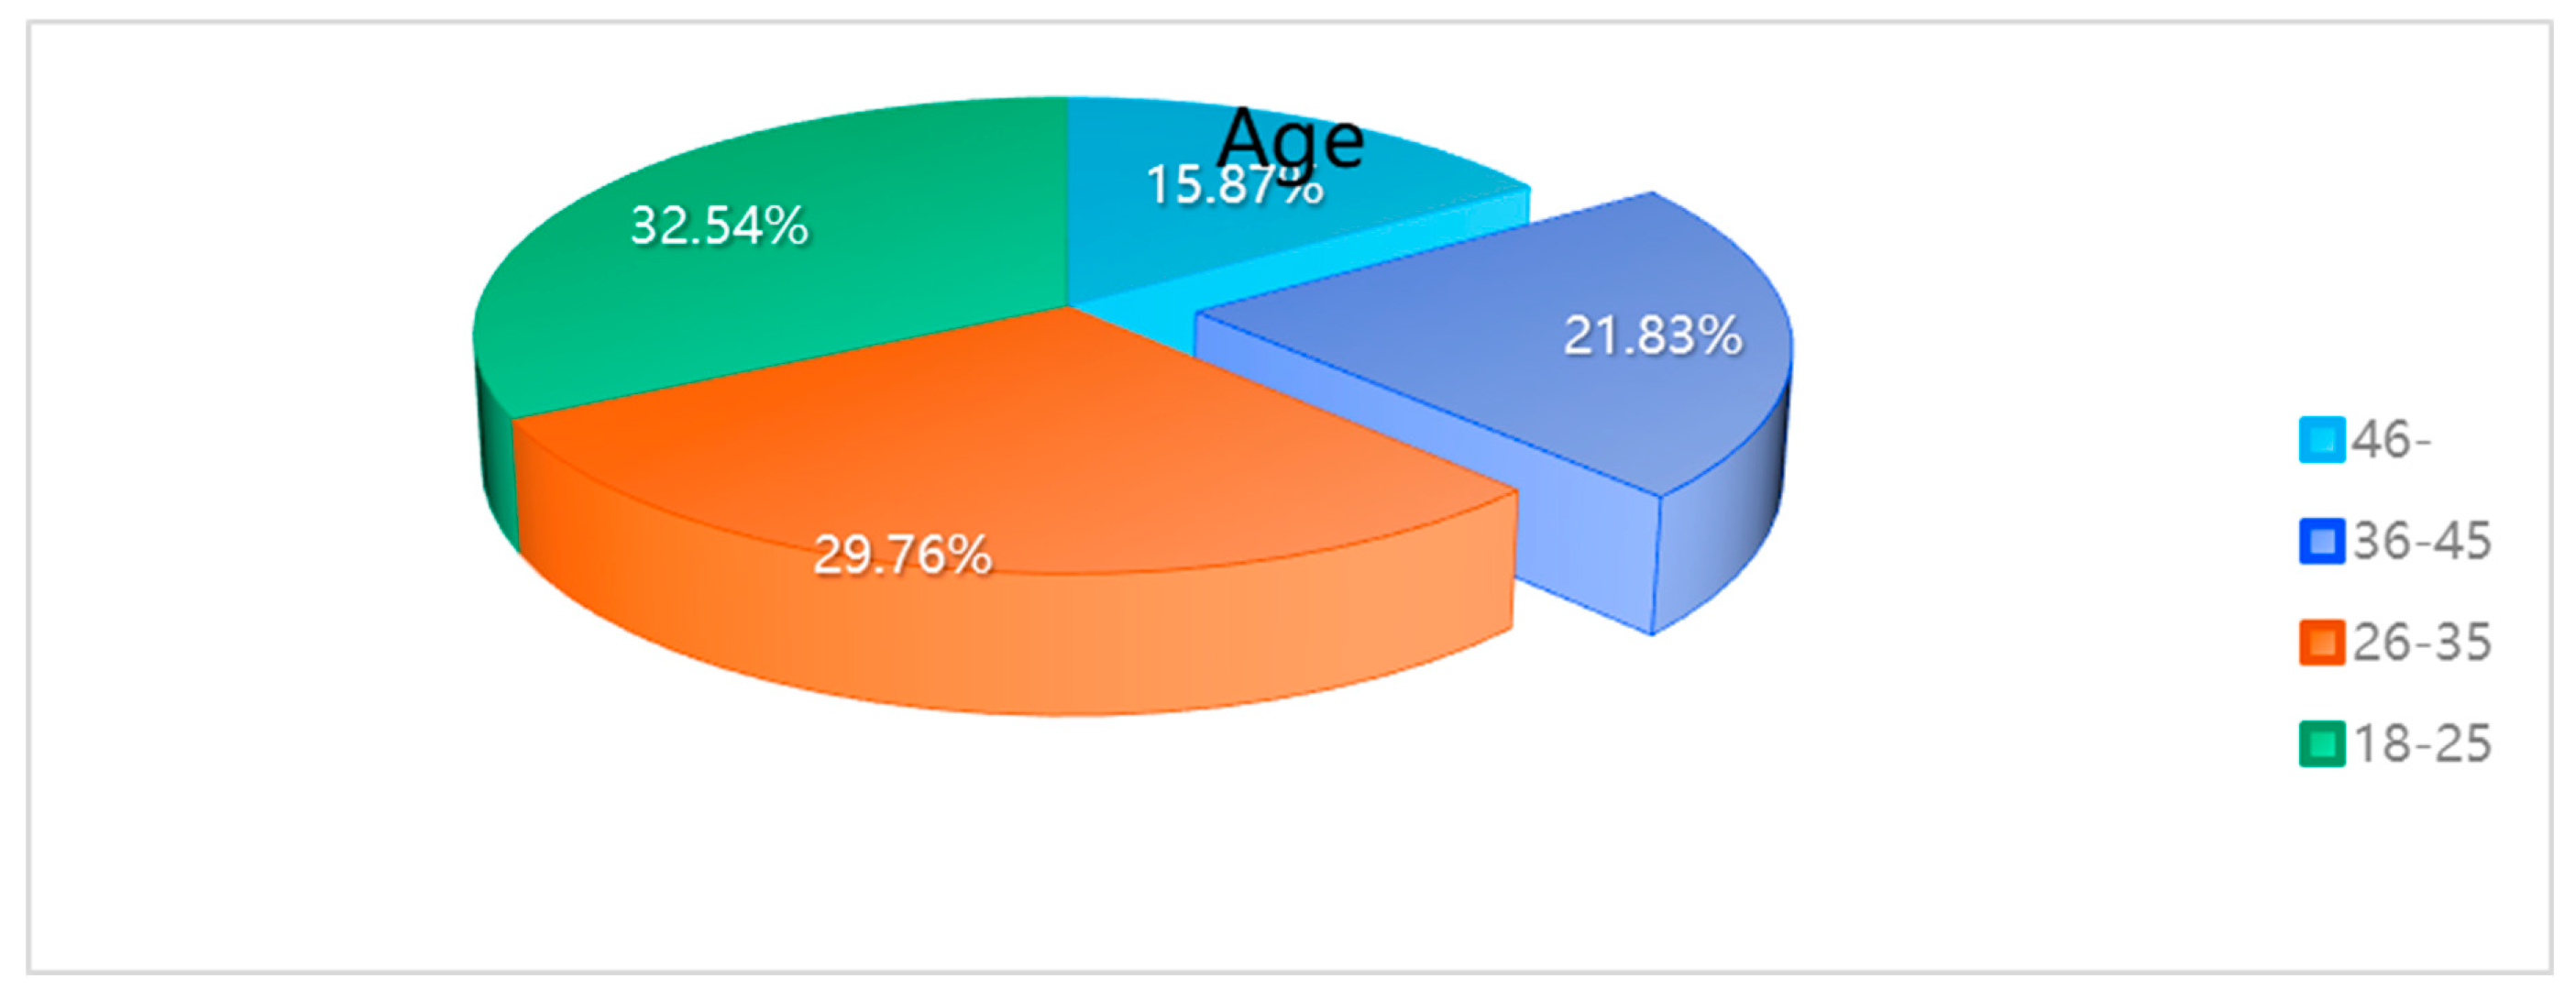
Table 3.
This is a table.Gender.
| Gender | |||
| Category | Frequency | Percentage (%) | Cumulative Percentage (%) |
| Male | 125 | 49.60% | 49.60% |
| Female | 127 | 50.40% | 100.00% |
| Total | 252 | 100.0% | |
Figure 2.
This is a figure. Gender.
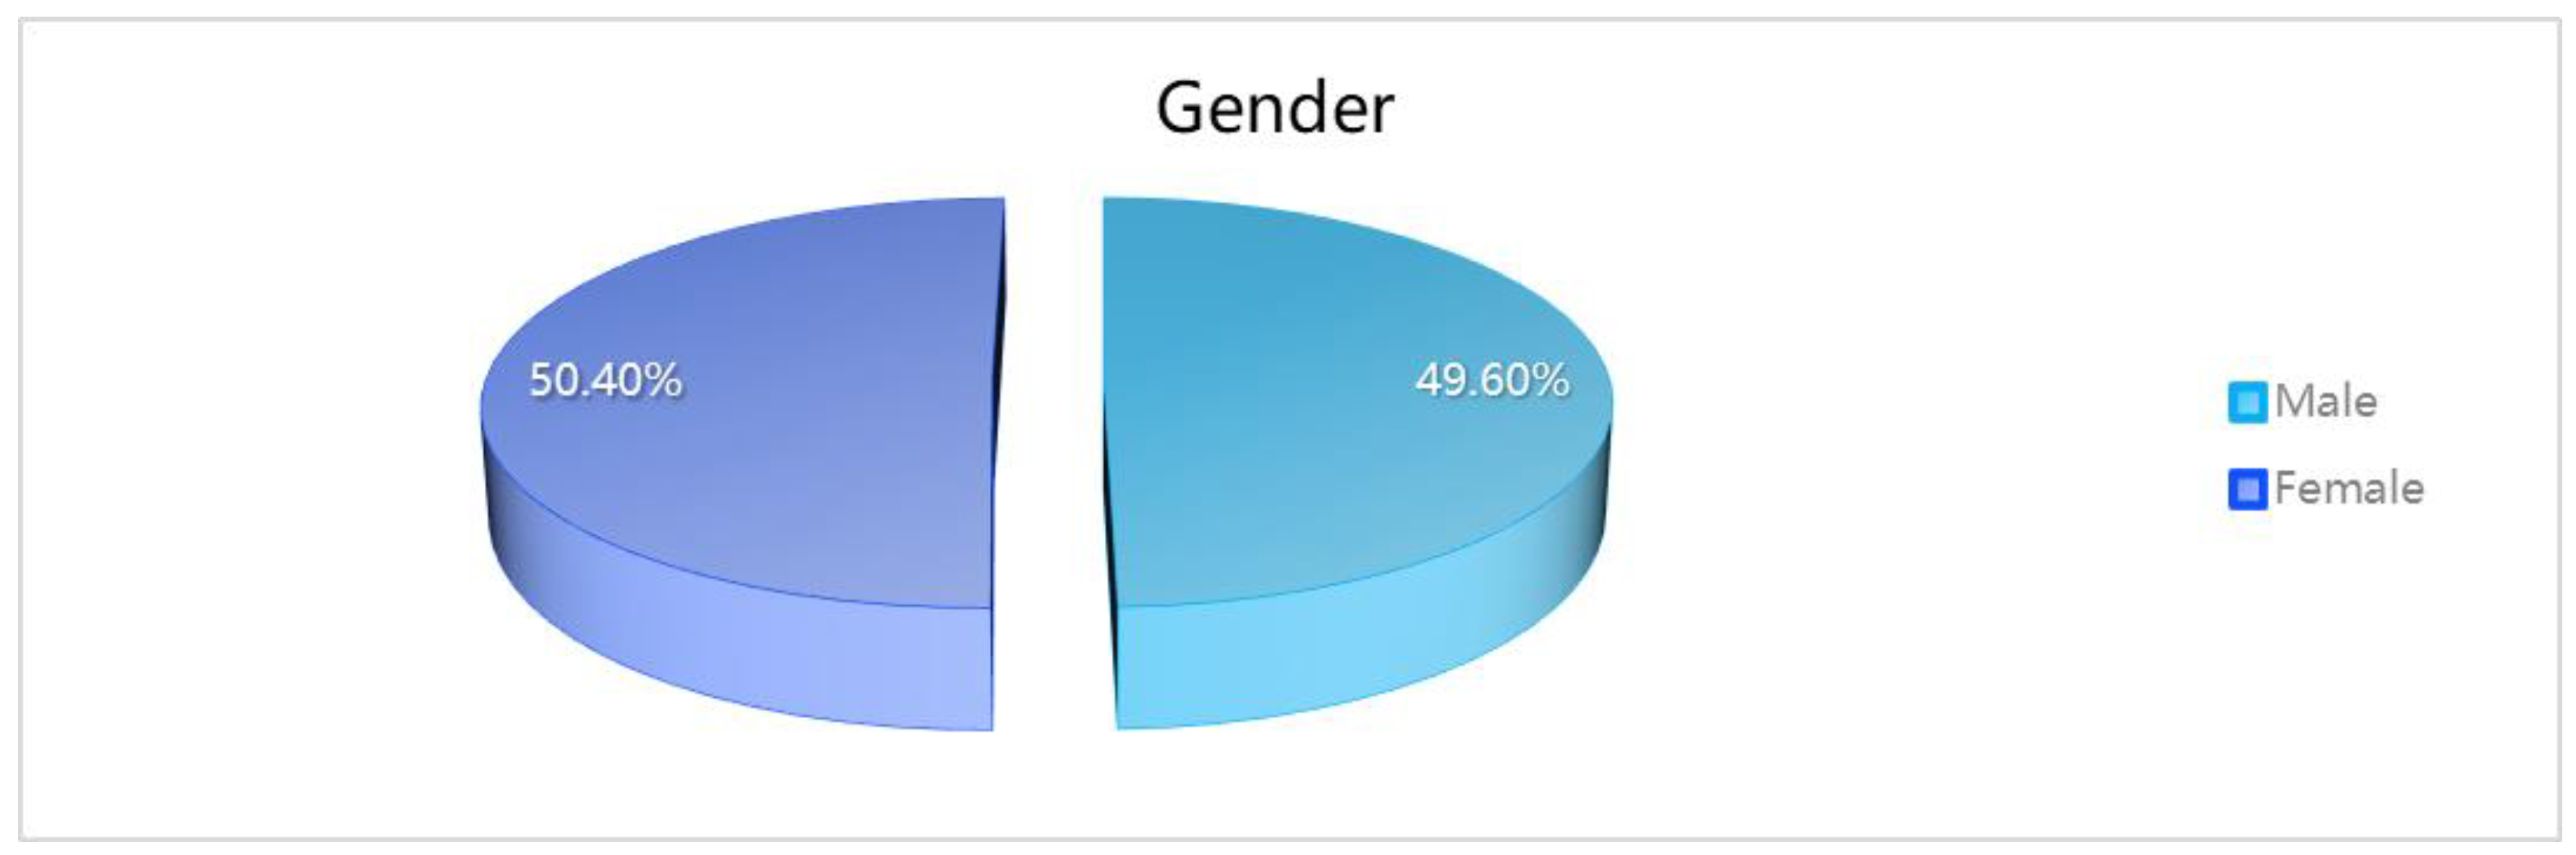
Table 4.
This is a table.Educational Background.
| Educational Background | |||
| Category | Frequency | Percentage (%) | Cumulative Percentage (%) |
| Undergraduate Students | 42 | 16.67% | 16.67% |
| Graduate Students | 6 | 2.38% | 19.05% |
| Teachers | 184 | 73.02% | 92.06% |
| Administrative Staff | 9 | 3.57% | 95.63% |
| Others | 11 | 4.37% | 100.00% |
| Total | 252 | 100.0% | |
Figure 3.
This is a figure.Educational Background.
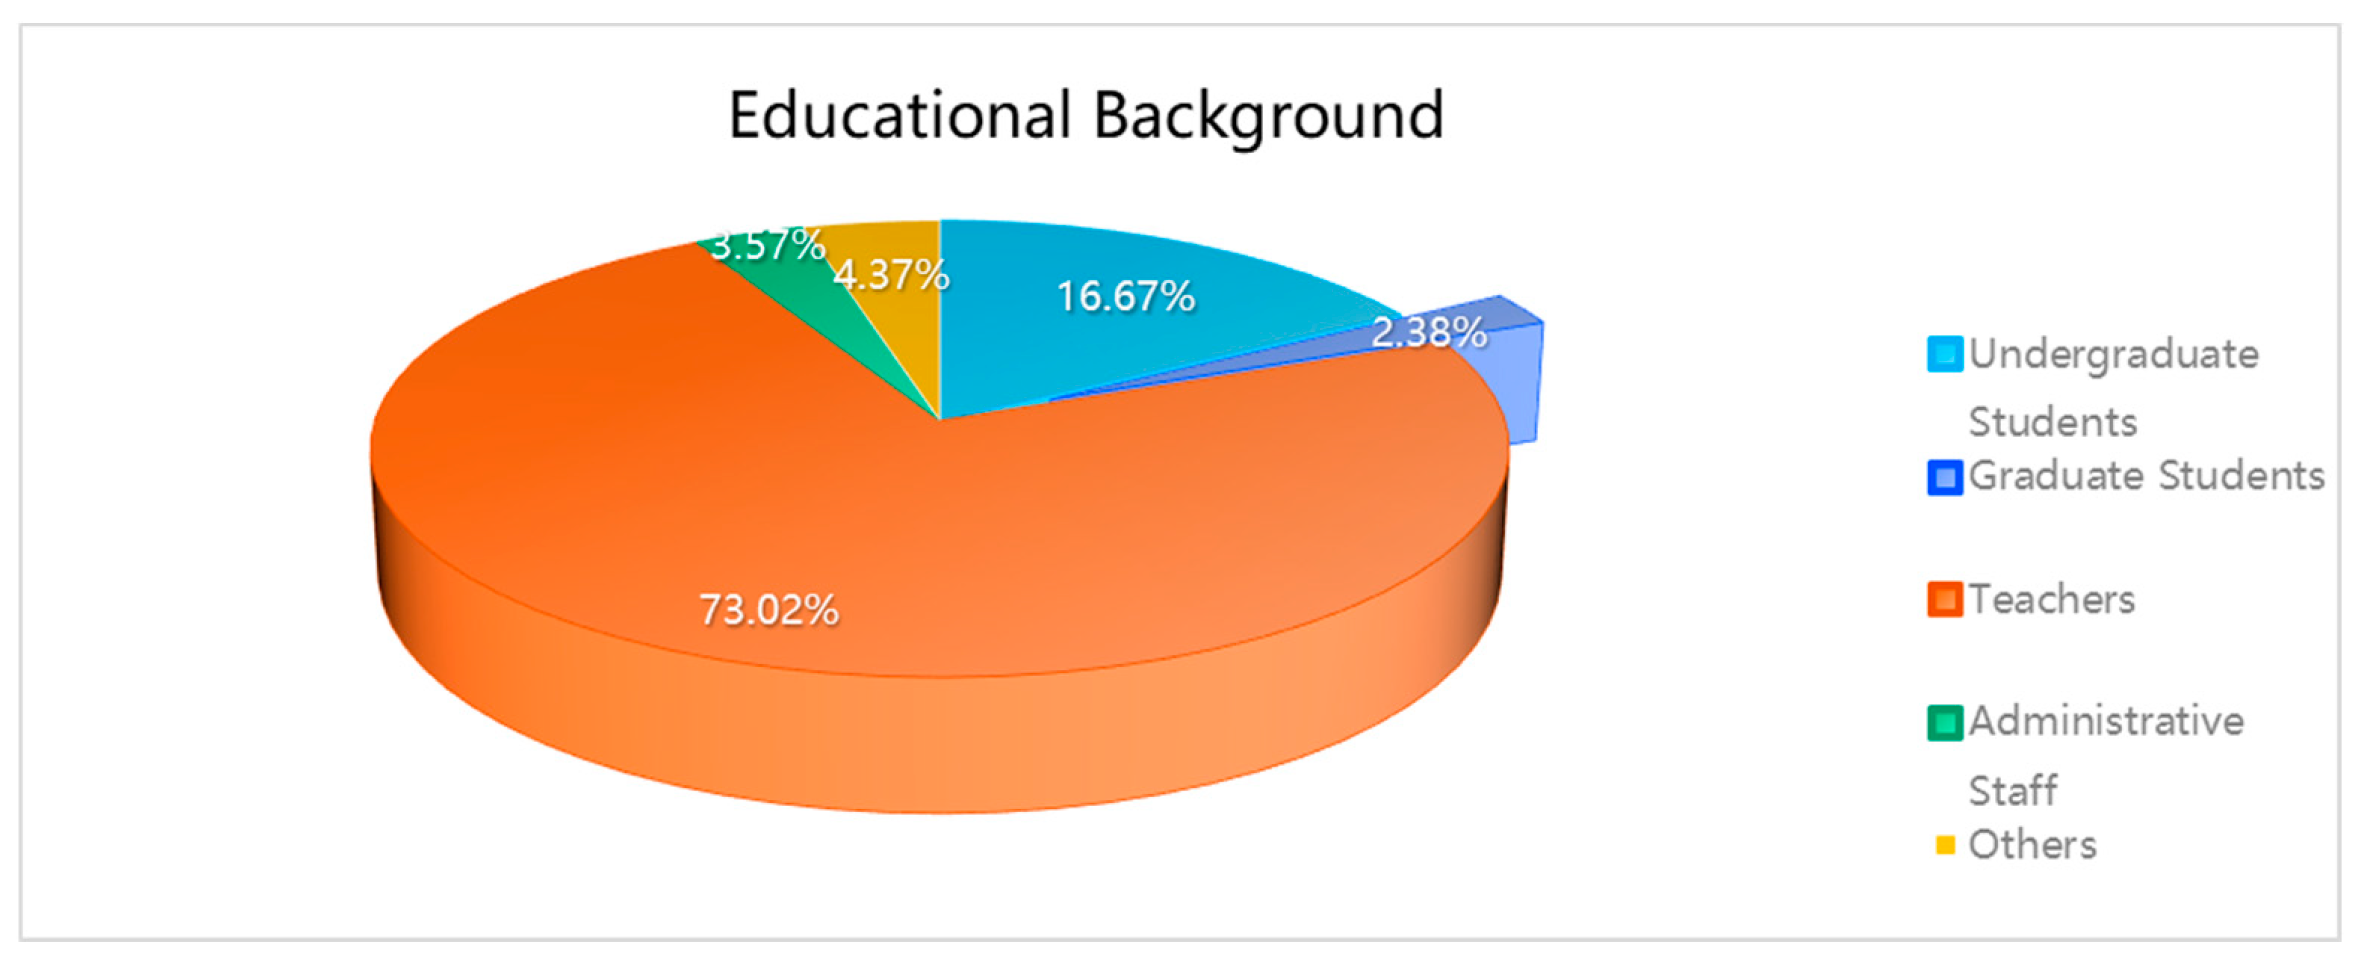
Table 5.
This is a table. How do you typically use digital educational tools?
| How do you typically use digital educational tools? | |||
| Category | Frequency | Percentage (%) | Cumulative Percentage (%) |
| Learning New Knowledge | 29 | 11.51% | 11.51% |
| Completing Assignments | 70 | 27.78% | 39.29% |
| Course Teaching | 108 | 42.86% | 82.14% |
| Curriculum Design | 20 | 7.94% | 90.08% |
| Others | 25 | 9.92% | 100.00% |
| Total | 252 | 100.0% | |
Figure 4.
This is a figure. How do you typically use digital educational tools?
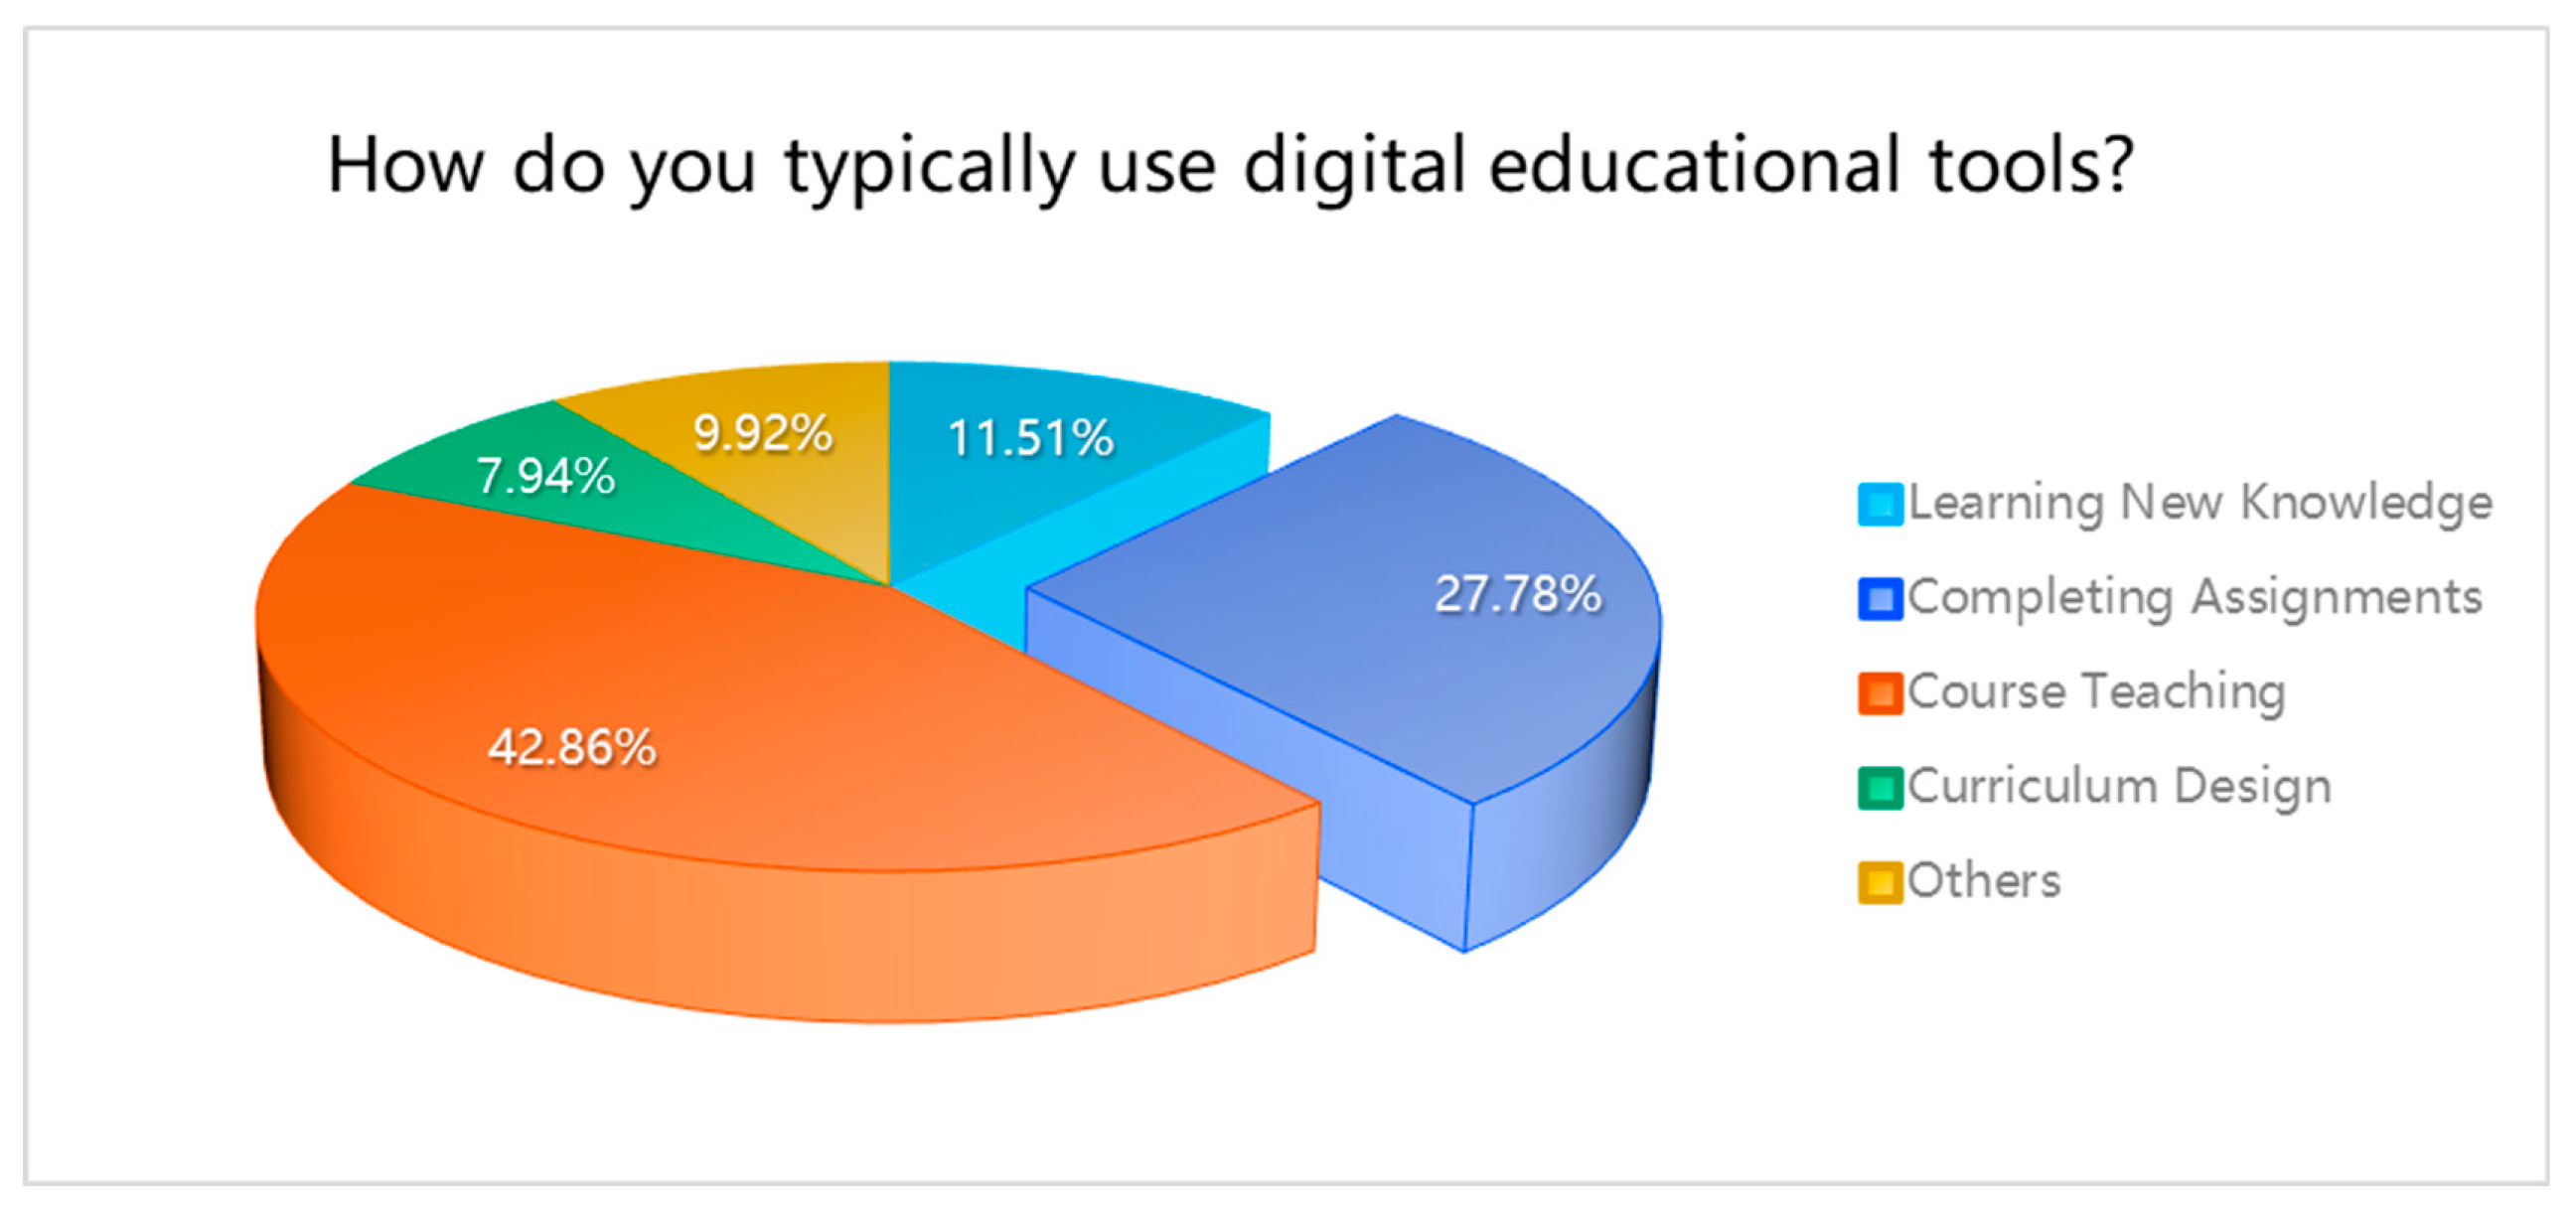
Table 6.
This is a table. What is the frequency of your weekly use of digital educational tools?
| What is the frequency of your weekly use of digital educational tools? | |||
| Category | Frequency | Percentage (%) | Cumulative Percentage (%) |
| Daily | 135 | 53.57% | 53.57% |
| Several times a week | 73 | 28.97% | 82.54% |
| Occasionally | 25 | 9.92% | 92.46% |
| Rarely used | 19 | 7.54% | 100.00% |
| Total | 252 | 100.0% | |
Figure 5.
This is a figure. What is the frequency of your weekly use of digital educational tools?
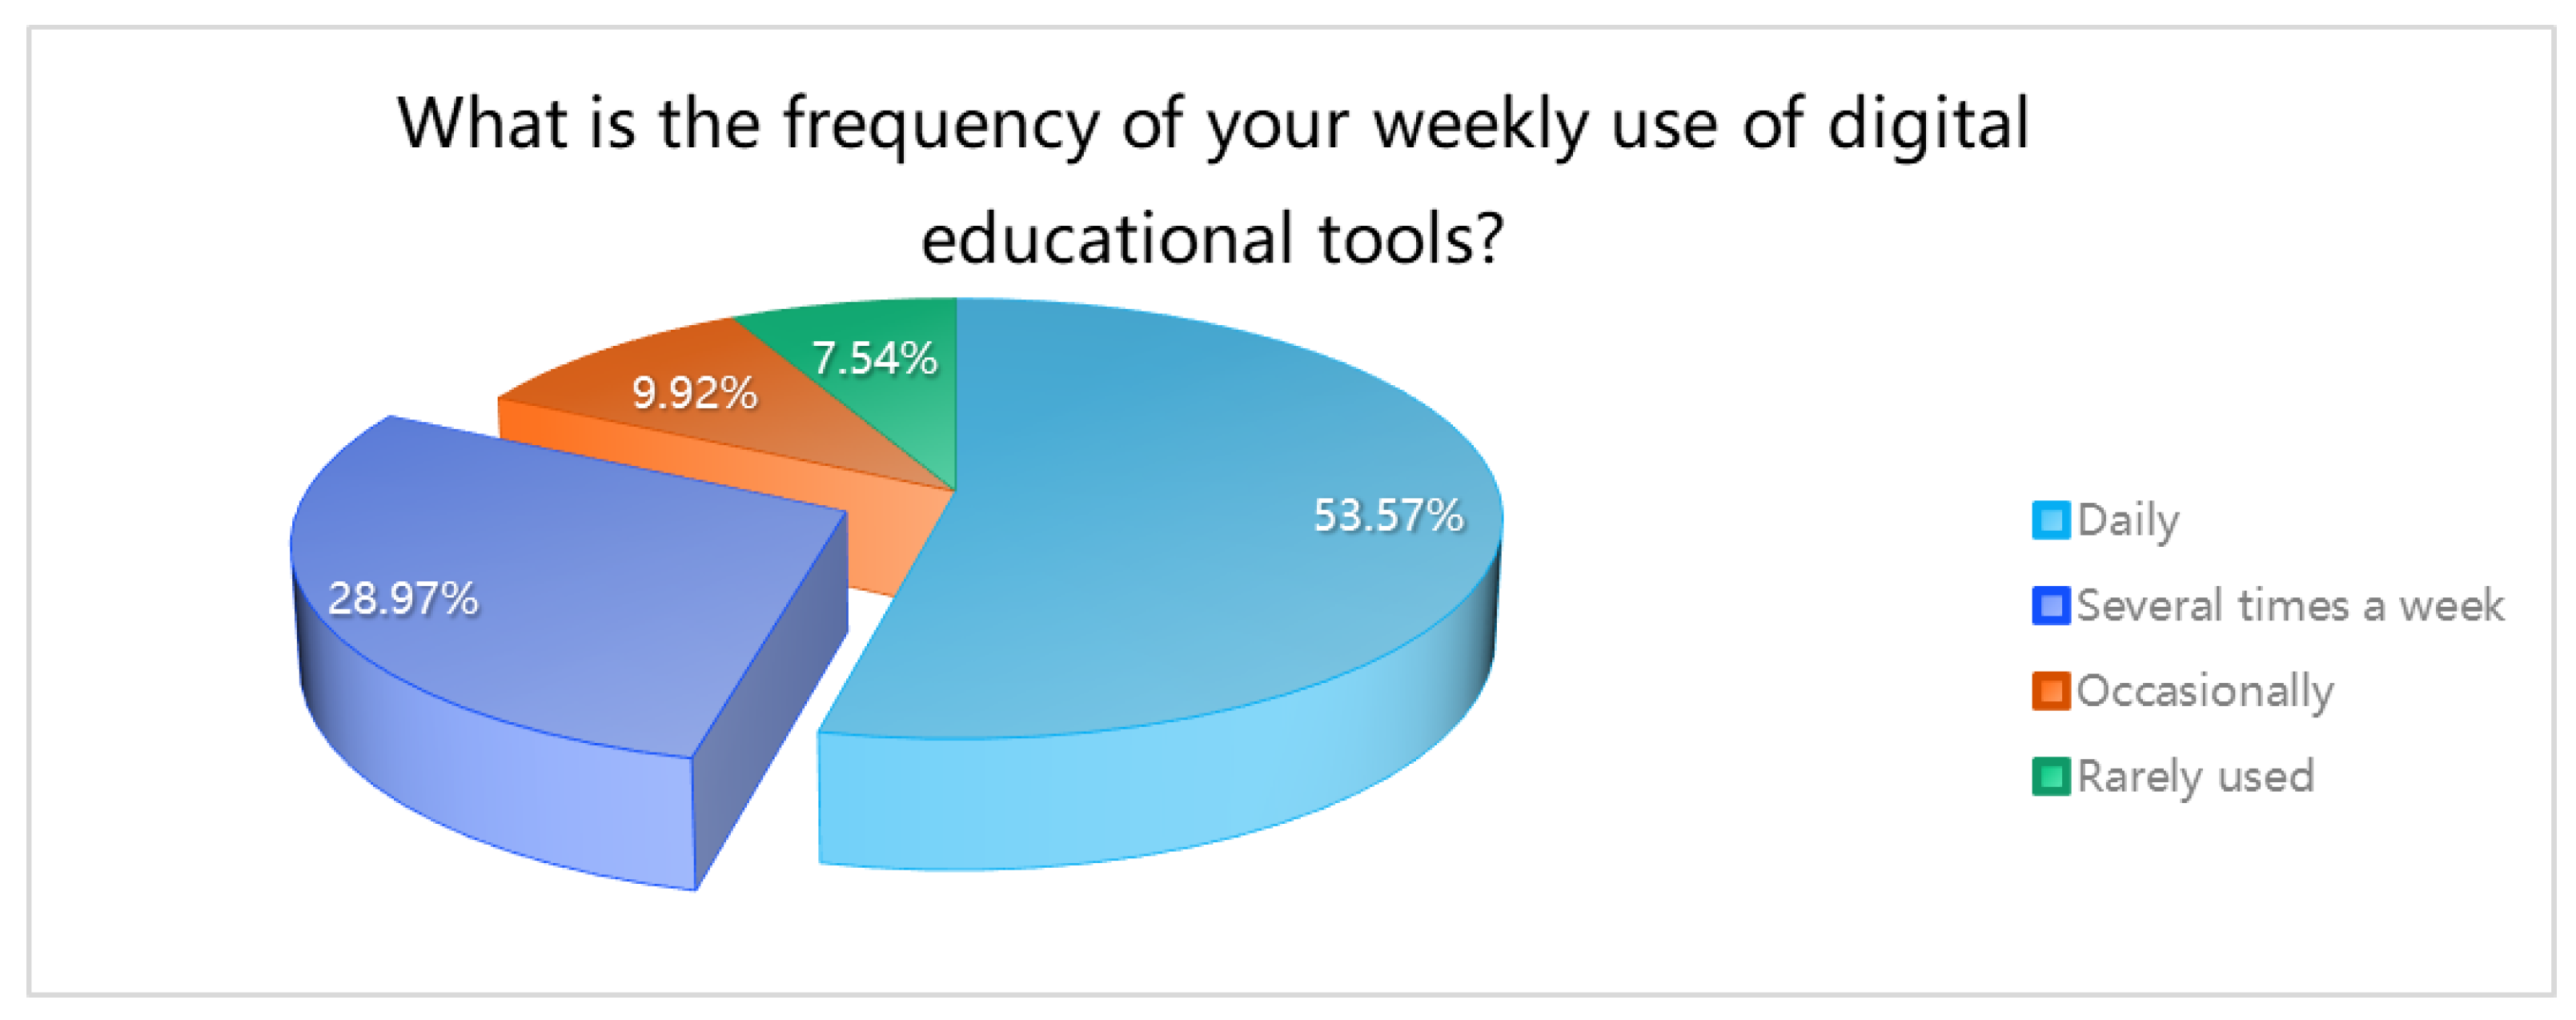
Table 7.
This is a table. To what extent do you believe that digital educational tools contribute to the realization of symbiotic education?
Table 7.
This is a table. To what extent do you believe that digital educational tools contribute to the realization of symbiotic education?
| To what extent do you believe that digital educational tools contribute to the realization of symbiotic education? | |||
| Category | Frequency | Percentage (%) | Cumulative Percentage (%) |
| Extremely helpful | 108 | 42.86% | 42.86% |
| Helpful | 107 | 42.46% | 85.32% |
| Neutral | 15 | 5.95% | 91.27% |
| Unhelpful | 8 | 3.17% | 94.44% |
| Extremely unhelpful | 14 | 5.56% | 100.00% |
| Total | 252 | 100.0% | |
Figure 6.
This is a figure. To what extent do you believe that digital educational tools contribute to the realization of symbiotic education?
Figure 6.
This is a figure. To what extent do you believe that digital educational tools contribute to the realization of symbiotic education?
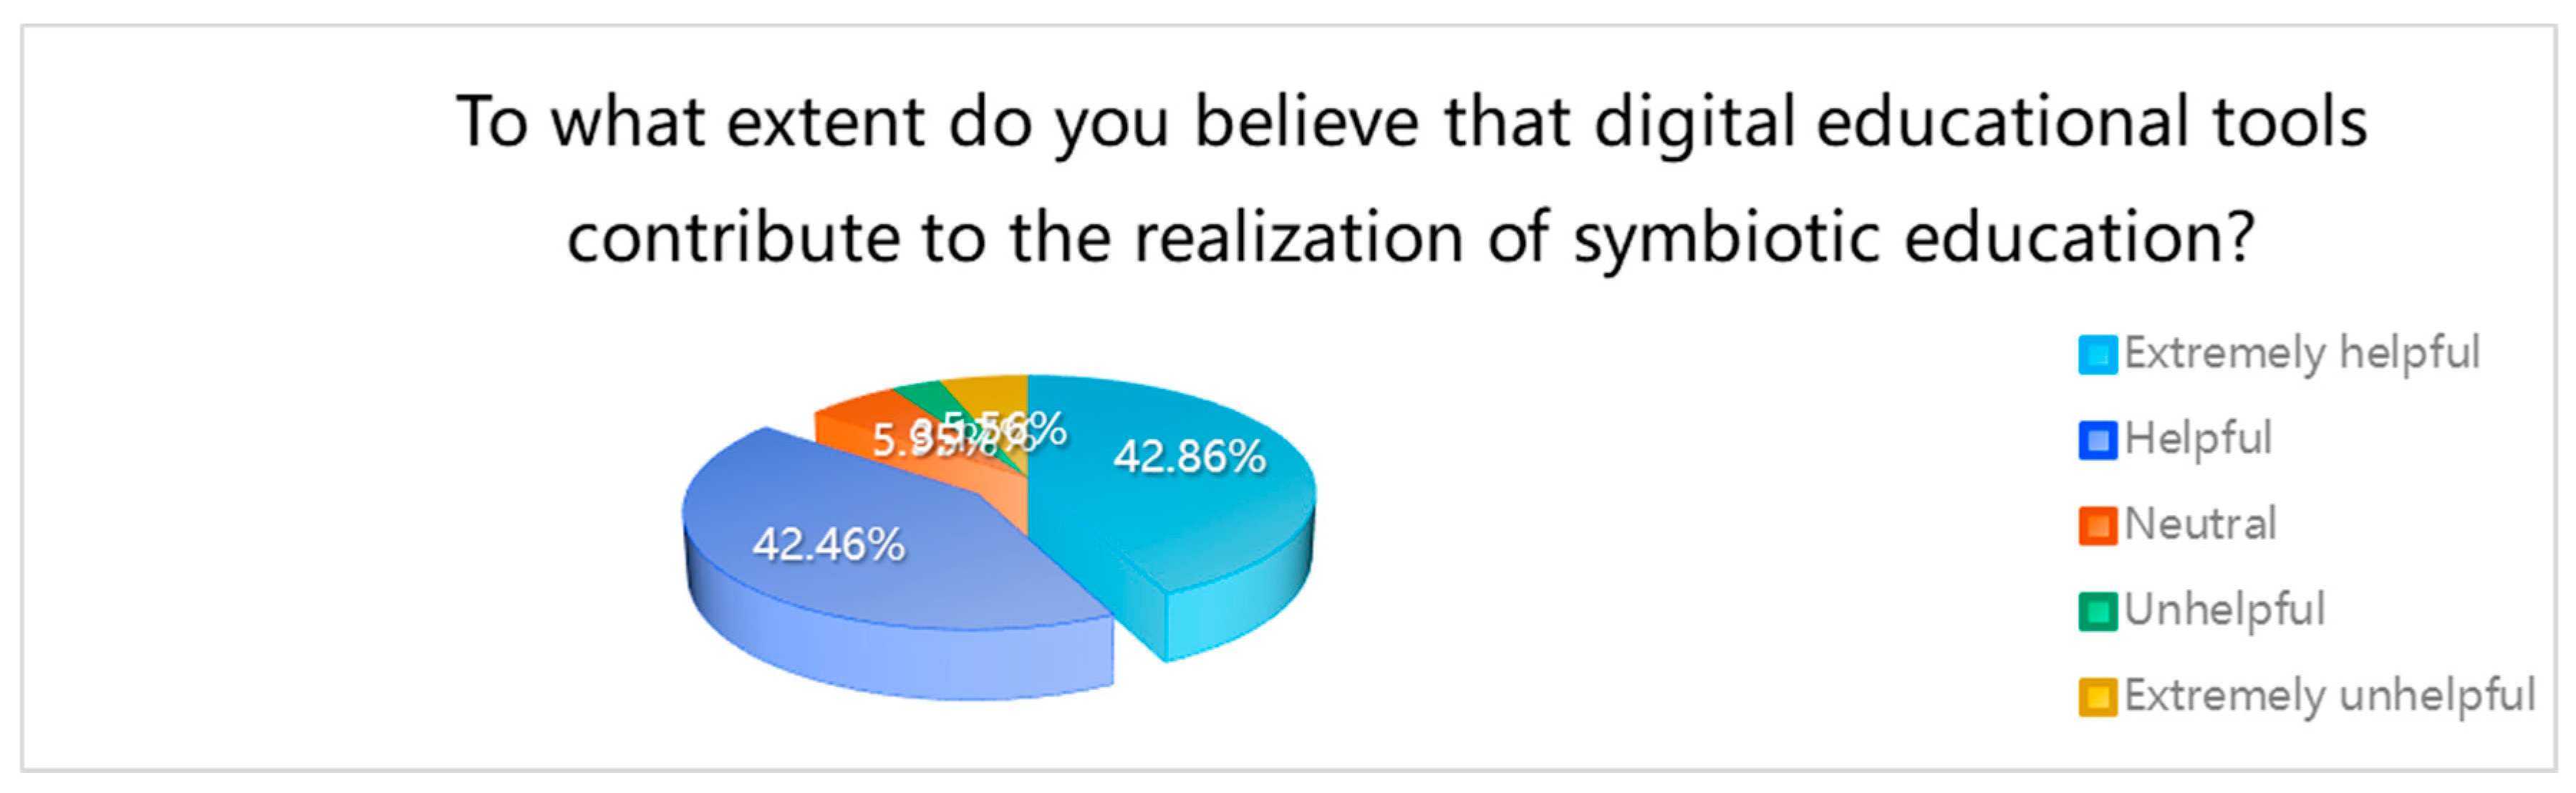
Table 8.
This is a table. What are the main challenges you encounter when using digital educational tools?
Table 8.
This is a table. What are the main challenges you encounter when using digital educational tools?
| What are the main challenges you encounter when using digital educational tools? | |||
| Category | Frequency | Percentage (%) | Cumulative Percentage (%) |
| Technical issues | 44 | 17.46% | 17.46% |
| Resource issues | 78 | 30.95% | 48.41% |
| Access to resources | 33 | 13.10% | 61.51% |
| Language barriers | 31 | 12.30% | 73.81% |
| Cultural understanding | 30 | 11.90% | 85.71% |
| Others | 36 | 14.29% | 100.00% |
| Total | 252 | 100.0% | |
Figure 7.
This is a figure. What are the main challenges you encounter when using digital educational tools?
Figure 7.
This is a figure. What are the main challenges you encounter when using digital educational tools?
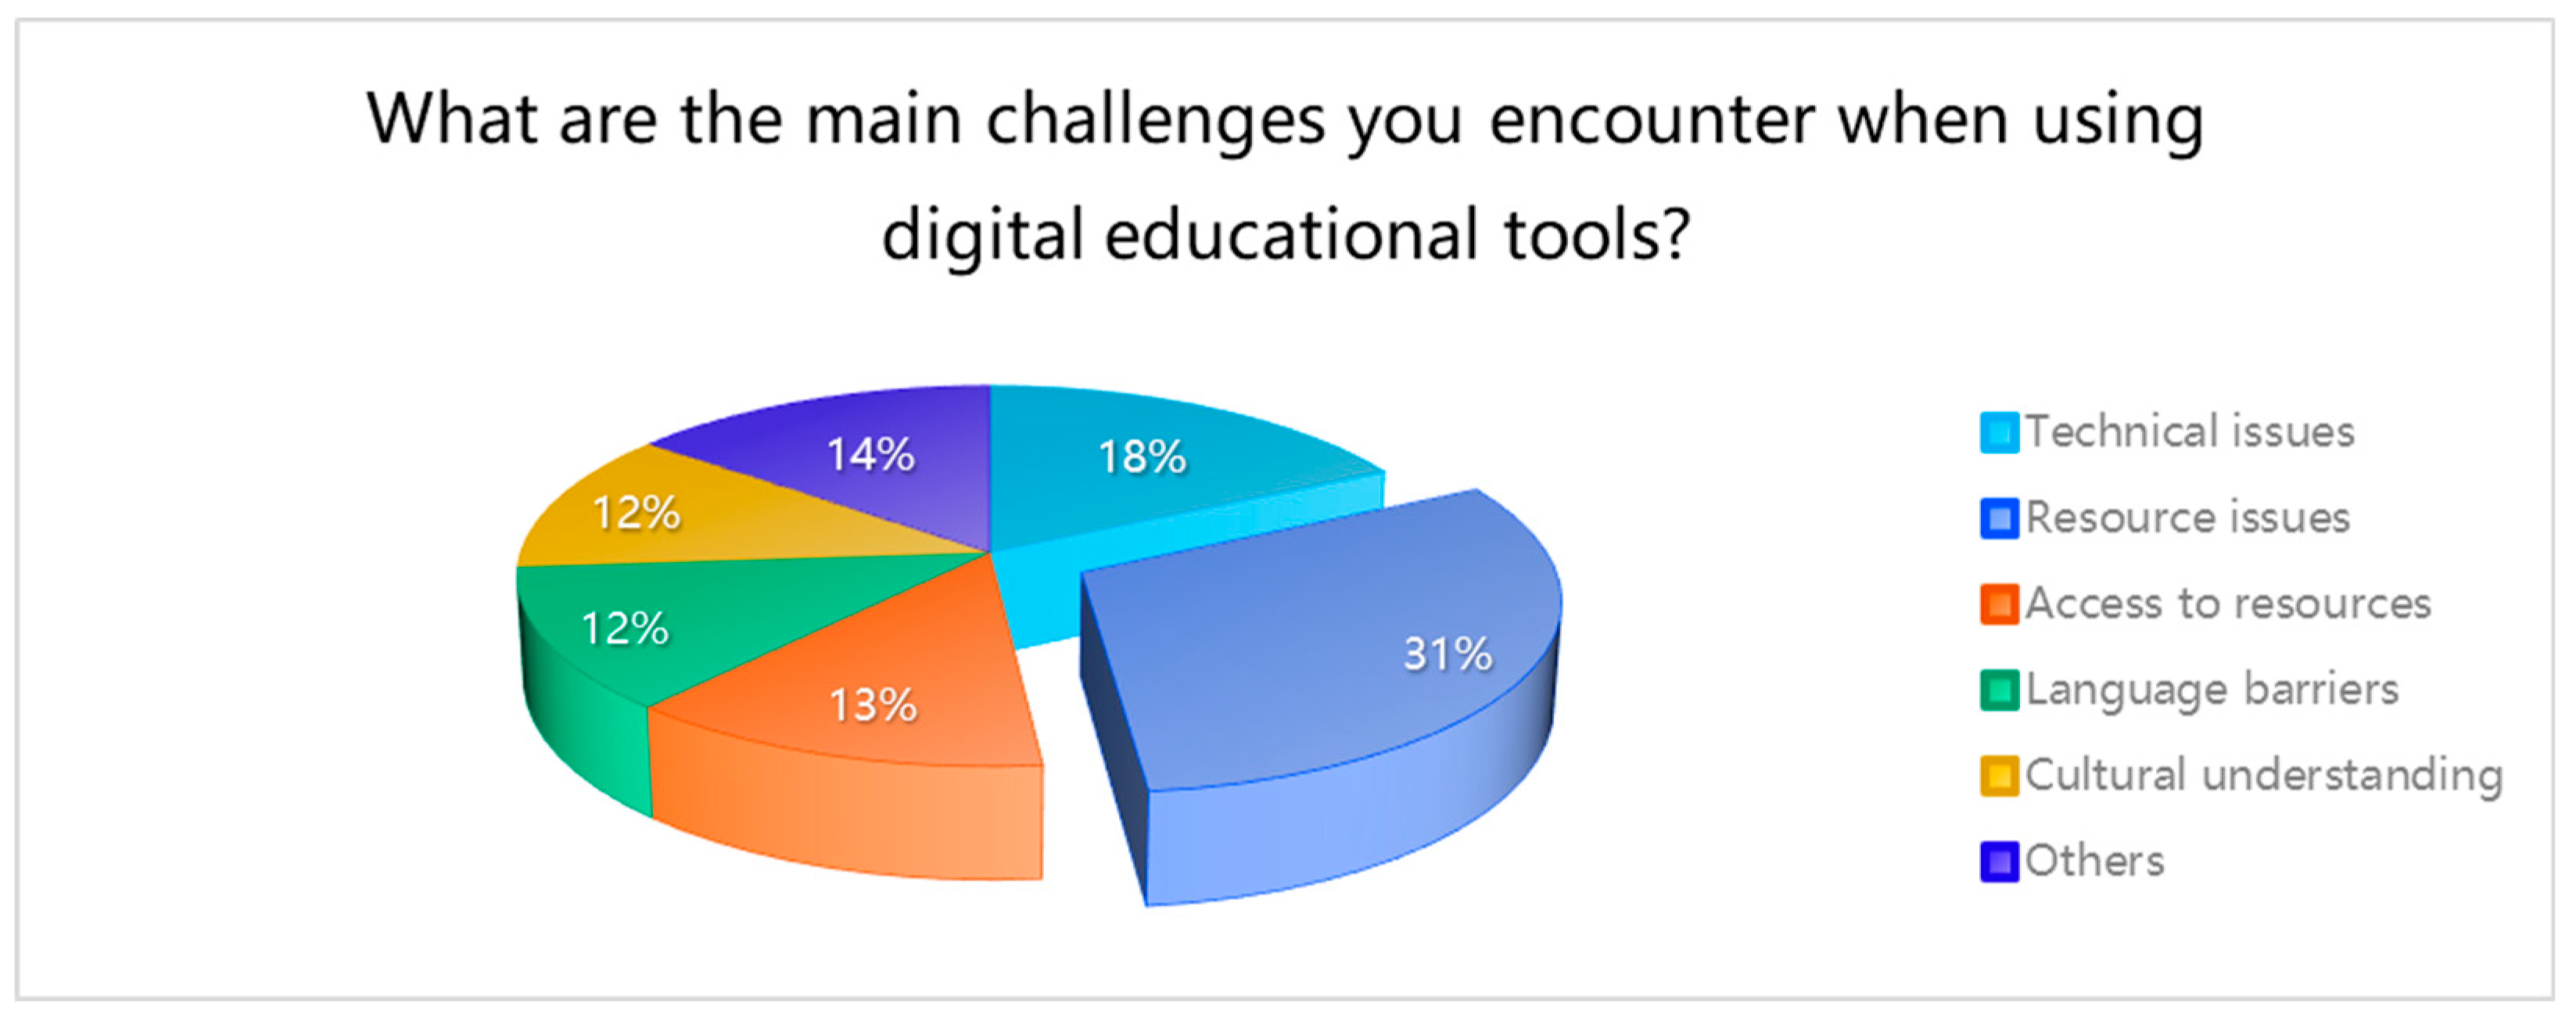
Table 9.
This is a table. What is your level of satisfaction with the current digital educational tools?
Table 9.
This is a table. What is your level of satisfaction with the current digital educational tools?
| What is your level of satisfaction with the current digital educational tools? | |||
| Category | Frequency | Percentage (%) | Cumulative Percentage (%) |
| Extremely satisfied | 224 | 88.89% | 88.89% |
| Satisfied | 6 | 2.38% | 91.27% |
| Neutral | 12 | 4.76% | 96.03% |
| Dissatisfied | 7 | 2.78% | 98.81% |
| Extremely dissatisfied | 3 | 1.19% | 100.00% |
| Total | 252 | 100.0% | |
Figure 8.
This is a figure. What is your level of satisfaction with the current digital educational tools? .
Figure 8.
This is a figure. What is your level of satisfaction with the current digital educational tools? .
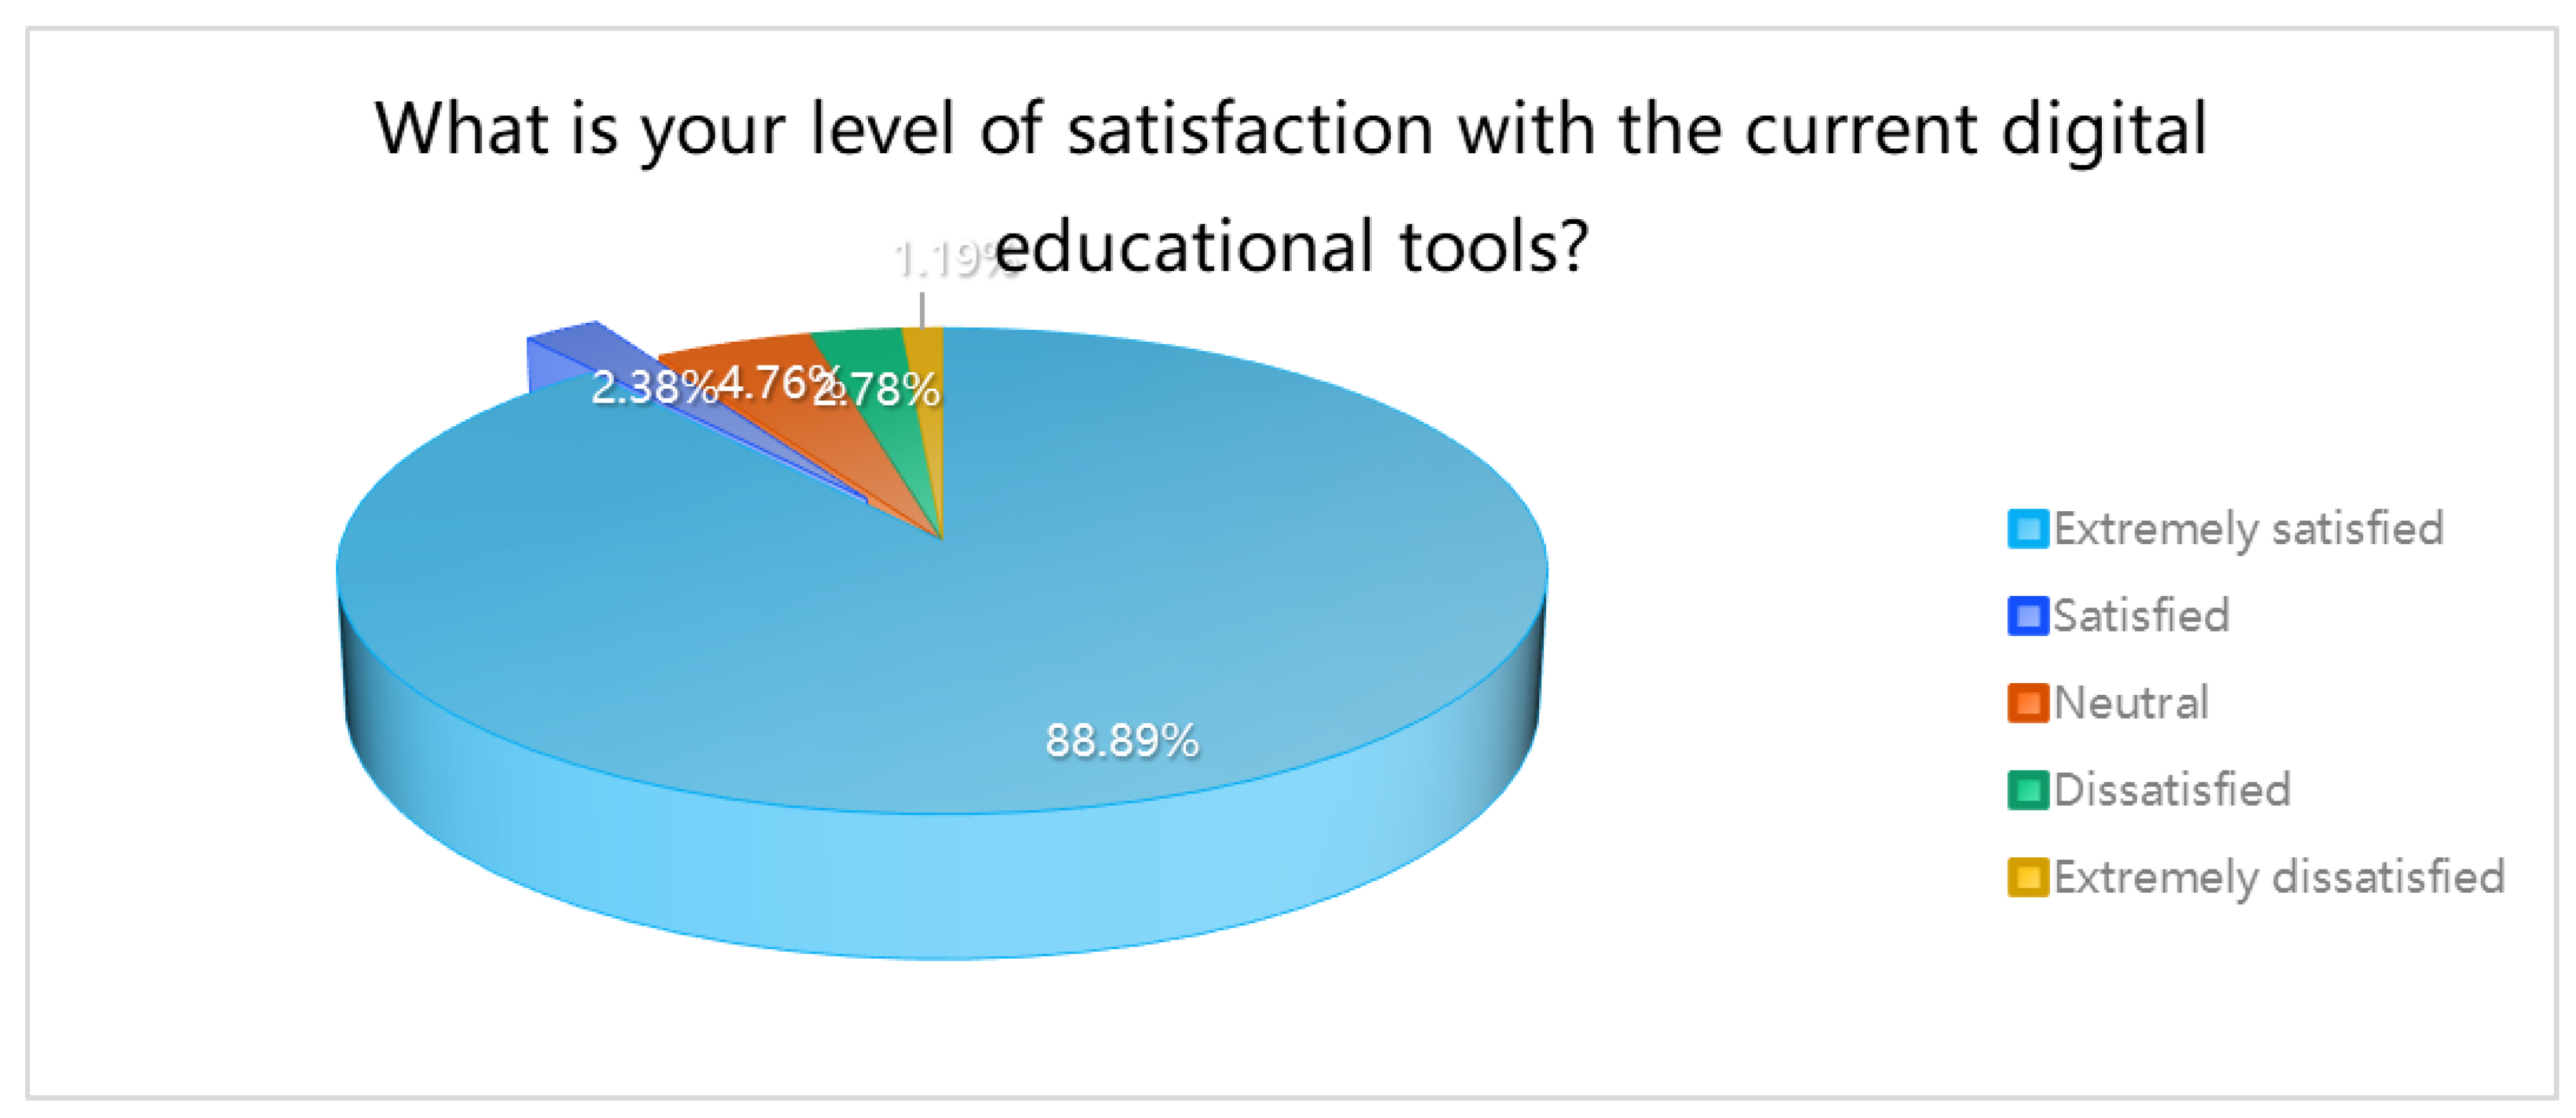
Table 10.
This is a table.ANOVA results.
| ANOVA results (normal format) | ||||||
| Analysis item | Item | Sample size | Average | Standard deviation | F | P |
| How do you typically use digital educational tools? | 18-25 | 82 | 2.40 | 0.73 | 5.337 | 0.001** |
| 26-35 | 75 | 3.03 | 1.08 | |||
| 36-45 | 55 | 2.95 | 1.46 | |||
| 46- | 40 | 2.80 | 0.88 | |||
| Total | 252 | 2.77 | 1.08 | |||
| What is the frequency of your weekly use of digital educational tools? | 18-25 | 82 | 1.72 | 0.57 | 47.145 | 0.000** |
| 26-35 | 75 | 1.28 | 0.76 | |||
| 36-45 | 55 | 2.69 | 0.96 | |||
| 46- | 40 | 1.18 | 0.68 | |||
| Total | 252 | 1.71 | 0.93 | |||
| To what extent do you believe that digital educational tools contribute to the realization of symbiotic education? | 18-25 | 82 | 2.13 | 0.52 | 22.215 | 0.000** |
| 26-35 | 75 | 1.36 | 0.48 | |||
| 36-45 | 55 | 2.51 | 1.62 | |||
| 46- | 40 | 1.35 | 0.98 | |||
| Total | 252 | 1.86 | 1.05 | |||
| What are the main challenges you encounter when using digital educational tools? | 18-25 | 82 | 3.50 | 1.75 | 3.686 | 0.013* |
| 26-35 | 75 | 2.63 | 1.36 | |||
| 36-45 | 55 | 3.24 | 1.69 | |||
| 46- | 40 | 3.17 | 1.99 | |||
| Total | 252 | 3.13 | 1.70 | |||
| What is your level of satisfaction with the current digital educational tools? | 18-25 | 82 | 1.00 | 0.00 | 104.912 | 0.000** |
| 26-35 | 75 | 1.00 | 0.00 | |||
| 36-45 | 55 | 1.00 | 0.00 | |||
| 46岁以上 | 40 | 2.58 | 1.30 | |||
| Total | 252 | 1.25 | 0.77 | |||
| * p<0.05 ** p<0.01 | ||||||
Variance:
Age demonstrated significant differences at the 0.01 level (F=5.337, p=0.001) concerning the usual use of digital educational tools. Specific comparative differences revealed that the mean scores of age groups “26-35 > 18-25; 36-45 > 18-25” were notably different, which can also be visually displayed using line graphs. As for the frequency of digital educational tool usage each week, significant differences were again apparent at the 0.01 level (F=47.145, p<0.001), with the mean score comparisons indicating substantial differences: “18-25 > 26-35; 36-45 > 18-25; 18-25 > over 46; 36-45 > 26-35; 36-45 > over 46,” which can also be represented using line graphs for intuitive presentation.
Furthermore, age showed significant differences at the 0.01 level (F=22.215, p<0.001) in perceptions of the extent to which digital educational tools facilitate symbiotic education. The mean score comparisons revealed significant differences, with “18-25 > 26-35; 36-45 > 18-25; 18-25 > over 46; 36-45 > 26-35; 36-45 > over 46,” and these relationships can also be depicted using line graphs.
In terms of the main challenges encountered when using digital educational tools, significant differences emerged at the 0.05 level (F=3.686, p=0.013), with mean score comparisons indicating that “18-25 > 26-35; 36-45 > 26-35,” which can also be illustrated through line graphs.
Regarding satisfaction with current digital educational tools, age showed significant differences at the 0.01 level (F=104.912, p<0.001), with the mean score comparisons showing distinct disparities: “over 46 > 18-25; over 46 > 26-35; over 46 > 36-45,” which can also be visually presented using line graphs.
In summary, significant differences were observed across all age samples concerning the usual use of digital educational tools, the weekly frequency of using digital educational tools, perceptions of digital tools’ contribution to symbiotic education, the main challenges encountered, and satisfaction with current digital educational tools.
Table 11.
This is a table.ANOVA results.
| ANOVA results (normal format) | ||||||
| Analysis item | Item | Sample size | Average | Standard deviation | F | p |
| How do you typically use digital educational tools? | Male | 125 | 2.78 | 1.10 | 0.042 | 0.837 |
| Female | 127 | 2.76 | 1.07 | |||
| Total | 252 | 2.77 | 1.08 | |||
| What is your frequency of digital educational tools usage per week? | Male | 125 | 1.80 | 1.01 | 2.133 | 0.145 |
| Female | 127 | 1.63 | 0.83 | |||
| Total | 252 | 1.71 | 0.93 | |||
| To what extent do you think digital educational tools contribute to the realization of symbiotic education? | Male | 125 | 1.84 | 1.00 | 0.100 | 0.752 |
| Female | 127 | 1.88 | 1.10 | |||
| Total | 252 | 1.86 | 1.05 | |||
| What are the main challenges you encounter when using digital educational tools? | Male | 125 | 2.82 | 1.55 | 8.331 | 0.004** |
| Female | 127 | 3.43 | 1.79 | |||
| Total | 252 | 3.13 | 1.70 | |||
| How satisfied are you with the current digital educational tools? | Male | 125 | 1.17 | 0.68 | 2.825 | 0.094 |
| Female | 127 | 1.33 | 0.85 | |||
| Total | 252 | 1.25 | 0.77 | |||
| * p<0.05 ** p<0.01 | ||||||
Gender For 7 WhGender For 7 What are the main challenges you encounter when using digital educational tools? It shows significance at the 0.01 level (F=8.331, p=0.004), and the specific comparison shows that the average value of men (2.82) is significantly lower than the average value of women (3.43).
In summary, we can know: How do you usually use digital educational tools for different gender samples? How often do you use digital educational tools every week? To what extent do you think digital educational tools help achieve symbiotic education?, how satisfied are you with current digital education tools? A total of 4 items will not show significant differences. In addition, gender samples have 7 What are the main challenges you encounter when using digital educational tools? A total of 1 item showed a significant difference.
Table 12.
This is a table.ANOVA results.
| ANOVA results (normal format) | ||||||
| Analysis Item | Item | Sample Size | Mean | Standard Deviation | F | p |
| How do you typically use digital educational tools? | Undergraduate Students | 42 | 2.12 | 0.71 | 6.924 | 0.000** |
| Graduate Students | 6 | 3.00 | 1.79 | |||
| Teachers | 184 | 2.95 | 1.04 | |||
| Administrative Staff | 9 | 2.00 | 1.22 | |||
| Others | 11 | 2.73 | 1.35 | |||
| Total | 252 | 2.77 | 1.08 | |||
| What is your frequency of digital educational tools usage per week? | Undergraduate Students | 42 | 2.02 | 0.41 | 1.645 | 0.164 |
| Graduate Students | 6 | 1.33 | 0.52 | |||
| Teachers | 184 | 1.66 | 1.00 | |||
| Administrative Staff | 9 | 1.78 | 1.20 | |||
| Others | 11 | 1.64 | 0.81 | |||
| Total | 252 | 1.71 | 0.93 | |||
| To what extent do you think digital educational tools contribute to the realization of symbiotic education? | Undergraduate Students | 42 | 2.14 | 0.57 | 1.248 | 0.291 |
| Graduate Students | 6 | 1.50 | 1.22 | |||
| Teachers | 184 | 1.80 | 1.08 | |||
| Administrative Staff | 9 | 2.11 | 1.17 | |||
| Others | 11 | 1.73 | 1.62 | |||
| Total | 252 | 1.86 | 1.05 | |||
| What are the main challenges you encounter when using digital educational tools? | Undergraduate Students | 42 | 3.76 | 1.71 | 3.124 | 0.016* |
| Graduate Students | 6 | 1.83 | 0.75 | |||
| Teachers | 184 | 3.08 | 1.68 | |||
| Administrative Staff | 9 | 2.22 | 1.64 | |||
| Others | 11 | 3.00 | 1.73 | |||
| Total | 252 | 3.13 | 1.70 | |||
| How satisfied are you with the current digital educational tools? | Undergraduate Students | 42 | 1.00 | 0.00 | 2.965 | 0.020* |
| Graduate Students | 6 | 1.50 | 1.22 | |||
| Teachers | 184 | 1.26 | 0.79 | |||
| Administrative Staff | 9 | 1.89 | 1.27 | |||
| Others | 11 | 1.36 | 0.81 | |||
| Total | 252 | 1.25 | 0.77 | |||
| * p<0.05 ** p<0.01 | ||||||
Educational background exhibited significant differences at the 0.01 level (F=6.924, p<0.001) in terms of how digital educational tools are typically used, with a notable discrepancy in mean scores indicating that “teachers > undergraduates; teachers > administrative staff.” These differences can also be visually represented through a line graph for intuitive display.
Regarding the main challenges encountered when using digital educational tools, educational background showed significant differences at the 0.05 level (F=3.124, p=0.016). The mean score comparison revealed marked differences among groups with “undergraduates > graduate students; undergraduates > teachers; undergraduates > administrative staff,” which can also be depicted using a line graph.
In terms of satisfaction with current digital educational tools, the educational background again showed significant differences at the 0.05 level (F=2.965, p=0.020), with mean score comparisons yielding “teachers > undergraduates; administrative staff > undergraduates; administrative staff > teachers,” also suitable for line graph representation.
In summary, there were no significant differences in the frequency of digital educational tool use per week and the perceived contribution of digital educational tools to facilitating symbiotic education across different educational background samples. However, three areas did present significant differences based on educational background: the typical use of digital educational tools, the main challenges encountered, and satisfaction with current digital educational tools.
Table 13.
This is a table.Correlation.
| Pearson related-detailed format | ||||
| To what extent do you think digital educational tools contribute to the realization of symbiotic education? | What are the main challenges you encounter when using digital educational tools? | How satisfied are you with the current digital educational tools? | ||
| To what extent do you think digital educational tools contribute to the realization of symbiotic education? | Correlation coefficient | 1 | ||
| p value | - | |||
| Sample size | - | |||
| What are the main challenges you encounter when using digital educational tools? | Correlation coefficient | 0.187** | 1 | |
| p value | 0.003 | - | ||
| Sample size | 252 | - | ||
| How satisfied are you with the current digital educational tools? | Correlation coefficient | -0.218** | -0.001 | 1 |
| p value | 0.000 | 0.990 | - | |
| Sample size | 252 | 252 | - | |
| * p<0.05 ** p<0.01 | ||||
The table above enables us tTThe table above enables us to understand the correlations studied between the perceptions of the effectiveness of digital educational tools in facilitating symbiotic education, the main challenges encountered while using these tools, and the satisfaction with the current digital educational tools, using Pearson’s correlation coefficient to represent the strength of these relationships. The specific analysis reveals that the correlation coefficient between perceptions of the effectiveness of digital educational tools in facilitating symbiotic education and the main challenges encountered is 0.187, which is significant at the 0.01 level. This indicates a significant positive correlation between the perceived effectiveness of digital educational tools in facilitating symbiotic education and the main challenges encountered while using them. Furthermore, the correlation coefficient between the perceived effectiveness of digital educational tools in facilitating symbiotic education and satisfaction with these tools is -0.218, which is also significant at the 0.01 level, thereby indicating a significant negative correlation between the two variables. These findings suggest that while there is a recognition of the positive role of digital tools in symbiotic education, the challenges encountered in using these tools are significantly related to the overall satisfaction with the digital educational tools.
4. Research Results
4.1. Quantitative Analysis Conclusions
Statistical analysis of survey data from 200 students and 40 teachers revealed the following key findings:
Frequency of Digital Tool Usage: The vast majority of students and teachers report using digital learning resources at least once a week. Students primarily use digital resources for completing assignments and autonomous learning, while teachers use them mainly for course preparation and interactive teaching. In terms of satisfaction, students and teachers’ ratings indicated above-average and high satisfaction with digital learning resources, respectively. However, students rated usability lower than content quality.
Perception of Symbiotic Education Concept: In the survey, more than half of the students and teachers believe that digital education supports the implementation of the symbiotic education concept to some extent. Both students and teachers generally agree that digital tools help access multicultural content.
Statistical Significance Tests: Chi-square tests revealed significant differences in the frequency of digital tool usage between urban and rural schools, with rural schools using them less frequently. Additionally, teachers’ satisfaction with digital tools was negatively correlated with their age, suggesting that younger teachers are more inclined to use these tools.
4.2. Qualitative Data Theme Analysis
Semi-structured interviews revealed the following themes: in terms of the applicability of digital tools, teachers and students discussed how digital tools help them connect with content from different cultures. For example, one teacher mentioned, “Through online forums and blogs, we are able to bring more cultural perspectives to our students.” In terms of technical challenges, many participants expressed concerns about technical issues, especially students and teachers in rural areas who face bandwidth and hardware limitations. “Even with the willingness, technical limitations make it hard to fully realize symbiotic education,” said a student from a rural school. Regarding the challenges and opportunities of cultural symbiosis, while many participants saw the potential of digital education in promoting cultural symbiosis, they also pointed out the practical challenges such as cultural misunderstandings and information overload. “Sometimes, the sheer amount of information makes it difficult for students to find valuable content,” one teacher mentioned. In terms of educational equity, during interviews, educational equity became a prominent topic. Participants worried that the digitalization process might exacerbate the uneven distribution of resources. “We need to ensure that every student has equal access to high-quality digital resources,” emphasized a professor from an urban university.
Conclusion: Integrating the results of quantitative data analysis and qualitative thematic analysis, it is evident that although digital tools have been widely used in higher education and support the implementation of the symbiotic education concept to a certain extent, significant challenges remain in terms of technical hurdles, cultural symbiosis practices, and educational equity. Future research will further explore how to address these issues and propose specific strategic recommendations.
5. Discussion
The findings of this study reveal the complex impact of the digitalization of higher education on the promotion of symbiotic education. The quantitative analysis shows that the prevalence and frequent use of digital tools indicate that higher education institutions have recognized the potential of technology in disseminating educational resources. Furthermore, the high satisfaction levels reflected in the survey suggest that students and teachers have widely accepted and are actively engaged in digital learning, corroborating previous research (see Literature Review) that digital education can enhance the accessibility of learning resources.
However, the thematic analysis of qualitative data indicates that there are significant challenges in the practice of technological challenges and cultural symbiosis in realizing the concept of symbiotic education. Despite technology providing a platform for cross-cultural communication, it cannot resolve all misunderstandings and barriers in cultural exchange by itself. Moreover, the inequality in access to technology, particularly the disparities between urban and rural areas, reveals underlying issues of educational inequity.
5.1. Comparison with Theory and Existing Research
In line with the existing literature, this study finds that while digital tools can facilitate the sharing of educational resources and diversification of knowledge (as discussed in previous studies), single-handed technological intervention is insufficient for creating a lasting and profound symbiotic educational environment. More targeted strategies are required to utilize these tools effectively, resonating with the cultural symbiosis theory that emphasizes the diversity of education and depth of exchange.
5.2. Practical Implications of the Findings
The practical significance of the study lies in emphasizing that digital strategies need to be refined to a level that can address cultural diversity and achieve educational equity. For instance, while online platforms may allow students worldwide to access the same courses, if these courses cannot adapt to cultural differences, their actual educational value is limited. Therefore, educators should consider the localization of course content and modes of communication, as well as how technology can be used to decrease rather than increase educational disparities.
Additionally, the high acceptance and usage rates of digital tools provide a new direction for educational strategies. School administrators need to ensure that further integration of technology encourages rather than inhibits cultural symbiosis, and there is also a need to raise awareness of technological challenges, especially in rural and resource-limited areas.
5.3. Implementation of Digitalization Strategies
The implementation of digitalization strategies within the framework of symbiotic education demands a nuanced approach that considers the multifaceted nature of cultural interaction. It is essential to align technological advancements with pedagogical objectives to foster an educational environment where diverse cultural backgrounds are not only acknowledged but integrated into the learning process.
Strategies for digitalization must, therefore, be tailored to meet the specific needs of the educational community they serve. This involves not only providing the necessary technological infrastructure but also ensuring that digital tools are utilized in a manner that complements and enhances traditional educational methods. The goal is to create a hybrid educational model that leverages the best aspects of both digital and conventional educational practices.
Moreover, the digital divide – the gap between those who have access to modern information and communication technology and those who do not – must be addressed as a priority. Efforts to bridge this divide should focus on providing equitable access to technology and ensuring that students and teachers alike are equipped with the digital literacy skills needed to participate fully in a digitally-enabled educational landscape.
Furthermore, the strategies must be dynamic and adaptable, capable of evolving with the rapidly changing technological landscape. Regular assessment and revision of digitalization strategies will ensure that they remain effective and relevant. In this way, the implementation of digitalization strategies can contribute to the development of a symbiotic educational model that is inclusive, equitable, and conducive to the exchange of diverse cultural perspectives.
5.4. Conclusion of Discussion
In conclusion, this study underscores the transformative potential of digitalization in higher education within the context of symbiotic education. The findings illustrate that while digital tools have facilitated unprecedented access to educational resources, thereby supporting the pedagogical shift towards a more inclusive and collaborative learning environment, there remain significant challenges that need to be addressed.
The study identifies a critical need for strategies that extend beyond mere access to technology. To achieve a genuinely symbiotic educational environment, there must be a concerted effort to ensure that digital tools are leveraged to foster deep cultural understanding and exchange. This includes the creation of digital content that is culturally sensitive and pedagogically sound, as well as the development of platforms that enable meaningful interactions among diverse educational stakeholders.
Additionally, the research points to the importance of ongoing support and training for educators and students in the use of digital tools. This is essential to build the competencies required to navigate and contribute to a digital learning space that is truly symbiotic in nature.
Looking forward, the insights gained from this study can inform the development of digital education policies and practices that are sensitive to the nuances of cultural diversity and symbiosis. It is through such informed approaches that higher education can harness the full potential of digitalization to enrich the educational experience and prepare students for the complexities of a globalized world.
6. Conclusion and Recommendations
This study aims to explore the construction of digital higher education under the perspective of symbiotic education. The results indicate that digital education has significant potential to popularize the concept of symbiotic education, with students and teachers generally believing that digital resources aid in the understanding and application of cultural diversity. However, the findings also reveal key issues, including unequal access to technology and limitations of digital education in achieving in-depth cultural exchange and understanding.
6.1. Suggestions for Future Research
Based on the findings of this study, suggestions for future research include: Future studies should analyze in greater depth how different types of digital tools facilitate or hinder cultural symbiosis and explore which specific technologies or strategies are most effective. Research should focus on how policymakers can support digital education through policies and practices, especially in efforts to promote educational equity and cultural diversity. Future research could assess the specific needs and preferences of student groups from different cultural backgrounds for digital learning resources and how these resources can better serve them. By comparing the application and effects of digitalization in higher education in different countries or regions, a more comprehensive perspective can be provided to promote the implementation of the concept of symbiotic education globally.
6.2. Limitations of the Study
The limitations of this study mainly lie in the following aspects: In terms of sample size and scope, the study’s sample mainly comes from two educational institutions, which may not fully represent all higher education environments. Future studies should expand the sample range to include more regions and types of educational institutions. In terms of data collection methods, this study relied on self-reported questionnaires and semi-structured interviews, which may introduce subjective bias. Future research could use more objective data collection methods, such as classroom observation and analysis of learning outcomes. In terms of research design, as an exploratory study, this research did not deeply analyze all the variables that may affect the relationship between digital education and symbiotic education. Future research should include more rigorous experimental designs. And in terms of practical challenges, when applying research results to practice, the following challenges may be encountered, such as the uneven distribution of educational resources in different regions that may affect the implementation of the concept of symbiotic education, which requires targeted strategies to ensure the effective and fair use of resources; such as differences in technology access and usage capabilities among students and teachers need to be addressed through professional training and support; and maintaining cultural sensitivity and adaptability in the design and application of digital educational materials is a significant challenge.
In summary, this study provides preliminary insights into understanding and promoting the construction of digital higher education under the perspective of symbiotic education. Future research and practice should continue to deepen on this basis, contributing to the creation of a more inclusive and diverse educational environment.
Appendix A. Research Questionnaire Basic Information
1What is your age?
18-25 years old
26-35 years old
36-45 years old
Over 46 years old
2What is your gender?
male
female
other
3What is your educational background?
undergrad
postgraduate
teacher
manager
other
Digital education experience
4. How do you usually use digital education tools?
learn new knowledge
finish homework
Course teaching
Course Design
other
5How often do you use digital education tools each week?
every day
several times a week
Occasionally
almost never used
The realization of the concept of symbiotic education
6. To what extent do you think digital educational tools contribute to achieving symbiotic education?
very helpful
helpful
neutral
helpless
very helpless
7What are the main challenges you encounter when using digital educational tools?
technical problem
resource quality
Resource acquisition
language disability
cultural understanding
other
Satisfaction and feedback
8. How satisfied are you with current digital education tools?
Very satisfied
satisfy
neutral
Not satisfied
Very dissatisfied
How do you think digital educational tools can be improved to better promote symbiotic education?
[Open answer]
Appendix B. Semi-Structured Interview Outline
[Open answer]
In your experience, how do these tools facilitate or limit exchange and symbiosis between cultures?
What challenges have you encountered using these tools?
What strategies do you think can be adopted to overcome these challenges?
In your opinion, what are the positive and negative impacts of technology on the realization of the concept of symbiotic education?
How do you think future technological developments should better support symbiotic education?
References
- wang,Dawei. (2020). Research on the digital transformation of higher education in China. Beijing: Education Science Press.
- Zhang,Yanmei & LiXiaohua. (2019). Higher education innovation path from a multicultural perspective. Educational Research, 40(3),115-123.
- Smith, J. A., & Tan, X. (2021). Bridging Cultural Gaps in Digital Higher Education. Journal of International Education, 35(2), 200-219.
- Johnson, L., Adams Becker, S., Estrada, V., & Freeman, A. (2015). NMC Horizon Report: 2015 Higher Education Edition. Austin, Texas: The New Media Consortium.
- UNESCO. (2019). Guidelines for Ensuring Inclusion and Equity in Education. Retrieved from http://unesdoc.unesco.org/images/0024/002482/248254e.pdf.
- Chen, G., Davis, D., Hauff, C., & Houben, G. J. (2018). Learning Analytics in Higher Education—An Analysis of Case Studies. American Behavioral Scientist, 62(1), 29-49.
- Li, M., & Bostwick, K. (2020). Rethinking Digital Higher Education: The Echo of Equity. Journal of Educational Technology & Society, 23(1), 16-26.
- Kumar, S., & Ochoa, M. N. (2020). Promoting Intercultural Competence in Digital Learning Environments. Online Learning Journal, 24(1), 5-20.
- Bennett, L., & Folley, S. (2014). A Tale of Two Modes: Initial Reflections on an Innovative MOOC. Research in Learning Technology, 22. [CrossRef]
- Zhao, Y. (2019). Build Symbiotic Higher Education Ecosystem in the Digital Age. Higher Education Studies, 9(1), 25-34.
Disclaimer/Publisher’s Note: The statements, opinions and data contained in all publications are solely those of the individual author(s) and contributor(s) and not of MDPI and/or the editor(s). MDPI and/or the editor(s) disclaim responsibility for any injury to people or property resulting from any ideas, methods, instructions or products referred to in the content. |
© 2023 by the authors. Licensee MDPI, Basel, Switzerland. This article is an open access article distributed under the terms and conditions of the Creative Commons Attribution (CC BY) license (http://creativecommons.org/licenses/by/4.0/).
Copyright: This open access article is published under a Creative Commons CC BY 4.0 license, which permit the free download, distribution, and reuse, provided that the author and preprint are cited in any reuse.


