
Submitted:
20 December 2023
Posted:
20 December 2023
You are already at the latest version
Abstract
The use of aerobic granular sludge is a promising and future-proof solution for wastewater treatment. The implementation of this technology requires the development of efficient and cost-effective methods for the management of excess sludge. The aim of the research was to evaluate the effects of hydrodynamic cavitation on the efficiency of aerobic granular sludge digestion. Respirometric measurements were performed at a temperature of 38°C and an initial organic load of 5.0 gVS/L. The changes in the properties of the pre-treated biomass, the kinetics of methane fermentation, the amount and composition of the biogas produced and an energetic evaluation of the process were carried out. A significant influence of hydrodynamic cavitation on the transfer of organic compounds into the dissolved phase was demonstrated. The degree of solubilisation was 37% for COD and 42% and for TOC. The efficiency of CH4 production from the pre-treated sludge reached a value of 496±12 mL/gVS, which corresponds to an increase of 19.6% compared to the raw biomass. The influence of cavitation on the CH4 content of the biogas was not observed. Strong correlations were found between the efficiency of anaerobic digestion and the concentration of dissolved organic compounds and the hydrodynamic cavitation time used. The highest net energy production of 2.89 Wh/gTS was achieved after 15 minutes of pre-treatment.
Keywords:
aerobic granular sludge
; hydrodynamic cavitation
; pretreatment
; solubilization degree
; anaerobic digestion
; methane
1. Introduction
In recent years, interest in wastewater treatment processes based on aerobic granular sludge (AGS) has increased considerably. The use of AGS is now seen as a promising, universal solution with great application potential [1]. It is characterised by a high level of technical readiness and certain advantages over the typical suspended activated sludge. The specific granular structure of the microbial community gives it specific, technologically desirable biochemical properties and physical characteristics [2]. Planners and operators of wastewater treatment plants point above all to the lower investment and operating costs of systems based on AGS. The increasing competitiveness is related to the possibility of using smaller volumes of biological treatment chambers and settling tanks for the separation of AGS from wastewater discharged into the environment [3].
However, remediable weaknesses, technical difficulties and emerging operational problems are still being identified [4]. Solutions are being sought to improve the methods of biodegradation of pollutants based on AGS, as well as technologies for the processing, stabilisation and neutralisation of this type of sewage sludge [5]. The direction is to improve economic profitability and technological efficiency, which should additionally increase the popularisation and dissemination of AGS-based solutions. The main weaknesses include not fully understood mechanisms for the synthesis of compact and durable granules, a long granulation period, the lack of standardised technical, technological and operational guidelines for the granulation process and the selection of system operating parameters that ensure the stability of AGS structures in reactors, or a relatively small number of plants in operation, which limits the possibility of obtaining inoculum for newly designed and built bioreactors [6].
Another frequently mentioned major obstacle to the competitiveness of AGS is the limited knowledge about the management and final neutralisation of excess sludge. One of the most popular, well-known and widely used methods for processing the sewage sludge produced in wastewater treatment plants is anaerobic digestion [7]. It is a very well-known technology that is commonly used as one of the processing steps of typical suspended activated sludge to stabilise it, reduce its volume, improve dewaterability, remove organic matter, improve sanitary and fertilising properties, reduce odour nuisance and produce biogas or biomethane [8].
Due to the different properties and characteristics of AGS, the processes currently used must be tested, checked for their functional suitability and finally optimised to ensure the expected technological effectiveness of the anaerobic stabilisation of sewage sludge [9]. The process units and technological parameters of the methane fermentation process should be adapted to a substrate with a slightly different chemical composition, structure and properties. So far, relatively few studies have focused on the analysis and optimisation of anaerobic digestion of AGS. Therefore, there is a real need to expand the available knowledge in this field, confirm existing findings, verify available results and ultimately identify the best technological solutions [10]. It is important to identify the areas where future research and practical efforts are needed that will improve scientific knowledge and influence the practical application of the anaerobic digestion process to stabilise AGS.
In order to improve the efficiency of biogas production from sewage sludge, pre-treatment processes are very often introduced into the anaerobic digestion process line [11]. It leads to the decomposition of the substrate by breaking down the walls and other cellular structures of the microorganisms that form the structure of the activated sludge. The effect of pre-treatment is to transfer organic matter into the dissolved phase, making it more available to the fermentation bacteria and resulting in a higher anaerobic conversion rate [12]. Considering the granular and compact structure of AGS, the significant content of extracellular polymeric substances and the large proportion of filamentous bacteria in the population forming the granules, the use of pre-treatment processes is even more justified.
There are few reports on the effects of AGS disintegration on the technological efficiency and economic profitability of anaerobic digestion. Thermal hydrolysis [13], ultrasonic disintegration [14] and the use of solidified carbon dioxide [15] have been investigated. Therefore, there is a large space for additional knowledge on the evaluation of the impact of other pretreatment methods on the efficiency of anaerobic digestion of AGS and the final technological effects and energy consumption. The paper presents the first investigation of the possibility of using hydrodynamic cavitation for the disintegration of AGS and the impact of this pretreatment on the course and effects of anaerobic digestion.
The main objective of the research was to determine the influence of AGS pretreatment with a hydrodynamic cavitation generator on the effectiveness of anaerobic stabilisation in the process of mesophilic methane fermentation. The influence of this disintegration method on the composition of the AGS biomass, the changes in the concentration of organic compounds in the dissolved phase, the efficiency and kinetics of biogas production as well as the qualitative composition and chemical properties of the sludge after fermentation were evaluated. Finally, an energy balance was drawn up to demonstrate the competitiveness of pre-treatment with a hydrodynamic cavitation generator.
2. Materials and Methods
2.1. Organisation of the experiment
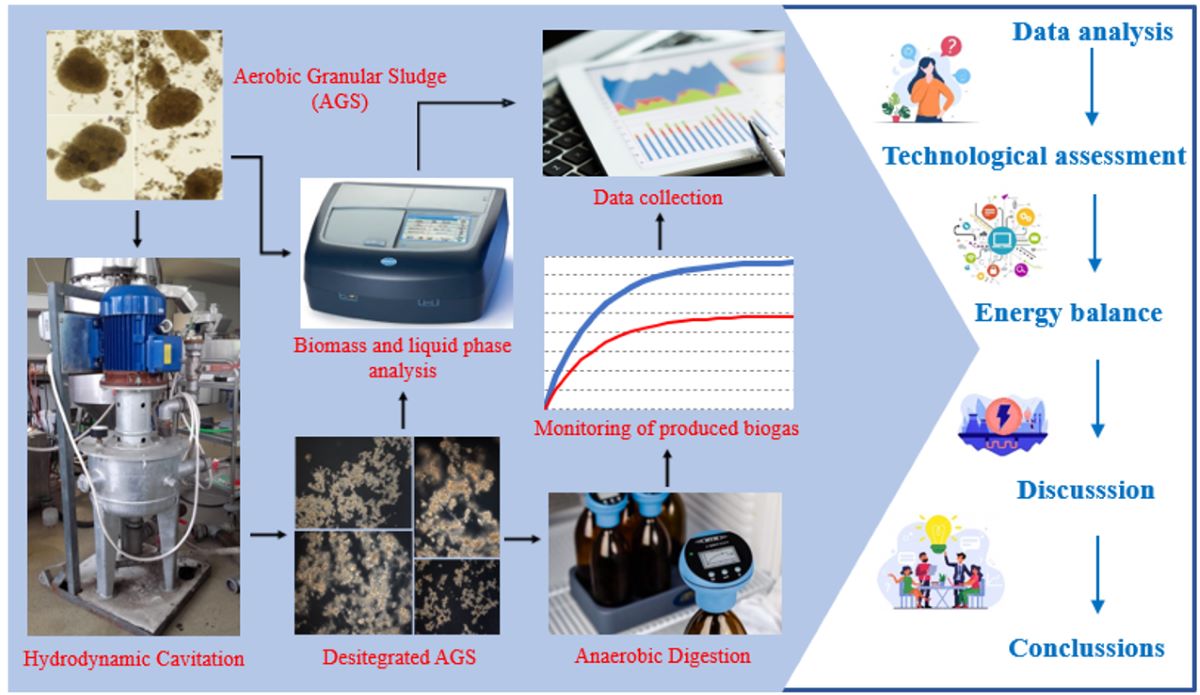
The experiments were divided into two stages. In stage 1, the pretreatment of aerobic granular sludge (AGS) using the hydrodynamic cavitation was carried out. The research focussed on the observation of changes in the chemical properties of the AGS. In stage 2, the disintegrated AGS was directed to anaerobic stabilisation in the methane fermentation process. The research determined the kinetics of anaerobic digestion by monitoring the amount of biogas produced and its qualitative composition. In both stages, the experiments were divided into 8 variants, which were differentiated according to the hydrodynamic cavitation time used. A basic energy analysis of the process was also carried out. The experimental setup is shown in Figure 1 and the basic parameters and conditions are presented in Table 1.
2.2. Materials
2.2.1. Aerobic granular sludge (AGS)
The AGS used in the research was obtained from a sequential biological reactor (SBR) operated on a semi-technical scale. The bioreactor was used to purify synthetic wastewater mixed in a 3:1 ratio with overlying water separated from digested sewage sludge during mechanical dewatering (COD - 452±125 mgO2/L, TN - 146±63 mg/L, N-NH4 - 95±15 mg/L, TP – 25±7 mg/L, P-PO4 – 11±3 mg/L). The SBR work cycle lasted 12 hours and comprised the following phases: filling 0.2 h; aeration 11.4 h; sedimentation 0.2 h; discharge of treated wastewater 0.2 h. The volume exchange rate of the wastewater was 80%. In the aeration phase, compressed air was supplied at a rate of 3.75 L/min through a medium-bubble diffuser located at the bottom of the reactor. The AGS concentration in the SBR was maintained at 3500 mgTS/L. A schematic diagram of the SBR system used for AGS cultivation is shown in Figure 2 and the properties of AGS are listed in Table 2.
2.2.2. Inokulum of the anaerobic sludge (AS)
The model respirometric digesters used in stage 2 were inoculated with anaerobic sludge (AS) from closed digesters of the Municipal Wastewater Treatment Plant in Olsztyn. The digesters are fed with a mixture of primary sludge and excess sludge. The basic operating parameters are organic load rate (OLR) of approximately 2.4 kg VS/m3·d, hydraulic retention time (HRT) of 20 days and temperature of 35°C. The characteristics of the AS used in the study are presented in Table 2.
2.2.3. Hydrodynamic cavitation generator
Hydrodynamic cavitation (HC) was carried out in a mechanical disintegrator consisting of a multifunction rotor manufactured according to patent PL 214335 B1 (Figure 3). The cavitator consists of a multifunctional impeller rotating in a 25-litre tank and driven by an electric motor with a power of 4 kW and a rotation speed of 2800 rpm. The impeller is mounted on a shaft of a bearing system that is inserted into the interior of the tank through a cover and a leak plug, and is connected to the motor via a rubber-metal coupling. The inlet opening of the tank is located in the base, the outlet opening in the lid of the tank. The inlet and outlet are fitted with 2” valves and connected to a bypass with a 2” valve, which allows the medium to flow through without the tank. Once the tank is filled and the disintegration is started, the substrate is repeatedly pumped through the impeller due to centrifugal force. The medium, which is sucked into the interior through the inlet opening in the axis of the impeller, is processed and simultaneously shifts into the chambers closest to the outer edge and is finally expelled outside the impeller. As it flows through the successive channels and chambers of the impeller, it is alternately subjected to low and high pressure, which, at the appropriate speed of rotation, creates the conditions for the formation and disappearance of cavitation bubbles, which in turn have a destructive effect on the structure of the AGS. After a certain time, disintegrator’s motor is stopped and the substrate is replaced. Once the shredding process is complete, the substrate is removed from the tank during the refilling process, as it is displaced by the newly filled batch of medium.
2.2.4. Respirometric measurements
The influence of AGS hydrodynamic cavitation on the efficiency of anaerobic digestion was analysed using respirometric measurements under mesophilic fermentation conditions (38±0.5°C). AGS was introduced into batch OxiTop bioreactors (WTW, Germany), which consist of reaction chambers with a total volume of 500 mL that are permanently connected to measuring and recording devices (Figure 4).
The respirometers were inoculated with inoculum - AS from the closed fermentation chambers of the MWWTP in Olsztyn (Table 2). An amount of AGS was added to 200 mL of AS to obtain an initial organic load of 5.0 gVS/L. The samples were then flushed with nitrogen to ensure anaerobic conditions. The retention time of the AGS was 20 days. The measurement was considered complete when the difference between three consecutive measurements of daily biogas production was no greater than 1%. The changes in partial pressure in the chamber caused by biogas production were analysed in respirometers.
2.3. Calculation Methods
The basis for calculating the amount of biogas produced was the ideal gas equation (1):
where n – number of moles of gas [mol], p – gas pressure [Pa], V – gas volume [m3], R – universal gas constant [8.314 J/mol·K], T – temperature [K].
n = (p·V)/(R·T)
Avogadro’s law was used to calculate the amount of gas produced, which assumes that under normal conditions, described by a temperature of 273 K and a pressure of 1013 hPa, one mole of gas takes up 22.4 L (2).
where V – volume of the gas [L], n – number of moles of the gas [mol], Vmol – molar volume of the gas [L]
V = n·Vmol
The specific energy input (Es) of the hydrodynamic cavitation in Wh/gTS was calculated as a function of the cavitation power and the amount of total solids in the pretreated sample (3):
where HCP is the hydrodynamic cavitation power [W], t is the duration of cavitation [h], and MTS is the total solids mass in the AGS pretreated by hydrodynamic cavitation [gTS].
Es=(HCP·t)/MTS
The gross energy output (EGout) in Wh/gTS generated from the methane production was calculated as (4):
where YCH4 is the methane production [L], CVCH4 is the methane calorific value [Wh/L], and MTS is the total solids mass of the digested AGS [gTS].
EGout=(YCH4 ·CVCH4)/MTS
The net energy output (ENout) in Wh/gTS was calculated as (5):
ENout= EGout − ES
The net energy gain (Enet) in Wh/gTS was calculated by subtracting the energy output in the n–variant and the energy output in variant 0 (without cavitation) as follows (6):
where E NoutVn is the net energy output in the n–variant with hydrodynamic cavitation [Wh/gTS] and ENoutV0 is the net energy output in variant ) without hydrodynamic cavitation [Wh/g VS].
Enet= ENout Vn – ENout V0
Equations (7) and (8) present, respectively, the COD and TOC solubilization degree [%] calculation [16,17]. In this equation, sCODS0/sTOCS0 is the soluble COD/TOC before the HC [mg/L], sCODS1/sTOCS1 is the soluble COD/TOC after the HC, and CODT0/TOCT0 is the total COD/TOC [mg/L] before the HC.
COD solubilization degree = [(sCODS1 − sCODS0)/(CODT0 − sCODS0)] × 100
TOC solubilization degree = [(sTOCS1 − sTOCS0)/(TOCT0 − sTOCS0)] × 100
2.4. Analytical procedures
The content of total solids (TS), volatile solids (VS) and minerals solids (MS) was determined using the gravimetric method in accordance with the PN-EN 14346:2011 standard. The total nitrogen (TN) content was determined using the distillation method after prior mineralisation of the sample with sulphuric acid in accordance with the standard [PN-81/C-04527]. The protein content was estimated by multiplying the NT value by the conversion factor to protein, which is 6.25 [18]. The analysis of the chemical oxygen demand (COD) was carried out using the colorimetric method according to Hach (LCK 114, 150 - 1000 mgO2/L and LCK014 1000 - 10000 mgO2/L). The samples for COD determination were centrifuged in a ROTINA 380 laboratory centrifuge for 3 min at a rotation speed of 9000 rpm. The samples were then filtered through a membrane philtre with a pore diameter of 1.2 µm according to the Hach method and then determined colorimetrically using a Hach DR6000 spectrometer (Hach, Loveland, CO, USA). The measurement of total carbon (TC), inorganic carbon (IC) and total organic carbon (TOC) was carried out using a Shimadzu TOC analyser. The sample is fed into an incinerator fuelled with purified air. In the furnace, the sample is burnt by heating to 680°C over a platinum catalyst, decomposed and converted into carbon dioxide. The resulting carbon dioxide is cooled, dried and detected using an NDIR analyser. The fat content in the samples was determined using the gravimetric method after the solvent had evaporated and the residue had been dried at a temperature of 105°C. The analysed samples were acidified with HCl to a pH value of 1. The prepared samples were evaporated to dryness and quantitatively transferred to thimbles, which were placed in a Soxhlet apparatus and extracted in the presence of petroleum ether. The quality of the biogas produced was analysed using an Agilent 7890A GC gas chromatograph with TCD detector.
2.5. Statistical methods
The biogas and methane production rate (r) and the rate constants (k) were calculated using the iterative non-linear regression method [19]. The experiments were carried out in four replicates. The assessment of the statistical significance of differences between the analysed variables was carried out at the applied significance level of α = 0.05 using Statistics 13.3 software (Statsoft, Inc., Tulsa, OK, USA). The following tests were used: Shapiro-Wilk (assessment of normality of distribution), ANOVA (significance of differences between variances), Levene (homogeneity of variances in groups), Tukey’s HSD (significance of differences between variables).
3. Results and discussion
3.1. Aerobic granular sludge properties
During the experiment, the influence of HC on the changes in the concentration of solubilised organic compounds was monitored. A significant increase in COD and TOC concentrations in the dissolved phase was observed (Table 3).
Analysis of the variability of the concentration of organic compounds in dissolved form is an indicator commonly used to evaluate the effectiveness of sewage sludge disintegration process [20]. Based on established correlations, dependencies and optimisation models, it is possible to estimate the efficiency of biogas/methane production using dissolved COD and TOC values [21]. Other indicators can also be helpful, such as the content of mineral forms of phosphorus and nitrogen as well as fragments of microbial cells or DNA strands [22]. However, the use of COD and TOC indicators is the most common [23]. Information on the effectiveness of pretreatment can be supplemented by images of biomass before and after the disintegration process [24]. An image of raw AGS (Figure 5A) and selected variants of the HC process is shown in Figure 5B. It should be emphasised that the granular structure of AGS was already destroyed after 1 min of disintegration (V1), but this was not correlated with the transfer of the organic matter into the dissolved phase.
A strong correlation was found between the pre-treatment time and consequently the applied energy dose and the systematic and dynamic increase in the concentration of dissolved organic compounds (Figure 6A). Similar observations were confirmed by Şaǧban et al. (2018) [25] and Kim et al. (2019) [26] when investigating the effectiveness of waste activated sludge (WAS) pretreatment. The use of a rotor-stator type hydrodynamic cavitation reactor (HCR) enabled a gradual increase in dissolved COD with increasing energy input [26]. Lee and Han (2013) [27], who used HC to disintegrate WAS, also showed a close relationship between the time of HC application and the concentration of dissolved organic compounds. In the study by Mancuso et al. (2019) [28], it was found that the use of HC as a mechanical pretreatment of WAS at a pressure of 2 bar and a temperature of 20°C did not ensure effectiveness in sludge solubilization. This value for the inlet pressure was chosen to minimise the costs associated with the use of HC [28].
In the case of COD, an increase from 225±20 mgO2/L in raw AGS to 1318±77 mgO2/L after 20 min of HC was observed (V6). This relationship reached a very high coefficient of determination R2 = 0.9365 (Figure 6A). The solubilisation degree varied from 4.4±0.7% after 1.0 min of HC (V1) to 36.1±1.9% after 20 min pretreatment of AGS (Figure 6B). The increase in pretreatment time no longer had a significant effect on the changes in the concentration of dissolved COD, whose value was within a narrow range from 1332±63 mgO2/L after 25 min of disintegration (V7) to 1305±91 mgO2/L after 50 min of HC (V8) (Table 3). The degree of solubilisation ranged from 36.1±1.9% (V8) to 37.0±1.7% (V7) (Figure 6B). This is consistent with the results of Lee and Han (2013) [27]. The times for HC pretreatment were set at 1, 5, 10, 15 and 20 minutes. The degree of solubilisation increased with HC time from 11.52 to 23.67% [27]. Kim et al. (2019) [26], who analysed changes in the concentration of dissolved COD, also observed similar correlations. The concentration of this indicator was 369.5 mg/L, which meant a dissolution rate of 16.9%. The specific energy input of HC was 84,5 kJ/kgTS. A further increase in the dose of specific energy input led to an increase in the concentration of dissolved COD and solubilization degree. At a dose of 167,7kJ/kgTS, a COD concentration of 483.5 mg/L and a solubilisation rate of 28.8% were achieved. The dose of 248,5 kJ/kgTS increased the COD concentration to 562 mg/L and a solubilisation rate of 36.9%. The specific energy input of 329,8 kJ/kgTS in turn led to an increase in the COD concentration to 633 mg/L and a solubilisation rate of 42.3% [26]. In the study by Mancuso et al. (2019) [28], 1 hour of HC at a pressure of 2 bar resulted in a solubilization degree of only 1.4%. An increase in dissolved COD from 228 to 617 mg/L was observed [28]. However, higher decay values can be achieved by changing the HC operating conditions such as inlet pressure and HC time [27,29]. In another study Mancuso et al. (2021) [30] investigated the effects of HC time on the concentration of dissolved COD. HC times of 0, 1, 2, 4 and 8 h resulted in dissolved COD concentrations of 244, 992, 1719, 2693 and 4578 mg/L, respectively [30].
Monitoring the changes in dissolved TOC content proved that a systematic increase in concentrations occurred in the range of the four shortest disintegration times tested (Table 3). In the liquid phase, the raw AGS value was 72.2±13.7 mg/L (V0), while after 10 min of HC a value of 352.4±21.2 mg/L was observed, corresponding to an almost fivefold increase in concentration. The linear correlation was very strong and the coefficient of determination was R2 = 0.9168 (Figure 6A). In this variant, the degree of solubilisation achieved was 5.5±1.2% (Figure 6B). The use of a longer disintegration time did not lead to an increase in TOC transfer to the liquid phase. The observed concentrations were statistically comparable and ranged from 354.1±20.6 mg/L after 15 min of HC (V5) to 372.8±16.2 mg/L after 50 min in V8 (Table 3). The degree of solubilisation in these variants ranged from 39.3±4.2% (V5) to 41.9±3.4% (V8) (Figure 6B).
There was no significant effect of the AGS pretreatment technique used on other chemical indicators measured in the dry mass. No significant changes in the content of volatile solids, proteins and lipids were detected in the AGS biomass. The concentrations of these indicators were within narrow ranges of 39.3±0.9 - 42.4±1.8 mgVS/g for volatile solids, 196.9±8.7 – 242.5±7.5 mg/g for proteins and 0.40±0.1 – 0.60±0.2 mg/g for lipids (Table 3). These results are in agreement with those of Ferrentino and Andreottola (2020) [31], who used HC to decompose WAS. Samples were taken after 10, 20, 40 and 80 min and subjected to chemical analysis. The protein concentrations were in a narrow range of 650 - 740 µg/mL and increased with the increase in HC time, corresponding to a low increase in protein concentration of about 10% [31]. Other researchers also observed no significant changes in VS, proteins and lipids [30,32].
3.2. Efficiency and kinetics of anaerobic digestion
Biogas production ranged from 650.3±47.0 mL/gVS to 785.2±27.2 mL/gVS depending on the AGS hydrodynamic cavitation time used. The lowest anaerobic digestion efficiency was observed when AGS was not subjected to any pretreatment processes (V0). The unit volume of biogas in this variant was 631.0±37.0 mL/gVS (Table 4).
The process rate was r = 130 mL/d and the rate constant k = 0.21 1/d (Figure 7). A significant and systematic increase in biogas production was observed when the HC time from 1 min (V1) to 15 min (V5) was extended, achieving 767.6±17.2 mL/gVS (r = 190 mL/d, k = 0.25 1 /d) (Table 4, Fig 7). In this range, a strong linear correlation between the HC time and the amount of gaseous products of anaerobic process was found, which is described by the coefficient of determination R2 = 0.9936 (Figure 8A). A further increase in the cavitation energy doses directed to the AGS had no significant effect on the increase in anaerobic digestion efficiency. The productivity achieved was within a very narrow range from 769.3±22.9 mL/gVS at r = 116 mL/d, k = 0.22 (V7) to 785.2±27.2 mL/gVS at r = 123 mL/d , k = 0.23 1/d) (V8) (Table 4, Figure 7). HC has so far mainly been used for the disintegration of typical suspended WAS. The results obtained by Zupanc et al. (2023) [33] show that higher CH4 production was obtained in all WAS samples treated with HC than in the sample without this pretreatment method. Four types of HC were used, namely no cavitation regime, attached cavitation regime, developed cloud shedding cavitation regime and cavitation in a wake regime. The CH4 production was 262.5, 231.7, 220.7 mL/gVS and 187.1 mL/gVS, respectively, while the control sample had a CH4 production of 127.6 mL/gVS. Furthermore, linear Pearson correlations confirmed positive or negative relationships between physical/chemical changes and CH4 production [33]. AGS was previously decomposed by thermal hydrolysis. In the study by Jeong et al. (2019) [13], the final CH4 production was in the range of 313±8 – 348±8 mL/gVS, at an optimal process temperature of 180°C. For the control sample, 178±8 - 187±6 mL/gVS was achieved [13]. Ultrasonic disintegration was also used to condition AGS. Cydzik-Kwiatkowska et al. (2022) [14] observed a significant increase in biogas production with the prolongation of the disintegration process. Regardless of the OLR, the biogas yield after 0.5, 4.0 and 8.0 min of disintegration was 400, 420 and 455 mL/gVS, respectively. For AGS that were not ultrasonically decomposed, the biogas yield was 375 mL/gVS, and the CH4 concentration in the biogas was between 56.7±0.4 and 57.5±0.6%. A significant increase in biogas production was observed with the extension of the disintegration process [14]. The use of solidified carbon dioxide for the disintegration of AGS was also investigated [15]. The highest biogas and CH4 production yields, 476±20 mL/gVS and 341±13 mL/gVS, respectively, were obtained with a volume ratio of solidified CO2 to AGS of 0.3. The biogas yield from raw AGS was 309±21 mL/gVS, and the CH4 concentration in the produced biogas reached 68.84±2.2% [15].
Anaerobic digestion of raw, non-cavitated AGS (V0) allowed to obtain 398.8±23.4 mL/gVS, and the CH4 content in the biogas was 63.2±1.2% (Table 4). The reaction rate was r = 78 mL/d and the rate constant k = 0.19 1/d (Figure 7). A similar effect of CH4 production of 405.8±29.2 mL/gVS (r = 82 mL/d, k = 0.10 1/d) and a CH4 concentration of 62.4±1.1% was obtained after applying a 1-min HC time (Table 4, Figure 7). A statistically significant increase in CH4 production was observed after a 2.5-min HC time (V2). In this variant, the CH4 content in the biogas was 62.9±0.9%, resulting in 427.8±11.5 mL/gVS (r = 97 mL/d, k = 0.20 1/d) (Figure 7). The correlation between the concentration of dissolved COD and the amount of biogas produced in the range of tested HC times from 0 to 20 min was demonstrated (Figure 8B).
A significant increase in CH4 production was observed in the subsequent pre-treatment variants up to 15 min cavitation time. The CH4 yield increased from 427.8±11.5 mL/gVS (V2) to 487.6±12.1 mL/gVS (V5) (Table 4), and r and k reached the values of 116 mL/d and 0.22 1/d (Figure 7). The increase in CH4 production for variants V0 – V5 was strongly and linearly correlated with the HC time, and the coefficient of determination was R2 = 0.95669 (Figure 8A). In the variants where the HC time was 20 min (V6) to 50 min (V8), a comparable efficiency of CH4 production was observed. The range of values was narrow and ranged from 487±18.2 mL/gVS (r = 116 mL/d, k = 0.22 1/d) to 495.9±10.7 mL/gVS (r = 121 mL/d, k = 0.23 1/d) (Table 4, Figure 7). The observed increase was not statistically significant. The CH4 content of the biogas stabilised within a narrow range of 63.3±0.6% to 63.3±1.4% (Table 4). Garlicka et al. (2020) [34] applied HC with an energy density of 70, 140 and 210 kJ/L to thickened excess sludge and thickened primary sludge prior to the anaerobic digestion process. With increasing energy density, 273, 136 and 218 mLCH4/gVS were obtained [34]. In the work of Islam and Ranade (2023) [35], it was shown that increasing the intensity of cavitation of the sludge from dissolved air flotation (DAF) led to an increase in CH4 yield. CH4 concentrations of 551, 618, 670 and 756 mL/gVS were achieved at 0, 20, 40 and 80 passes, respectively. Therefore, CH4 production was increased by 12.1, 21.6 and 37.2%, respectively, compared to the control sample [35].
3.3. Energy balance
The specific energy input was directly proportional to the AGS hydrodynamic cavitation time used and ranged from 0.02 Wh/gTS for 1 min of disintegration (V1) to 0.44 Wh/gTS in V8, in which the operating time of the device was 50 min (Table 5). The gross energy yield contained in the biogas was closely correlated with the amount of CH4 produced and its energy value of 9.17 Wh/LCH4. The highest comparable values of 3.12 Wh/gTS to 3.18 Wh/gTS were found in the variants in which the HC time was between 15 min (V5) and 50 min (V8) (Figure 9A, Table 5). A strong correlation between the pretreatment time and the gross energy output obtained, determined by the coefficient of determination R2 = 0.9569, was observed from V0 (raw AGS) to V5, where a cavitation time of 15 min was used. Within this range, the gross energy increased from 2.55 Wh/gTS to 3.12 Wh/gTS (Figure 9A).
The highest net energy output after taking into account the time of the HC process was observed in V5 with 2.89 Wh/gTS (Figure 9A, Table 5). A slightly lower energy efficiency was achieved in V6 and V7, where the HC times were 20 and 25 min. The specific net energy output was 2.85 Wh/gTS. A value of 2.74 Wh/gTS was achieved in V4 and V8 (Figure 9A, Table 5). The use of shorter pre-treatment times resulted in significantly lower net energy production efficiencies, ranging from 2.55 Wh/gTS (V0) to 2.73 Wh/gTS (V3). A strongly correlated increase, described by R2 = 0.9228, between the HC time and the net energy output was observed in the variants from V0 to V5, while it decreased in the subsequent pre-treatment variants tested (Figure 9A).
The unit amount of energy directly resulting from the use of the tested HC solution was also estimated. For this purpose, the gross energy gained was reduced by the energy consumption of the HC and the amount of energy gained from the non-pretreated AGS. The highest net energy gain of 0.226 Wh/gTS was found in the variant in which 15 min of cavitation were used (V5). In V2, 0.141 Wh/gTS was achieved (Figure 9B, Table 5). Values below 0.100 Wh/gTS were recorded for the other variants of HC. In V6, an energy loss of 0.004 Wh/gTS was observed (Figure 9B).
Ferrentino and Andreottola (2020) [31] determined an energy consumption after 10 min of HC of 4.44 kWh/Mg wet sludge. After 20 min, the energy consumption was 8.89 kWh/Mg, after 40 min 17.78 kWh/Mg and after 80 min 35.56 kWh/Mg wet sludge [31]. Lee and Han (2013) [27] showed that HC consumes much less energy (60–1200 kJ/kgTS) compared to ultrasonic (180–3600 kJ/kgTS) and thermal (72,000 kJ/kgTS) methods. The study by Garlick et al. (2020) [34] reported that the energy input for pretreatment with HC exceeded the amount of energy obtained from CH4. The net energy production was -0.276 when the energy density was 140 kJ/L and -0.582 when the energy density was 210 kJ/L [34]. Islam and Ranade (2023) [35] presented a techno-economic analysis in which they showed an energy gain of 102.5 kWh/Mg as a result of HC dissolved air flotation (DAF) sludge from dairy waste treatment with the highest number of 80 passes at a pressure of 250 kPa, followed by a biomethane production of 756 mL/gVS [35]. In the study by Zupanc et al. (2023) [33], although no cavitation regime yielded the most CH4, the operational energy consumption reduced its positive effect. The energy balance was -0.141 kWh. The use of the cavitation regime with attached cavitation, the developed cloud shedding cavitation regime and the cavitation regime in a wake was associated with an energy balance of –0.105, –0.076 and –0.095, respectively. The authors of [33] claim that the first step to reduce the energy consumption should be to minimise the number of transitions and thus the HC time, while achieving a reasonable impact on the desired WAS properties.
5. Conclusions
The use of hydrodynamic cavitation for the pretreatment of aerobic granular sludge led to a mechanical destruction of the sludge structure, significantly increased the degree of solubilisation of organic compounds and also enabled an improvement in the kinetics and efficiency of anaerobic digestion.
Hydrodynamic cavitation led to an almost six-fold increase in the concentration of dissolved COD fractions and a five-fold increase in dissolved TOC compared to the values observed in raw AGS. Strong positive correlations were found between the duration of HC and the concentration of organic compounds in the dissolved phase in the range of tested pretreatment times from 0 to 15 min. Increasing the disintegration time had no significant effect on the changes in the concentration of dissolved COD and TOC.
The use of HC intensified the anaerobic digestion of AGS. The highest, statistically comparable CH4 yields were found when the cavitation time ranged from 15 min to 50 min. For these variants, the values achieved ranged from 487.6±12.1 mLCH4/g VS to 495.9±12.3 mLCH4/gVS. These variants were also characterised by the highest methane fermentation kinetics. Strong correlations were found between HC time, dissolved organic matter concentration and anaerobic digestion efficiency.
It was found that the highest net energy production of 2.89 Wh/gTS was achieved after 15 minutes of pretreatment. Extending the HC time had no significant effect on the increase in energy efficiency indicators.
Author Contributions
Conceptualization, M.Z. and M.D.; Methodology, M.Z. and M.D.; Validation, M.D.; Formal analysis, M.Z. and M.D.; Investigation, M.Z., M.D., J.K., A.N., and M.D.; Resources, M.Z., M.D., J.K., A.N., and M.D.; Data curation, M.Z., M.D., J.K., A.N., and M.D; Supervision, M.Z. and M.D.; Writing—original draft preparation, M.D. and J.K.; Writing—review and editing, M.Z., M.D., J.K., A.N., and M.D.; Visualization, M.D. and J.K.; Funding acquisition, M.D. All authors have read and agreed to the published version of the manuscript.
Funding
The manuscript was supported by the work WZ/WB-IIŚ/3/2022, funded by the Minister of Education and Science.
Data Availability Statement
Not applicable.
Conflicts of Interest
The authors declare no conflict of interest.
References
- Guo, H.; van Lier, J. B.; de Kreuk, M. Digestibility of Waste Aerobic Granular Sludge from a Full-Scale Municipal Wastewater Treatment System. Water Res. 2020, 173, 115617. [CrossRef]
- Yeasmin, F.; Rasheduzzaman, M.; Manik, M.; Hasan, M. M. Activated Sludge Process for Wastewater Treatment. Adv. Innov. Approaches Environ. Biotechnol. Ind. Wastewater Treat. 2023, 23–50. [CrossRef]
- Nancharaiah, Y. V.; Sarvajith, M. Granular Stability, Nitrogen and Phosphorus Removal Pathways of Aerobic Granular Sludge Treating Real Municipal Wastewater at Different Temperatures. J. Environ. Chem. Eng. 2023, 11 (5), 110769. [CrossRef]
- Sharma, K. S.; Panchal, K.; Chhimwal, M.; Kumar, D. Integrated Detection and Natural Remediation Technology as a Low-Cost Alternative for Wastewater Treatment. Heal. Sci. Rev. 2023, 8, 100111. [CrossRef]
- Kazimierowicz, J.; Dębowski, M. Aerobic Granular Sludge as a Substrate in Anaerobic Digestion—Current Status and Perspectives. Sustain. 2022, Vol. 14, Page 10904 2022, 14 (17), 10904. [CrossRef]
- Cheng, L.; Wei, M.; Guo, G.; Hu, Q.; Li, B.; Jiang, Y.; Hu, Z. Effects of Feeding Mode on the Formation and Stability of Aerobic Granular Sludge under Combined Antibiotic Stress. Chem. Eng. J. 2023, 475, 145996. [CrossRef]
- Zielinski, M.; Debowski, M.; Kazimierowicz, J. The Effect of Static Magnetic Field on Methanogenesis in the Anaerobic Digestion of Municipal Sewage Sludge. Energies 2021, Vol. 14, Page 590 2021, 14 (3), 590. [CrossRef]
- Hidaka, T.; Tsushima, I.; Tsumori, J. Comparative Analyses of Microbial Structures and Gene Copy Numbers in the Anaerobic Digestion of Various Types of Sewage Sludge. Bioresour. Technol. 2018, 253, 315–322. [CrossRef]
- Kosar, S.; Isik, O.; Akdag, Y.; Gulhan, H.; Koyuncu, I.; Ozgun, H.; Ersahin, M. E. Impact of Seed Sludge Characteristics on Granulation and Performance of Aerobic Granular Sludge Process. J. Clean. Prod. 2022, 363, 132424. [CrossRef]
- Dababat, S.; Berzio, S.; Wichern, M.; Lübken, M. Anaerobic Digestibility of Aerobic Granular Sludge from Continuous Flow Reactors: The Role of Granule Size Distribution. Water Sci. Technol. 2023, 87 (12), 3047–3058. [CrossRef]
- Zieliński, M.; Dębowski, M.; Kisielewska, M.; Nowicka, A.; Rokicka, M.; Szwarc, K. Comparison of Ultrasonic and Hydrothermal Cavitation Pretreatments of Cattle Manure Mixed with Straw Wheat on Fermentative Biogas Production. Waste and Biomass Valorization 2019, 10 (4), 747–754.
- Yuan, Q.; Gong, H.; Xi, H.; Wang, K. Aerobic Granular Sludge Formation Based on Substrate Availability: Effects of Flow Pattern and Fermentation Pretreatment. Front. Environ. Sci. Eng. 2020, 14 (3), 1–10.
- Jeong, S. Y.; Chang, S. W.; Ngo, H. H.; Guo, W.; Nghiem, L. D.; Banu, J. R.; Jeon, B. H.; Nguyen, D. D. Influence of Thermal Hydrolysis Pretreatment on Physicochemical Properties and Anaerobic Biodegradability of Waste Activated Sludge with Different Solids Content. Waste Manag. 2019, 85, 214–221. [CrossRef]
- Cydzik-Kwiatkowska, A.; Bernat, K.; Zielińska, M.; Gusiatin, M. Z.; Wojnowska-Baryła, I.; Kulikowska, D. Valorization of Full-Scale Waste Aerobic Granular Sludge for Biogas Production and the Characteristics of the Digestate. Chemosphere 2022, 303, 135167. [CrossRef]
- Kazimierowicz, J.; Dębowski, M.; Zieliński, M. Technological, Ecological, and Energy-Economic Aspects of Using Solidified Carbon Dioxide for Aerobic Granular Sludge Pre-Treatment Prior to Anaerobic Digestion. Int. J. Environ. Res. Public Heal. 2023, Vol. 20, Page 4234 2023, 20 (5), 4234. [CrossRef]
- Zou, X.; Yang, R.; Zhou, X.; Cao, G.; Zhu, R.; Ouyang, F. Effects of Mixed Alkali-Thermal Pretreatment on Anaerobic Digestion Performance of Waste Activated Sludge. J. Clean. Prod. 2020, 259, 120940. [CrossRef]
- Dębowski, M.; Kisielewska, M.; Zieliński, M.; Kazimierowicz, J. The Influence of the Ultrasound Disintegration of Microalgal–Bacterial Granular Sludge on Anaerobic Digestion Efficiency. Appl. Sci. 2023, Vol. 13, Page 7387 2023, 13 (13), 7387. [CrossRef]
- Krul, E. S. Calculation of Nitrogen-to-Protein Conversion Factors: A Review with a Focus on Soy Protein. J. Am. Oil Chem. Soc. 2019, 96 (4), 339–364. [CrossRef]
- Das, A.; Mondal, C. Comparative Kinetic Study of Anaerobic Treatment of Thermally Pretreated Source-Sorted Organic Market Refuse. J. Eng. (United Kingdom) 2015, 2015. [CrossRef]
- Li, W.; Li, C.; Zhu, N.; Yuan, H.; Shen, Y. The Extent of Sludge Solubilization Allows to Estimate the Efficacy of Ozonation for Removal of Polycyclic Aromatic Hydrocarbons (PAHs) in Municipal Sewage Sludge. J. Hazard. Mater. 2021, 413, 125404. [CrossRef]
- Ndobeni, A.; Oyekola, O.; Welz, P. J. Organic Removal Rates and Biogas Production of an Upflow Anaerobic Sludge Blanket Reactor Treating Sugarcane Molasses. South African J. Chem. Eng. 2019, 28, 1–7. [CrossRef]
- Kasinath, A.; Fudala-Ksiazek, S.; Szopinska, M.; Bylinski, H.; Artichowicz, W.; Remiszewska-Skwarek, A.; Luczkiewicz, A. Biomass in Biogas Production: Pretreatment and Codigestion. Renew. Sustain. Energy Rev. 2021, 150, 111509. [CrossRef]
- Li, C.; Nges, I. A.; Lu, W.; Wang, H. Assessment of the Degradation Efficiency of Full-Scale Biogas Plants: A Comparative Study of Degradation Indicators. Bioresour. Technol. 2017, 244, 304–312. [CrossRef]
- Kim, M.; Kim, B. C.; Nam, K.; Choi, Y. Effect of Pretreatment Solutions and Conditions on Decomposition and Anaerobic Digestion of Lignocellulosic Biomass in Rice Straw. Biochem. Eng. J. 2018, 140, 108–114. [CrossRef]
- Şaǧban, F. O. T.; Dindar, E.; Cirakoglu, C.; Keskinler, B. Hydrodynamic Cavitation of Waste-Activated Sludge. https://home.liebertpub.com/ees 2018, 35 (8), 775–784. [CrossRef]
- Kim, H.; Sun, X.; Koo, B.; Yoon, J. Y. Experimental Investigation of Sludge Treatment Using a Rotor-Stator Type Hydrodynamic Cavitation Reactor and an Ultrasonic Bath. Process. 2019, Vol. 7, Page 790 2019, 7 (11), 790. [CrossRef]
- Lee, I.; Han, J. I. The Effects of Waste-Activated Sludge Pretreatment Using Hydrodynamic Cavitation for Methane Production. Ultrason. Sonochem. 2013, 20 (6), 1450–1455. [CrossRef]
- Mancuso, G.; Langone, M.; Andreottola, G.; Bruni, L. Effects of Hydrodynamic Cavitation, Low-Level Thermal and Low-Level Alkaline Pre-Treatments on Sludge Solubilisation. Ultrason. Sonochem. 2019, 59, 104750. [CrossRef]
- Petkovšek, M.; Mlakar, M.; Levstek, M.; Stražar, M.; Širok, B.; Dular, M. A Novel Rotation Generator of Hydrodynamic Cavitation for Waste-Activated Sludge Disintegration. Ultrason. Sonochem. 2015, 26, 408–414. [CrossRef]
- Mancuso, G.; Langone, M.; Di Maggio, R.; Toscano, A.; Andreottola, G. Effect of Hydrodynamic Cavitation on Flocs Structure in Sewage Sludge to Increase Stabilization for Efficient and Safe Reuse in Agriculture. Bioremediat. J. 2022, 26 (1), 41–52. [CrossRef]
- Ferrentino, R.; Andreottola, G. Investigation of Sludge Solubilization and Phosphorous Release in Anaerobic Side-Stream Reactor with a Low Pressure Swirling Jet Hydrodynamic Cavitation Treatment. J. Environ. Chem. Eng. 2020, 8 (5), 104389. [CrossRef]
- Lee, G.; Lee, I.; Han, J. I. A Combined Method of Hydrodynamic Cavitation and Alkaline Treatment for Waste-Activated Sludge Solubilization; N/P Recovery from Anaerobic Granular Sludge. J. Environ. Chem. Eng. 2019, 7 (5), 103329. [CrossRef]
- Zupanc, M.; Humar, B. B.; Dular, M.; Gostiša, J.; Hočevar, M.; Repinc, S. K.; Krzyk, M.; Novak, L.; Ortar, J.; Pandur, Ž.; Stres, B.; Petkovšek, M. The Use of Hydrodynamic Cavitation for Waste-to-Energy Approach to Enhance Methane Production from Waste Activated Sludge. J. Environ. Manage. 2023, 347, 119074. [CrossRef]
- Garlicka, A.; Zubrowska-Sudol, M.; Umiejewska, K.; Roubinek, O.; Palige, J.; Chmielewski, A. Effects of Thickened Excess Sludge Pre-Treatment Using Hydrodynamic Cavitation for Anaerobic Digestion. Energies 2020, Vol. 13, Page 2483 2020, 13 (10), 2483. [CrossRef]
- Islam, M. S.; Ranade, V. Enhancing Bmp and Digestibility of Daf Sludge Via Hydrodynamic Cavitation. SSRN 2023, 1–33. [CrossRef]
Figure 1.
Organisation and procedure of the experiment.
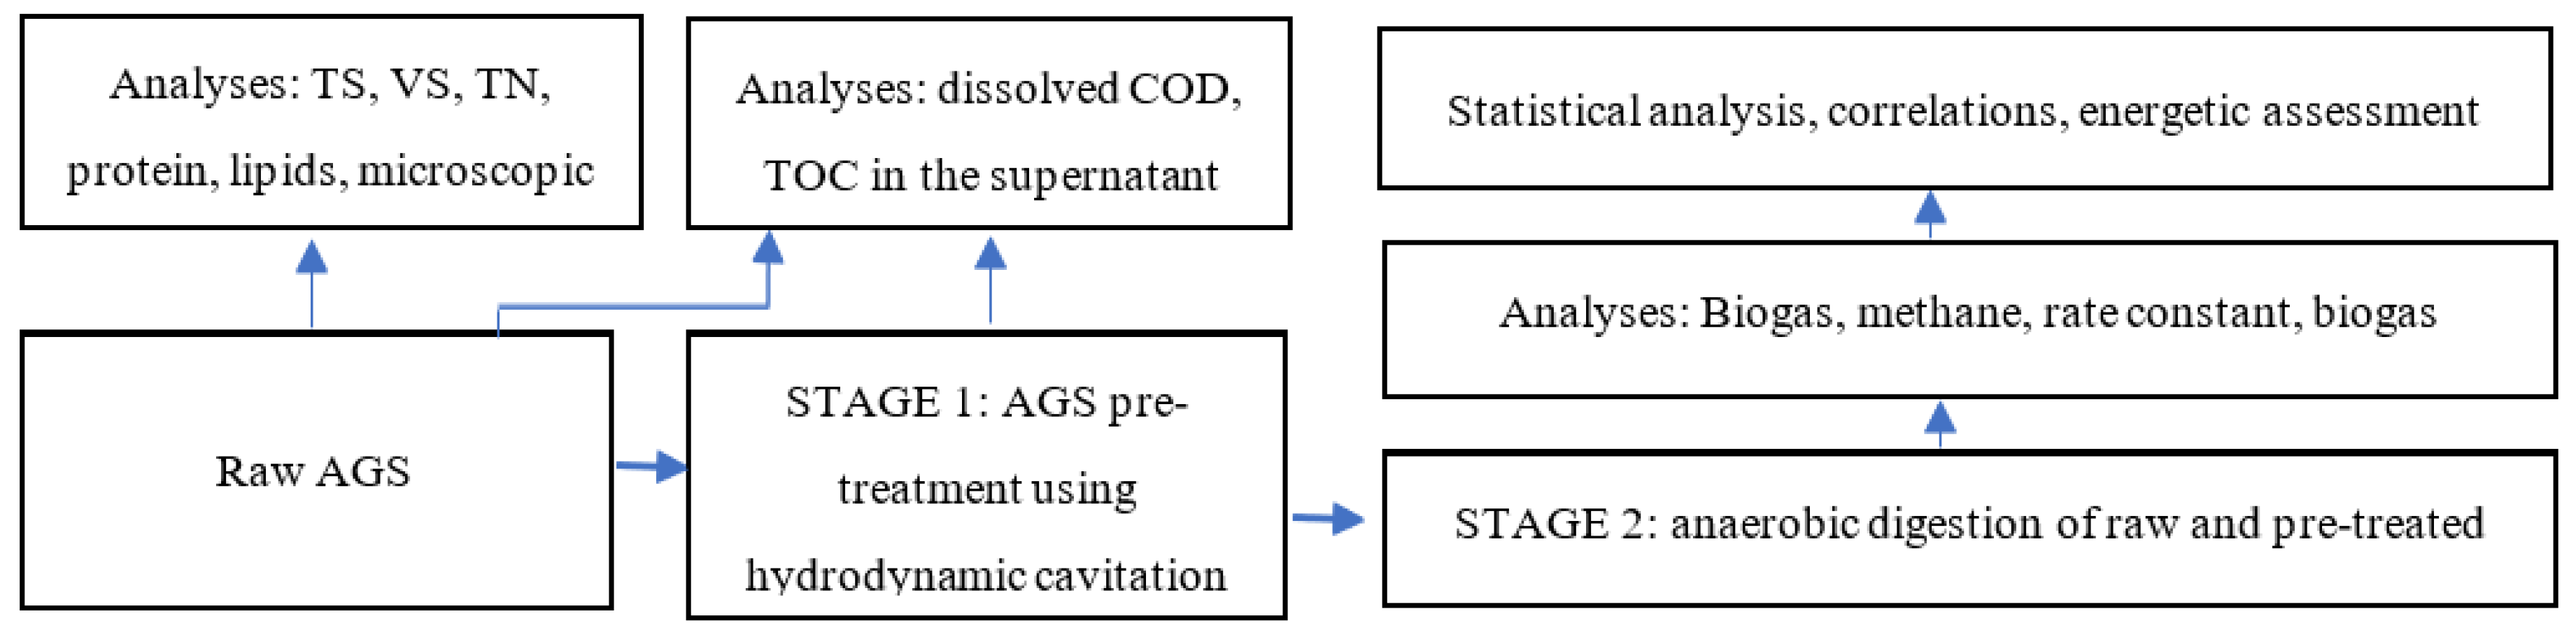
Figure 2.
Diagram of the AGS production reactor (1 - raw wastewater tank, 2 - peristaltic pump, 3 - column reactor, 4 - diffuser for medium bubbles, 5 - decanting system, 6 - solenoid valve, 7 - air compressor, 8 - tank for purified wastewater, 9 – overflow tank, 10 – control system).
Figure 2.
Diagram of the AGS production reactor (1 - raw wastewater tank, 2 - peristaltic pump, 3 - column reactor, 4 - diffuser for medium bubbles, 5 - decanting system, 6 - solenoid valve, 7 - air compressor, 8 - tank for purified wastewater, 9 – overflow tank, 10 – control system).
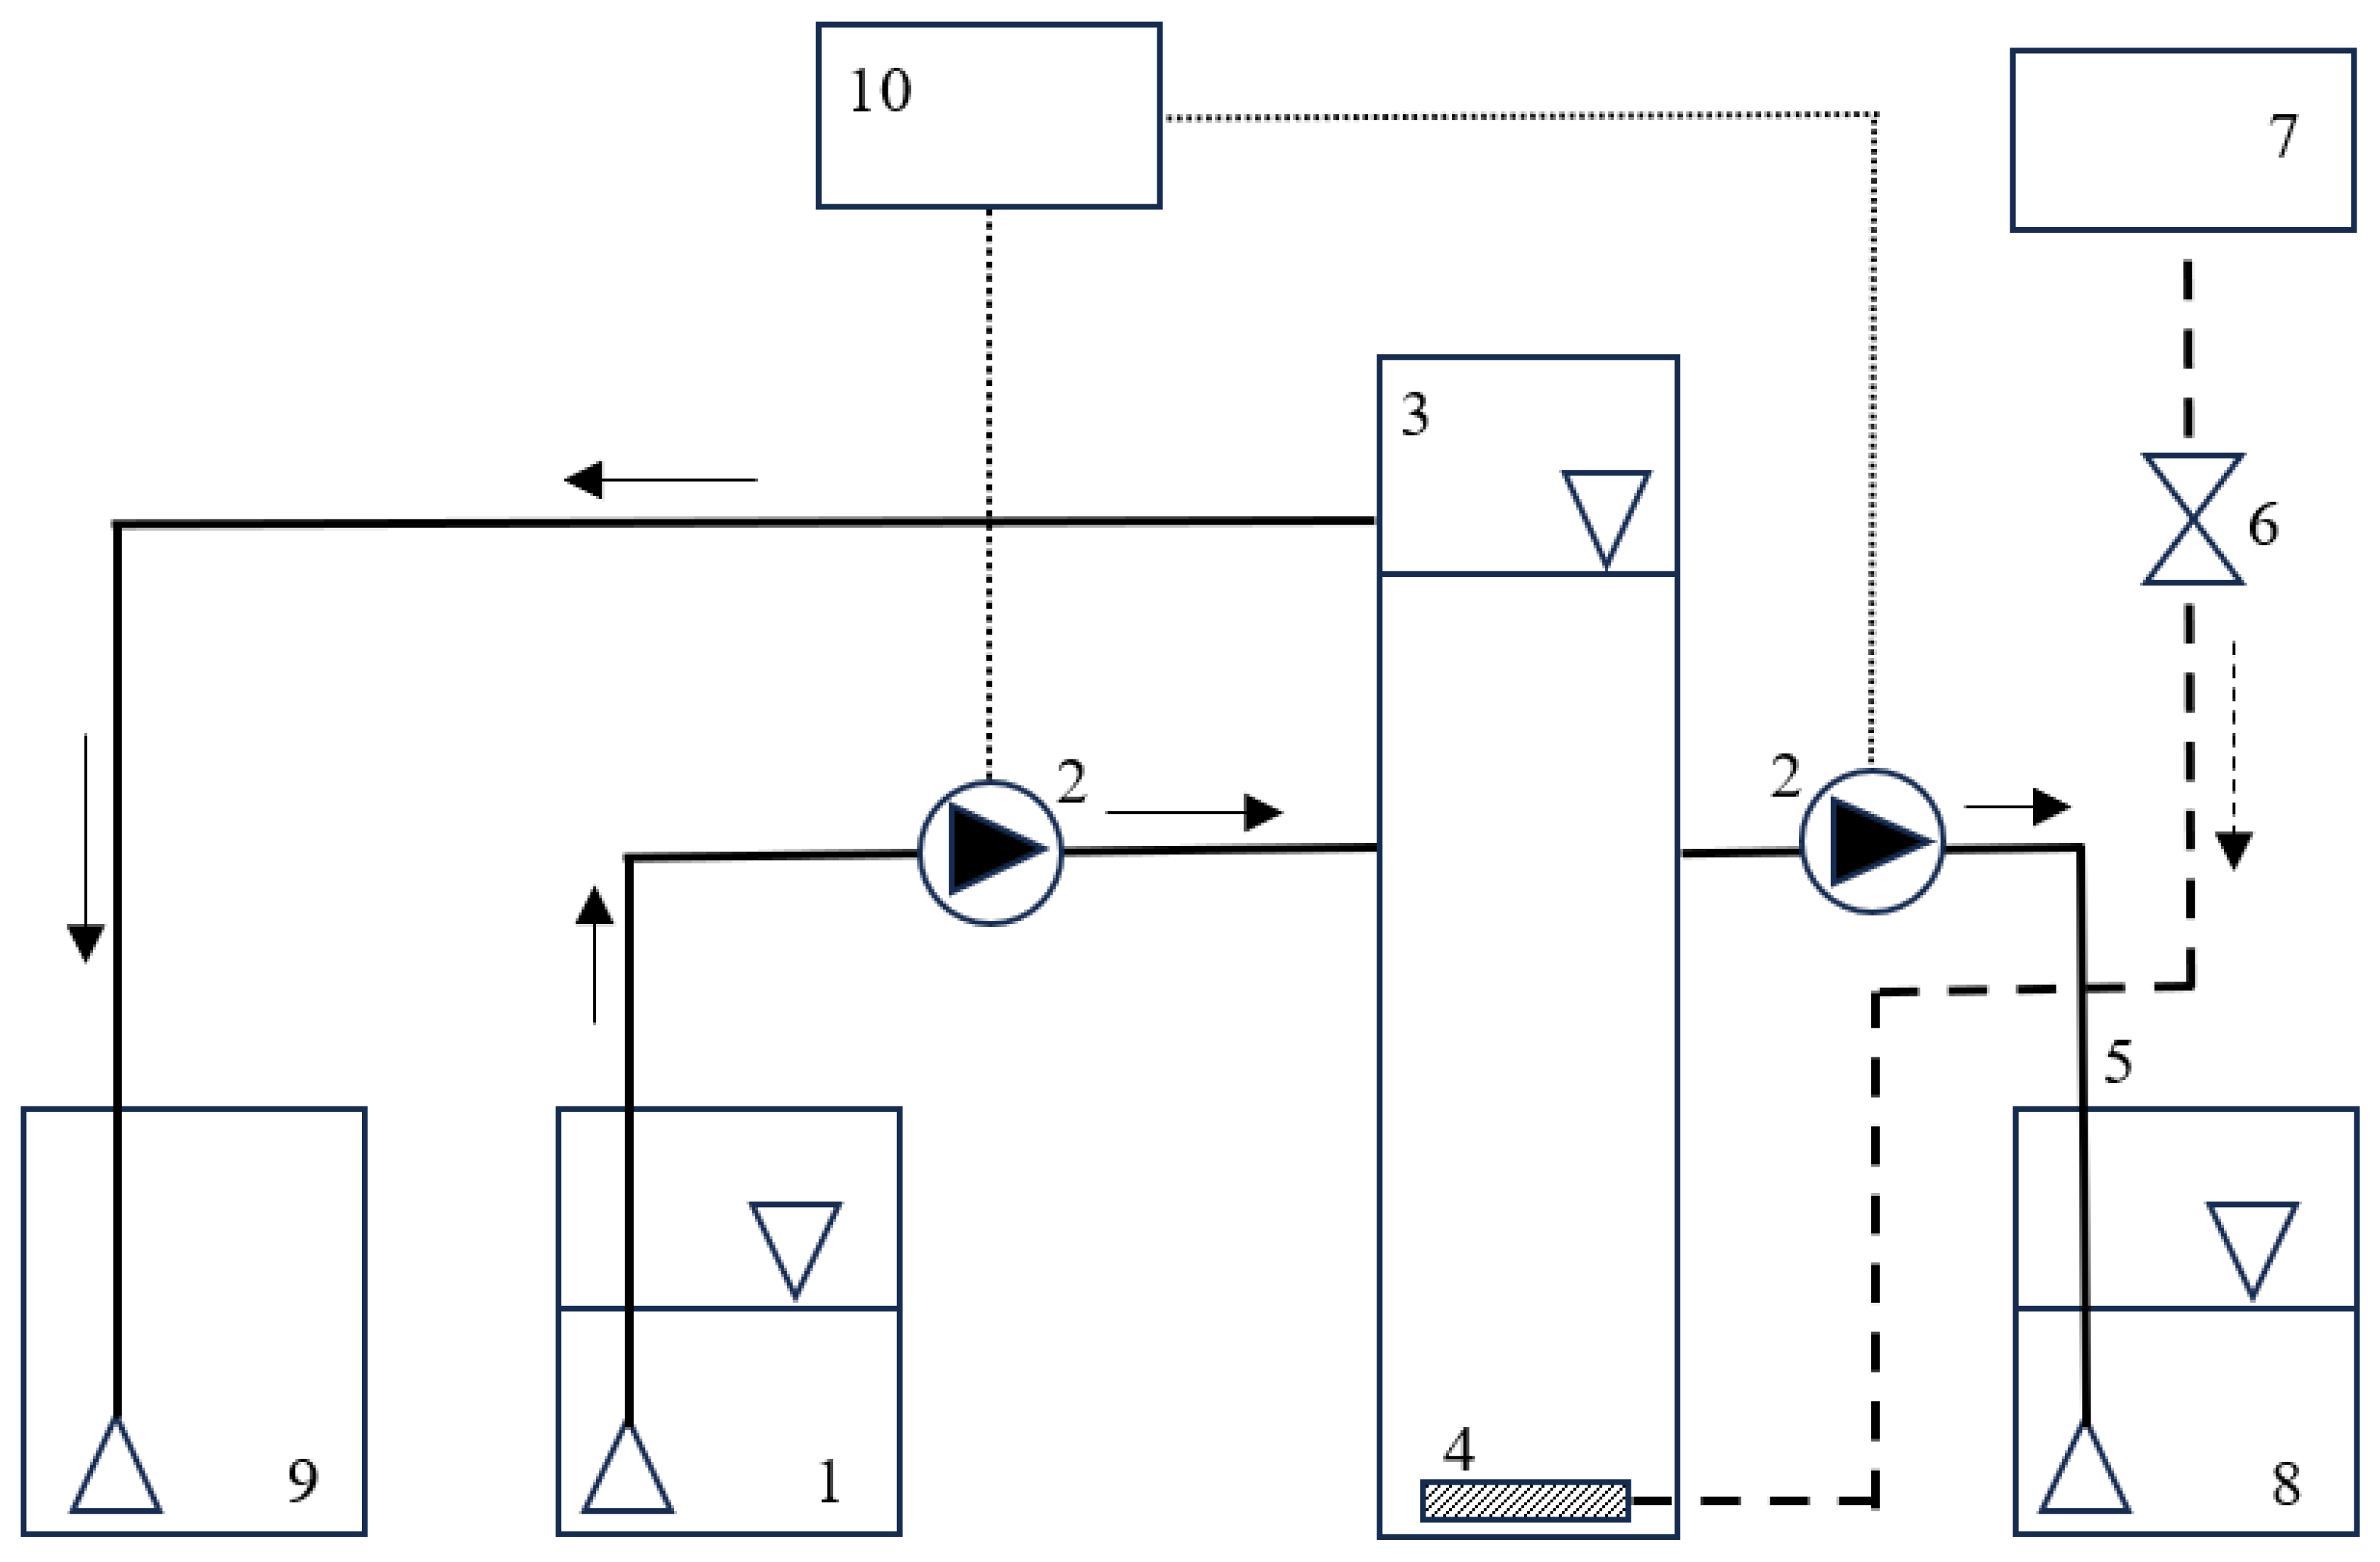
Figure 3.
Scheme of the hydrodynamic cavitator (A), cavitation head (B), basic dimensions (C), image (D).
Figure 3.
Scheme of the hydrodynamic cavitator (A), cavitation head (B), basic dimensions (C), image (D).
Figure 4.
(A) Measurement set (1 - liquid phase, 2 - gas phase, 3 - side connector for the biogas inlet, 4 - measuring and recording device, 5 - magnetic stirrer) and (B) a picture of the respirometer sets used in the incubator.
Figure 4.
(A) Measurement set (1 - liquid phase, 2 - gas phase, 3 - side connector for the biogas inlet, 4 - measuring and recording device, 5 - magnetic stirrer) and (B) a picture of the respirometer sets used in the incubator.
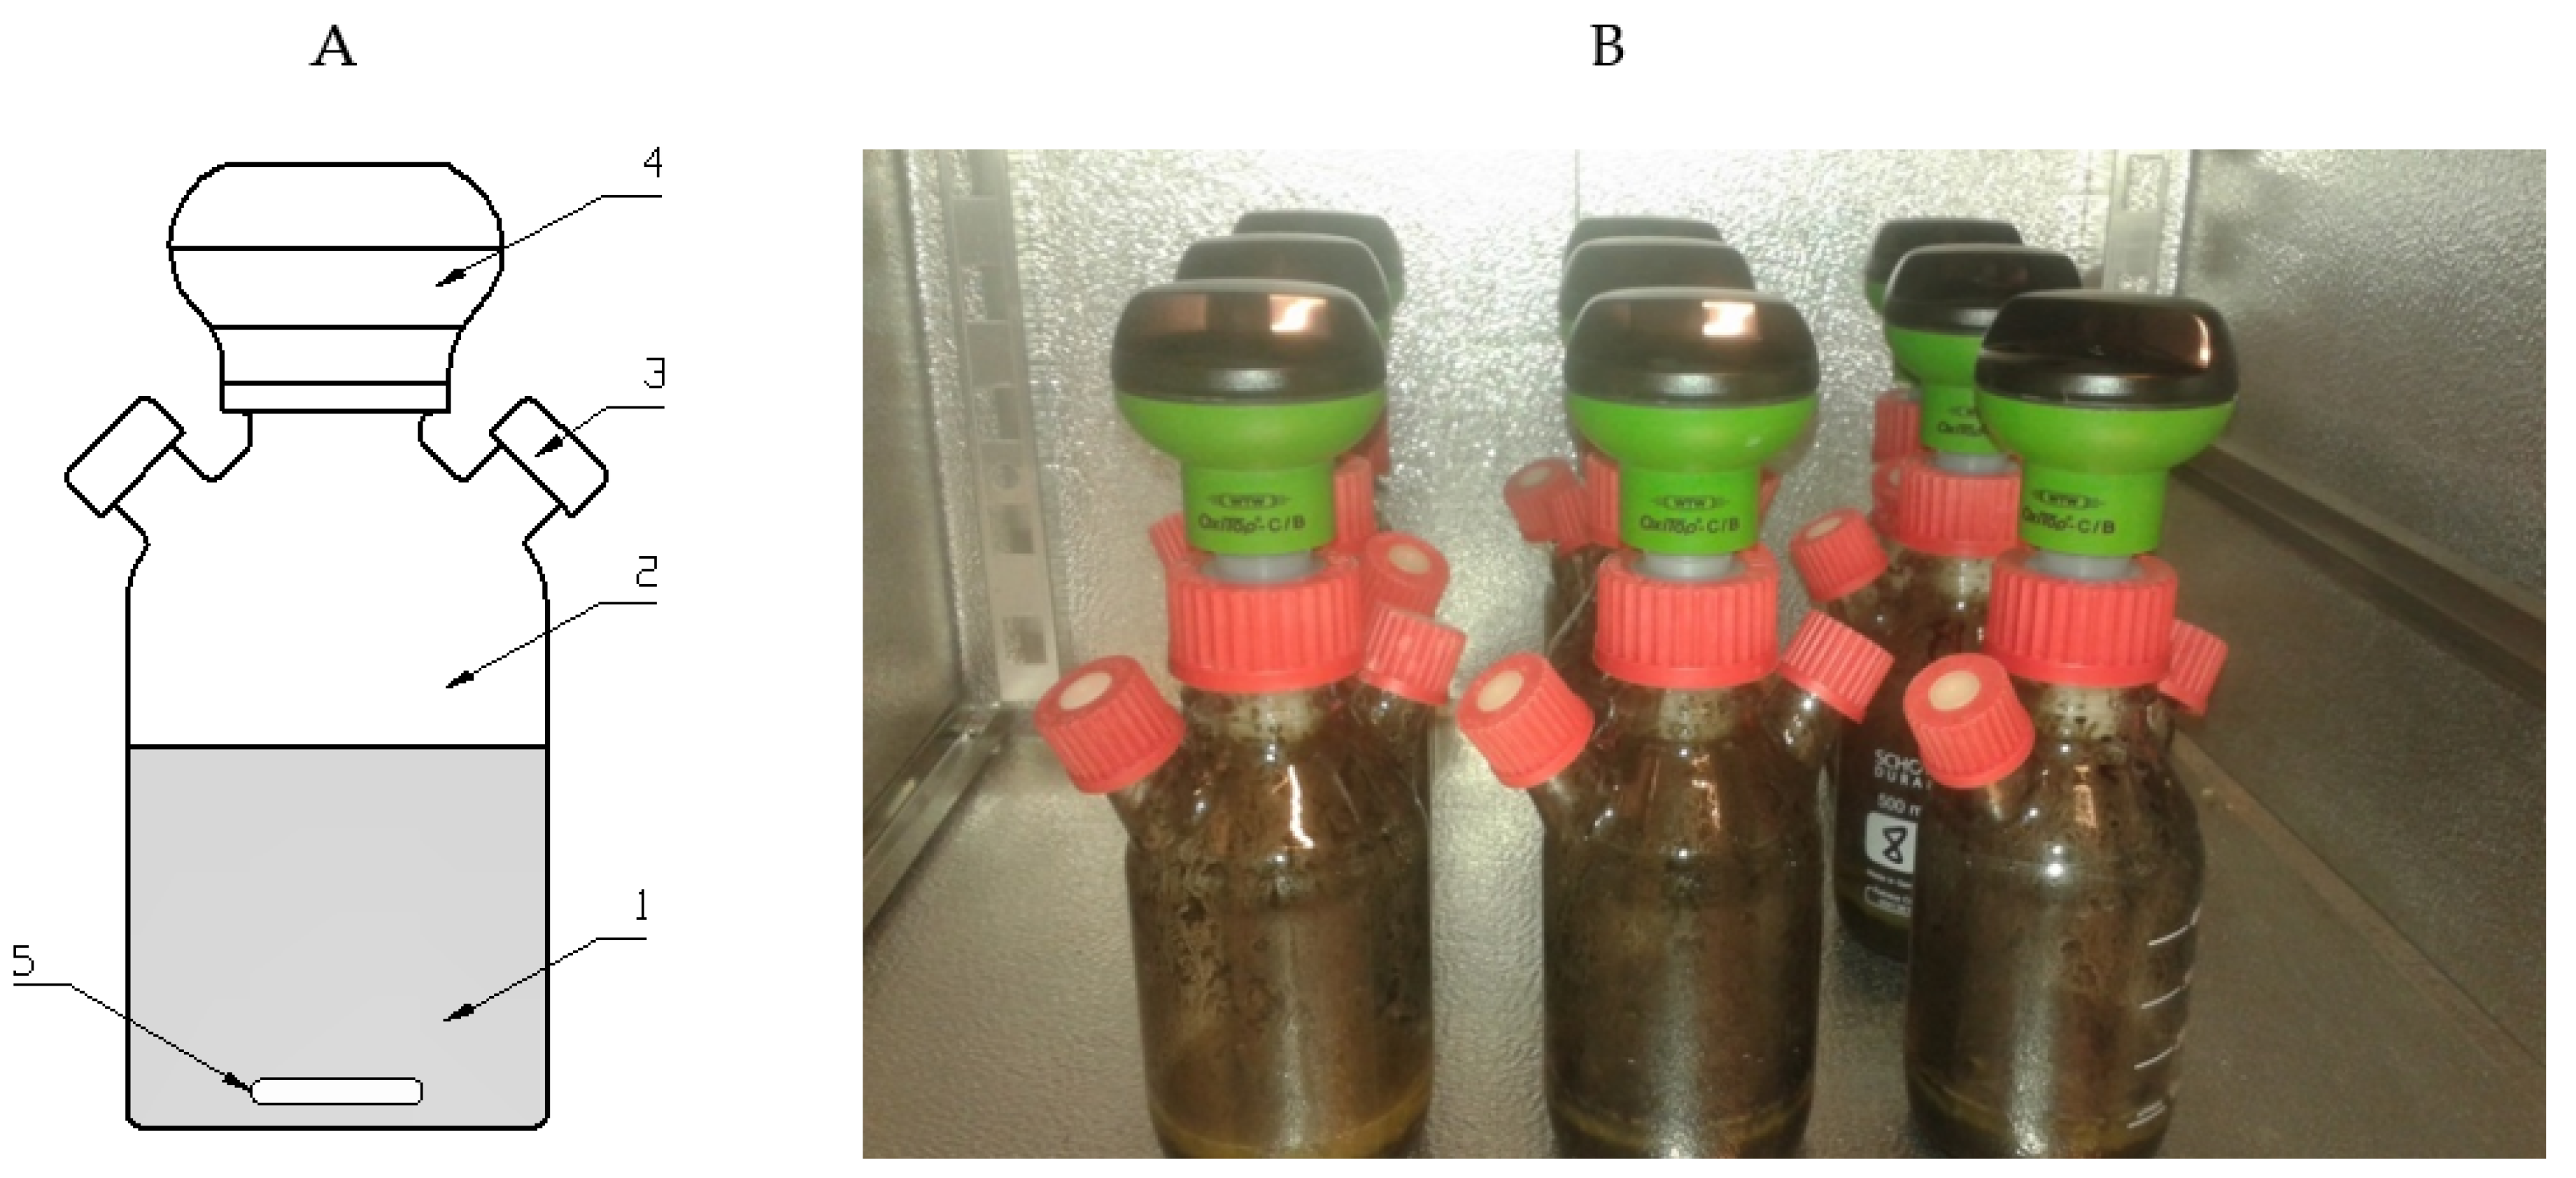
Figure 5.
(A) Image of the raw AGS (V0) and (B) after selected variants (V2, V4, V6, V8) of HC.
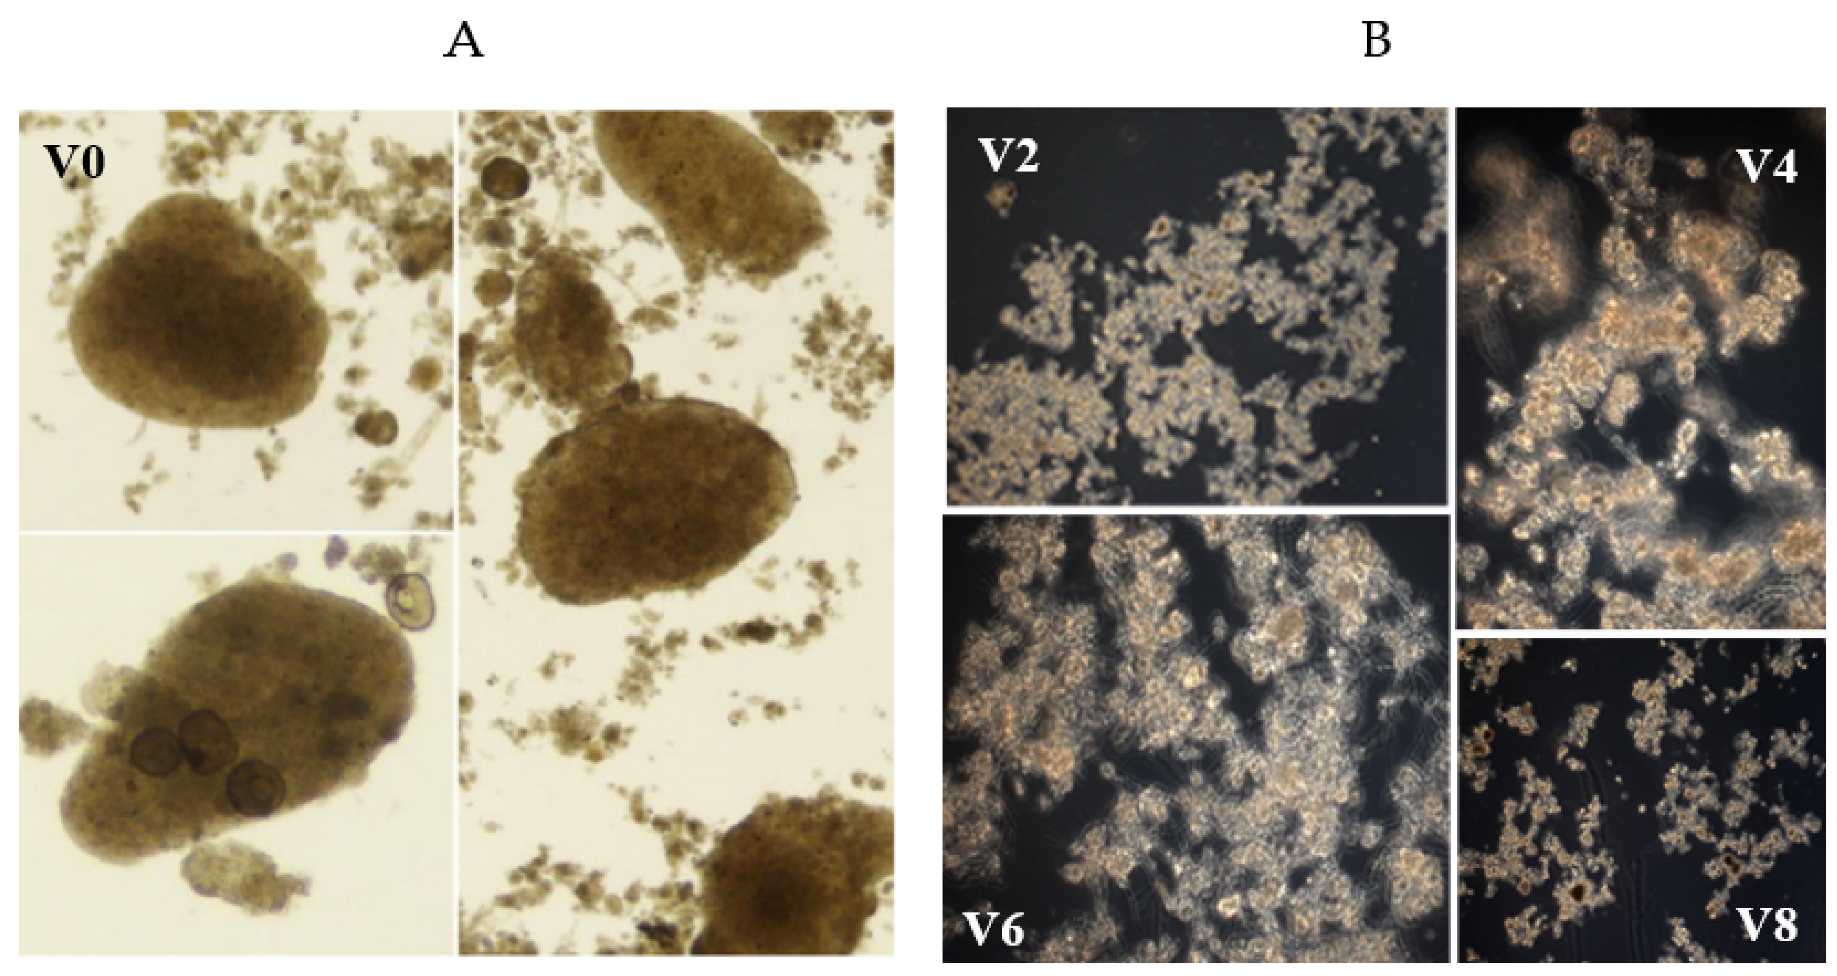
Figure 6.
(A) Correlation between the applied HC time and the concentration of COD and TOC in the dissolved phase and (B) the degree of solubilisation achieved.
Figure 6.
(A) Correlation between the applied HC time and the concentration of COD and TOC in the dissolved phase and (B) the degree of solubilisation achieved.
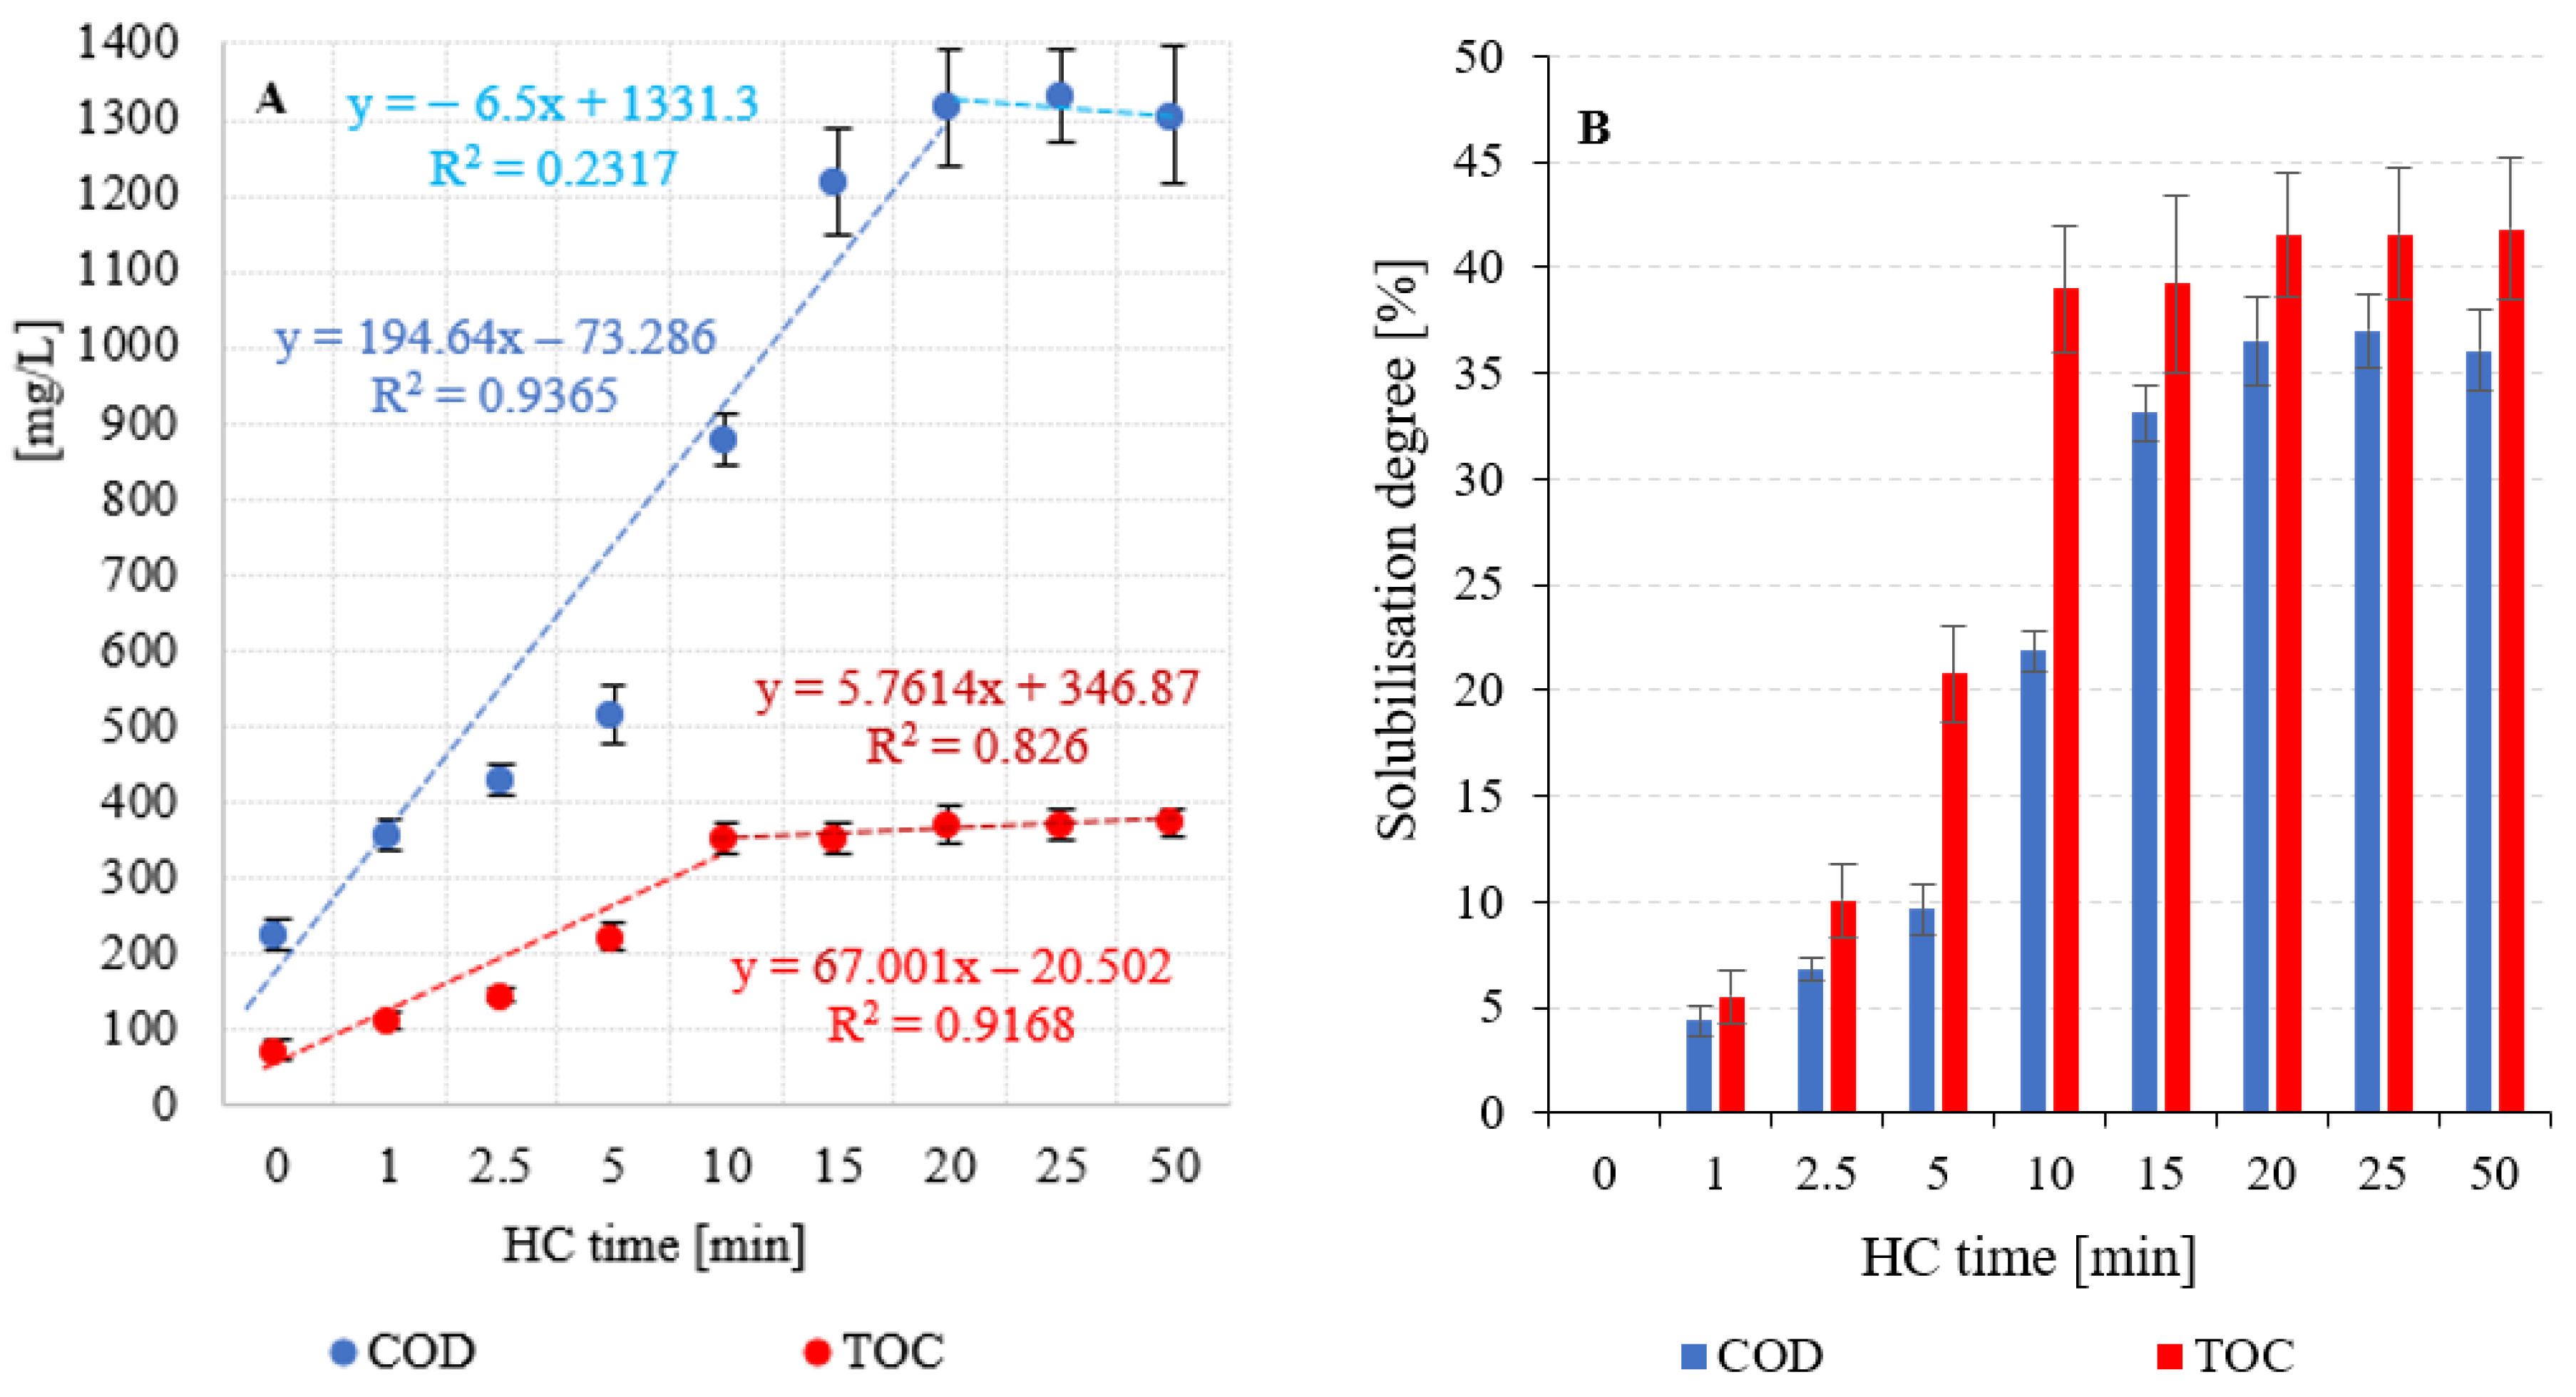
Figure 7.
Kinetics of biogas and methane production in the following variants of the experiment.
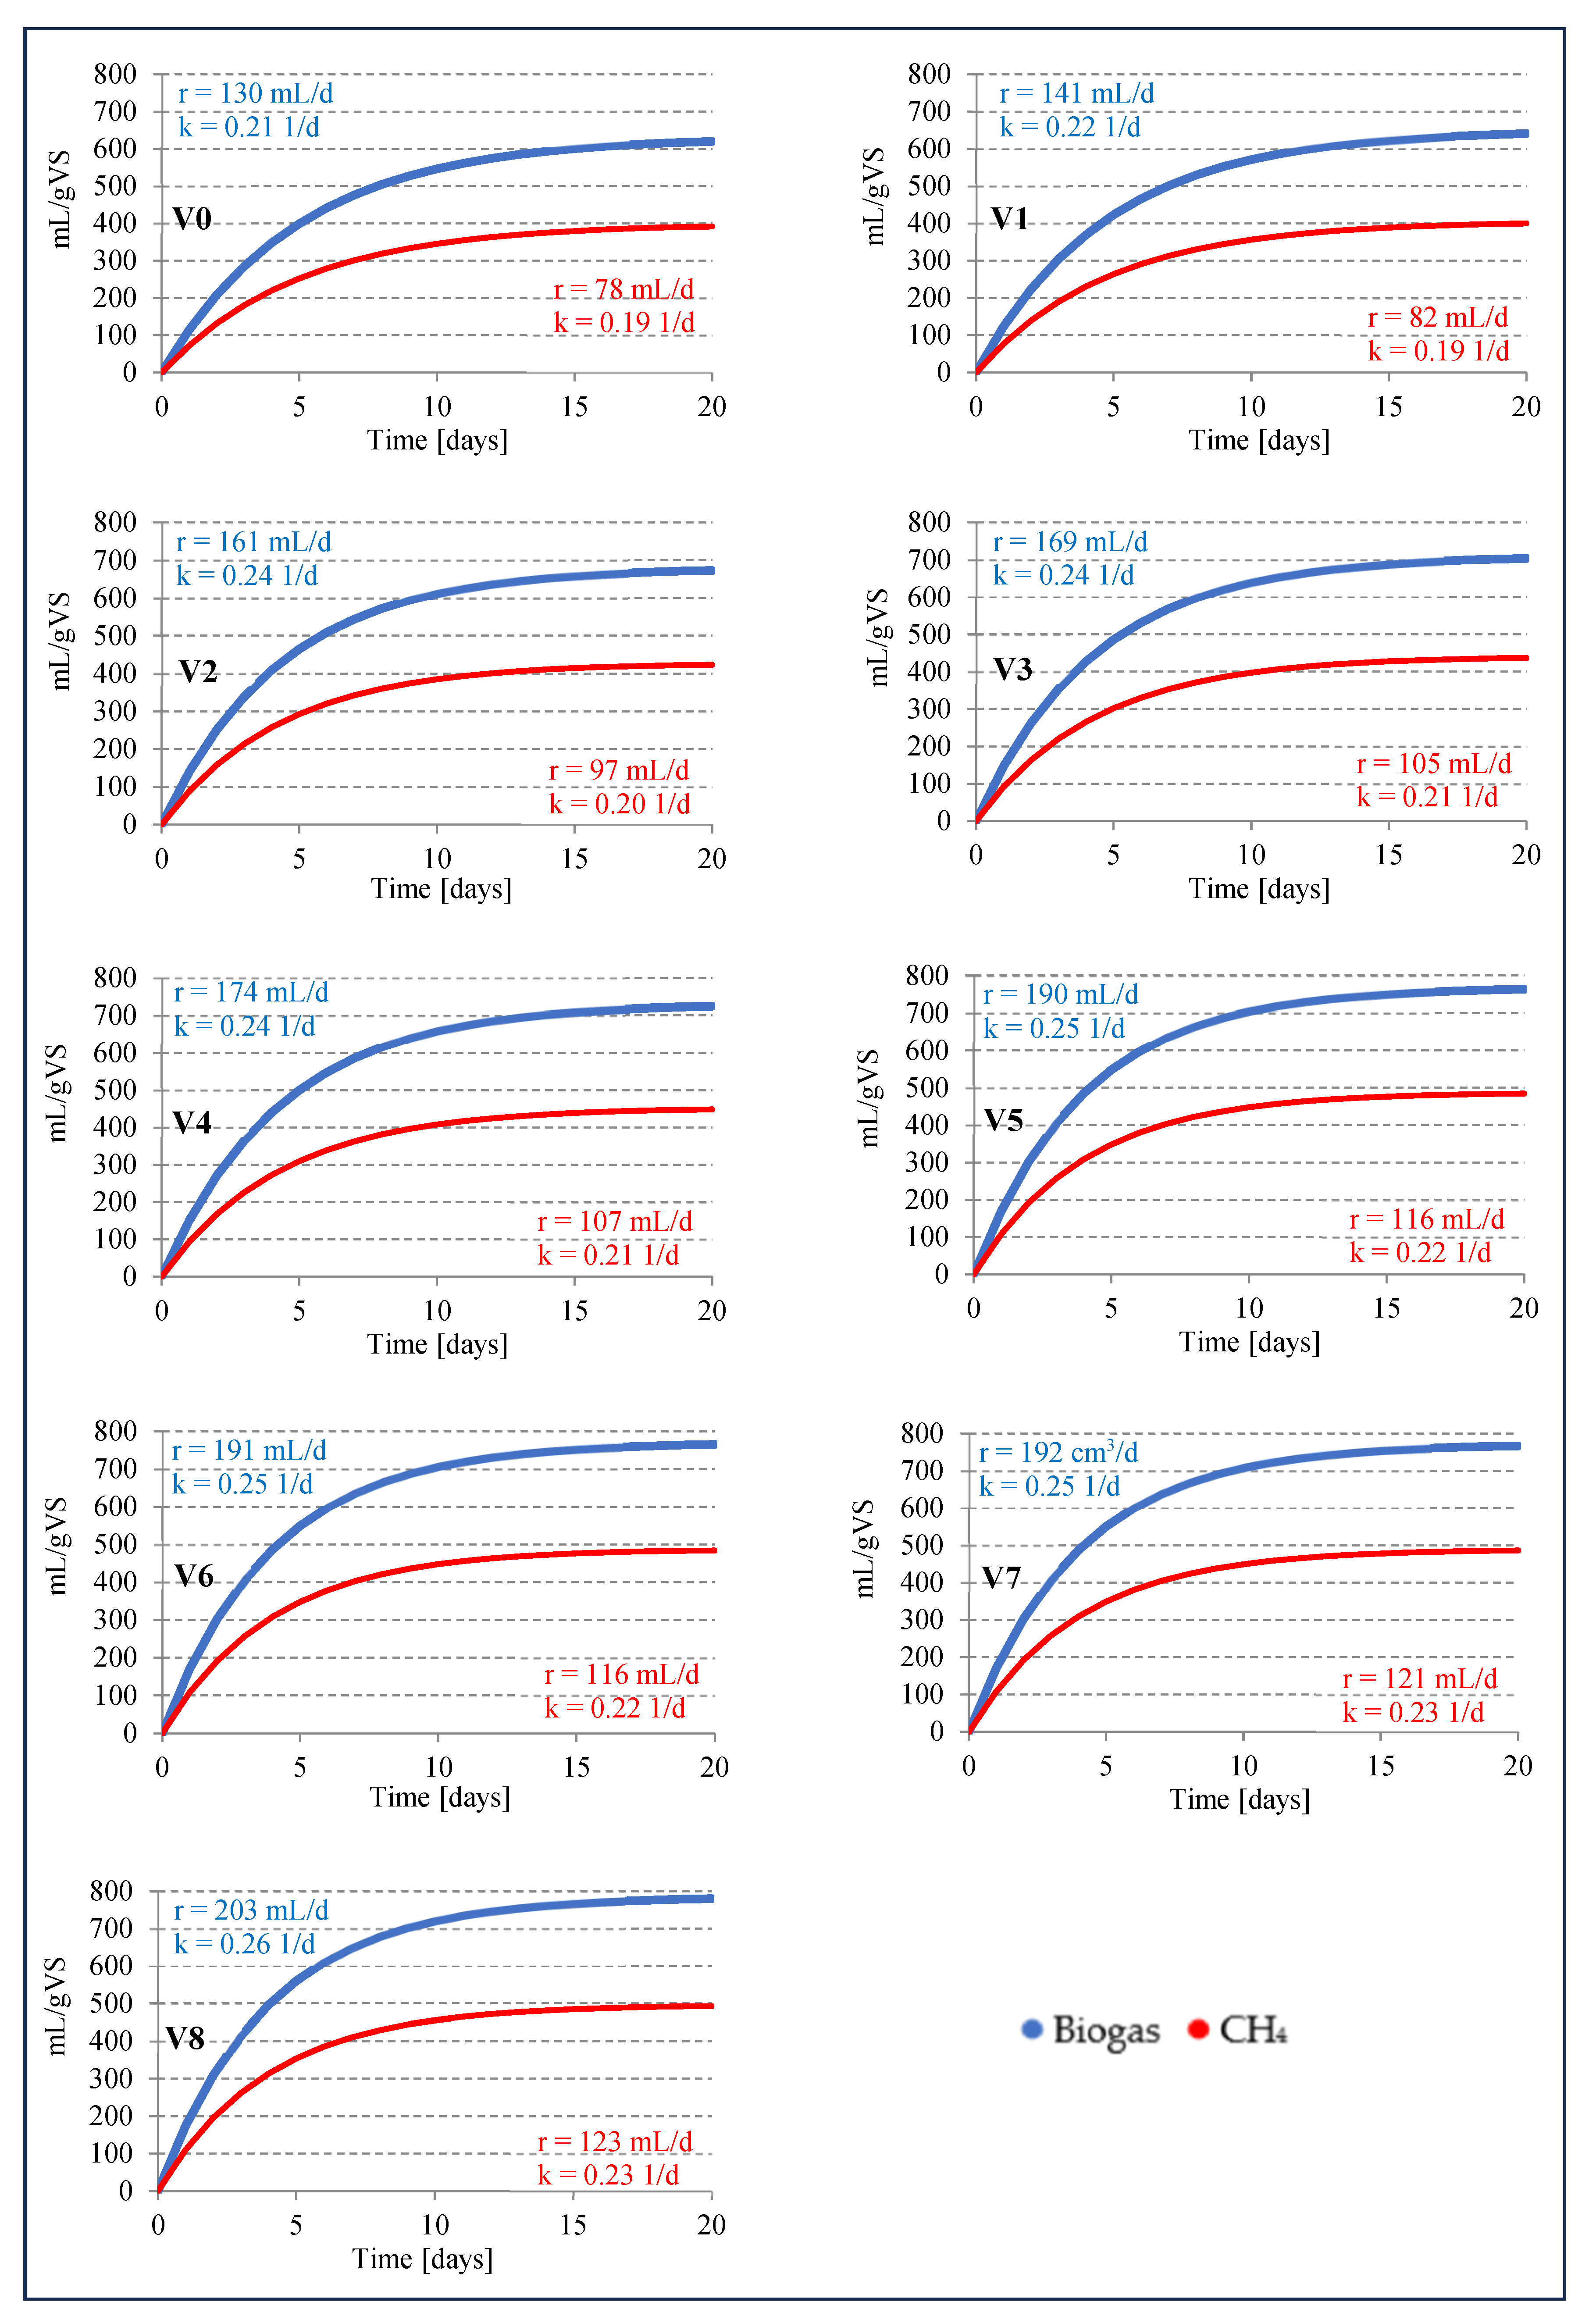
Figure 8.
Correlations between (A) the applied HC time and (B) the concentration of dissolved COD and the efficiency of biogas/methane production.
Figure 8.
Correlations between (A) the applied HC time and (B) the concentration of dissolved COD and the efficiency of biogas/methane production.
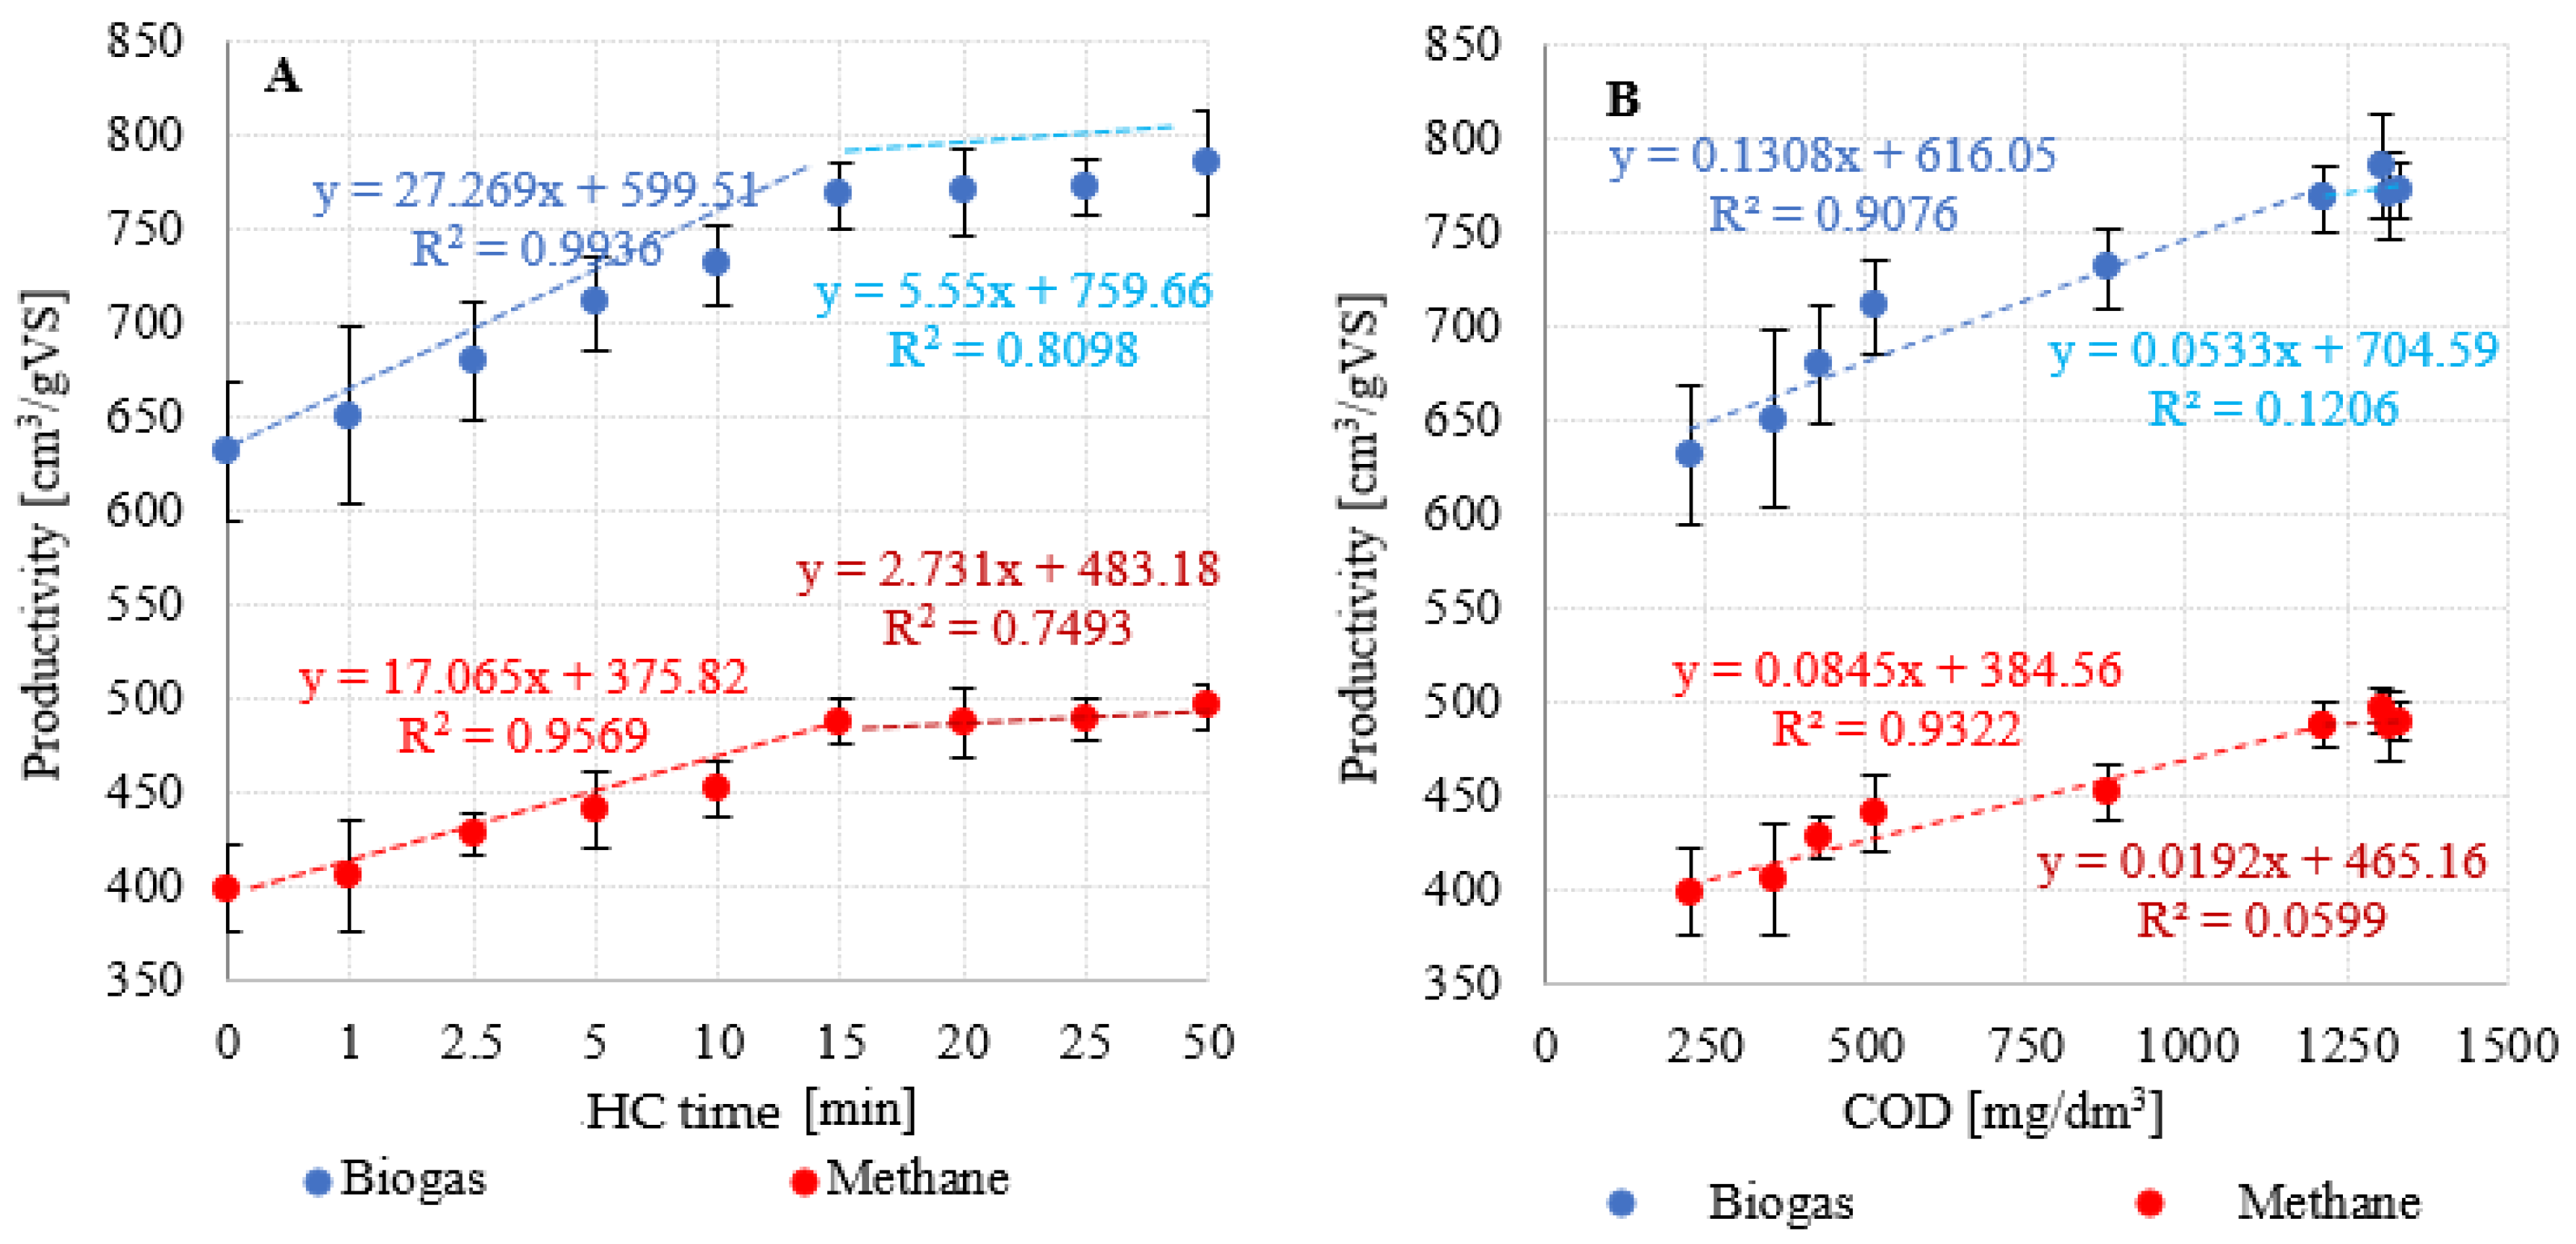
Figure 9.
Effects of HC duration on (A) the gross and net energy output; and (B) the net energy gain.
Figure 9.
Effects of HC duration on (A) the gross and net energy output; and (B) the net energy gain.
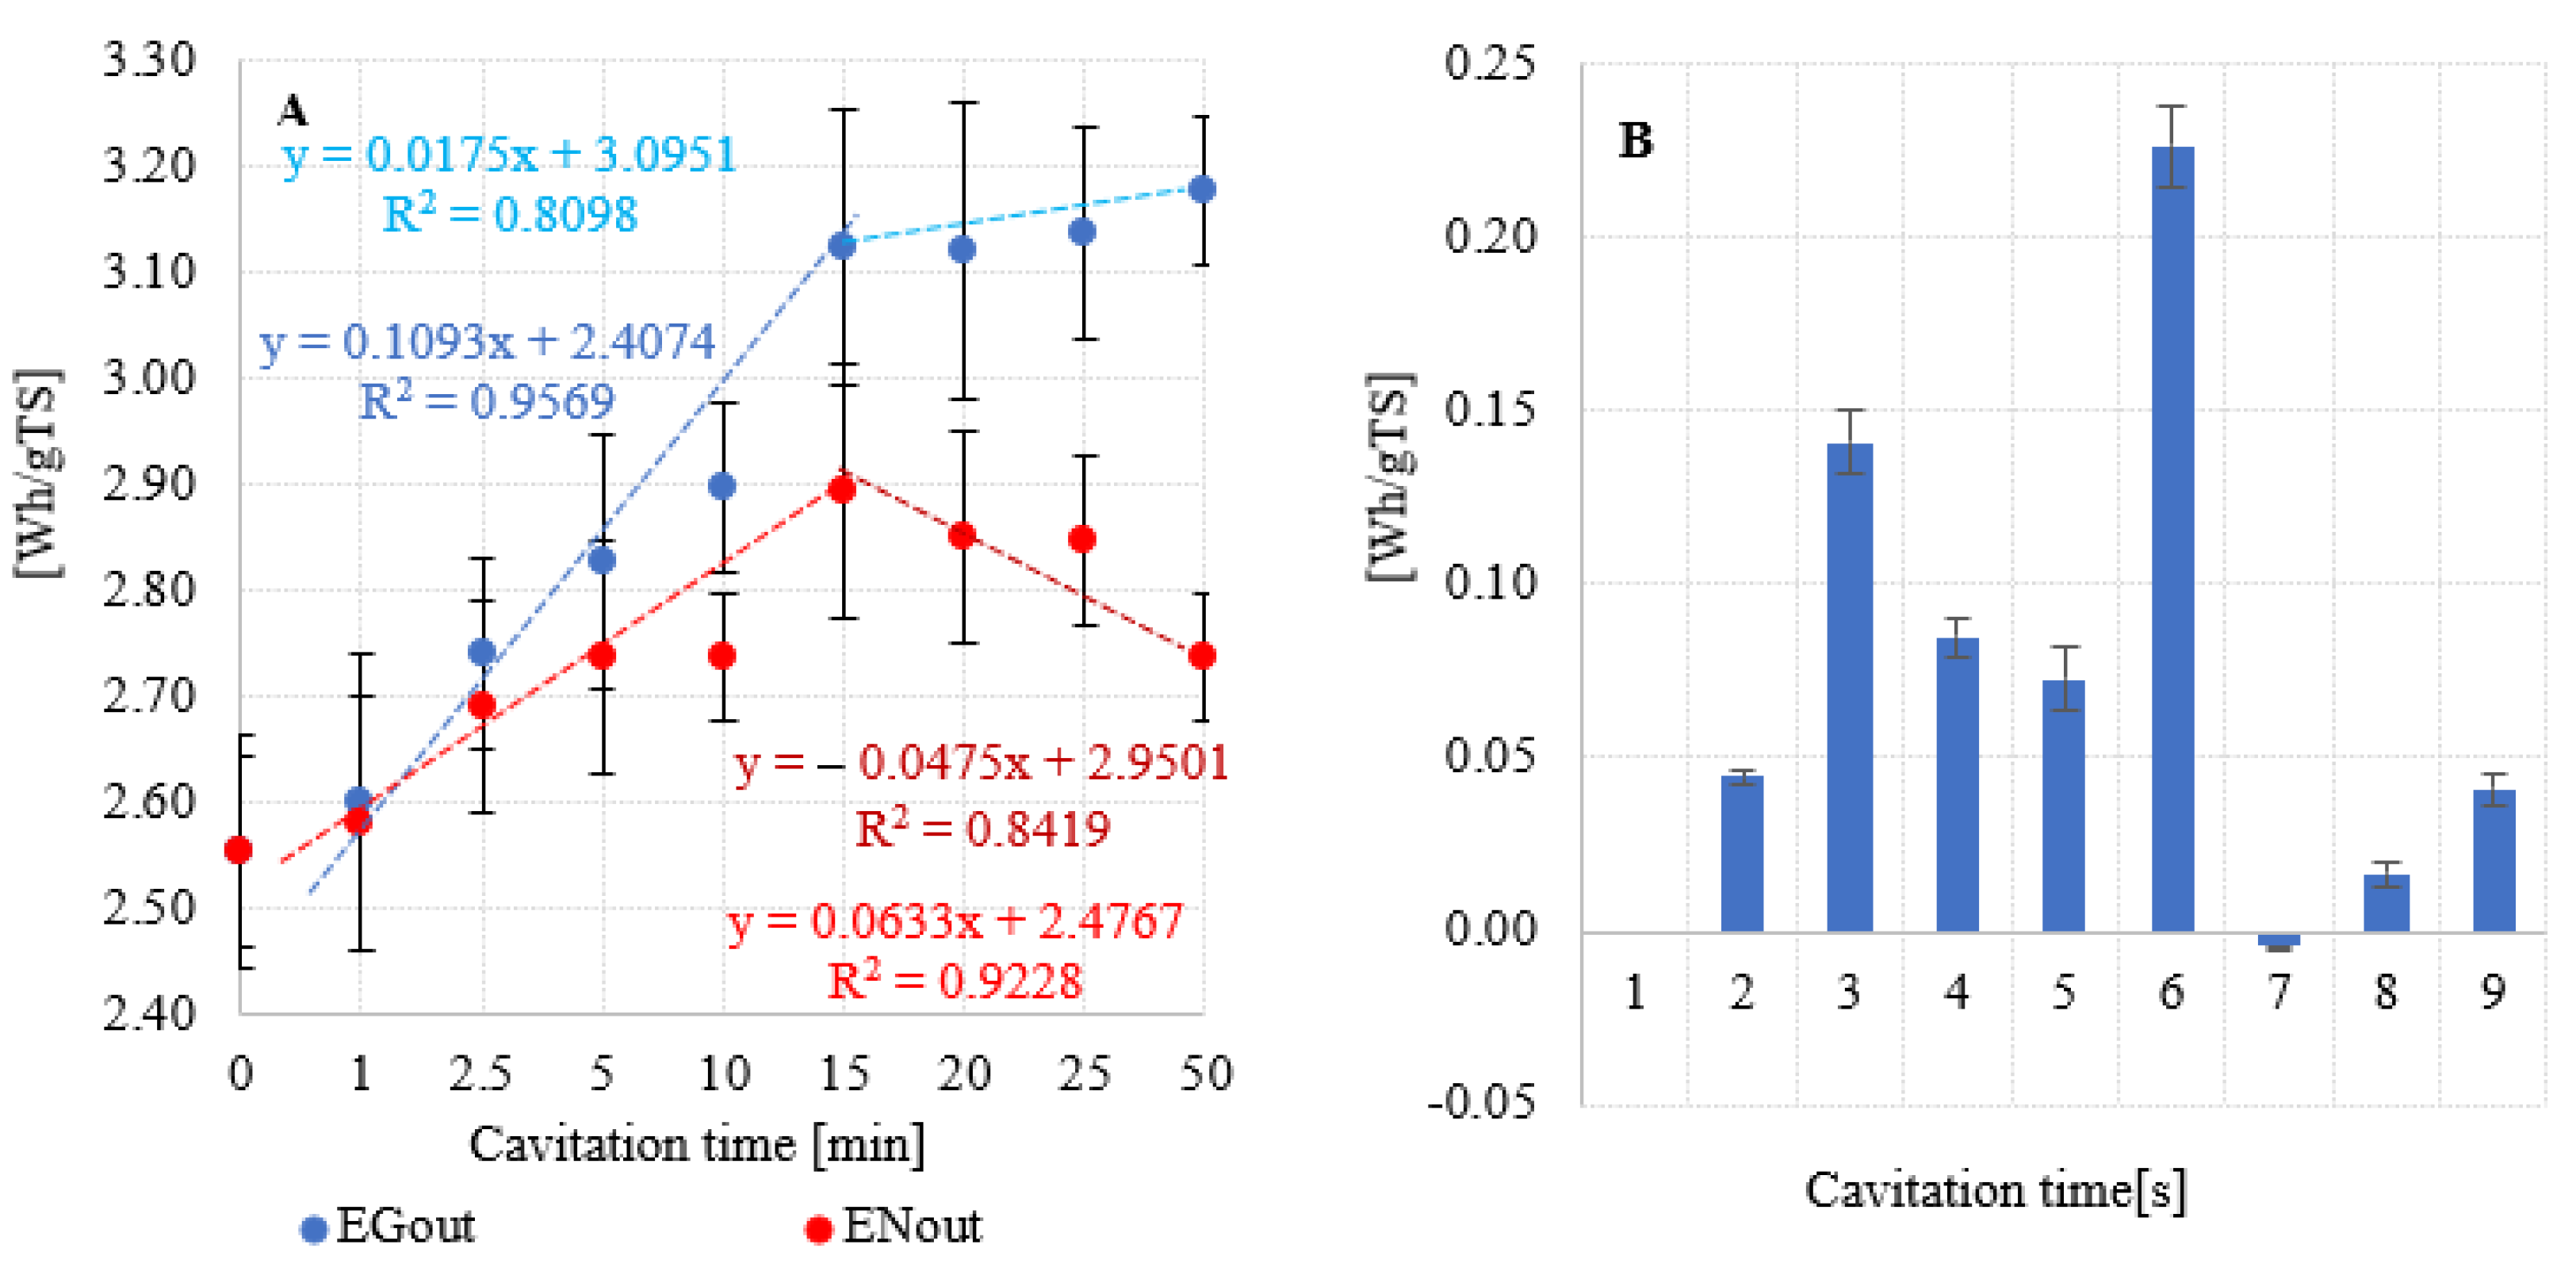

Table 1.
Planned stages and variants of research and parameters/conditions used.
| Stage 1 | ||||
| Variant | HC time [min] | Energy consumption | Temperature of AGS after HC [°C] | |
| [Wh/L] | [Wh/gTS] | |||
| V0 | 0 | - | - | 21,2 |
| V1 | 1 | 1,2 | 0,02 | 21,6 |
| V2 | 2,5 | 2,8 | 0,05 | 21,9 |
| V3 | 5 | 5,2 | 0,09 | 22,4 |
| V4 | 10 | 9,6 | 0,16 | 23,8 |
| V5 | 15 | 13,6 | 0,23 | 27,0 |
| V6 | 20 | 15,6 | 0,27 | 27,5 |
| V7 | 25 | 17,2 | 0,29 | 28,2 |
| V8 | 50 | 26,0 | 0,44 | 28,4 |
| Stage 2 | ||||
| Respirometric measurement of anaerobic digestion: Temerature - 38°C Initial organic load rate – 5,0 gVS/L Retention time – 20 days Frequency of partial pressure measurement – 2h | ||||
Table 2.
Characteristics of the aerobic granular sludge (AGS) and anaerobic sludge (AS) used in the experiment.
Table 2.
Characteristics of the aerobic granular sludge (AGS) and anaerobic sludge (AS) used in the experiment.
| Parameter | Unit | Value | |
|---|---|---|---|
| AGS | AS | ||
| Total solids (TS) | [mg/gFM.] | 58,6±3,1 | 21,0±2,2 |
| Mineral solids (MS) | [mg/gFM] | 16,0±1,8 | 6,4±01,5 |
| Volatile solids (VS) | [mg/gFM] | 42,5±1,8 | 14,6±1,5 |
| Total nitrogen (TN) | [mgN/gTS] | 32,4±2,3 | 30,5±1,9 |
| COD | [mgO2/L] | 225,0 ±19,8 | 412,0±67,2 |
| TOC | [mg/L] | 72,2±13,7 | 290±11,4 |
| TC | [mg/L] | 175,5±13,5 | 352±10,9 |
| IC | [mg/L] | 31,0±9,1 | 62±7,2 |
| Lipids | [mg/gTS] | 0,42±0,1 | 0,34±0,1 |
| Proteins | [mg/gTS] | 202,5±14,4 | 190,6±11,9 |
FM – fresh mass.
Table 3.
Chemical properties of AGS in experimental variants.
| Parametr | Unit | HC time [min] (Variant) | ||||||||
|---|---|---|---|---|---|---|---|---|---|---|
| 0 (V0) | 1 (V1) | 2,5 (V2) | 5 (V3) | 10 (V4) | 15 (V5) | 20 (V6) | 25 (V7) | 50 (V8) | ||
| Total solids (TS) | [mg/gFM.] | 58,6±3,1 | 53,4±1,7 | 54,5±2,1 | 55,0±1,3 | 56,2±2,6 | 56,7±2,9 | 56,0±2,3 | 55,8±1,4 | 55,7±3,2 |
| Mineral solids (MS) | [mg/gFM] | 16,0±1,8 | 15,0±1,2 | 15,1±0,9 | 15,1±1,5 | 15,7±2,1 | 16,1±0,7 | 15,9±1,3 | 15,8±1,1 | 15,4±2,4 |
| Volatile solids (VS) | [mg/gFM] | 42,5±1,8 | 38,4±1,2 | 39,3±0,9 | 39,9±1,5 | 40,6±2,1 | 40,6±0,7 | 40,1±1,3 | 40,1±1,1 | 40,4±2,4 |
| Total nitrogen (TN) | [mgN/gTS] | 32,4±2,3 | 32,2±1,9 | 31,5±1,4 | 32,2±1,6 | 34,5±1,6 | 36,4±2,1 | 38,8±1,2 | 38,5±2,0 | 37,5±0,9 |
| ChZT | [mgO2/L] | 225,0 ±19,8 | 356,0±21,3 | 429,0±19,8 | 514,0±39,2 | 878,0±32,6 | 1217,0±70,8 | 1318,0±77,2 | 1332,0±62,6 | 1305,0±91,1 |
| TOC | [mg/L] | 72,2±13,7 | 111,9±12,9 | 144,5±9,1 | 221,5±17,9 | 352,4±21,2 | 354,1±20,6 | 370,6±23,8 | 370,9±19,9 | 372,8±16,2 |
| TC | [mg/L] | 175,5±13,5 | 138,4±19,1 | 163,1±14,3 | 271,3±17,7 | 410,4±29,2 | 405,0±20,7 | 426,2±31,2 | 427,2±17,4 | 118,7±14,6 |
| IC | [mg/L] | 31,0±9,1 | 47,0±7,2 | 51,2±12,9 | 49,8±17,9 | 58,0±21,2 | 50,9±20,6 | 55,6±23,8 | 56,3±19,9 | 46,5±13,7 |
| Lipids | [mg/gTS] | 0,42±0,1 | 0,6±0,11 | 0,4±0,1 | 0,4±0,1 | 0,4±0,1 | 0,5±0,2 | 0,6±0,1 | 0,6±0,1 | 0,6±0,2 |
| Protein | [mg/gTS] | 202,5±14,4 | 201,3±11,9 | 196,9±8,7 | 201,3±10,0 | 215,6±10,0 | 227,5±13,1 | 242,5±7,5 | 240,6±12,5 | 234,4±5,6 |
Table 4.
Efficiency of biogas production and its qualitative composition depending on the experimental variant.
Table 4.
Efficiency of biogas production and its qualitative composition depending on the experimental variant.
| Cavitation time [min] (Variant) | Biogas | Methane | Biogas composition | ||||||
|---|---|---|---|---|---|---|---|---|---|
| mL/gFM | mL/gTS | mL/gVS | mL/gFM | mL/gTS | mL/gVS | CH4 [%] | CO2 [%] | O2 [%] | |
| 0 (V0) | 25,6±1,5 | 457,2±26,8 | 631,0±37,0 | 16,2±0,9 | 289,0±16,9 | 398,8±23,4 | 63,2±1,2 | 36,3±1,1 | 0,4±0,1 |
| 1 (V1) | 26,2±1,9 | 461,7±33,5 | 650,3±47,2 | 16,3±1,2 | 288,1±20,9 | 405,8±29,2 | 62,4±1,1 | 37,1±1,0 | 0,4±0,1 |
| 2,5 (V2) | 27,8±1,3 | 480,1±22,4 | 680,0±31,8 | 18,4±0,8 | 324,6±14,1 | 427,8±11,5 | 62,9±0,9 | 36,0±0,6 | 1,1±0,3 |
| 5 (V3) | 29,2±1,7 | 505,2±29,4 | 710,3±41,4 | 18,1±1,1 | 331,9±18,3 | 441,0±20,1 | 62,1±2,3 | 36,7±2,1 | 1,2±0,2 |
| 10 (V4) | 30,6±1,6 | 527,9±27,6 | 730,6±38,3 | 19,2±1,0 | 342,6±17,4 | 452,3±14,7 | 61,9±1,6 | 37,0±1,5 | 1,1±0,1 |
| 15 (V5) | 30,8±1,4 | 548,3±24,9 | 767,6±34,9 | 19,3±0,9 | 342,8±15,6 | 487,6±12,1 | 63,5±1,2 | 36,1±1,1 | 0,3±0,1 |
| 20 (V6) | 29,6±1,3 | 557,5±24,5 | 769,3±33,8 | 18,7±0,8 | 352,9±15,5 | 487,0±18,2 | 63,3±0,6 | 35,8±0,4 | 0,9±0,2 |
| 25 (V7) | 29,9±1,6 | 539,4±28,9 | 772,1±41,3 | 18,7±1,0 | 336,6±18,0 | 489,5±10,7 | 63,4±0,8 | 36,0±0,6 | 0,5±0,2 |
| 50 (V8) | 30,5±1,2 | 541,0±21,3 | 785,2±30,9 | 21,4±0,7 | 393,4±13,2 | 495,9±12,3 | 63,2±1,4 | 35,9±1,0 | 0,9±0,4 |
Table 5.
Energy gain assessment of the anaerobic digestion of AGS pretreated with HC.
| Variant | HK time [min] |
Energy consumption [kWh] | Specific energy input (Es) [Wh/gTS] | CH4 yeld mL/gTS |
CH4 energy value (YCH4) [Wh/L] |
Gross energy output (EGout) Wh/gTS |
Net energy output (ENout) Wh/g TS |
Net energy gain (Enet) Wh/g TS |
|---|---|---|---|---|---|---|---|---|
| V0 | 0 | 0 | 0 | 278,6 | 9,17 | 2,55 | 2,55 | 0,000 |
| V1 | 1 | 0,03 | 0,02 | 283,4 | 2,60 | 2,58 | 0,045 | |
| V2 | 2,5 | 0,07 | 0,05 | 298,8 | 2,74 | 2,69 | 0,141 | |
| V3 | 5 | 0,13 | 0,09 | 308,1 | 2,82 | 2,73 | 0,085 | |
| V4 | 10 | 0,24 | 0,16 | 316,0 | 2,90 | 2,74 | 0,073 | |
| V5 | 15 | 0,34 | 0,23 | 340,6 | 3,12 | 2,89 | 0,226 | |
| V6 | 20 | 0,39 | 0,27 | 340,2 | 3,12 | 2,85 | -0,004 | |
| V7 | 25 | 0,43 | 0,29 | 342,0 | 3,14 | 2,85 | 0,016 | |
| V8 | 50 | 0,65 | 0,44 | 346,4 | 3,18 | 2,74 | 0,041 |
Disclaimer/Publisher’s Note: The statements, opinions and data contained in all publications are solely those of the individual author(s) and contributor(s) and not of MDPI and/or the editor(s). MDPI and/or the editor(s) disclaim responsibility for any injury to people or property resulting from any ideas, methods, instructions or products referred to in the content. |
© 2023 by the authors. Licensee MDPI, Basel, Switzerland. This article is an open access article distributed under the terms and conditions of the Creative Commons Attribution (CC BY) license (http://creativecommons.org/licenses/by/4.0/).
Copyright: This open access article is published under a Creative Commons CC BY 4.0 license, which permit the free download, distribution, and reuse, provided that the author and preprint are cited in any reuse.


