Submitted:
31 October 2025
Posted:
04 November 2025
You are already at the latest version
Abstract
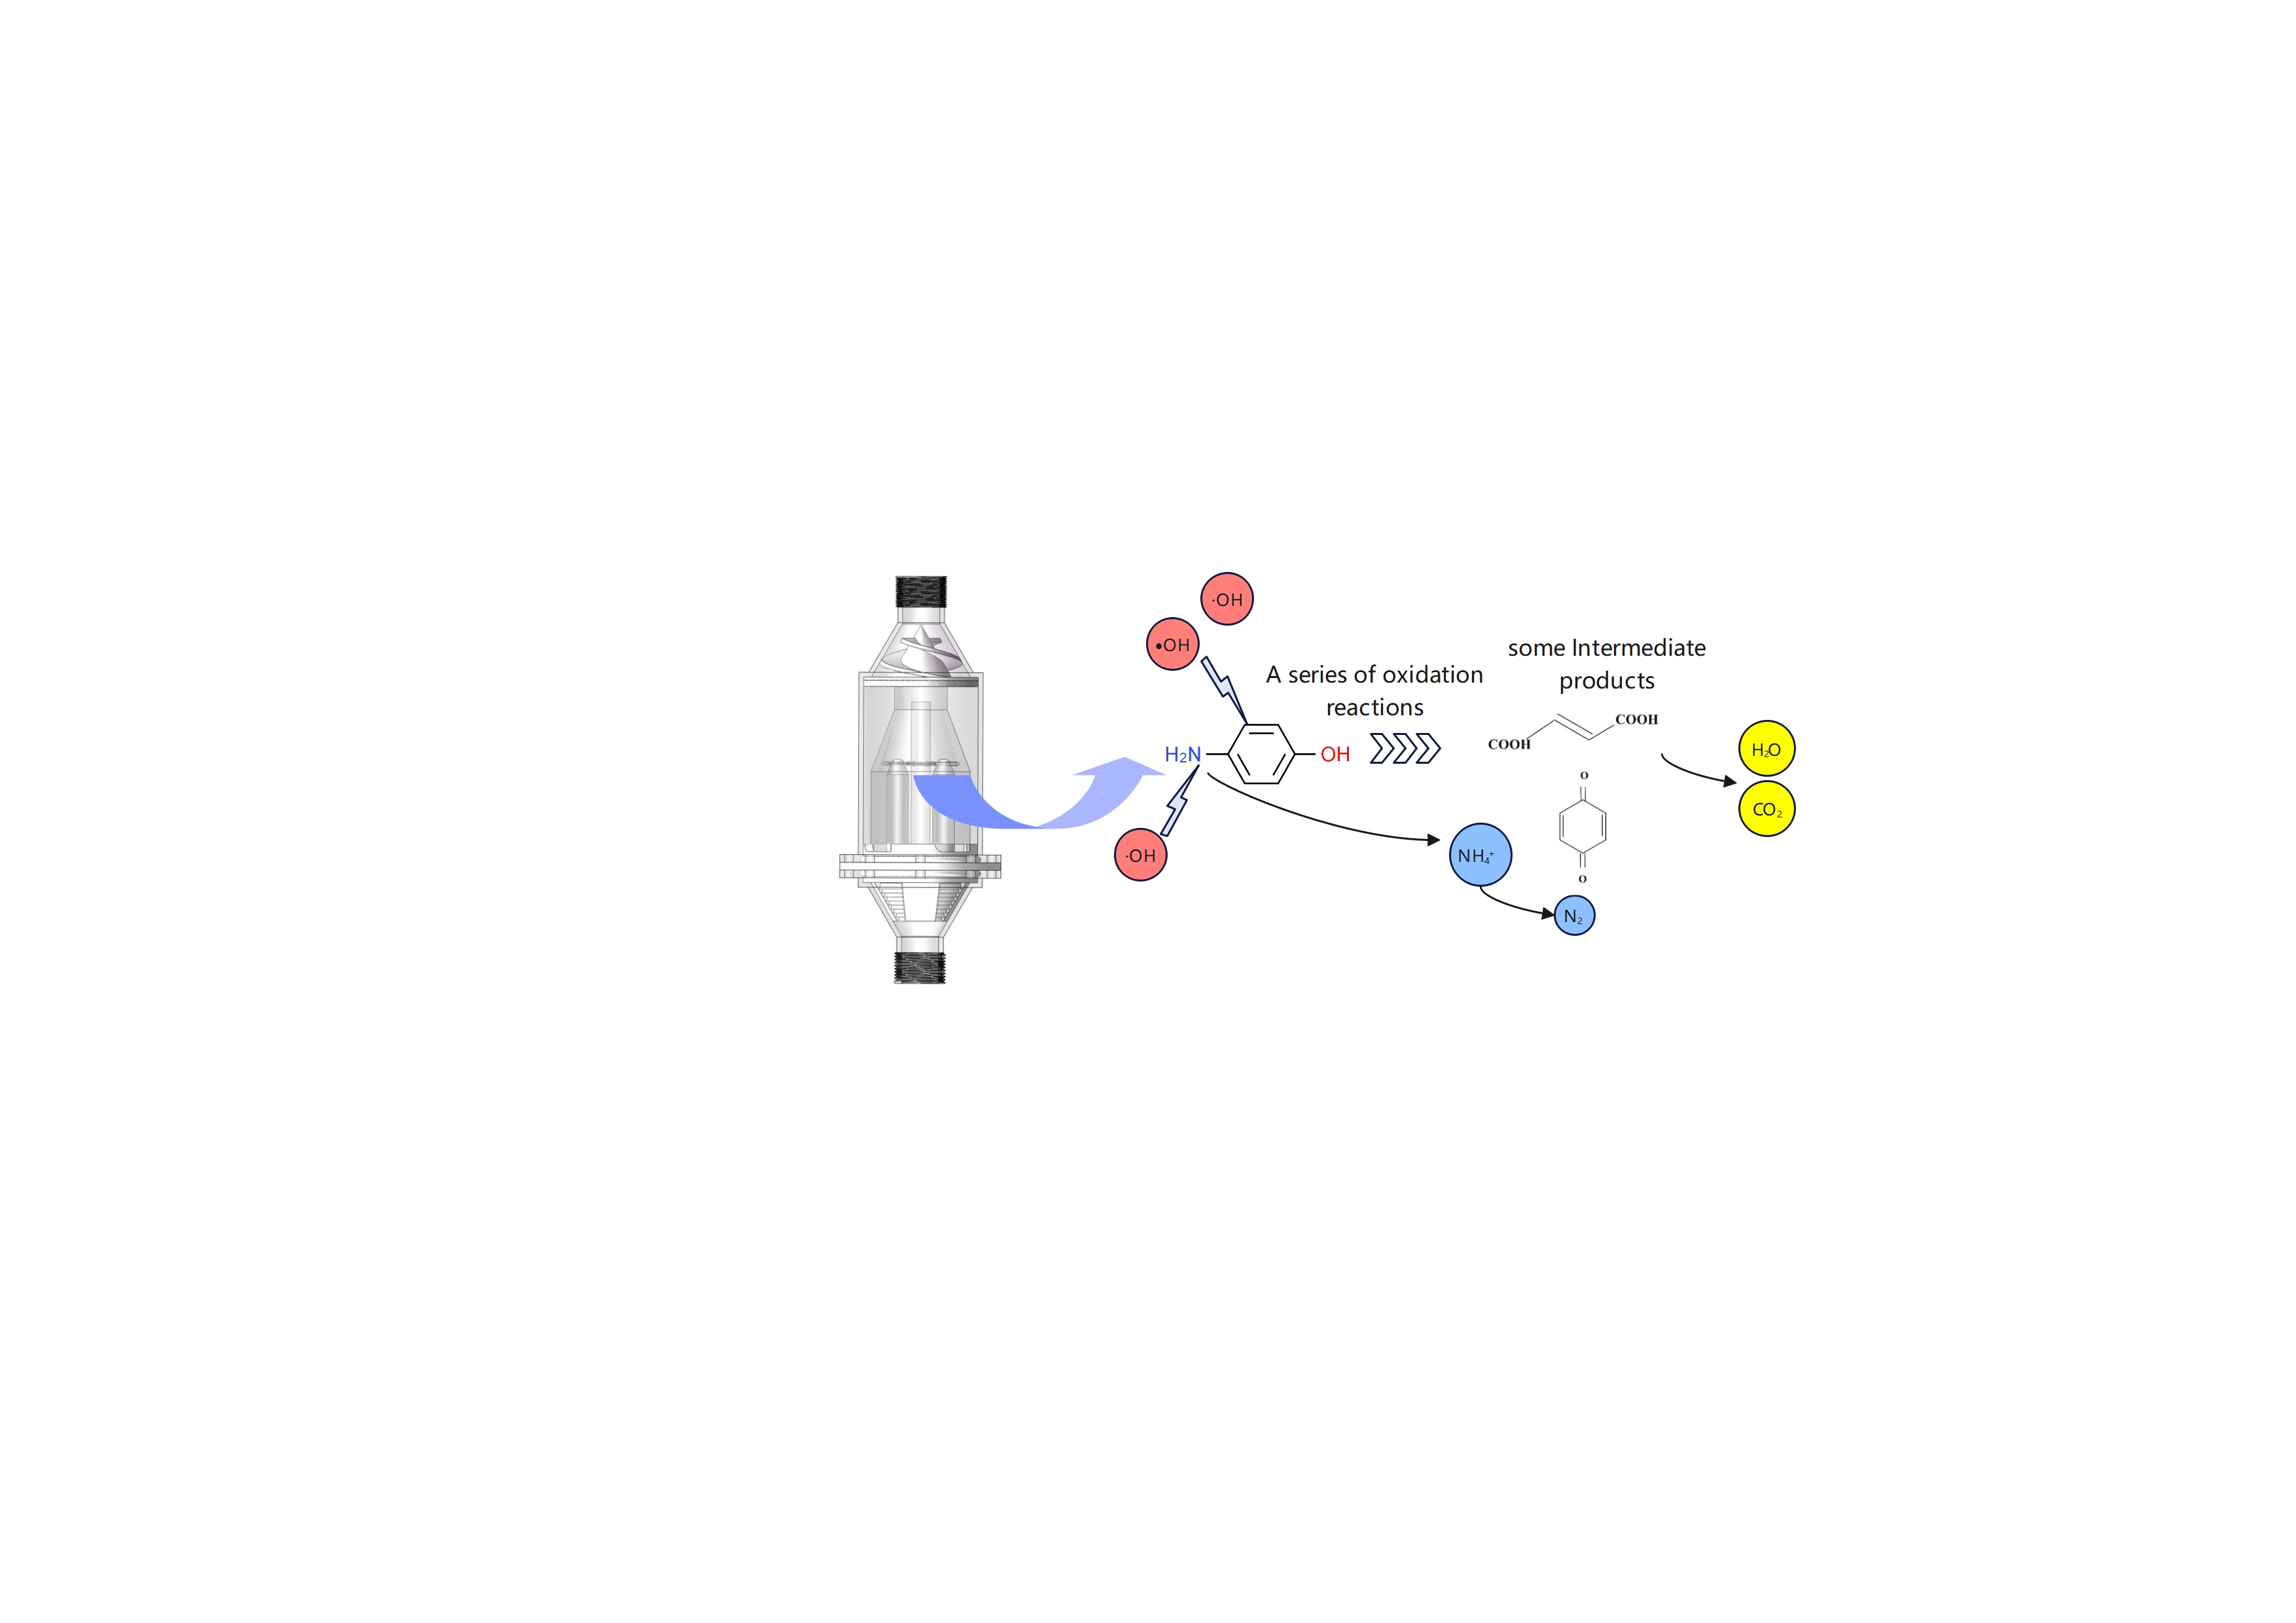
The treatment of refractory nitrogenous organic matter poses challenges in the removal of organic matter and nitrogen. In this study, a designed novel composite hydrodynamic cavitator, which can generate cavitation twice perpass at the throat of the spiral pipe and the step drain of the cavitation cavity superior to current other cavitators with only once perpass, was used to address these issues. The composite hydrodynamic cavitator optimized using ANSYS simulation software exhibits significant advantages in energy utilization and mass transfer efficiency. Moreover, it generates a high concentration of hydroxyl free radicals, which is crucial for organic matter degradation. Batch experiments proved the good treatment of 4-aminophenol solution. Within 120 minutes, 4-aminophenol degradation efficiency reached 74.7%, total nitrogen concentration decreased from 1.28 mg/L to 1.06 mg/L, while ammonia nitrogen concentration initially increased before decreasing from its peak value of 0.82 mg/L to 0.77 mg/L. During the cavitation treatment of 4-aminophenol solution, intermediate products such as benzoquinone are generated. Under the strong oxidative action of hydroxyl radicals, the nitrogen element undergoes deamination to form ammonium ions, which are ultimately removed in the form of nitrogen gas.
Keywords:
composite hydrodynamic cavitator
; degradation of 4-aminophenol
; denitrification
1. Introduction
The treatment of refractory nitrogenous organic compounds poses a significant challenge in industrial wastewater management [1]. These substances, commonly found in effluents from petroleum refining, landfill leachate, pharmaceutical manufacturing, and chemical industries, are characterized by high toxicity, poor biodegradability, and stable chemical structures. Moreover, since organic compounds contain nitrogen, the nitrogen released during the degradation process enters the wastewater, increasing the nitrogen concentration and exacerbating the difficulty of nitrogen removal from the wastewater. Therefore, the treatment of wastewater containing refractory nitrogenous organic substances remains a rather challenging issue at present.
This study employs 4-aminophenol as a representative nitrogenous organic compound to investigate its degradation and nitrogen removal through hydrodynamic cavitation, aiming to provide a novel approach for the treatment of refractory nitrogenous organic wastewater. The compound 4-aminophenol, commonly used as an intermediate, is extensively applied in the synthesis of pharmaceuticals like clofibrate and paracetamol. Additionally, it is present in significant quantities in wastewater generated from dye production processes, posing challenges for conventional treatment methods due to its potent biological toxicity and chemical stability [2].
Advanced oxidation processes (AOPs) are often considered by researchers for the treatment of 4-aminophenol. The photocatalytic-oxidation method utilizes light to irradiate specific semiconductor catalysts with band structures, inducing the production of •OH from H2O and effectively degrading pollutants in wastewater. Mehdi A et al. [3] employed CuO—loaded wavy zeolite for catalytic degradation of 4-aminophenol using sunlight. Photocatalytically—assisted electrochemical oxidation utilizing Z-TiO2 achieved an 88% degradation efficiency of 4-aminophenol [4]. In addition, a PbO2–TiO2 electrode was utilized as an anode for photoelectrocatalytic degradation treatment of simulated and real 4-aminophenol wastewaters [5], yielding favorable degradation results in all aforementioned studies. However, photocatalysts possess limitations such as high band gaps, agglomeration tendencies, small surface areas, instability issues, and difficulties in recovery after treatment. Furthermore, the Fenton oxidation method is also commonly employed as an AOP approach. Carlos Moreno-Castill et al. [6] investigated the synthesis of highly active Fenton multiphase catalysts containing Cu2+ ions within copper ferrites to synthesize copper ferrite nanoballs (CFNS), analyzing their effectiveness in degrading 4-aminophenol compounds. Nevertheless, treating sludge-containing Fe ions can be costly and requires significant amounts of chemicals and manpower resources. Biodegradation represents another viable option for removing 4-aminophenol compounds; effective removal has been demonstrated through the use of organisms such as pea (Pisum sativum) shells activated with sulfuric acid [7] or Pseudomonas sp. strain ST-4 [8]. However, this method exhibits limitations when applied to wastewater treatment due to low degradation efficiency resulting from complex compositions present in actual organic wastewaters, and long reaction times caused by high cultivation requirements on pH, complicated reaction process and low removal efficiency
Cavitation is regarded as a highly efficient and promising technology that has garnered significant attention from researchers. Due to its cavitation effects, such as increased temperature, oxidation, and mechanical collision, cavitation technology has been found extensive applications in various fields including disinfection [9,10], degradation of refractory organics like synthetic dyes [11,12,13], pharmaceutical residues [14,15,16], pesticides [17,18], and sludge treatment [19]. Patil et al. investigated the removal of ammoniacal nitrogen from synthetic wastewater using 4-aminophenol as a model nitrogen-containing organic compound through hydrodynamic cavitation. Remarkable improvement in ammoniacal nitrogen removal was achieved by introducing air or oxygen sparging during hydrodynamic cavitation and employing solvent-assisted hydrodynamic cavitation with substances such as 1-octanol and cyclohexanol [20,21]. In this study, our objective was to enhance cavitation effect and treat 4-aminophenol efficiently without the need for additional substances by a novel composite hydrodynamic cavitator. We examined the degradation of 4-aminophenol along with ammonia nitrogen and total nitrogen removal from the solution using this cavitator. The findings of our research will provide an innovative approach for treating refractory nitrogenous organic wastewater through hydrodynamic cavitation while specifically addressing ammoniacal nitrogen removal.
2. Structure Design and Its CFD Optimization of the Composite Hydrodynamic Cavitator
2.1. The Structure of Composite Hydrodynamic Cavitator
The autonomously designed composite hydrodynamic cavitator primarily comprises a shell, a spiral filter inlet, a cavitation generation chamber, a separator, a stepped drainage outlet, and an effluent outlet, as illustrated in Figure 1. Notably, the cavitation generation chamber is equipped with four vortex chambers. The fundamental structural dimensions of the cavitator are as follows: total length of 254 mm, inlet and outlet diameters of 24 mm, and the vortex chamber has a diameter of 14 mm and a height of 50 mm.
2.2. Flow Field Simulation Method
The cavitator was modeled by using the 3D design software UG. The preprocessing and volume extraction of the solid model were conducted by the preprocessing module SpaceClaim of the ANSYS simulation software. The computational domain of the cavitator was meshed by the mesh module of the ANSYS simulation software, and the simulation calculation of the mesh file was then carried out by the fluent module of the ANSYS simulation software.
2.2.1. Mesh Division
The structure of the composite hydrodynamic cavitator is relatively complex. Therefore, an adaptive unstructured mesh was employed to divide the model. According to the stress degree of the cavitator, the densities of the meshes at the throttling section, the cavitation generation section, and the boundary layer were all increased. The mesh model is shown in Figure 2.
In order to ensure the reliability of the simulation calculation, a grid generation method is used to generate four sets of grid numbers, namely 731 210, 1 191 536, 2 131 717, and 3 460 983. The inlet pressure is set to 0.4 MPa, and the velocity at the exit of the cavitation body is monitored. The velocity in the network model with 2 131 717 grid numbers tends to stabilize, indicating that the accuracy of the calculation is no longer affected by the increase in the number of network nodes. Therefore, considering the calculation accuracy and simulation efficiency, we select the network model with 2 131 717 grid numbers for the fluid field simulation calculation.
2.2.2. Simulation Conditions and Model Selection
The simulation is carried out using the pressure-based transient solver PISO algorithm, and the other variable solutions are obtained using the first-order advection scheme to ensure absolute stability. The mixture multiphase flow model and the realizable k-ε two-equation turbulence model are selected to better simulate the phenomena of the jet in the cavitation effect [22]. The wall treatment is selected as the non-equilibrium wall function. The Schnerr&Sauer cavitation model [23] is used to simulate the mass transport process of the two-phase flow in the cavitation. The velocity, pressure, and mass component variables in the flow field are solved using the continuity equation, momentum equation, turbulent kinetic energy-turbulent dissipation rate equation, and vapor phase mass transport equation.
3. Experimental Methods
3.1. The Degradation Experimental Platform
The experimental platform for the composite hydrodynamic cavitor is shown in Figure 3. The main components of the platform include the frame, water tank, composite hydrodynamic cavitator, pressure gauge, overflow valve, flow control valve, vertical booster pump, pressure tank, intelligent turbine flow transmitter, and various water pipes.
It is a closed loop system designed to pump 10 L of 4-aminophenol solution from water tank, then take it into the composite hydrodynamic cavitator and discharge the treated solution back to the water tank through the pump.
3.2. The Hydroxyl Radical Generation
The methylene blue (MB) degradation was used to indirectly determine the amount of hydroxyl radicals (•OH) generated by the composite hydrodynamic cavitator during operation [24,25].
With an inlet pressure of 0.25 MPa, initial temperature of 25 °C, and pH of 7, 10 L solutions of MB with initial concentrations of 10 mg/L, 15 mg/L, 20 mg/L, 25 mg/L, and 30 mg/L were subjected to cavitation experiments for 120 min. The amount of •OH generated was calculated as follows:
Where, C·OH represents the concentration of hydroxyl radicals, mg/L; ΔA is the difference in the absorbance of MB before and after degradation by cavitation. The equation was obtained by the standard curve equation of MB concentration(C, mg/L) and its absorbance(A): A=0.0541C-0.001(R2=0.9997), and the reaction equation between MB and •OH : MB +•OH → MB-OH.
Simplified equation (1) is:
3.3. Degradation Experiment
Batch experiments were conducted for the degradation of 4-aminophenol and ammonia nitrogen by the composite hydrodynamic cavitator. Under the basic conditions of an inlet pressure of 0.25 MPa, initial temperature 25 °C, pH of 7, 10 L of initial concentration of 10 mg/L of 4-aminophenol solution was subjected to cavitation experiment for 120 min.
The 4-aminophenol solution samples before and after degradation for 120 min at optimum conditions were detected by HPLC. For this experiment, the HPLC detection instrument used was the SHIMADZU-LC-2050C of Shimadzu, and the column used was C18. The detection conditions were as follows: the mobile phase was a mixture of methanol and water at a ratio of 50:50 (V/V), the flow rate was 1.0 L/min, the injection volume was 20 μL, the detection wavelength was 268 nm, and the column temperature was 30 °C.
4. Results and Discussions
4.1. Cavitation Characteristics Analysis of the Cavitator with Optimal Structural Parameters
Through CFD simulations of various structure parameters of the composite hydrodynamic cavitator, the optimal structure of it was obtained as follows. The helical pipe is designed as a Laryngeal-type pipe with the laryngeal diameter of 1.3 mm, an entrance diameter of 3 mm, an exit diameter of 3 mm, and a pipe length of 38 mm. The stepped-type drainage outlet has a 9-stage structure, with a channel width of 0.5 mm. Then we evaluated the cavitation performance of the above optimum cavitator comprehensively, by analyzing the pressure, gas content, and mass transfer cavitation characteristics of fluid inside the cavitator under the entrance pressure of 0.6 MPa.
Figure 4 shown XY sectional diagram of the compound hydrodynamic cavitator is the coordinate diagram used for the subsequent analysis. The diagram takes the entrance to the cavitator to the exit as the X-axis, represented by Y(m). The Y-axis represents the variable values of the micro-elemental bodies in the cross-section, such as absolute pressure values, gas content, and mass transfer cavitation characteristics of fluid inside the cavitator.
4.1.1. The Absolute Pressure of the Fluid Inside the Cavitator
Figure 5 shows the cross-sectional cloud image of absolute pressure of fluid at two key places where cavitation occurs: spiral pipe in cavitation cavity(a) and the stepped drain(b).
From Figure 5a, it can be seen that as the fluid flows through the helical flow passage in the front section with decreasing gradually cross-sectional area, the pressure drops significantly. When the fluid flows to the throat position, the absolute pressure gradually drops below the saturated vapor pressure of set simulated liquid (3,540 Pa), and then vaporization occurs to produce a vapor nucleus. After the fluid flows through the throat, the cross-sectional area of pipe increases gradually, and the pressure increases gradually, causing the internal and external pressure imbalance of the cavitation bubble to cause its collapse, thus causing cavitation. From Figure 5b, it can be seen that when the liquid flows from the cavitation generation chamber to the entrance of the stepped condensate outlet, the pressure is restored to 0.32 MPa and then gradually decreases. When the liquid flows near the stepped condensate outlet, the pressure is lower than the saturated vapor pressure of the simulated liquid again, and bubbles are generated at this time. When the liquid flows to the outlet, the pressure suddenly rises and cavitation occurs. Moreover, the stepped outlet can make the cavitation bubbles, which have not collapsed in the cavitation generation chamber, collapse repeatedly in the process of flowing through multiple changed areas, thereby improving the efficiency of cavitation per pass.
4.1.2. Mass Transfer Analysis
Figure 6 displays mass transfer rate XY diagram of cavitation simulation from inlet to outlet. The mass transfer rate includes both forward and negative mass transfer. In the process of hydraulic cavitation, forward mass transfer refers to the process of gas molecules dissolved in the liquid phase to the gas phase, which may increase the concentration of gas in the liquid phase and promote the formation and release of bubbles, corresponding to the formation and development stage of bubbles in the process of cavitation. Negative mass transfer refers to the dissolution process of the bubble in the liquid phase, that is, the gas molecules in the bubble are re-dissolved into the liquid phase, corresponding to the collapse stage of the bubble in the cavitation process. As shown in Figure 6, peaks 1 and 2 represent the formation, development and collapse of bubbles in the cavitation process at the spiral pipe and the stepped drain respectively. Among them, the forward mass transfer rate of peak No. 1 exceeds 20 000 kg·m−3·s−1, while the negative mass transfer rate exceeds 10 000 kg·m−3·s−1. These high forward mass transfer rate and negative mass transfer rate can promote the transfer and removal of solute. The negative mass transfer rate of peak No. 2 does not peak and is near the zero axis, indicating that during the cavitation process, the bubbles collapse at the exit rapidly and have no chance to transfer the solute to the liquid phase.
4.1.3. Gas Holdup Analysis
Gas holdup, that is, vapor phase volume fraction, is one of the important indicators to measure the occurrence and intensity of cavitation. Figure 7 shows the distribution of gas holdup where cavitation occurs. It was found that the distribution corresponded to the pressure distribution where cavitation occurs in Figure 5. As shown in Figure 7a, due to the abrupt change in the pipeline through which the fluid flows, the flow velocity increases sharply, the pressure decreases significantly, and the kinetic energy increases accordingly. The pressure at the throat of the spiral channel reaches the saturated vapor pressure, causing the gas to escape from the liquid phase to form bubbles. At this spot, the gas holdup at the cavitation of the spiral channel reached 63%. As shown in Figure 7b, the outlet pressure of the stepped drain is the lowest, which is lower than the saturated vapor pressure of the liquid, resulting in the gas in the liquid escaping to form bubbles. Therefore, the gas core generation area at the outlet has the highest gas holdup, up to 95%.
4.2. The Concentration of Hydroxyl Radical Produced During Cavitation
As can be seen from Figure 8, the evaluation of hydroxyl radical concentration in the composite hydrodynamic cavitator system shows that when the methylene blue concentration is low, the hydroxyl radical capture rate is also low. With the increase of methylene blue solution concentration, the capture rate increased gradually. When the concentration reached 25 mg/L, the capture rate of hydroxyl radical remained basically unchanged, indicating that the hydroxyl radical generated in the composite hydrodynamic cavitator system had been fully captured by methylene blue, and its concentration was about 35 μmol/L. The numerical value is much higher than 0.3 μmol/L of the concentration of hydroxyl radicals detected by Zhang et al. [25].
4.3. Degradation of 4-aminophenol by the Cavitator and Nitrogen Removal Performance of the Solution
4.3.1. Influence of Cavitation Time
The degradation of 4-aminophenol and the removal of total nitrogen and ammonia nitrogen in 4-aminophenol solution with an initial concentration of 10 L of 10 mg/L under the operation time of the cavitation from 10 min to 150 min are shown in Figure 10.
As can be seen from Figure 10a, the degradation efficiency of 4-aminophenol solution gradually increased with the increase of cavitation time, and the degradation efficiency of 4-aminophenol tended to be stable at 120 min, reaching 74.7%. As can be seen from Figure 10b, the ammonia nitrogen concentration showed a trend of first rising and then slightly falling. The concentration decreased from the highest 0.82mg/L to 0.77mg/L. With the continuous degradation of 4-aminophenol, ammonia nitrogen was continuously generated and the concentration increased. At the same time, the generated ammonia nitrogen was continuously oxidized under the action of hydroxyl radical generated by cavitation effect until the rate of ammonia nitrogen generation was equal to that of ammonia nitrogen removal, the concentration of ammonia nitrogen began decreasing. The gradual decrease in total nitrogen concentration, from 1.28 mg/L to 1.06 mg/L, can be attributed to the nitrogen release as a gas, such as nitrogen, ammonia, nitrogen oxide, etc. in the degradation process, resulting in a gradual decrease in total nitrogen concentration.
4.3.2. Influence of Inlet Pressure
The degradation efficiency of 4-aminophenol and the removal of total nitrogen and ammonia nitrogen at different inlet pressures of 0.15 MPa ~ 0.35 MPa for 120 min are shown in Figure 11.
As can be seen from Figure 11, when the inlet pressure was in the range of 0.15–0.25 MPa, the degradation efficiency of 4-aminophenol increased significantly with the increase of the inlet pressure. The maximum degradation efficiency of 4-aminophenol was 74.7% when the inlet pressure is 0.25 MPa. The concentration of ammonia nitrogen also showed an inflection point at the inlet pressure of 0.25 MPa. However, when the inlet pressure was in the range of 0.25–0.35 MPa, the degradation efficiency of 4-aminophenol showed a slow decline with the increase of the inlet pressure, while the ammonia nitrogen concentration was basically unchanged.
The inlet pressure has a double influence on the cavitation effect. First, at low inlet pressure levels, increasing the inlet pressure can increase the fluid flow rate and reduce the pressure of the fluid as it passes through the mechanically confined structure, thus reducing the difference between the fluid pressure and the saturated vapor pressure. This is conducive to the easy formation of the pressure drop required to meet the occurrence of cavitation, thus improving the cavitation effect. However, when the inlet pressure is too high, the flow rate of the fluid is too fast. This will significantly shorten the development time of the cavitation bubbles, resulting in a decrease in the number of effective cavitation bubbles. Moreover, too fast flow rate will cause the strong oxidizing free radicals generated by the cavitation effect to pass through the cavitation region quickly. It results low concentration of strong oxidizing free radicals on the outside of the cavitation region. Then it will reduce the reaction rate of 4-aminophenol, and then significantly affected the degradation efficiency of 4-aminophenol. However, the total nitrogen concentration gradually decreases with the increase of inlet pressure, because the solubility of gas molecules in the solution will decrease under higher pressure conditions, resulting in the release of gases from the liquid, including nitrogen-containing gases. Therefore, the inlet pressure has a certain impact on the cavitation effect of the composite hydrodynamic cavitator. Taking into account the energy consumption of cavitation operation, the higher the inlet pressure, the greater the energy consumption, the best inlet pressure is 0.25 MPa.
4.3.3. Influence of Initial pH
The degradation efficiency of 4-aminophenol and the removal of total nitrogen and ammonia nitrogen at pH range of 5~9 was obtained, as shown in Figure 12.
The degradation efficiency of 4-aminophenol slightly decreased with an increase in pH within the range of 5-7, as depicted in Figure 12. Simultaneously, there was a slight increase in the concentrations of total nitrogen and ammonia nitrogen. However, when pH raised within the range of 7-9, an increased pH led to a significant decrease in the degradation efficiency of 4-aminophenol while causing a gradual reduction in the concentrations of total nitrogen and ammonia nitrogen. This phenomenon can be attributed to several possible reasons [26,27]. The first, under acidic conditions, more hydroxyl radicals are generated which facilitate the degradation process for 4-aminophenol. Additionally, these hydroxyl radicals oxidize nitrogen-containing substances resulting in the release of gaseous nitrogen compounds leading to decreased levels of both total nitrogen and ammonia nitrogen. The second, under alkaline conditions, the generation of hydroxyl radicals may be inhibited, resulting in a decrease in the degradation efficiency of 4-aminophenol, while the concentration of ammonia nitrogen also decreases. Under alkaline conditions, more ammonium ions are converted into ammonia gas and overflow during the cavitation process, resulting in a decrease in the concentration of total nitrogen. The third, the occurrence of cavitation is more favorable for solute molecules with higher hydrophobicity; however, 4-aminophenol exhibits strong hydrophilicity under acidic and alkaline conditions. Under neutral conditions, the hydrophilicity of amino group and hydrophobicity of benzene ring balance each other, which is conducive to the degradation of 4-aminophenol. Therefore, considering all the above factors comprehensively, pH 7 is determined as the optimal value.
4.3.4. Influence on the Initial Concentration of 4-aminophenol
In order to better compare the concentration changes of total nitrogen and ammonia nitrogen with the degradation of 4-aminophenol at different initial concentrations, the concentration is expressed in unit concentration. The unit concentration of total nitrogen and ammonia nitrogen at different initial concentrations is defined as follows:
where Cu is the unit concentration, C is the concentration of total nitrogen or ammonia nitrogen after cavitation (mg/L), C0 is the initial concentration of 4-aminophenol (mg/L).
The degradation efficiency of 4-aminophenol and the concentrations of total nitrogen and ammonia nitrogen at different initial concentrations ranging from 5 mg/L to 25 mg/L were obtained, is shown in Figure 13.
As shown in Figure 13, the degradation efficiency of 4-aminophenol decreased continuously with an increase in its initial concentration, while the degradation amount gradually increased. This is because at relatively low initial concentrations of 4-aminophenol in the hydraulic cavitation system, the molecules are dispersed and difficult for hydroxyl radicals generated by cavitation to capture. Conversely, higher concentrations of 4-aminophenol are easily captured by hydroxyl radicals resulting from cavitation effects, leading to a faster reaction.
The concentrations of total nitrogen and ammonia nitrogen exhibited a decreasing trend with increasing initial concentration of 4-aminophenol; however, the overall change was not statistically significant. In the case of high initial concentration of para-aminophenol, enhanced degradation led to increased generation of ammonia nitrogen, which subsequently converted into more nitrogen-containing gas for release. Consequently, the total reduction was amplified without substantial alteration in unit concentrations of total nitrogen and ammonia nitrogen.
4.4. Degradation and Denitrification Chemical Reaction During Degradation
Infrared spectroscopy scan spectrum and the HPLC chromatogram before and after cavitation for 120 min was determined, as shown in the Figure 14 and Figure 15.
As shown in Figure 14, compared with the two curves, the absorption peak of before cavitation with retention time of 1.347 min significantly declined, and the absorption peak with retention time of 4.775 min basically disappeared, and some small miscellaneous peaks appeared after cavitation. This indicates that with the progress of the experiment, the 4-aminophenol in the solution is greatly reduced, and some intermediate products are produced.
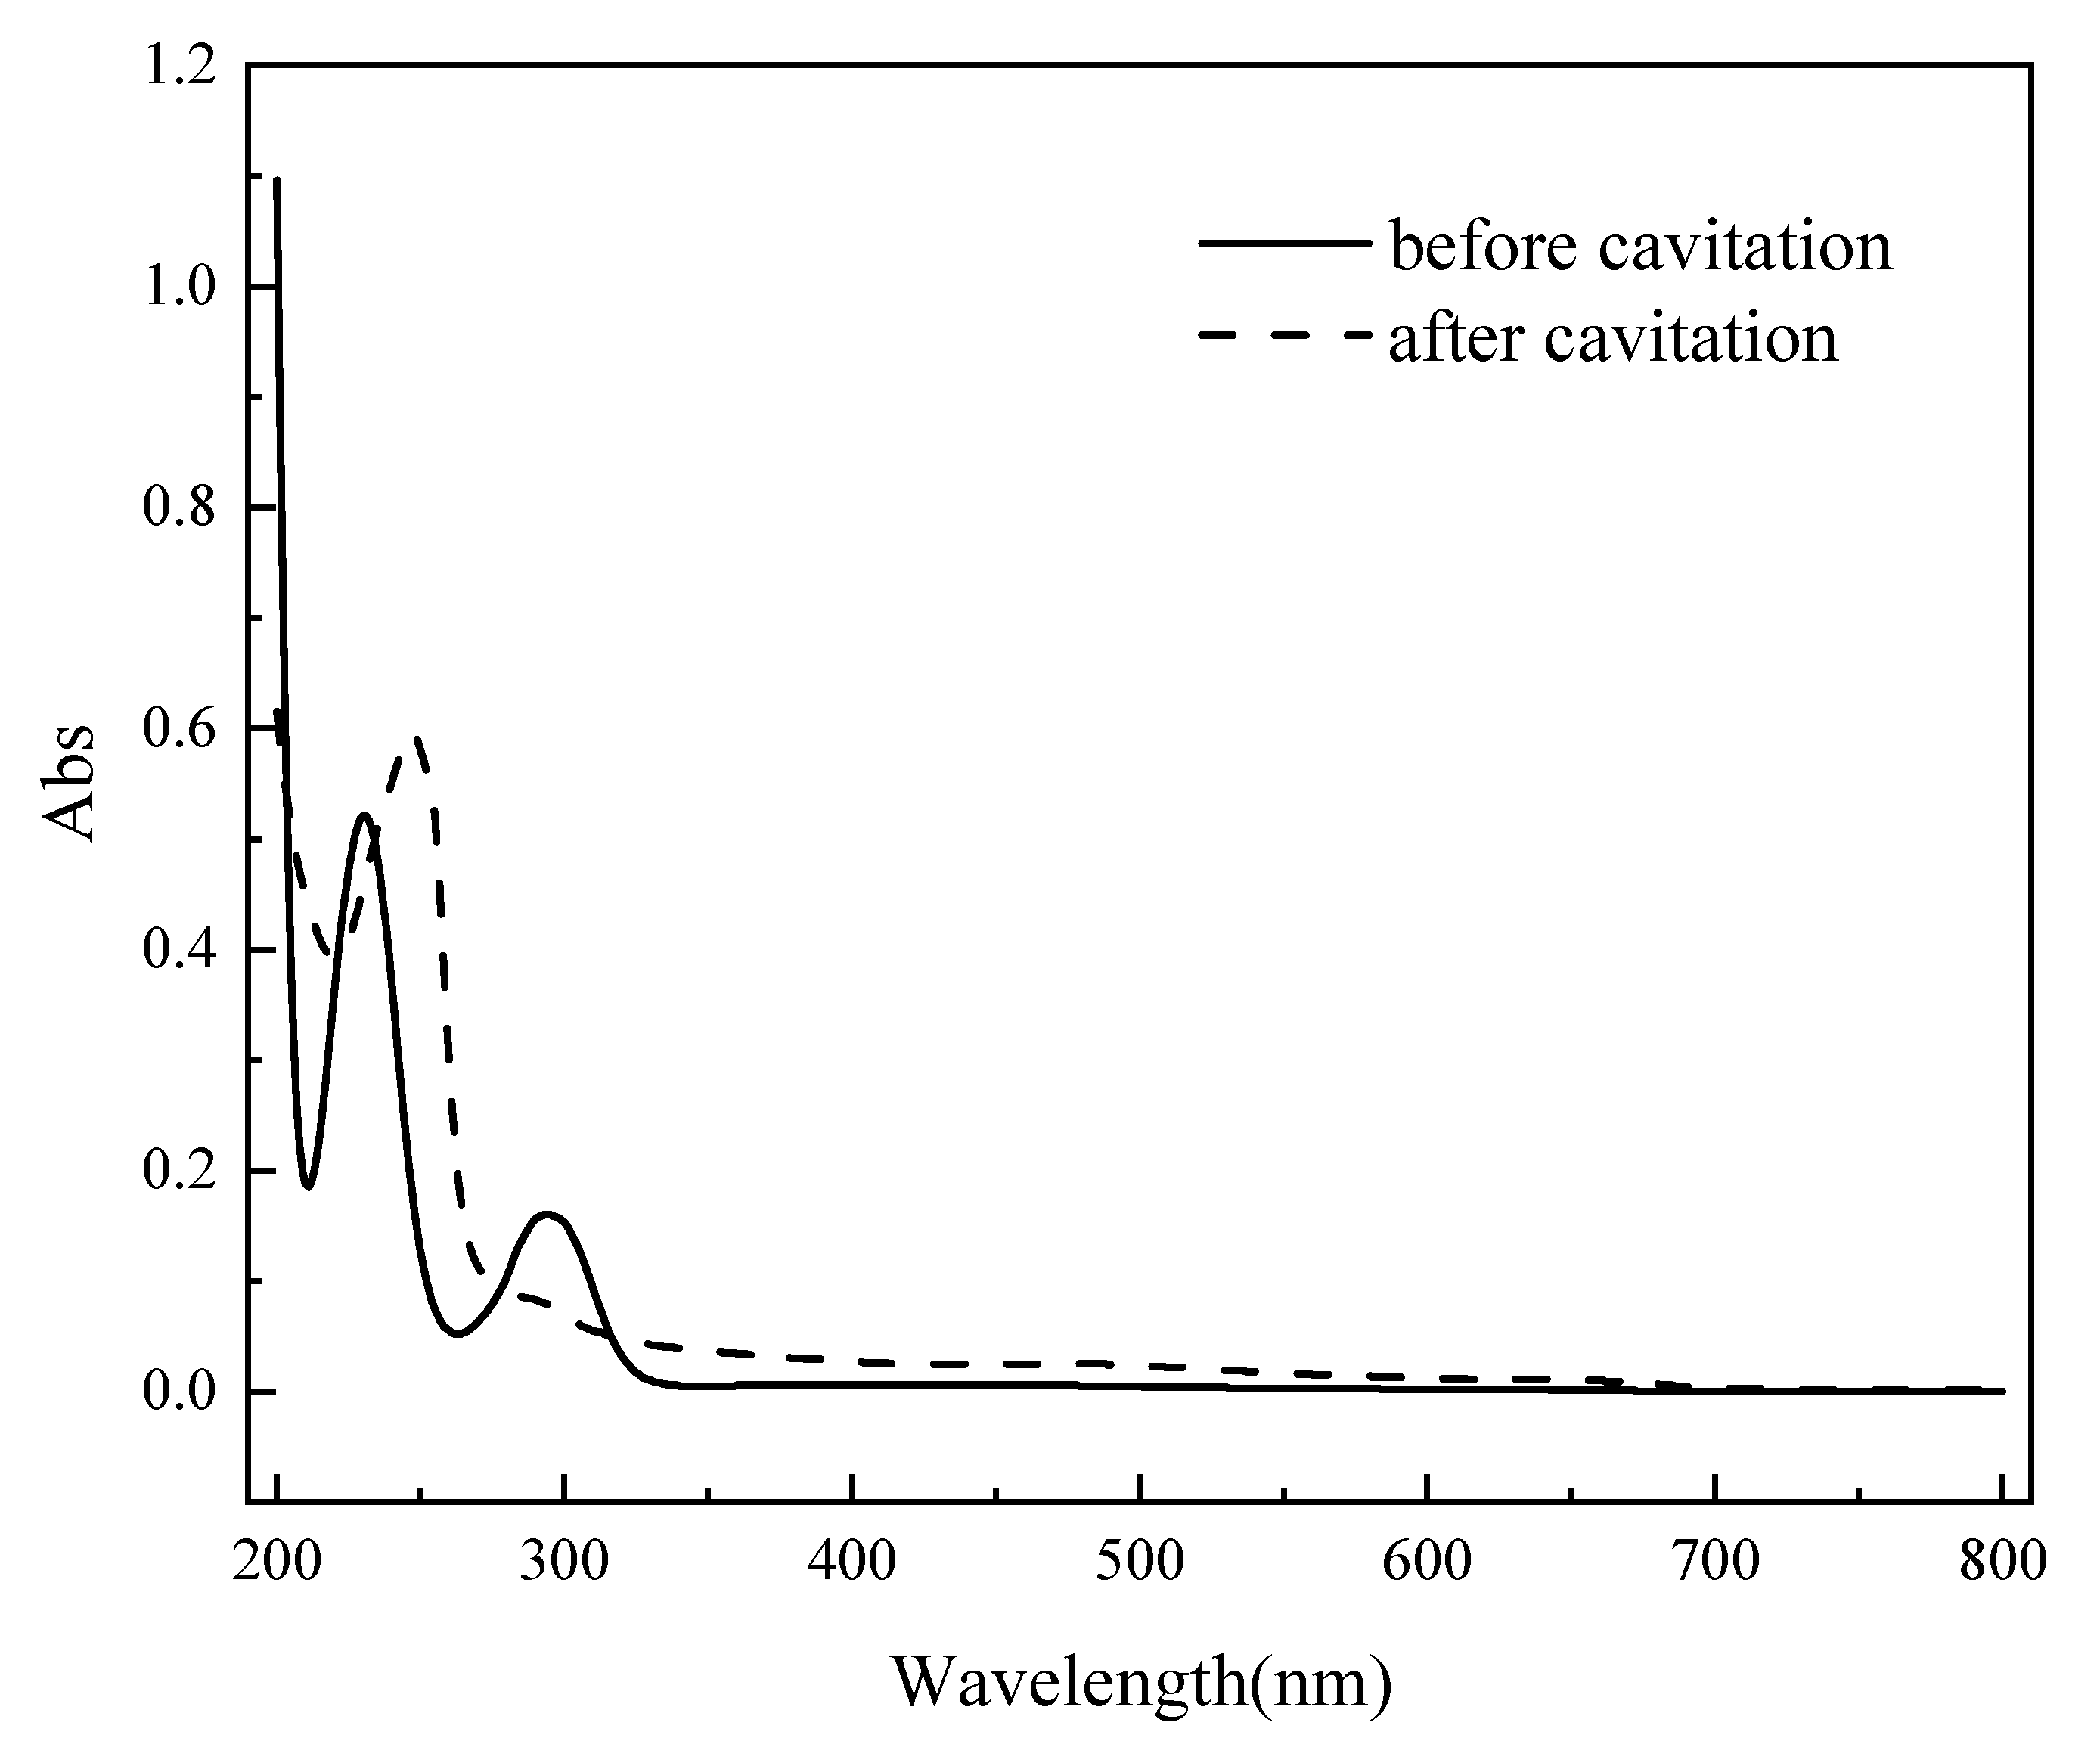
As shown in Figure 15, original 4-aminophenol exhibits two distinct absorption peaks within the scanning range of 200–800 nm, located at 231 nm and 295 nm, respectively. The molecule contains unsaturated bonds and lone electron pairs, enabling π→π* and n→π* transitions . Furthermore, the presence of a conjugated system along with both -NH₂ and -OH substituents contributes to a bathochromic shift of its absorption peaks. After 120 min of cavitation degradation, the absorption peaks at 295 nm and 355 nm nearly disappear, while a new characteristic peak emerges at 246 nm. This indicates a gradual reduction in 4-aminophenol content during the degradation process , accompanied by the formation of new substances.[28] The absorption at 246 nm is characteristic of benzoquinone, suggesting that benzoquinone and other intermediate products are progressively generated as degradation proceeds.
Therefore, Degradation and denitrification chemical reaction can be deduced according to results above. The following reactions equation represents the possible reaction process. The production of H+ deduced by the pH of solution decreases slightly during cavitation. The R in equation 3 represents the benzoquinone or other intermediate products. The equations show that during the cavitation treatment, intermediate products such as benzoquinone are generated, some products are decomposed into carbon dioxide and water ultimately. Under the strong oxidative action of hydroxyl radicals, the nitrogen element undergoes deamination to form ammonium ions, which are ultimately removed in the form of nitrogen gas.
5. Conclusion
The composite hydrodynamic cavitator has excellent cavitation effect performance. Cavitation effect occurs at two distinct locations: the throat of the spiral pipe and the stepped drain of the cavitation cavity, with maximum gas holdup rate reaching 63% and 95% respectively, and both high mass transfer rate.
The composite hydrodynamic cavitator exhibits effective degradation performance for 4-aminophenol and demonstrates a notable removal on total nitrogen and ammonia nitrogen. The experiment was conducted over a duration of 120 min. At an inlet pressure of 0.25 MPa, with an initial concentration of 10 mg/L, pH maintained at 7, and an initial temperature of 25 °C, the degradation efficiency of 4-aminophenol reached 74.7%. Concurrently, the total nitrogen concentration decreased from 1.28 mg/L to 1.06 mg/L. Nevertheless, the ammonia nitrogen concentration initially increased before subsequently decreasing, with its maximum concentration reducing from 0.82 mg/L to 0.77 mg/L. During the cavitation treatment, intermediate products such as benzoquinone are generated, and some products are decomposed into carbon dioxide and water ultimately. Under the strong oxidative action of hydroxyl radicals, the nitrogen element undergoes deamination to form ammonium ions, which are ultimately removed in the form of nitrogen gas.
Acknowledgments
The authors are thankful to Department of Science and Technology of Guangdong Province for providing financial support in the form of Project of Agricultural Science and Technology Specialist (KTP20240964).
References
- Karimi-Maleh H, Darabi R, Karimi F, Karaman C, Shahidi S A, Zare N , Baghayeri M , Fu L, Rostamnia S, Rouhi J , Rajendran S. State-of-art advances on removal, degradation and electrochemical monitoring of 4-aminophenol pollutants in real samples: A review. Environ. Res., 2023, 222, 115338.
- Tranchant M, Serrà Albert, Gunderson C , Bertero E , García-Amorós J , Gómez E, Michler J, Philippe L. Efficient and green electrochemical synthesis of 4-aminophenol using porous Au micropillars. Applied Catalysis A: General. 2020, 602, 117698.
- Nezamzadeh-Ejhieh A., Amiri M., CuO supported Clinoptilolite towards solar photocatalytic degradation of p-aminophenol. Powder. Technol. 2013, 235, 279-288.
- Ratiu, C., Manea, F., Lazau, C., Orha, C., Burtica, G., Grozescu, I., et al. Photocatalytically-assisted electrochemical degradation of p-aminophenol in aqueous solutions using zeolite-supported TiO2 catalyst. Chem. Pap.2011. 65 (3), 289–298.
- Wang Y, Yu N, Xing M, Xu Z, Shen K, Wu J, Feng Y. Photoelectrocatalysis degradation of P-aminophenol using PbO2-TiO2 heterojunction electrode: Catalytic, theoretical calculating and mechanism. J Environ. Chem. Eng.. 2024, 12, 113304.
- Moreno-Castilla C., López-Ramón M. V., et al. Removal of phenolic compounds from water using copper ferrite nanosphere composites as fenton catalysts. Nanomaterials-Basel. 2019, 9, 901.
- Mishra P, Singh K, Dixit U, Agarwal A, Bhat R A. Effective removal of 4-Aminophenol from aqueous environment by pea (Pisum sativum) shells activated with sulfuric acid: Characterization, isotherm, kinetics and thermodynamics. J Ind. Chem. Soc. 2022, 99, 100528.
- Afzal Khan S., Hamayun M., et al. Degradation of 4-aminophenol by newly isolated Pseudomonas sp. strain ST-4 . Enzyme. Microb. Tech. 2006, 38, 10-13.
- Sun X, Liu J, Jia L, Wan g G, Zhao S, Yoon J Y, Chen S. A review on hydrodynamic cavitation disinfection: The current state of knowledge. Sci.Total Environ. 2020, 737, 139606.
- Hou R, Song Y, Liu J, Zhang L, Zhang M, Sun X. Experimental and numerical investigation on the disinfection characteristics of a novel rotor-radial groove hydrodynamic cavitation reactor. Process Saf. Environ. 2023, 169, 260–269.
- Gore M M., Saharan V K, Pinjari D V, Chavan P V, Pandit A B. Degradation of reactive orange 4 dye using hydrodynamic cavitation based hybrid techniques. Ultraso. Sonochem. 2014, 21, 1075–1082.
- Innocenzi V., Prisciandaro M., Centofanti M., VegliòF. Comparison of performances of hydrodynamic cavitation in combined treatments based on hybrid induced advanced Fenton process for degradation of azo-dyes. J. Environ. Chem. Eng. 2019, 7, 103171.
- Kore V S., Manjare S D, Patil A D., Dhanke P B. A parametric study on intensified degradation of textile dye water using hydrodynamic cavitation based hybrid technique. Chem. Engin. Process.—Process Intensification, 2023, 193, 109550.
- Thanekar P, Panda M, Gogate P R. Degradation of carbamazepine using hydrodynamic cavitation combined with advanced oxidation processes. Ultraso. Sonochem. 2018, 40, 567–576.
- Wang B, Zhang R, Li Y, Lian X. CFD simulation of a swirling vortex cavitator and its degradation performance and pathway of tetracycline in aqueous solution. Int. J. Chem. React. Eng. 2022, 20(9), 955–963.
- Roy K, Moholkar V S. Sulfadiazine degradation using hybrid AOP of heterogeneous Fenton/persulfate system coupled with hydrodynamic cavitation. Chem. Engin. J. 2020, 386, 121294.
- Raut-Jadhav S, Saini D, Sonawane S, Pandit A. Effect of process intensifying parameters on the hydrodynamic cavitation based degradation of commercial pesticide (methomyl) in the aqueous solution. Ultraso. Sonochem. 2016, 28, 283–293.
- Patil P N, Bote S D, Gogate P .. Degradation of imidacloprid using combined advanced oxidation processes based on hydrodynamic cavitation. Ultraso. Sonochem.2014, 21, 1770–1777.
- Abdelrahman A M, Tebyani S, Talabazar F R, Tabar S A, Berenji N R, Aghdam A S, Koyuncu I, Kosar A, Guven H, Ersahin M E, Ghorbani M, Ozgun H. The flow pattern effects of hydrodynamic cavitation on waste activated sludge digestibility. Chemosphere, 2024, 357, 141949.
- Patil P B, Bhandari V M, Ranade V V. Improving efficiency for removal of ammoniacal nitrogen from wastewaters using hydrodynamic cavitation. Ultraso. Sonochem. 2021, 70, 105306.
- Patil P B, Bhandari V M. Solvent-assisted cavitation for enhanced removal of organic pollutants—Degradation of 4-aminophenol. J. Environ. Manage., 2022, 311, 114857.
- Hong F, Tian H, Yuan X, Liu S, Peng Q, Shi Y, Jin L, Ye L, Jia J, Ying D, Ramsey T S, Huang Y. CFD-assisted modeling of the hydrodynamic cavitation reactors for wastewater treatment —A review. J. Environ. Manage., 2022, 321, 115982.
- Dastane G G., Thakkar H, Shah R, Perala S, Raut J, Pandit A.B. Single and multiphase CFD simulations for designing cavitating venturi. Chem. Eng. Res. Des. 2019, 149, 1-12.
- Iwamori S, Nishiyama N, Oya K. A colorimetric indicator for detection of hydroxyl radicals in atmosphere using a methylene blue dye based on nafion film. Polym. Degrad. Stabil. 2016, 123, 131-136.
- Zhang X, Yang H, Li Z. Relationship between strength of hydrodynamic cavitation and amount of induced hydroxyl radical. J. Chem. Indus. Engin. (China), 2007, 58(1), 27-32.
- Saharan V K, Badve M P, Pandit A B. Degradation of reactive red 120 dye using hydrodynamic cavitation. Chem. Engin. J., 2011, 178(1), 100-107.
- Marálek B, Zezulka T, Marálková E, et al. Synergistic effects of trace concentrations of hydrogen peroxide used in a novel hydrodynamic cavitation device allows for selective removal of cyanobacteria. Chem. Engin. J., 2019, 382, 122 383.
- Chen W, Gu Z, Wen P, et al. Degradation of refractory organic contaminants in membrane concentrates from landfill leachate by a combined coagulation-ozonation process. Chemosphere, 2019, 217, 411-422.
Figure 1.
Schematic diagram of the composite hydrodynamic cavitator Outer hull, 2. Spiral channel, 3. Diverter plate, 4. Seal ring, 5. Cavitation generation chamber, 6. Dividing plate, 7. O-ring seal, 8. Step-shaped drain outlet, 9. Outlet.
Figure 1.
Schematic diagram of the composite hydrodynamic cavitator Outer hull, 2. Spiral channel, 3. Diverter plate, 4. Seal ring, 5. Cavitation generation chamber, 6. Dividing plate, 7. O-ring seal, 8. Step-shaped drain outlet, 9. Outlet.
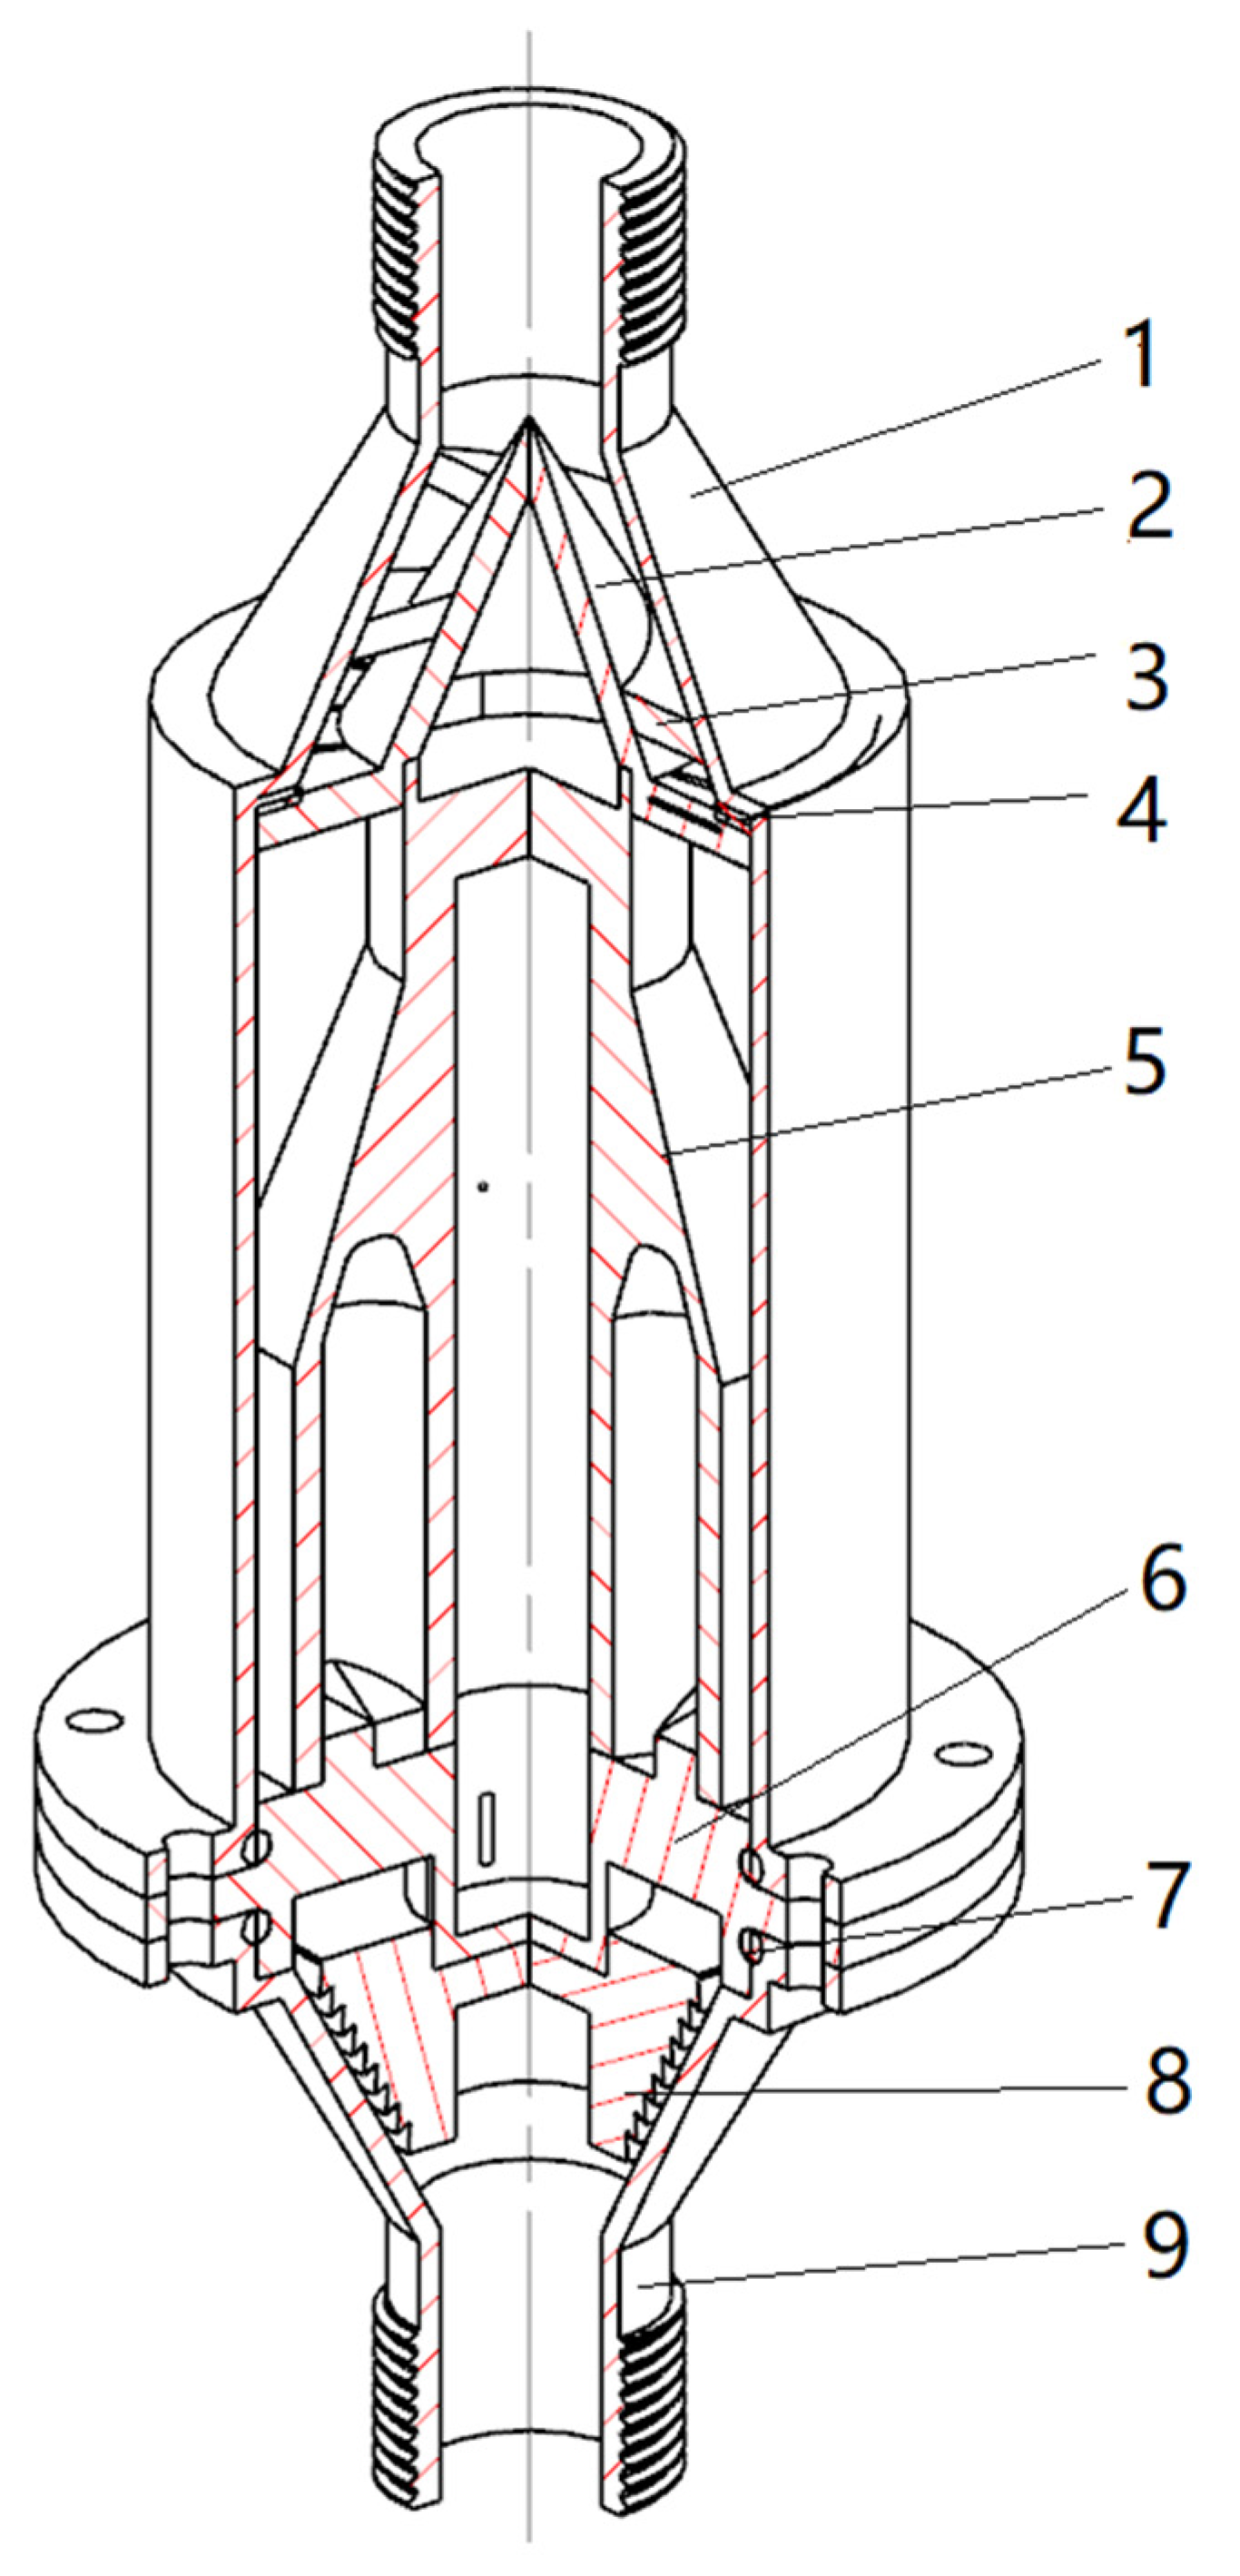
Figure 2.
Grid model diagram.
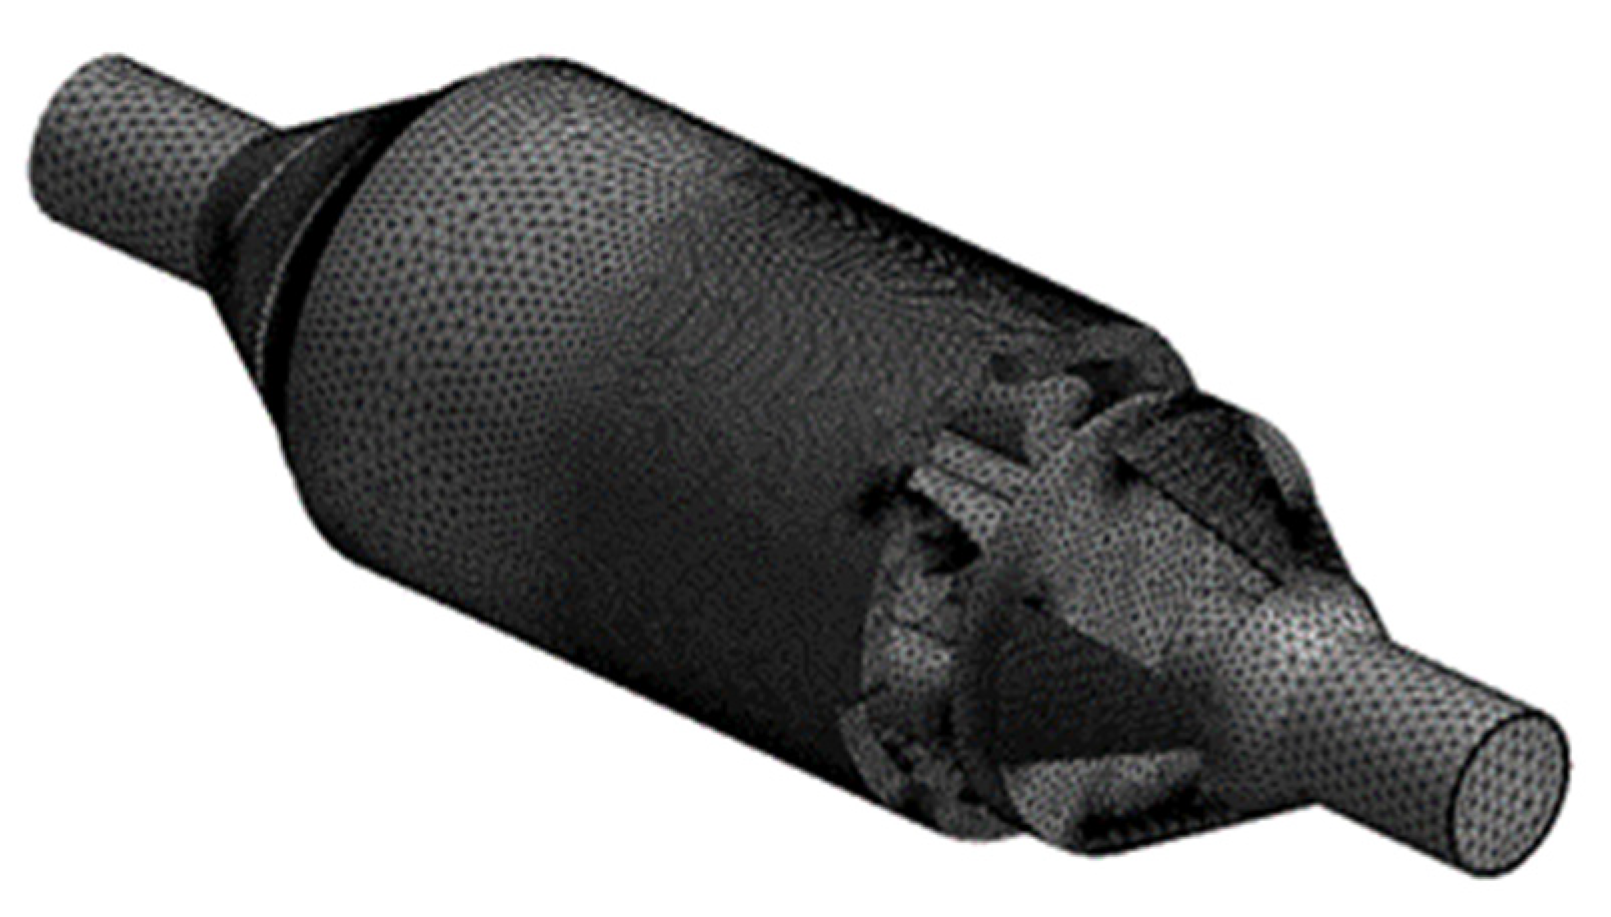
Figure 3.
Three-dimensional diagram of composite hydrodynamic cavitator test platform 1. Water tank 2. Frame 3. Manometer 4. Composite hydrodynamic cavitator 5. Flowmeter 6. Flow control valve 7. Overflow valve 8. Booster pump 9. Pressure tank.
Figure 3.
Three-dimensional diagram of composite hydrodynamic cavitator test platform 1. Water tank 2. Frame 3. Manometer 4. Composite hydrodynamic cavitator 5. Flowmeter 6. Flow control valve 7. Overflow valve 8. Booster pump 9. Pressure tank.
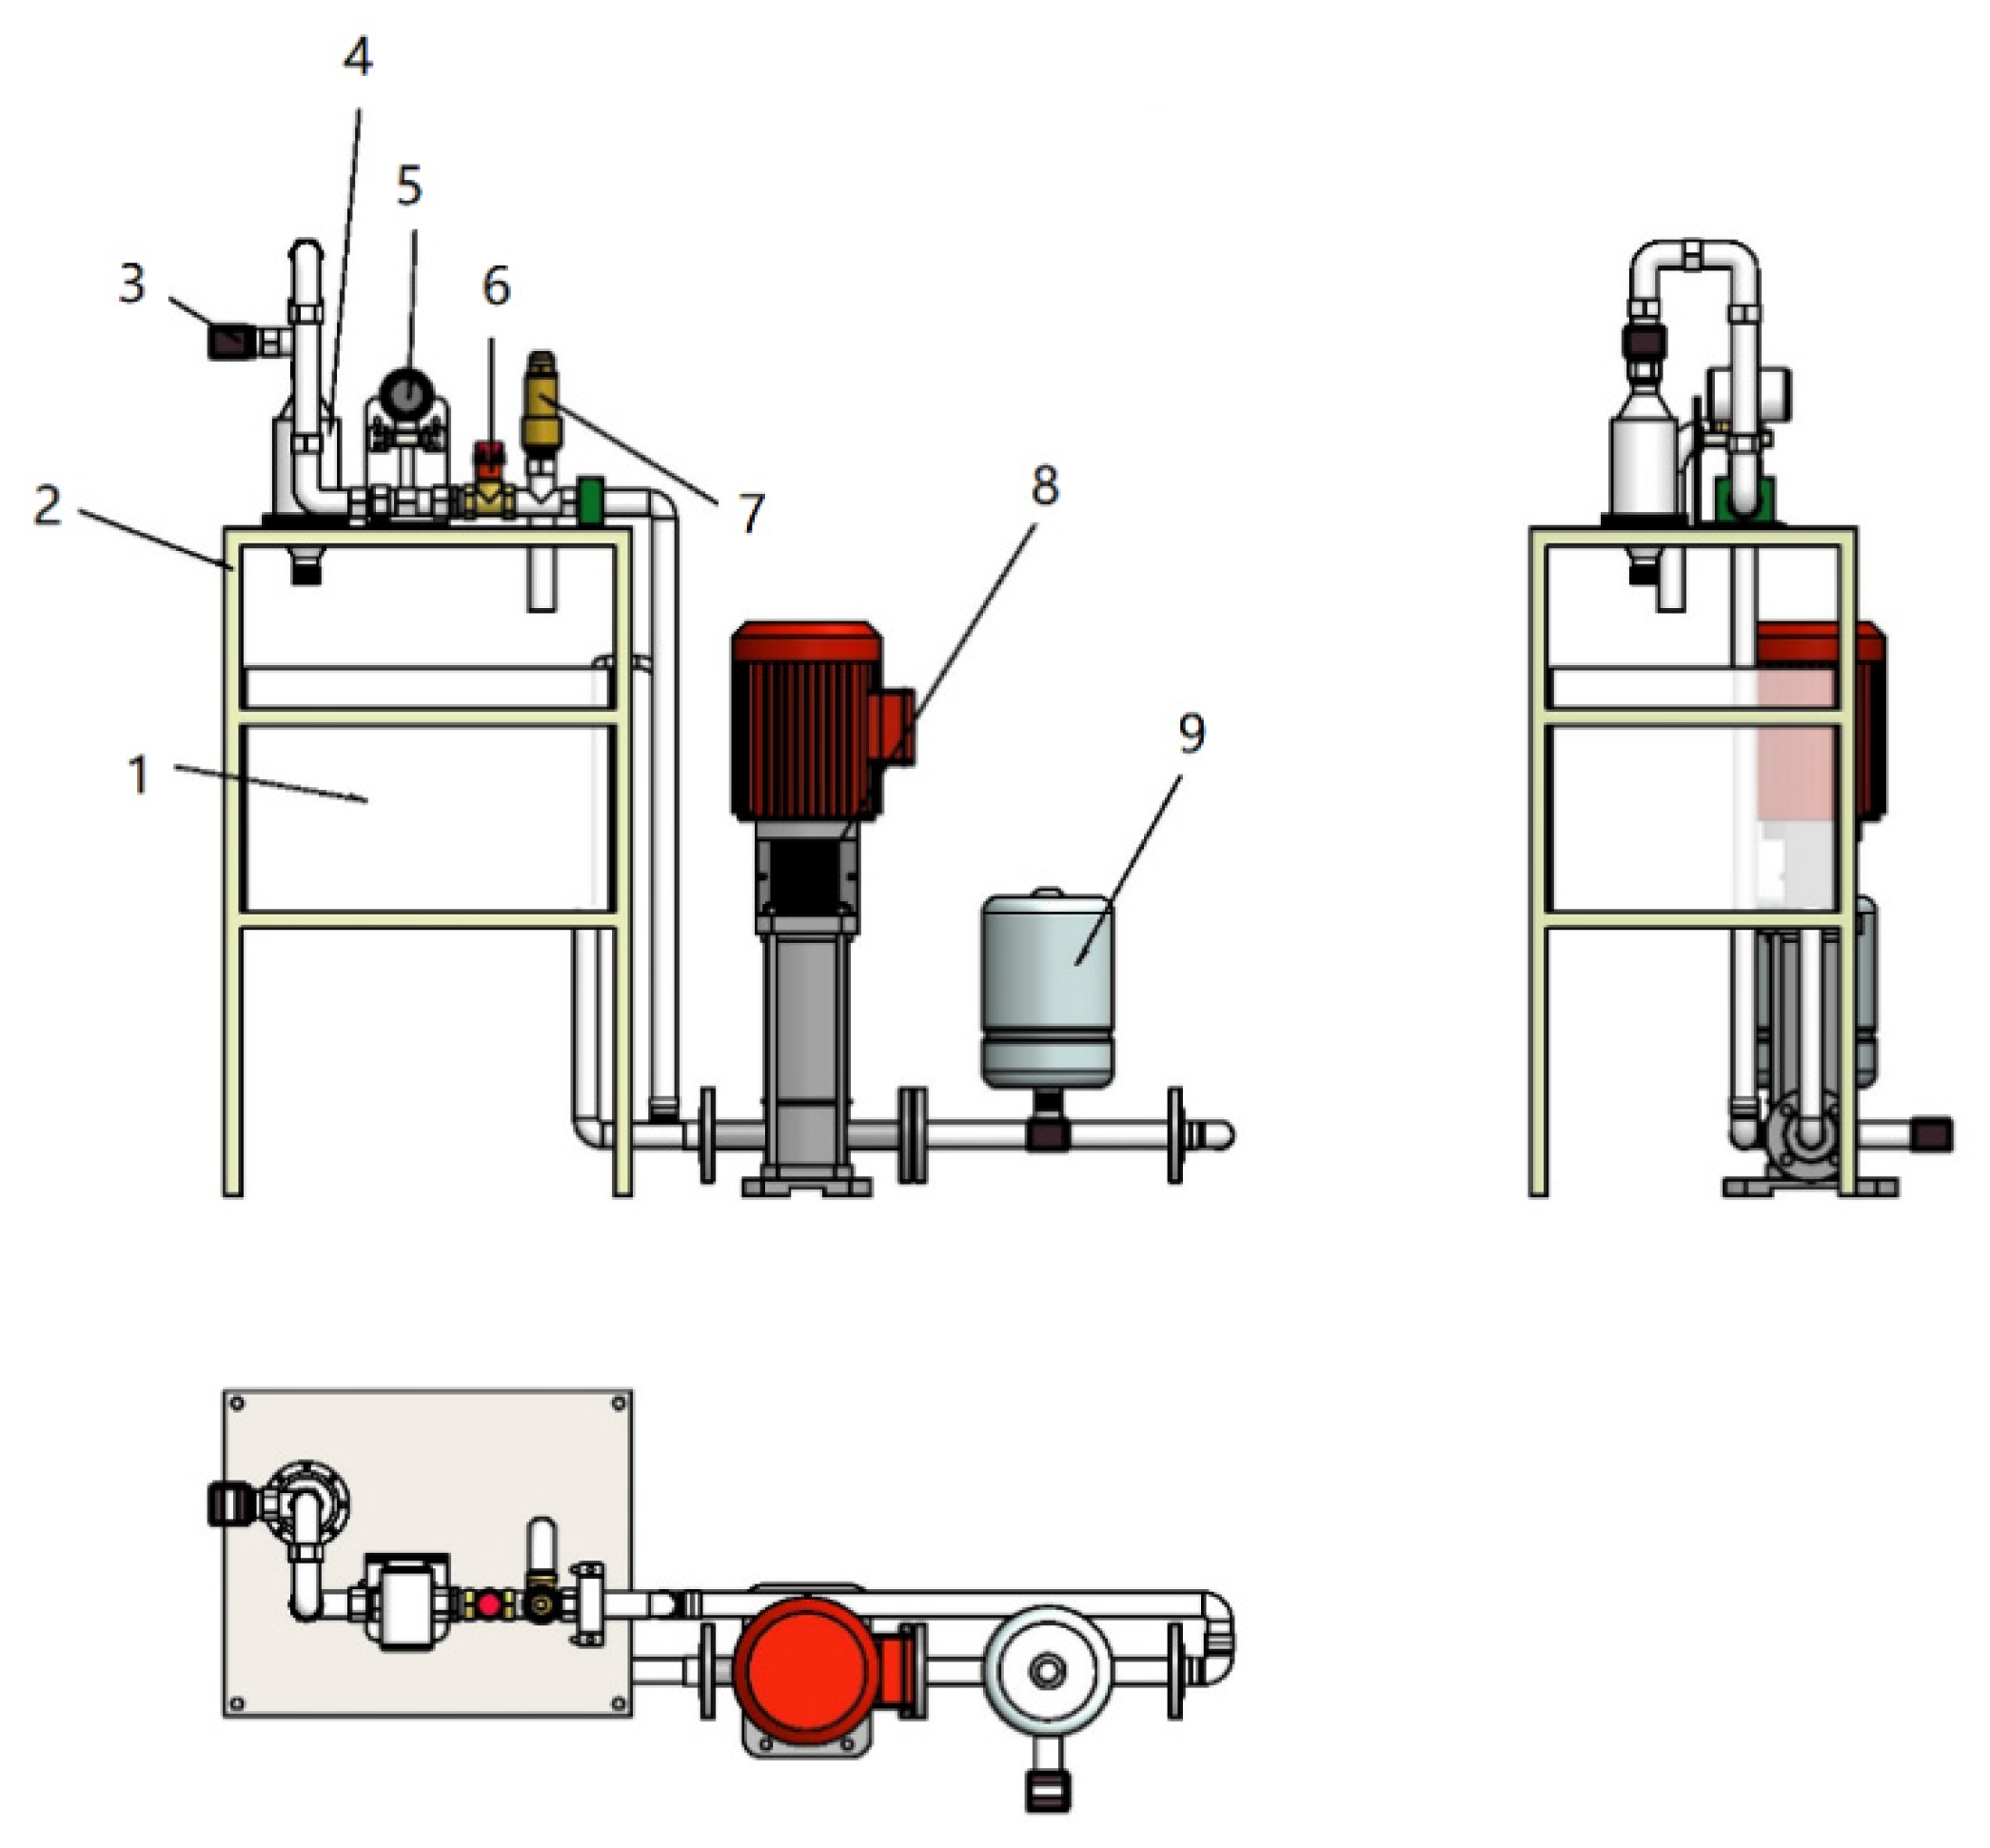
Figure 4.
XY cross-section of the composite hydrodynamic cavitator.
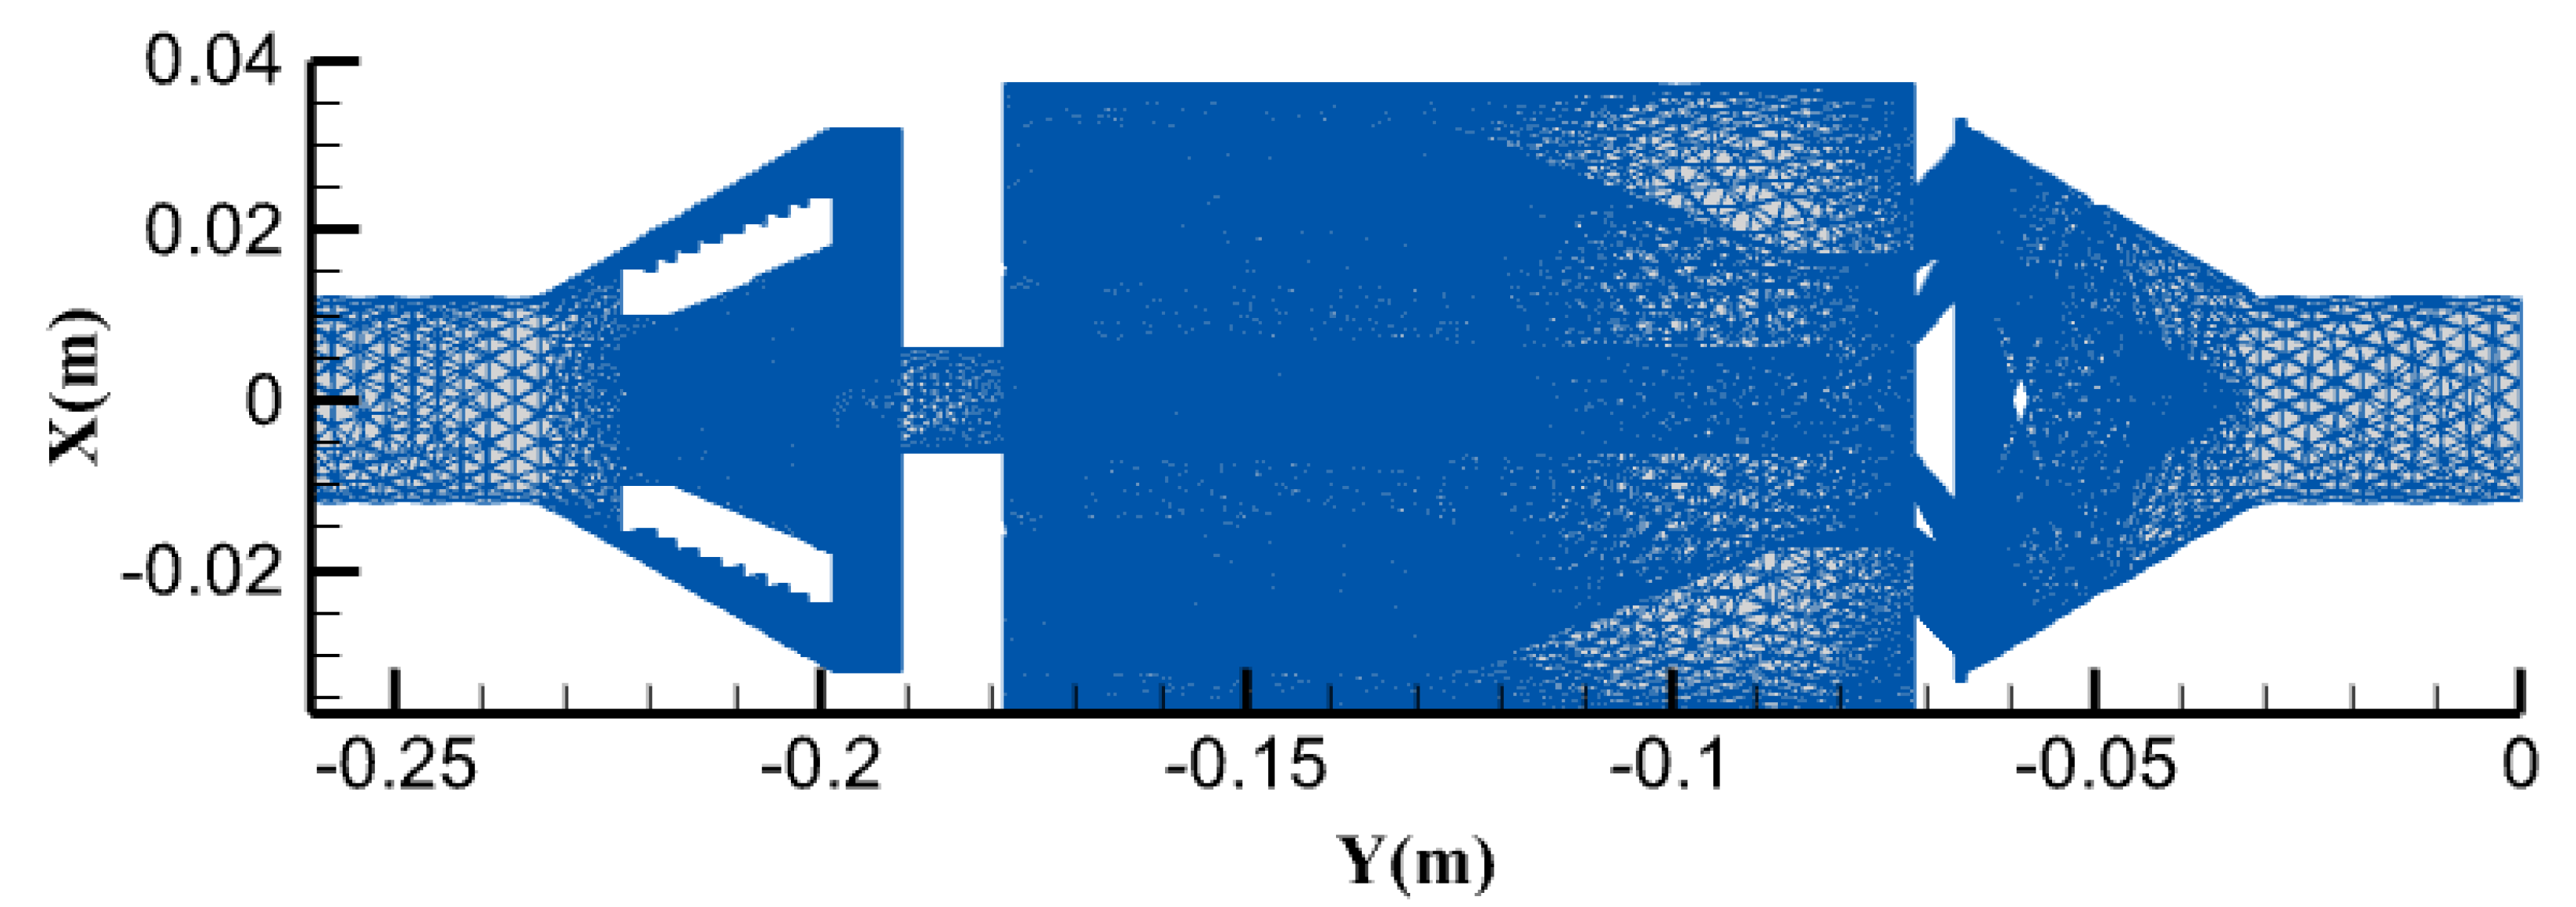
Figure 5.
Cross-sectional nephogram of absolute-pressure gradient distribution at where cavitation occurs. a. Absolute-pressure distribution of spiral pipe b. Absolute-pressure distribution of drain outlet.
Figure 5.
Cross-sectional nephogram of absolute-pressure gradient distribution at where cavitation occurs. a. Absolute-pressure distribution of spiral pipe b. Absolute-pressure distribution of drain outlet.
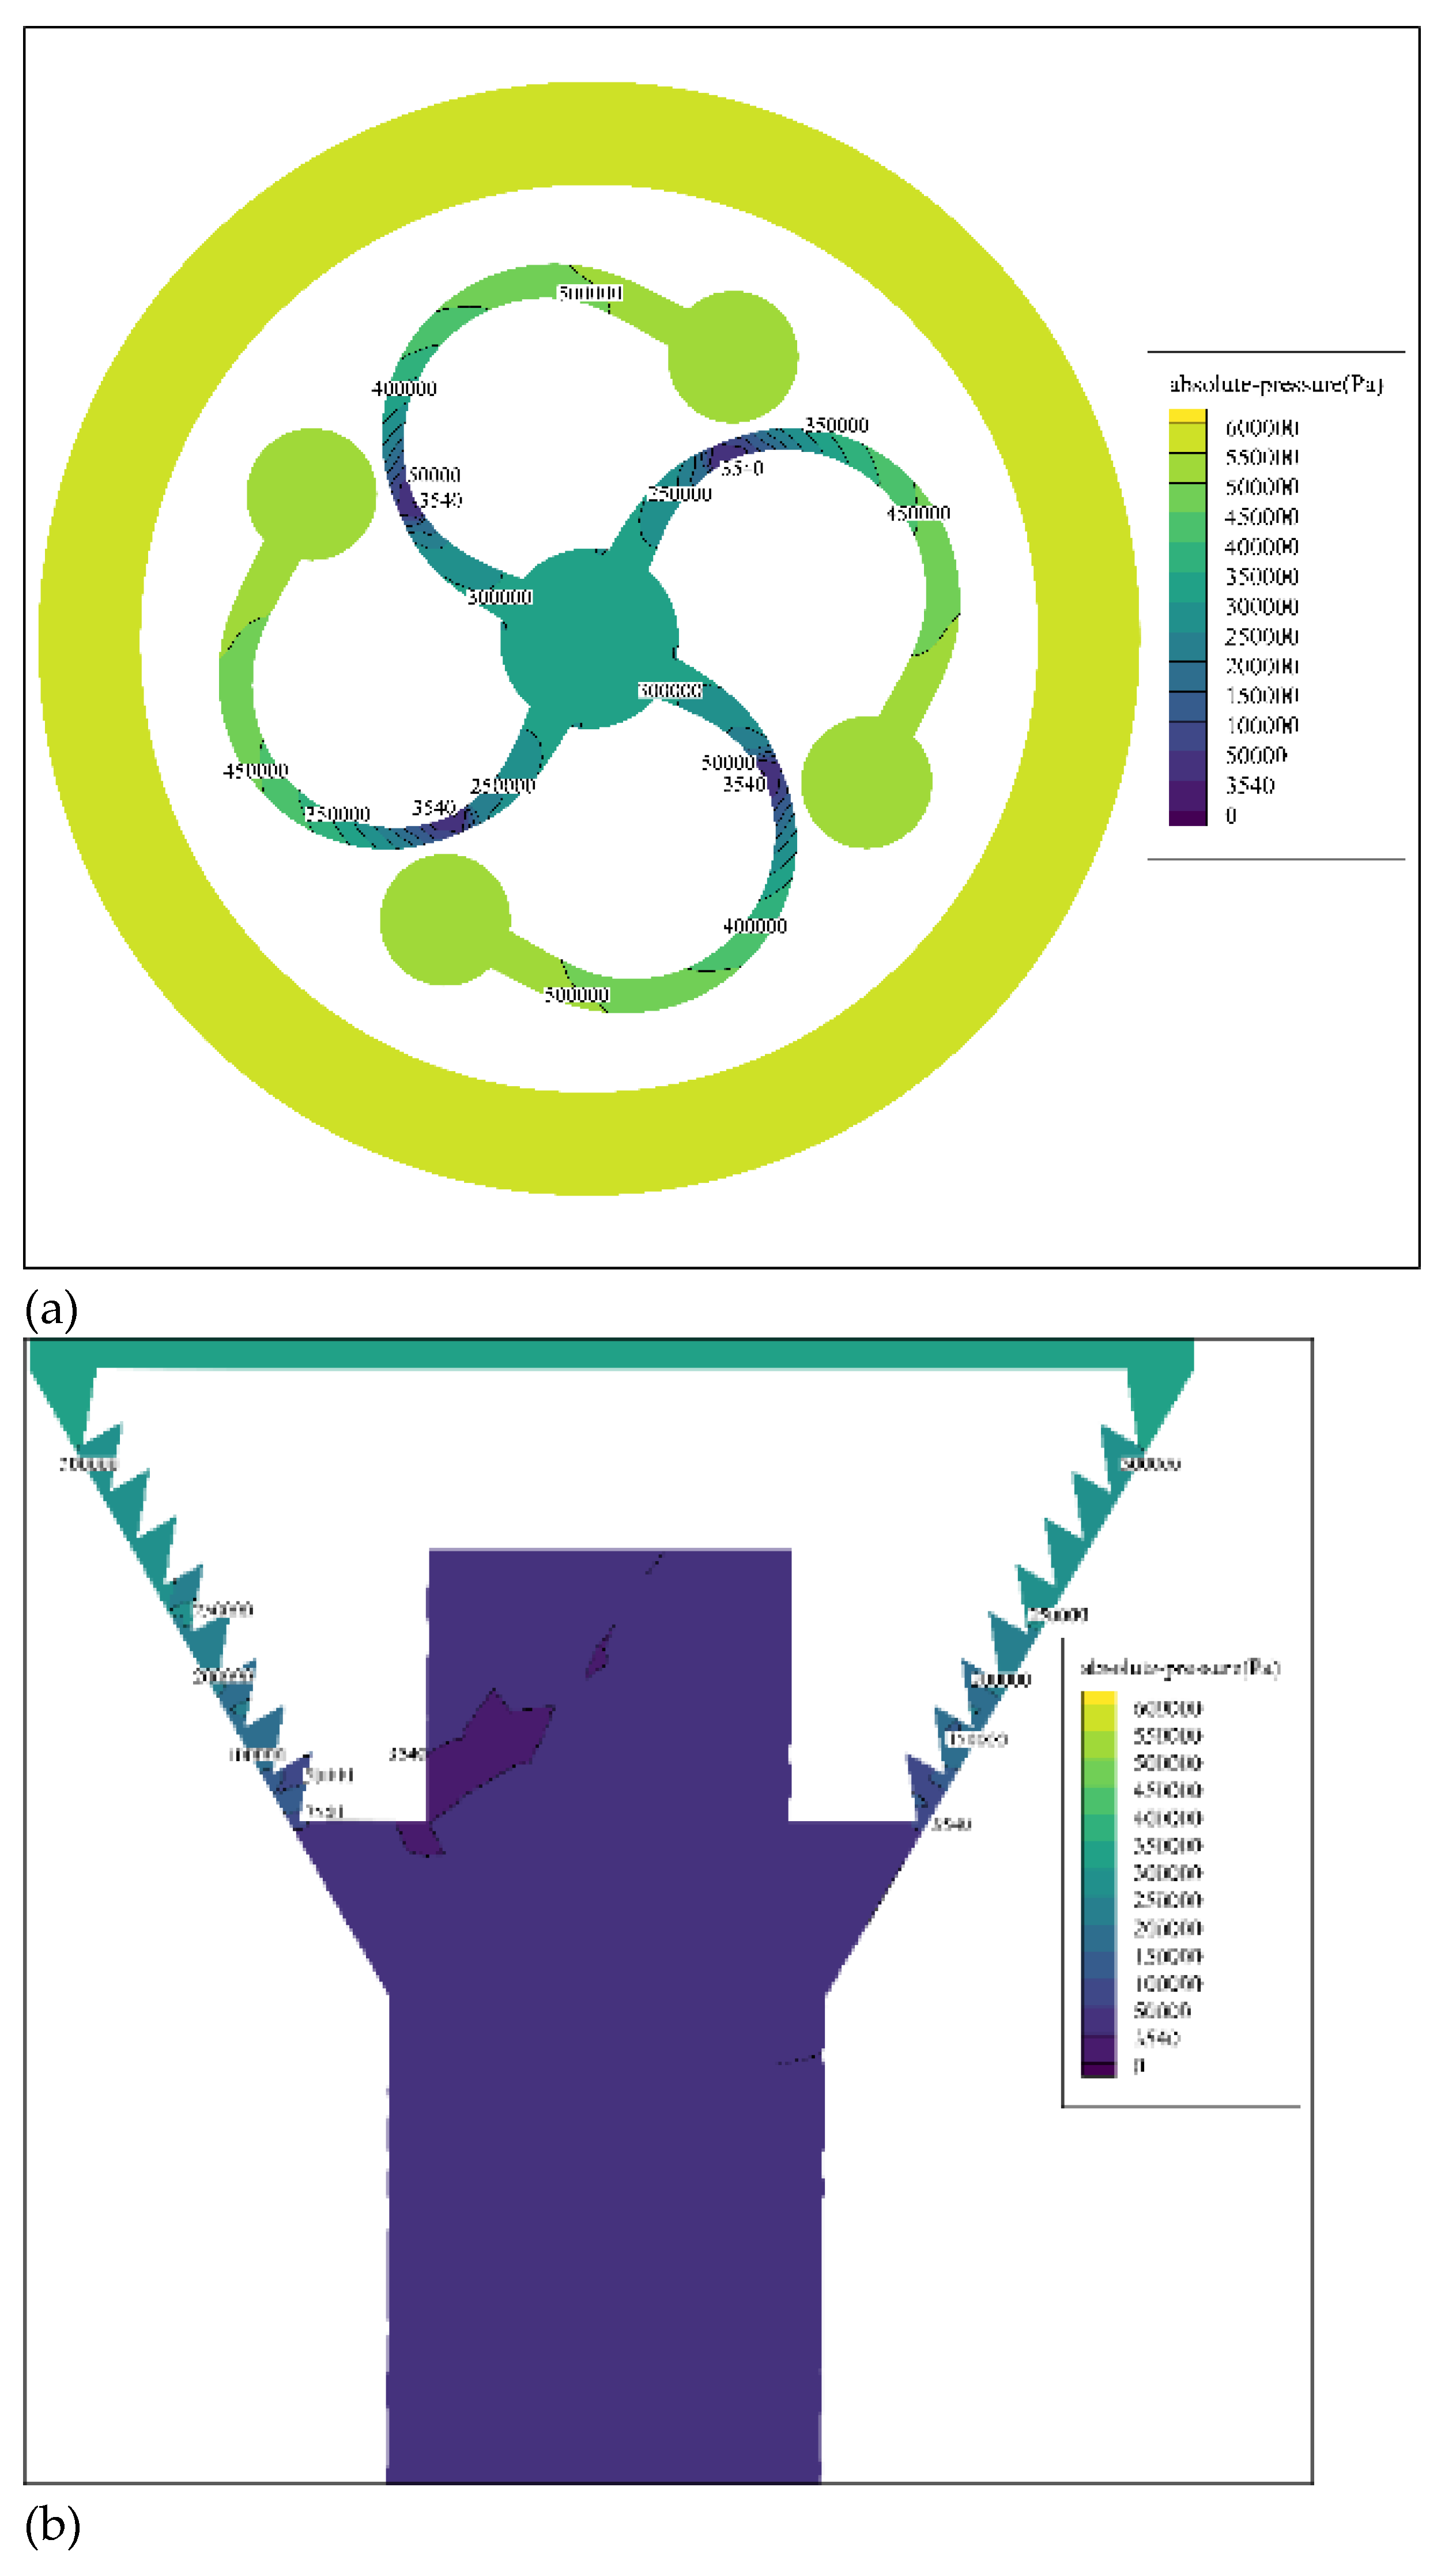
Figure 6.
Mass transfer efficiency diagram.
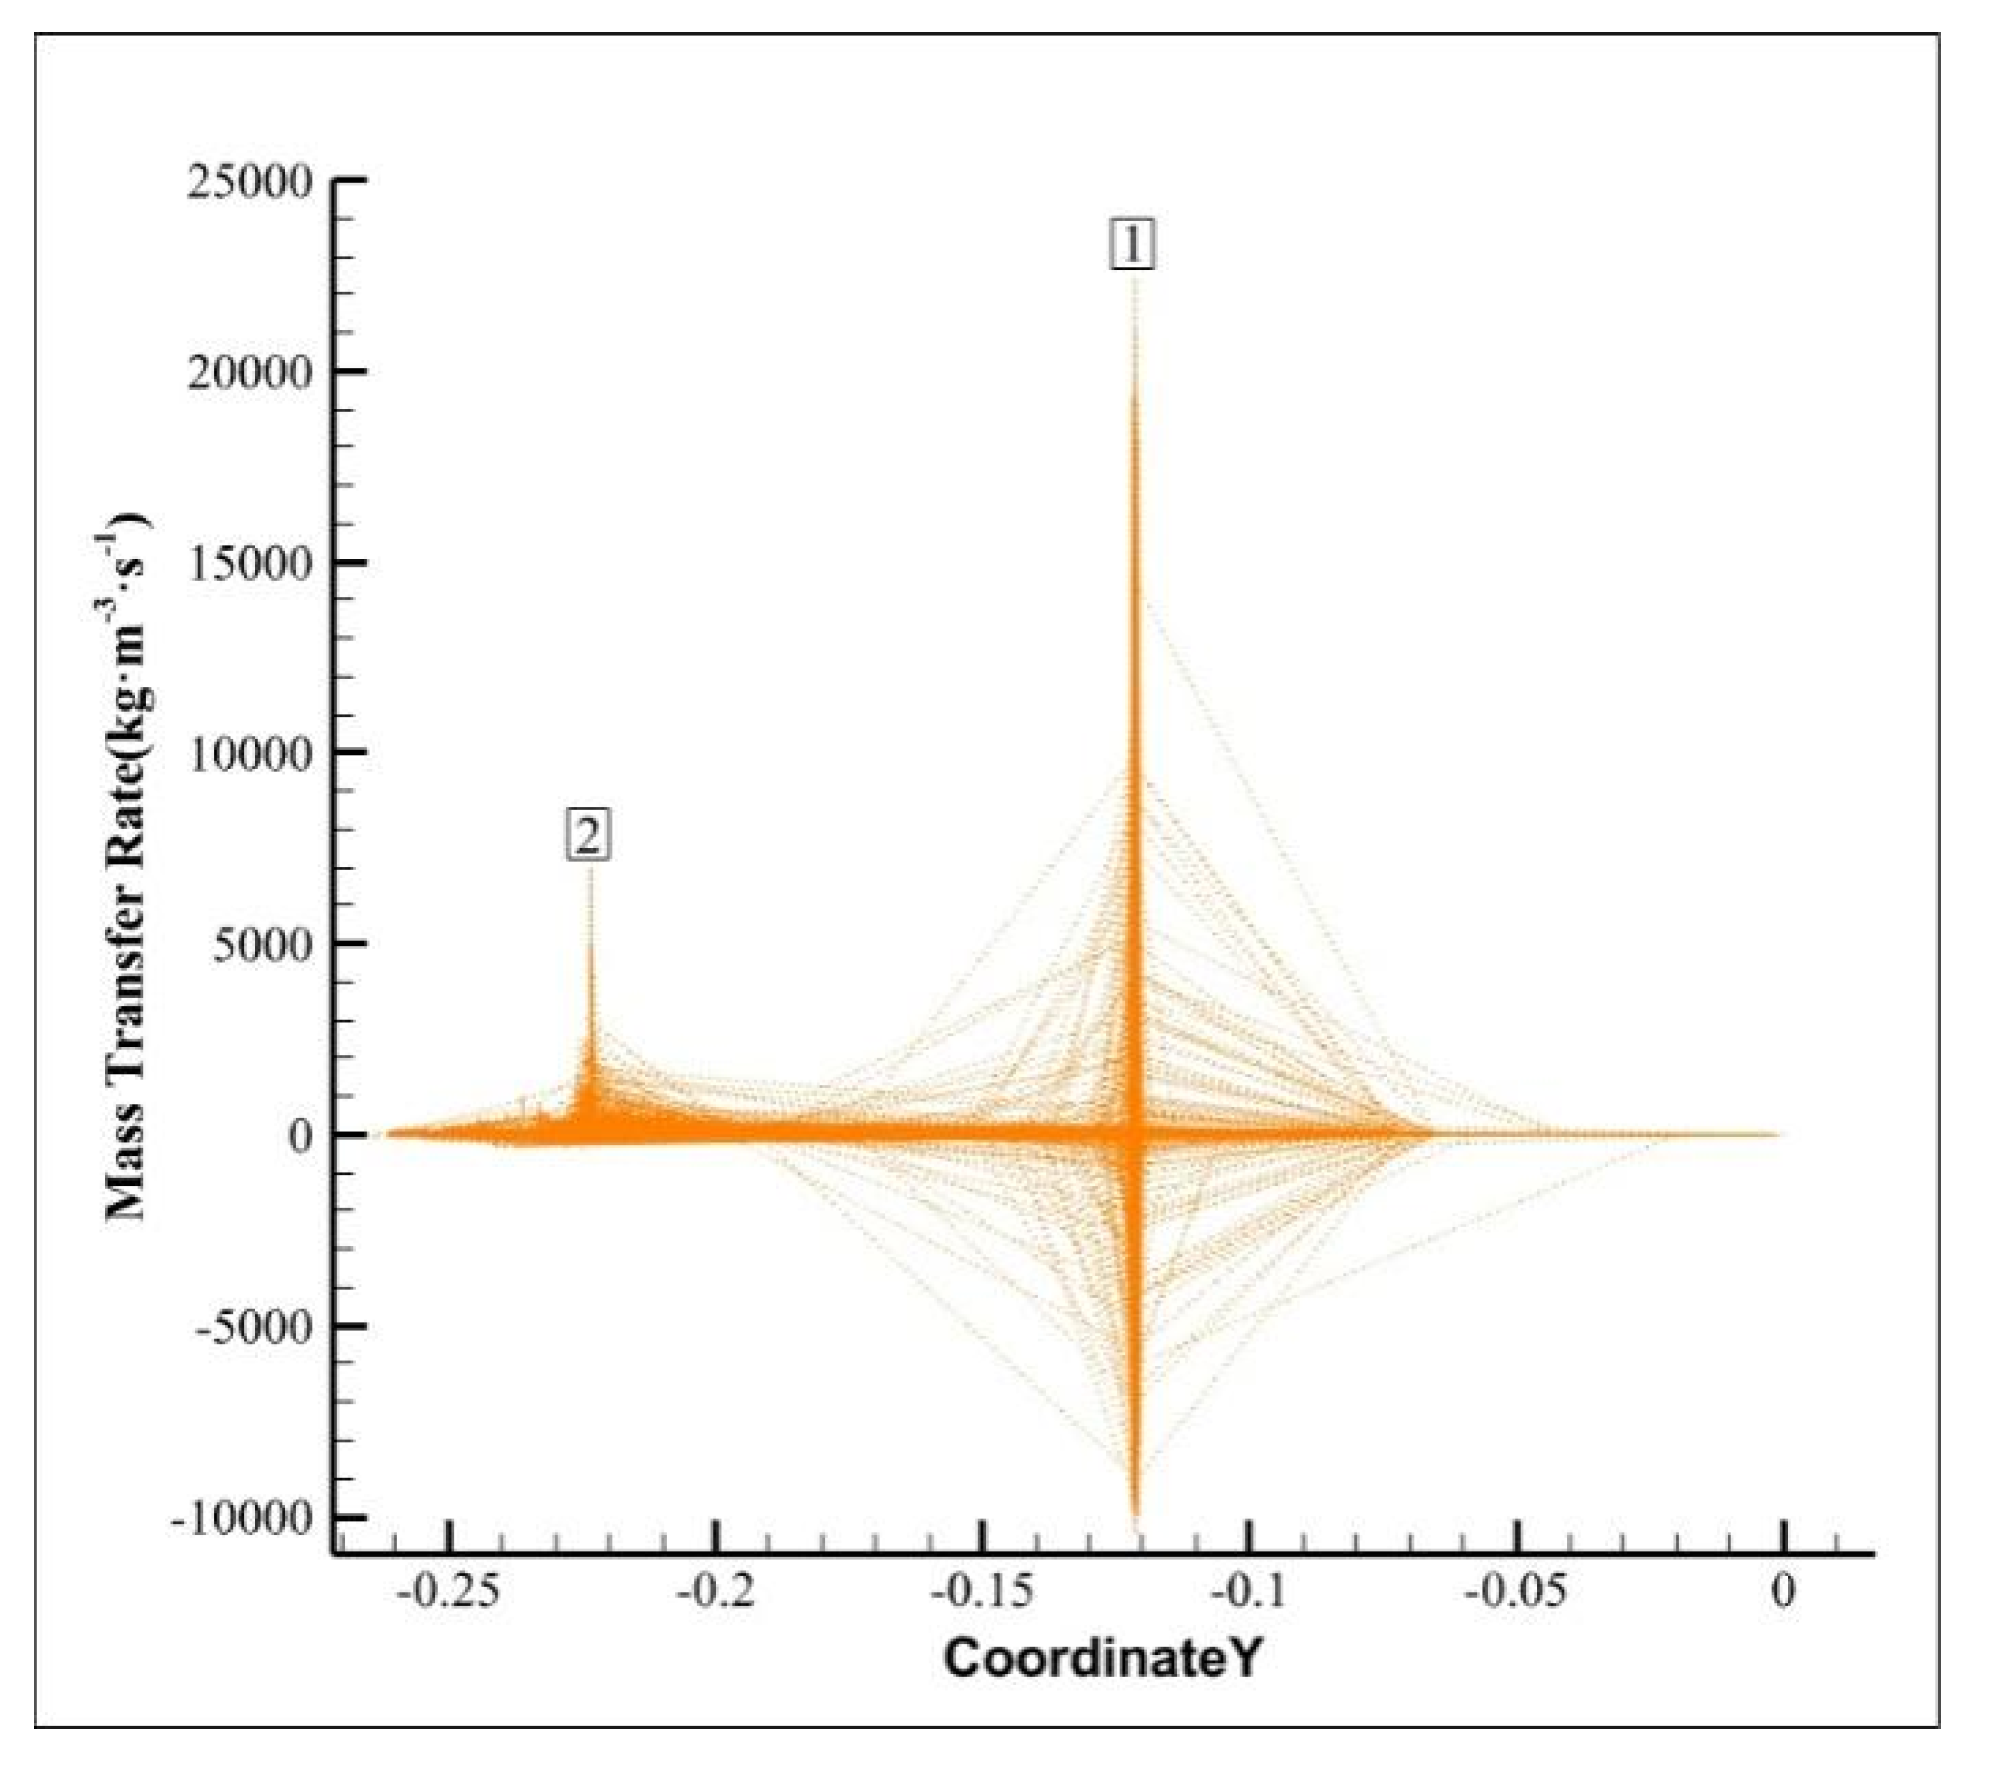
Figure 7.
Cloud diagram of gas holdup distribution at the place where cavitation occurs (a. at the spiral pipe; b. at the drain port).
Figure 7.
Cloud diagram of gas holdup distribution at the place where cavitation occurs (a. at the spiral pipe; b. at the drain port).
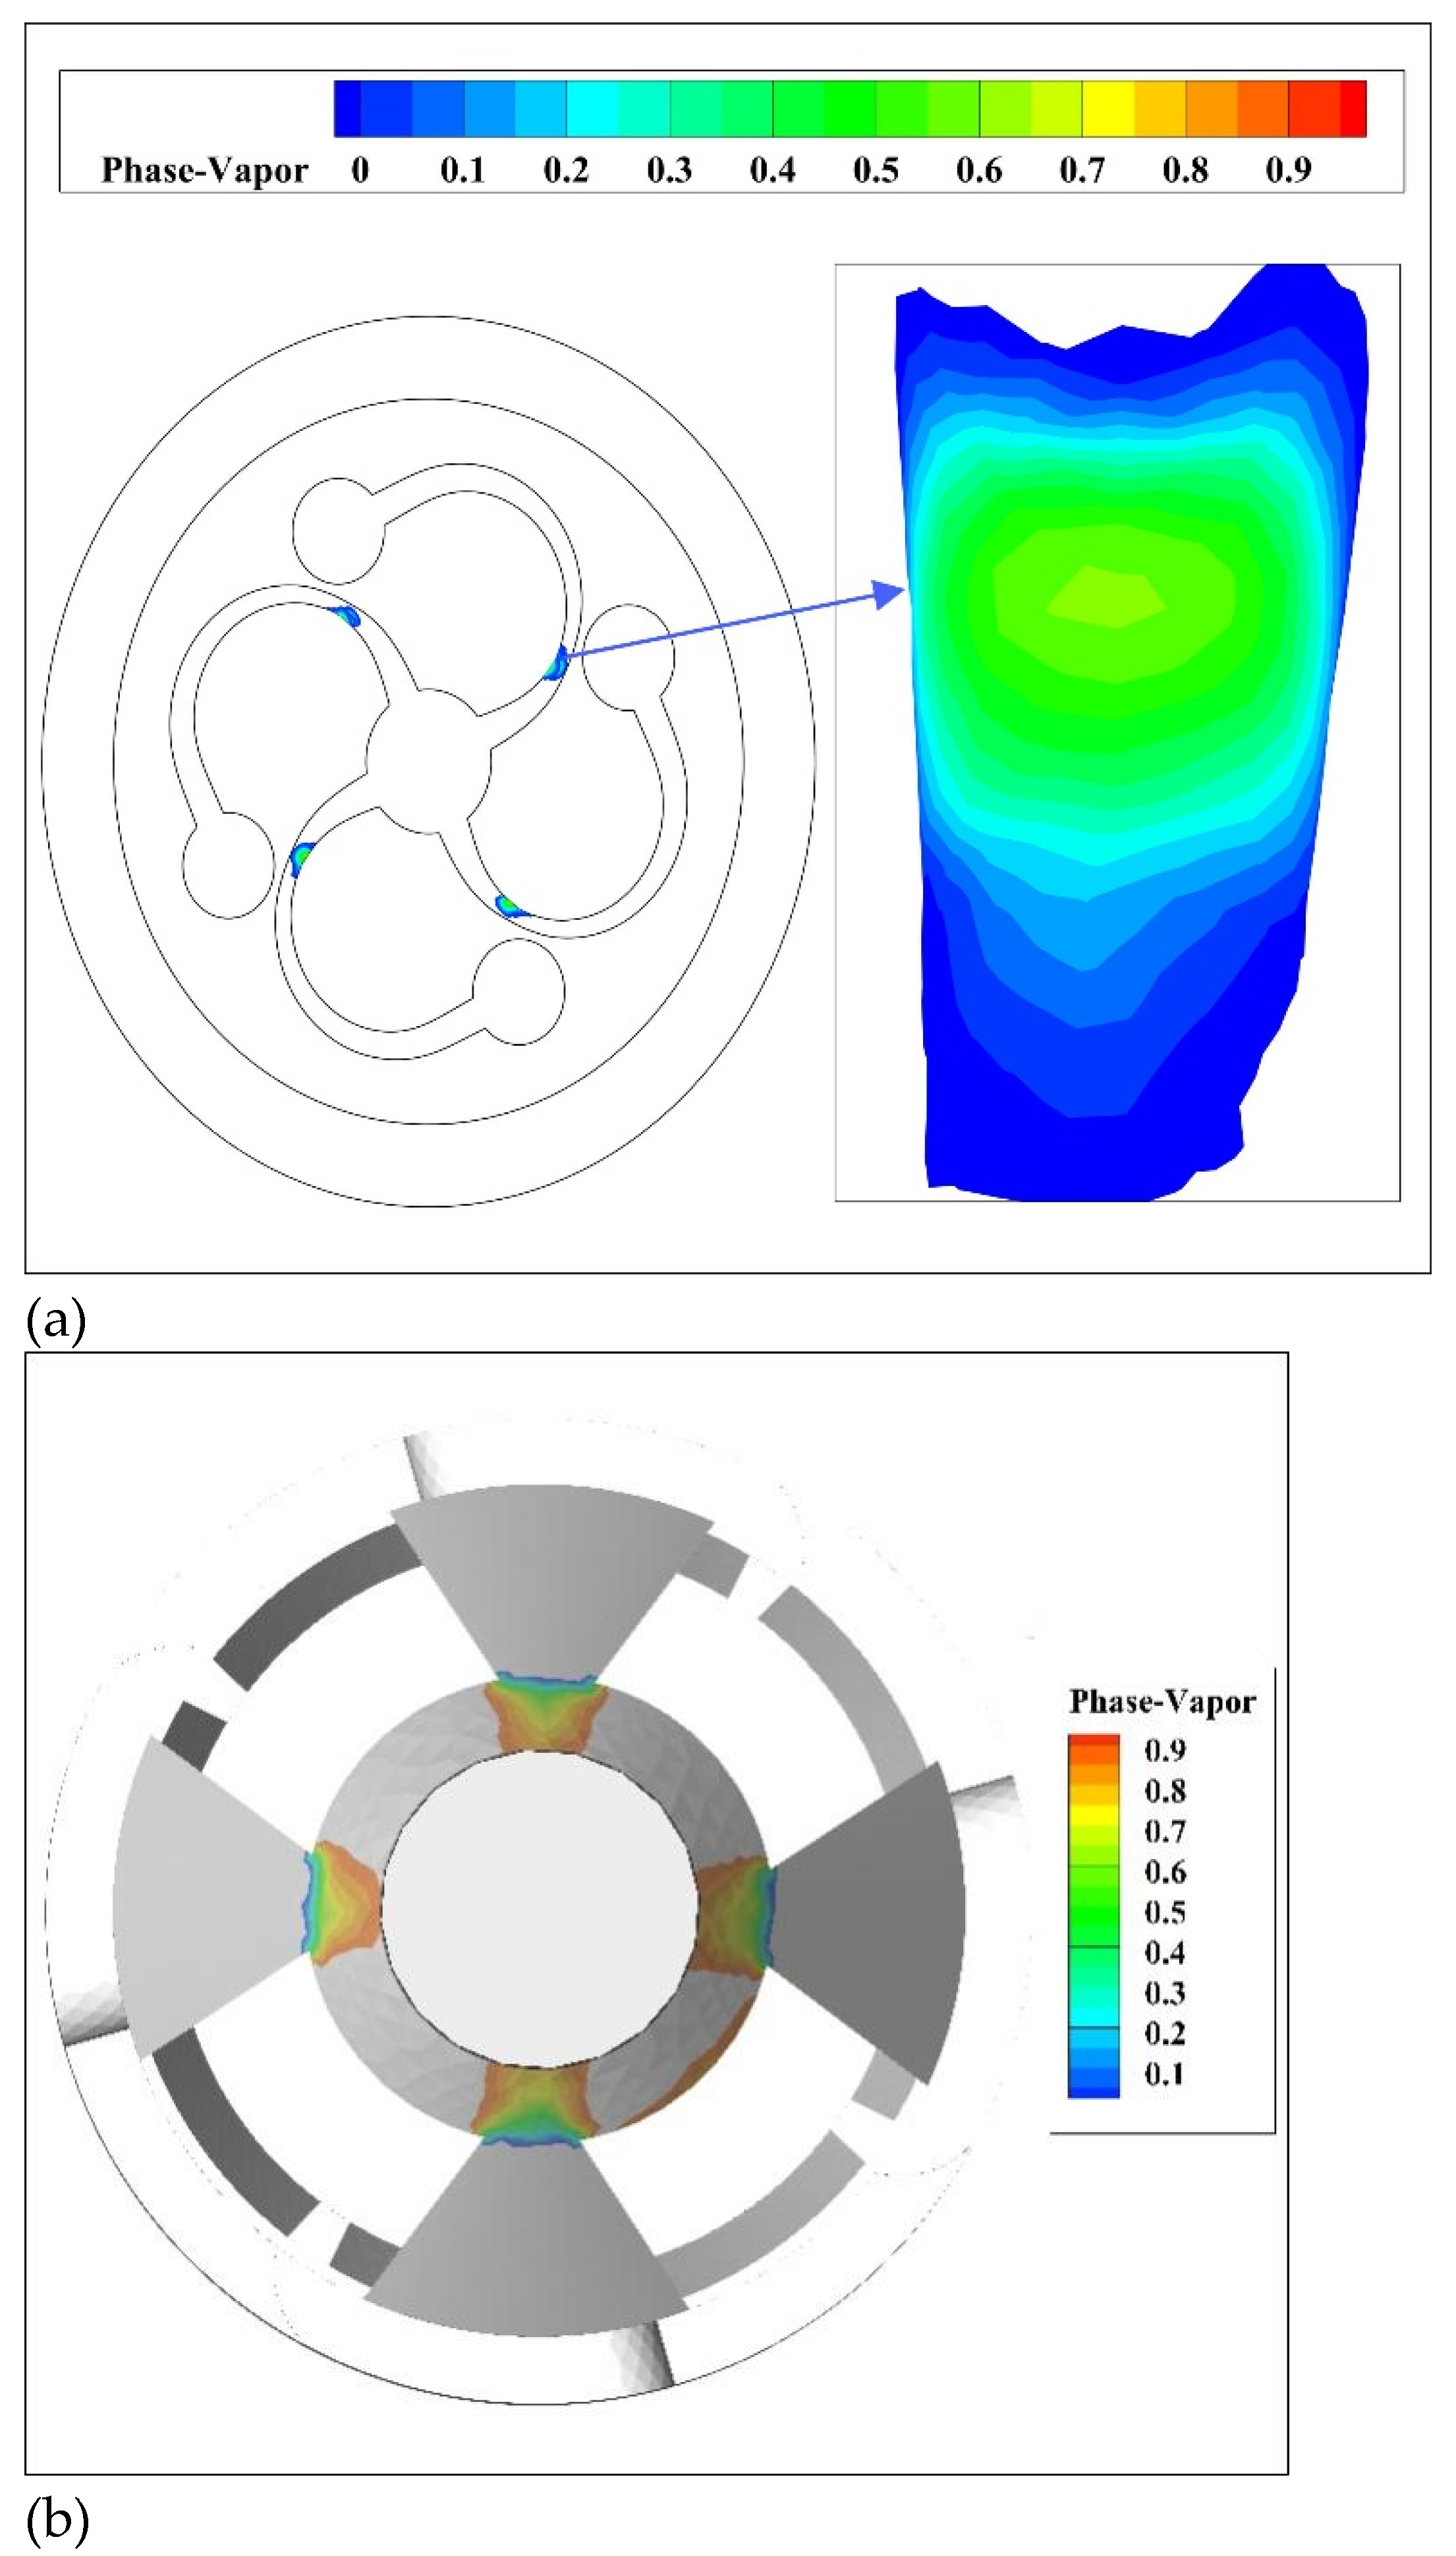
Figure 8.
The concentration of hydroxyl radical produced during cavitation.
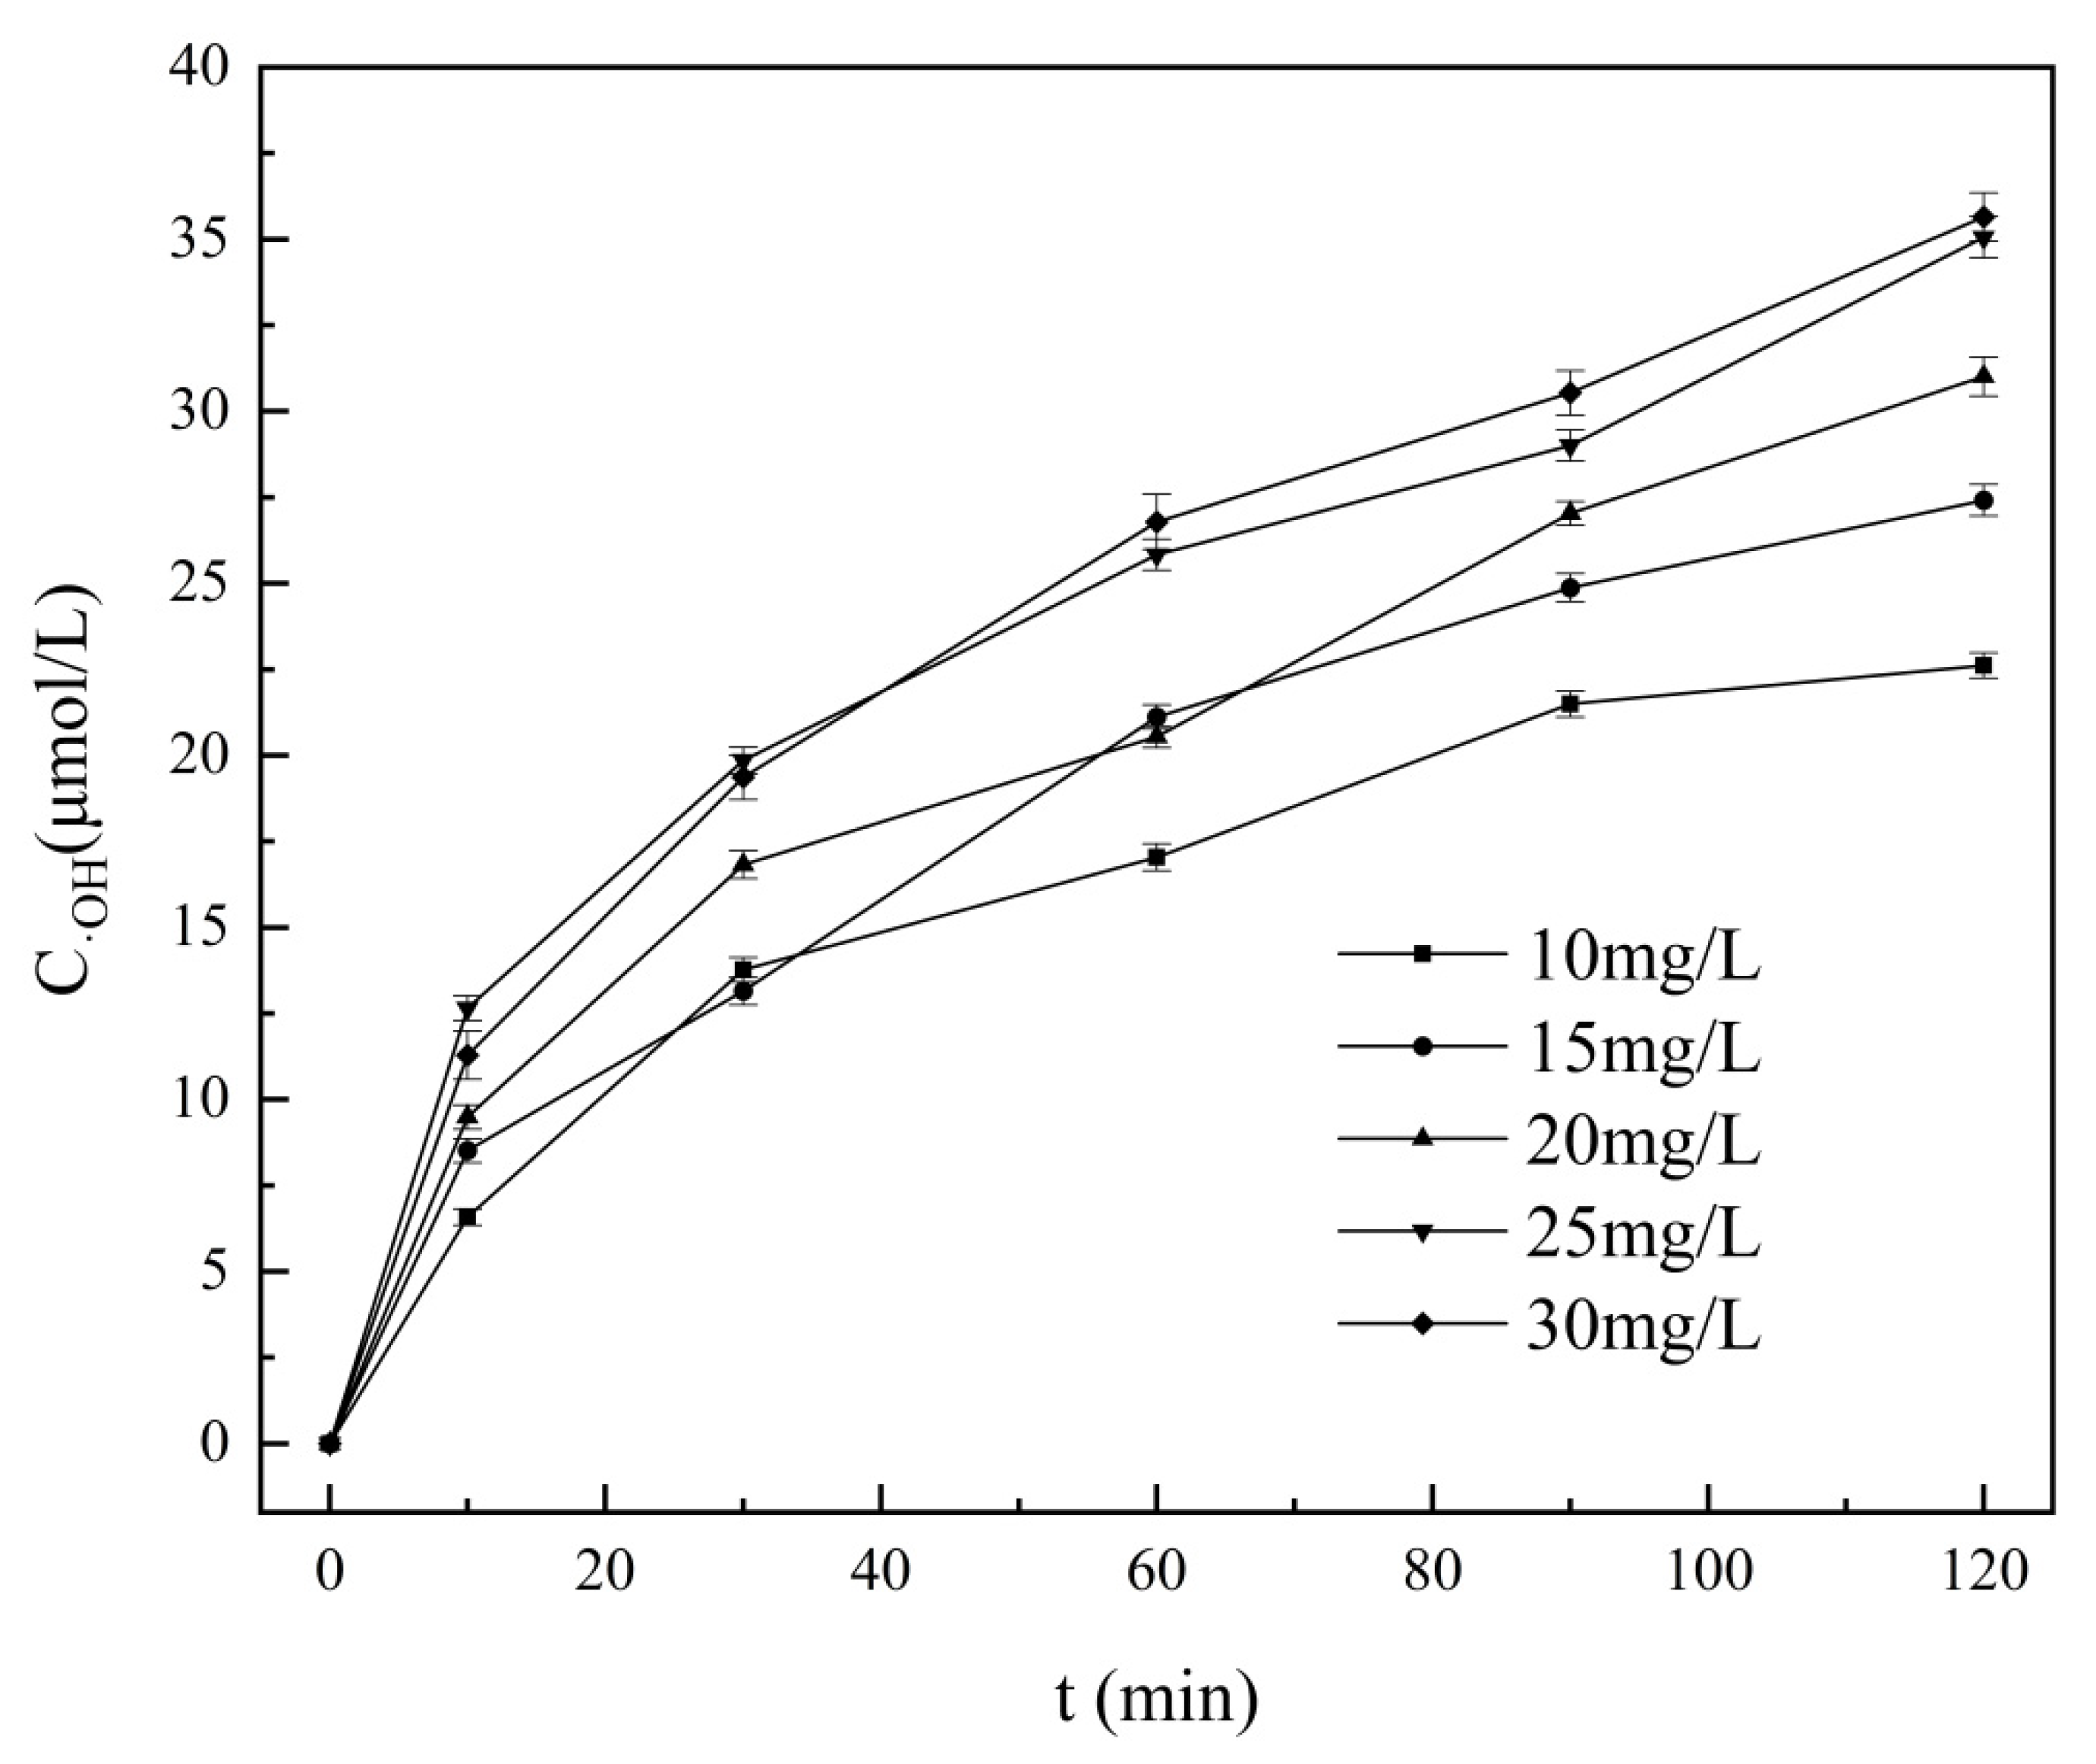
Figure 10.
The degradation of 4-aminophenol (a) and the removal of total nitrogen and ammonia nitrogen (b) with cavitation time.
Figure 10.
The degradation of 4-aminophenol (a) and the removal of total nitrogen and ammonia nitrogen (b) with cavitation time.
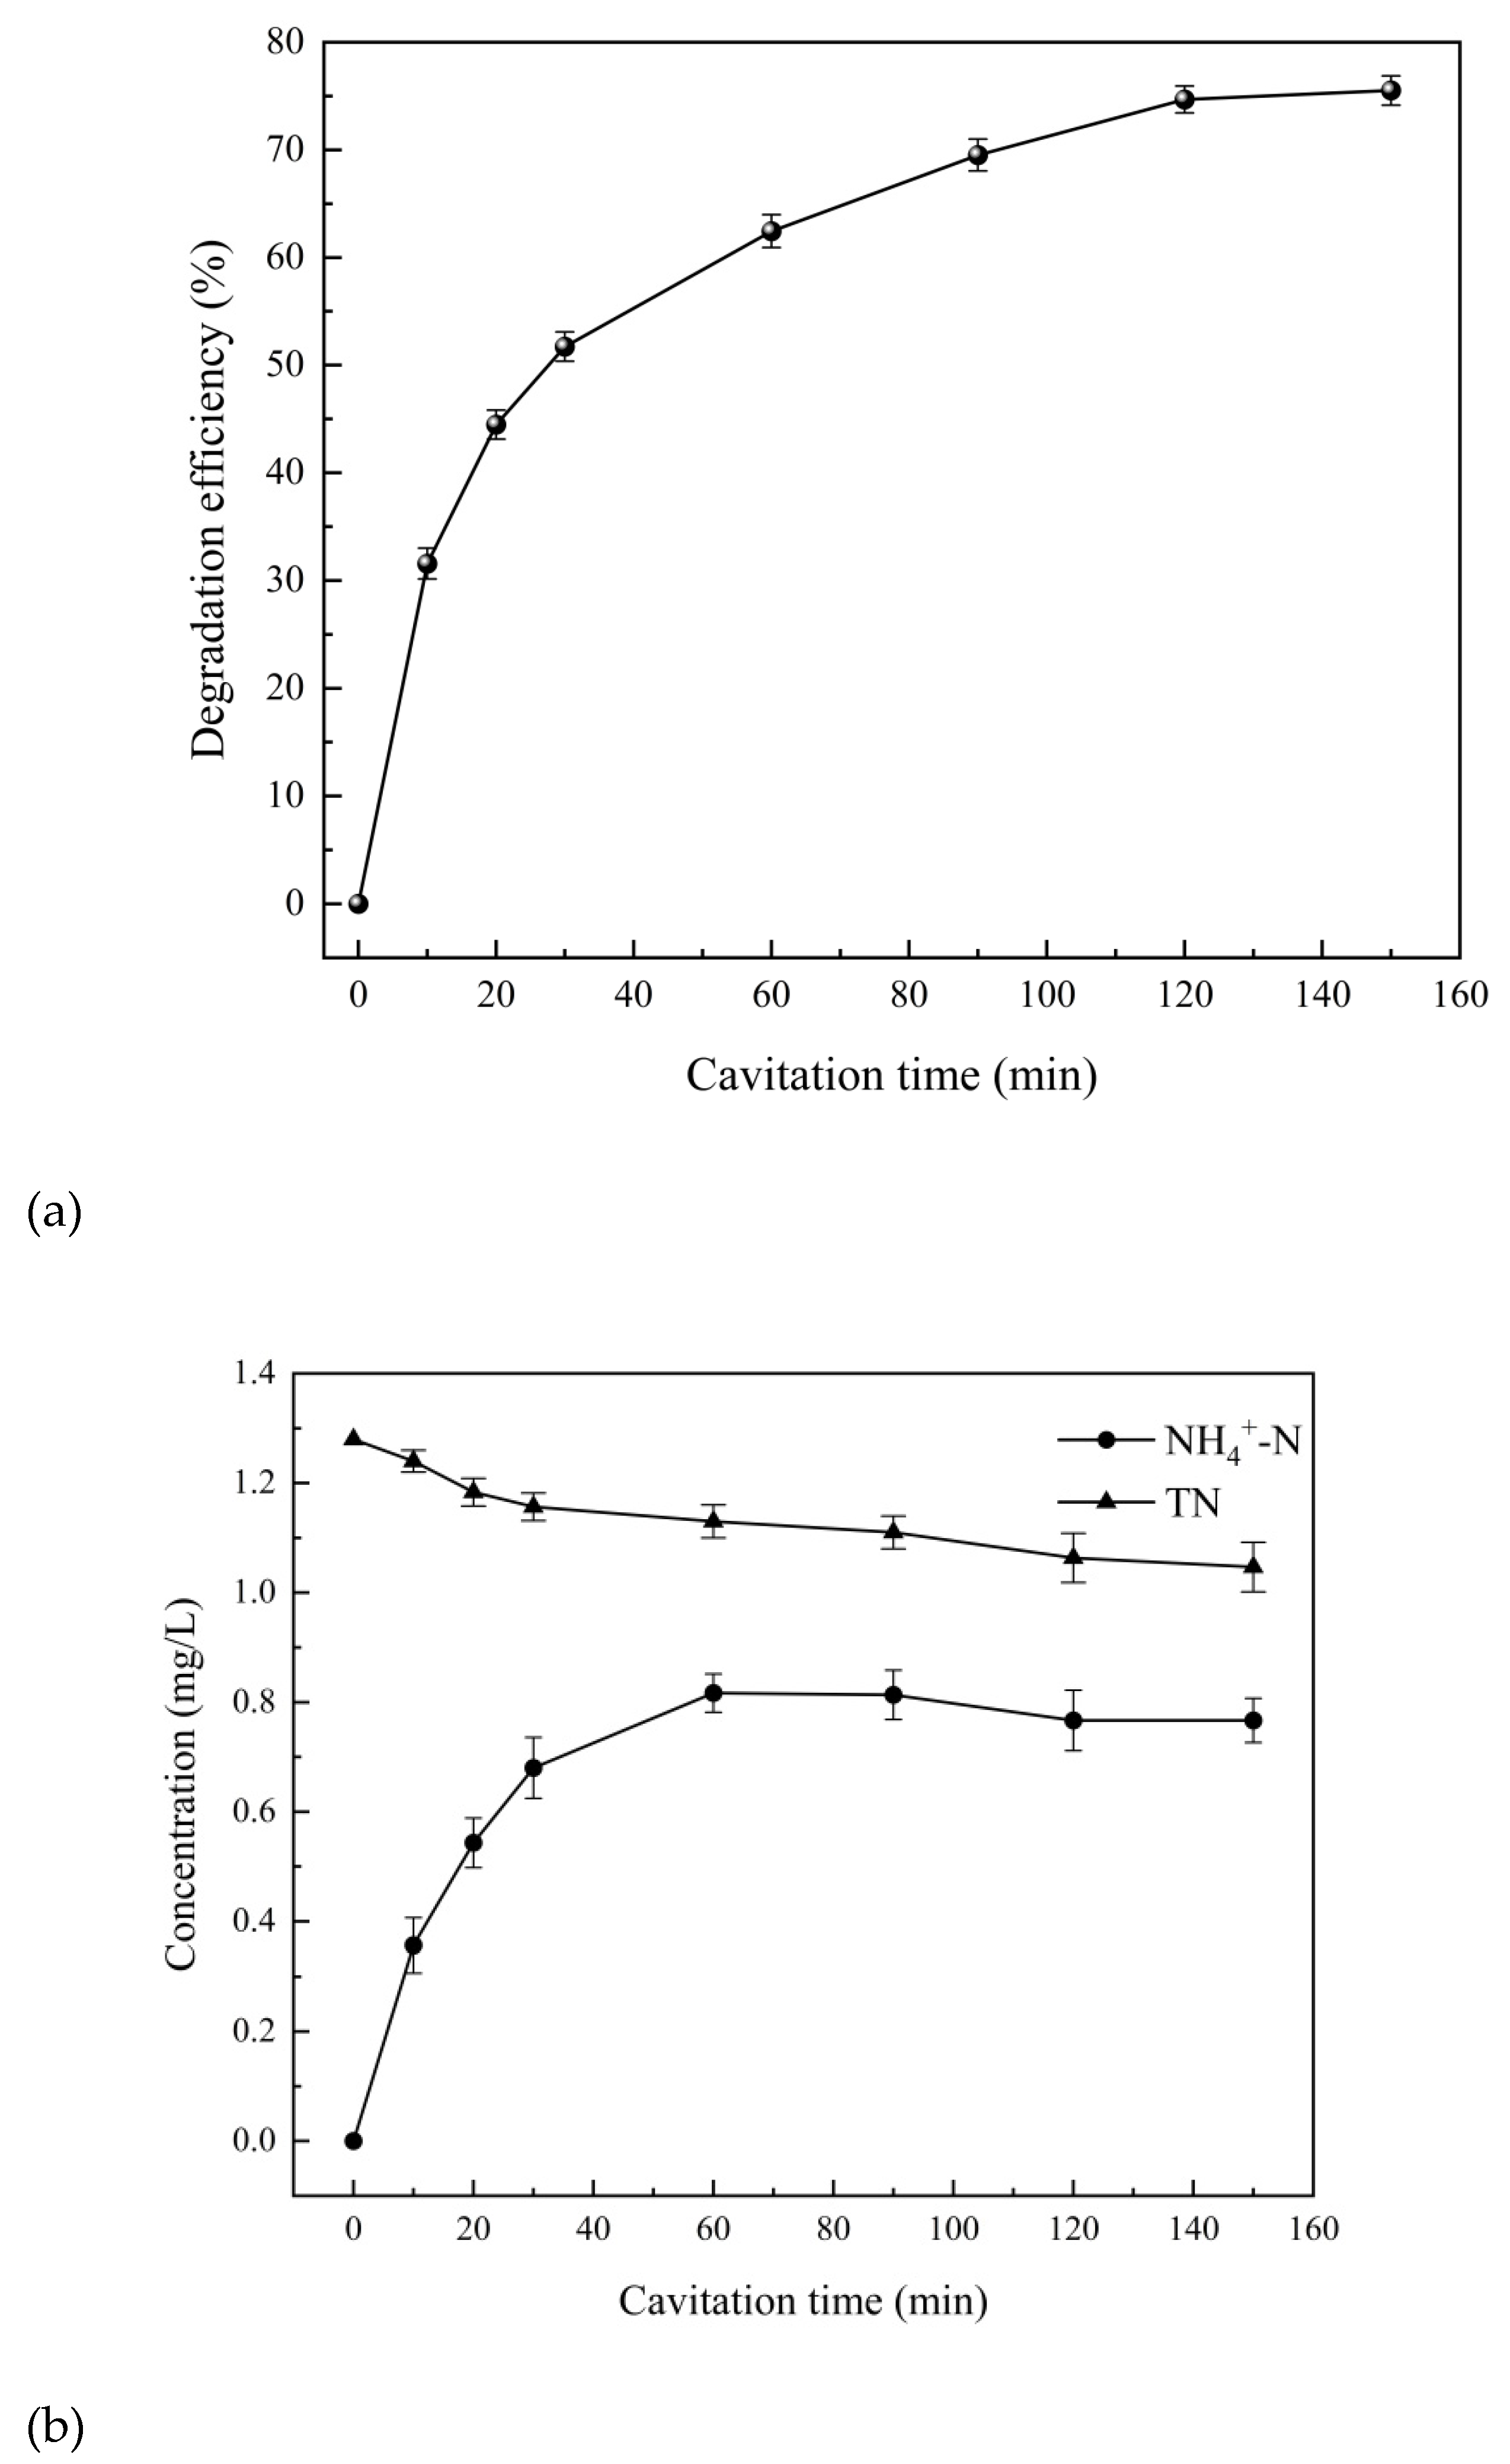
Figure 11.
The degradation of 4-aminophenol (a) and the removal of total nitrogen and ammonia nitrogen (b) at different inlet pressure.
Figure 11.
The degradation of 4-aminophenol (a) and the removal of total nitrogen and ammonia nitrogen (b) at different inlet pressure.
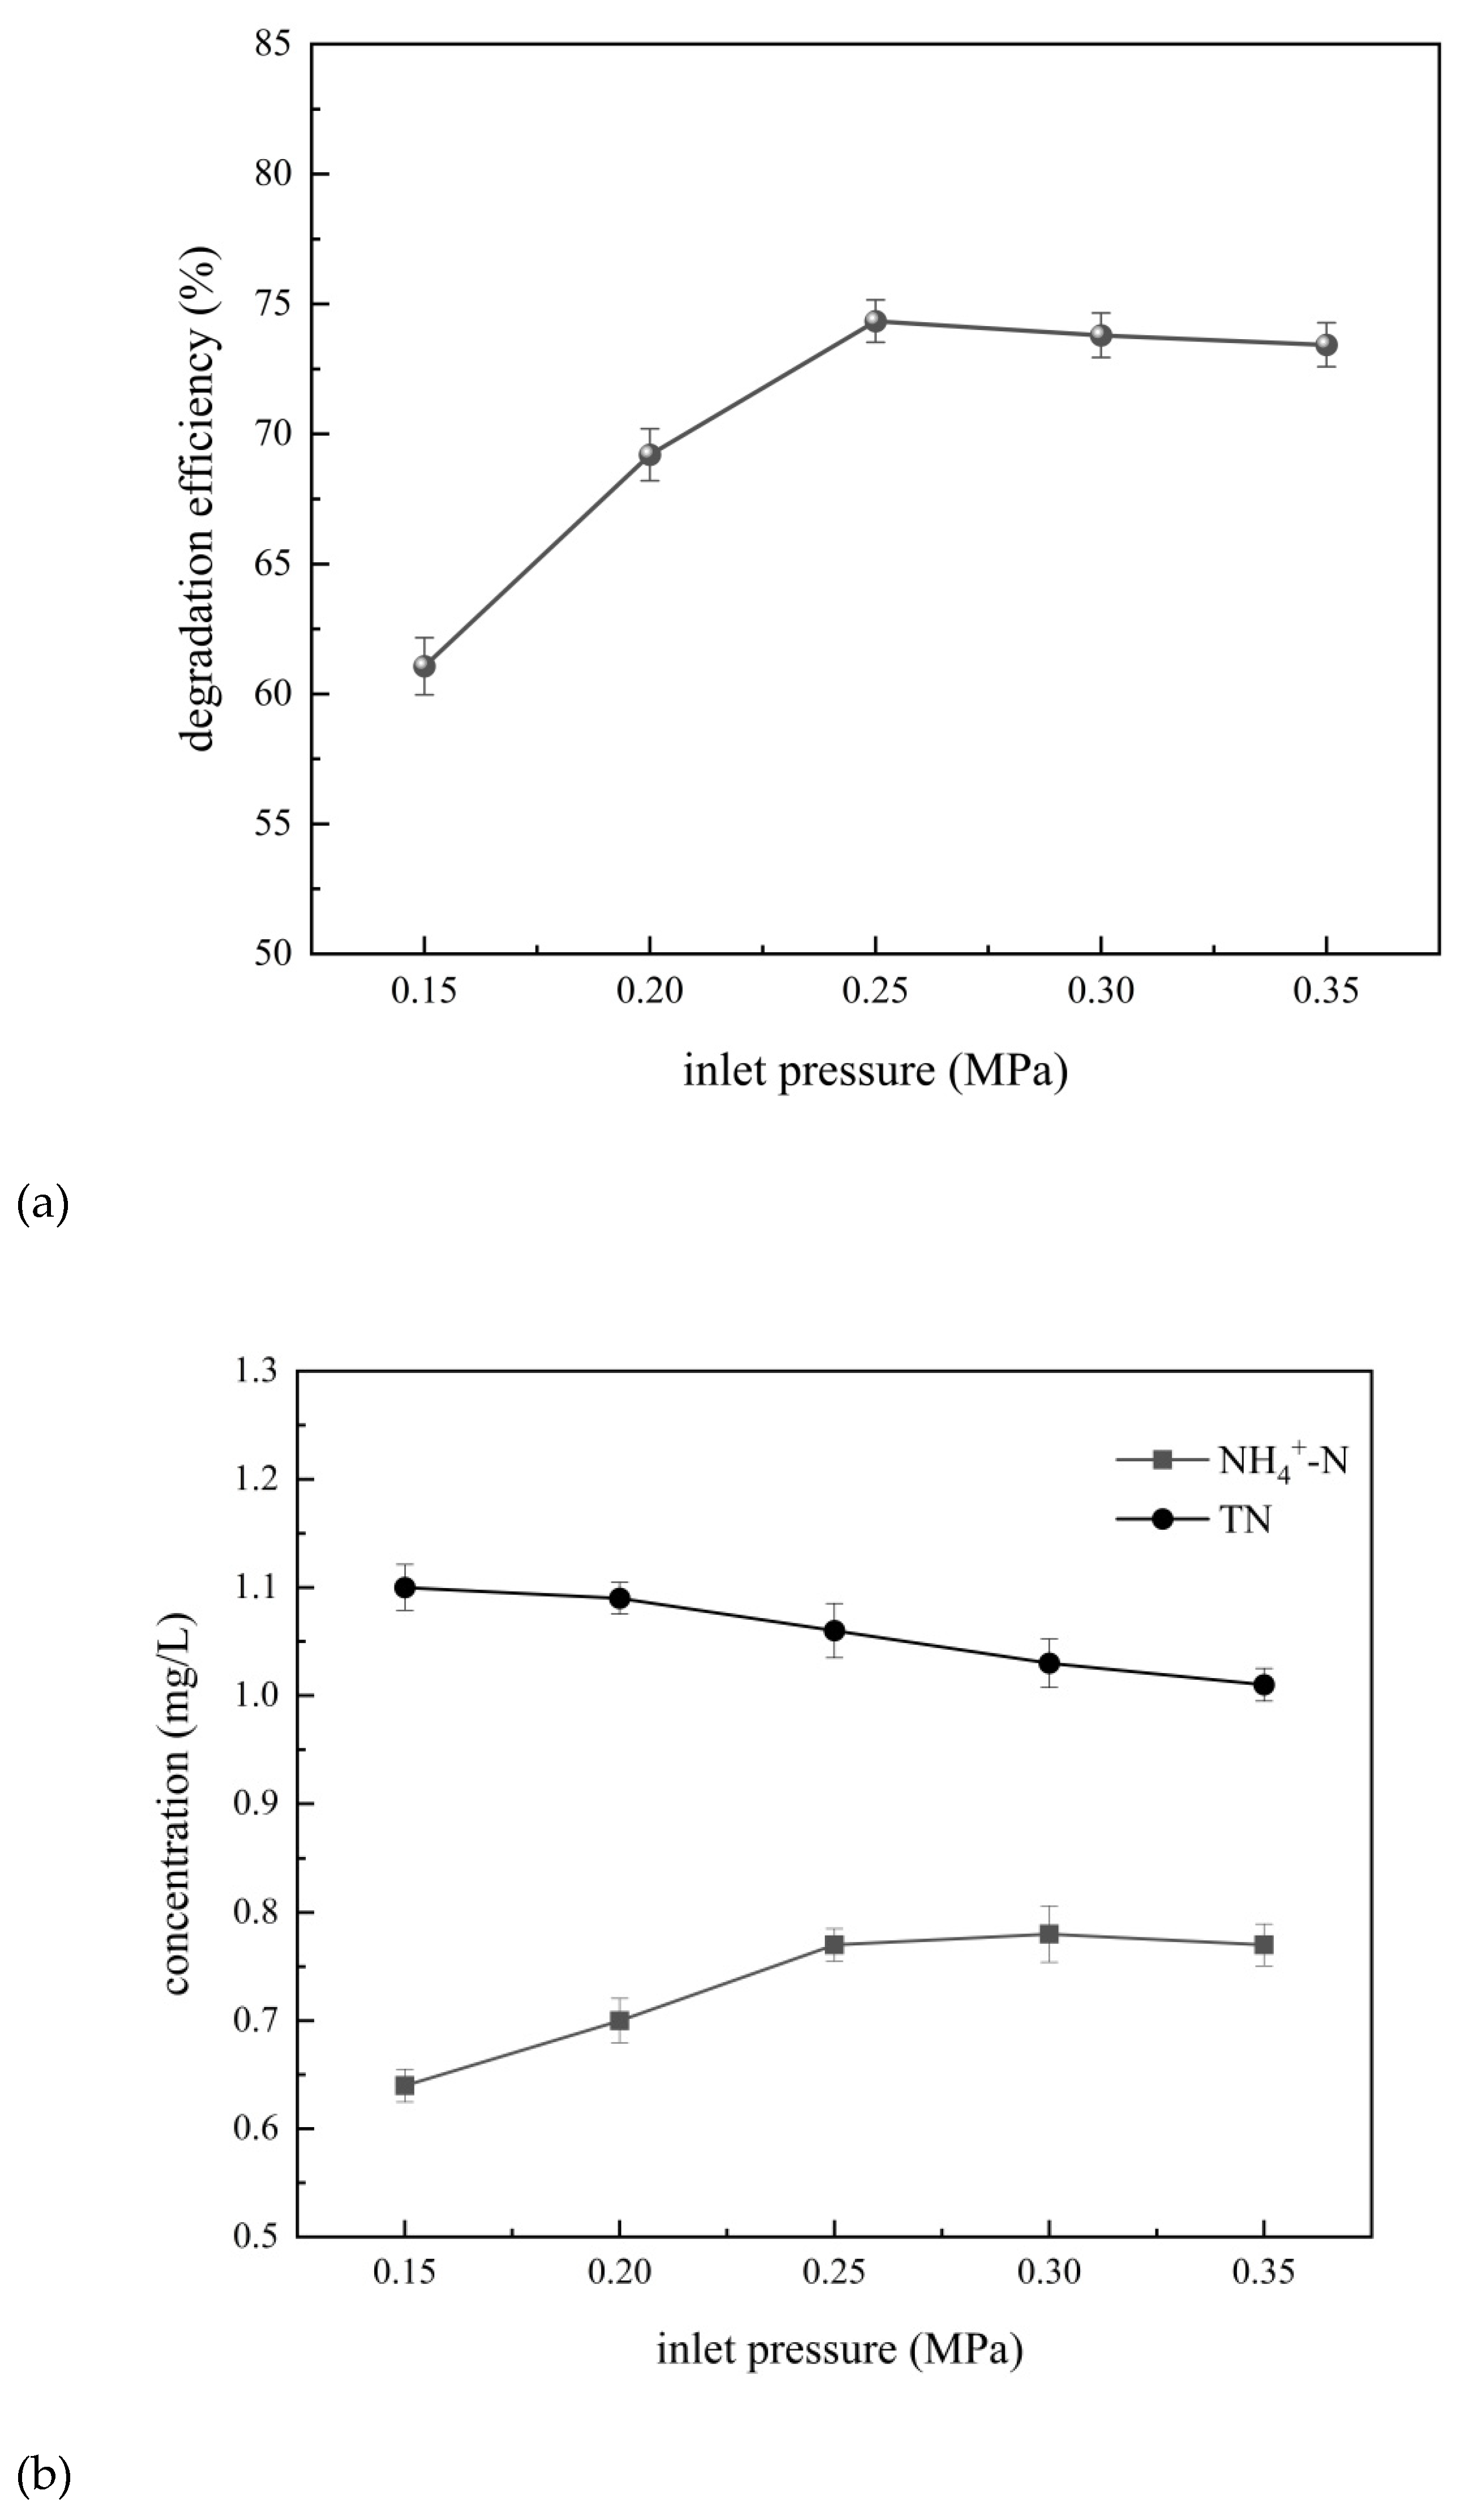
Figure 12.
The degradation of 4-aminophenol (a) and the removal of total nitrogen and ammonia nitrogen (b) at different initial pH.
Figure 12.
The degradation of 4-aminophenol (a) and the removal of total nitrogen and ammonia nitrogen (b) at different initial pH.
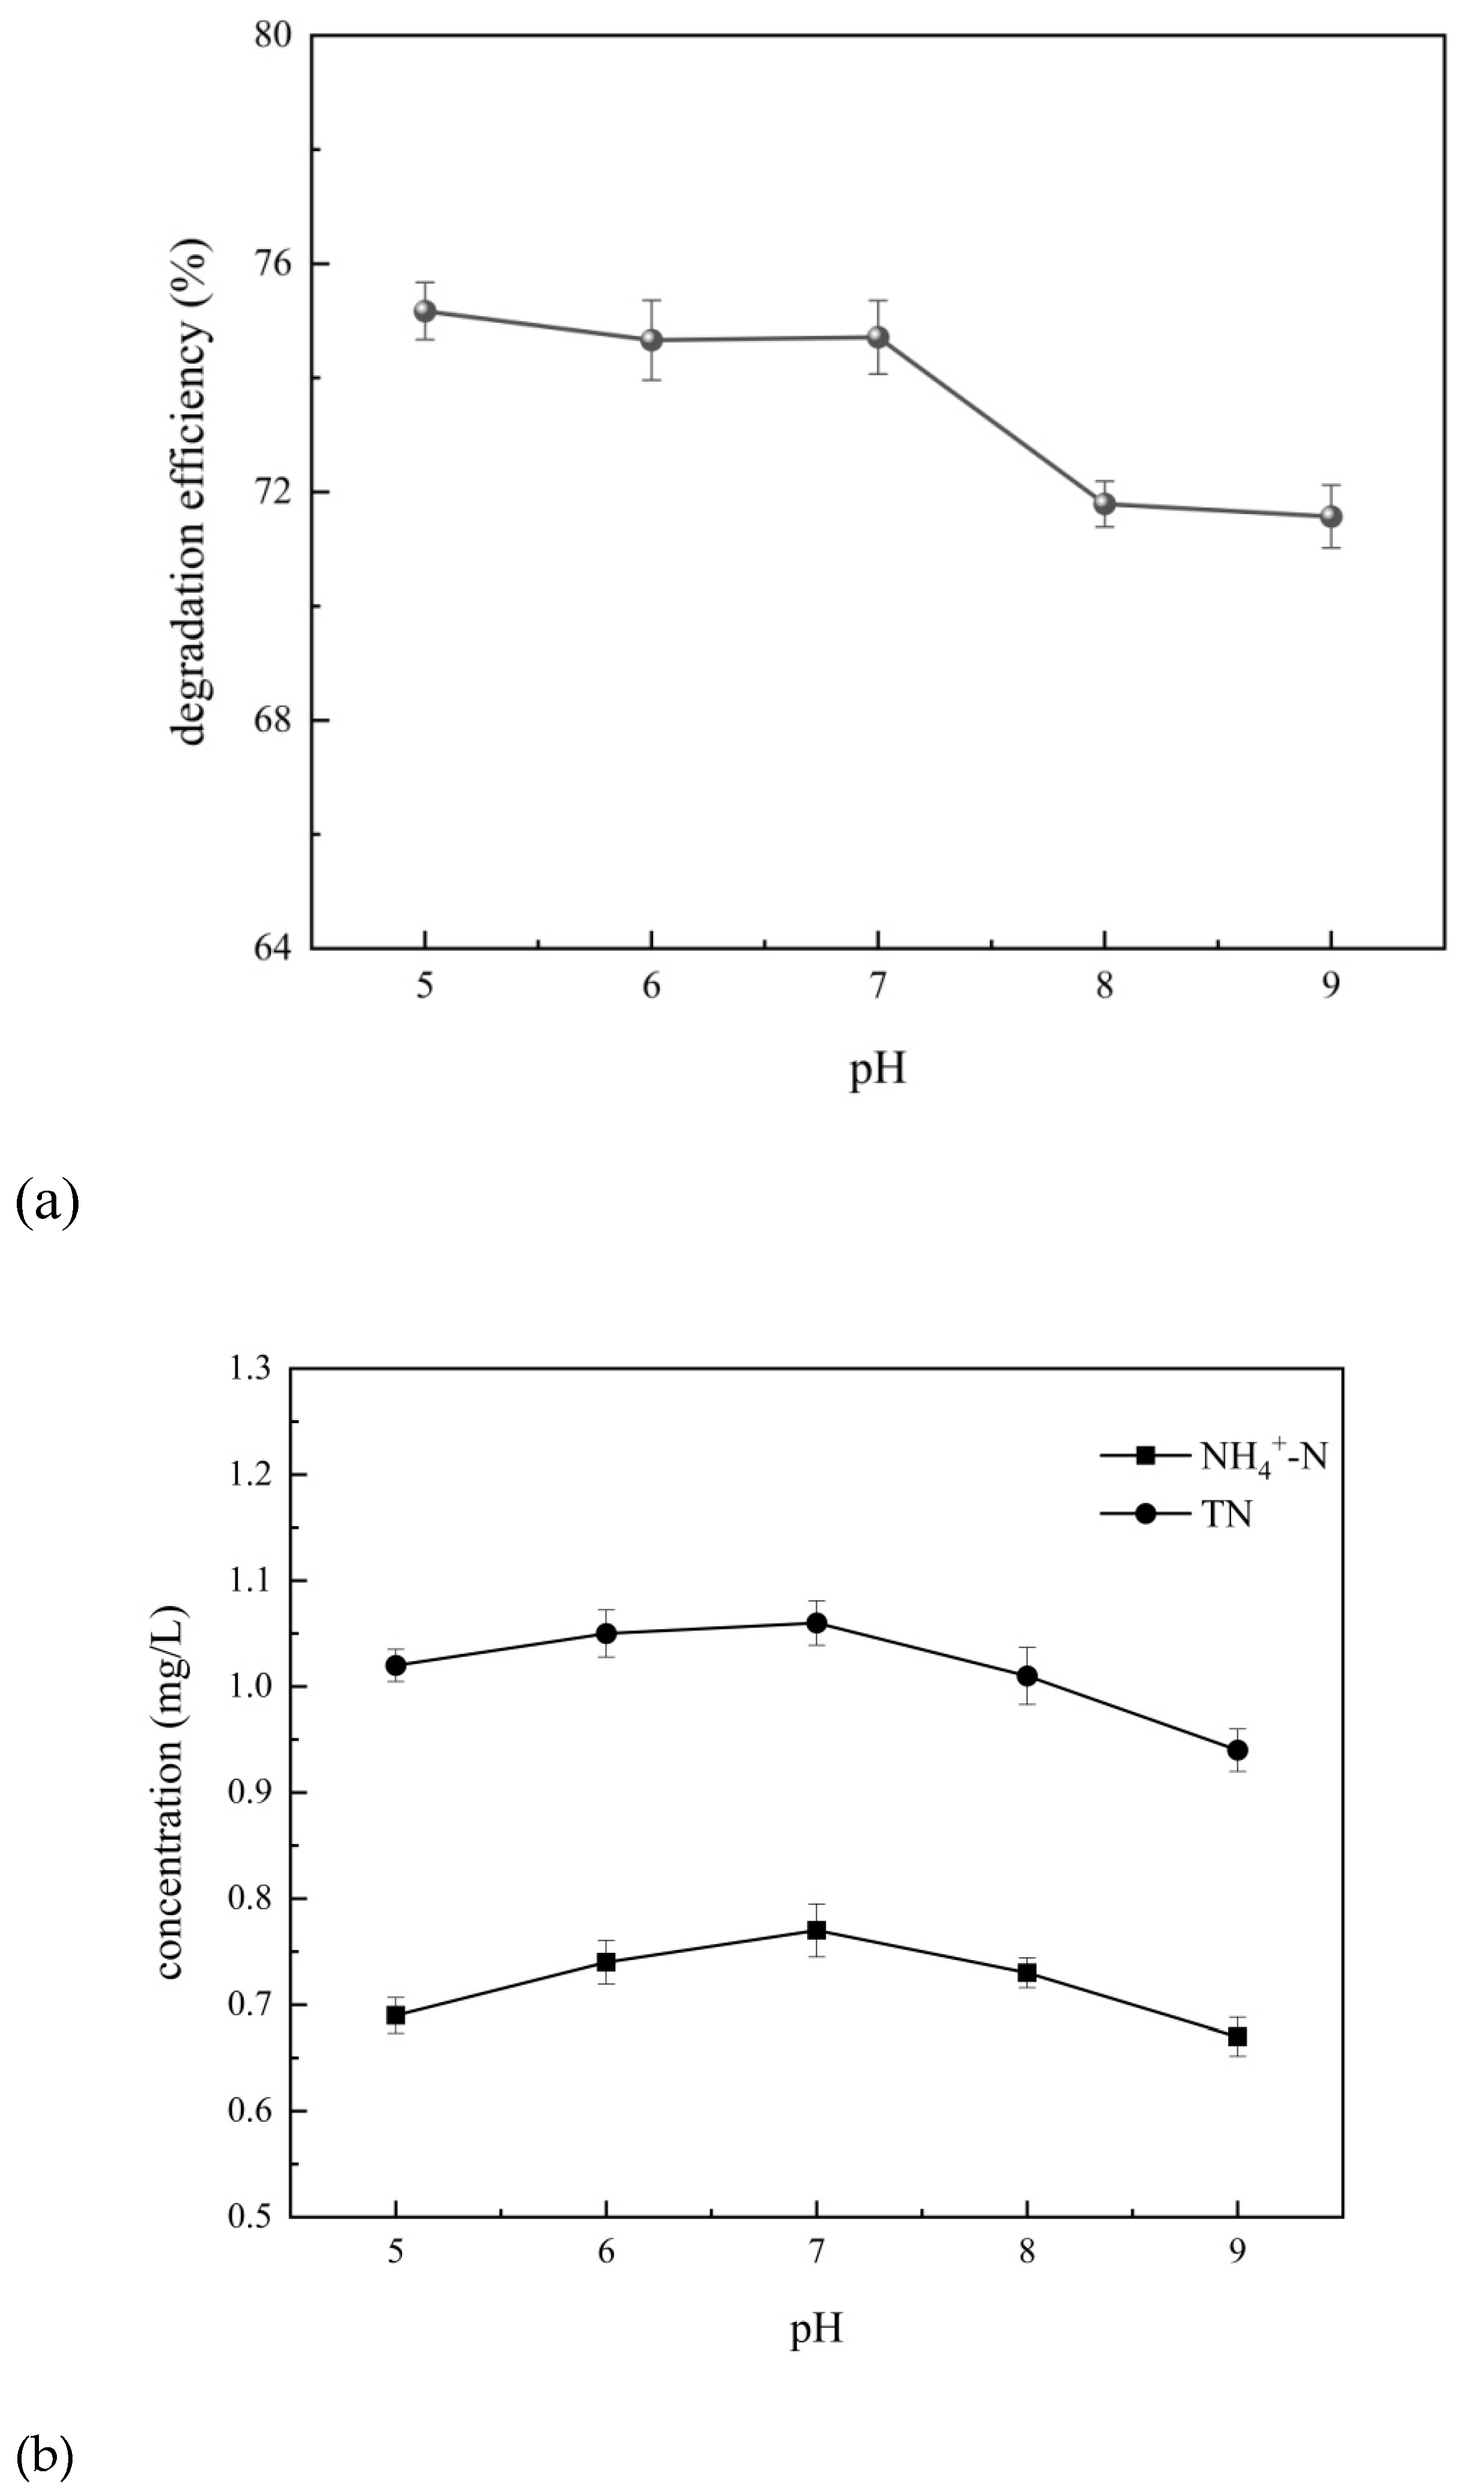
Figure 13.
The degradation of 4-aminophenol (a) and the removal of total nitrogen and ammonia nitrogen (b) at different initial 4-aminophenol concentrations.
Figure 13.
The degradation of 4-aminophenol (a) and the removal of total nitrogen and ammonia nitrogen (b) at different initial 4-aminophenol concentrations.
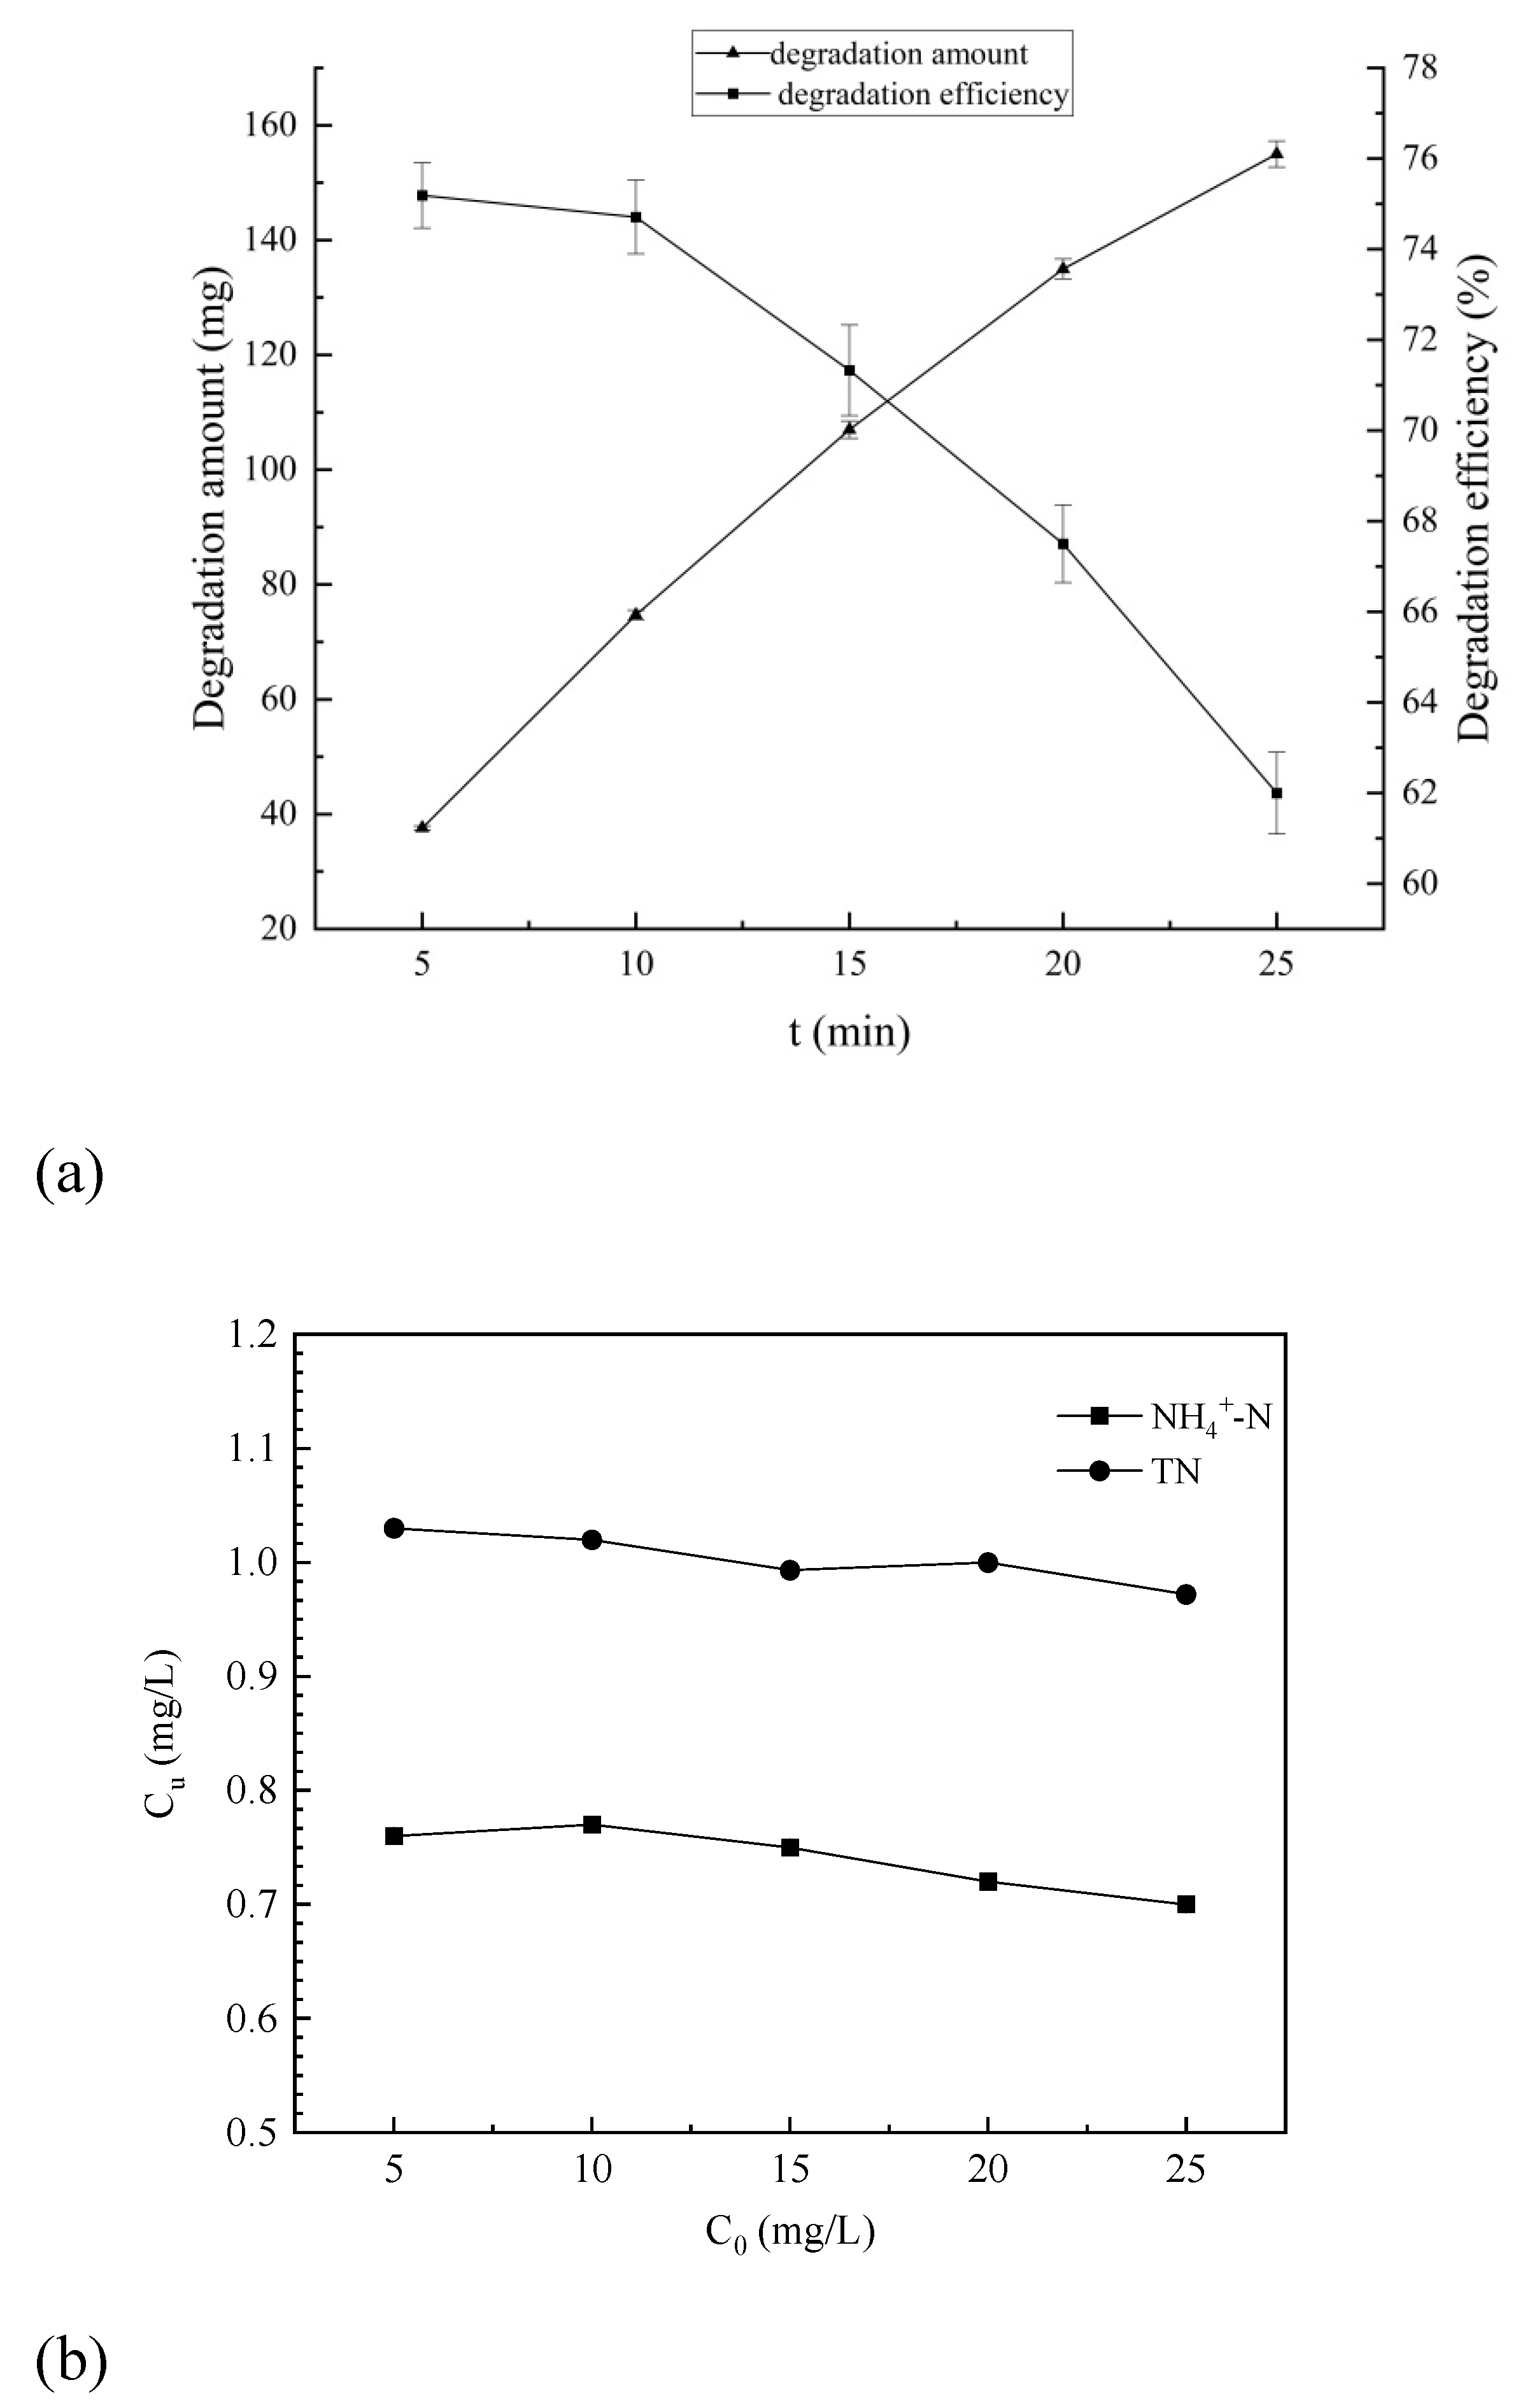
Figure 14.
HPLC chromatogram of 4-aminophenol solution before and after degradation.
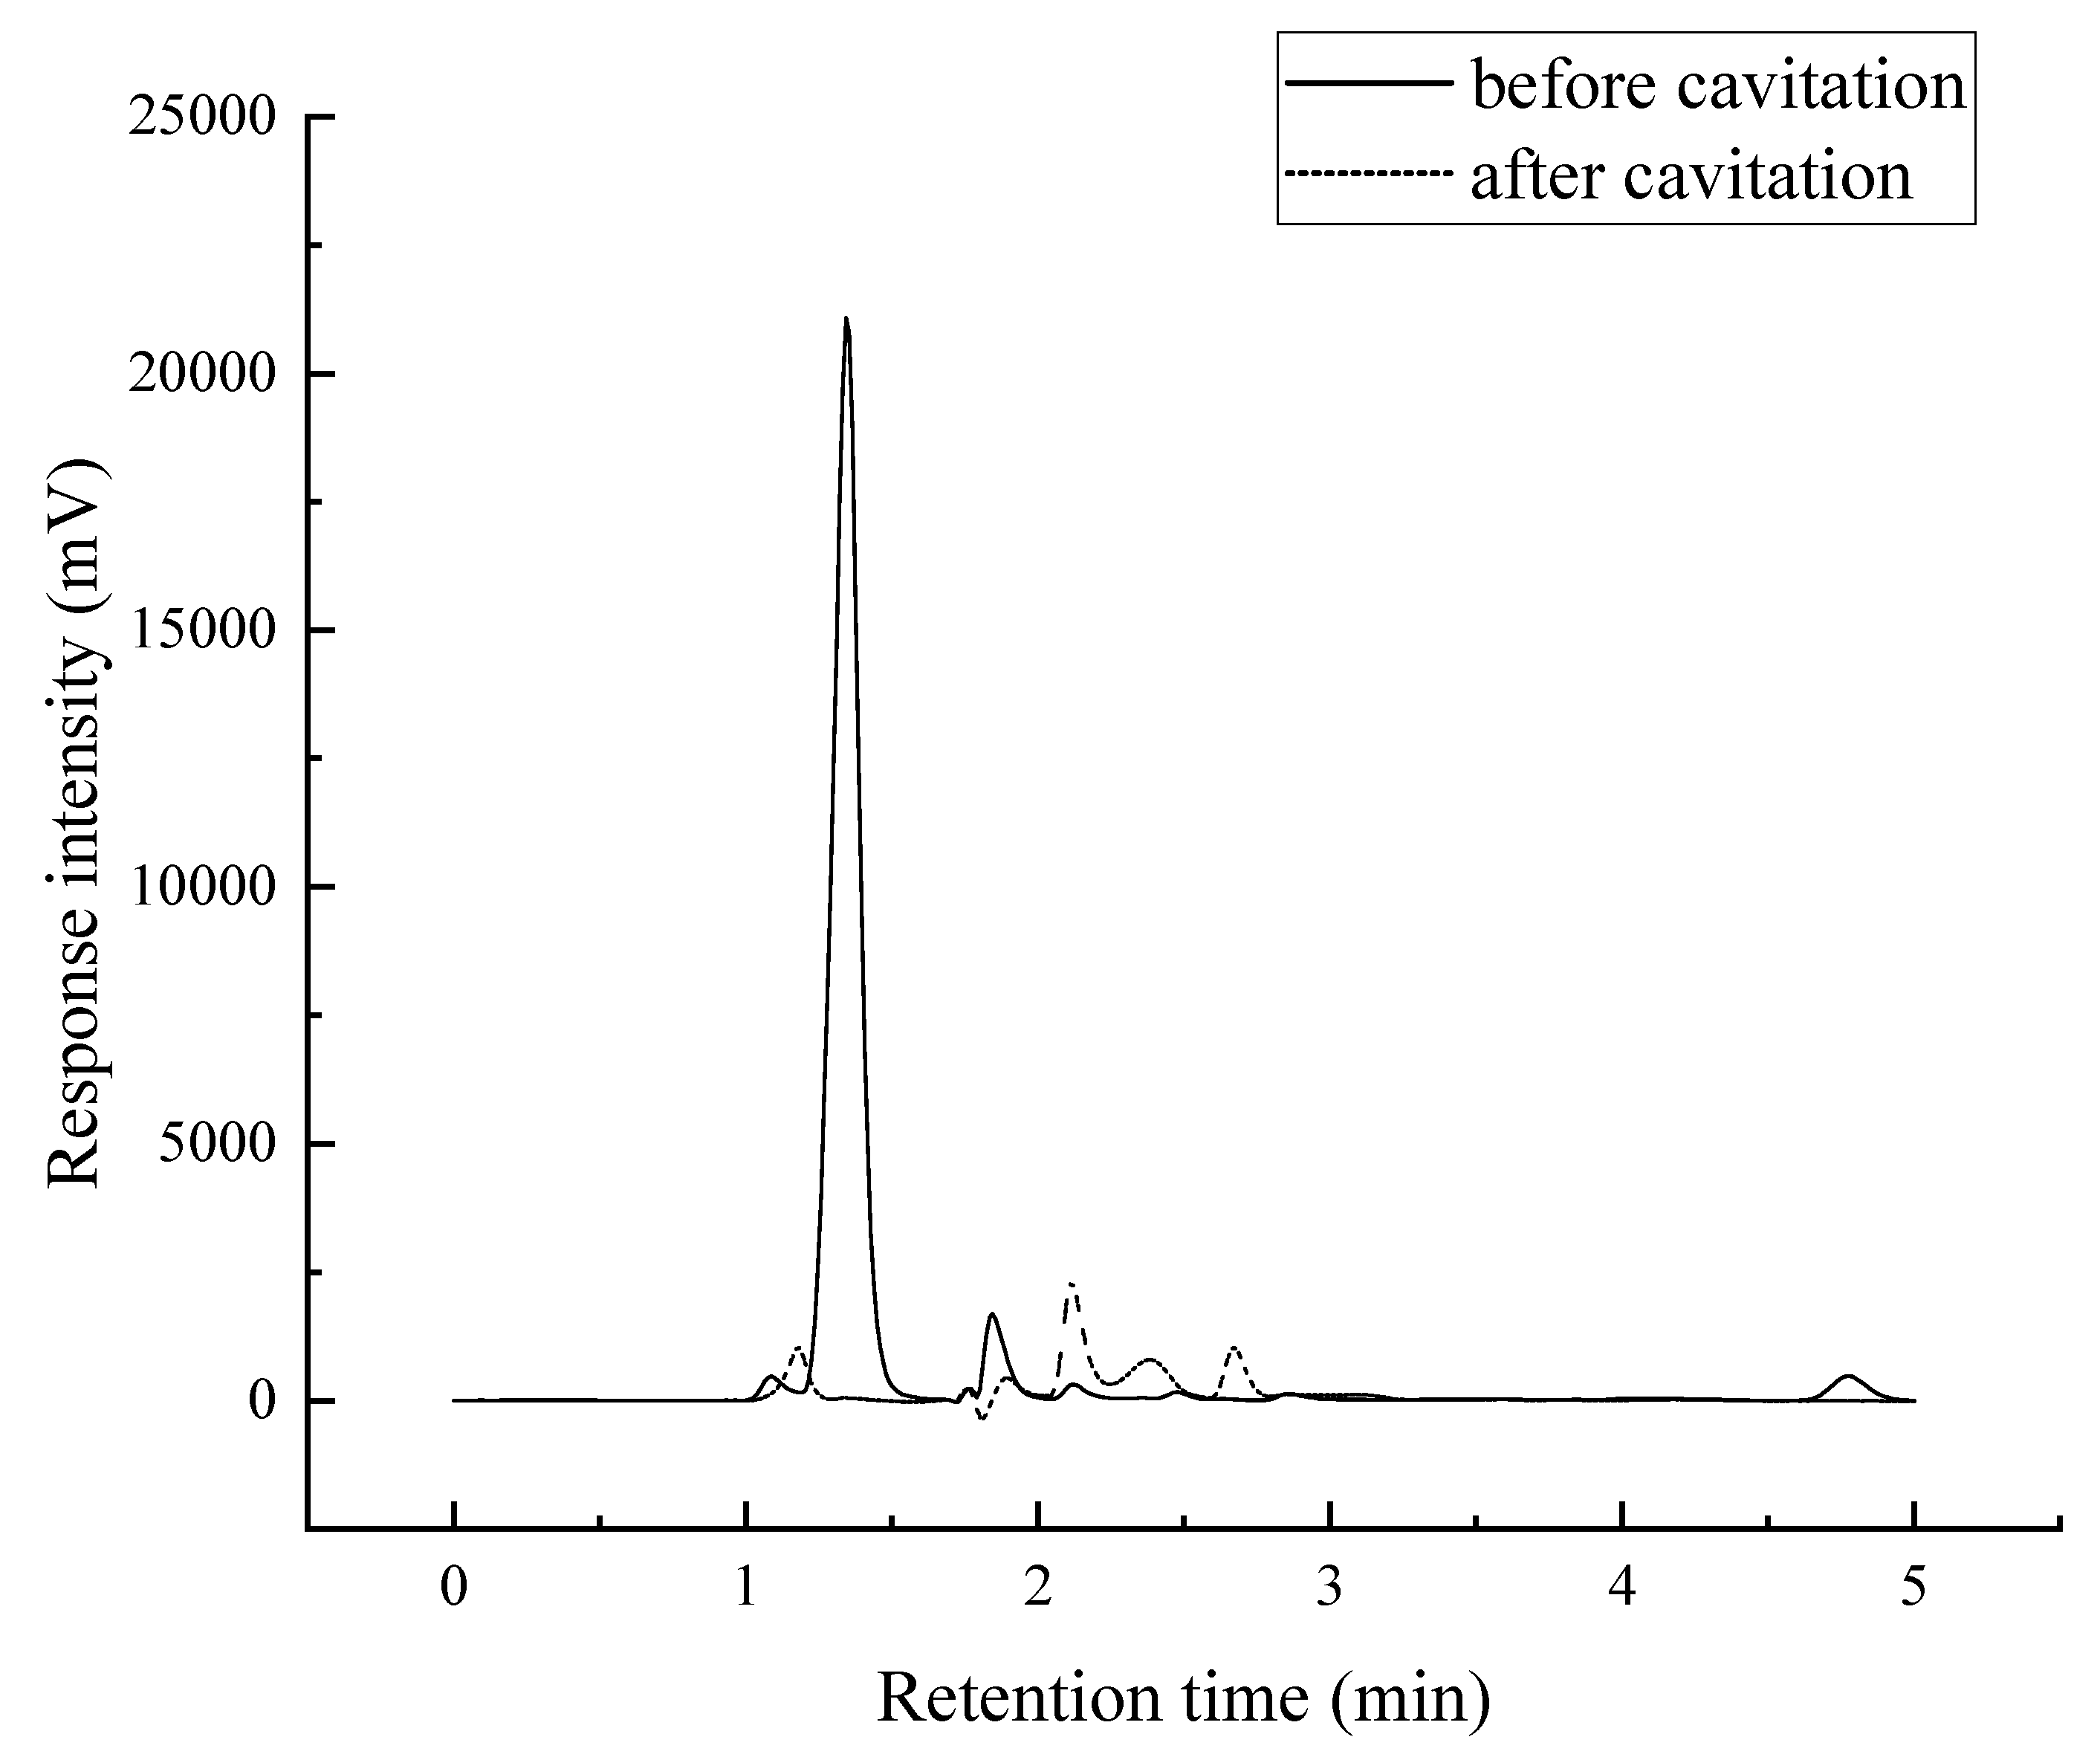
Figure 15.
Infrared spectroscopy scan spectrum of 4-aminophenol solution before and after degradation.
Figure 15.
Infrared spectroscopy scan spectrum of 4-aminophenol solution before and after degradation.
Disclaimer/Publisher’s Note: The statements, opinions and data contained in all publications are solely those of the individual author(s) and contributor(s) and not of MDPI and/or the editor(s). MDPI and/or the editor(s) disclaim responsibility for any injury to people or property resulting from any ideas, methods, instructions or products referred to in the content. |
© 2025 by the authors. Licensee MDPI, Basel, Switzerland. This article is an open access article distributed under the terms and conditions of the Creative Commons Attribution (CC BY) license (http://creativecommons.org/licenses/by/4.0/).
Copyright: This open access article is published under a Creative Commons CC BY 4.0 license, which permit the free download, distribution, and reuse, provided that the author and preprint are cited in any reuse.


