
Submitted:
19 December 2023
Posted:
19 December 2023
You are already at the latest version
Abstract
The maritime sector, grapples with environmental challenges, but the adoption of "cold ironing" emerges as a promising solution, signifying a shift toward sustainability by providing energy to ships at port, reducing reliance on fossil fuels, and significantly lowering emissions, contributing to global climate change efforts. This transition towards renewable energy is especially crucial for islands like Lesvos, addressing challenges of high energy costs and environmental degradation resulting from reliance on imported fossil fuels, highlighting the potential for positive economic and environmental impacts. The existing literature highlights a research gap in the development of Renewable Energy Sources (RES) to support cold ironing operations, specifically due to the absence of specific data for the power demand needed in such operations and the lack of monitoring data for accurate calculations. This study's primary objective is to utilize real monitoring data from the port of Lesvos to evaluate the power demand for a potential cold ironing application. Additionally, the study aims to analyze the implementation of a wind power park to meet the energy needs of an electric port and evaluate the potential reduction in CO2 emissions. The database of Marine Traffic S.A. was utilized, while the determination of the energy used in-port per ship depended on factors such as the number of arrivals, the duration of hoteling, and the type of engine used by the ships. In addition, the software RETSCREEN was used for the energy analysis of a simulated 20 MW wind park that can support the in-port operations. The combined monthly energy demand for both main and auxiliary engines of shipping vessels at Mytilini port was assessed to be 6118 MWh and averaging a power demand equaled to 8.2 MW. The simulation analysis indicates that the annual electricity delivered to the port can be72080 MWh, with a significant portion remaining unused and exported to the grid, amounting to 14956 MWh annually. Due to demand fluctuations, in-port activities require an additional 924 MWh from the main electrical grid, which highlights the importance of additional measures like energy storage and demand-response practices for the gradual transition to 100% Renewable Energy Sources (RES) operations.
Keywords:
Electrification
; Green Transition
; Wind Power
; Electric Ports
; Maritime
1. Introduction
The flow of goods and commodities across the world’s seas and oceans is made easier by the maritime sector, which forms the foundation of global trade and transportation. But despite its vital significance, this business has a significant negative impact on the environment because it contributes significantly to air pollution and greenhouse gas emissions. The need to battle climate change and lessen the environmental impact of different sectors is growing worldwide, and this pressure is particularly focused on the marine industry and its adoption of sustainable practices. With "cold ironing," often referred to as shore power or Alternative Maritime Power (AMP), gaining center stage in the pursuit of greener and more sustainable shipping practices, maritime electrification has emerged as a possible answer to these problems [1]. Cold ironing represents a significant paradigm shift in the maritime sector, showcasing a growing commitment to sustainability and environmental responsibility. This practice involves supplying energy to ships while berthed in port, allowing them to shut down their generators and onboard engines. This enables ships to operate without using fossil fuels, reducing emissions and mitigating the negative environmental impact of the maritime industry. This essay explores cold ironing, examining current best practices, ongoing and future developments, and potential transformative practices for the maritime industry. It serves as a comprehensive exploration of this environmentally beneficial technology, illustrating its positive effects on the environment. By connecting ships to onshore electricity grids, cold ironing significantly reduces greenhouse gas emissions and harmful air pollutants like sulfur and nitrogen oxides. This not only improves local air quality but also contributes to global efforts to combat climate change, making it a noteworthy example of good environmental practice in the maritime sector [2].
In addition to its considerable environmental advantages, cold ironing offers financial benefits for ship operators. Operating onboard generators powered by diesel or heavy fuel oil can be more expensive and energy-intensive than accessing electricity from the shore. Cold ironing proves to be a financially and environmentally desirable option due to its effectiveness, leading to significant cost savings and improved operational efficiency for vessel owners. Traditional shipboard generators often consume more fuel than onshore power sources. By eliminating the need for ships to burn fuel for power generation, cold ironing reduces operating costs and decreases reliance on fossil resources. As a result, ship owners can enjoy lower fuel costs, especially during extended port calls where ships would otherwise continuously idle and burn fuel. Cold ironing emerges as a win-win solution for both the marine industry and the environment, delivering economic and environmental benefits [3]. An area of active research and development is the incorporation of alternative energy sources into cold ironing systems. Using solar, wind, and battery storage systems can help ships when they’re in port run more sustainably and environmentally, supporting international efforts to switch to greener energy sources and lowering the carbon footprint of the sector. Setting a new benchmark for maritime electrification and demonstrating the industry’s commitment to a more sustainable and ecologically conscious future, cold ironing represents hope for cleaner port operations [4]. The global focus on deploying and embracing renewable energy sources (RES) has intensified due to concerns about addressing climate change, diminishing reliance on fossil fuels, and ensuring energy security [5]. For islands, the transition to renewable energy is crucial as they heavily rely on imported liquid fossil fuels to meet their energy needs. This dependency leads to negative consequences such as high energy costs, supply vulnerabilities, environmental degradation, and adverse impacts on local economies [6 - 7]. Despite these challenges, many islands recognize RES as a feasible and sustainable alternative. RES technologies provide benefits like abundant resource availability, potential cost savings, and positive environmental effects. However, the successful adoption of RES on islands depends on various factors unique to each case. In the case of Lesvos, the island’s isolated grid and dependence on a diesel power plant make its energy production carbon-intensive, costly, and reliant on external resources. This highlights the potential of RES as a viable and sustainable alternative for Lesvos, with opportunities and barriers that need careful consideration [8].
Lesvos is the third biggest island in Greece and is located in the North Aegean. The island has significant opportunities in the energy transition, including the potential for energy independence using local resources and reducing reliance on imported fossil fuels. This not only enhances energy security but also addresses environmental concerns by mitigating climate change and reducing air pollution and greenhouse gas emissions. As mature technologies like photovoltaic, wind power, and certain biomass applications become economically viable, there’s a chance for cost savings compared to traditional energy sources [9]. Additionally, Lesvos can capitalize on its agricultural and food industry by repurposing organic waste for renewable energy, creating economic opportunities and reducing the environmental impact of energy production [10]. The energy transition also offers social benefits, fostering the development of energy communities that enable local generation, storage, and distribution of energy, encouraging active participation, social cohesion, and renewable energy production [11].
In the framework of the above-mentioned information, a research gap has been identified in the field of RES development for the support of cold ironing operations. There is a lack of specific data for the power demand that is necessary for such operations and -to this point- studies have not provided monitoring data that would allow such calculations. The scope of this study is the utilization of real monitoring data from the port of Lesvos in order to assess the power demand of a potential cold ironing application. On a second level, this study aims to analyze the deployment of a wind power park for covering the energy requirements of an electric port and assess the reduction of CO2 emissions.
2. Materials and Methods
Available data from shipping routes
The accounting of shipping routes to and from Mytilene was implemented by utilizing the database of Marine Traffic S.A. This database played a crucial role in providing comprehensive information, including the number of arrivals per ship, Deadweight Tonnage (DWT), draught, distance traveled, and ship types. Additionally, publicly available data was used in this study to identify the engines employed by each shipping vessel. The data depicted in Figure 1 showcases the arrivals at the Mytilene port categorized by Deadweight tonnage (DWT). Passenger ships, specifically those with a DWT of 6148, represent a notable portion, with 36 arrivals recorded in June. Smaller passenger vessels operating on short sea international routes, within the range of 50 to 180 DWT, contribute to a total of 151 arrivals, predominantly servicing the MJT-AYK international route. Other passenger ships with relatively higher DWT, such as those measuring 3348 DWT (28 arrivals) and 7622 DWT (31 arrivals) in June 2019, also play a substantial role in the overall arrival figures. Passenger ships dominate the total arrivals, accounting for 42.4%, followed by Ro-Ro/Passenger vessels at 33.9%, and Ro-Ro Cargo ships at approximately 3.5% of the total arrivals. These three categories, operating on regular schedules, collectively constitute around 80% of the arrivals. Additionally, there are other vessels engaged in vital supply services, including the transportation of heavy fuel oil and cement to the island. It is worth noting that Figure 1 excludes military vessels and other non-scheduled shipping practices that could impact the total arrival count.
The calculation of the in-port utilized energy per ship relied on the number of arrivals, the hoteling time and the engine type of the ships. The nominal engine power of each shipping vessel was adjusted using data from Table 1 and Table 2. It’s important to note that main engines are minimally utilized during hoteling, operating only 5% of the time. Although some studies advocate for a 0% usage during hoteling, this study adopts the values from the EMEP/EEA report while recognizing the validity of the alternative argument [12]. Table 1 was employed in order to convert the nominal power of engines for each ship into adjusted values corresponding to specific actions such as cruising, maneuvering, and hoteling. To offer numerical insights while maintaining the anonymity of the shipping vessels, it can be noted that Passenger ships have an average main engine power of 7668 KW, Ro-Ro Cargo ships have an average main engine power of 11600 KW, and small (short sea) Passenger ships have an average main engine power of 1300 KW. The auxiliary engine output power ranges from 27% to 39% of the main engine output power for each case. The power output and operation hours values are adjusted for each action in alignment with the information in Table 1.
Table 2 provides the time required for various actions, with a focus on data from the summer (June 2019), accounting for reduced hoteling-idling times. During winter, hoteling-idling times range from 14-15 hours for Passenger and Ro-Ro Cargo ships, but during summer, they are reduced to approximately 6 hours, coinciding with a significant increase in arrival frequency. Maneuvering times remain consistent throughout the year but only the hoteling/ idling times play a crucial role in calculating the in-port energy demand [13].
By utilizing the above-mentioned data, this study will present the power of the main and auxiliary engines of the ships that have hoteling-idling times in the port of Mytilene. One main scope of the study is the calculation of the power demand for supporting the in-port activities in order to present an electrification scenario that could be partially supported by renewable energy technologies in the framework of green transition.
For Ht as hoteling time, Ep as engine power (of a given engine), % ME as main engine load factor and % AE as auxiliary engine load fact the total energy produced for the hoteling of each ship can be seen in Eq.1.
Total energy per ship: Ht × [(Ep × % ME) + (Ep × % AE)]
The total energy of all the shipping vessels is subsequently calculated and added in order for the total energy to be assessed. The average power demand is calculated by taking into account the total hoteling time of each shipping vessel and a power demand fluctuation of 80% during the day.
Methodology and software for the in-port energy demand analysis
The energy analysis utilized RETScreen, which is a free software that was launched by Canada’s Ministry of the Environment. It is developed in Microsoft Excel environment, and is designed (among other uses) for assessing energy production from potential projects involving renewable energy sources. RETScreen not only provides information about emissions but also evaluates the economics and risk associated with specific projects [14]. This tool is valuable for decision-making, assessing the feasibility of future renewable energy projects, and identifying additional solutions for profitable energy production. The energy analysis component evaluates the generated energy from the proposed energy system. The cost analysis estimates the initial and annual costs for the project. The emission analysis assesses the reduction in greenhouse gas emissions resulting from the development of renewable energy sources. Lastly, the financial analysis calculates the net present value of the project, offering insights into its overall economic sustainability.
In this framework this study considers the development of a 20 MW wind park that can electrify the in-port operations of Mytilene port. Figure 2 utilizes the real average wind data of Lesvos island as it has been presented by the publicly available data provided by HEDNO S.A., i.e. the Hellenic Electricity Distribution Network Operator [15]. The average wind speed data of the existing operating wind parks is accounted as a baseline for our analysis. ON the one hand the exact geolocation for the installation of the wind park exceeds the scope of this study, and on the other hand it cannot be assumed that any new installations will be vastly different that the already operating ones.
Table 3 presents the characteristics of the wind turbine ENERCON - 48 - 76m that has been selected as the Wind turbine that could potentially be installed in the framework of this analysis. The design and operational characteristics have been extracted by the product database of the software RETSCREEN. The software also has incorporated the Power curve of the wind turbine, and the wind fluctuation has been calculated by means of a Weibull distribution, with the default setting of the Weibull K factor at 2. Analyzing power curve data aids in selecting suitable turbine models for specific locations, considering the prevailing wind conditions. It also facilitates the development of effective control strategies to enhance energy capture and minimize turbine stress. Ultimately, a comprehensive understanding of power curve data is fundamental for the successful integration and utilization of wind energy, contributing to sustainable and renewable power generation.
3. Results
The power requirements of both main and auxiliary engines are significant considerations for passenger shipping vessels, particularly those with extended hoteling times in the port of Mytilini. The main engines, responsible for propulsion, play a crucial role in providing the necessary power for the vessel’s movement. Simultaneously, auxiliary engines support various onboard functions during hoteling, such as maintaining lighting, air conditioning, and other essential systems. The power capacity of these engines is determined by the vessel’s size, design, and the range of amenities and services offered during hoteling. Understanding and optimizing the power of both main and auxiliary engines are key factors in ensuring the operational efficiency and passenger comfort of these vessels during their extended stays in the port of Mytilini. Figure 3 presents the nominal power of main and auxiliary engines for the passenger shipping vessels with the highest hoteling times in Mytilini port.
The energy requirements of shipping vessels constitute a pivotal element within the maritime sector, encompassing the power needs for propulsion, auxiliary systems, and various onboard functions. Shipping vessels utilize a range of energy sources, including traditional marine fuels like heavy fuel oil (HFO), marine diesel oil (MDO), liquefied natural gas (LNG), and an increasing focus on renewable energy alternatives. The energy demand in shipping is influenced by factors such as the size, type, and operational characteristics of the vessel. Larger vessels, particularly container ships and oil tankers, face substantial power demands to ensure efficient navigation and cargo handling. Ongoing technological advancements, marked by the development of more energy-efficient engines, hybrid propulsion systems, and exploration into alternative fuels, are crucial in addressing the continually evolving energy needs of the industry. With the maritime sector aiming to align with environmental sustainability objectives, there is a growing emphasis on improving energy efficiency, reducing emissions, and transitioning towards cleaner and more sustainable energy solutions for shipping operations. By using the equation 1, Figure 4 the total energy demand for main and auxiliary engines for the passenger shipping vessels with the highest hoteling times in Mytilini port. The total energy demand for the month of June (2019) for all shipping vessels in the port of Mytilini has been calculated to be 6118 MWh with an average power demand of 8.2 MW.
The power curve data represents the relationship between the wind speed and the electrical power output generated by a wind turbine. Typically, the power output increases with rising wind speeds, reaching a peak at the turbine’s rated capacity. Beyond this point, the turbine operates at its maximum output. Table 4 shows the power and energy curve data of a simulated 20 MW wind park at Lesvos island, and follows exactly the previously described pattern, with the wind turbines not producing any energy for wind speeds lower than 3 m/s and higher than 15 m/s. Each turbine has a simulated gross energy production of 3481 MWh with a specific yield of 1810 kWh/m2.
According to the simulation analysis the electricity delivered annually to the port equals to 72080 MWh, while a significant part of electricity remains unutilized and is exported to grid. This amount equals to 14956 MWh annually and the projected monthly fluctuation is presented in Figure 5.
It should be highlighted that due to the fluctuations in demand, the in-port activities require and additional amount of 924 MWh that has to be provided by the main electrical grid. This result shows that although the net balance of the electricity that is required can be covered from the operation of the proposed wind park, other actions need to be implemented to support the gradual transition to a 100% RES covered operations. These practices could include energy storage and demand – response practices, which in the case of ports would entail the adjustment of the incoming and outcoming shipping routes in order not to increase the power demand beyond specific limits. Therefore, this study suggests that future work cold ironing designs should be done with cooperative between the shipping route designers and the energy planners. Additionally, national policies on energy storage, hydrogen production and net metering legislation will vastly influence the success of cold ironing practices.
4. Discussion
In response to environmental concerns, many nations have implemented stringent laws regulating ship emissions in ports. The International Maritime Organization (IMO), through regulations like MARPOL Annex VI, imposes strict limits on sulfur and nitrogen oxide emissions in designated areas. Cold ironing, connecting ships to onshore electrical grids during port stays, has emerged as an effective solution for compliance. This practice eliminates hazardous pollutant emissions, meeting environmental standards and avoiding fines. Cold ironing not only addresses environmental issues but also provides energy efficiency, noise reduction, and regulatory compliance. By significantly reducing air pollutants and greenhouse gas emissions, this approach enhances local air quality. Ship operators benefit from lower fuel costs, making cold ironing financially attractive, and reduced noise pollution fosters better relations with port communities. In summary, cold ironing reflects the maritime industry’s commitment to sustainability and a greener future [16]. The widespread adoption of cold ironing necessitates substantial investments in global port infrastructure. Ports worldwide are actively enhancing cold ironing capacity, developing essential infrastructure and electrical connections to accommodate a larger segment of the maritime industry. Infrastructural development is crucial for fully maximizing the benefits of cold ironing and influencing the overall environmental footprint of the industry. As vital nodes in global trade, ports are expanding infrastructure, including electrical distribution systems, dock renovations, and standardized connectors, to ensure compatibility across various vessel types. Continuous investments are making it increasingly feasible for ships of all sizes to connect to the electrical grid while docked, aligning the maritime sector with international sustainability standards. Ongoing technological advancements, focusing on effectiveness and user-friendliness, contribute to the promising future of cold ironing. Innovations such as wireless charging technologies simplify the connection process, while automation, including automated plug-in systems, streamlines docking and interaction with the electrical grid, making cold ironing more appealing for busy ports and expedited shipping operations. These technological developments are expected to accelerate the industry’s adoption of cold ironing as they become more convenient and economically viable for ship operators [17].
The maritime industry’s dedication to reducing its carbon footprint propels continuous research and development efforts to integrate renewable energy sources into cold ironing systems. Solutions involving solar, wind, and battery storage provide eco-friendly and sustainable energy options for ships in port. Utilizing solar energy from port infrastructure and strategically placed wind turbines, ships at anchor can reduce reliance on traditional grid electricity, minimizing the environmental impact of cold ironing. Battery storage solutions ensure continuous access to shore power, enhancing system reliability even during periods of low renewable energy generation. Integration of these alternative energy sources brings the maritime sector closer to achieving a greener and more sustainable future. Ongoing research contributes to transforming sustainability initiatives, making cold ironing accessible to a broader range of vessels. Technological innovations, such as automated plug-in procedures and wireless charging systems, enhance usability and appeal for ship owners. The inclusion of sustainable energy aligns with global efforts to combat climate change, diminishing the industry’s carbon impact. As these efforts progress, cold ironing is poised to play a central role in the maritime industry’s journey towards sustainability, shaping a cleaner and more environmentally responsible future for global shipping [18].
The concept of smart ports, integrating automation, data analytics, and modern technology for operational efficiency, aligns seamlessly with cold ironing. Smart ports, utilizing technology to streamline logistics and cargo handling, can enhance the precision of connecting vessels to the electrical grid through automation and data-driven decision-making, minimizing energy waste and reducing costs. Modern sensors and monitoring systems further enhance security and reliability, ensuring the long-term viability of cold ironing. Integrating cold ironing into smart ports aligns ship-to-port interactions with ecological benefits, promoting a holistic approach to sustainable marine operations that combines efficiency, security, and environmental responsibility. In conclusion, the future of cold ironing will significantly impact the sustainability of the maritime sector. Global standardization ensures widespread and uniform application of this technology. Incentive schemes from governments and international organizations provide financial advantages to encourage the adoption of cold ironing. Collaboration and education involving relevant stakeholders foster awareness, understanding, and effective implementation. Ultimately, incorporating cold ironing into smart ports represents a comprehensive approach to sustainable maritime practices, enhancing environmental responsibility, efficiency, and safety. These advancements could lead to widespread adoption and significantly reduce the environmental impact of the maritime sector in the future [19].
Globalization plays a pivotal role in standardizing cold ironing practices across the maritime sector, ensuring efficiency and uniformity. Initiatives led by organizations like the International Maritime Organization (IMO) establish protocols, safety norms, and technical standards for seamless electrical grid connections at ports worldwide. This framework simplifies adoption, addressing compatibility issues and regulatory complexities that could hinder widespread use. The international nature of the marine sector benefits from universal technological standards and common procedures, facilitating the implementation of cold ironing as a widely accepted solution. Governments and international organizations further expedite adoption through incentive schemes, offering financial benefits, tax exemptions, or reduced port charges for ships using shore electricity. These incentives not only overcome financial obstacles but also align with broader environmental goals, showcasing the industry’s commitment to mitigating its environmental impact and potentially accelerating the adoption of cold ironing techniques. Successful incorporation of cold ironing into the maritime industry relies on collaboration among stakeholders, including technology suppliers, port authorities, and ship operators. This collaborative effort is crucial for identifying obstacles, sharing best practices, and advocating for sustainable technologies. Educational programs play a key role in increasing awareness of the economic and environmental benefits of cold ironing, addressing misconceptions, garnering support, and ensuring the effective and safe operation of cold ironing systems by ship crews and port workers [20].
Author Contributions
Conceptualization, A.K. and S.V.; methodology, A.K., A.D. and S.V.; software, A.D. and S.V.; validation, A.K., A.D. and S.V.; formal analysis, A.K. and S.V.; investigation, A.K. and S.V.; resources D.L. and S.V.; data curation, A.K., D.L. and S.V.; writing—original draft preparation, S.V.; writing—review and editing, S.V.; visualization, A.K., A.D. and S.V.; supervision, S.V.; project administration, S.V.;.
Funding
This research received no external funding
Data Availability Statement
The data are unavailable due to privacy restrictions.
Acknowledgments
The authors would like to thank cordially the company Marine Traffic S.A. for providing the data that supported the analysis of this study.
Conflicts of Interest
The authors declare no conflict of interest.
References
- International Maritime Organization. (2022). IMO: Fuel oil consumption data collection system enters into force. Retrieved from https://www.imo.org/en/MediaCentre/PressBriefings/Pages/33-GHG-datacollection.aspx.
- European Maritime Safety Agency. (2022). Cold ironing - Alternative Maritime Power (AMP). Retrieved from https://www.emsa.europa.eu/operations/maritime-security/cold-ironing-alternative-maritime-power.html.
- European Maritime Safety Agency. (2022). Use of Cold Ironing and electrical connection for ships at berth. Retrieved from https://www.emsa.europa.eu/operations/maritime-safety/use-of-cold-ironing.html.
- The European Environment Agency. (2022). Cleaner fuels and energy sources for ships can lower environmental risks. Retrieved from https://www.eea.europa.eu/signals/signals-2017-content-list/cleaner-fuels-and-energy-sources.
- Katsaprakakis, D. A. , Proka, A., Zafirakis, D., Damasiotis, M., Kotsampopoulos, P., Hatziargyriou, N., Dakanali, E., Arnaoutakis, G., and Xevgenos. D., 2022. “Greek Islands’ Energy Transition: From Lighthouse Projects to the Emergence of Energy Communities.” Energies 15 (16): 5996. [CrossRef]
- Genave, A., Blancard, S., and Garabedian, S. 2020. “An Assessment of Energy Vulnerability in Small Island Developing States’. Ecological Economics 171 (May): 106595. [CrossRef]
- Carrasco, J.M., L.G. Franquelo, J.T. Bialasiewicz, E. Galvan, R.C. PortilloGuisado, M.A.M. Prats, J.I. Leon, and N. Moreno-Alfonso. 2006. “Power-Electronic Systems for the Grid Integration of Renewable Energy Sources: A Survey.” IEEE Transactions on Industrial Electronics 53 (4): 1002–16. [CrossRef]
- Katsoulakos, N. 2019. “An Overview of the Greek Islands’ Autonomous Electrical Systems: Proposals for a Sustainable Energy Future.” Smart Grid and Renewable Energy 10 (January): 55–82. [CrossRef]
- G. Altiparmaki, M. A. Vasileiadou, S. Vakalis. The effect of excess water on the hydrothermal carbonization of anise waste from ouzo production on Lesvos island. Sustainable Chemistry and Pharmacy 29, 2022, 100831. [CrossRef]
- M. A. Vasileiadou, G. Altiparmaki, K. Moustakas, S. Vakalis (2022). Quality of Hydrochar from Wine Sludge under Variable Conditions of Hydrothermal Carbonization: The Case of Lesvos Island. Energies 15(10), 3574. [CrossRef]
- A. Barney, H. Polatidis, S. Vakalis, D. Grondin, M. Benne, F. Sainz Salces, D. Haralambopoulos. (2023). Energy transition awareness: Can it guide local transition planning on islands? Heliyon, Volume 9, Issue 9, e19960. [CrossRef]
- EMEP/EEA, (2016). ‘Air Pollutant Emission Inventory Guidebook. EEA’. Technical report No 21/2016.
- Tzannatos E., (2010), ‘Ship emissions and their externalities for the port of Piraeus – Greece’, Atmospheric Environment, 44, 400-407.
- Moya, D., Paredes, J., Kaparaju, P. (2018). Technical, financial, economic and environmental pre-feasibility study of geothermal power plants by RETScreen – Ecuador's case study. Renew Sust Energ Rev 92, 628-637. [CrossRef]
- HEDNO (2023). Report: Issuance of Power Generation Informative Report for the non-Interconnected Islands. Retrieved online (25 October 2023): https://deddie.gr/en/kentro-enhmerwsis/nea-anakoinwseis/miniaia-deltia-ape-december-2022/.
- American Association of Port Authorities. (2022). Ports and Harbors: Cold Ironing, Shoreside Power, Alternative Maritime Power (AMP). Retrieved from https://www.aapa-ports.org/advocating/programs-and-priorities/environment/shore-power/.
- European Maritime Safety Agency. (2022). Cold ironing - Alternative Maritime Power (AMP). Retrieved (23/09/2023) from: https://www.emsa.europa.eu/operations/maritime-security/cold-ironing-alternative-maritime-power.html.
- Port of Los Angeles. (2022). Shore Power. Retrieved online (20th October 2023) from: https://www.portoflosangeles.org/environment/shore-power.
- American Association of Port Authorities. (2022). Ports and Harbors: Cold Ironing, Shoreside Power, Alternative Maritime Power (AMP). Retrieved (11/10/2023) from: https://www.aapa-ports.org/advocating/programs-and-priorities/environment/shore-power/.
- Port of Rotterdam Authority. (2022). Shore power. Retrieved (14/10/2023) from https://www.portofrotterdam.com/en/sustainability/reducing-emissions/shore-power.
Figure 1.
Total monthly arrivals at the port of Mytilini sorted by Deadweight tonnage (DWT), with Passenger ships in green color and short-sea shipping vessels in red color,
Figure 1.
Total monthly arrivals at the port of Mytilini sorted by Deadweight tonnage (DWT), with Passenger ships in green color and short-sea shipping vessels in red color,
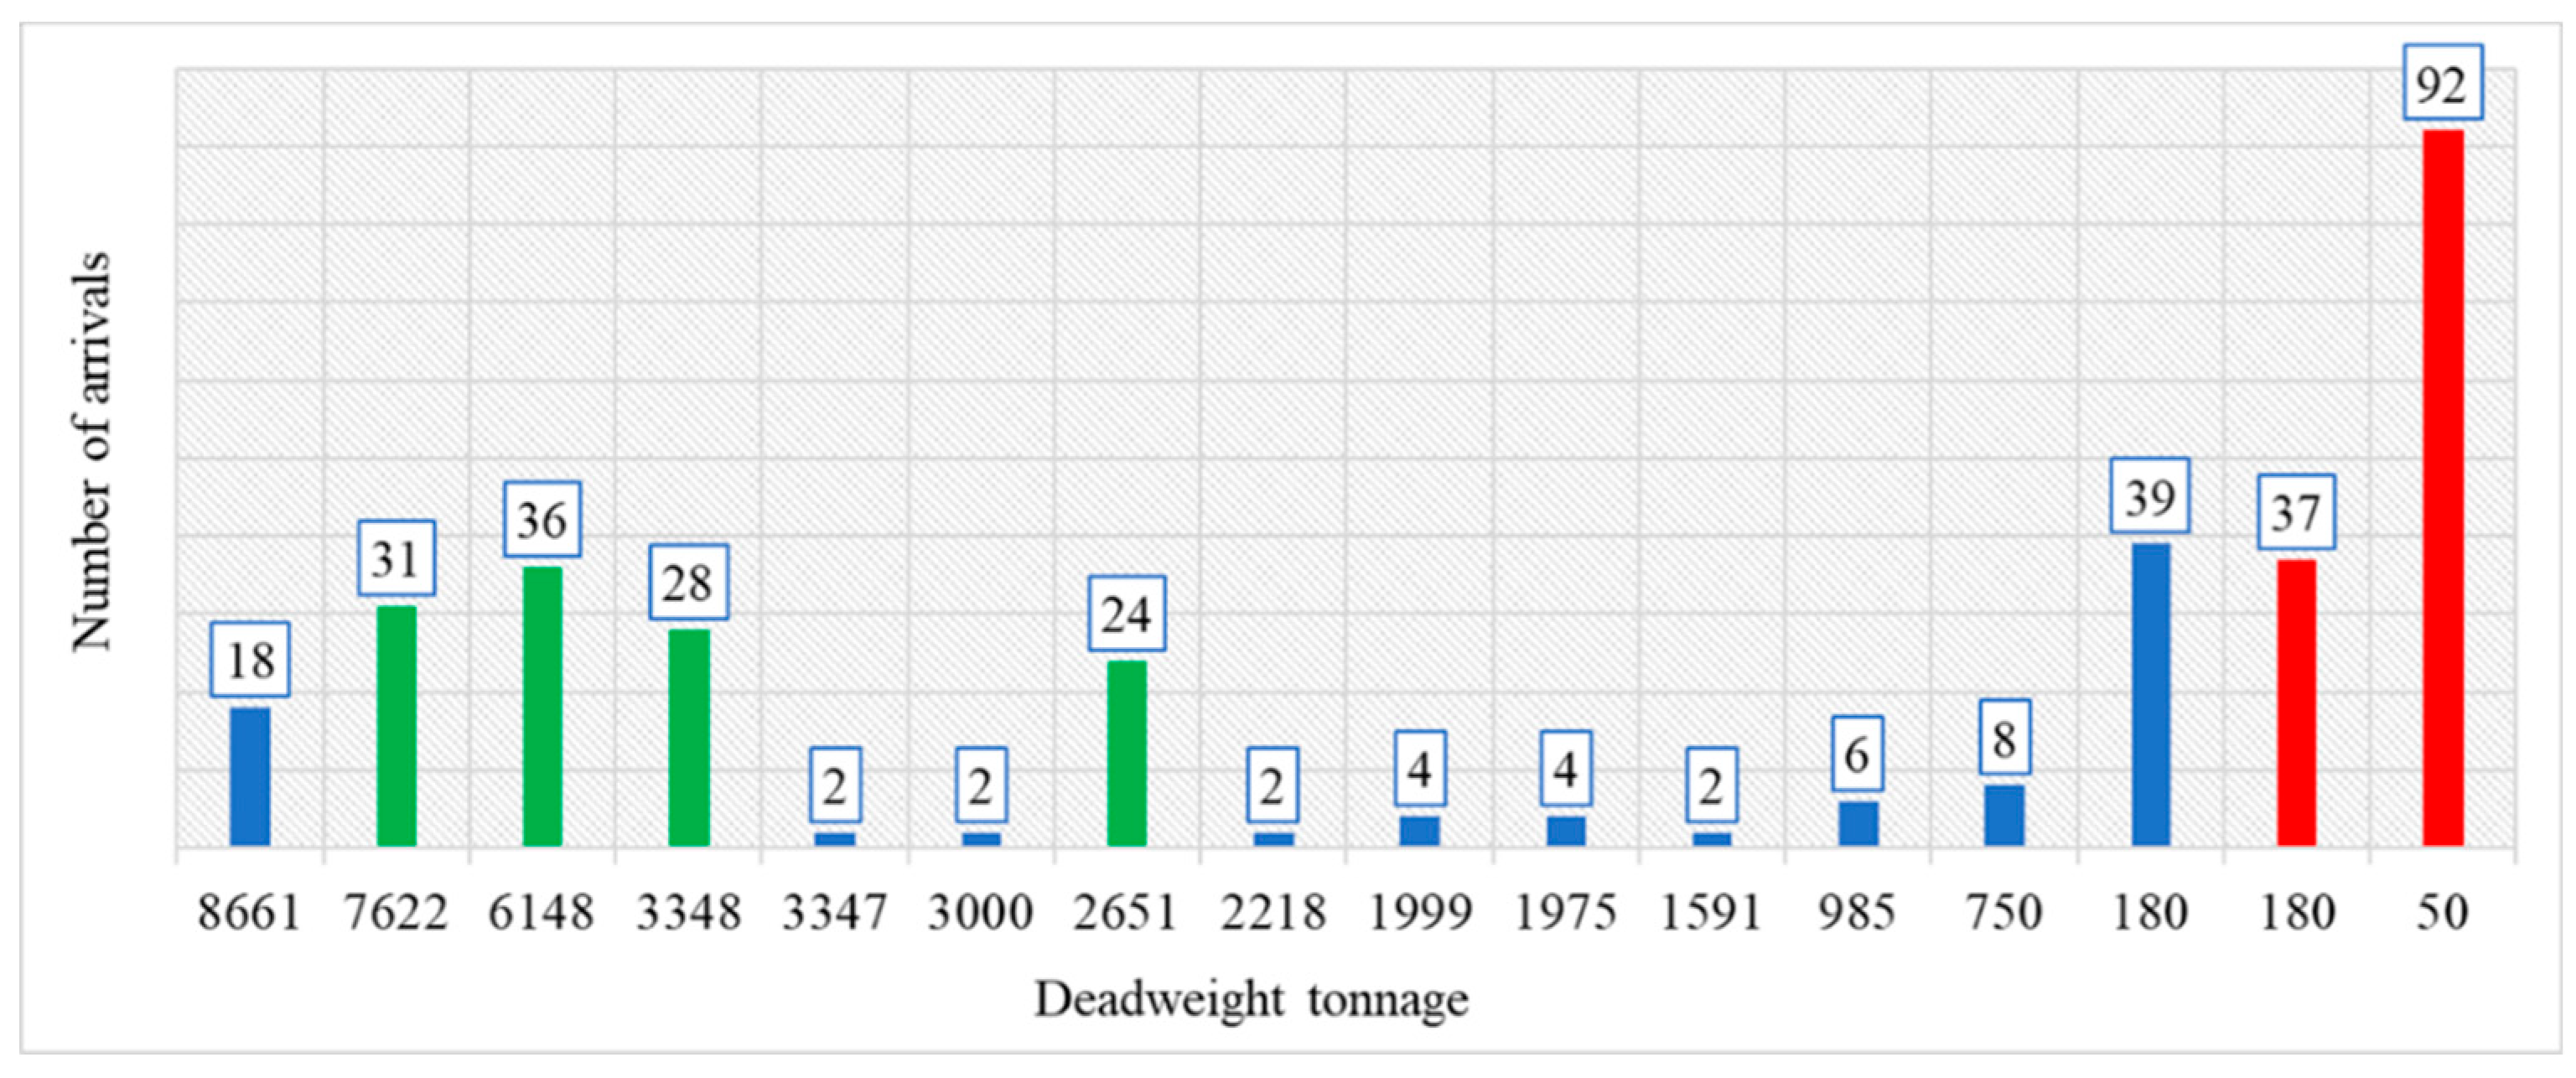
Figure 2.
Average monthly wind speed for Mytilini and the average monthly wind speed of existing wind parks on Lesvos island.
Figure 2.
Average monthly wind speed for Mytilini and the average monthly wind speed of existing wind parks on Lesvos island.
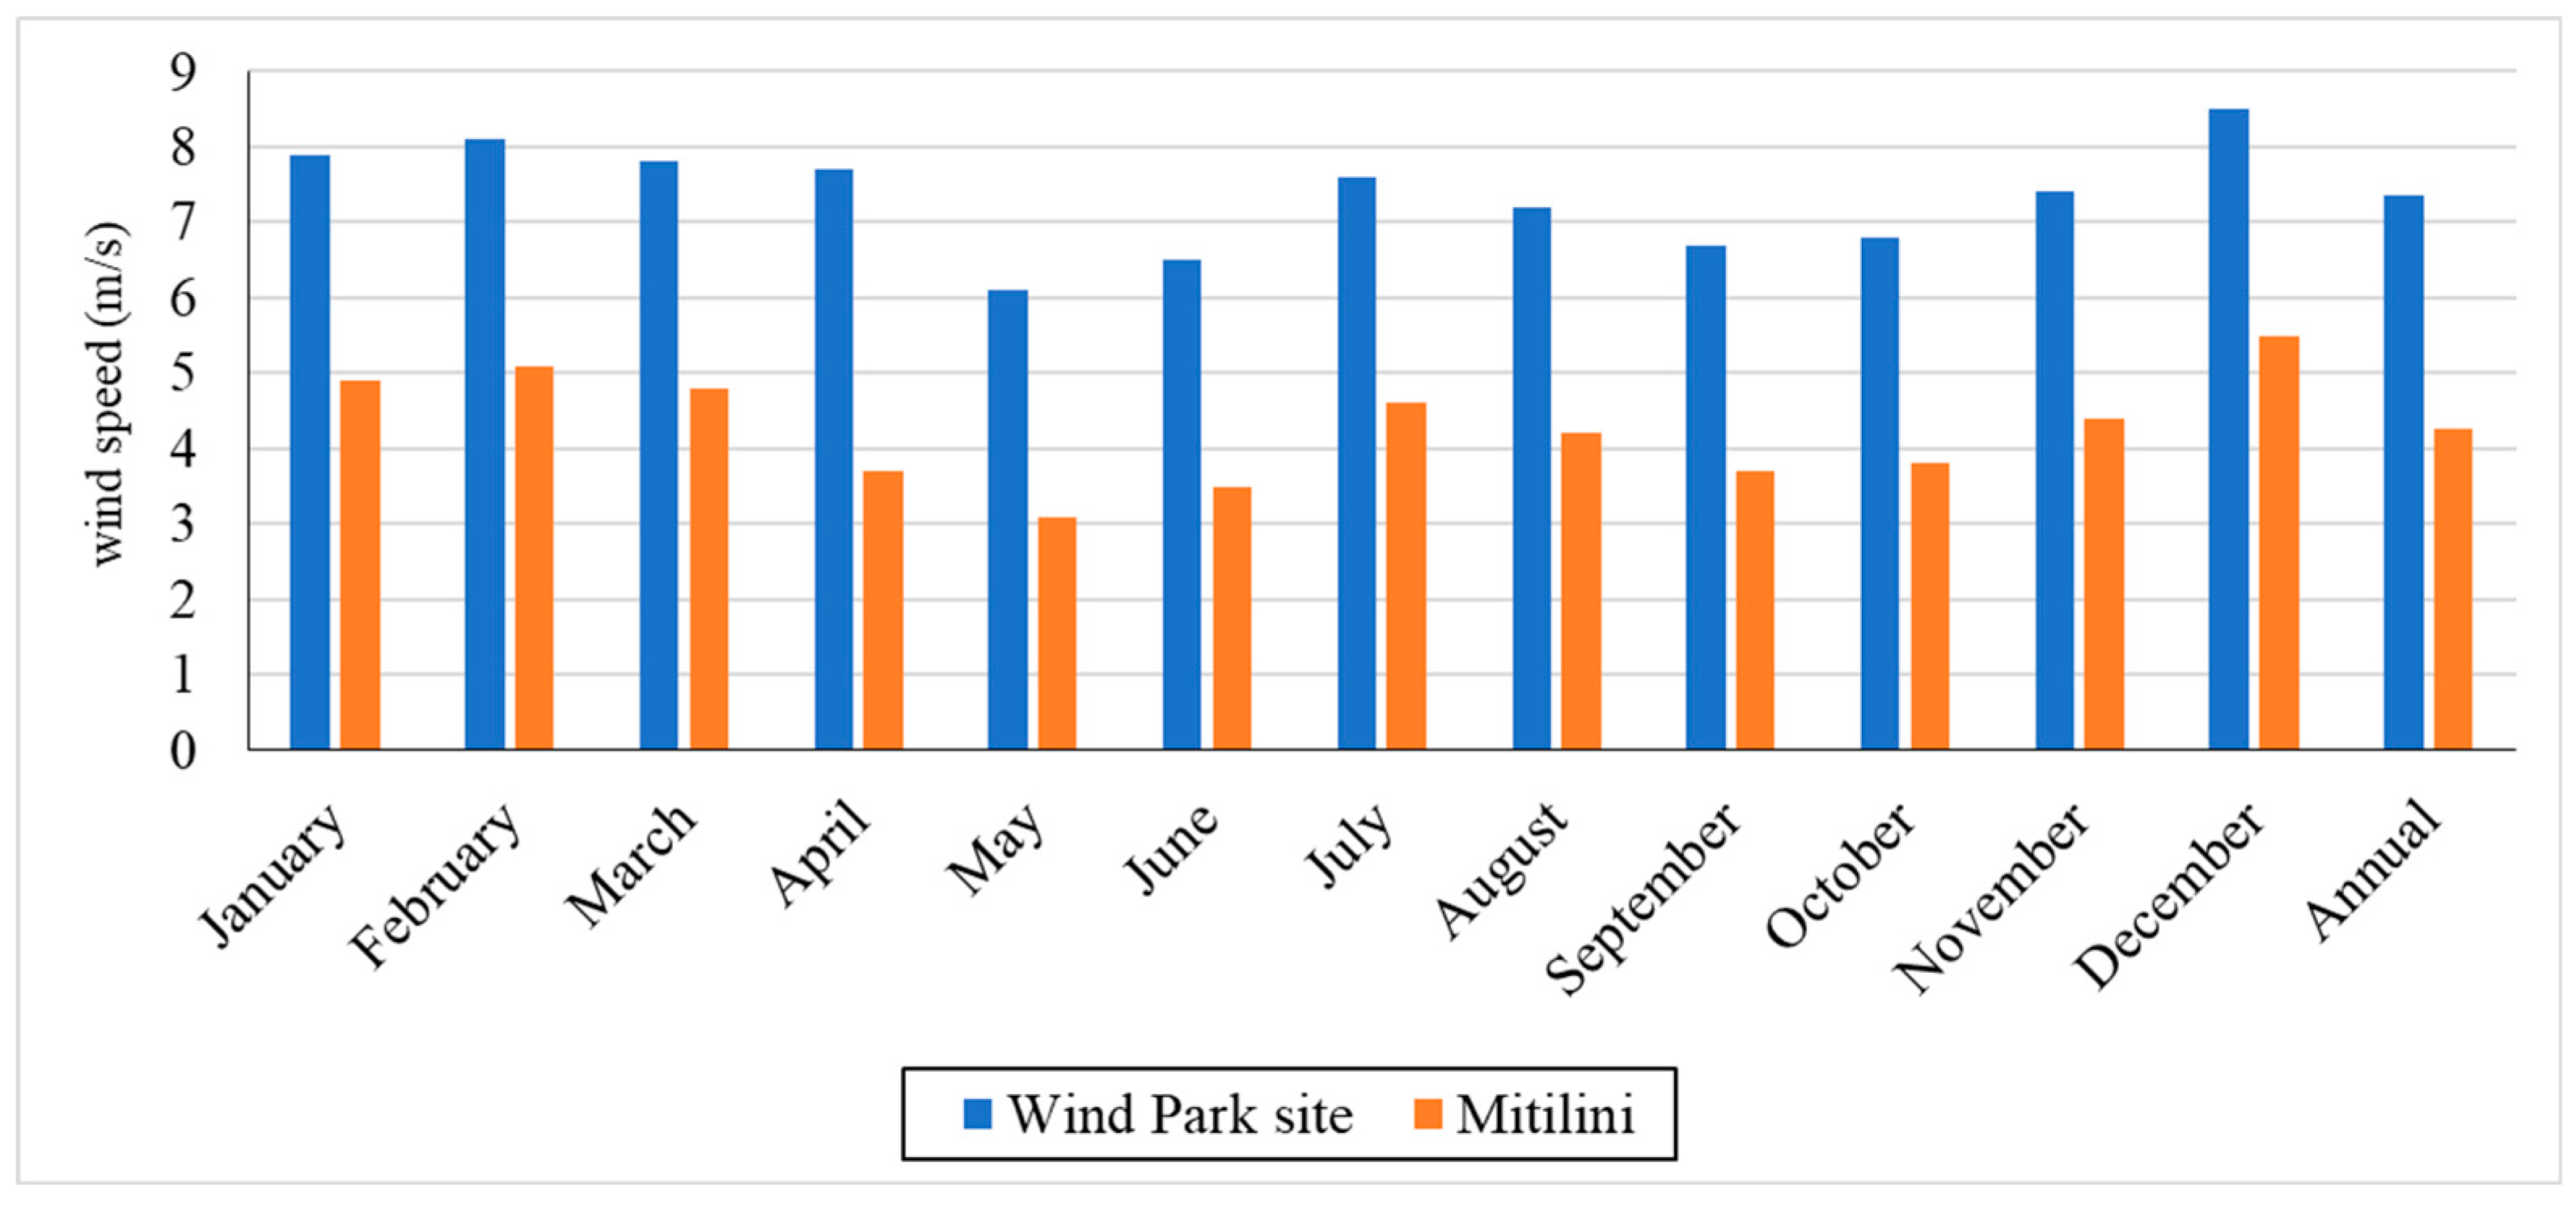
Figure 3.
Power of main and auxiliary engines for the passenger shipping vessels with the highest hoteling times in Mytilini port (June 2019)
Figure 3.
Power of main and auxiliary engines for the passenger shipping vessels with the highest hoteling times in Mytilini port (June 2019)
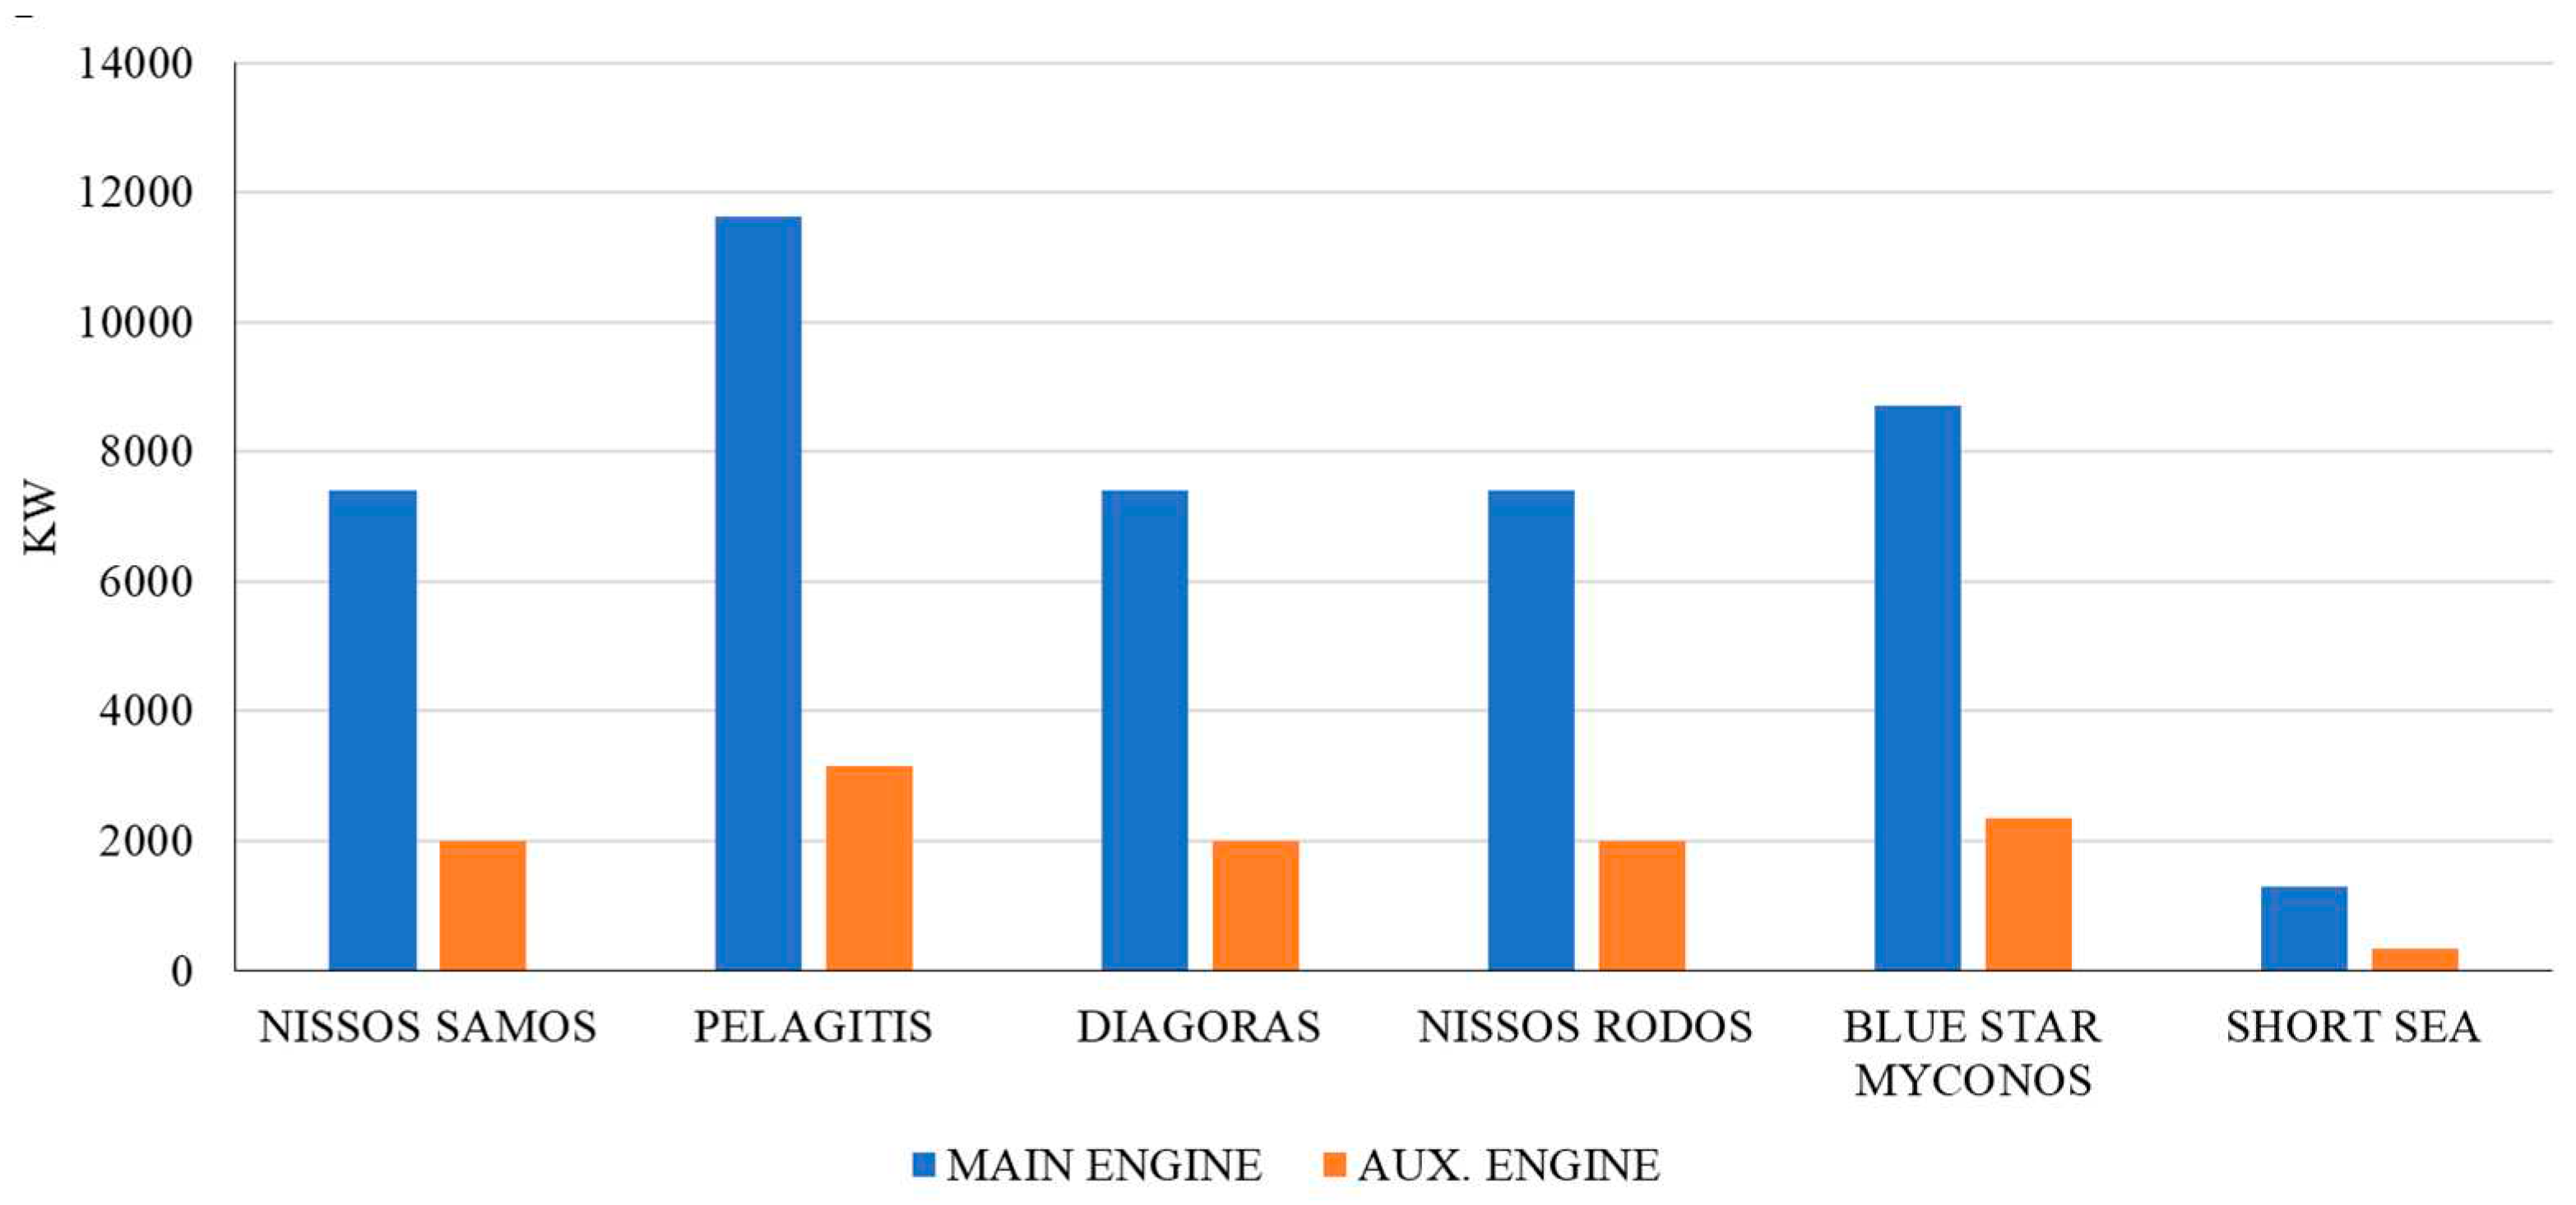
Figure 4.
The total energy demand for main and auxiliary engines for the passenger shipping vessels with the highest hoteling times in Mytilini port (June 2019)
Figure 4.
The total energy demand for main and auxiliary engines for the passenger shipping vessels with the highest hoteling times in Mytilini port (June 2019)
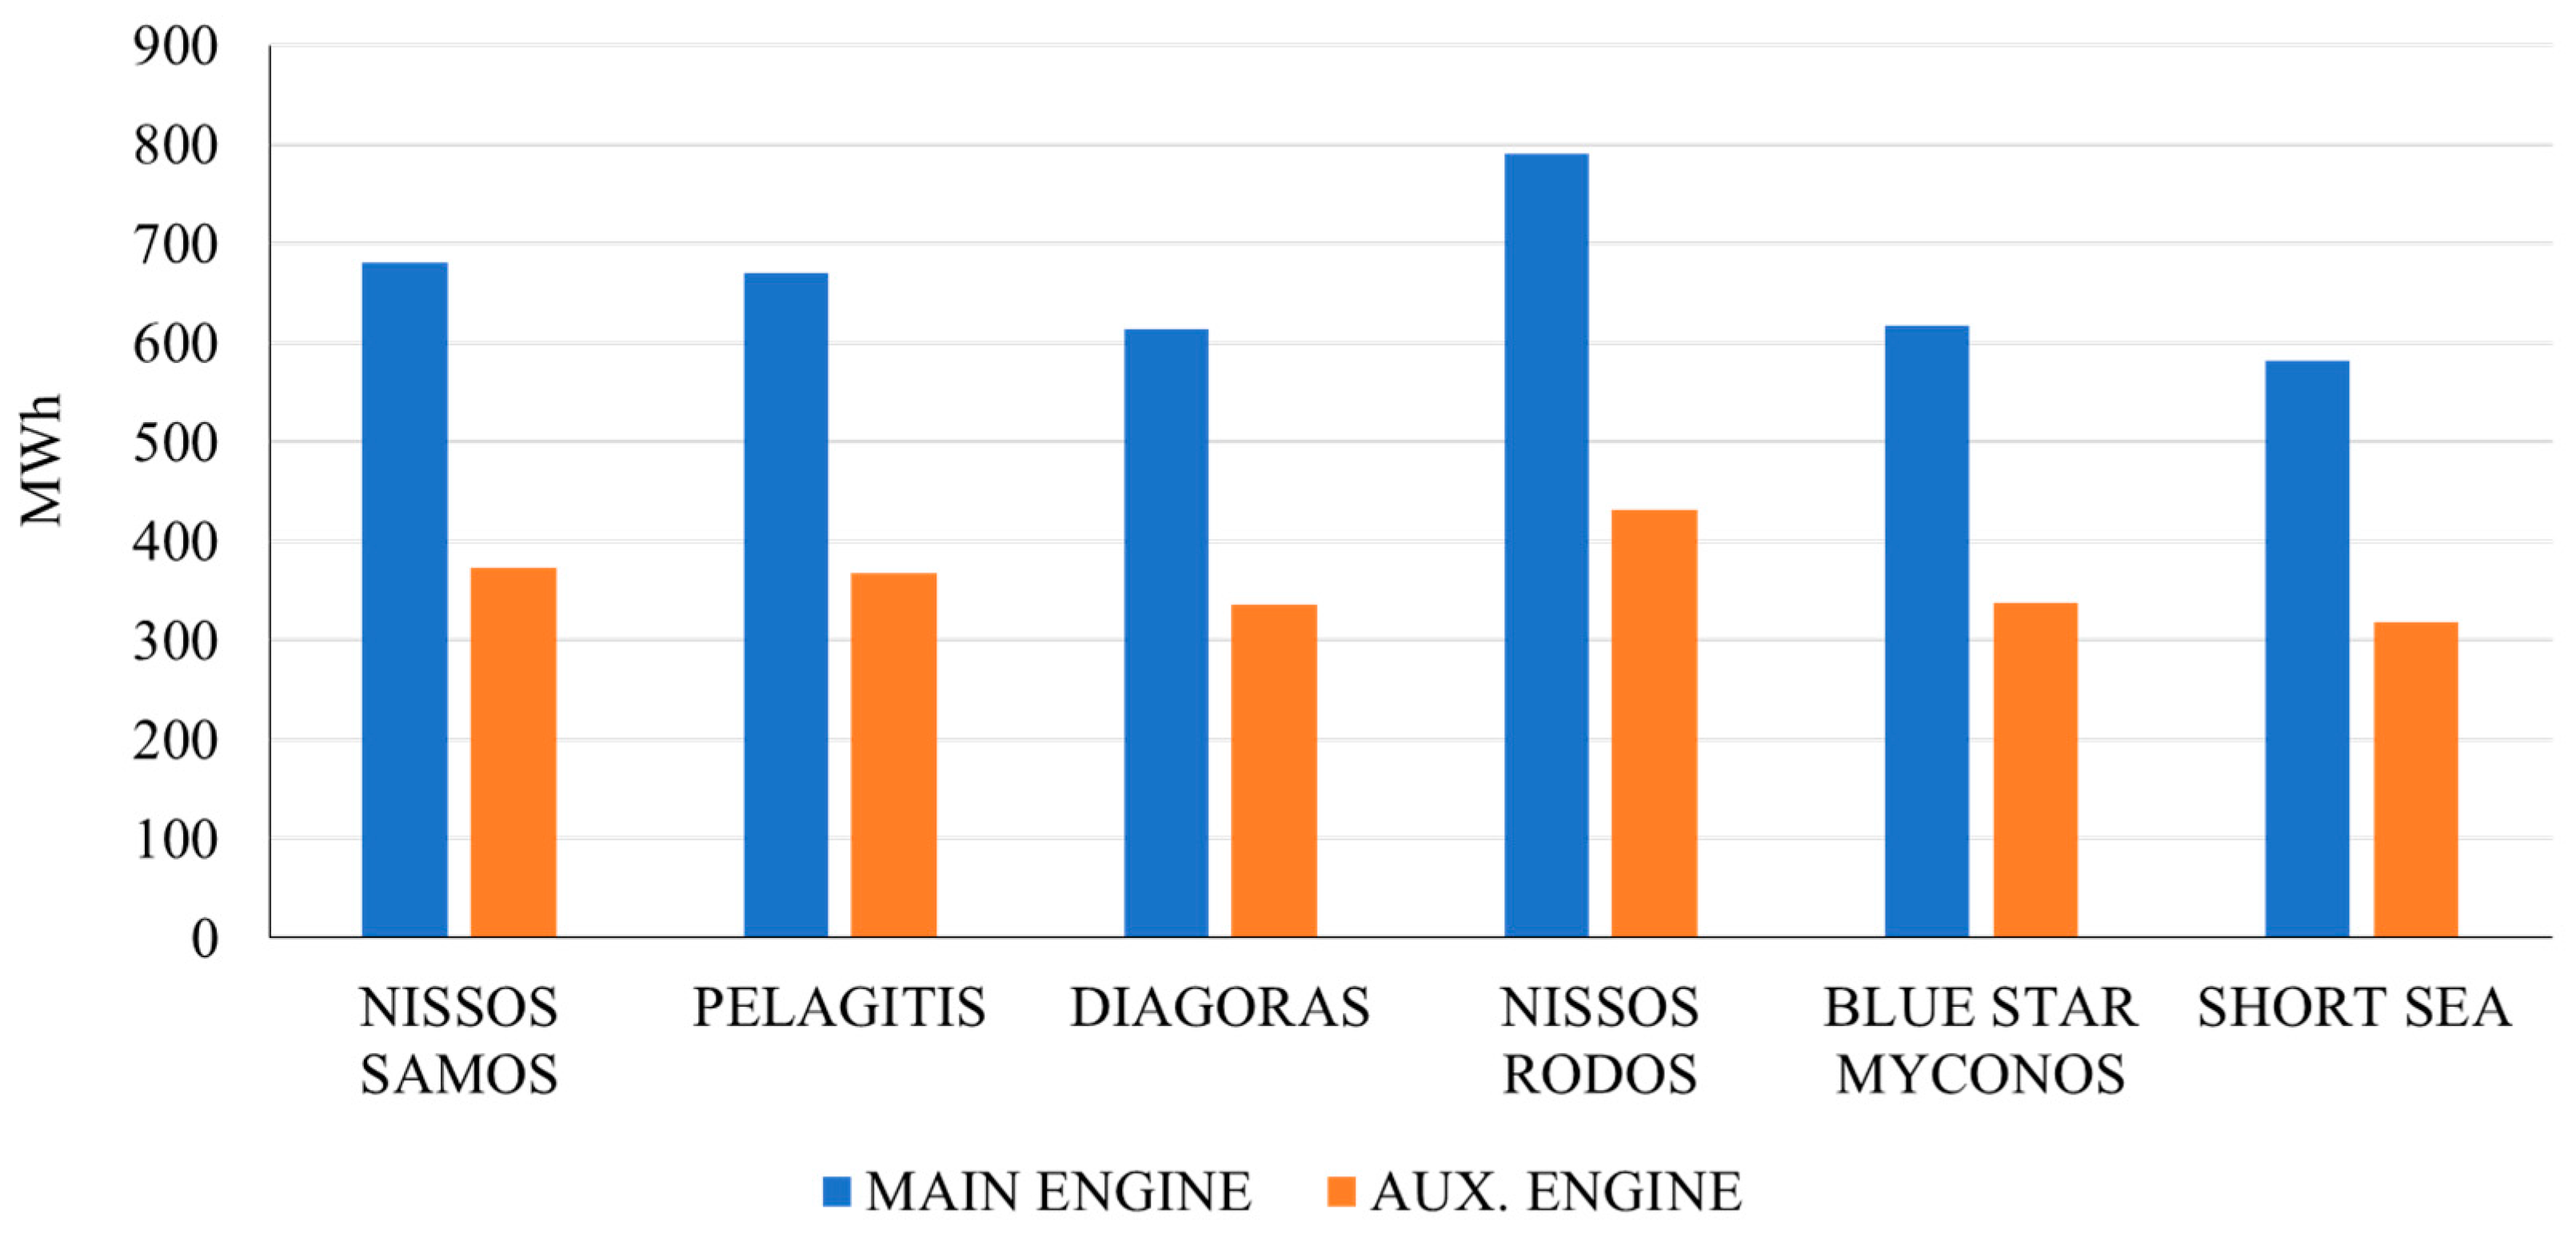
Figure 5.
Monthly excess energy produced by the simulated wind farm that is exported to the main electrical grid.
Figure 5.
Monthly excess energy produced by the simulated wind farm that is exported to the main electrical grid.
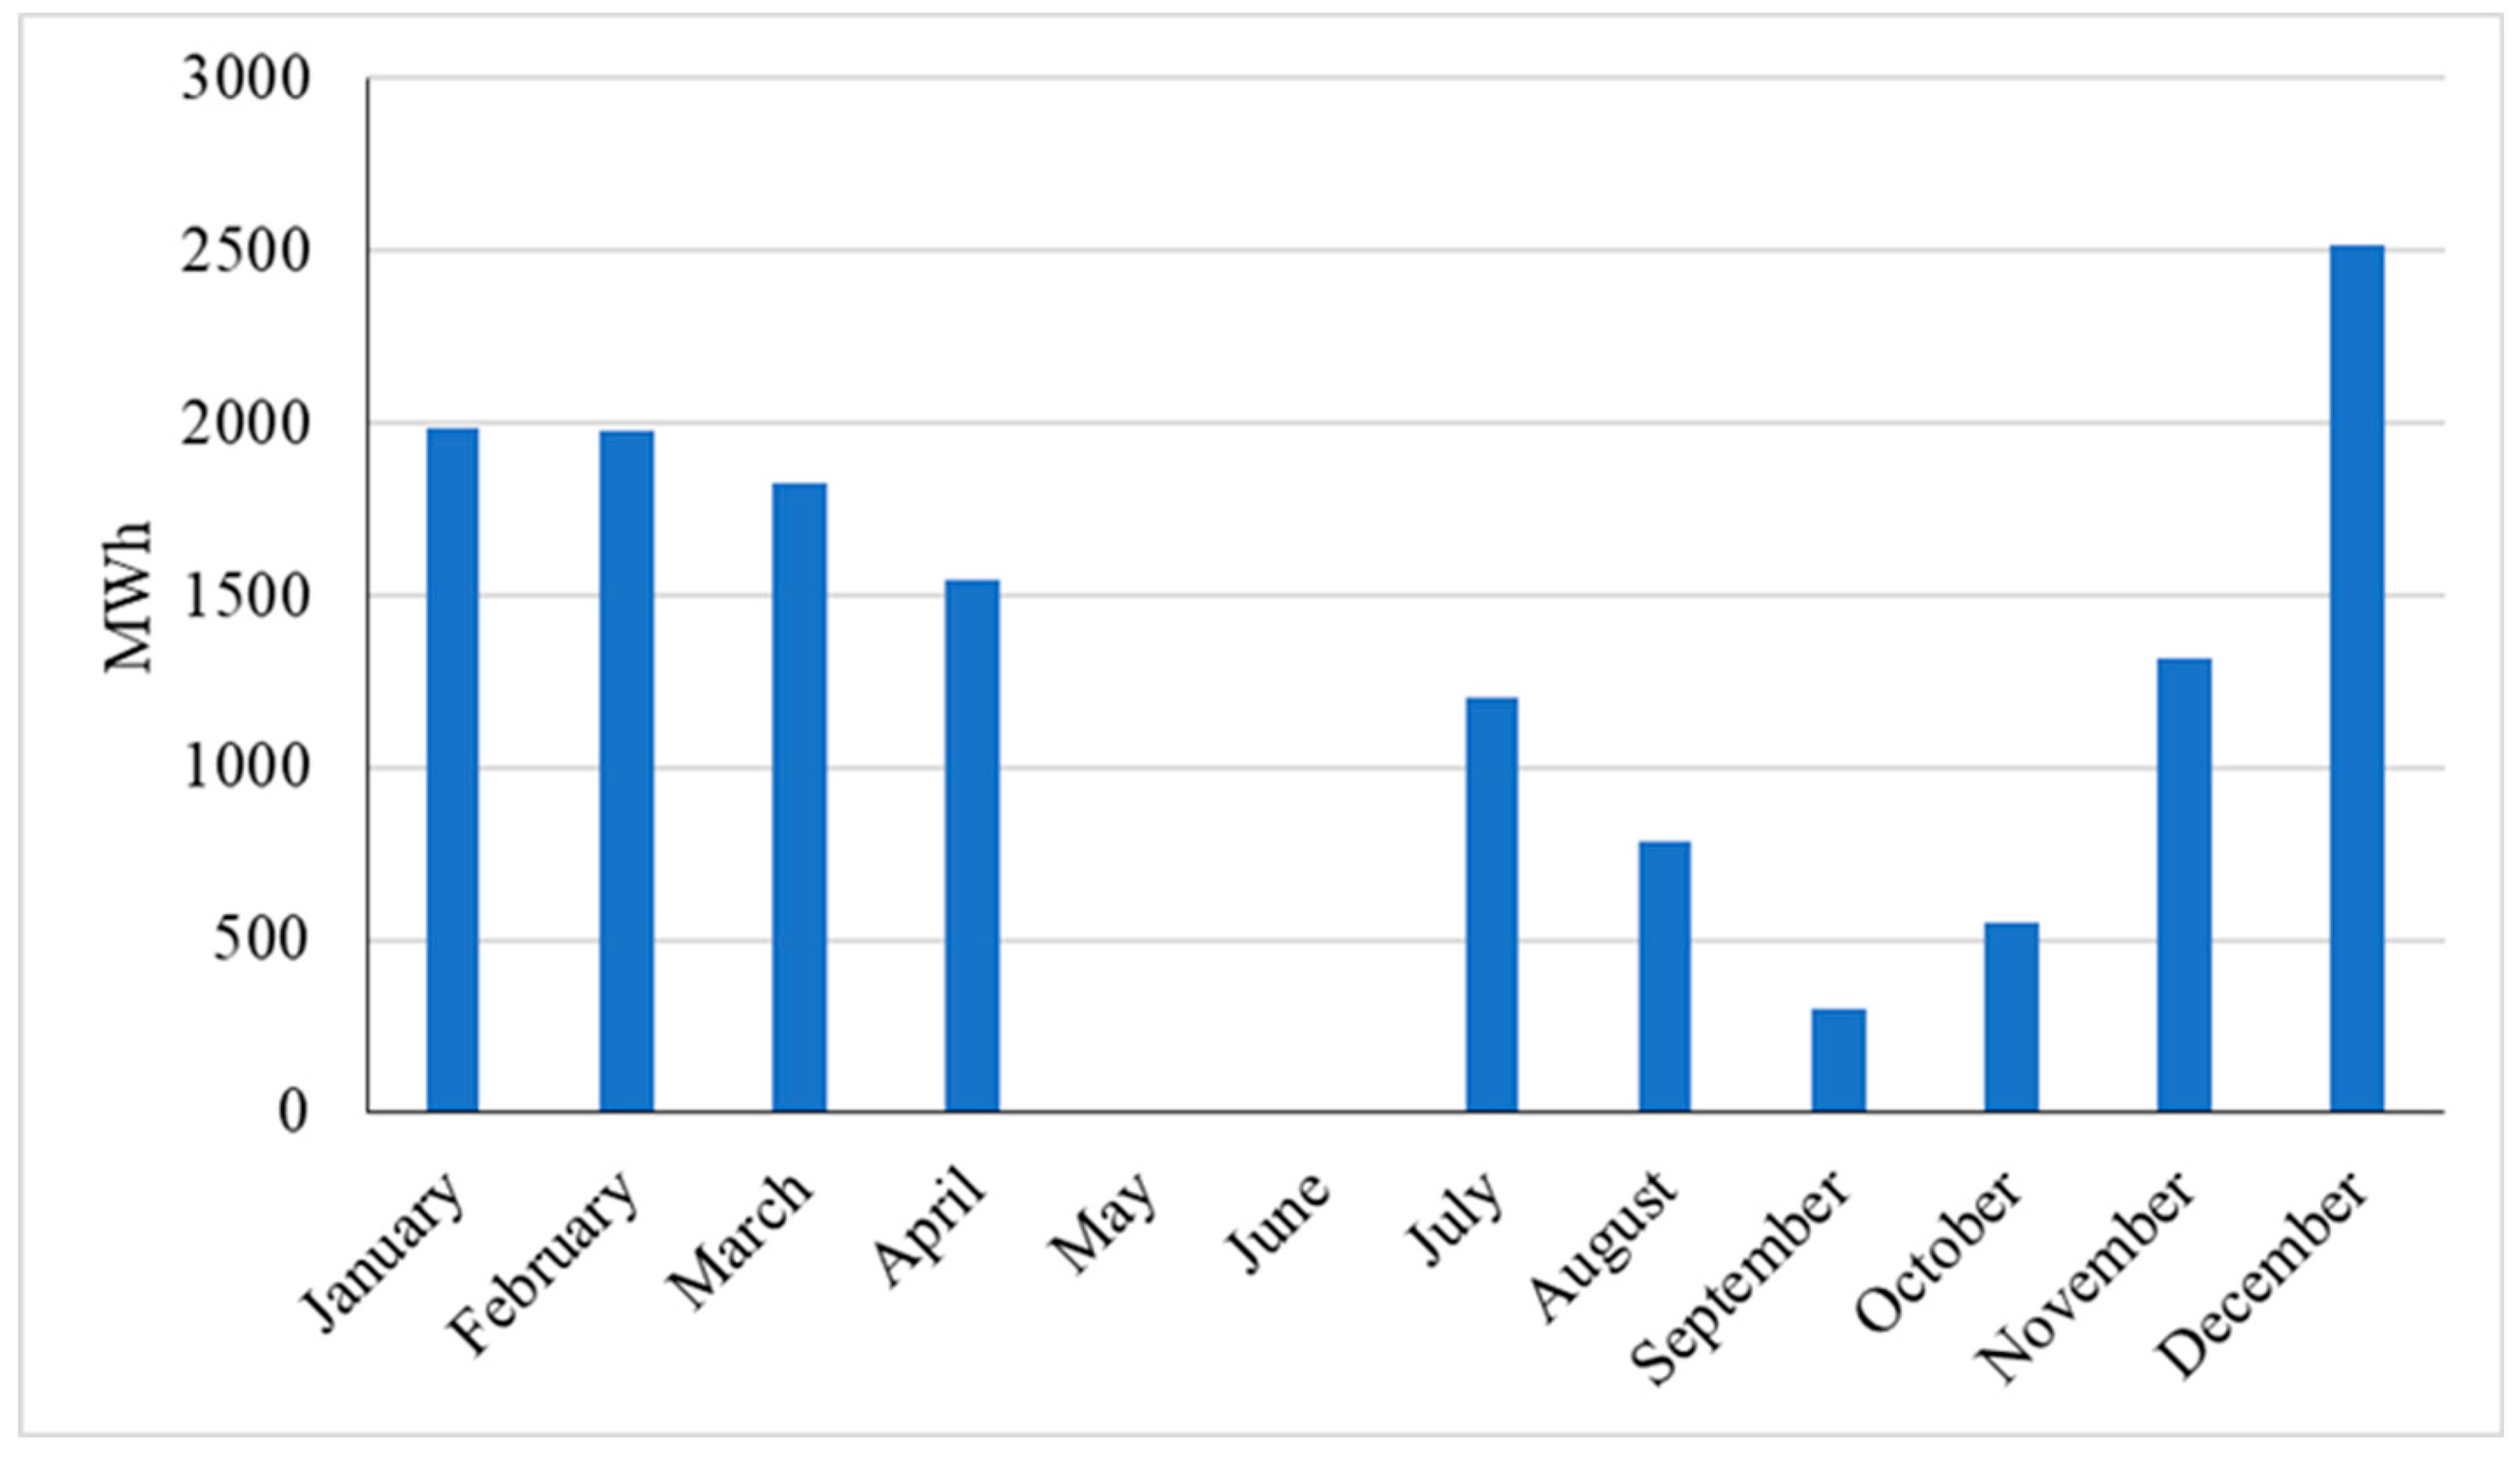

Table 1.
Percentage of engines operation (ME: Main Engine, AE: Auxiliary Engine)
| % load ME | % time ME | % load AE | |
|---|---|---|---|
| Cruise | 80 | 100 | 30 |
| Maneuvering | 20 | 100 | 50 |
| Hoteling | 20 | 5 | 40 |
Table 2.
Parameters for cruising and in-port ship activity
| Ship type | Cruise (km/h) | Maneuvering (h) | Hotelling (h) |
|---|---|---|---|
| Ro-Ro Cargo | 27 | 1 | 6 |
| Passenger | 39 | 0.8 | 6 |
| Passenger (short sea) | 25 | 0.6 | 2 |
Table 3.
Desing and operational parameters of the selected wind turbine type.
| Model | ENERCON - 48 - 76m | |
|---|---|---|
| Parameter | Unit | Value |
| Power capacity per turbine | kW | 800 |
| Number of turbines | 25 | |
| Total Power capacity | kW | 20000 |
| Hub height | m | 76 |
| Rotor diameter per turbine | m | 48 |
| Swept area per turbine | m2 | 1809.6 |
| Air temperature - annual | °C | 17.1 |
| Atmospheric pressure - annual | kPa | 99.6 |
| Wind shear exponent | 0.14 | |
| Shape factor | 2 |
Table 4.
Power and Energy curve data of a simulated 20 MW wind park at Lesvos island
| Wind speed (m/s) | Power curve data (kW) | Energy curve data (MWh) |
|---|---|---|
| 0 | 0 | - |
| 1 | 0 | - |
| 2 | 2 | - |
| 3 | 12 | 234.07 |
| 4 | 32 | 575.20 |
| 5 | 66 | 1084.68 |
| 6 | 120 | 1697.24 |
| 7 | 191 | 2330.31 |
| 8 | 284 | 2926.60 |
| 9 | 405 | 3458.51 |
| 10 | 555 | 3916.83 |
| 11 | 671 | 4299.86 |
| 12 | 750 | 4608.18 |
| 13 | 790 | 4843.49 |
| 14 | 810 | 5009.13 |
| 15 | 810 | 5110.46 |
| 15 | 0 | - |
Disclaimer/Publisher’s Note: The statements, opinions and data contained in all publications are solely those of the individual author(s) and contributor(s) and not of MDPI and/or the editor(s). MDPI and/or the editor(s) disclaim responsibility for any injury to people or property resulting from any ideas, methods, instructions or products referred to in the content. |
© 2023 by the authors. Licensee MDPI, Basel, Switzerland. This article is an open access article distributed under the terms and conditions of the Creative Commons Attribution (CC BY) license (http://creativecommons.org/licenses/by/4.0/).
Copyright: This open access article is published under a Creative Commons CC BY 4.0 license, which permit the free download, distribution, and reuse, provided that the author and preprint are cited in any reuse.


