
Submitted:
30 January 2025
Posted:
31 January 2025
You are already at the latest version
Abstract
To reduce the environmental impact of the maritime industry, international actions have been established since the adoption of the first International Convention for the Prevention of Pollution of the Sea by Oil in 1954. Among these actions is the reduction of greenhouse gases emissions from shipping, including ports. The purpose of this study is to calculate the energy consumption and carbon footprint of the Port of Sines for the period 2018-2022, considering the diversity of activities at its terminals and modes of transport, as a first step towards achieving this decarbonization. For this purpose, the calculation methodology has been based on the three scopes defined in the Greenhouse Gases Protocol. The Port of Sines is representative of Portugal's maritime industry. Presently, it has five maritime terminals and other services managed by different concessionaires. The diversity of its operations makes the calculation methodology distinctive, and by providing a detailed assessment of this calculation, it fills a knowledge and information gap related to the decarbonization of multi-terminal and multimodal maritime ports. The main conclusion of the study is that, considering 2018 as the baseline, a non-linear relationship is shown between the independent variables (number of ships and total annual cargo) and the dependent variables (total energy consumed and carbon footprint), and different consumption and emission patterns among its terminals. This indicates that the measures to achieve decarbonization should be differentiated based on the logistical efficiency and typology of each terminal.
Keywords:
Carbon footprint
; energy consumption
; maritime ports
; port of Sines
1. Introduction
Given the international nature of maritime transport, initiatives to reduce risks, improve safety, and prevent pollution are the responsibility of various countries and regions [1,2,3]. This diversity of interests promotes the coordination of efforts at a global level and the adoption of standards and practices for all the sector, including not only the activities in high seas but also those carried out in the maritime port terminal.
In 1950, the number of hydrocarbons transported by the sea was such that arises a growing concerning by the danger that this represented to marine pollution. In 1954, it was established the first International Convention for the Prevention of Pollution of the Sea by Oil (OILPOL). Later, in 1973, it was signed the International Convention for the Prevention of Pollution from Ships (MARPOL) [4], extending his scope and replacing it. However, OILPOL continues being the frame of reference for those countries that have not subscribed to MARPOL [5]. MARPOL [4] and its protocols constitute the international treaty with further ambitious in subject of preventing marine pollution [6].
In 1973, it was established the Marine Environment Protection Committee (MEPC) [7]. The MEPC is the senior technician organ of the International Maritime Organization (IMO), dealing with pollution control and prevention caused by the ships, including emissions of gases that affect human health and contribute to environmental and climate changes [8,9].
Among MARPOL fundamental’s it purposes to preserve the human and marine environment [4] [10]. It’s structured in six Annexes. Among them, the Annex VI, Prevention of Air Pollution in Ships (1997), entered into force in 2005 and deals with emission. This establishes the policies regarding the regulation of emissions and includes mandatory procedures to prevent this atmospheric pollution [11,12]. Chapters 3 and 4 includes the policy established to achieve the reduction of emissions in all maritime transport activity (Table 1).
In 2018, the MECP.304 (72) [13] is published the Initial Strategy including targets for emission reduction in the entire maritime industry into the “Roadmap”. This includes steps for the CII, EEDI and from international shipping to peak and decline reduction by 2030 and 2050.
In 2023, the MECP.377 (80) [14] is published which indicative checkpoints to reach net-zero greenhouse gasses (GHG) emissions from international shipping:
- To reduce the total annual GHG emissions from international shipping by at least 20%, striving for 30%, by 2030, compared to 2008.
- To reduce the total annual GHG emissions from international shipping by at least 70%, striving for 80%, by 2040, compared to 2008.
The MECP.377 (80) [14] including “consider and analyse measures to encourage port developments and activities globally to facilitate reduction of GHG emissions from shipping, including provision of ship and shoreside/onshore power supply from renewable sources, infrastructure to support supply of zero or near-zero GHG emission fuels and/or energy sources, and to further optimize the logistic chain and its planning, including ports”.
Inside the maritime industry, the ports play a crucial role in the loading and unloading of cargo, as well as in the provision of logistical services. However, this industry faces the challenge of reducing their emissions originated by ships, port operations [15,16,17,18] and port authorities [19].
Developing a decarbonisation plan for port activity, based on the quantification of emissions, is identified as an important task for managers [20,21,22], users [23] and researchers in this area [24,25,26,27].
The calculation of the carbon footprint represents a methodological complexity and a greater requirement of information as its rigorousness increases. The fact of involving external agents to the organization itself considerably increases its complexity, due to the amount of information required and the difficulty of making it available [28]. However, the greater detail and the comprehensive way it is carried out makes it a suitable tool for the establishment of emission reduction policies and thus for achieving carbon neutrality [29,30,31].
Maritime transport is a fundamental pillar of Portuguese economy. This refers to the sustainable use of marine and coastal resources to boost the economic development of the country. The wide range of activities contributed 5,1% of the Gross Domestic Product (GDP), 4% of national employment and, additionally, its port activity represented 5% of the country totals exportation during the year 2018 [32], being, in terms of cargo, above the average activity of the countries of the European Union (EU). In this sense, its transition is an opportunity to strengthen his position in the international scenery. In this framework, it is essential to address the global challenges related to climate change, decarbonization of maritime industry and strengthen long-term sustainability in this sector [33,34,35,36,37].
The Port of Sines has a location and strategic importance that distinguishes it in the maritime industry of Portugal [37]. This paper shows the energy characterization and carbon footprint of the Port of Sines, in Portugal, for the period of 2018-2022. This characterization consists of the calculation model and considers several information sources, including that of its concessionaires. This paper contains the general description of the methodology, methods and materials used. The general results obtained by terminal, considering the diversity of cargo types and emission factors and, finally, the most relevant conclusions of the study.
This study represents a significant contribution to the knowledge of energy characterization and the carbon footprint of ports. By providing a detailed assessment that fills an information gap in the relationship of decarbonization of multi-terminal and multimodal maritime ports. Additionally, it establishes a baseline for future research. The results obtained allow the identification of the main sources of greenhouse gas emissions and the most promising improvement opportunities. Moreover, the application of an methodology for calculating the carbon footprint contributes to the development of best practices in the port sector. Finally, the findings of this study have important implications for strategic decision-making at the port and can serve as a model for others seeking to reduce their GHG emissions and thus achieve carbon neutrality in the maritime industry.
2. Material and Methods
The Port of Sines in Portugal is a maritime infrastructure of vital importance for Portugal, EU and other countries outside this region. Its location on the Atlantic coast, depth and facilities makes it at an important logistic node. It is a natural deep-water port since it has an average depth value of 18 m (maximum of 28 m), greater than many other maritime regions [38,39,40].
Currently, the Port of Sines is the main container port in the country and one of the most important in EU, facilitating the international trade and the cargo transportation. In addition, its fundamental role in the energy by receiving most of the liquid fuels for the country. This makes it into an economic engine for the region and an asset for the integration of Portugal in the European market [39].
For the period January-September 2024, the Port of Sines managed a cargo of 36.608.437 t (10,3% higher for the same period of the previous year) and several ship 1.391 were operated (with a decrease of 3,8%). Table 2 shows the distribution of this cargo by terminal and the countries of origin/destination of ships for that period [41].
The monthly and annual calculation of the energy consumption and carbon footprint of the land and maritime transport in the Jurisdiction Area of the Port of Sines (AJPS) for the period 2018-2022 is carried out based on a detailed calculation model that considers the diversity of terminals it currently has. This area is distributed in 6,31 and 147,5 km² land and sea, respectively (Figure 1).
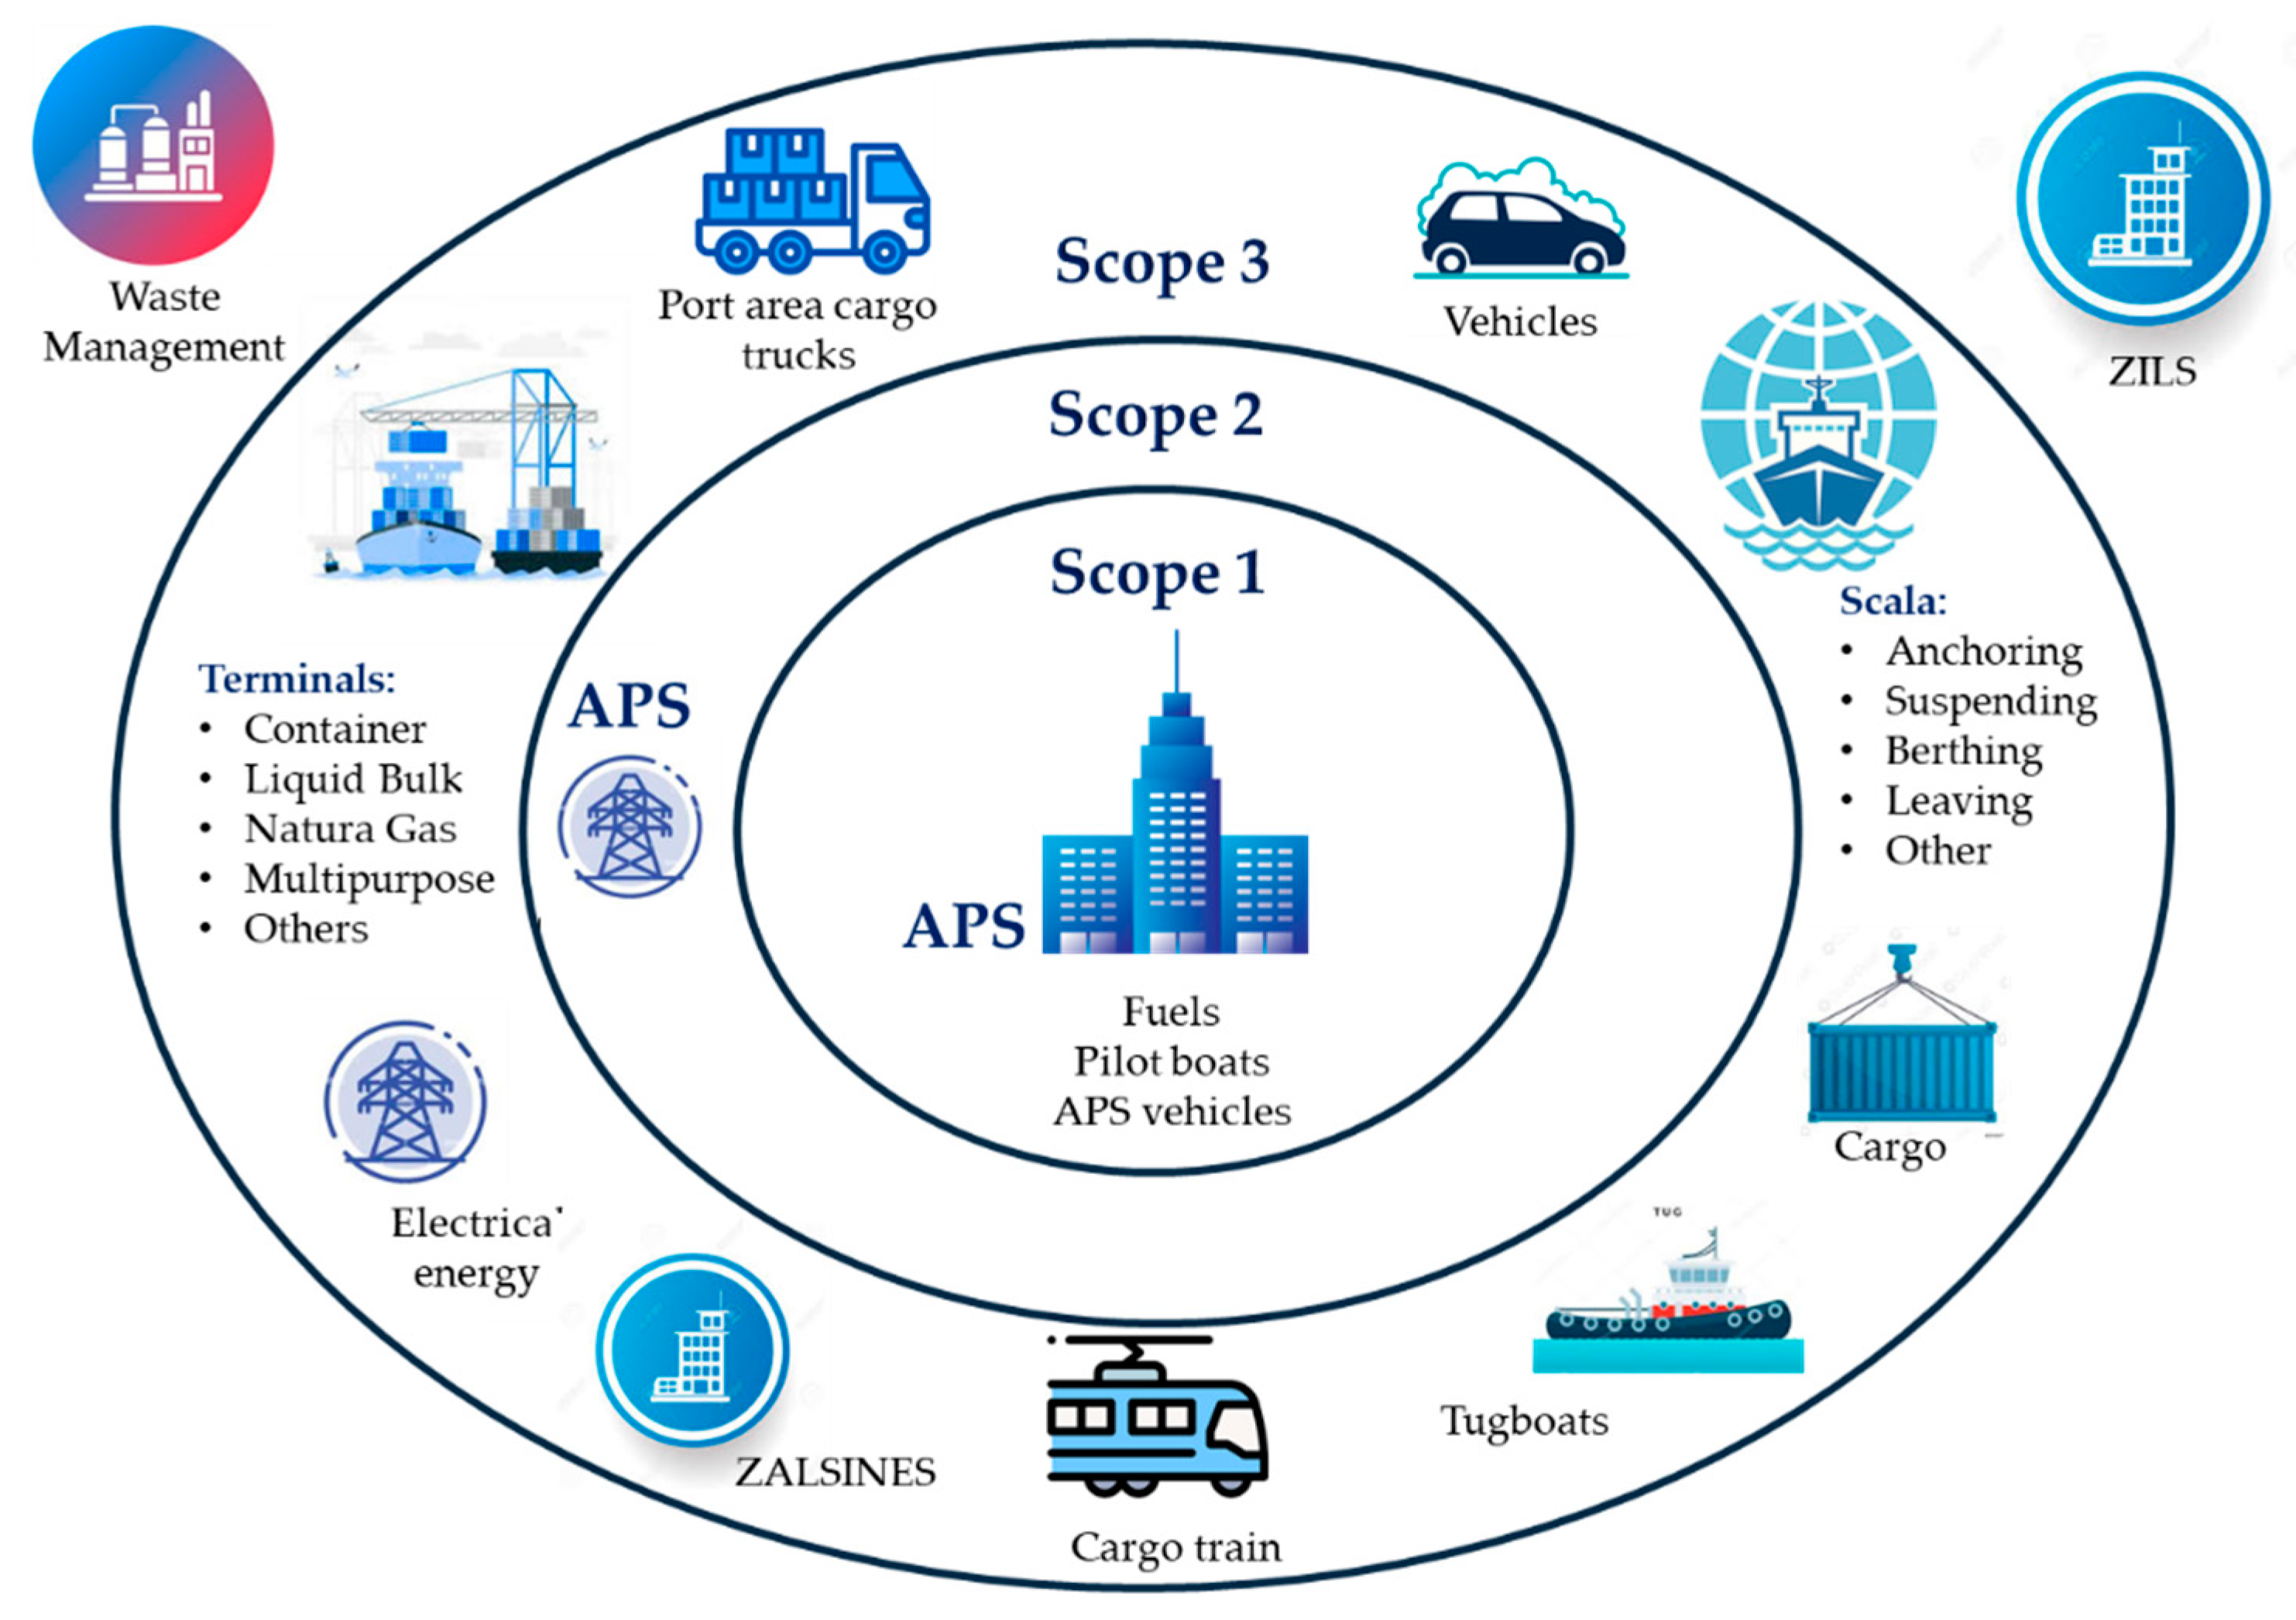
To achieve the goal of carbon neutrality, the IMO establishes 2008 as the base year for comparison, with targets defined for the years 2030 and 2040 [14]. However, another base year may be selected depending on data availability [42]. Tank to wheel (TTW) emissions are considered [43], classified according to the tree scopes of the GHG Protocol methodology [44], recommended for similar studies [45]. For each scope, emissions from land-based and maritime activities, as well as stationary and mobile activities, have been estimated for the AJPS, along with each type of terminal and the different types of services.
Scope 1 [44] considers the consumption of fossil fuels used by the Administration of the Ports of Sines and Algarve, SA (APS) for land and maritime activities carried out within the jurisdiction area. For Scope 2 [44], the consumption is obtained based on the purchase and sale of electricity by APS. Scope 3 [44] includes the calculation of energy consumption for the maritime and land transport activities of each terminal and the electricity consumption. The calculation of Scope 3, although it encompasses indirect emissions, it’s crucial for establishing effective emission reduction policies at the port, as it allows for the identification of the main emission sources associated with the concessionaires and the implementation of joint measures [19].
The Port of Sines has five (5) specializing terminals with private concessions: containerized cargo (SCT), liquid bulks (LBT), liquefied natural gas (NGT), petrochemical (PCT) and general cargo (GCT). Additionally, in ´Others´ are included he Sports and Fishing Port, the tugboat service (operated also under concession) and some service providers in the Sines Industrial and Logistics Zone (ZALSINES), to which APS provided electric energy service. They have different maritime and inland infrastructures, technologies, and inland transport modes for their cargo, among others. This diversity means that the calculation of the energy consumption and carbon footprint is differentiated for each terminal and with asymmetric data [46]. This heterogeneity add complexity and restricts the application of standard statistical models requiring a more detailed analysis for each terminal.
Table 3 and Figure 2 show a description of the terminals, and, in general terms, the aspects considered in each domain in the methodology, respectively.

Table 3.
Depth and cargo type from different terminal of Port of Sines.
| Terminal | Depth (m) | Cargo type |
|---|---|---|
| SCT | 17 | Container. |
| LBT | 28 | Crude oil, refined oil, liquefied petroleum gas, methanol, and chemical naphtha. |
| NGT | 15 | Liquefied natural gas (LNG). |
| PCT | 12 | Propylene, ethylene, butadiene, ethyl tertiary butyl ether, ethanol, methyl tertiary butyl ether, aromatic mixtures, and methanol. |
| GCT | 18 | Dry bulk, general cargo, and roll-on/roll-off ( ro_ro ). |
Figure 2.
GHG Protocol Scopes (1,2 and 3) [44]: applications to the AJPS.
Figure 2.
GHG Protocol Scopes (1,2 and 3) [44]: applications to the AJPS.
The calculation methodology considers the consumption of the fuels used and their respective emission factors. In addition, the statistics of ships and cargo managed by terminal for the period 2018-2022 carried by APS.
- Natural gas for the boilers.
- Diesel fuel for the emergency power plant.
- Diesel fuel for employees’ collective transport vehicles.
- Diesel fuel and gasoline for private employee transport vehicles.
- Diesel fuel for the pilot boats who steer the ships within the AJPS.
Scope 2 [44] includes electricity consumption based on records kept by APS and emission factors from the Portuguese Environment Agency (APA, acronyms in Portuguese) [48].
Scope 3 includes the calculation of energy and emissions from the activity carried out by the concessionaires in the different terminals. Energy consumption and carbon footprint are calculated for the end use of electricity and for maritime and land transport [42,47].
Regarding the ship movement data, until 2019, it was used the maritime transport information from the Port Single Window (JUP). After 2020, the Law Decree No. 158/2019 [49] sets the Logistics Single Window (JUL) as a technological platform that define and support he flow of information relating to the formalities of declaration, planning, execution, and monitoring of the transport chain logistics-maritime that ports use in Portugal. This platform includes information on the scales of the ships, cargos, access to facilities, operations in the terminals and other maritime transportation. In addition, transport information on road and railway movements [50]. The information of the maritime transport includes:
- Type of ship and fuel, IMO id and others.
The calculation of the emissions is carried out based on the information on the type of ship, fuel used and time duration of the manoeuvres, according to the methodology recommended in the European Environment Agency (EEA) [47]. This is based in the calculation of the energy consumption and emissions in function of the power and load factors of the main (ME) and auxiliary engines (AE) of the ship and the execution time of each manoeuvre within the AJPS, Load Factor, proportion AE/ME and fuel type. In this methodology, the auxiliary engine power is estimated as a percentage of the main engine depending on the type of ship.
It was analysed 28.785 manoeuvres during the 5 years of the study, however, only 48% of these data include the power of ME. To achieve, data completeness to allocate missing main engine power [52], it was assigning numerical values based on linear regression.
For land transport, the following fuels are considered:
-
Diesel and gasoline for the pendular movement of employees by terminal in private and collective vehicles. Generally, these data are not included in the carbon footprint calculation models [29]. In the present study it was considered all the data in these calculations to ensure greater accuracy and detail in the model. We considered:
- o
- Number of employees at concessionaires and terminals, provided by APS.
- o
- Vehicle occupancy rate: 1,2 passengers/vehicle.
- o
- Distribution of vehicles: 60% diesel and 40% gasoline.
- o
- In accordance with the methodology, only the journey within the APSJ was considered.
- Diesel for the transport of cargo by container, general cargo and cryogenic trucks for LNG.
- Electric power for the train line for container transport. Load factor: full locomotive and full truck (cargo).
For the electric energy consumption, was used the data provided by APS of its energy purchase and sale records to the terminal operators and the energy data provided to the NGT and PCT by external providers. Similar to Scope 2, the emission factors used are the indicated for each year by APA [48].
Additionally, the Scope 3 includes the energy consumption and the calculation of the carbon footprint of the sport and fishing ports, some ZALSINES traders and the ship service tugboats, since these latter are operated by concessionaires.
3. Results and Discussion
The calculations of energy consumption and carbon footprint were made on a monthly and annual basis, considering the load managed by each terminal, based on the statistics kept by APS and others. Table 4 and Table 5 show energy characterisations and carbon footprint average and of Scope 3, respectively. We can observe in Table 3 and Table 4, that in average, more than 99% of the energy consumption and carbon footprint is in Scope 3.
Table 3.
Energy characterisation and carbon footprint of the Port of Sines. Average annual value for the period 2018-2022.
Table 3.
Energy characterisation and carbon footprint of the Port of Sines. Average annual value for the period 2018-2022.
| Energy consumption (MWh) | |||||||
| Scope | 2018 | 2019 | 2020 | 2021 | 2022 | Average | Average (%) |
| 1 | 1.758,78 | 2.024,81 | 1.802,64 | 1.799,73 | 1.601,66 | 1.797,52 | 0,43 |
| 2 | 1.600,12 | 1.613,60 | 1.367,00 | 1.643,00 | 1.504,00 | 1.545,54 | 0,37 |
| 3 | 386.686,69 | 380.522,45 | 413.976,29 | 536.283,83 | 377.707,63 | 419.035,38 | 99,21 |
| Total | 390.045,59 | 384.160,87 | 417.145,93 | 539.726,56 | 380.813,29 | 422.378,45 | 100,00 |
| Base (%) | 100,00 | 98,49 | 106,95 | 138,38 | 97,63 | -- | -- |
| Carbon footprint (tCO2eq) | |||||||
| Scope | 2018 | 2019 | 2020 | 2021 | 2022 | Average | Average (%) |
| 1 | 593,94 | 742,29 | 593,73 | 579,18 | 545,99 | 611,03 | 0,27 |
| 2 | 459,00 | 376,00 | 251,00 | 266,00 | 205,00 | 311,40 | 0,14 |
| 3 | 226.347,11 | 179.767,30 | 217.452,23 | 300.064,52 | 194.915,94 | 223.709,42 | 99,59 |
| Total | 227.400,05 | 180.885,60 | 218.296,96 | 300.909,70 | 195.666,93 | 224.631,85 | 100,00 |
| Base (%) | 100,00 | 79,55 | 96,00 | 132,33 | 86,05 | -- | -- |
Table 4.
Energy characterisation and carbon footprint of Scope 3 of the Port of Sines. Average value for the period 2018-2022.
Table 4.
Energy characterisation and carbon footprint of Scope 3 of the Port of Sines. Average value for the period 2018-2022.
| Energy consumption (MWh) | ||||||||
| Font | SCT | LBT | NGT | PCT | GCT | Others | Scope 3 | Scope 3 (%) |
| Electric energy | 17.163,28 | 4.776,63 | 62.053,12 | 31.634,13 | 2.209,22 | 733,45 | 118.569,83 | 28,03 |
| Land Transport | 3.032,28 | 214,00 | 228,95 | 86,60 | 455,07 | -- | 4.016,90 | 0,95 |
| Maritime Transport | 59.356,17 | 192.397,26 | 19.142,65 | 4.425,97 | 21.126,60 | 3.978,61 | 300.427,26 | 71,02 |
| Total | 79.551,73 | 197.387,89 | 81.424,72 | 36.146,70 | 23.790,89 | 4.712,06 | 423.013,99 | 100,00 |
| Contribution (%) | 18,81 | 46,66 | 19,25 | 8,55 | 5,62 | 1,11 | -- | -- |
| Carbon footprint (tCO2eq) | ||||||||
| Font | SCT | LBT | NGT | PCT | GCT | Others | Scope 3 | Scope 3 (%) |
| Electric energy | 3.405,46 | 968,07 | 12.269,49 | 6.218,96 | 523,05 | 150 | 23.535,03 | 10,33 |
| Land Transport | 408,09 | 28,76 | 30,81 | 11,66 | 61,24 | -- | 540,60 | 0,24 |
| Maritime Transport | 41.494,34 | 135.238,27 | 5.087,54 | 3.109,00 | 14.886,23 | 3.978,61 | 74.524,11 | 89,43 |
| Total | 45.307,89 | 136.235,10 | 17.387,84 | 9.339,62 | 15.470,52 | 4.128,61 | 227.869,58 | 100,00 |
| Contribution (%) | 19,88 | 59,79 | 7,63 | 4,10 | 6,79 | 1,81 | -- | -- |
Considering the year 2018 as a baseline, Table 3 and Figure 3 show a non-linear relationship between the independent variables (number of ships and total annual cargo) and the dependent variables (total energy consumed and carbon footprint). Specifically:
- The reduction in the number of ships has a moderating effect on the carbon footprint, suggesting that this variable is a key factor in reducing emissions.
- There are inflection points where energy consumption and emissions do not decrease in the same proportion as the cargo, suggesting the presence of additional factors influencing these variables. These factors include the emission factor from electricity grid consumption, which is decreasing in Portugal, and the efficiency in port operations, terminal depth, and typology of ships.
- There is a decoupling between the cargo and the other variables, indicating that the relationship is not deterministic and that other considered factors play an important role, such as the berthing and docking time of ships at different terminals.
Figure 3.
Variation of ships, cargo, energy, and carbon footprint of the Port of Sines for the period 2018-2022. The year 2018 is considered as the baseline for the graph.
Figure 3.
Variation of ships, cargo, energy, and carbon footprint of the Port of Sines for the period 2018-2022. The year 2018 is considered as the baseline for the graph.

We can find different patterns when observing Figure 4 and Table 4. The LBT shows the highest value in both energy consumption and carbon footprint. On the other extreme, we have ’Others,’ with the lowest values. However, in the Top 2 for energy consumption is the NGT, which does not match this position in terms of carbon footprint, as it has been displaced by the SCT. This indicates a heterogeneity in the relationship between the variables. For LBT, Others, SCT and GCT, the highest consumption is due to maritime transportation. In Others we can find the emissions produced by the tugboats, being he more representative. PCT and NGT are characterized by its highest electric energy consumption. Finally, the SCT and GCT terminals are those that have a consumption by land transport between 4 and 2%, respectively, related to the freight transport.
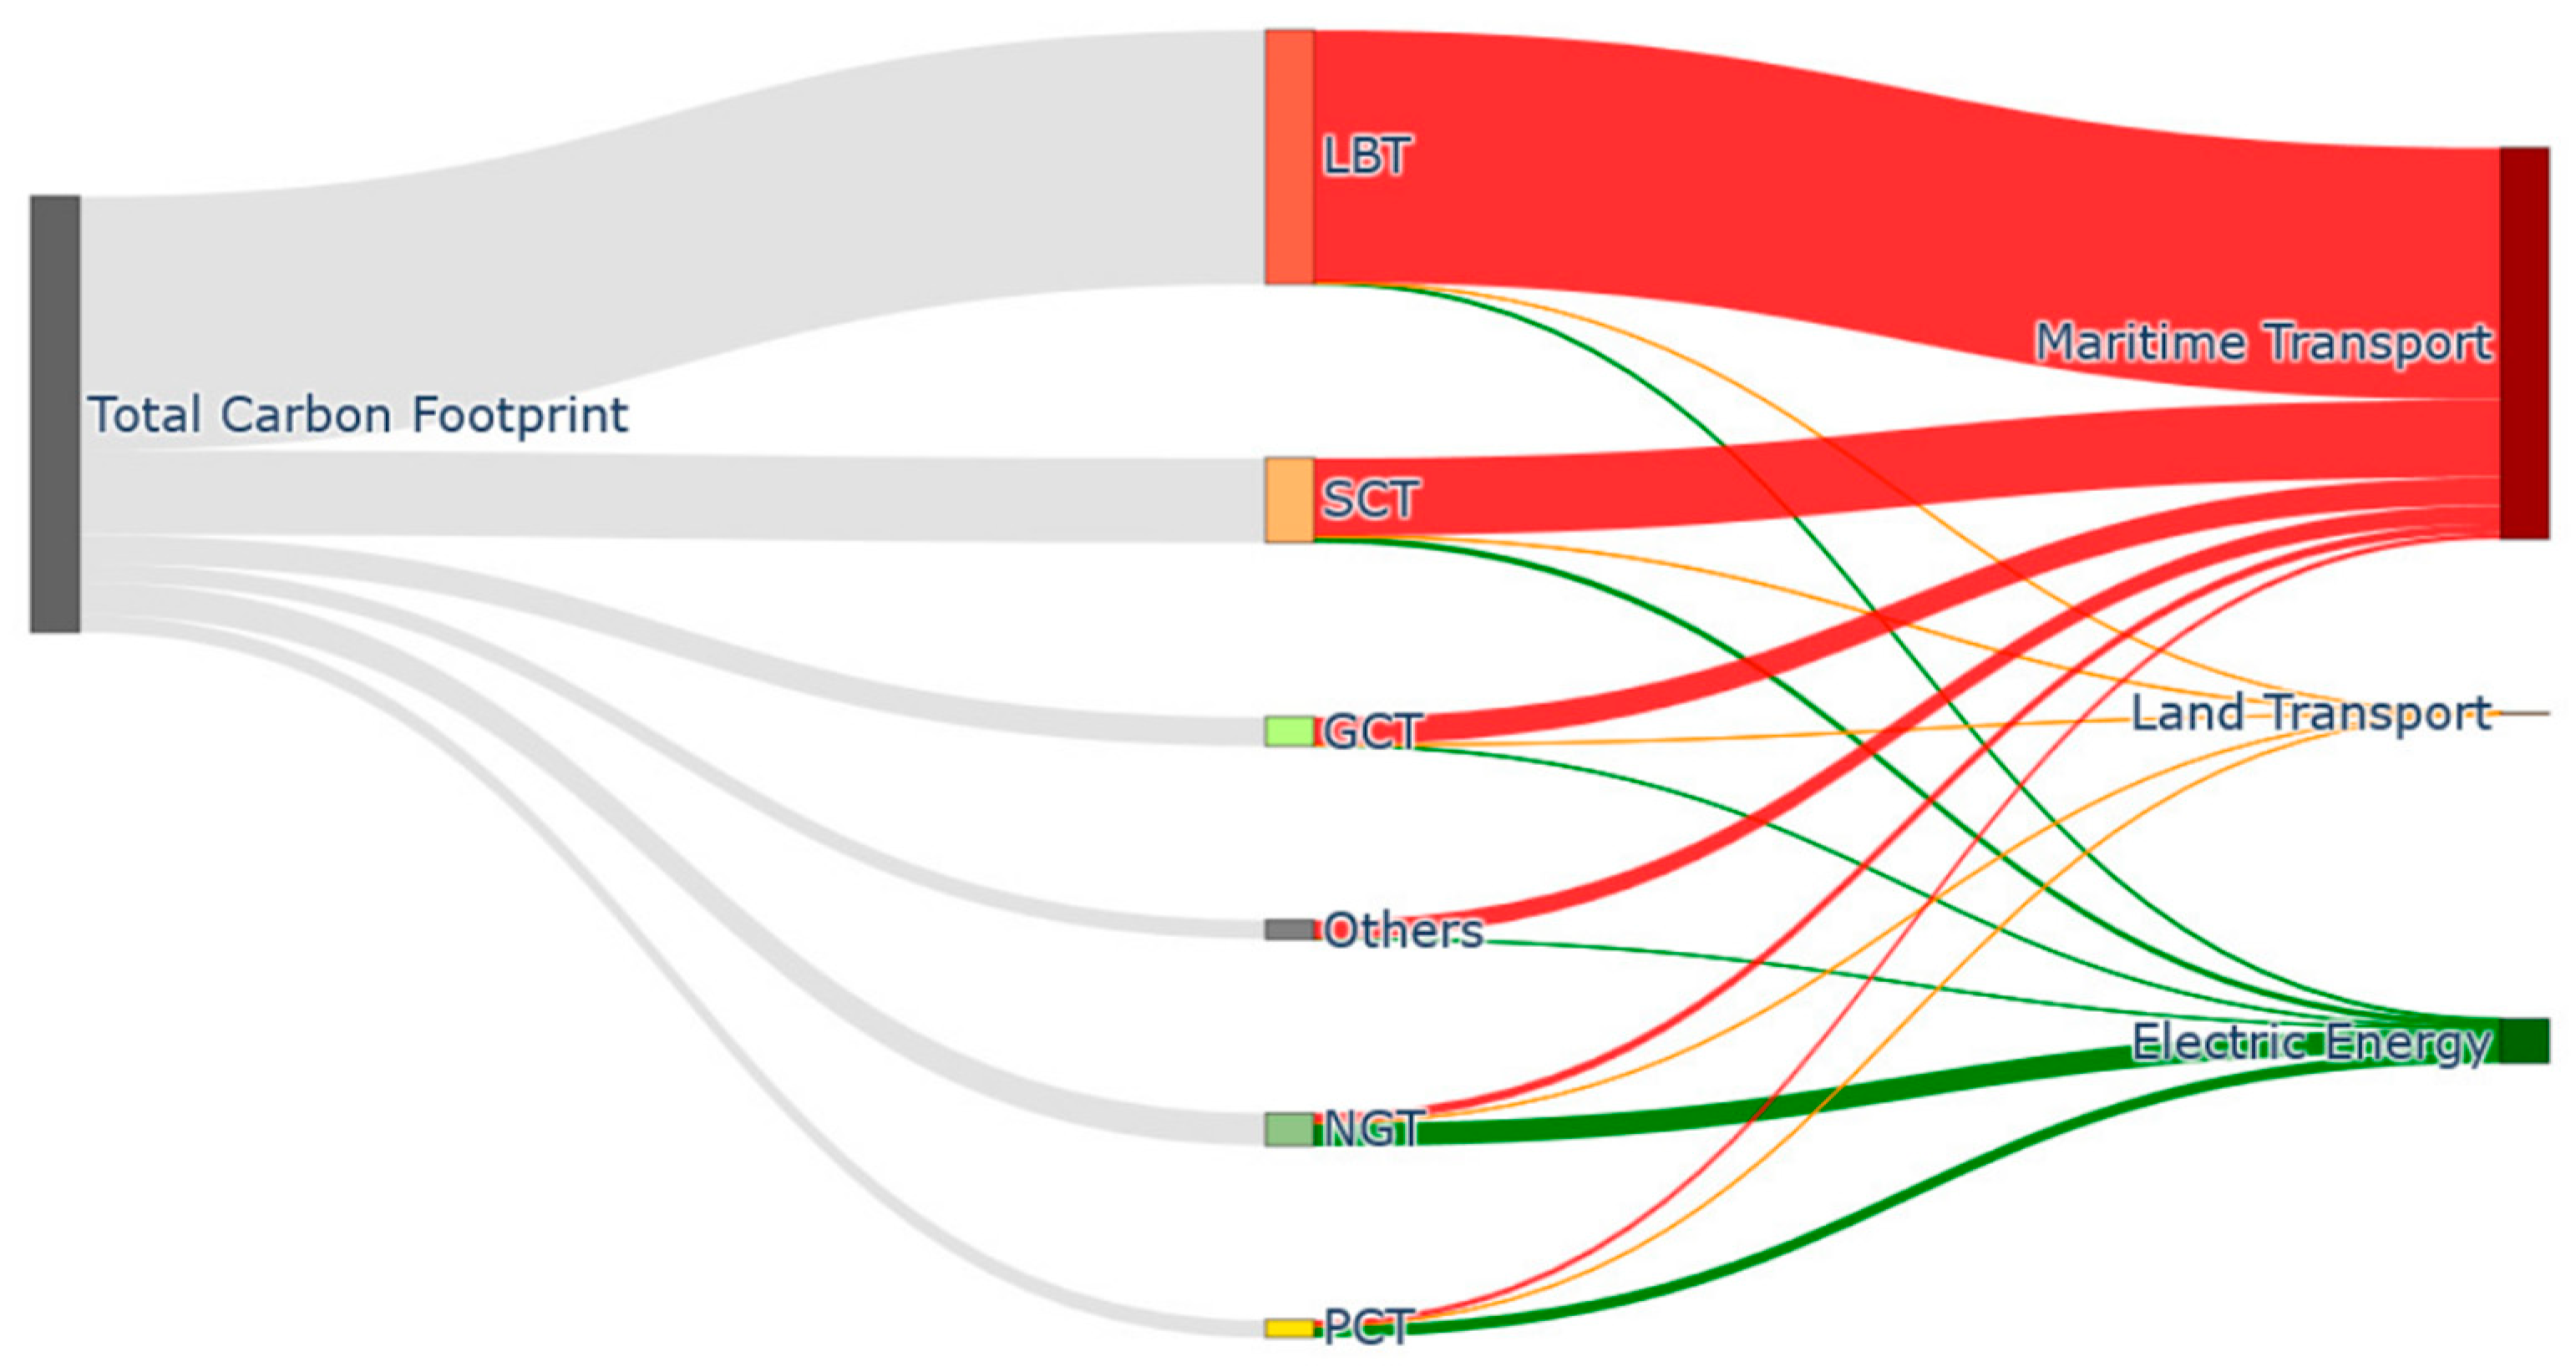
Figure 5 and Figure 6 shows energy and carbon footprint of Sankey Diagram 2022, respectively. Figure 4 shows this consumption in absolute values, and we can note that the LBT has the highest value due to maritime transport, matching with the deepest terminal. Figure 5 shows the highest energy consumption of each terminal, where it is evident that this is depends on their characteristics.
Figure 4.
Energy, and carbon footprint from terminal the Port of Sines.
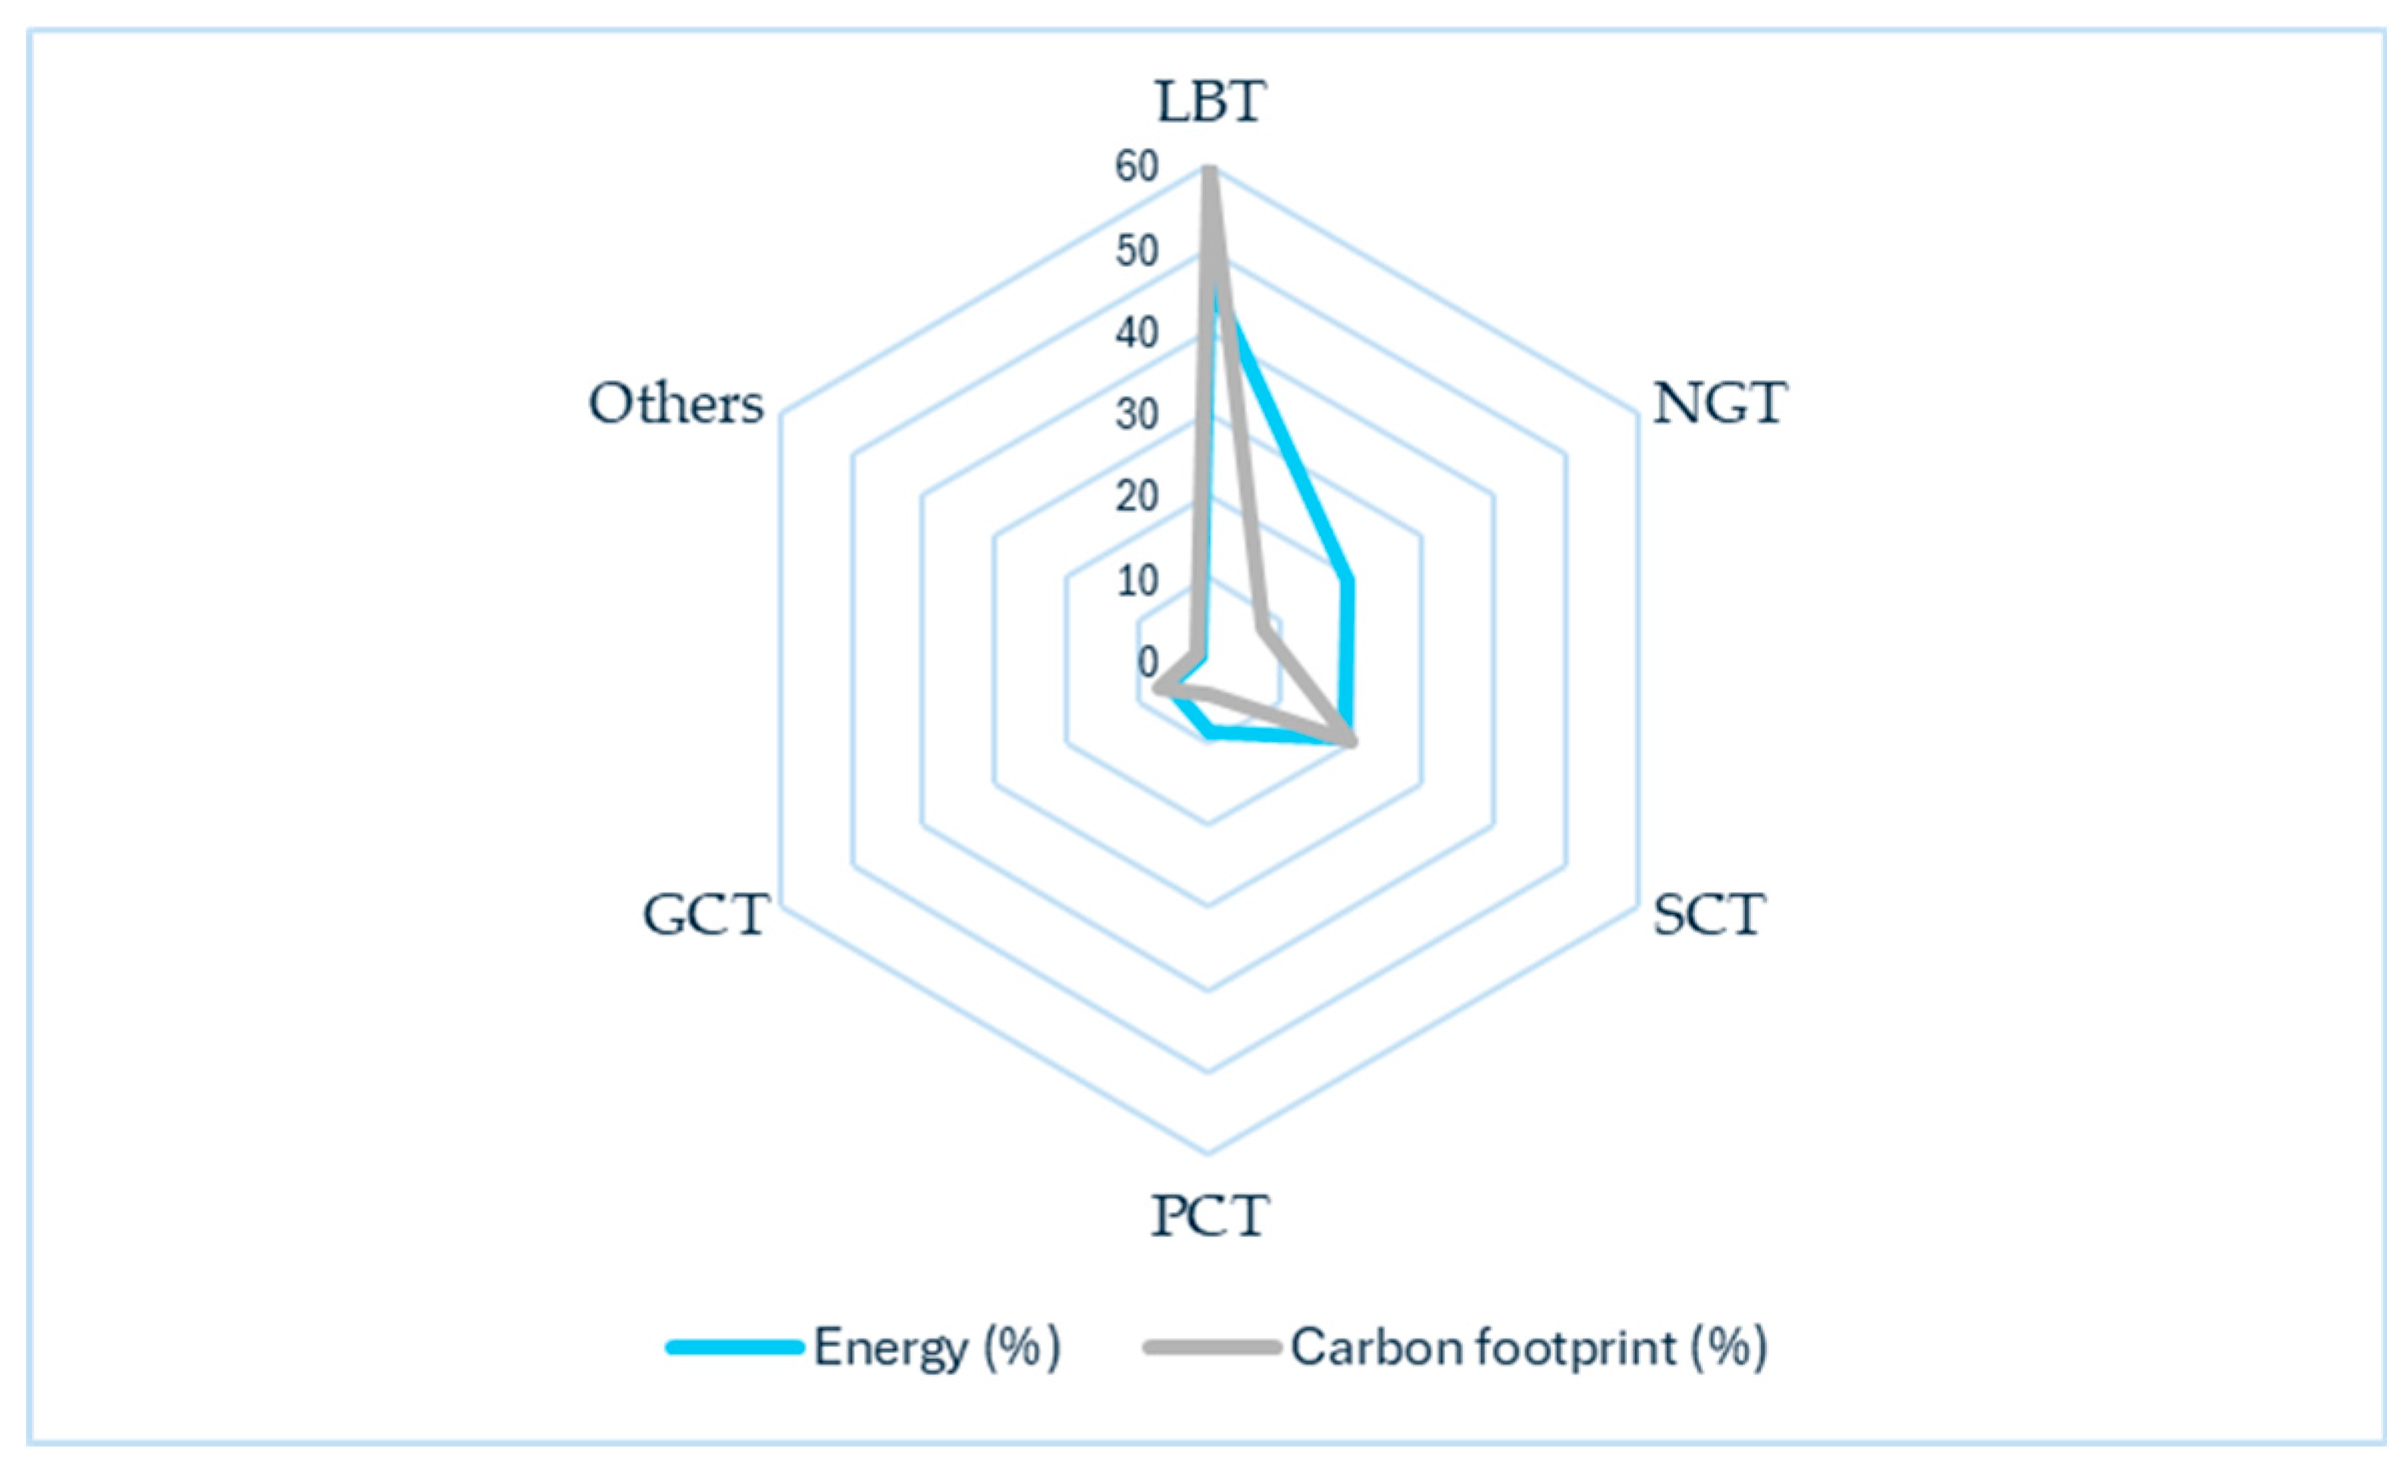
Figure 5.
Energy of Sankey Diagram the Port of Sines.
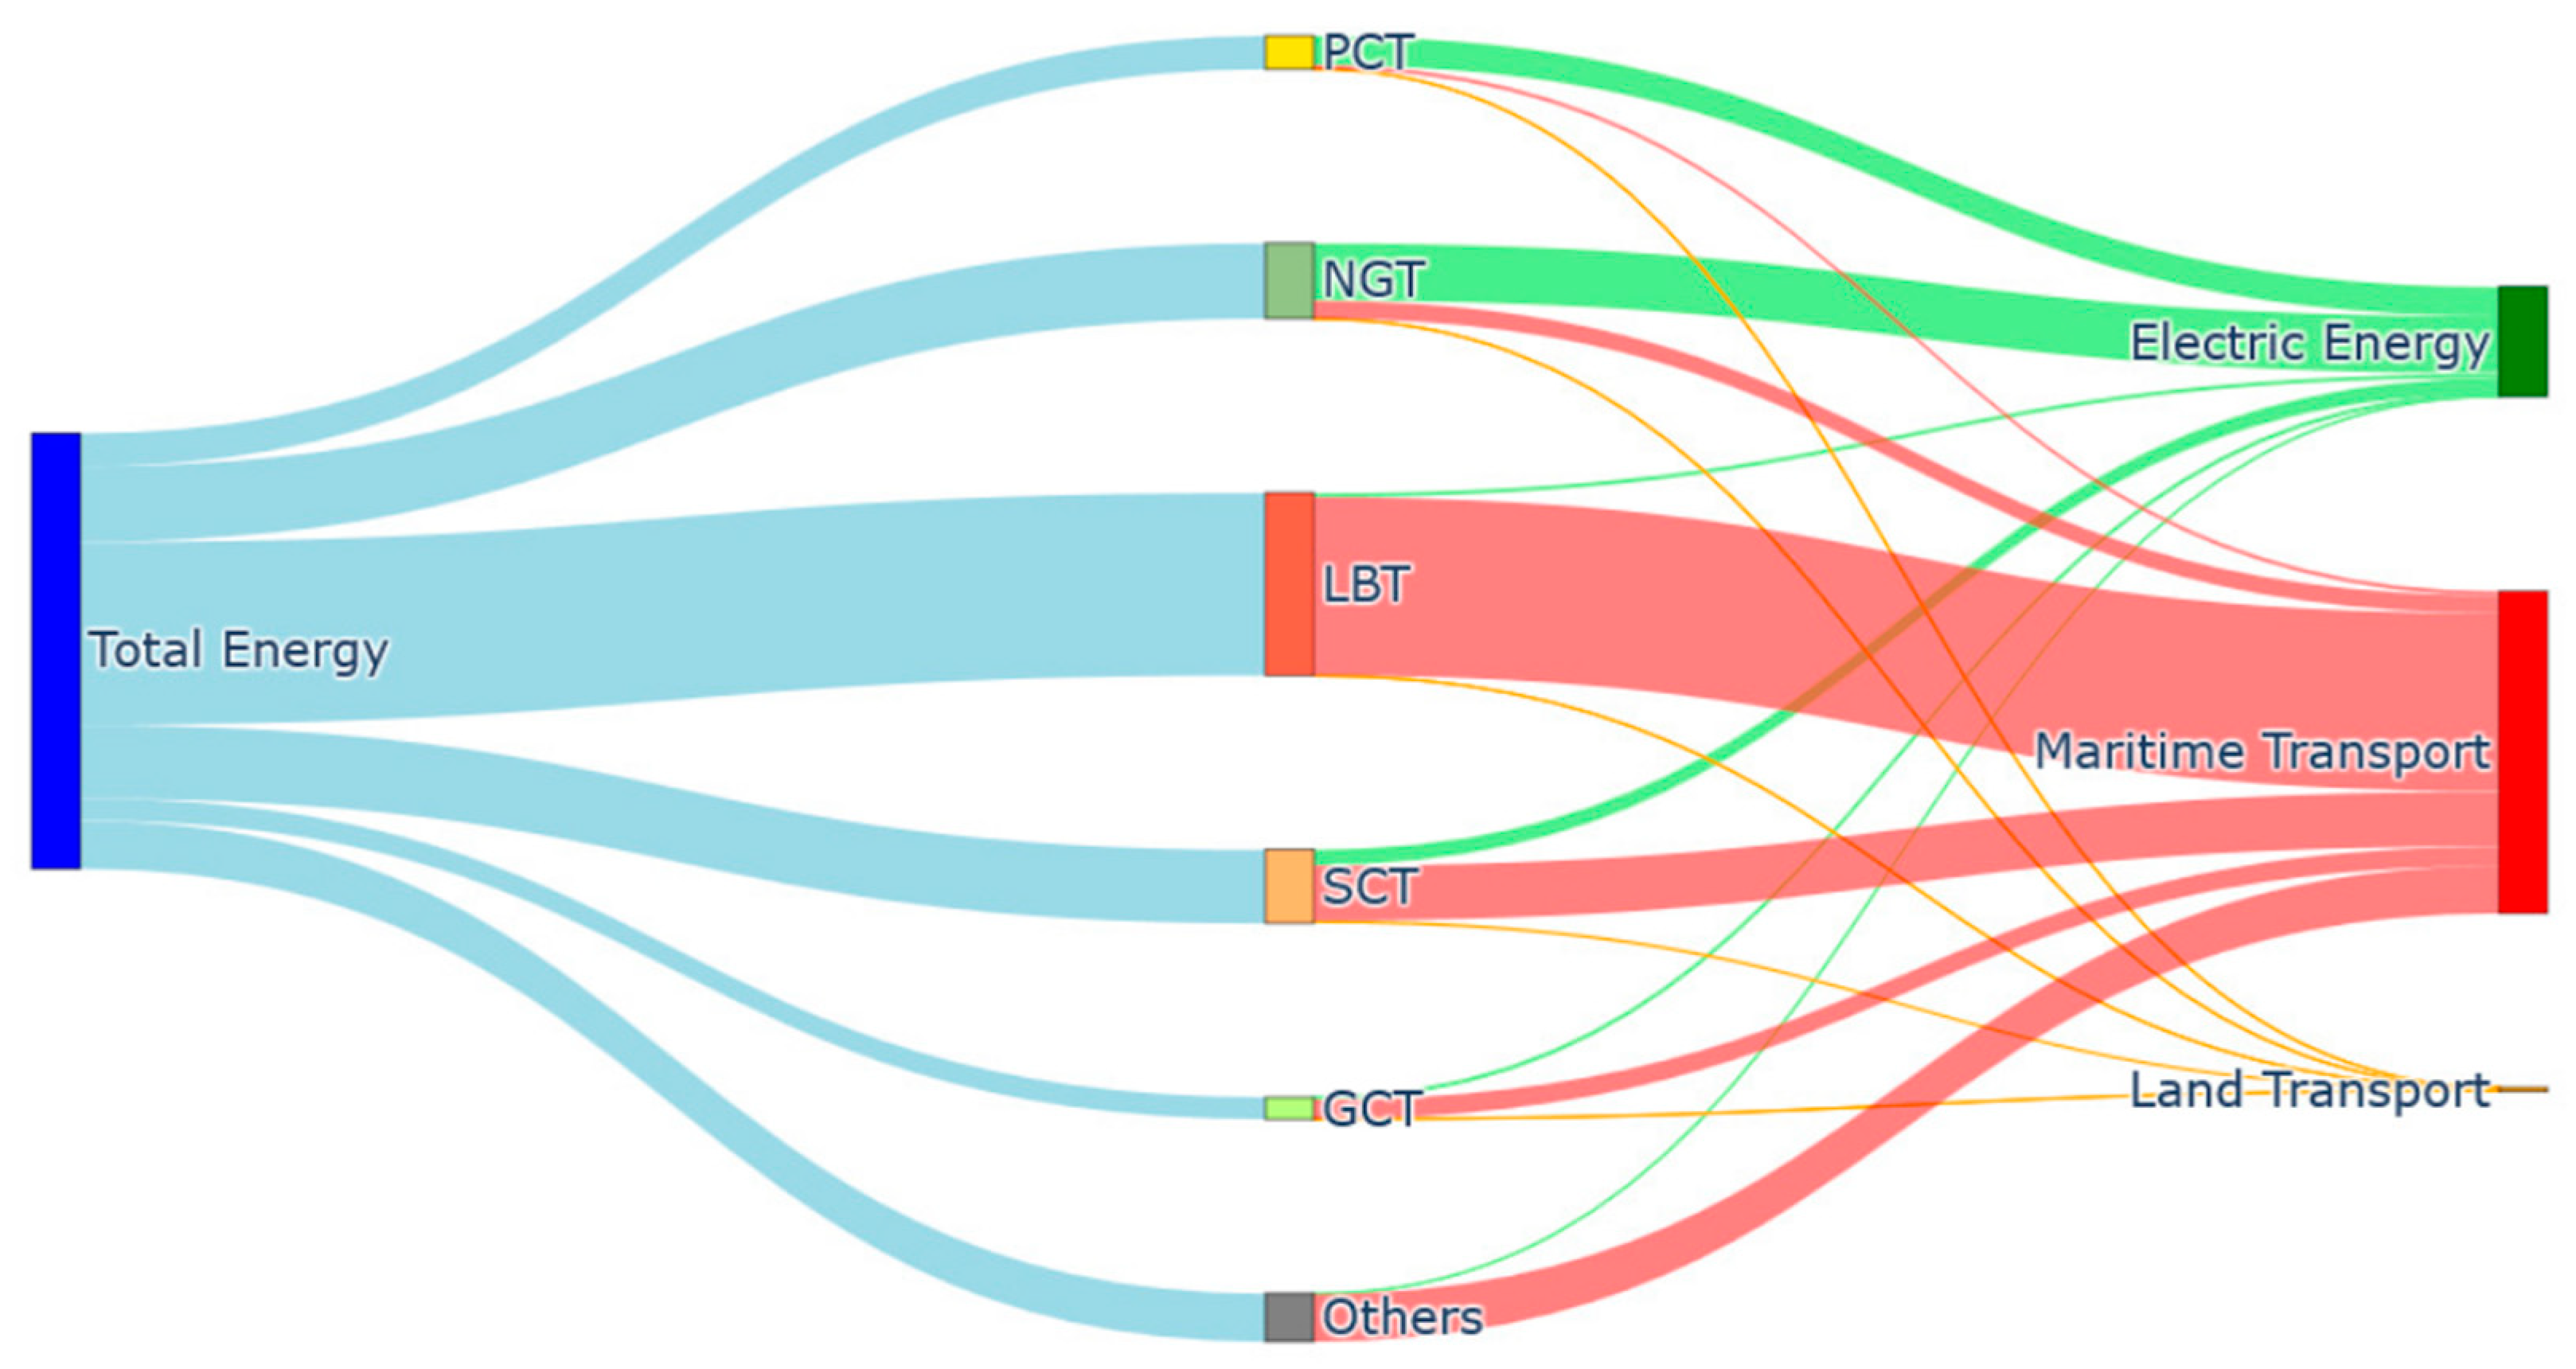
Figure 6.
Carbon footprint of Sankey Diagram the Port of Sines.
In Table 3 and Table 4, for the period 2018 to 2022 the total carbon footprint was reduced in 13,95%. This is due to several factors:
- a)
-
Scope 1 which are the emissions due to the consumption of APS fuels. During this period:
- a.
- The boiler’s natural gas consumption has been reduced due to the close of the restaurant, in 2021.
- b.
- During the years 2021 and 2022 was not reported fuel consumption for electrical plants.
- c.
- There is a 15,7% reduction in diesel consumption of the pilot boats.
- b)
- c)
-
Scope 3 represents the carbon footprint of the concessionaries, during this period:
- a.
- On average, LBT contributes in 59,79% of the carbon footprint. In addition, 99,3% of its emissions are due to maritime transport. For the period 2018-2022, the managed load has increased in 17,2% and the number of ships served only 2,3%, going from 23.238,2 to 26.467,6 t/ship, that is, larger. On average, the 56 and 36% of emissions occur during anchoring and berthing, respectively. During 2022, there is an increase in these times of 31,3 and 15,9%, respectively. Even the percentage of ships anchoring has increased from 51 to 61% during this period. Which indicates that the measures to reduce his carbon footprint must be aimed at lowering he percentage and anchoring time of the ships.
- b.
- The SCT contributes to average in a 19,88% in the carbon footprint. This terminal for December 2019 has an increase in the number of its porticos to 10, which has increased his efficiency in the loading and unloading of the container ships. The 91,2% of their emissions are due to maritime transport, related to 27 and 52% that occur during anchoring and berthing, respectively. For this period, he percentage of ships in anchoring has been reduced from 9,9 to 4,8%. However, it has an increase of these times of 37,3 and 29,9%, thanks to the fact that they have an increment in the cargo handled from 1.726,3 to 2.104,6 TEU/ship. It represents being the most efficient terminal in the port by his relatively low number of ships in anchoring. The remainder of its emissions are due to electric energy consumption (7,5%) and terrestrial transport. The electric energy in this terminal is used for the cranes and gantries operation and their building headquarters, the which they had an increase in his consumption. However, thanks to the reduction of the emissions factor [48], the carbon footprint has been diminished. Finally, the land transport contributes with 1,3% for the carbon footprint, where 70% of this value is related to the transport of cargo within AJPS (30 and 40% by rail and road transport, respectively) in 1,9 (rail) and 2,1 km (road). For this type of terminals, measures to reduce his carbon footprint are found to be related to the use of alternative fuels in auxiliaries’ engines, increasing the efficiency of this engine or the possibility of replacement by electrical engines fed from the terminal during the berthing, which represents 41,9% of the total operation time in the port and 51,8% contribution to the carbon footprint.
- c.
- NGT contributes in 7,63% to the carbon footprint. Unlike the other two terminals, 70,6 % is due to energy consumption of the facility pumping systems for load and unload the ships. This terminal has an increase in its cargo and number of ships for this period, which impacts positively for the energetic transition of the country, being LNG the fuel that has replaced coal in its power plants electrical [54]. What in your opinion time to shocked in the reduction of emissions from this terminal. However, this has gone from 63.396,6 to 59.271,9 t/ship, for the years 2018 and 2022, respectively. The 29,2% of its carbon footprint is due to maritime transportation, which has been reduced, thanks to the reduction of the anchoring and berthing times of 16,9 and 5,06%, respectively. In addition, the reduction from 13 to 9% of the ships that anchor, which denotes improvements in his efficiency logistics. Less than 7% of its cargo is transported by land, hence the contribution to the carbon footprint is less than 0,2%. As a measure to reduce his carbon footprint must be include the reduction of the emissions factor by electricity consumption [48], aligned with the decarbonization policy of the energetic matrix in Portugal [54–56]. Additionally, due to the cold losses during the unload process of the ships in this terminal, this could contribute to reducing the refrigerant consumption in the operations of the adjacent terminals (refrigerated containers) and reduce the Port’s total carbon footprint.
- d.
- GCT, PCT and Others contribute a total of 12,7% to the carbon footprint. Approximately 80,6% of this footprint is due to maritime transportation. Of this value, 35,6% are emissions due to the use of the tugboats, which is decarbonization would impact positively in reducing the carbon footprint. By the last half of 2022, the GCT replaced the solids bulk terminal (SBT), which has impacted positively in reducing its carbon footprint.
- e.
- The carbon footprint of the PCT is due by 67 and 33% to electrical energy consumption and maritime transportation, respectively. The carbon footprint by consumption of the electric energy has been reduced thanks to the reduction of the emission factors [48]. An average of 3.593,7 t/ship of maritime transport is maintained despite the increase in its managed cargo by 18%, guaranteeing his efficiency. 65% of its emissions are due to anchoring and only 30% to berthing. However, the times of these operations have been reduced by 75,3 and 7,2%, respectively. In addition, the percentage of ships in anchoring have reduced from 68,8 to 37,5%, demonstrating improvements in its efficiency from a logistical point of view. On average, the anchoring time and emissions from this terminal account for approximately 46,5%, a similar value to berthing. To reduce the carbon footprint, increasing efficiency in the logistics of ship waiting times and implementing measures for the auxiliary engines can be effective.
4. Conclusions
The following work includes the energy characterization and carbon footprint calculation of the Port of Sines currently managed by APS for the period 2018-2022. This characterization is carried out for each of its terminals and service provision in its entire jurisdiction area. The diversity of activities in the terminals means that this calculation is carried out specifically for each type of terminal dealing with asymmetric data. Within this framework, it is shown that Scope 3, due to the activity of the concessionaires and the movement of goods, contributes with more than 99% of the energy consumption and carbon footprint of the Port as a whole. On average, the Port of Sines consumes an average value of 422.378,45 MWh/year and has a carbon footprint of 224.631,85 tCO2eq/year.
Being a multi-terminal and multimodal port, its calculation model is asymmetric, which merits detail in the data used to ensure its precision. We observe that the variables that impact in the characterization of consumption energy and carbon footprint depend on the deep-water terminal, the characteristics of the ships and the modes of transit of cargo. In this sense, the present model can be used for others freight ports with similar characteristics.
Author Contributions
Conceptualization TB, LMN, RRP and CV; methodology, TB, RRP, LMN, CV, JF, PS and FB; data curation RRP, CV and FAB; writing-original draft preparation CV; writing-review and editing TB, CV, LMN, RRP, LM, FAB and AC; supervision TB and RRP, LMN; project administration TB, JA, and EB; funding acquisition TB, JA and EB. All authors have read and agreed to the published version on the manuscript.
Acknowledgements
Content produced within the scope of the Agenda “NEXUS - Pacto de Innovação – Green and Digital Transition for Transport, Logistics and Mobility”, financed by the Portuguese Recovery and Resilience Plan (PRR), with no. C645112083-00000059 (investment project no. 53)
Conflicts of Interest
The authors declare no conflicts of interest.
Abbreviations
The following abbreviations are used in this manuscript:
| AJPS | Jurisdiction Area of the Port of Sines | LNG | Liquefied Natural Gas |
| APA | Portuguese Environment Agency | MARPOL | International Convention for the Prevention of Pollution from Ships |
| APS | Administration of the Ports of Sines and Algarve, SA | MEPC | Marine Environment Protection Committee |
| CII | Carbon intensity indicator | NGT | Natural Gas Terminal |
| EEA | European Environment Agency | PCT | Petrochemical Terminal |
| EEDI | Energy Efficiency Design Index | PLF | Passenger Locator Forms |
| PM | Particulate material | ||
| EEXI | Energy Efficiency Existing Ship Index | ro_ro | roll-on/roll-off |
| EU | European Union | OILPOL | Convention for the Prevention of Pollution of the Sea by Oil |
| GCT | General Cargo Terminal | SBT | Solid Bulk Terminal |
| GDP | Gross domestic product | SCT | Sine’s Container Terminal |
| GHG | Greenhouse gas | SEEMP | Ship Energy Efficiency Management Plan |
| IAPH | International Association of Ports and Harbors | TTW | Tank to Wheel |
| IMO | International Maritime Organization | VOC | Volatile Organic Compounds |
| JUL | Logistics Single Window | ZALSINES | Port and Industrial and Logistics Zone of Sines |
| JUP | Single Port Window | ZILS | Sines Industrial and Logistics Zone |
| LBT | Liquid Bulk Termina |
References
- EU. Regulation 2015/757 of the European Parliament and of the Council. Official Journal of the European Union 2015, https://eur-lex.europa.eu/eli/reg/2015/757/oj/eng.
- EU. The European Green Deal of the 2020 2020, https://commission.europa.eu/strategy-and-policy/priorities-2019-2024/european-green-deal_en.
- EU. Commission welcomes completion of key ‘Fit for 55’ legislation, putting EU on track to exceed 2030 targets 2023, https://ec.europa.eu/commission/presscorner/detail/en/ip_23_4754.
- FDFA. International Convention for the prevention of pollution from ships (MARPOL). Flanders Chancellery and Foreign Office 1973, https://fdfa.be/en/international-convention-for-the-prevention-of-pollution-from-ships-marpol.
- Sáez, P. From maritime salvage to IMO 2020 strategy: Two actions to protect the environment. Marine Pollution Bulletin 2021, 170, 112590. [CrossRef]
- Tanaka, Y. Regulation of Greenhouse Gas Emissions from International Shipping and Jurisdiction of States. Review of European, Comparative & International Environmental Law 2016, 25, 3, 273-401.
- IMO. Marine Environment Protection Committee (MEPC). https://www.imo.org/en/MediaCentre/MeetingSummaries/Pages/MEPC-default.aspx.
- Baumann, J. From global to human factors: Shipping emissions policy process in the IMO. Marine Policy 2024, 167,106291. [CrossRef]
- Pigani, L; Boscolo, M; Pagan, N. Marine refrigeration plants for passenger ships: Low-GWP refrigerants and strategies to reduce environmental impact. International Journal of Refrigation 2016, 64, 80-92. [CrossRef]
- NU. International Convention for the prevetion of pollution for ship. No. 22484 1978, https://treaties.un.org/pages/showDetails.aspx?objid=0800000280291139.
- EPA. Guidance Documents related to Annex VI Standards for Marine Diesel Engines and Fuel 2024, https://www.epa.gov/regulations-emissions-vehicles-and-engines/guidance-documents-related-annex-vi-standards-marine.
- Roy, W; Sheldeman, K; Nieuwenhove, A; Merveille, J; Schallier R; Maes, F. Current progress in developing a MARPOL Annex VI enforcement strategy in the Bonn Agreement through remote measurements. Marine Policy 2023, 158, 105882. [CrossRef]
- IMO. Resolution MEPC.304 (72). Initial imo strategy on reduction of GHG emissions from ships 2018, chrome-extension://efaidnbmnnnibpcajpcglclefindmkaj/https://wwwcdn.imo.org/localresources/en/KnowledgeCentre/IndexofIMOResolutions/MEPCDocuments/MEPC.304(72).pdf.
- Winnes, H; Styhre, L; Fridell, E. Reducing GHG emissions from ships in port areas. Research in Transportation Business & Management 2015, 17,73-82. [CrossRef]
- Fenton, P. The role of port cities and transnational municipal networks in efforts to reduce green house gas emissions on land and at sea from shipping – An assess mentof the World Ports Climate Initiative. Marine Policy 2017, 75, 271-277. [CrossRef]
- Zhong, H; Hu, Z; Leung, T. Carbon emissions reduction in China’s container terminals: Optimal strategy formulation and the influence of carbon emissions trading. Journal of Cleaner Production 2019, 219, 518-530. [CrossRef]
- Barberi, S; Sambito, M; Neduzha y A. Severino. Pollutant Emissions in Ports: A Comprehensive Review. Infrastructures 2021, 6, 114, 1-36. [CrossRef]
- Alamoush, A; Olcer, A; Ballini, F. Port greenhouse gas emission reduction: Port and public authorities’ implementation schemes. Research in Transportation Business & Management 2022, 43, 100708. [CrossRef]
- Winnes, H; Styhre, L; Fridell, E. Reducing GHG emissions from ships in port areas. Research in Transportation Business & Management 2015, 17, 73-82. [CrossRef]
- EU. Monitoring, reporting and verification of EU ETS emissions 2021, https://climate.ec.europa.eu/eu-action/eu-emissions-trading-system-eu-ets/monitoring-reporting-and-verification-eu-ets-emissions_en.
- Coelho, M; Mesquita, J; Macedo, E; Macedo, J. Decarbonising mobility in port cities. Transportation Research Procedia 2024, 78, 304-310. [CrossRef]
- Oloruntobi, O; Kasypi, M; Gohari, A; Saira, A; Chuah, L. Sustainable transition towards greener and cleaner seaborne shipping industry: Challenges and opportunities. Cleaner Engineering and Technology 2023, 231, 100628. [CrossRef]
- Styhre, L; Winnes, H; Black, J; Lee, J; Le-Griffin, H. Greenhouse gas emissions from ships in ports – Case studies in four continents. Transportation Research Part D 2017, 54, pp. 212-224. [CrossRef]
- Zhou, C; Huang, H; Liu, Z; Ding, Y; Xiao, J; Shu, Y. Identification and analysis of ship carbon emission hotspots based on data field theory: A case study in Wuhan Port. Ocean & Coastal Management 2023, 235, 106479. [CrossRef]
- Mocerino, F; Murena, F; Quaranta, F; Toscano, D. Validation of the estimated ships’ emissions through an experimental campaign in port. Ocean Engineering 2023, 288, 115957. [CrossRef]
- Akakura, Y. Analysis of offshore waiting at world container terminals and estimation of CO2 emissions from waiting ships. Asian Transport Studies, 9, 100111, 2023. [CrossRef]
- Aseel, S; Al-Yafei, H; Kucukvar, M; Onat, N; Turkay, M; Kazancoglu, Y; Al-Sulaiati, A; Al-Hajri, A. A model for estimating the carbon footprint of maritime transportation of Liquefied Natural Gas under uncertainty. Sustainable Production and Consumption 2021, 27,1602-1613.
- Azarkamand, S; Wooldridge, C; Darbra, R. Review of Initiatives and Methodologies to Reduce CO2 Emissions and Climate Change Effects in Ports. International journal of environmental research and public health 2022, 17, 11, 3858. [CrossRef]
- Hsu, W; Huynh, N; Quoc, T; Yu, H. An assessment model of eco-efficiency for container terminals within a port. Economics of Transportation 2024, 39. [CrossRef]
- Freitas, D; Gervásio, H. The challenge of benchmarking carbon emissions in maritime ports. Environmental Pollution 2024, 363, Pat 2, 125170. [CrossRef]
- DGPM. Direcao-Geral de Política do Mar 2023, https://www.dgpm.mm.gov.pt/conta-satelite-do-mar.
- Winnes, H; Styhre, L; Fridell, E. Reducing GHG emissions from ships in port areas. Research in Transportation Business & Management 2015, 17, 73-82. [CrossRef]
- Fenton, P; The role of port cities and transnational municipal networks in effort storeduce greenhousegas emissions on landandat sea from shipping – An assessmen tof the World Ports Climate Initiative. Marine Policy 2017, 75, 271-277. [CrossRef]
- Fadiga, A; Ferreira, L; Bigotte, J. Decarbonising maritime ports: A systematic review of the literature and insights for new research opportunities. Journal of Cleaner Production 2024, 452, 142209. [CrossRef]
- Nunes, R; Alvim-Ferraz, M; Martins, F; Sousa, S. Local mortality and costs from ship-related emissions in three major Portugueses ports. Urban Climate 2024, 53,101780. [CrossRef]
- Kazimieras, E; Turskis, Z; Bagocius, V. Multi-criteria selection of a deep-water port in the Eastern Baltic Sea. Applied Soft Computing 2015, 26, 180-192. [CrossRef]
- Martínez-Moya, J; Mestre-Alcover, M; Sala-Garrido, R; Furió-Pruñonosa, S. Are transhipment ports more efficient in the Mediterranean Sea? Analysing the role of time at ports using DEA metafrontier approach. Journal of Transport Geography 2024, 116, 103866. [CrossRef]
- Huang, H; Yan, Q; Yang, Y; Wang, S; Yuan, Q; Li, X; Mei, Q. Spatial classification model of port facilities and energy reserve prediction based on deep learning for port management―A case study of Ningbo. Ocean and Coastal Management 2024, 258, 107413. [CrossRef]
- APS. Port of Sines/Statictics 2025, https://www.apsinesalgarve.pt/en/statistics/monthly-statistics/port-of-sines/.
- GloMEEP, gef, UNDP, IMO, IAPH. Port Emissions Toolkit, Guide No.1 – GloMEEP 2018, http://chrome-extension://efaidnbmnnnibpcajpcglclefindmkaj/https://glomeep.imo.org/wp-content/uploads/2019/03/port-emissions-toolkit-g1-online_New.pdf.
- Osorio-Tejada, J; Llera Sastresa, E; Scarpellini, S. Environmental assessment of road freight transport services beyond the tank-to-wheels analysis based on LCA. Environment, Development and Sustainability 2024, 26, 421–451. [CrossRef]
- GHGPROTOCOL. Standards & Guidance 2024, https://ghgprotocol.org/standards-guidance.
- GreenVoyage2050, Port Emissions Toolkit Guide No. 1: Assessment of Port 2021.
- Zhao, N; Wang, Z; Ji, X; Fu, H; Wang, Q. Analysis of a maritime transport chain with information asymmetry and disruption risk. Ocean and Coastal Management 2023, 231, 106405. [CrossRef]
- EMSA; EEA. European Maritime Transport Environmental Report 2021. ISBN: 978-92-9480-371-9, https://www.eea.europa.eu/en/analysis/publications/maritime-transport.
- APA. Factor de Emissao da Electricidade 2024 Portugal 2024, https://apambiente.pt/clima/fator-de-emissao-de-gases-de-efeito-de-estufa-para-eletricidade-produzida-em-portugal.
- PGLISBOA. DL n.º 158/2019. Janela Única Logística. Ministério Público de Portugal 2019. https://www.pgdlisboa.pt/leis/lei_mostra_articulado.php?nid=3188&tabela=leis&ficha=1&pagina=1&so_miolo=.
- Santos, S; Lima, L; Castelo, M. Corporate sustainability of Portuguese seaports. Journal of Cleaner Production 2022, 380, 136057. [CrossRef]
- Gil, R; Borges, R; Maritna, A; Macebo, B; Teixeira, L. A Simulation Tool to Forecast the Behaviour of a New Smart Pre-Gate at the Sines Container Terminal, sustainability 2025, 17, 1, 163. [CrossRef]
- Run, S; Abouarghoub, W; Demir, E. Enhancing data quality in maritime transportation: Apractical method for imputing missing ship static data. Ocean Engineering 2025, 315, 119722. [CrossRef]
- Lorenzi, G; Baptista, P. Promotion of renewable energy sources in the Portuguese transport sector: A scenario analysis. Journal of Cleaner Production 2018, 180, 918-932. [CrossRef]
- Maia, F; Leitao, S; Corria, M. Energy transition in Portugal: The harnessing of solar photovoltaics in electric mobility and its impact on the carbon footprint. Journal of Cleaner Production 2024, 477, 143834. [CrossRef]
- Xing, H; Spence, S; Chen, H. A comprehensive review on countermeasures for CO2 emissions from ships,» Renewable and Sustainable Energy Reviews 2024, 134, 110222. [CrossRef]
- Arif, M; Rais, M; Shinoda, T. Estimation of CO2 emissions for ship activities at container port as and effort towards a green port index,» Energy Reports 2022, 8, 229-236. [CrossRef]
Figure 1.
Jurisdiction area of the Port of Sines.
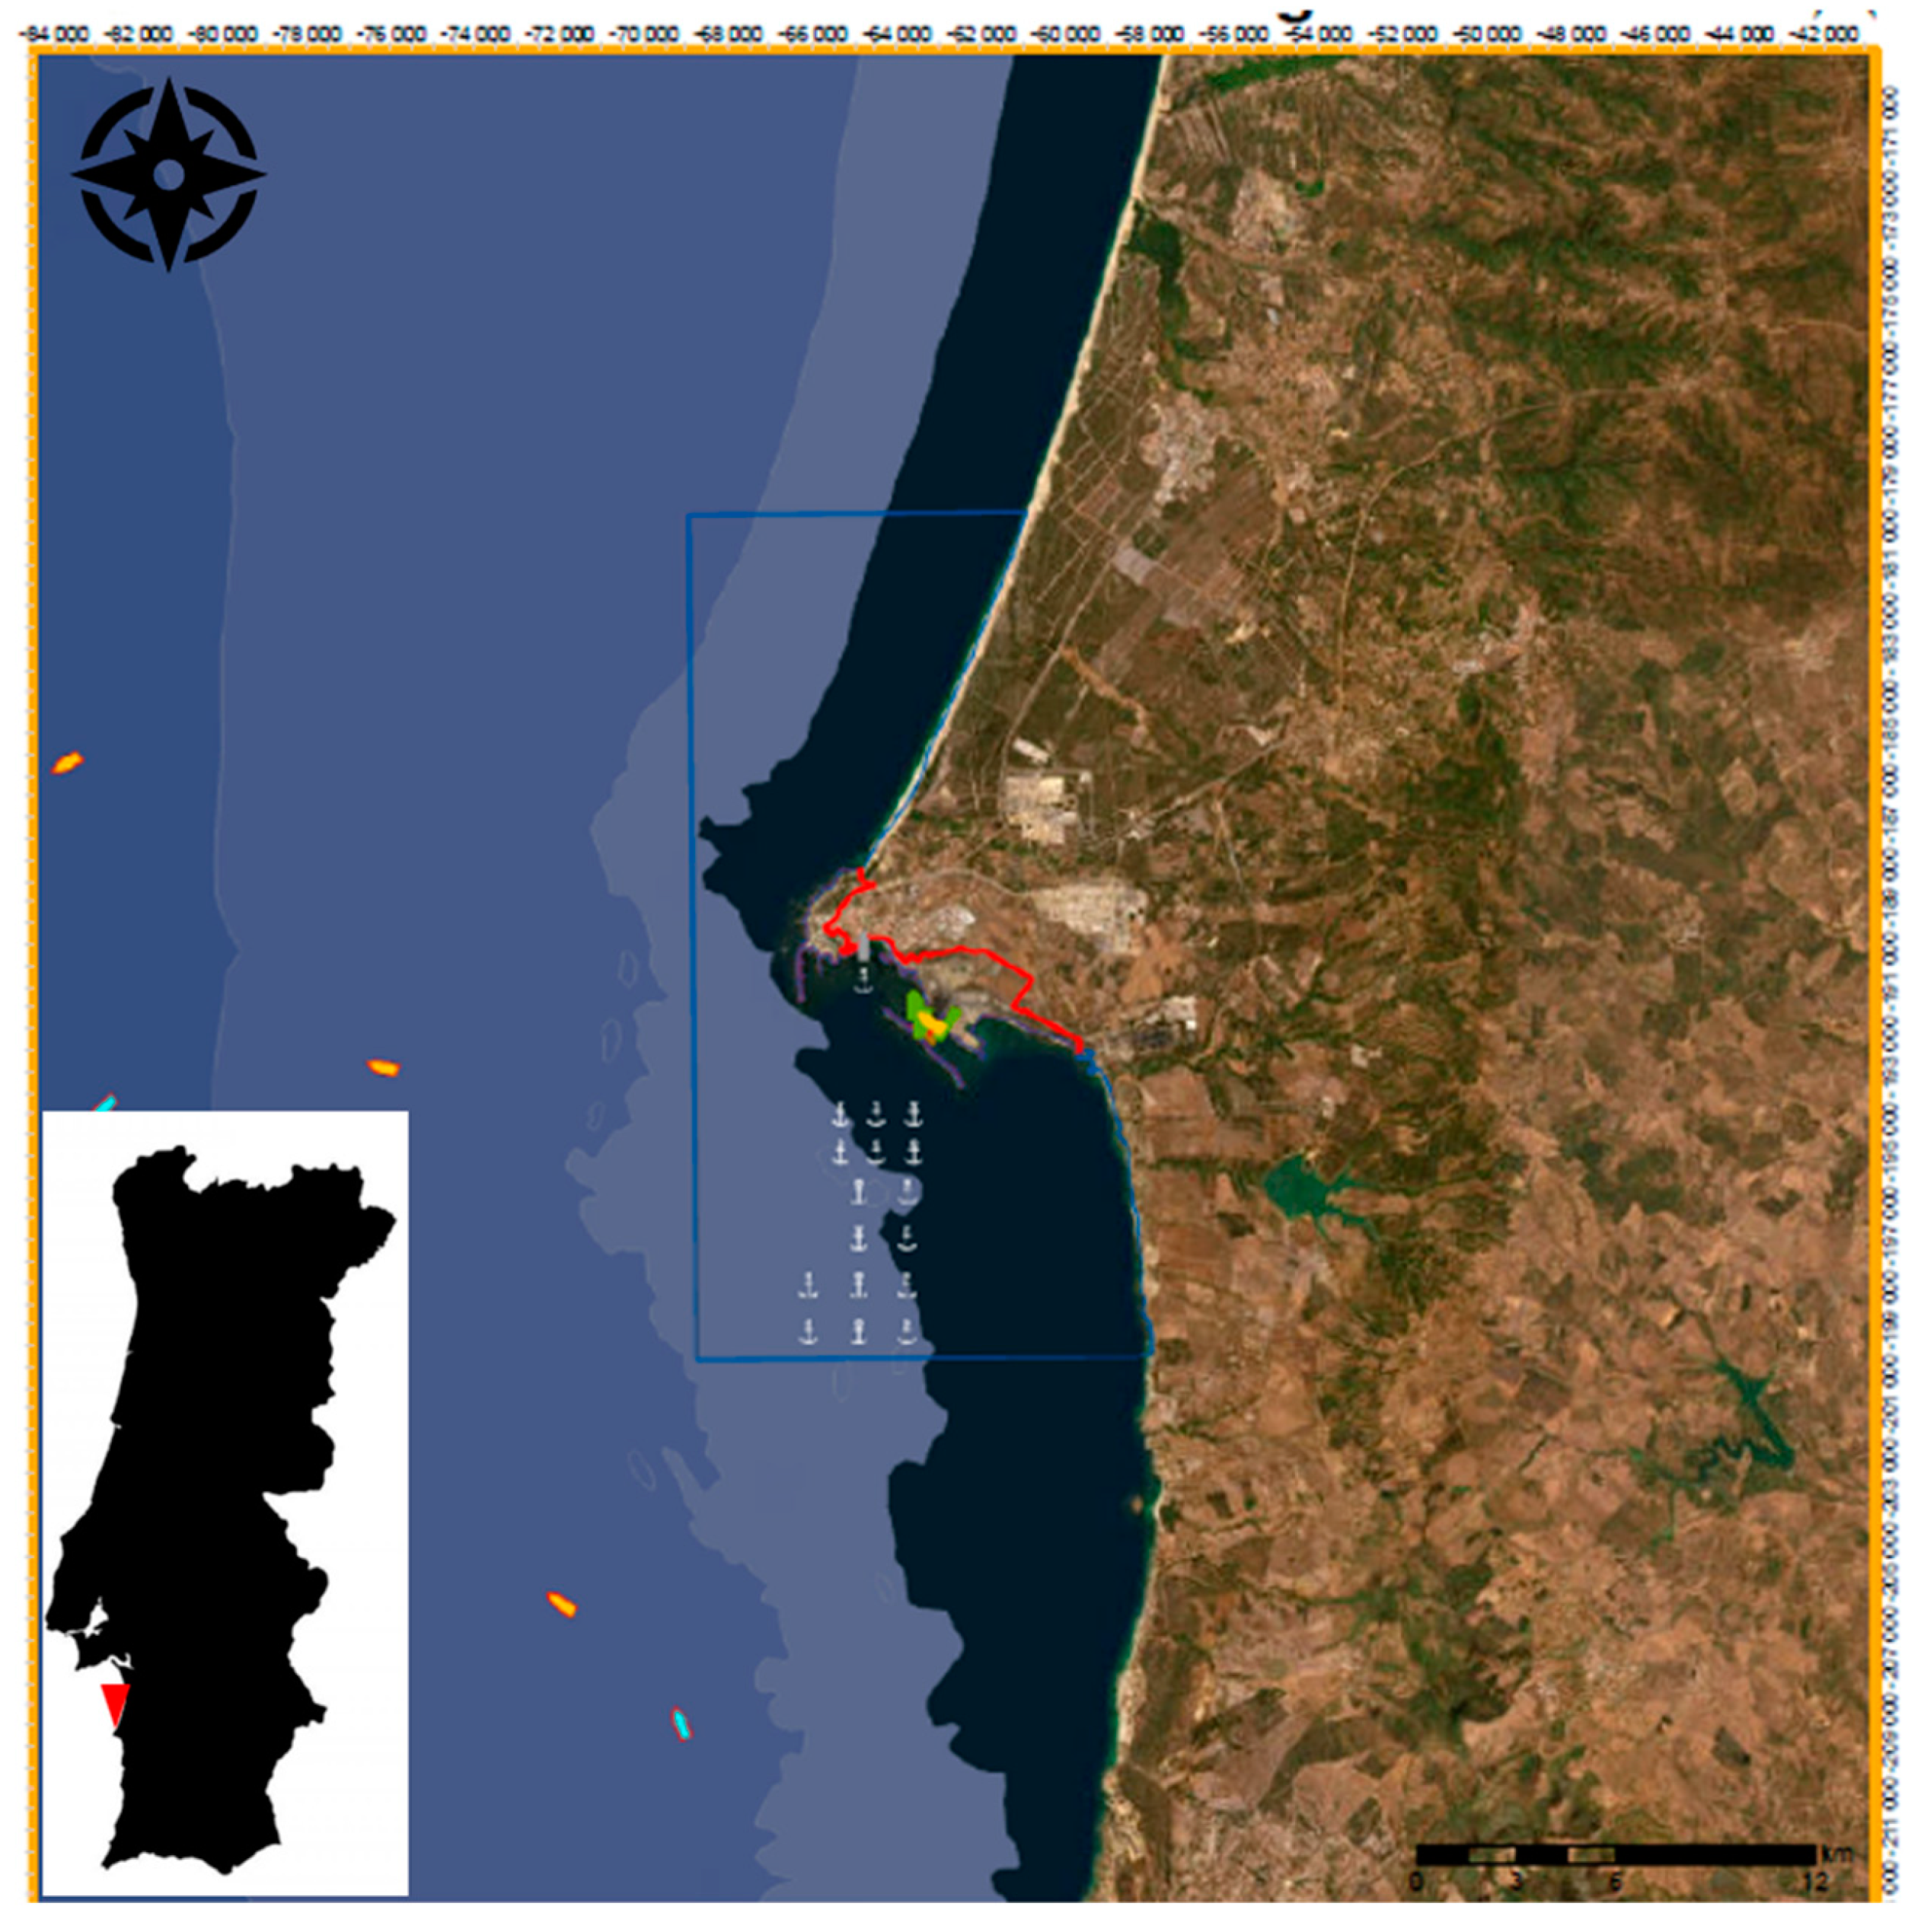
Table 1.
Established rules in the Chapters 3 and 4 of MARPOL Annex VI to reduce emissions from transport maritime [11,12].
| Chapter | Ruler | Define |
|---|---|---|
| 3 | Rule 12 | Substances that deplete the ozone layer defined in the Montreal Protocol and your amendments |
| 3 | Rule 13 | Nitrogen oxides (NOx) |
| 3 | Rule 14 | Sulphur oxides (SOx) and particulate matter (PM) |
| 3 | Rule 15 | Volatile Organic Compounds (VOC) |
| 3 | Rule 18 | Fuel oil quality and availability |
| 4 | Rule 22 | Energy Efficiency Design Index (EEDI) obtained |
| 4 | Rule 23 | Energy Efficiency Existing Index (EEXI) obtained |
| 4 | Rule 24 | EEDI prescribed |
| 4 | Rule 25 | EEXI prescribed |
| 4 | Rule 26 | Ship Energy Efficiency Management Plan (SEEMP) |
| 4 | Rule 27 | Collection and reporting of the data about the ship ’s fuel oil consumption |
| 4 | Rule 28 | Carbon intensity operational (CII) |
Table 2.
Cargo and countries origin / destination of the Port of Sines for the period January-September 2024 [41].
Table 2.
Cargo and countries origin / destination of the Port of Sines for the period January-September 2024 [41].
| Cargo Handling | Total (t) | Total (%) |
| Total Charge | 36.608.437 | 100,00 |
| Liquid Bulk | 18.484.960 | 50,49 |
| Dry Bulk | 323.018 | 0,88 |
| General Cargo | 17.800.458 | 48,62 |
| Countries of origin/destination | Total (t) | Total (%) |
| Portugal | 2.508.480 | 6,85 |
| EU Countries | 6.544.333 | 17,88 |
| Other Countries | 27.555.624 | 75,27 |
Disclaimer/Publisher’s Note: The statements, opinions and data contained in all publications are solely those of the individual author(s) and contributor(s) and not of MDPI and/or the editor(s). MDPI and/or the editor(s) disclaim responsibility for any injury to people or property resulting from any ideas, methods, instructions or products referred to in the content. |
© 2025 by the authors. Licensee MDPI, Basel, Switzerland. This article is an open access article distributed under the terms and conditions of the Creative Commons Attribution (CC BY) license (http://creativecommons.org/licenses/by/4.0/).
Copyright: This open access article is published under a Creative Commons CC BY 4.0 license, which permit the free download, distribution, and reuse, provided that the author and preprint are cited in any reuse.


