
Submitted:
15 December 2023
Posted:
18 December 2023
You are already at the latest version
Abstract
In this work, we report the engineering of a sub-70 nm nanocomposite of ZnO/Zn2TiO4 using a low-temperature solution-phase method. Titanium isopropoxide and zinc acetate were used as precursors, and isopropyl alcohol and water were used as solvents. The investigation focused on the growth of nanocomposites by varying the concentrations of precursors and surfactants, as well as their efficiency within different pH ranges. All three ZnO/Zn2TiO4 nanocomposites consist of hexagonal wurtzite ZnO and Zn2TiO4 structures in the three nanocomposites. The crystallite size in three ZnO/Zn2TiO4 nanocomposites, with a hexagonal wurtzite ZnO structure, were measured to be 62.67, 40.34, and 39.50 nm. The crystallite size values in three ZnO/Zn2TiO4 nanocomposites were 26.15 nm, 25.36 nm, and 21.24 nm, respectively, with Zn2TiO4. Morphological observations, conducted using FESEM, reveal the formation of three ZnO/Zn2TiO4 nanocomposites across the entire sample. These nanocomposites resemble dispersed cotton packets, with sizes ranging from 18 to 350 nm. Peaks in the range of 610-1250cm-1 are attributed to Ti-O bond formation and peak located at 1350-1450 cm-1 are attributed to Zn-O bond formation. Also, EDX spectrum reveals peaks for various sample components such as Ti, O and Zn. UV spectrums confirmed the formation of three nanocomposite of ZnO/Zn2TiO4 as showing two peaks for each sample. Photocatalytic investigation carried out by analyzing the UV-Visible absorption spectra of methylene blue dye on the surface of ZnO/Zn2TiO4 nanocomposites, dye degradation at various irradiation time intervals, dye degradation at varied catalyst concentrations and the influence of pH on dye-degradation. Furthermore, the said nanocomposites were used to degrade environmental pollutant (Methylene blue dye). Different sets of experiments were conducted under ambient conditions which show an excellent photo catalytic degradation efficiency.
Keywords:
ZnO/Zn2TiO4 nanocomposites
; spectrum
; methylene blue
; dye
1. Introduction
In the late 1960s, photocatalysis technology was employed for water and wastewater treatment applications. Organic pollutants, accounting for over 50% of all water pollutants, play a crucial role in water pollution. The presence of toxic contaminants in water and wastewater poses a serious threat to both human beings and aquatic life[1]. Nanotechnology refers to the process of creating nanostructures, which have dimensions between atoms and bulk atom materials. It is important to note that the characteristics of materials at the atomic level differ significantly from those of their bulk counterparts, particularly when the material dimensions are in the nano-scale[2]. Photocatalysis is a technique that utilizes photocatalysts and light irradiation to degrade pollutants. This method is commonly employed in energy generation and environmental restoration efforts[3,4]. Global population expansion has an impact on the supply of clean water with billions of people experiencing a freshwater scarcity[5,6]. Mixed metal oxides additives have gained significant attention in recent years due to their unique properties and potential applications in various fields. These additives are composed of a combination of different metal oxides, which offer enhanced performance compared to individual metal oxides. The addition of mixed metal oxides to different materials has shown promising results in improving their mechanical, electrical, and catalytic properties. These additives can be incorporated into polymers, ceramics, and composites to enhance their strength, conductivity, and reactivity. One of the key advantages of mixed metal oxides additives is their tunable properties. By varying the composition and ratio of different metal oxides, it is possible to tailor the desired characteristics of the final material. This flexibility opens up a wide range of possibilities for their application in various industries, including energy storage, electronics, and environmental remediation. Furthermore, mixed metal oxides additives have shown excellent stability and durability, making them suitable for long-term use in demanding conditions. Their resistance to corrosion and high temperatures makes them ideal for applications in harsh environments.[1,51–53]
Several methods have been introduced for synthesizing ZnO: Zn2TiO4 nanocomposite powder, including the co-precipitation method, sol-gel precipitating method, solid-state reaction, and solution combustion. Among these methods, the sol-gel precipitating method is the most prominent for synthesizing nano-crystalline materials. This is because it allows for the formation of distinctive metastable structures at low reaction temperatures and provides excellent chemical consistency. Additionally, this method offers the added benefit of preparing high purity and well-crystallized powder of the nanocomposites[1]. Nanostructured Zn2TiO4 and zinc oxide (ZnO) are well-known n-type semiconductor materials with wide band-gaps of approximately 3.22 eV and 3.37 eV, respectively. These materials play effective roles in absorbing electromagnetic energy and degrading organic pollutants through photo-degradation. Although Zn2TiO4 and ZnO have similar band-gap energy values, the conduction and valence bands of Zn2TiO4 are located below those of ZnO by approximately 0.48 eV. This difference in redox energy levels between the two metal oxides makes them suitable for the preparation of core-shell heterojunction nanostructures. Despite several reports on the synthesis of ZnO/Zn2TiO4 heterostructures using techniques such as physical vapor deposition, microwave-assisted hydrothermal technique, and radio frequency sputtering, achieving photocatalysts with tunable structures through low-cost fabrication procedures remains a significant challenge. Among the previously published synthesis methods, the co-precipitation technique is a simple chemical process widely used in industrial production due to its cost-effective nature[2].
ZnO/Zn2TiO4 possesses several appealing properties, such as excellent transparency in the visible spectrum, a high piezoelectric constant, a significant electro-optic coefficient, and a substantial excitation binding energy of approximately 60 meV at room temperature[7]. Significant efforts have been made to improve the photocatalytic performance of ZnO/Zn2TiO4 using several approaches. These include doping with other ions, surface coupling with other semiconductors to form a heterojunction, photosensitization, and nano-structure design[8]. They are important binary combination of oxygen and metal that creates the typical characteristics of metallic ions while organizing a sphere of oxygen ions around the metallic ions to provide tightly packed order[9].Reactive electrical transitions and broad band gaps are only a few of the unique properties that these features contribute[10]. Studies examined the beneficial characteristics of ZnO nanostructures that depend on the concentration of Zn2TiO4 [11]. Zn function doping and light stimulator shows enormous importance for semiconductors[12]. Additionally, by decreasing bulk materials using some methods, nanostructures were created. Etching, breaking or cutting methods that are needed for film machining, mould machining and surface machining with lithography produce a "top-down" approach[13].
ZnO/Zn2TiO4 nanocomposite adapted ability for photonic usage in the UV spectral region at room temperature because broad super lattice and high ionization potential energy of 60 meV, respectively[14]. ZnO is a harmless and affordable semiconductor material because it maintains a higher level of chemical stability[15,16].To synthesize ZnO nanostructures with a variety of structures, such as nanorods, nanobelts, nanorings, nanowires, nanoflowers, and many more, several dynamic attempts are required[17,18].The diffuse reflection accessory is measuring the shift in the visible absorption band of ZnO within the temperature reaction chamber by enhancing the ZnO reflectance characteristic when doped with metal atoms[19]. ZnO is a significant semiconductor material because its bandgap energy is near to that of Zn2TiO4 and flaws ultimately describe a drop in the bandgap of ZnO[20]. ZnO exhibits n-type conductivity and is an insulator. Due to this characteristic, it illuminates upon UV light, emitting blue and green fluorescence[21]. A number of oxygen defects are introduced, including vacancies and oxygen interstitial during the solvo thermal process which have an influence on ZnO work[22]. ZnO morphological, structural and optical properties were improved using the appropriate dopants in order to change how ZnO performs[23].However, a useful strategy for producing ZnO nanostructures and other luminous materials is the hydrothermal process[24]. Between ionic and covalent materials, ZnO has iconicity. Wurtzite, zinc blende and rock salt are three different types of ZnO crystal formations[14]. ZnO wurtzite structure is frequently thermodynamically stable in natural settings[25]. The Zn and O ions are arranged in tetrahedrons next to the ZnO structures c axis. This arrangement maintains structure of crystal, which may be dependent on the order in which Zn2+ and O2 layers are stacked, making the entire structure asymmetric. Cations and anions are present at surfaces, hence a ZnO surface has either positive or negative charge[26]. ZnO has a variety of technical uses, including heterogeneous catalysis and optoelectronics, thus it is crucial to presume that its band structure is critical due to potential effects in devices, also improving the functionality of the devices [14].
While variable nanostructures have been developed to dominate the problems, several research groups attempted to improve the photocatalytic performance of metal-oxide semiconductor nanomaterials by synthesizing dual core-shell nanostructures. For example, Kwiatkowskiet al prepared ZnO/Zn2TiO4 core/shell composites by sol-gel deposition of Zn2TiO4 on ZnO nanorods hydrothermally grown on electrically conductive indium tin oxide substrate (ITO) for photodecomposition of methylene blue (MB)[3].
To recognize the band structure of ZnO, a variety of experimental techniques are commonly used, as x-ray induced photo absorption and photoemission spectroscopy[27]. To better comprehend the optoelectronic characteristics of ZnO and other events, it is crucial to understand the ZnO band structure. Because valence band and conduction band zones are equal at k=0, a straight band-gap material, has a wurtzite structure[28]. ZnO nanostructures developed a photocatalytic property to protect against bacteria, fungus, and other viruses. They are also utilized to degrade environmental pollutants. The generation of reactive oxygen species, the catalytic activity used in photo surfactants and UV radiation induced cancer damage all depend on ZnO nanostructures, a common excitation gap semiconductor[29].The processing of higher exciton binding energies by ZnO/Zn2TiO4 also result in efficient exciton emission at ambient temperature and visible spectrum, in addition to the ultra violet spectrum[30]. ZnO PL spectra typically show a UV band that corresponds to (NBE) at room temperature and one or two visible bands that are made up of defects such as interstitial vacancies, extra atoms occupying lattice interstices (missing atoms at regular lattice sites)and complicated defects[31]. Large ZnO nanoparticles provide a white barrier that is unsightly from an aesthetic standpoint[32]. Przybyszewska et al and Zaborski et al have thoroughly investigated the effects of the cross linking activity mechanism on the size, surface, and morphology of ZnO[33]. The use of ZnO as a relief agent for infant diaper rash is a crucial application area in medicine. About 40% of the creams contain ZnO. ZnO is used in cancer treatment to kill tumor cells while causing the least harm to healthy cells[34].
Among the various photocatalysts, Zn2TiO4, as the most widely employed “golden” photocatalysts, has been largely used in heterogeneous photocatalysis, due to its chemical stability, nontoxicity and low cost[35,36]. Zn2TiO4 heterogeneous photocatalysis has grown rapidly over the past twenty years due to a variety of energy and environmental challenges associated to development, such as the direct solar water splitting into H2 and the decomposition of air pollutants and water at low concentrations[37]. Due to the rapid increase of heterogeneous photocatalysis use, the literature describing this field has been summarized in numerous reviews, which not only review the development of photocatalysts and the characterization of photocatalytic processes but also point to the challenges and opportunities confronting heterogeneous photocatalysis[38]. To the best of our knowledge, we are reporting the first instance of enhanced photoreactivity in the ZnO/Zn2TiO4 nanocomposite.
2. Experimental Details
2.1. Materials
In the present research work, zinc acetate, titanium tetra-isopropoxide, absolute ethanol, distilled water were used. All chemicals were purchased from Sigma Aldrich having analytical grades.
2.2. Synthesis of ZnO/Zn2TiO4 nanocomposites
Three nanocomposite compositions were produced using the sol-gel method: 85ZnO-15 Zn2TiO4, 75ZnO-25 Zn2TiO4, and 65ZnO-35 Zn2TiO4. Weighed amounts of Zn(CH3COO)2.2H2O powder (11.5g, 9.8g, and 7.6g) were added to the mixture, which was then agitated for 25 minutes at 40°C. To synthesize the NaOH solution, distilled water (130mL, 115mL, and 100mL) was added to NaOH pellets (4.2g, 3.6g, and 3.2g) and stirred continuously for 25 minutes at 40°C. The Zn(CH3COO)2.2H2O solution was then added, and the mixture was agitated for approximately 140 minutes. The ZnO sol was formed once the stirring was completed. Meanwhile, 50mL of ethanol was mixed with 5mL, 10mL, and 15mL of titanium (IV) isopropoxide and agitated for 30 minutes to achieve homogeneity. After that, the solution was ionized with 20mL of distilled water. Precipitation of ZnO/Zn2TiO4 was observed when the ZnO and Zn2TiO4 sols were combined and stirred for 250 minutes at 30°C. The precipitate was then left for 25 hours, filtered using filter paper, rinsed with distilled water, and dried at 150°C overnight in an oven. Finally, the dried powder was calcined at 710°C for 3 hours[39].
2.3. Characterization
The SEM and EDX analysis were conducted using the FEI NOVA nano SEM 450, which was equipped with an Oxford EDX detector. X-ray diffraction measurements were performed using the Bruker D2 Phaser XRD model. The FTIR spectrum of three ZnO/Zn2TiO4 nanocomposites was recorded in KBr using the FTIR-8400S instrument from Shimadzu, within the range of 4000-400 cm-1. The absorption spectra and other photocatalytic measurements were obtained using the Shimadzu UV-2600 spectrophotometer, which is an Ultraviolet-visible instrument.
3. Results and Discussion
3.1. Scanning electron microscopy (SEM) and energy dispersive x-ray spectroscopy
Figure 1(a, b, c) show the micro structures of three ZnO/Zn2TiO4 nanocomposite. ZnO/Zn2TiO4 nanocomposites structures were explained having magnitude of 200 nm which are displayed. The particles thickness in three ZnO/Zn2TiO4 nanocomposite ranged in diameter from 18-350nm. The size of the spherical nanocomposite in this study indicates the structure of the ZnO/Zn2TiO4 nanocomposites. [40,41].
Using the EDX method, the elemental composition of sample materials was identified. Figure 1 show the EDX spectrum for synthesized three ZnO/Zn2TiO4 nanocomposite. The EDX spectrum shows peaks for different contents in the synthesized sample. The ZnO/Zn2TiO4 nanocomposites synthesis was confirmed by the presence of peaks for Zn, O and Ti. Zn, O and Ti make up a significant amount of the final products weight as seen by the spectra. As in three ZnO/Zn2TiO4 nanocomposite, element Zn having weight percentage 49.44%, 48.03%, 42.28% while element Ti having weight percentage 22.22%, 20.29%, 23.26%. Also element O having weight percentage 25.8%, 31.69%, 34.46%. An EDX examination shows the presence of the anticipated ZnO/Zn2TiO4 nanocomposite components with no additional impurities or elements discovered, demonstrating that the nanocomposites were properly manufactured. Zn, Ti, and O all are included and their weight percentages almost exactly match the composition[42].
3.2. X-ray Diffraction Analysis (XRD)
XRD confirm hexagonal wurtzite ZnO and Zn2TiO4 synthesized three ZnO/Zn2TiO4 nanocomposite. Other reflections in the XRD pattern as synthesized three ZnO/Zn2TiO4 nanocomposite have been observed at 2θ = 31.98ᴼ, 34.56ᴼ, 36.45ᴼ,42.75ᴼ,63.05ᴼ which are consistent with Miller indices of (100), (002), (101), (102), (110) represented ZnO (JCPDS card no: 36-1451) which nicely matched to observed peaks and showed that they are highly crystalline.
Figure 2.
XRD pattern of synthesized ZnO/Zn2TiO4 nanocomposite, a) 85% ZnO-15% Zn2TiO4 nanocomposite b) 75% ZnO-25% Zn2TiO4 nanocomposite c) 65% ZnO-35% Zn2TiO4 nanocomposite.
Figure 2.
XRD pattern of synthesized ZnO/Zn2TiO4 nanocomposite, a) 85% ZnO-15% Zn2TiO4 nanocomposite b) 75% ZnO-25% Zn2TiO4 nanocomposite c) 65% ZnO-35% Zn2TiO4 nanocomposite.
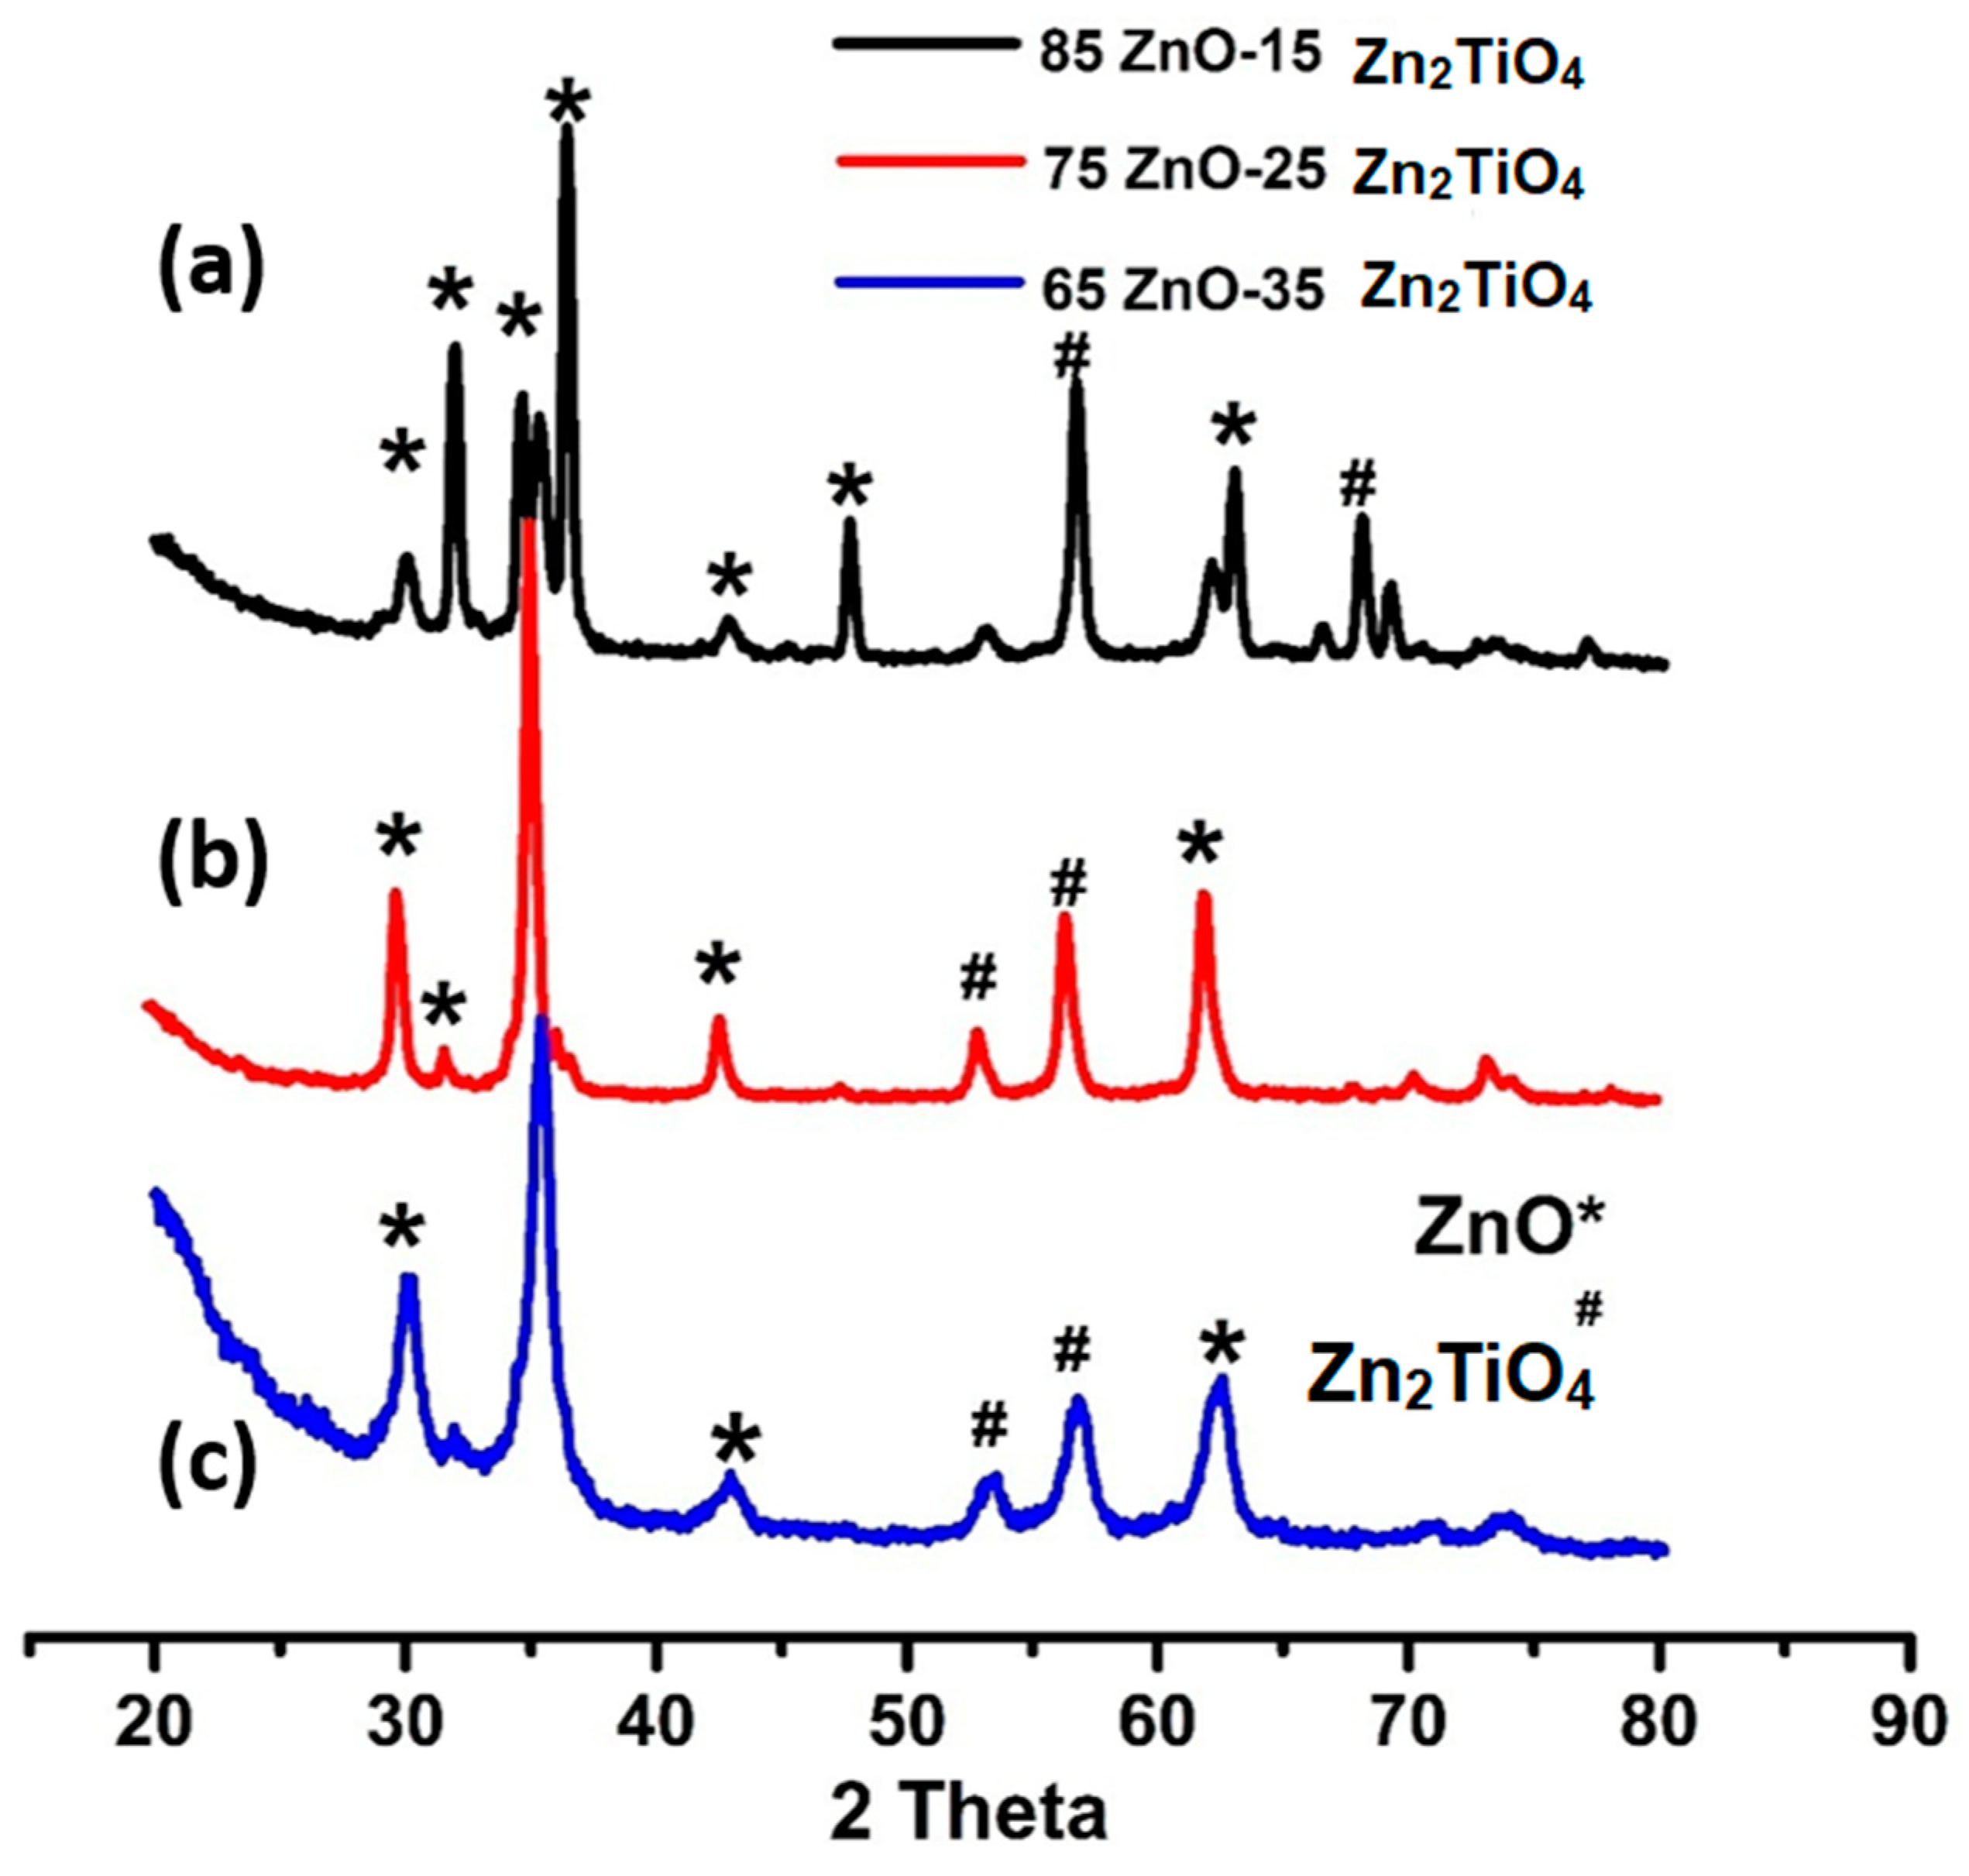
Also, peaks at 53.8° ,56.75° , 69.90°which are consistent with Miller indices of (020), (110),(220) corresponded to Zn2TiO4 phase (JCPDS card 25-1164). Furthermore, grain sizes of ZnO/ Zn2TiO4 nanocomposites are determined using the Scherer formula.
where D is the average grain-size, which might be smaller or larger than grain size, β indicates full width at half maximum of peak in radian and ‘θ’ shows Bragg's angle. ZnO crystallite sizes in ZnO/Zn2TiO4 nanocomposite, values were 62.67, 40.34 and 39.50nm. While, anatase phase size values were 26.15, 25.36 and 21.24nm respectively[39,41].
3.3. Fourier Transform Infrared Spectroscopy (FTIR)
A double beam spectrophotometer was used to analyze the chemically synthesized sample. Figure 3(a) shows the FTIR spectra of the ZnO/Zn2TiO4 nanocomposite, with peaks observed at 3413cm-1, 2070cm-1, 1639cm-1, 1381cm-1, and 1117cm-1. In Figure 3(b) on the left, the FTIR spectra of the ZnO/Zn2TiO4 nanocomposites reveal peaks at 3442cm-1, 1629cm-1, 1404cm-1, 1116cm-1, and 611cm-1.
Figure 3(c) at left displays the FTIR spectra of ZnO/Zn2TiO4 nanocomposite in which the peaks at 3454cm-1, 1637cm-1, 1384cm-1, 1240cm-1 and 615cm-1 were obtained. Peaks in the range of 610-1250cm-1 are attributed to Ti-O bond formation. Peak at 3652-3170cm-1 represents O-H bond. Peak at 1610-2335cm-1 is attributed to bending vibrations of C=O molecule. Peak located at 1350-1450 cm-1are attributed to Zn-O bond formation [43,44].
3.4. Ultra Violet-Visible Spectroscopy
Intense peaks are seen in the UV spectrum of three ZnO/Zn2TiO4 nanocomposites.
In Figure 4(a), the synthesized ZnO/Zn2TiO4 nanocomposite showed absorbance at 345nm and 251nm. In Figure 4(b), the synthesized ZnO/Zn2TiO4 nanocomposite showed absorbance at 341nm and 285nm respectively. In Figure 4(c), the synthesized ZnO/Zn2TiO4 nanocomposite showed absorbance at 354nm and 288nm. This is an indication of the fact that the synthesized ZnO/Zn2TiO4 nanocomposites are photosensitive in UV region [45,46].
3.5. Photo catalytic activity
The photocatalytic activity of three ZnO/Zn2TiO4 nanocomposite was compared by using methylene blue dye as the model pollutant. Experiments used 20 mL of methylene blue solution with 2mg of the catalyst suspended in it while being exposed to UV light. By stirring the reaction mixture for 30 minutes in the dark prior to irradiation, the adsorption-desorption equilibrium was achieved. Stirring the reaction mixture in the dark, no decrease in methylene blue concentration due to no absorption by dye(MB) solution but under light passing time with repeated interval of 20min absorbance shown by MB solution (as depicted in Figure 5).
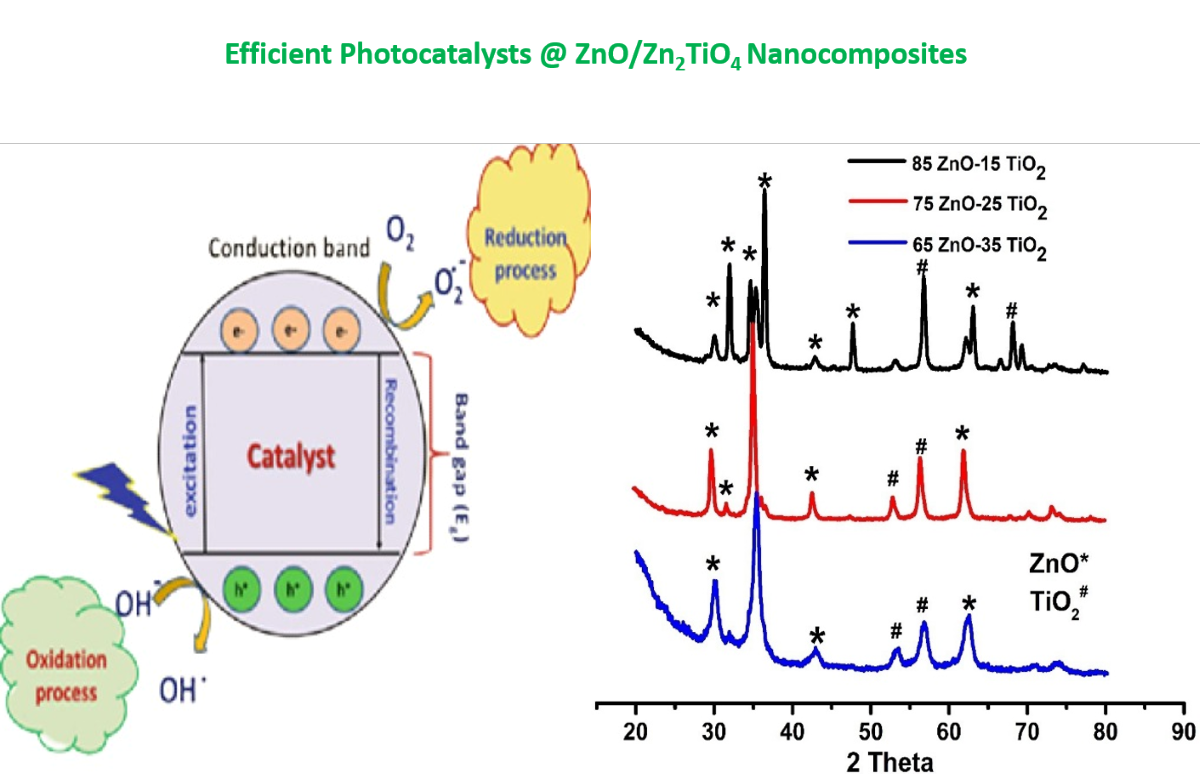
The ZnO/ Zn2TiO4 nanocomposites exhibits an increase in photocatalytic activity due to the synergistic interaction of Zn2TiO4 and ZnO. The design of the heterojunction because of the interfacial contact between ZnO and Zn2TiO4 may be the cause of this rising influence in catalytic activity. When a photo catalyst is exposed to radiation, the valence band and conduction band of the catalyst create a pair of positive holes and electrons. Positive photo generated holes switch from Zn2TiO4 to ZnO valence band. It causes the separation of positive holes and photo excited electrons, which in turn increase the life of charge carriers. The OH radicals are produced, when positive holes oxidize water molecules, while super oxide anions are produced, when photo excited electrons decrease dissolved oxygen molecules. The dye molecules are converted to inorganic by-products, by these OH radicals. The separation of positive holes and photo excited electrons increase the production of OH radicals, which enhanced the photocatalytic activity [47,48].
Following is a summary of the suggested mechanism:
Catalyst + Irradiation → h+VB + e− CB
(1) h +VB + H2O → OH + H+
(2) e− CB + O2 → O2−
(3) H+ + O2− → HO2
(4) HO2 → H2O2 + O2
(5) H2O2 → OH
(6) OH + MB → Degradation products
It is clear that OH radicals were crucial in the methylene blue dye breakdown. The photonic crystal structure of ZnO/Zn2TiO4 has a great capacity for light harvesting and its hetero structure has the ability to separate the photo generated electron-hole pairs. The catalytic activity of the composites ZnO/Zn2TiO4 catalyst increases as a result of both of these characteristics. One of the factors that lowers the cost of the catalytic process is the recycling of the photo catalyst [49].
As seen in Figure 6, Figure 7, Figure 8 and Figure 9, the effects of several experimental conditions including time, catalyst amount, dye concentration and pH on the percentage of degradation were carefully evaluated. The photo-degradation efficiency of methylene blue (MB) was calculated by using the following equation.
Where, C0 and Ce corresponds to the initial and final concentration of dye before and after photo irradiation.
Degradation (% ) = C0 – Ce C 0 × 100
The dye degradation properties of three ZnO/Zn2TiO4 nanocomposite on MB dye surface were investigated.
According to Fig. 6,degrading effectiveness of ZnO/Zn2TiO4 nanocomposites on MB dye were examined along with interval of time as at 0-30min degradation percentage is zero but passing time with repeated interval of 20min percentage degradation goes on increasing. Nanocomposite “a”( at time 50min,70min,90min,110min) percentage degradation goes on increasing to 5%,35%,70%,80% ,100% degradation. Nanocomposite “b”( at time 50min,70min,90min,110min,130min,150min) percentage degradation goes on increasing to 6%,8%,12%,15%,25%,36% degradation. Nanocomposite “c”( at time 50min,70min,90min,110min,130min) percentage degradation goes on increasing to 3%,10%,20%,25% ,34% degradation [40,41,50].
Fig. 7 used to demonstrate the removal effectiveness of MB dye with various catalyst amounts. The findings show that the percentage degradation efficiency rises with increasing catalyst amount of three different ZnO/Zn2TiO4 nanocomposite as starting from 1mg and taking 30ml MB dye solution. In nanocomposite “a” increasing amount from 2-8mg %degradation (20-80%), in nanocomposite “b” increasing amount from 2-4mg %degradation (33-70%), in nanocomposite “c” increasing amount from 2-5mg %degradation (3-60%). The degradation% efficiency goes on increasing, which could be attributed to an increase in the number of accessible adsorption sites on the catalyst surface[40].
When using ZnO/Zn2TiO4 nanocomposites, it was discovered that the percentage of degradation efficacy decreased as the concentration of dye increased. In nanocomposite “a” increasing conc(5ml, 20ml, 35ml, 50ml) results in decreasing degradation(85%, 64%, 30%,0%), in nanocomposite “b” increasing conc(5ml, 10ml, 20ml, 30ml, 45ml) results in decreasing degradation(85%, 45%, 25%, 10%, 0%), in nanocomposite “c” increasing conc(5ml, 20ml, 30ml, 45ml) results in decreasing degradation(92%, 38%, 12%, 0%) as shown in Figure 8. As a result of the Vander Waals contact between the catalyst and dye, there are fewer adsorption sites, which lead to degradation. The influence of amount of catalyst on percentage degradation of dye (MB) efficacy was observed using a series of adsorption tests[40].
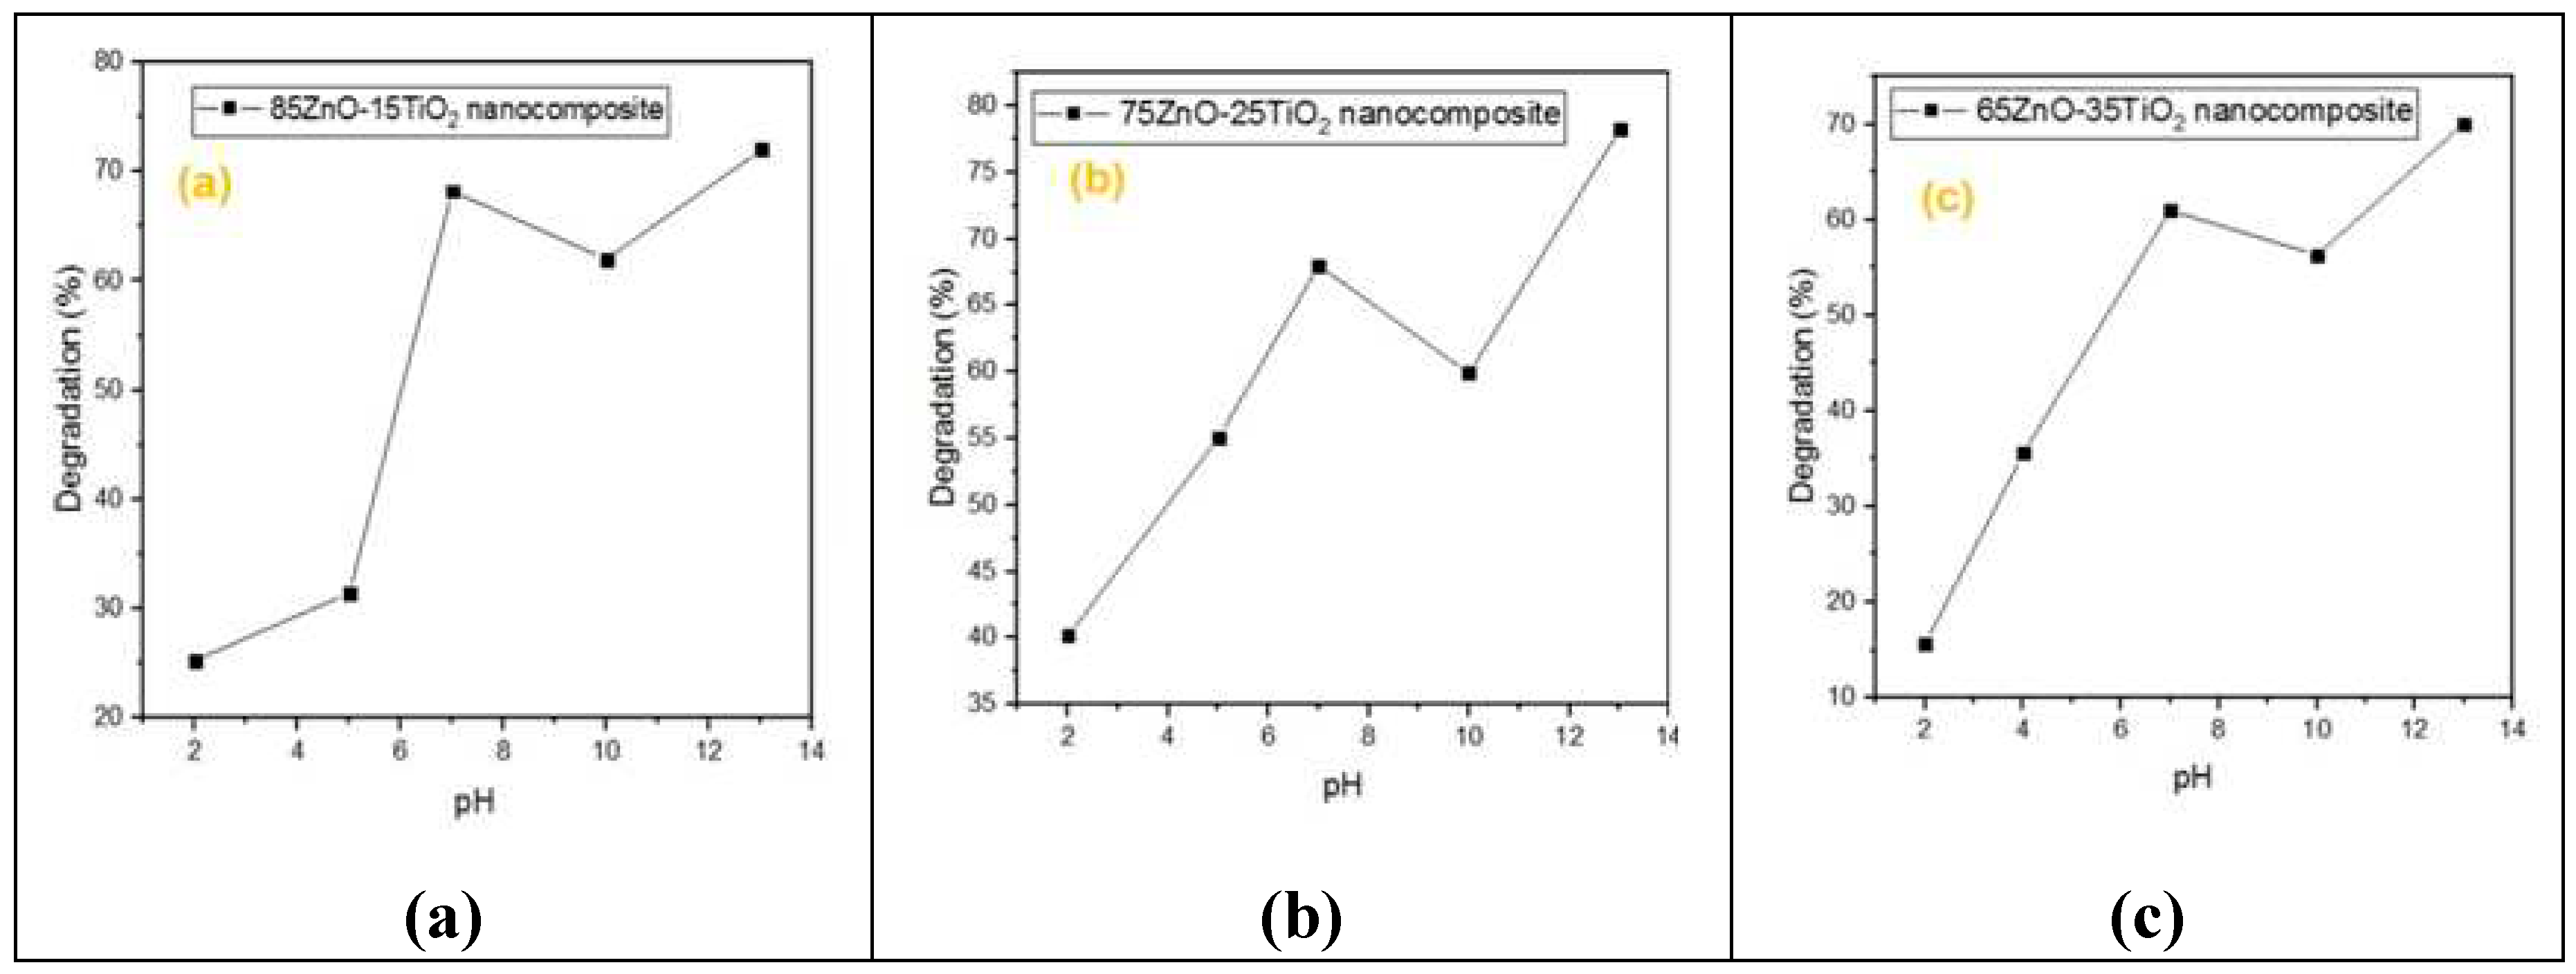
The pH directly affects the surface binding sites, surface charges, and structural characteristics of the dye molecule. As a result, the pH effect on percent dye degradation efficacy was observed by varying the solution pH from 2 to 13 using 0.1 M HCl and NaOH solutions, as shown in Figure 9. Nanocomposite “a” at pH(7, 10, 13) degradation (68%, 62%, 70%),in nanocomposite “b” at pH(7, 10, 13) degradation (68%, 60%, 78%), in nanocomposite “c” at pH(7, 10, 13) degradation (60%, 57%, 70%) and at low pH range nanocomposite “a” at pH(2, 5) degradation (5%, 30%), in nanocomposite “b” at pH(2, 5) degradation (40%, 55%), in nanocomposite “c” at pH(2, 4) degradation (5%, 35%). Low pH to high pH increased the degradation efficiency, which may have caused the -ive charge to decrease as a result of H+ neutralization. However, at pH levels higher than 7, some decreased may be as a result of increased competition between H+ and dye. The appearance of a -ive charge on ZnO/Zn2TiO4 nanocomposites is compatible with the zeta potential results of the breakdown of dye molecules with various charges at various pH levels. As a result, it has been found that the degradation of dyes is extremely specific to the surface charge of the catalyst. Thus, ZnO/ Zn2TiO4 nanocomposites may be categorized as ultrafast catalysts, which would be very beneficial for the quick and significant destruction of dangerous compounds[40,50].
4. Conclusion
The sol-gel technique was found to be an efficient, quick, easy, and inexpensive method for fabricating three ZnO/Zn2TiO4 nanocomposites. These nanocomposites were formed to study the degradation of methylene blue dye in the presence of sunlight. Various characterization methods, including XRD, EDX, UV-VIS, SEM, and FTIR, were used to investigate the physiochemical characteristics of the samples. FESEM observations revealed the formation of ZnO/Zn2TiO4 nanocomposites with a size range of 18-350 nm, resembling spread-out cotton packets. XRD measurements confirmed the formation of wurtzite ZnO and Zn2TiO4 structures in the three nanocomposites. UV spectra also confirmed the formation of the nanocomposites, showing two peaks for each sample. FTIR spectra further confirmed the formation of the nanocomposites, with peaks indicating Ti-O and Zn-O bond formations. The elemental composition of the nanocomposites was determined using energy dispersive X-ray spectroscopy, which revealed peaks for Ti, O, and Zn. Photocatalytic investigations were then carried out, analyzing the UV-visible absorption spectra of the dye on the nanocomposite surface, degradation of the dye at different irradiation time intervals and catalyst concentrations, and the influence of pH on dye degradation. The chemical synthesis of ZnO/Zn2TiO4 nanocomposites using the sol-gel method demonstrated its simplicity and ease of fabrication. This work obliges as an inspiration for young scientists to explore the potential applications of ZnO/Zn2TiO4 nanocomposites, particularly in photocatalytic activity studies.
Author Contributions
Conceptualization, M.H..; methodology, H.A.A.; validation, H.A.A. and S.S.; formal analysis, J.K., M.U.H..; investigation, H.A.A and A.K..; writing—original draft preparation, H.A.A, M.H.,; writing—review and editing, J.K., M.M.A.; visualization, S.K.C.; supervision, J.K.; project administration, M.H.; funding acquisition, M.M.A. All authors have read and agreed to the published version of the manuscript.
Funding
Princess Nourah Bint Abdulrahman University, Riyadh, Saudi Arabia.
Acknowledgments
We are thankful to Princess Nourah bint Abdulrahman University for funding our project through Researchers Supporting Project number (PNURSP2023R56), Princess Nourah bint Abdulrahman University, Riyadh, Saudi Arabia.
Conflicts of Interest
The Authors declare no conflict of interest.
References
- Bhanvase, B., T. Shende, and S.J.E.T.R. Sonawane, A review on graphene–TiO2 and doped graphene–TiO2 nanocomposite photocatalyst for water and wastewater treatment. 2017. 6(1): p. 1-14.
- Roco, M.C., C.A. Mirkin, and M.C.J.J.o.n.r. Hersam, Nanotechnology research directions for societal needs in 2020: summary of international study. 2011, Springer. p. 897-919. [CrossRef]
- Khalid, A., et al., A practical method for incorporation of Fe (III) in Titania matrix for photocatalytic applications. 2021. 8(4): p. 045006. [CrossRef]
- Wu, T., et al., Application of QD-MOF composites for photocatalysis: Energy production and environmental remediation. 2020. 403: p. 213097. [CrossRef]
- Raza, A., et al., Enhanced industrial dye degradation using Co doped in chemically exfoliated MoS2 nanosheets. 2020. 10(5): p. 1535-1544. [CrossRef]
- Raza, A., et al., Liquid-phase exfoliated MoS 2 nanosheets doped with p-type transition metals: a comparative analysis of photocatalytic and antimicrobial potential combined with density functional theory. 2021. 50(19): p. 6598-6619. [CrossRef]
- Wang, L.-L., Z.-Q. Ren, and Q.J.J.o.M.S.M.i.E. Li, Improvement in optical and electrical properties of ZnO films by neodymium and aluminum co-doping. 2014. 25(7): p. 2992-2997. [CrossRef]
- Yang, L., et al., Synthesis, characterization and photocatalytic activity of porous WO3/TiO2 hollow microspheres. 2014. 313: p. 470-478.
- Yu, X., T.J. Marks, and A.J.N.m. Facchetti, Metal oxides for optoelectronic applications. 2016. 15(4): p. 383-396. [CrossRef]
- Serpone, N., et al., Why do hydrogen and oxygen yields from semiconductor-based photocatalyzed water splitting remain disappointingly low? Intrinsic and extrinsic factors impacting surface redox reactions. 2016. 1(5): p. 931-948. [CrossRef]
- Sharma, P.K., et al., Doping dependent room-temperature ferromagnetism and structural properties of dilute magnetic semiconductor ZnO: Cu2+ nanorods. 2009. 321(24): p. 4001-4005.
- Kryshtab, T., et al., Thin ZnS: Cu, Ga and ZnO: Cu, Ga film phosphors. 2002. 403: p. 76-80.
- Majumder, D.D., et al., Nano-materials: Science of bottom-up and top-down. 2007. 24(1): p. 9-25.
- Özgür, Ü., et al., A comprehensive review of ZnO materials and devices. 2005. 98(4): p. 11. [CrossRef]
- Li, Y., et al., Enhanced electrical properties of ZnO transparent conducting films prepared by electron beam annealing. 2018. 428: p. 191-198. [CrossRef]
- Vaidyanathan, R., et al., RETRACTED: Nanosilver—The burgeoning therapeutic molecule and its green synthesis. 2009. 27(6): p. 924-937. [CrossRef]
- Peng, Y., et al., Polymer-controlled crystallization of zinc oxide hexagonal nanorings and disks. 2006. 110(7): p. 2988-2993. [CrossRef]
- Koziej, D., A. Lauria, and M.J.A.m. Niederberger, 25th anniversary article: metal oxide particles in materials science: addressing all length scales. 2014. 26(2): p. 235-257. [CrossRef]
- Chanakul, A., et al., Controlling the reversible thermochromism of polydiacetylene/zinc oxide nanocomposites by varying alkyl chain length. 2013. 389(1): p. 106-114. [CrossRef]
- Shanmugam, V. and K.S.J.A.S.S. Jeyaperumal, Investigations of visible light driven Sn and Cu doped ZnO hybrid nanoparticles for photocatalytic performance and antibacterial activity. 2018. 449: p. 617-630. [CrossRef]
- Khan, M.F., et al., Sol-gel synthesis of thorn-like ZnO nanoparticles endorsing mechanical stirring effect and their antimicrobial activities: Potential role as nano-antibiotics. 2016. 6(1): p. 1-12. [CrossRef]
- Zheng, Y., et al., Luminescence and photocatalytic activity of ZnO nanocrystals: correlation between structure and property. 2007. 46(16): p. 6675-6682. [CrossRef]
- Zhang, Y., E.-W. Shi, and Z.-Z.J.J.o.c.g. Chen, Synthesis and magnetic properties of Mn-doped ZnO hollow nanospheres. 2008. 310(11): p. 2928-2933. [CrossRef]
- Baruah, S., J.J.S. Dutta, and t.o.a. materials, Hydrothermal growth of ZnO nanostructures. 2009. [CrossRef]
- Morkoç, H. and Ü. Özgür, Zinc oxide: fundamentals, materials and device technology. 2008: John Wiley & Sons.
- Wang, Z.L.J.M.S. and E.R. Reports, ZnO nanowire and nanobelt platform for nanotechnology. 2009. 64(3-4): p. 33-71.
- Muller, S., et al., Microscopic Identification of Hot Spots in Multibarrier Schottky Contacts on Pulsed Laser Deposition Grown Zinc Oxide Thin Films. 2012. 59(3): p. 536-541. [CrossRef]
- Klingshirn, C.J.p.s.s., ZnO: From basics towards applications. 2007. 244(9): p. 3027-3073. [CrossRef]
- Hameed, A.S.H., et al., In vitro antibacterial activity of ZnO and Nd doped ZnO nanoparticles against ESBL producing Escherichia coli and Klebsiella pneumoniae. 2016. 6(1): p. 1-11. [CrossRef]
- Djurišić, A., et al., Green, yellow, and orange defect emission from ZnO nanostructures: Influence of excitation wavelength. 2006. 88(10): p. 103107. [CrossRef]
- Djurišić, A.B. and Y.H.J.s. Leung, Optical properties of ZnO nanostructures. 2006. 2(8-9): p. 944-961.
- Xu, M., et al., Contribution of physicochemical characteristics of nano-oxides to cytotoxicity. 2010. 31(31): p. 8022-8031. [CrossRef]
- Przybyszewska, M. and M.J.E.P.L. Zaborski, The effect of zinc oxide nanoparticle morphology on activity in crosslinking of carboxylated nitrile elastomer. 2009. 3(9): p. 542-552. [CrossRef]
- Costa, B., et al., ZnO nanoparticles with different sizes and morphologies for medical implant coatings: Synthesis and cytotoxicity. 2018. 8(2): p. 587-595. [CrossRef]
- Fujishima, A., et al., Titanium dioxide photocatalysis. 2000. 1(1): p. 1-21. [CrossRef]
- Monmaturapoj, N., et al., Antiviral activity of multifunctional composite based on TiO2-modified hydroxyapatite. 2018. 92: p. 96-102. [CrossRef]
- Ibhadon, A.O. and P.J.C. Fitzpatrick, Heterogeneous photocatalysis: recent advances and applications. 2013. 3(1): p. 189-218. [CrossRef]
- Linsebigler, A.L., G. Lu, and J.T.J.C.r. Yates Jr, Photocatalysis on TiO2 surfaces: principles, mechanisms, and selected results. 1995. 95(3): p. 735-758. [CrossRef]
- Ali, M.M., et al., Nano synthesis of ZnO–TiO2 composites by sol-gel method and evaluation of their antibacterial, optical and photocatalytic activities. 2021. 11: p. 100199.
- Khalid, A., et al., Cytotoxic and photocatalytic studies of hexagonal boron nitride nanotubes: a potential candidate for wastewater and air treatment. 2022. 12(11): p. 6592-6600. [CrossRef]
- AsadzadehPatehkhor, H., M. Fattahi, and M.J.S.R. Khosravi-Nikou, Synthesis and characterization of ternary chitosan–TiO2–ZnO over graphene for photocatalytic degradation of tetracycline from pharmaceutical wastewater. 2021. 11(1): p. 1-17. [CrossRef]
- SANUSI, I.J., Synthesis, Characterization, and Analysis of TiO2/ZnO Composites Thin Films Photocatalysts for Ethanol Vapor Oxidation. 2021, Miami University.
- Landge, V.K., et al., Solar-Energy-Driven Cu-ZnO/Zn2TiO4Nanocomposite Photocatalyst for the Rapid Degradation of Congo Red Azo Dye. 2022. 12(6): p. 605.
- Jagtap, S., K.J.S. Priolkar, and A.B. Chemical, Evaluation of ZnO nanoparticles and study of ZnO–TiO2 composites for lead free humidity sensors. 2013. 183: p. 411-418. [CrossRef]
- Chivukula, V., et al., ZnO nanoparticle surface acoustic wave UV sensor. 2010. 96(23): p. 233512. [CrossRef]
- Pavasupree, S., et al., Hydrothermal synthesis, characterization, photocatalytic activity and dye-sensitized solar cell performance of mesoporous anatase TiO2 nanopowders. 2008. 43(1): p. 149-157. Authors. [CrossRef]
- Zhang, X., et al., Recent advances in porous graphene materials for supercapacitor applications. 2014. 4(86): p. 45862-45884. [CrossRef]
- Lin, L., et al., A highly efficient TiO 2@ ZnO n–p–n heterojunction nanorod photocatalyst. 2013. 5(2): p. 588-593.
- Momeni, M.M. and Y.J.J.o.A.E. Ghayeb, Visible light-driven photoelectrochemical water splitting on ZnO–TiO2 heterogeneous nanotube photoanodes. 2015. 45(6): p. 557-566.
- Lian, G., et al., Boron nitride ultrathin fibrous nanonets: one-step synthesis and applications for ultrafast adsorption for water treatment and selective filtration of nanoparticles. 2013. 5(24): p. 12773-12778. [CrossRef]
- Upadhyay, G.K., et al., Synthesis of ZnO: TiO2 nanocomposites for photocatalyst application in visible light. 2019. 160: p. 154-163.
- Lachom, V., P. Poolcharuansin, and P.J.M.R.E. Laokul, Preparation, characterizations and photocatalytic activity of a ZnO/Zn2TiO4nanocomposite. 2017. 4(3): p. 035006.
- Haghighatzadeh, A., et al., Improved photocatalytic activity of ZnO-TiO2 nanocomposite catalysts by modulating TiO2 thickness. 2019. 6(11): p. 115060.
Figure 1.
FESEM magnification micrograph and EDX analysis of synthesized ZnO- Zn2TiO4 nanocomposite, a)85% ZnO-15% Zn2TiO4 nanocomposite b) 75% ZnO-25% Zn2TiO4 nanocomposite c) 65% ZnO-35% Zn2TiO4 nanocomposite.
Figure 1.
FESEM magnification micrograph and EDX analysis of synthesized ZnO- Zn2TiO4 nanocomposite, a)85% ZnO-15% Zn2TiO4 nanocomposite b) 75% ZnO-25% Zn2TiO4 nanocomposite c) 65% ZnO-35% Zn2TiO4 nanocomposite.
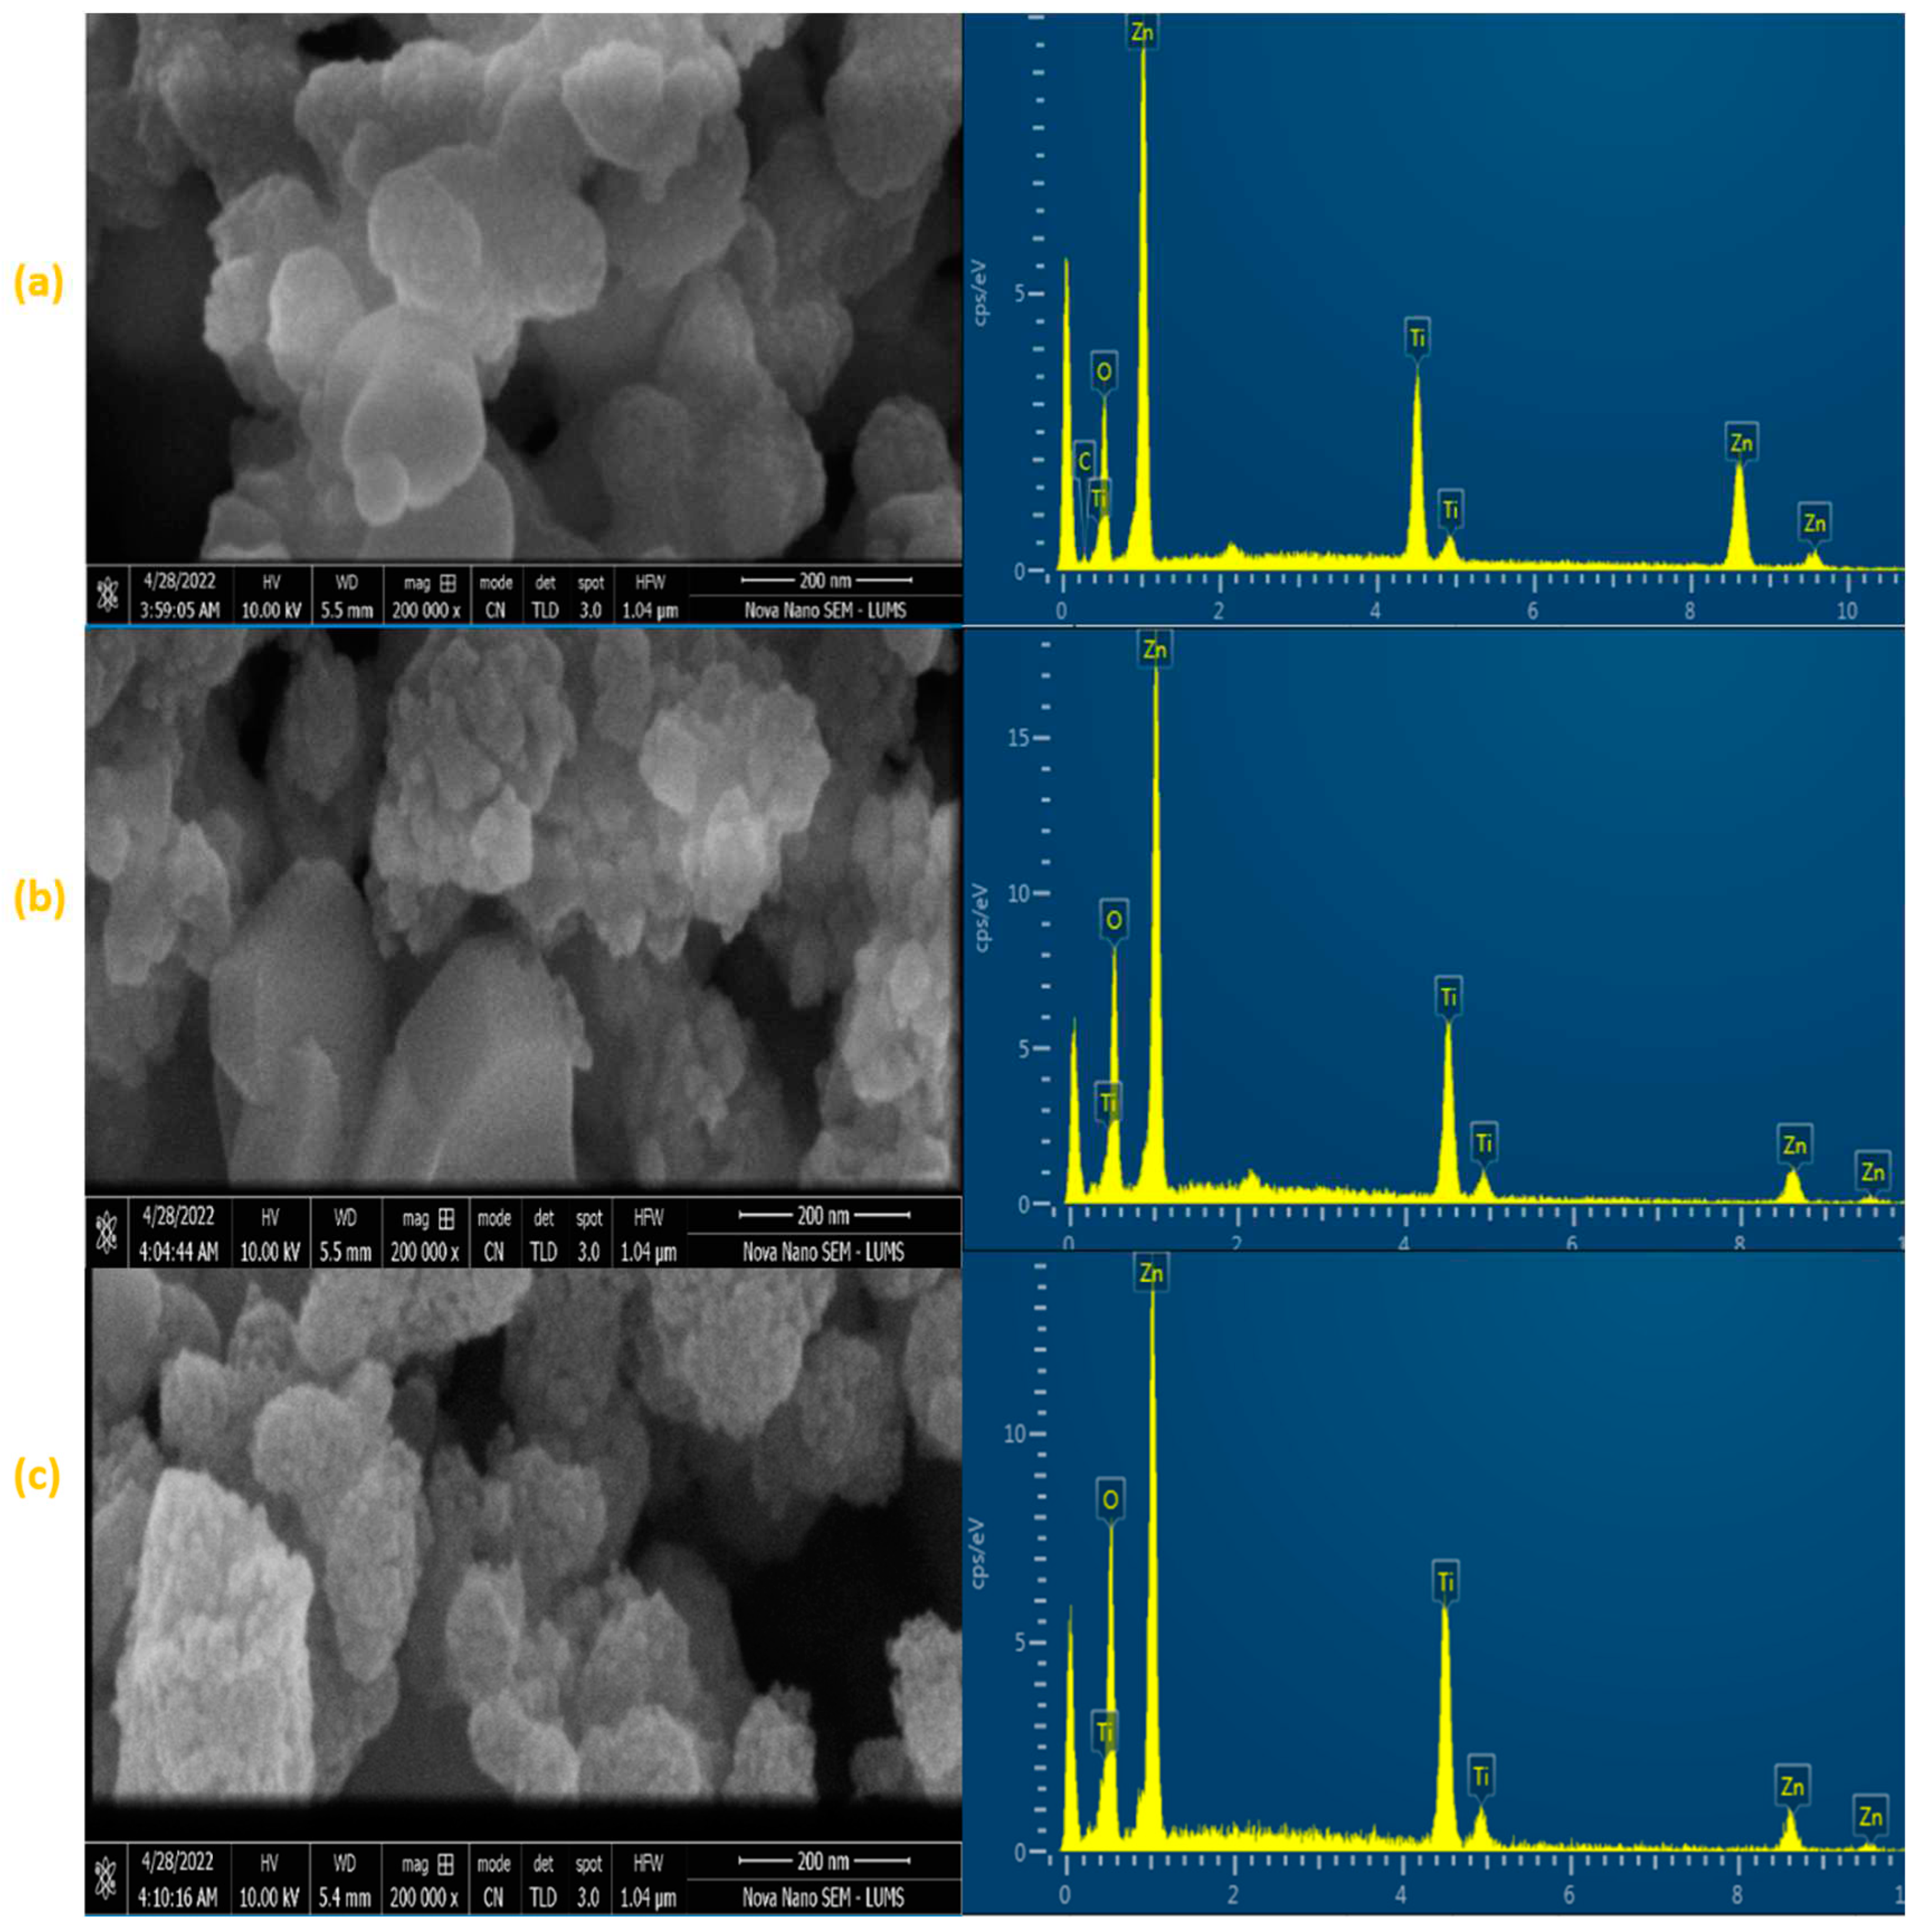
Figure 3.
FTIR spectrum of ZnO- Zn2TiO4 nanocomposite, a)85% ZnO-15% Zn2TiO4 nanocomposite b) 75% ZnO-25% Zn2TiO4 nanocomposite c) 65% ZnO-35% Zn2TiO4 nanocomposite.
Figure 3.
FTIR spectrum of ZnO- Zn2TiO4 nanocomposite, a)85% ZnO-15% Zn2TiO4 nanocomposite b) 75% ZnO-25% Zn2TiO4 nanocomposite c) 65% ZnO-35% Zn2TiO4 nanocomposite.

Figure 4.
Ultraviolet-visible spectrum of ZnO- Zn2TiO4 nanocomposite, a)85% ZnO-15% Zn2TiO4 nanocomposite b) 75% ZnO-25% Zn2TiO4 nanocomposite c) 65% ZnO-35% Zn2TiO4 nanocomposite.
Figure 4.
Ultraviolet-visible spectrum of ZnO- Zn2TiO4 nanocomposite, a)85% ZnO-15% Zn2TiO4 nanocomposite b) 75% ZnO-25% Zn2TiO4 nanocomposite c) 65% ZnO-35% Zn2TiO4 nanocomposite.

Figure 5.
UV-Visible absorption spectra of MB dye on ZnO/Zn2TiO4 nanocomposites surface, a)85% ZnO-15% Zn2TiO4 nanocomposite b) 75% ZnO-25% Zn2TiO4 nanocomposite c) 65% ZnO-35% Zn2TiO4 nanocomposite.
Figure 5.
UV-Visible absorption spectra of MB dye on ZnO/Zn2TiO4 nanocomposites surface, a)85% ZnO-15% Zn2TiO4 nanocomposite b) 75% ZnO-25% Zn2TiO4 nanocomposite c) 65% ZnO-35% Zn2TiO4 nanocomposite.
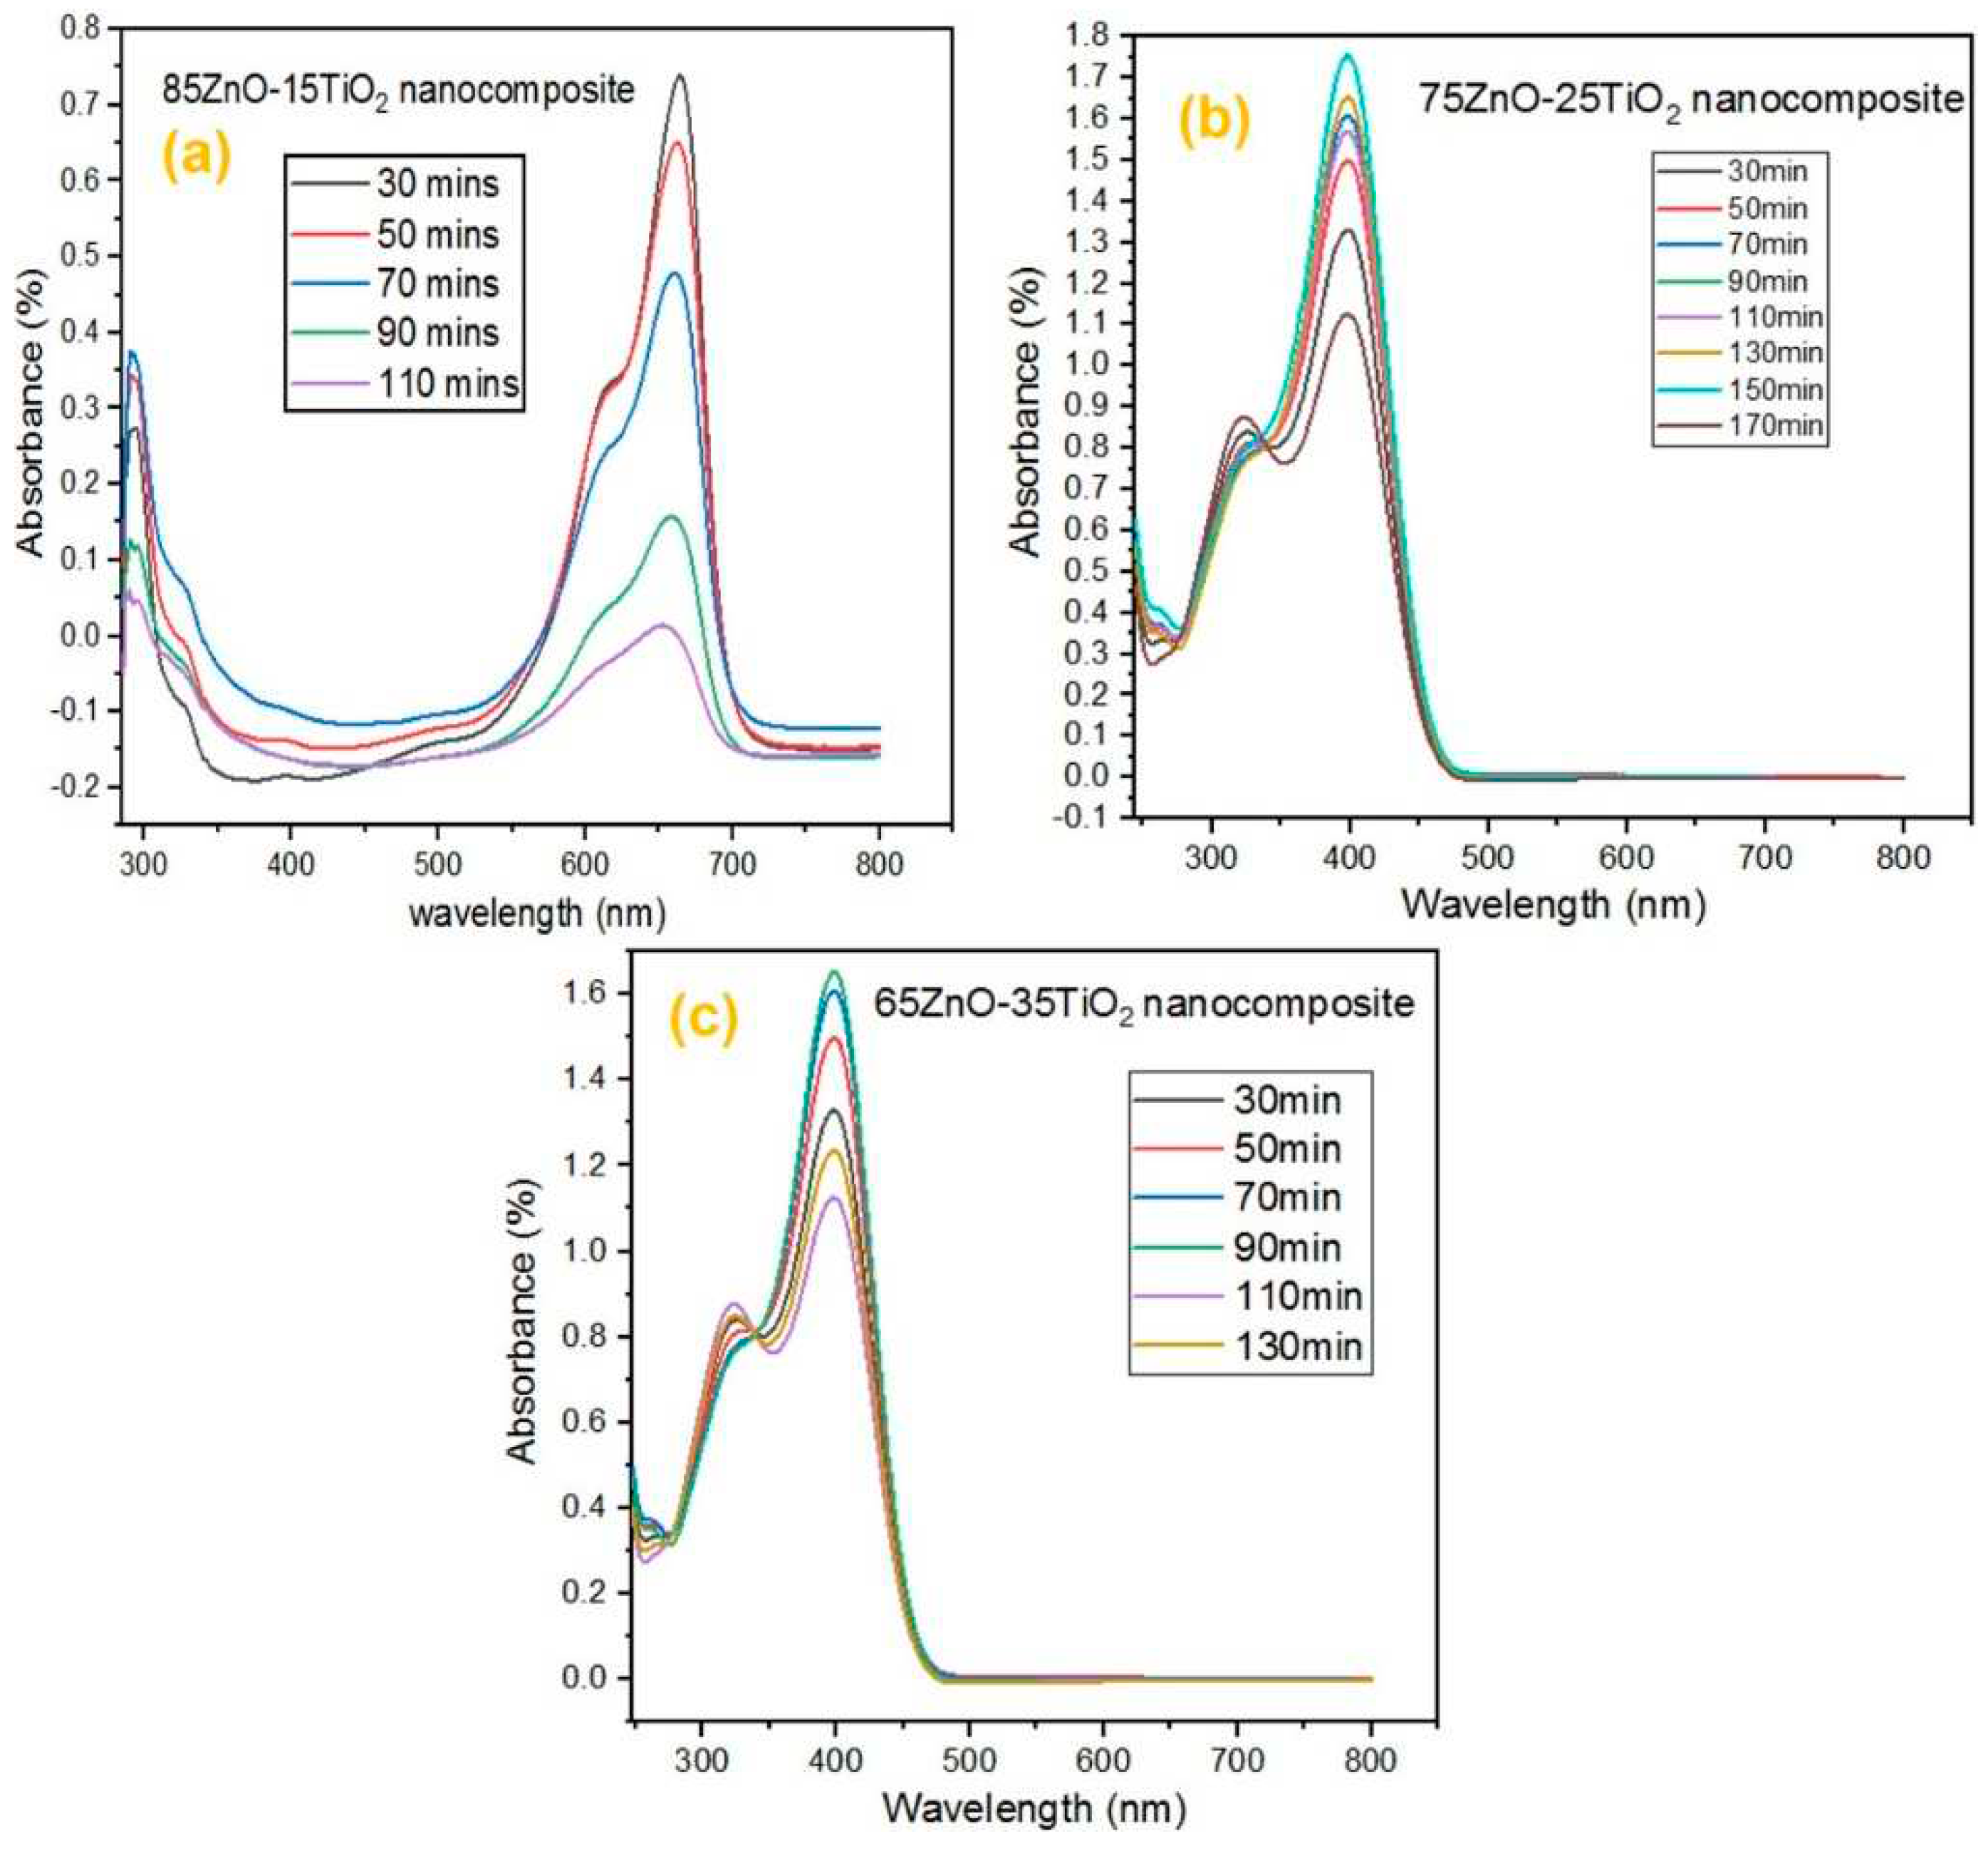
Figure 6.
Dye degradation (%) at various Irradiation time intervals.
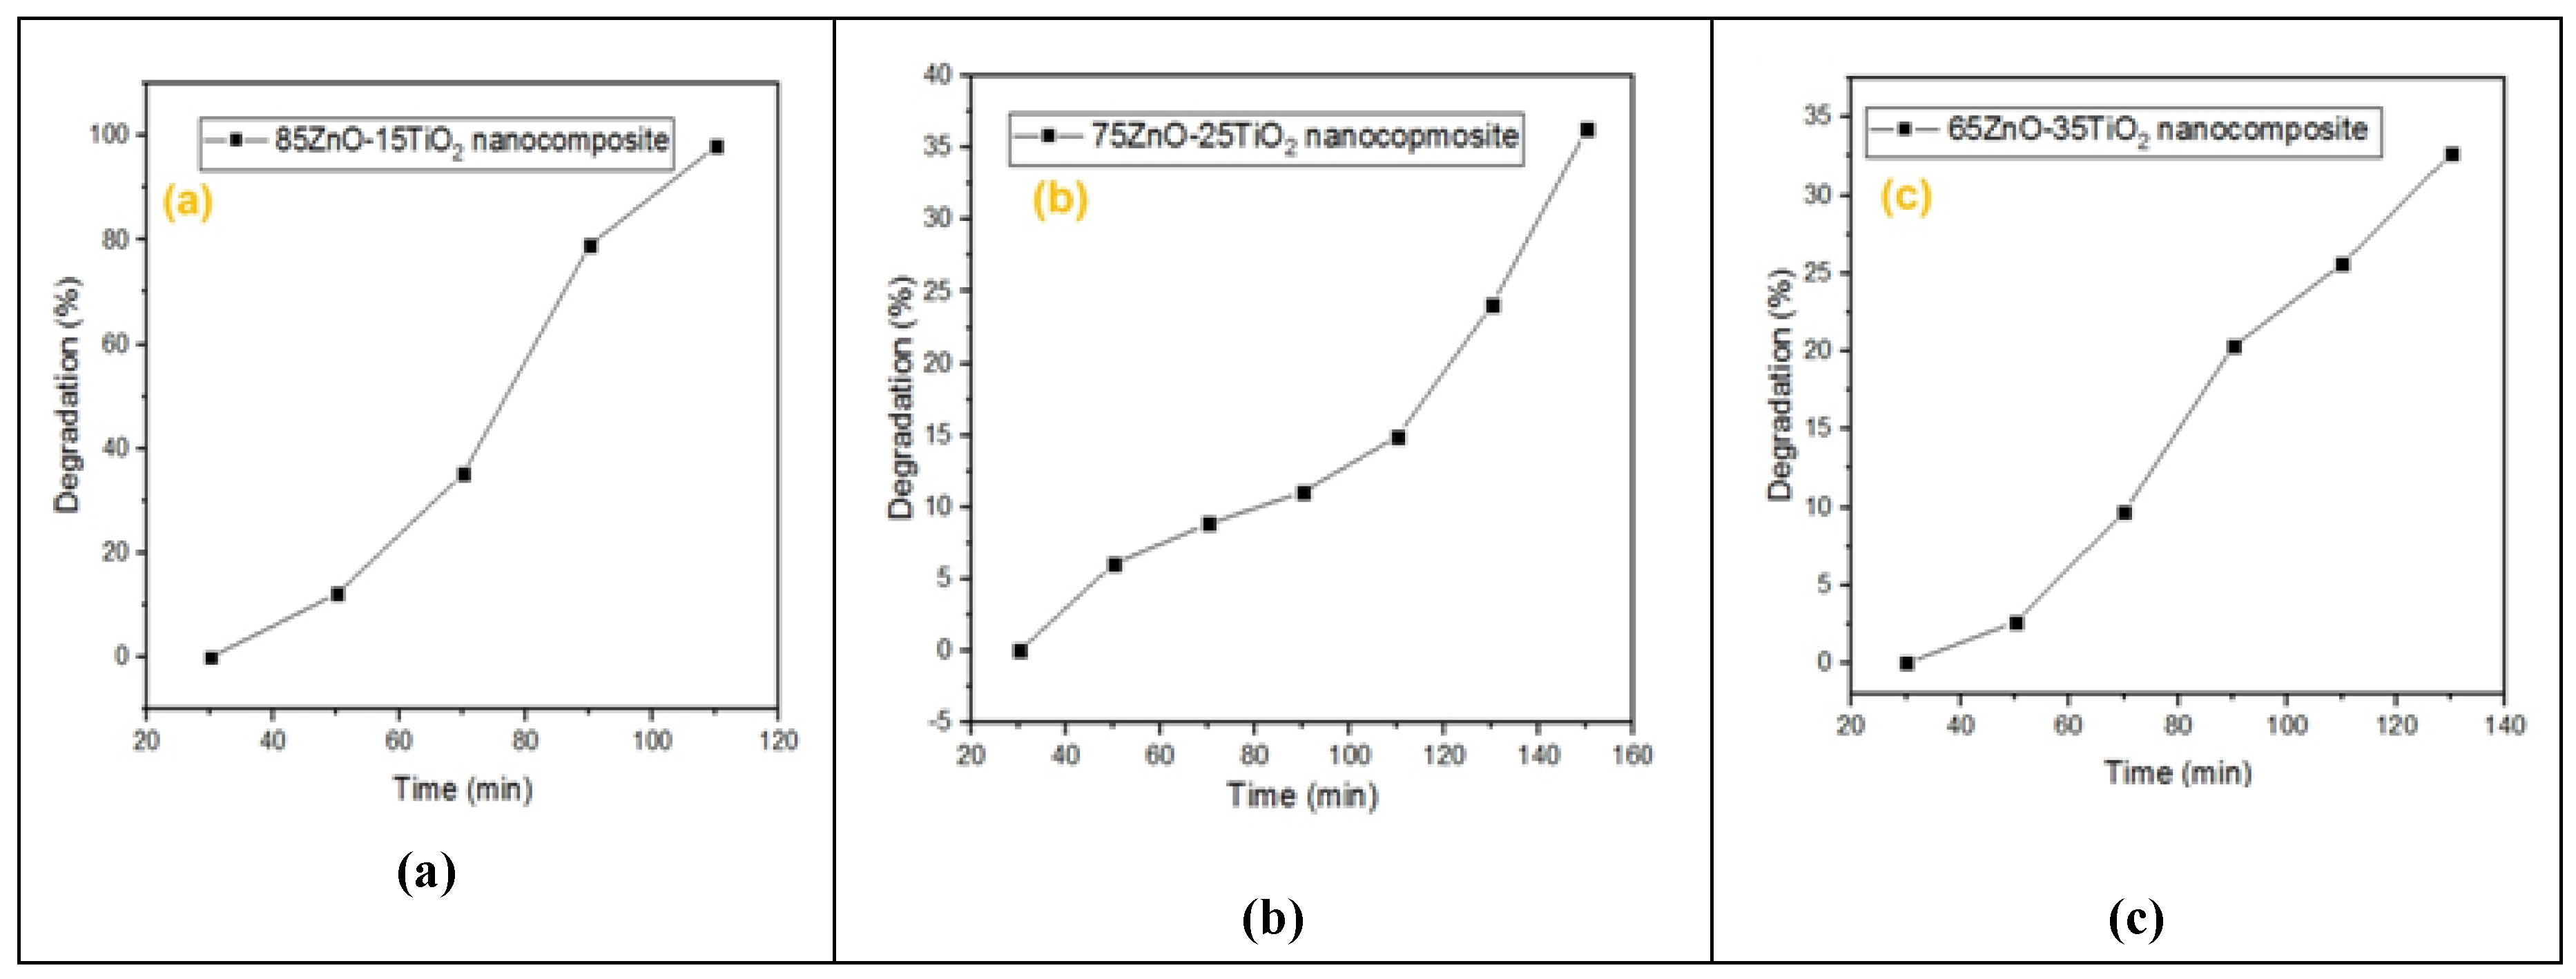
Figure 7.
Effect of catalyst amount on dye degradation (%).
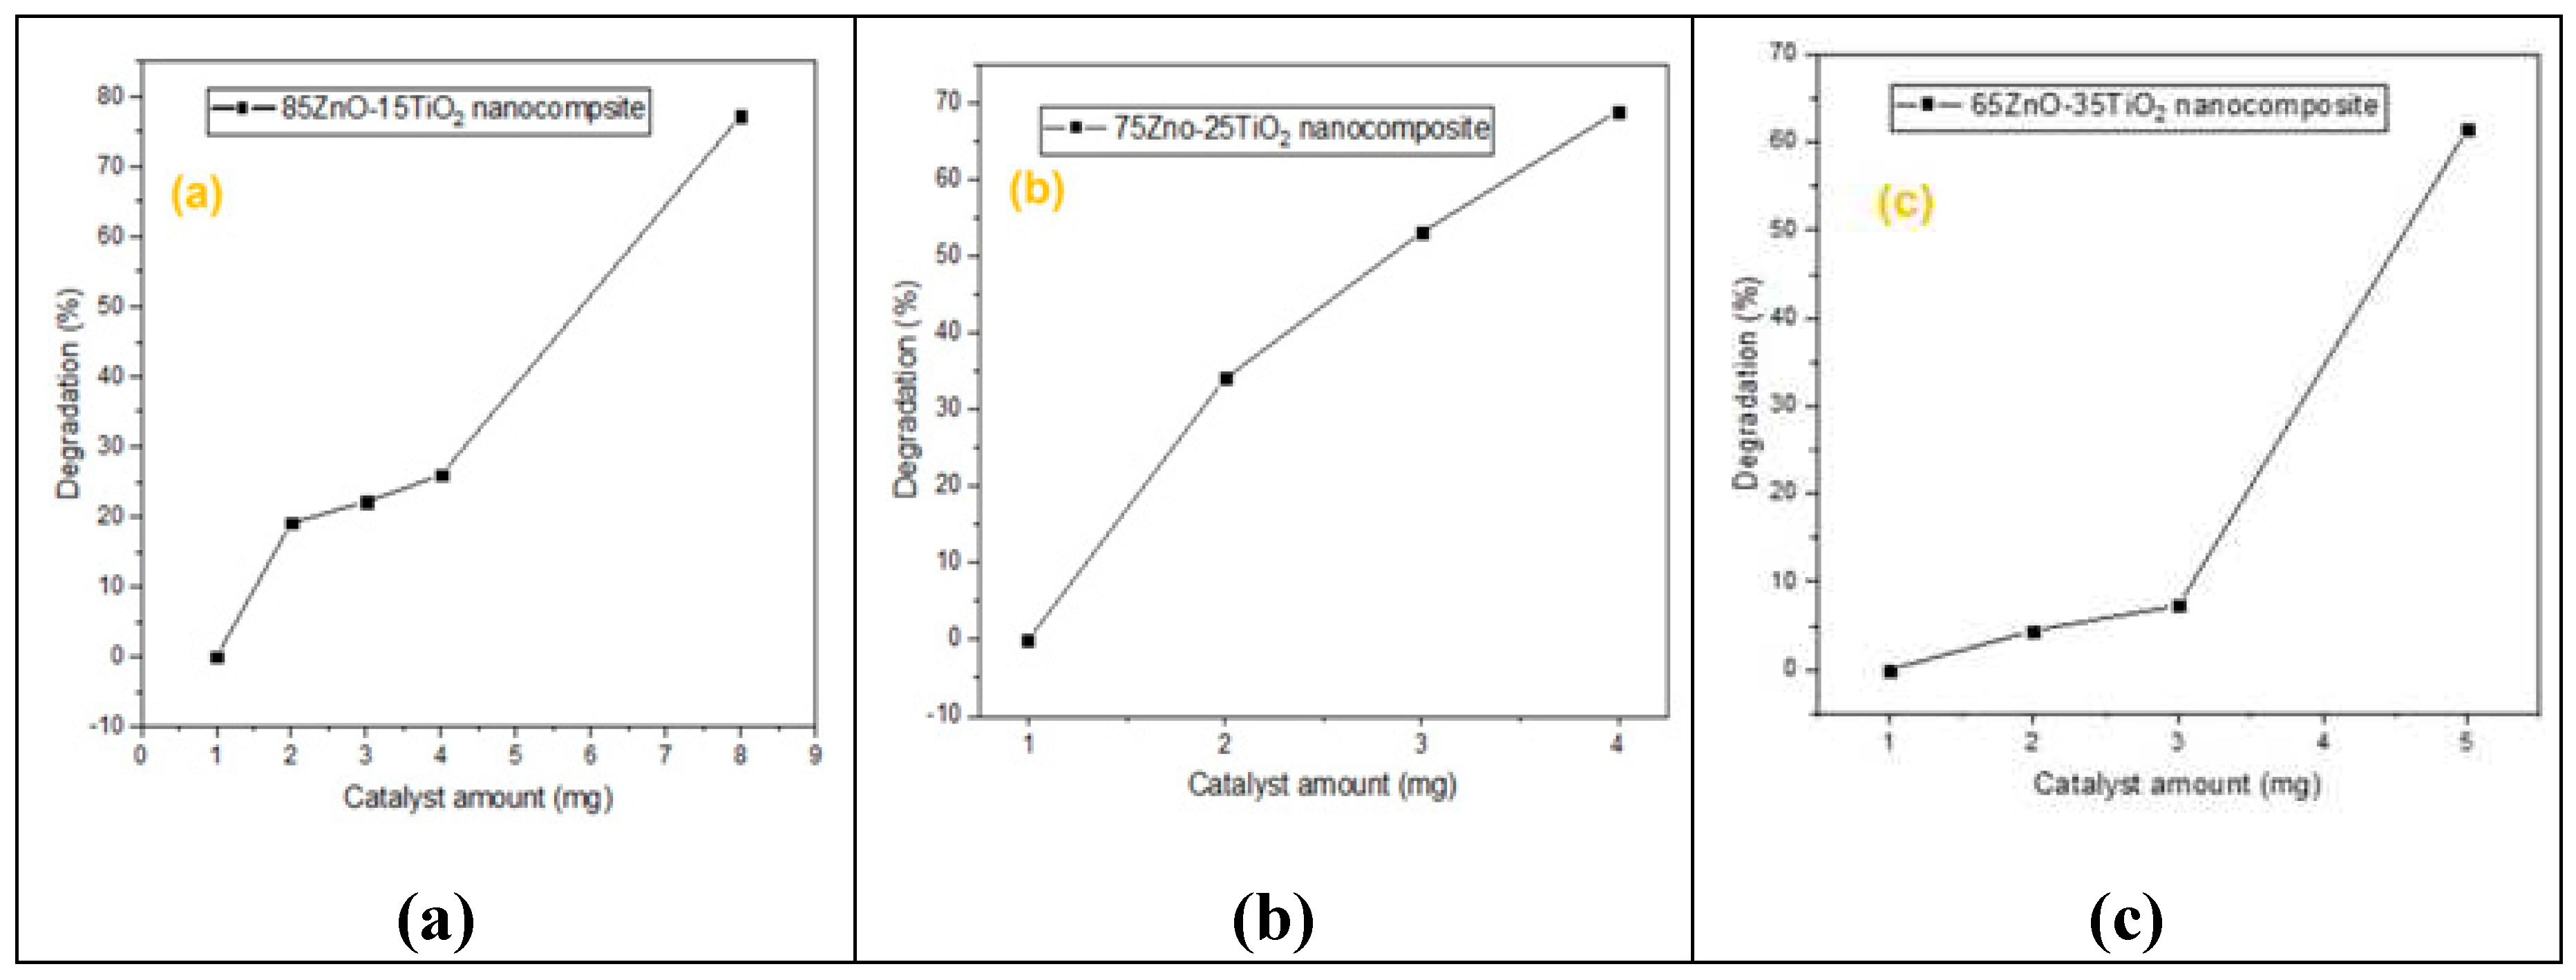
Figure 8.
Effect of dye concentration on degradation (%).
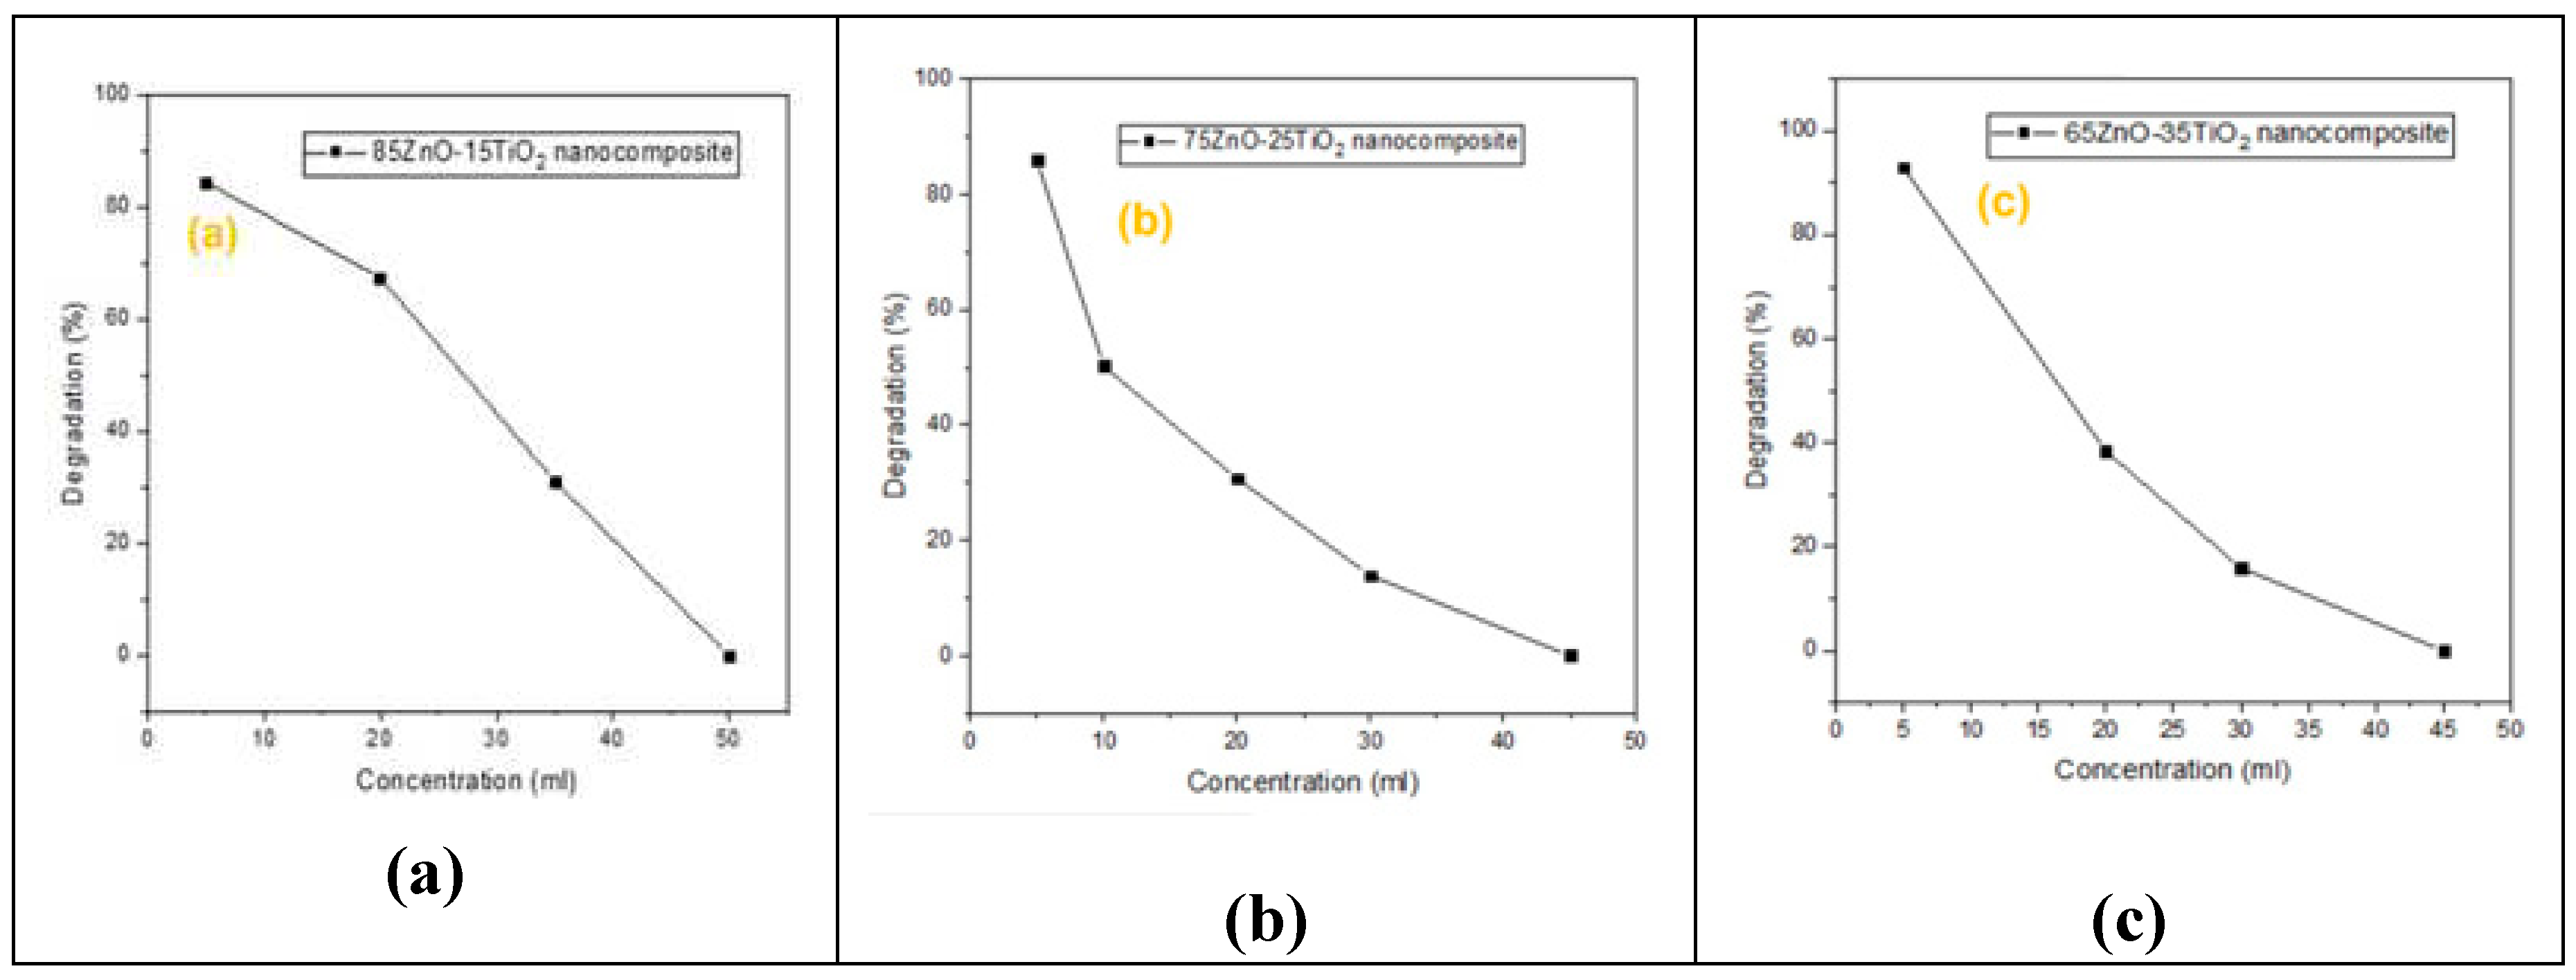
Figure 9.
Effect of pH on dye degradation (%).
Disclaimer/Publisher’s Note: The statements, opinions and data contained in all publications are solely those of the individual author(s) and contributor(s) and not of MDPI and/or the editor(s). MDPI and/or the editor(s) disclaim responsibility for any injury to people or property resulting from any ideas, methods, instructions or products referred to in the content. |
© 2023 by the authors. Licensee MDPI, Basel, Switzerland. This article is an open access article distributed under the terms and conditions of the Creative Commons Attribution (CC BY) license (http://creativecommons.org/licenses/by/4.0/).
Copyright: This open access article is published under a Creative Commons CC BY 4.0 license, which permit the free download, distribution, and reuse, provided that the author and preprint are cited in any reuse.


