

Submitted:
10 December 2023
Posted:
15 December 2023
You are already at the latest version
Abstract
Abstract:
The recently described perivascular unit (PVU) resides immediately adjacent to the true capillary neurovascular unit (NVU) in the postcapillary venule and contains the normal-benign perivascular spaces (PVS) and pathological enlarged perivascular spaces (EPVS). The PVS are important, in that, they also have recently been identified to be the construct and the conduit responsible for the delivery of metabolic waste from the interstitial fluid to the ventricular cerebrospinal fluid for disposal into the systemic circulation and has been termed the glymphatic system. Importantly, the outermost boundary of the PVS is lined by protoplasmic perivascular astrocyte endfeet (pvACef) that communicate with regional neurons. As compared to the well-recognized and described neurovascular unit (NVU) and NVU coupling, the PVU is less well understood and remains an emerging concept. The primary focus of this narrative review is to compare the similarities and differences between these two units and discuss each of their structural and functional relationships and how they relate not only to brain homeostasis but also how they may relate to the development of multiple clinical neurological disease states and specifically how they may relate to obesity, metabolic syndrome, and type 2 diabetes mellitus. Additionally, the concept and importance of a perisynaptic astrocyte coupling to the neuronal synapses with pre- and postsynaptic neurons will also be considered as a perisynaptic unit to provide for the creation of the information transfer in the brain via synaptic transmission and brain homeostasis. Multiple electron microscopic images and illustrations will be utilized in order to help explain these complex units.
Keywords:
Diabetic cerebral microvascular disease
; Enlarged perivascular spaces
; Glymphatic system
; Neurovascular unit
; Perisynaptic astrocyte endfeet
; Perivascular astrocyte endfeet
; Pervascular spaces
; Perivascular unit
; Postcapillary venule
1. Introduction
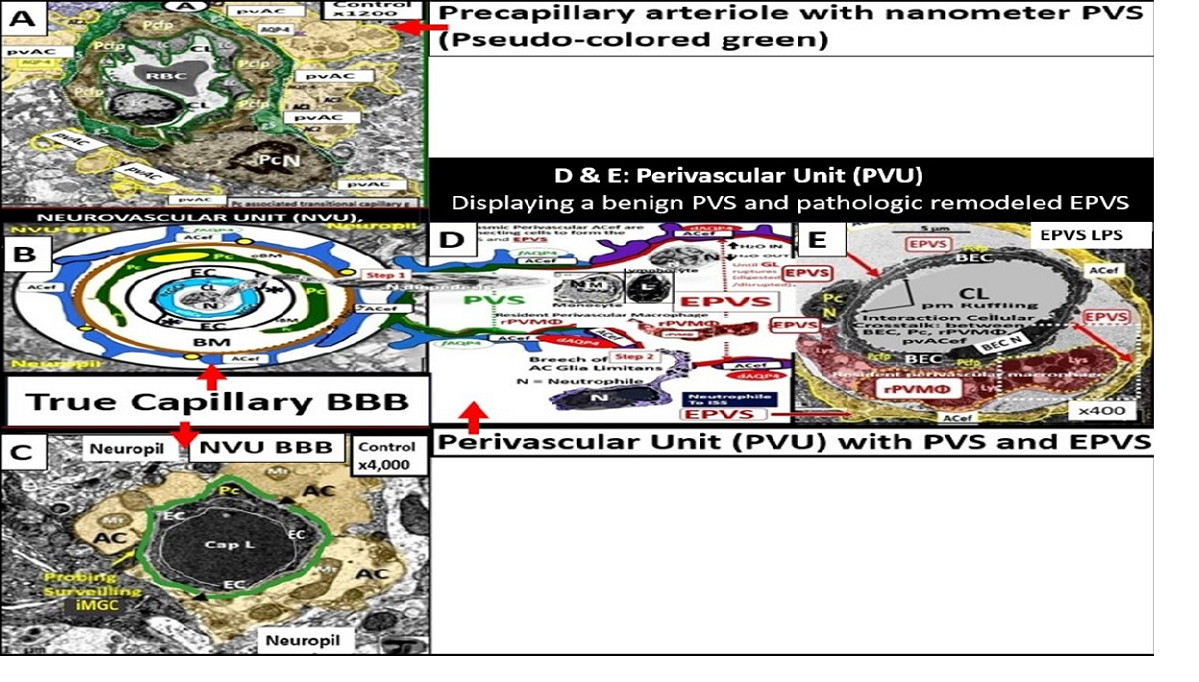
The perivascular unit (PVU) has been recently defined and described by Troili et al. (2020) [1]. They have described the PVU as “a key anatomical and functional substrate for the interaction between neuronal, immune, and vascular mechanisms of brain injury, which are shared across different neurological disease” [1]. They defined the PVU in order to emphasize the contributions that are made by both the cellular (structural) and molecular (functional) activities that surround the perforating vessels (pial arteries, arterioles, and precapillary arterioles) and the effluxing vessels (pial postcapillary venules, venules, and veins). This is in addition to their interactions, which determine the function of the normal or benign perivascular spaces (PVS) in health and the pathologic remodeling of dilated or enlarged perivascular spaces (EPVS) that are associated with many neurologic diseases [1]. Much of the focus regarding the PVU, PVS, and dilated EPVS has been on pial arteries, arterioles, and precapillary arterioles. However, this review intends to focus more on the pial postcapillary venules, venules, and veins because the PVU and their PVS serve as the conduit for the recently described glymphatic system (GS) of waste removal that is essential for proper brain homeostasis (Figure 1) [1,2].
PVS are also referred to as Virchow-Robins spaces and are the fluid-filled spaces that ensheathe the pial penetrating vessels both those entering (arteries, arterioles, precapillary arterioles) and those leaving the brain (postcapillary venules, venules, and veins) as they exit the brain parenchyma back to the subarachnoid space (SAS) allowing the contents of their spaces (interstitial fluid (ISF) and metabolic waste) to eventually enter the cerebrospinal fluid space (CSF) and exit the brain to the systemic circulation (Figure 2) [2].
Throughout this narrative review, the author has utilized the term “true capillary” in order to distinguish its ultrastructure characteristics from the precapillary arterioles and postcapillary venules that manifests a PVU, which contains the normal PVS and the pathologic dilated EPVS, which associates with pathologic remodeling and many neurologic diseases as in Figure 1.
The neurovascular unit (NVU) and NVU coupling are well recognized and accepted structural and functional units in the brain, which are responsible for cerebral autoregulation and are essential for the proper maintenance of regional cerebral blood flow (CBF) and brain homeostasis (Figure 2, Figure 3 and Figure 4) [2,3,4,5]
Importantly, the PVU that resides immediately adjacent to the true capillary NVU with its BBB contains the normal PVS that serves as the conduit for the glymphatic system and the pathological EPVS that are more of an emerging concept that is less well understood (Figure 1, Figure 2, Figure 3, Figure 4, Figure 5 and Figure 6) [1,2,6,7,8,9,10].
Troili et al., only recently introduced this newer term (the PVU) in 2020 and since then there has been increasing interest in this newly defined unit within the postcapillary venule; however, the PVU still remains an emerging topic of study and deliberation (Figure 3, Figure 4, Figure 5 and Figure 6) [1]. Importantly, the PVS have been demonstrated to serve as the construct and the structural conduit for the glymphatic system that is responsible for the clearance of metabolic waste from the interstitial spaces to the SAS and CSF [11,12].
In addition to focusing on pial postcapillary venules, venules, and veins, this narrative review also intends to compare the similarities and differences between the NVU and PVU as well as their structural and functional relationships and how they relate not only to brain homeostasis but also how they relate to the development of enlarged perivascular spaces and clinical neurological disease states as they relate to obesity, MetS and T2DM (Table 1 and Table 2) [13,14].
While both the NVU and PVU have similar and different functions (Table 1 and Table 2), they work collaboratively to maintain the proper functioning of the brain's vascular and neural systems to provide proper neurovascular coupling to provide homeostatic CBF to provide nutrients and metabolic waste removal [1Troili]. Additionally, the concept and importance of a perisynaptic astrocyte cradle coupling to the neuronal synapses with pre- and postsynaptic neurons will also be considered as a unit to provide brain homeostasis and the creation of information transfer in the brain via synaptic transmission.
While the principal focus of this review primarily remains on the pial postcapillary venules and their PVUs with their PVS and EPVS, it is important to note that the PVU and spaces also reside alongside the pia arteries, arterioles, and precapillary arterioles which allows for intramural periarterial drainage (IPAD) removal of metabolic waste to the CSF along the basement membrane(s) (BMs) of the vascular smooth muscle cells and the walls of capillaries and arterioles [15,16]. Additionally, it is intended to discuss the metabolic waste (MW) clearance from these glymphatic system spaces to the subpial space, SAS, and CSF for delivery into the systemic circulation [1,7,9,10,11]. Also, newer concepts have been emerging regarding the concept that all brain compartments involved in CSF homeostasis are involved with a functional continuous exchange between them rather than just serving as separate fluid compartment receptacles that are primarily based on hydrostatic pressure [6,17]. Accordingly, aquaporin-4 (AQP4) in the pvACef plays a central role in cerebral fluid homeostasis discussed later in greater detail [6,17].
In summary, the NVU consists of the following cellular components, which are neurons, perivascular astrocytes, microglia, pericytes, BECs, and the basement membrane (BM). The cellular components of the NVU form and share intimate, complex interactions and thus, are responsible for the formation of single functional NVU. While the PVU also contains these same cells with the addition of intra-perivascular space resident perivascular macrophage (Table 1 and Table 2) [13,14,18].
2. Obesity, Metabolic Syndrome (MetS), Type 2 Diabetes Mellitus (T2DM), and Global Aging
Obesity, MetS, and T2DM in addition to advanced age are currently global societal problems that are expected to grow over the coming decades [19]. T2DM of this triad and neurodegenerative diseases (including cerebrocardiovascular disease, cerebral small vessel disease (SVD), and stroke thrombotic or hemorrhagic) are also anticipated to develop aging-related EPVS. Currently, the global population is one of the oldest in our history and it is expected to continue to increase over the next 2-3 decades, such that we will observe these four groups to merge and increase in numbers [19].
Obesity with visceral adipose tissue (VAT), MetS, and T2DM predispose to the development of EPVS, impaired synaptic transmission, impaired cognition, and neurodegeneration over time [20,21]; metabolic disorders with MetS are also associated with EPVS [22,23].
T2DM is a heterogeneous, multifactorial, polygenic disease that may be characterized by a defect in insulin’s secretion (the beta cell secretory defect), insulin’s action (insulin resistance) and chronic hyperglycemia [24]. T2DM is strongly associated with obesity-visceral adipose tissue (VAT), insulin resistance (IR) and MetS, which is known to have numerous, devastating complications including hypertension, vasculopathy (micro-macrovascular disease) with cerebrocardiovascular disease and stroke, peripheral neuropathy, retinopathy and blindness, neuropathy, non-traumatic amputation, and nephropathy. Importantly, T2DM is also associated with dilated EPVS and impaired glymphatic function of interstitial waste (including multiple neurotoxic substances that include misfolded proteins amyloid beta and tau) [25,26,27,28,29]. Additionally, peripheral and brain IR as well as MetS also play an important role in brain remodeling (Figure 7) [22,23,26,30,31].
Notably, T2DM is known to be associated with significant brain remodeling with cognitive impairment and dysfunction (CID), vascular cognitive impairment and dementia (VCID), and the development of EPVS [25,27,28,29,30,31,32,33,34,35,36,37,38]. Interestingly, Fulop et al. examined the brains’ venous system and its role in the development of enlarged perivascular spaces [39]. They were able to share that while cerebral microbleeds-microhemorrhages are definitely associated with small arterioles and capillaries that there is increasing evidence that rupture of small veins and venules that can also result in microbleeds [39]. Cerebral microbleeds-hemorrhages (CMBs) are associated with the rupture of small intracerebral microvessels and associated with impaired neuronal function and have the potential to contribute to cognitive impairment, older age, psychiatric syndromes as well as gait disorders [40]. Interestingly, these multifocal CMBs were readily demonstrated in the 20-week-old female, obese, insulin resistant, diabetic db/db preclinical female mouse model of T2DM (Figure 8 and Figure 9) [5].
It is important to note that during these studies of the female 20-week-old db/db models that authors did not examine the venular systems for EPVS or evidence that also may be involved with both cerebral microbleeds and microinfarcts, since we were not aware of their importance at that time (2018). Of importance, if you are not looking for a remodeling structure with TEM, you seldom find them [5].
Notably, obesity, MetS, and T2DM have been found to have increased capillary microvascular rarefaction (loss of capillary microvessels) in multiple regions of the brain [2,5,41,42,43,44]. Recently, Shulyatnikova et al. have hypothesized that capillary microvascular rarefaction might possibly be responsible for the development of EPVS [2]. Capillary microvessel loss due to rarefaction would leave an empty space within the confines of the PVUs’ PVS that would subsequently fill with ISF and this could possibly allow for an increase in the percent total fluid volume within the PVS that subsequently results in separation of all surrounding pvACef leaving an EPVS (Figure 10) [2,8].
While this capillary microvascular rarefaction still remains a hypothesis that will need to be further tested, it remains an intriguing potential mechanism for the development of EPVS in microvascular disease in the brain.
3. The True Capillary of the NVU Deliverers Its Peripheral Blood and Cellular Contents into the Immediate Adjacent Postcapillary Venule Perivascular Unit
The concept of the NVU and its definition and importance were officially introduced and described in 2001 at the first Stroke Progress Review Group Meeting of the National Institute of Neurological disorders and Stroke of the National Institute of Health (NIH) that incorporated neurons and the adjacent vascular cells with the pvACef cells that serve as the connecting cell between the vascular cells and neurons resulting in coupling [4]. The NVU and the NVU coupling are now well accepted and have received great interest in the field of neurobiology. Its cells are comprised of BECs, Pcs, pvACef cells, vascular smooth muscle cells in arterioles and arterial microvessels, and interrogating microglia with the pvACef cells being connected to regional neurons to allow for NVU coupling in order to increase oxygen and nutrients to match neuronal excitement demand [4,45,46,47,48]. Incidentally, the PVU cells are the same as the NVU except for the presence of the phagocytic and antigen presenting resident perivascular macrophage (rPVMΦ) cells in health and disease [7,49]. While the NVU of the true capillary and PVU of the postcapillary venule appear to be an anatomical continuum with many structural similarities and only a few minor differences, their functions seem to be quite different (Table 1 and Table 2).
When one reviews Zlokovic’s 2-hit vascular hypothesis for neurodegeneration in Alzheimer's disease [47], it is unquestionable that there is considerable overlap among risk factors for cerebrovascular disorders including cerebral microvascular disease and dysfunction and late onset Alzheimer’s disease (LOAD), vascular dementia (VaD), neurodegeneration and impaired cognition [19]. The two-hit vascular hypothesis for Alzheimer’s disease places microvascular disease and more specifically the NVU BBB as the first hit of the two-hit hypothesis. Since not only the NVU BBB and the immediately adjacent PVU with its PVS and EPVS are involved, the PVU, PVS, and EPVS could now also be included in this first hit, while the 2nd hit would be the impaired clearance of beta amyloid due to EPVS within the PVU [47].
It has been known for some time that midlife obesity [50], diabetes [51,52], and hypertension [53] are all vascular risk factors that are known to increase the risk for neurodegeneration including LOAD. It is currently well recognized that most cases of LOAD have mixed vascular pathology and small-vessel disease [54,55]. Additionally, brain hypoperfusion–hypoxia [56], silent infarcts [57], the presence of one or more infarctions [58], stroke episodes and transient ischaemic or hypoxic attacks all increase the risk of LOAD. Indeed, there may be a continuum of progression in obesity, metabolic syndrome, T2DM to VaD, LOAD, and mixed dementia in addition to the accumulating knowledge that macro-microvascular disease risk factors might all converge on a common final remodeling disease pathway, involving brain microvascular dysfunction and/or degeneration, as well as amyloid-β and tau pathology [19]. Notebly, there has been a trend to soften the once hard-fixed clinical and histopathologic boundary-lines drawn between vascular dementia and LOAD. Notably, LOAD may be considered to reside under the umbrella of mixed dementias [19].
NVU BBB disruption caused primarily by BECact/dys with activated BECs (Hit-1) allows proinflammatory peripheral cytokines/chemokines (pCC) to enter the PVU and the proinflammatory cells to adhere to the aBEC within the PVU in addition to allowing increased permeability to multiple neurotoxins from the systemic circulation [59]. The neurotoxic molecules are then delivered to the postcapillary venule’s PVU with its normal PVS and pathologic remodeled EPVS. These neurotoxic molecules and cells with the ensuing metabolic debris begin to accumulate more and more and may result in PVS obstruction, which results in the PVS becoming dilated, enlarged, and remodeled, which results in EPVS that can be identified by non-invasive magnetic resonance imaging (MRI) studies of the brain that are indicative of impaired waste removal via an impaired glymphatic system (Figure 11).
These EPVS (1-3mm by MRI) can now be identified and quantitated via deep learning algorithms that reduce time, effort, and increase specificity in contrast to the earlier manual hand-counting when viewing MRIs [60].
4. The PVU With Its Normal PVS and Pathologic EPVS: Crossroads and Multicellular Crosstalk
Troili et al. were the first to define and describe the perivascular unit (PVU) [1] and this concept is taking better hold now that it has also been learned that the glymphatic system utilizes the postcapillary venule PVS as a conduit for MW clearance [1,11,12,61]. The PVU with its normal PVS and pathologic remodeled EPVS is located in the postcapillary venule and is immediately adjacent to the true capillary (Figure 1, Figure 5, Figure 6, Figure 11). The PVU allows one to visualize the multicellular crosstalk communication possibilities, which includes BECs, Pcs, resident PVMΦs, the outermost delimiting basement membrane (glia limitans) of the pvACef of this unit, and peripheral cellular leukocytes that are able to penetrate the disrupted NVU BBB (Figure 12 and Figure 13).
The EPVS that result from the multicellular crosstalk and aberrant remodeling are most commonly identified in either the basal ganglia (BG) or the centrum semiovale (CSO) on MRI T2 weighted images; however EPVS have also been identified in the midbrain (Type III); however, they have also been identified in the hippocampus and more recently characterized in the subcortical white matter of the anterior superior temporal lobe, cerebellum at the dentate nucleus, and brain stem [62]. With the use of newer more high-intensity 7T MRIs and increased interest in the glymphatic system and EPVS we will undoubtedly come to learn of even more areas as the venular system is explored and studied more carefully [63].
5. Regional Variation of Enlarged Perivascular Space Locations: Basal Ganglion (BG) and Centrum Semiovale (CSO)
During the remodeling phase in the response to injury wound healing (RTIWH) mechanism [64] there occurs multiple remodeling changes, including the development of EPVSs, which can be visualized on non-invasive T2-weighted MRI images. These changes are primarily located either in the basal ganglia and the centrum semiovale depending on the clinical disease state of its brain injury: response to injury wound healing mechanism (Figure 14) [2,64,65,66,67,68,81].
EPVS are most commonly viewed in the BG and CSO. This observation may represent different pathologic remodeling, in that, BG EPVS are more associated with hypertension-related diseases such as SVD, while CSO EPVS are more commonly associated with misfolded protein diseases such as occurs in LOAD, CAA, and CADSIL [69,70,71]. Additionally, with the newer use of algorithm-based indentification of EPV we may find new regional variation in other clinical diseases as we perform more refined studies in this field of study. Over time, we have found that this aberrant remodeling and development of EPVS may be also found to be associated with the venular systems [63] within the brain, since we are learning more and more about the glymphatic system at an exponential rate [72].
6. Protoplasmic Perivascular Astrocyte endfeet and their Aquaporin 4 (AQP4) Water Channels Play a Crucial Role in the Development of Enlarged Perivascular Spaces
Protoplasmic perivascular astrocyte endfeet line the bulk of the brain vasculature at their abluminal surface [9]. Their polarized expression of AQP4 water channels at the plasma membrane of their endfeet are necessary conditions for the functioning glymphatic system pathway of waste removal [11,61]. Actually, Rassmussen, Mestre, and Nedergaard [61] along with Iliff [11,61,73] were responsible for coining the term glymphatic system that was based on the pvACef and their dependency on the abluminal location of AQP4 at the plasma membrane facing mostly ISF and metabolic waste filled PVS/EPVS at the pial postcapillary venule and the CSF filled PVS at the pial precapillary arterioles [11,73]. Loss of AQP4 polarization in the pvACef leads to diminished CSF influx and significantly, a reduced clearance of metabolic waste in the postcapillary venule of the PVU [9,74,75]. Importantly, maintenance of the brain’s structural integrity and its suspension by being suspended or buoyant state in order to not compress the arterial system and cause decreased CBF or ischemia, which is made possible by the proper regulation of the brains’ water content and distribution [73].
pvACef play numerous important roles, which are important for controlling volume in the brain, which include the CSF, ISF, PVS, and glymphatic space for waste removal, in addition to controlling its own size and volume due to its highly AQP4 polarized plasma membranes [9,64]. The role of AQP4 in the maintenance of CNS homeostasis includes proper CSF circulation and flow, potassium buffering, regulation of extracellular space volume, interstitial fluid resorption, neuroinflammation, osmosensing, calcium signaling, cell migration, and importantly, metabolic waste clearance via PVS/EPVS-glymphatic system [9,76,77]. When AQP4 is dysfunctional or undergoes loss of polarization as occurs in LOAD [68], SVD, VCI, VCID, VaD, [78,79,80] there is dysfunction. Also, when AQP4 is dysfunctional and/or lost as in the clinical diseases neuromyelitis optica [81,82] and neuromyelitis optica spectrum disorders [83,84] as a result of autoantibodies against the AQP4 water channel as well as the genetic knockout rodent models, which are associated with EPVS [11,85]. Further, Nielsen et al. were able to demonstrate that nanogold particles staining of AQP4 by transmission electron immunochemistry were localized to the plasma membrane of the pvACef where they tightly adhered to the NVUs’ pvACef basement membrane [86]. Author has only had the opportunity to explore the AQP4 by immunohistochemistry in hepatic cirrhosis individuals and included images of from the brains of those individuals with encephalopathy and EPVS (Figure 15) [9,64].
Notably, the glymphatic system is most active during sleep when the clearance of exogenous tracers undergoes a doubling of the clearance rate as compared to wakefulness [87].
EPVS are most commonly viewed in the BG and CSO. This observation may represent different pathologic remodeling, in that, BG EPVS are associated with more hypertension-related diseases such as SVD, while CSO EPVS are more commonly associated with misfolded protein diseases such as occurs in LOAD, CAA, and CADSIL [69,70,71]. Additionally, with the newer use of algorithm based indentification of EPV we may find new regional variation in other clinical diseases as we perform more refined studies with higher intensity MRI machines such as 3 and 7T MRIs in this field of study. Over time, we have found that this aberrant remodeling and development of EPVS may be also found to be associated with the venular systems [63] within the brain, since we are learning more and more about the glymphatic system at an exponential rate [72].
7. Loss of Polarity of Aquaporin 4 (AQP4) and Dysfunction or loss of Dystroglycan (DC) Results in Detachment and Separation of pvACef from NVU and the psACef from Perisynaptic Unit (PSU)
The brain is critically dependent on the homeostatic functions of astrocytes [9]. Astrocytes (AC) are multifunctional and play an essential role in brain development, modeling, and homeostasis [9,88,89]. ACs are one of the most abundant cells in the brain and are the master connecting and communicating cells that provide structural, functional support of brain cells at all levels of organization as depicted in Figure 5, in addition to being regarded as the guardians and housekeeper of the brain [9,88]. The large AC cellular presence in the brain and their vast cell–cell communication via gap junctions connexins may be viewed as the brain’s functional syncytium [89,90]. Additionally, their role in controlling volume in the brain is of essential importance in maintaining homeostasis, in which, their highly polarized AQP4 water channels provide for the maintenance of the CNS CSF, ISF, PVS, glymphatic space for waste removal, and buoyancy [9,89] in addition to controlling its own size and volume due to its highly AQP4 polarized plasma membranes [9,89]. Homeostatic functions of ACs (via pvACef and perisynaptic ACef) include molecular homeostasis, which includes ion homeostasis of (calcium, potassium, chloride, and potassium), regulation of pH, water transport and homeostasis via AQP 4, and neurotransmitter homeostasis (including glutamate, gamma-aminobutyric acid (GABA), adenosine, and monoamines) for further homeostatic functions [9,88,89]. There are known to be three major types of ACs, which include (1) protoplasmic perivascular AC endfeet (pvACef) and occur primarily in cortical grey matter, (2) fibrous ACs, which occur primarily in cortical white matter, and (3) peripheral astroglial processes (PAPs) important for providing cradling the astrocyte leaflets of the perisynaptic unit [88,89,91].
In this review the AC focus has been on the pvACef that connect the NVU to neurons responsible for neurovascular coupling and maintain regional CBF, pvACef, and the PAPS or perisynaptic astrocyte endfeet (psACef) that cradle synaptic neurons of the perisynaptic cradle unit (PSU) that control synaptic transmission and information transfer between neurons.
7.1. The NVU and PVU pvACef Are Responsible for Neurovascular Coupling and Regional Neuronal Activity-Induced Maintenance of Regional CBF
The pvACef of the NVU and PVUs are known to work in collaborative synergism to maintain the proper functioning of the brain's vascular and neural systems via coupling to provide homeostatic CBF to provide nutrients as well as metabolic waste removal [1]. Indeed, the NVU and PVU consist of cellular networks that control and maintain BBB integrity and tightly regulates CBF, which is known to match energy supply to neuronal demand (neurovascular coupling) [4,92]. Proper polarization and functioning of both the AQP4 water channels (AQP4) and dystroglycan (DG) at the pvACef are absolutely necessary for the normal functioning of both the NVU and PVU. Once pvACef or perisynaptic astrocytes become dysfunctional or lose their polarization of AQP4 or DG the pvACef will undergo detachment and separation from the NVU BEC and Pc-Pcef BMs and separate, which allow for not only NVU but also PVU dysfunction with increased permeability and become increasing vulnerable to the response to brain injury wound healing mechanisms (Figure15) [7,9,59,64,89]. In a past study of the obese, insulin resistant, and 20-week-old female diabetic db/db models, Hayden et al. were able to demonstrate pvACef detachment and separation from the NVU BECs and Pcfps outer BM [7]. This detachment and separation are believed to be caused by the dysfunction or degradation of dystroglycan and a4b6 integrins and is most likely due to increased oxidative stress (ROS) with MMP-2, 9 activation and partial or complete degradation (Figure 8, Figure 9, Figure 16 and Figure 17A, B) [7,93].
In summary, the NVU-PVU pvACef are responsible for neurovascular coupling, ensuring that regional cerebral blood flow is tightly coupled to the activity of neurons in specific brain regions (Figure 17A, B). This dynamic regulation is essential for maintaining optimal brain function and responding to the varying metabolic demands of different brain areas.
7.2. Cradling Perisynaptic Astrocyte Endfeet (psACef) Are Responsible for Synaptic Transmission of Information
psACef play an essential role in cradling neuronal synapses, synaptic transmission, and plasticity (Figure 17C, D and Figure 18) [89,91,94].
Among the numerous roles of the ACs, they are absolutely essential for controlling the volume of CNS, ISF, and PVS within the PVU as well as the AC itself via its highly polarized plasma membrane AQP4 bidirectional water channel. This is especially true at the pvACef in contact with the vasculature as well as including the PVS and the psACef that are in contact with pre- and postsynapse’s of the PVU [89,91,95,96]. As the psACef form the cradle of the PSU they also hide the tripartite synapse from nearby regional injurious stimuli that is termed “synaptic isolation”, insulation, and shielding (Figure 17C) [91,96]. Further, this pvACef cradling may result in reducing both the “spill-in” of transmitters released during extrasynaptic signaling events and the “spill-out: of transmitter from the synaptic cleft [97]. Importantly this would contribute to isolating the synapse from the rest of the CNS i.e., insulating and shielding (Figure 17C).
AQP4 water channel dysfunction, deficiency, loss of polarization, or has been demonstrated to show impaired synaptic plasticity and neurotransmission [96,98,99,100]. Notebly, there are known to be at least two clinical neurological diseases that are associated with antibodies against AQP4 water channels: neuromyelitis optica [81,82,83] and neuromyelitis optica spectrum disorder [83,84] as previously presented in section 6. psACef may indeed follow the same detachment and separation (Figure 17C, D) as demonstrated for the pvACef detachment and separation (Figure 8, Figure 9 and Figure 17A, B), since both are dependent on the functioning presence of β dystroglycan and polarized AQP4 water channels that will become aberrant under similar clinical diseases and brain injurious stimuli [9,94].
Up to this point we have referred to synapses as the tripartite synapses and it is important to note that there is strong scientific reason to consider the synapses as a tetrapartite synapses since the extracellular matrix plays such an integral role in synaptic transmission or at the very least refer to these synapses as multipartite synapses [89,101].
In summary, the detachment-retraction of pvACef and psACef can both have widespread effects on the neurovascular unit and perisynaptic unit respectively and potentially lead to disruptions in blood-brain barrier integrity, altered blood flow regulation, compromised metabolic support to neurons, and disturbances in synaptic function. These changes may contribute to neurological disorders and impair overall brain function via neuroinflammation, impaired glymphatic system efflux associated with EPVS, compromised metabolic support to neurons, impaired synaptic function, plasticity, and synaptogenesis, and impaired synaptic transmission with impaired transmission of information [9,89,91,94,97].
8. The Venular Side of the Perivascular Unit (PVU) and Enlarged Perivascular Spaces (EPVS)
All small vessels including the postcapillary venules, venules, and veins are almost completely covered by astrocytic endfeet that provide for a relative barrier, since there are known to be up to 20nm clefts/gaps between some pvACef [102]. pvACef ensheathment of cortical postcapillary venules, venules, and veins play an essential role in the transcellular trafficking of metabolic solutes, ions, and water as they diffuse bidirectionally into and out of the interstitial neuronal parenchymal spaces at the level of the PVS within the PVUs and subsequently empty into the SAS and CSF to the systemic circulation (Figure 2) [63,102,103]. Also, the polarized AQP4 water channels located at the plasmalemma of pvACef/psACef are responsible for bidirectional water flow are essential for proper water and volume homeostasis including the ISF within the PVS and the interstitial spaces of the parenchyma, CNS, CSF, PVS within the PVU, and the astrocyte itself [9,89]. These important functions of the pvACef are necessary and essential for the proper removal of waste by the glymphatic system to the SAS and CSF and systemic circulation previously discussed in section 7.
The response to injury wound healing mechanism due to any brain injury is known to result in the loss of polarization of AQP4 water channels and dysfunction or loss of DG (especially if it is ongoing or chronic as in obesity, MetS, T2DM due to metainflammation or age-related disease such as LOAD), which results if dysfunctional regulation of water [9,88,89]. Dysfunction of the AQP4 water channel would allow for the development of both interstitial space edema, enlargement of the PVS with resultant EPVS. In turn, the EPVS would result in increased stalling and stasis within the PVS with the accumulation of neurotoxins, proinflammatory leukocytes, metabolic debris with the accumulation of neurotoxins that could be delivered to the interstitial space of the neuronal parenchyma. Additionally, this would result in damage to neurons and synapses with the development of impaired cognition and neurodegeneration with the eventual development of various dementia’s depending on the specific instigating injurious mechanisms. For example, venular pathology has been shown to contribute to vascular dysfunction in LOAD, which have resulted in WMHs and microthrombosis, infarcts, and microbleeds as in Figure 8 and Figure 9 to result in regional ischemia [104,105,106]. Also, single venule blockade in mice models resulted in impaired cerebrovascular structure and function [107,108,109,110].
Even though histopathological documentation of venular accumulation of amyloid fragments in both human and animal models has been identified [103,109,110,111,112,113,114,115,116], the role of the venous network and venous dysfunction induced by amyloid accumulation in SVD, CAA, SVD will need to be further studied [103].
Notebly, Duvernoy and Hartmann et al. [107,117] have previously described how penetrating venules formed “units” that were surrounded by rings of penetrating arterioles [107]. Exact ratios were not specified in their studies; however, a typical penetrating venule appeared to drain blood supplied by ~4-5 penetrating arterioles (Figure 19) [63,103].
Therefore, should Hartmann and Duvernoy [107,117] findings be supported by others this would help to explain the importance of venular neurovasculome [118] with obstruction-thrombosis be studied with greater detail since the venular systems have not yet been studied to the degree that the arteriole neurovasculome systems have been studied to date. Notebly, pre-clinical studies have confirmed that venular occlusion causes microinfarcts that are remarkably similar to those found in clinic-pathological human studies [119]. Recently, blockage of a single venule in mice increased microinfarcts, and vastly impaired cerebrovascular structure and function [107,108]. Importantly, it is felt as we continue to study and explore the glymphatic system that we will also advance our understanding of the venular system.
9. Conclusion
PVUs with their normal PVS and pathologic remodeled EPVS play essential roles in the development of neuroinflammation, cerebrovascular disease, and neurodegeneration as follows in sections 9.1. to 9.3.
9.1. In regards to neuroinflammation
Postcapillary venular EPVS and alterations in the perivascular unit can trigger inflammatory responses in the brain. Disruption of the NVU BBB integrity and increased permeability can allow immune cells and peripheral cytokines/chemokines to infiltrate the brain PVS (Figure 5, Figure 11, Figure 12 and Figure 13), which completes step-1 of Owens’ 2-step process and contributes to neuroinflammation [10]. Once the glia limitans is breeched (step-2 of Owens 2-step process) [10], CNS neuroinflammation can exacerbate neuronal damage and contribute to the progression of various neuropathologic disorders. Further, the PVU and its EPVS can release inflammatory mediators that further amplify the neuroinflammatory response via its resident PVMΦs. Thus, the PVU allows a crossroad for extensive cellular crosstalk (Figure 5, Figure 11, Figure 12 and Figure 13) [1].
9.2. In regards to cerebrovascular disease
Postcapillary venular EPVS are excessive fluid-filled spaces surrounding blood vessels in the brain and are associated with impaired drainage of interstitial fluid, contributing to changes in cerebral blood flow regulation. Impaired perivascular clearance mechanisms lead to the accumulation of toxic substances (neurotoxins) and contribute to the development of cerebrovascular diseases such as SVD, ischemic and hemorrhagic stroke, and venular thromboses, which are emerging as a risk for the development of microinfarcts, and possibly even accelerated microinfarctions and microhemorrhages or microbleeds that are known to be increased in obesity, MetS, and T2DM (Figure 8 and Figure 9) [5,39]. Rollo et al., have found that in human individuals with SVD and LOAD that cerebral microbleeds were common [103]. Further, these microbleeds were associated with the venous vasculature in human individuals with higher resolution 7TMRI [103]. Cerebral microbleeds (MBs) are a common finding in patients with VSD, CAA, and LOAD [103,120]. Additionally, van Veluw et al., were able to demonstrate that cerebral microbleeds and infarcts commonly co-occurred in CAA utilizing high resolution 7T MRI that were not identified with either 1.5 or 3T MRI and further identified more microbleeds with 7T [120]. Thus, as we begin to use newer high resolution MRI we will begin to advance the knowledge in the field of venular pathology [120]. Also, Morrone et al., have proposed that venular amyloid is an important part of both CAA and AD or LOAD pathology [121]. Further, numerous mechanisms related to the pathophysiology of veins, which include EPVS, venous impaired cerebrovascular pulsatility due to the vascular stiffness of aging, and continued studies would allow for further insight into cerebral SVD, CAA, LOAD and cerebrovascular dysfunction as an associated early remodeling change associated with multiple brain injuries that result in the response to injury wound healing mechanisms to add further insight [64,120,121] and may lend further insight into the cerebrovascular dysfunction in SVD, CAA, and LOAD [120,121].
9.3. In regards to neurodegeneration
Postcapillary venular EPVS have been linked to neurodegenerative diseases like LOAD, PD, MS, and recently described to associate with migraine headaches. The associated compromised perivascular drainage may result in the accumulation of beta-amyloid plaques and other neurotoxic substances, which are known to contribute to the progression of neurodegeneration. Accordingly, the PVU, which consists of blood microvessels, pvACef, Pcs with their endfeet, and resident PVMΦs play a crucial role in maintaining the microenvironment for neuronal health. Dysfunction within the PVU with its pathologic EPVS can lead to impaired nutrient supply and waste removal that are known to contribute to neurodegenerative mechanisms. The above three major headings, neuroinflammation, cerebrovascular disease, and neurodegeneration are equivalent to original description of the PVUs by Troili [1] as a result of being the key anatomical and functional substrate for the interaction between immune, vascular, and neuronal mechanisms associated with multiple types of brain injury.
Advancing science in novel areas typically grows on the shoulders of preexisting scientific discoveries and concepts along with advancing technology, such as high resolution 7T MRI. Since the glymphatic system is totally dependent on the anatomic structure of the fluid-filled perivascular spaces as its conduit, we can expect the growth of knowledge regarding the PVS, EPVS, and the PVU to grow along with this exciting, novel topic of research regarding the GS and vice versa as the knowledge expands in the PVS, EPVS, and the PVU field of studies expand we may come to understand more about the GS.
A better understanding of the intricate relationships between EPVS, the PVU, and neurological disorders are crucial for developing targeted therapeutic interventions. Strategies aimed at preserving perivascular space function and the promotion of efficient clearance mechanisms hold great promise in mitigating the impact on neuroinflammation, cerebrovascular disease, and neurodegeneration that are associated with each of clinical diseases mentioned throughout this review.
In summary, it is hoped that this narrative review will help to increase the understanding regarding the importance of not only the microvascular arterial system including its PVS, but also the venular system. The venular system with its PVU and PVS are essential for waste removal including the effective removal of neurotoxins via glymphatic system that is dependent on the normal functioning of the postcapillary venular PVS as it is known to be the structural conduit for waste removal within the PVU. The normal postcapillary venular PVS are effective in the removal of neurotoxins including soluble oligomeric amyloid beta, tau, other neurotoxic misfolded proteins, and metabolic waste to slow or prevent neurovascular, neuroinflammatory, and neurodegenerative diseases discussed in this review. EPVS identified by MRI are a biomarker of GS stasis, stalled, or obstructed waste removal, and are associated with multiple neurodegenerative diseases. Therefore, we must continue to strive to better understand the microvascular venular systems in addition to the arterial systems. Importantly, EPVS can now be identified and quantitated via algorithms that have been created for deep machine learning, which reduce time and effort, and increase specificity in contrast to earlier visual quantifications.
Funding
Author received no funding from any source.
Institutional Review Board Statement
The tissues provided for the representative electron microscopic images utilized in this manuscript were all approved in advance by the University of Missouri Institutional Animal Care and Use Committee (No. 190). The animals were cared for in accordance with National Institutes of Health guidelines and by the Institutional Animal Care and Use Committees at the Harry S. Truman Memorial Veterans Hospital and the University of Missouri, Columbia, MO, USA, which conformed to the Guide for the Care and Use of Laboratory Animals published by the National Institutes of Health (NIH).
Informed Consent Statement
Not applicable.
Data Availability Statement
The data and materials can be provided upon reasonable request.
Acknowledgments
The author would like to acknowledge Tatyana Shulyatnikova for the contribution of many artistic illustrations and her editing of this manuscript. The author would also like to acknowledge DeAna Grant Research Specialist of the Electron Microscopy Core Facility at the Roy Blunt NextGen Precision Health Research Center, University of Missouri, Columbia, Missouri. The author also acknowledges the kind support of the William A. Banks Lab at the VA Medical Center, Seattle, Washington
Conflicts of Interest
The author declares no conflict of interest.
Abbreviations
AC: astrocyte; ACef, astrocyte endfeet; AQP4, aquaporin-4; ATIII, BBB, blood–brain barrier; BEC(s), brain endothelial cell(s); BECact/dys, brain endothelial cell activation/dysfunction; BG, basal ganglia; BM(s), basement membranes; CAA, cerebral amyloid angiopathy; CBF, cerebral blood flow; CID, cognitive impairment and dysfunction; CL, capillary lumen; CMB(s), cerebral microbleed(s); CSF, cerebrospinal fluid; CSO, central semiovale; EPVS, enlarged perivascular spaces; DG. dystroglycan; EPVS, enlarged perivascular spaces; GS, glymphatic space; IPAD, intramural periarterial drainage; ISF, interstitial fluid; ISS, interstitial space; LAN, lanthanum nitrate; LOAD, late-onset Alzheimer’s disease; LPS, lipopolysaccharide; MetS, metabolic syndrome; MGCs, microglia cells; MMP-2,-9, matrix metalloproteinase-2,-9; MRI, magnetic resonance imaging; MS, multiple sclerosis; PD, Parkinson’s disease; NVU, neurovascular unit-neuro-glia-vascular unit; Pc, pericyte; Pcfp, pericyte foot process; perivascular astrocyte endfeet; pvACef; perivascular astrocyte endfeet; psACendfeet, perisynaptic astrocyte endfeet; PVS, perivascular spaces; PVS/EPVS, perivascular space/enlarged perivascular space; rPVMΦ, resident perivascular macrophages; SAS, subarachnoid space; rPVMΦ, reactive perivascular macrophage; SVD, cerebral small vessel disease; T2DM, type 2 diabetes mellitus; TEM, transmission electron microscopy; TI/AJs, tight and adherens junctions; VAD, vascular dementia; VAT, visceral adipose tissue; VCID, vascular contributions to cognitive impairment and dementia; WMH, white matter hyperintensities.
References
- Troili F, Cipollini V, Moci M, Morena E, Palotai M, Rinaldi V, et al, Perivascular Unit: This Must Be the Place. The Anatomical Crossroad Between the Immune Vascular and Nervous System. Front Neuroanat. 2020;14: 17. [CrossRef]
- Shulyatnikova T, Hayden MR. Why Are Perivascular Spaces Important? Medicina (Kaunas). 2023;59(5):917. [CrossRef]
- Presa JL, Saraia F, Bagi Z, Filosa JA. Vasculo-Neuronal Coupling and Neurovascular Coupling at the Neurovascular Unit: Impact of Hypertension. Front Physiol. 2020:11:584135. [CrossRef]
- Iadecola C. The Neurovascular Unit Coming of Age: A Journey through Neurovascular Coupling in Health and Disease. Neuron. 2017;96(1):17-42. [CrossRef]
- Hayden MR, Grant DG, Aroor AA, DeMarco VG. Ultrastructural Remodeling of the Neurovascular Unit in the Female Diabetic db/db Model—Part I: Astrocyte. Neuroglia. 2018;1(1):22044. [CrossRef]
- Szczygielski J, Kopańska M, Wysocka A, Oertel J. Cerebral Microcirculation, Perivascular Unit, and Glymphatic System: Role of Aquaporin-4 as the Gatekeeper for Water Homeostasis. Front Neurol. 2021 Dec 13;12:767470. [CrossRef]
- Hayden MR. Pericytes and Resident Perivascular Macrophages Play a Key Role in the Development of Enlarged Perivascular Spaces in Obesity, Metabolic Syndrome and Type 2 Diabetes Mellitus. Preprints. 2023;2023070461. [CrossRef]
- Hayden MR. The Brain Endothelial Cell Glycocalyx Plays a Crucial Role in the Development of Enlarged Perivascular Spaces in Obesity, Metabolic Syndrome, and Type 2 Diabetes Mellitus. Life. 2023;13(10): 1955. [CrossRef]
- Hayden M.R. Protoplasmic Perivascular Astrocytes Play a Crucial Role in the Development of Enlarged Perivascular Spaces in Obesity, Metabolic Syndrome, and Type 2 Diabetes Mellitus. Neuroglia. 2023; 4(4):307-328.; [CrossRef]
- Owens T, Bechmann I, Engelhardt B. Perivascular spaces and the two steps to neuroinflammation. J Neuropathol Exp Neurol. 2008;67(12):1113-21. [CrossRef]
- Iliff JJ, Wang M, Liao Y, Plogg BA, Peng W, Gundersen GA, et al. A Paravascular Pathway Facilitates CSF Flow Through the Brain Parenchyma and the Clearance of Interstitial Solutes, Including Amyloid β. Sci. Transl. Med. 2012;4:147ra111. [CrossRef]
- Mestre H, Kostrikov S, Mehta RI, Nedergaard M. Perivascular Spaces, Glymphatic Dysfunction, and Small Vessel Disease. Clin Sci (Lond). 2917;131(17):2257–2274.. [CrossRef]
- Kutuzov N, Henrik Flyvbjerg H, Martin Lauritzen M. Contributions of the glycocalyx, endothelium, and extravascular compartment to the blood-brain barrier. Natl Proc Acad Sci U S A. 2018;115(40):E9429-E9438. [CrossRef]
- Horng S, Therattil A, Moyon S, Gordon A, Kim K, Argaw AT, et al. Astrocytic tight junctions control inflammatory CNS lesion pathogenesis. J. Clin. Investig. 2017;127:3136–3151. [CrossRef]
- Diem AK, Carare RO, Weller RO, Bressloff NW. A control mechanism for intra-mural peri-arterial drainage via astrocytes: How neuronal activity could improve waste clearance from the brain. PLoS One. 2018;13(10):e0205276. [CrossRef]
- Carare RO, Aldea R, Agarwal N, Bacskai BJ, Bechman I, Boche D, Bu G, et al. Clearance of interstitial fluid (ISF) and CSF (CLIC) group—part of Vascular Professional Interest Area (PIA): Cerebrovascular disease and the failure of elimination of Amyloid-β from the brain and retina with age and Alzheimer's disease-Opportunities for Therapy. Alzheimers Dement (Amst). 2020;12(1):e12053. [CrossRef]
- Brinker T, Stopa E, Morrison J, Klinge P. A new look at cerebrospinal fluid circulation. Fluids Barriers CNS. 2014; 11(10):. [CrossRef]
- Kaplan L, Chow BW, Gu C. Neuronal regulation of the blood–brain barrier and neurovascular coupling. Nat Rev Neurosci. 2020 Aug; 21(8): 416–432.. [CrossRef]
- Hayden MR New Section 2. Type 2 Diabetes Mellitus Increases the Risk of Late-Onset Alzheimer’s Disease Increases The Risk of Late-Onset Alzheimer's Disease: Ultrastructural Remodeling of the Neurovascular Unit and Diabetic Gliopathy. Brain Sci. 2019;9(10):262. [CrossRef]
- Qi Y, Lin M, Yang Y, Li Y. Relationship of Visceral Adipose Tissue With Dilated Perivascular Spaces. Front Neurosci. 2021; 14: 583557. [CrossRef]
- Lee TH, Yau SY. From Obesity to Hippocampal Neurodegeneration: Pathogenesis and Non-Pharmacological Interventions. Int J Mol Sci. 2021;22(1):201. [CrossRef]
- Wu D, Yang X, Zhong P, Ye X, Li C, Liu X. Insulin Resistance Is Independently Associated With Enlarged Perivascular Space in the Basal Ganglia in Nondiabetic Healthy Elderly Population. American Journal of Alzheimer’s Disease & Other Dementias. 2020;35. [CrossRef]
- Cai Y, Chen B, Zeng X, Xie M, Wei X, Cai J. The Triglyceride Glucose Index Is a Risk Factor for Enlarged Perivascular Space. Front Neurol. 2022;13:782286. [CrossRef]
- Hayden MR. Islet Amyloid, Metabolic Syndrome, and the Natural Progressive History of Type 2 Diabetes Mellitus. JOP. 2002 Sep;3(5):126-138. PMID: 12221327.
- Jiang Q, Zhang L, Ding G, Davoodi-Boid E, Li Q, Li L, Sadry N Nedergaard M, Chopp M, Zhang Z. Impairment of the glymphatic system after diabetes. J Cereb Blood Flow Metab. 2017;37(4):1326-1337. [CrossRef]
- Tiehuis AM, van der Graaf Y, Mali WP, Vincken K, Muller M, Geerlings MI; SMART Study Group. Metabolic syndrome, prediabetes, and brain abnormalities on mri in patients with manifest arterial disease: the SMART-MR study. Diabetes Care. 2014;37(9):2515-2521. [CrossRef]
- Munia OB. Association of Type 2 Diabetes Mellitus With Perivascular Spaces and Cerebral Amyloid Angiopathy in Alzheimer’s Disease: Insights From MRI Imaging. Dement Neurocogn Disord. 2023;22(3): 87–99. [CrossRef]
- Choi EY, Park YW, Lee M, Kim M, Lee CS, Ahn SS, Kim J, Lee SK. Magnetic Resonance Imaging-Visible Perivascular Spaces in the Basal Ganglia Are Associated With the Diabetic Retinopathy Stage and Cognitive Decline in Patients With Type 2 Diabetes. Front Aging Neurosci. 2021; 13: 666495. [CrossRef]
- Zhao H, Wang F, Luo GH, Lei H, Peng F, Ren QP, Chen W, Wu YF, Yin LC, Liu JC, Pan SN. Assessment of structural brain changes in patients with type 2 diabetes mellitus using the MRI-based brain atrophy and lesion index. Neural Regen Res. 2022;17(3): 618–624. [CrossRef]
- Craft S. The role of metabolic disorders in Alzheimer's disease and vascular dementia: two roads converged. Arch Neurol. 2009;66:300–305. [CrossRef]
- Hayden MR. Overview and New Insights into the Metabolic Syndrome: Risk Factors and Emerging Variables in the Development of Type 2 Diabetes and Cerebrocardiovascular Disease. Medicina (Kaunas). 2023;59(3):561. [CrossRef]
- Hayden MR, Banks WA, Shah GN, Gu Z, Sowers JR. Cardiorenal metabolic syndrome and diabetic cognopathy. Cardiorenal Med. 2013;3(4):265-282. [CrossRef]
- Zebarth J , Kamal R , Perlman G , Ouk M , Xiong LY, Yu D, et al. Perivascular spaces mediate a relationship between diabetes and other cerebral small vessel disease markers in cerebrovascular and neurodegenerative diseases. J Stroke Cebrovasc Dis. 2023;32(9):107273. [CrossRef]
- Biessels GJ, Staekenborg S, Brunner E, Brayne C, Scheltens P. Risk of dementia in diabetes mellitus: a systemic review. Lancet Neurol. 2006;5:64–74. [CrossRef]
- Ott A, Stolk RP, van Harskamp F, Hofman HA, Breteler MMB et al. Diabetes mellitus and risk of dementia: the Rotterdam study. Neurology. 1999;53:1037–1942. [CrossRef]
- Cukierman T, Gerstein HC, Williamson JD. Cognitive decline and dementia in diabetes – systematic overview of prospective observational studies. Diabetologia. 2005;48:2460–2469. [CrossRef]
- Jacobson AM, Musen G, Ryan CM, Silver N, Cleary P, Waberski B, et al. Long-term effect of diabetes and its treatment on cognitive function. N Engl J Med. 2007;356:1842–1852. [CrossRef]
- McCrimmon RJ, Ryan, CM, Frier BM. Diabetes and cognitive dysfunction. Lancet. 2012;379:2291–2299. [CrossRef]
- Fulop GA, Tarantini S, Yabluchanskiy A, Molnar A, Prodan CI Kiss T, et al. Role of age-related alterations of the cerebral venous circulation in the pathogenesis of vascular cognitive impairment. Am J Physiol Heart Circ Physiol. 2019; 316(5): H1124–H1140. [CrossRef]
- Ungvari Z, Tarantini S, Kirkpatrick AC, Csiszar A, Prodan CI. Cerebral microhemorrhages: mechanisms, consequences, and prevention. Am J Physiol Heart Circ Physiol. 2017;312(6):H1128-H1143. [CrossRef]
- Paavonsalo S, Hariharan S, Lackman MH, Karaman S. Capillary Rarefaction in Obesity and Metabolic Diseases—Organ-Specificity and Possible Mechanisms. Cells. 2020;9:2683. [CrossRef]
- Chantler PD, Shrader CD, Tabone LE, D’Audiffret AC, Huseynova K, Brooks SD, Branyan KW, Grogg KA, Frisbee JC. Cerebral Cortical Microvascular Rarefaction in Metabolic Syndrome is Dependent on Insulin Resistance and Loss of Nitric Oxide Bioavailability. Microcirculation. 2015;22:435–445. [CrossRef]
- Estato V, Nascimento A, Antunes B, Gomes F, Coelho L, Rangel R, Garzoni, Daliry A, Bousquet P, Tibirica E. Cerebral Microvascular Dysfunction and Inflammation Are Improved by Centrally Acting Antihypertensive Drugs in Metabolic Syndrome. Metab. Syndr. Relat. Disord. 2017;15:26–35. [CrossRef]
- Tucsek Z, Toth P, Tarantini S, Sosnowska D, Gautam T, Warrington JP, et al. Aging exacerbates obesity-induced cerebromicrovascular rarefaction, neurovascular uncoupling, and cognitive decline in mice. J. Gerontol. A Biol. Sci. Med. Sci. 2014;69:1339–1352. [CrossRef]
- Grotta JC. Stroke Progress Review Group: summary of successes and lack of progress. incorporating neurons and the adjacent vasculature. Stroke. 2013;44(6 Suppl 1):S111-S113. [CrossRef]
- Lo EH, Rosenberg GA. The neurovascular unit in health and disease: introduction. Stroke. 2009;40(3 Suppl):S2-3. [CrossRef]
- Zlokovic BV. Neurovascular pathways to neurodegeneration in Alzheimer's disease and other disorders. Nat Rev Neurosci. 2011;12(12):723-38. [CrossRef]
- Alkayed NJ, Cipolla MJ. The Ever-Evolving Concept of the Neurovascular Unit. Stroke. 2023;54(8):2178-2180. [CrossRef]
- Faraco G, Park L, Josef Anrather J, Iadecola C. Brain perivascular macrophages: characterization and functional roles in health and disease. J Mol Med (Berl). 2017;95(11):1143-1152. [CrossRef]
- Whitmer RA, Gustafson DR, Barrett-Connor E, Haan MN, Gunderson EP, Yaffe K. Central obesity and increased risk of dementia more than three decades later. Neurology. 2008;71(14):1057-1064. [CrossRef]
- Luchsinger JA, Roberts R. Relation of diabetes to mild cognitive impairment. Arch Neurol. 2007;64:570–575. [CrossRef]
- Knopman DS, Roberts R. Vascular risk factors: imaging and neuropathologic correlates. J Alzheimers Dis. 2010;20:699–709. [CrossRef]
- Iadecola C, Davisson RL. Hypertension and cerebrovascular dysfunction. Cell Metab. 2008;7:476–484. [CrossRef]
- Jellinger KA. Prevalence and impact of cerebrovascular lesions in Alzheimer and lewy body diseases. Neurodegener Dis. 2010;7:112–115. [CrossRef]
- Marchesi VT. Alzheimer’s dementia begins as a disease of small blood vessels, damaged by oxidative-induced inflammation and dysregulated amyloid metabolism: implications for early detection and therapy. FASEB J. 2011;25:5–13. [CrossRef]
- Ruitenberg A, den Heijer TD, Bakker SLM, van Swieten JC, Koudstaal PJ, Hofman A, Breteler MMB. Cerebral hypoperfusion and clinical onset of dementia: the Rotterdam Study. Ann Neurol. 2005;57(6):789-94. [CrossRef]
- Vermeer SE, Prins ND, den Heijer T, Hofman A, Koudstaal PJ, Breteler MMB. Silent brain infarcts and the risk of dementia and cognitive decline.2003;348(13):1215-22. [CrossRef]
- Snowdon DA, Greiner LH, Mortimer JA, K P Riley KP, Greiner PA, Markesbery WR. Brain infarction and the clinical expression of Alzheimer disease. The Nun Study. JAMA. 1997;277:813–817. [CrossRef]
- Hayden MR. Hypothesis: Neuroglia Activation Due to Increased Peripheral and CNS Proinflammatory Cytokines/Chemokines with Neuroinflammation May Result in Long COVID. Neuroglia. 2021, 2(1), 7-35; [CrossRef]
- González-Castro V, Valdes-Hernández MDCV, Chappell FM, Armitage PA, Makin S, Wardlaw JM. Reliability of an automatic classifier for brain enlarged perivascular spaces burden and comparison with human performance. Clin Sci (London). 2017;131(13):1465-1481. [CrossRef]
- Iliff JJ, Lee H, Yu M, Feng T, Logan J, Nedergaard M, Benveniste H. Brain-wide pathway for waste clearance captured by contrast-enhanced MRI. J Clin Invest. 2013;123(3):1299-309. [CrossRef]
- Rudie JD, Rauschecker AM, Nabavizadeh SA, Mohan S. Neuroimaging of Dilated Perivascular Spaces: From Benign and Pathologic Causes to Mimics. J Neuroimaging. 2018;28(2):139–149.. [CrossRef]
- Zeddie M, Grisendi I, Assenza F, Vandelli G, Napoli M, Moratti C, et al. The Venular Side of Cerebral Amyloid Angiopathy: Proof of Concept of a Neglected Issue. Biomedicines. 2023;11(10): 2663. [CrossRef]
- Hayden MR. Brain Injury: Response to Injury Wound-Healing Mechanisms and Enlarged Perivascular Spaces in Obesity, Metabolic Syndrome, and Type 2 Diabetes Mellitus. Medicina (Kaunas). 2023;59(7):1337. [CrossRef]
- Wardlaw JM, Smith EE, Biessels GJ, Cordonnier C, Fazekas F, Frayne R, et al. STandards for ReportIng Vascular changes on nEuroimaging (STRIVE v1). Lancet Neurol. 2013;12(8):822-38. [CrossRef]
- Brown R, Benveniste H, Black SE, Charpak S, Dichgans M, Joutel A, Nedergaard M, Smith KJ, Zlokovic BV, Wardlaw JM. Understanding the role of the perivascular space in cerebral small vessel disease. Cardiovasc. Res. 2018;114.1462–1473. [CrossRef]
- Bown CW, Carare RO, Schrag MS, Jefferson AL. Physiology and Clinical Relevance of Enlarged Perivascular Spaces in the Aging Brain. Neurology. 2022;98(3):107-117. [CrossRef]
- Doubal FN, MacLullich AMJ, Ferguson KJ, Dennis MS, Wardlaw JM. Enlarged perivascular spaces on MRI are a feature of cerebral small vessel disease. Stroke. 2010;41(3):450-454. [CrossRef]
- Paradise M, Crawford JD, Lam BCP, Wen W, Kochan NA, Makkar S, et al. Association of Dilated Perivascular Spaces With Cognitive Decline and Incident Dementia. Neurology. 2021;96(11):e1501–e1511. [CrossRef]
- Ramirez J, Berezuk C, McNeely AA, Scott CJM , Gao F, Black SE. Visible Virchow-Robin spaces on magnetic resonance imaging of Alzheimer's disease patients and normal elderly from the Sunnybrook Dementia Study. J Alz. Dis. 2015;43(2):415-424. [CrossRef]
- Banerjee G , Kim HJ, Fox Z, Jäger HR, Wilson D , Charidimou A. MRI-visible perivascular space location is associated with Alzheimer's disease independently of amyloid burden. Brain. 2017;140(4):1107-1116. [CrossRef]
- Bohr T, Hjorth PG, Holst SC, Hrabětová S, Kiviniemi V, Lilius T, et al. The glymphatic system: Current understanding and modeling. iScience. 2022;25(9):104987. Section 6. [CrossRef]
- Rasmussen MK, Mestre H, Nedergaard M. Fluid transport in the brain. Physiol Rev. 2022;102(2):1025-1151. [CrossRef]
- Kress BT, Iliff JJ, Xia M, Wang M, Wei HS, Zeppenfeld D, Xie L, Kang H, Xu Q, Liew JA, Plog BA, Ding F, Deane R, Nedergaard M. Impairment of paravascular clearance pathways in the aging brain. Ann Neurol. 2014;76: 845–861. [CrossRef]
- Hablitz LM, Plá V, Giannetto M, Vinitsky HS, Stæger FF, Metcalfe T, Nguyen R, Benrais A, Nedergaard M. Circadian control of brain glymphatic and lymphatic fluid flow. Nat Commun. 2020;11: 4411. [CrossRef]
- Loos CMJ, Klarenbeek P, van Oostenbrugge RJ, Staals J. Association between Perivascular Spaces and Progression of White Matter Hyperintensities in Lacunar Stroke Patients. PLoS One. 2015; 10(9): e0137323. [CrossRef]
- Pham W, Lynch M, Spitz G, O'Brien T, Vivash L, Sinclair B, Law M. A critical guide to the automated quantification of perivascular spaces in magnetic resonance imaging. Front Neurosci. 2022;16:1021311. [CrossRef]
- Wang Y, Huang C, Guo Q, Chu H. Aquaporin-4 and Cognitive Disorders. Aging Dis. 2022;13(1):61–72. [CrossRef]
- Mader S, Brimberg L. Aquaporin-4 Water Channel in the Brain and Its Implication for Health and Disease. Cells. 2019;8(2):90. [CrossRef]
- Benveniste H, Nedergaard M. Cerebral small vessel disease: A glymphopathy? Curr Opin Neurobiol. 2022;72:15-21. [CrossRef]
- Papadopoulos MC, Verkman AS. Aquaporin 4 and neuromyelitis optica. Lancet Neurol. 2012;11(6):535-544. [CrossRef]
- Jarius S, Paul F, Weinshenker BG, Levy M, Kim HJ, Wildemann B. Neuromyelitis optica. Nat Rev Dis Primers. 2020;6(1):85. [CrossRef]
- Huang TL, Wang JK, Chang PY, Hsu YR, Lin CJ, Lin KH, Tsai RK. Neuromyelitis Optica Spectrum Disorder: From Basic Research to Clinical Perspectives. Int J Mol Sci. 2022 Jul; 23(14): 7908. [CrossRef]
- Huda S, Whittman D, Bhojak M, Chamberlain J, Noonan C, Jacob A, Kneen R. Neuromyelitis optica spectrum disorders. Clin Med (Lond). 2019;19(2):169-176. [CrossRef]
- Verkman S, Binder DK, Bloch O, Auguste K, Papadopoulos MC. Three roles of aquaporin-4 in brain function revealed by knockout mice. Biochim Biophys Acta. 2006;1758(8):1085-1093. [CrossRef]
- Nielsen S, Nagelhus EA, Amiry-Moghaddam M, Bourque C, Agre P, Ottersen OP. Specialized membrane domains for water transport in glial cells: high-resolution immunogold cytochemistry of aquaporin-4 in rat brain. J Neurosci. 1997;17(1):171-80. [CrossRef]
- Rasmussen MK, Mestre H, Nedergaard M. The glymphatic pathway in neurological disorders. Lancet Neurol. 2018;17(11):1016-1024. [CrossRef]
- Verkhratsky A. Astrocytes: The Housekeepers and Guardians of the CNS. Adv Neurobiol. 2021;26: 21–53. [CrossRef]
- Verkhratsky A, Butt AM. Neuroglia: Function and Pathology. 1st ed.; Academic Press. 125 London Wall, London EC2Y 5AS, United Kingdom 525 B Street. Copyright © 2023 Elsevier Inc. All rights reserved.
- Scemes E, Spray DC. Chapter: The astrocytic syncytium In Non-Neural Cells in the Nervous System: Function and Dysfunction; Hertz, L., Ed.; Elsevier: New York, NY, USA, 2004; Volume 31, pp. 165–179.
- Verkhratsky A, Nedergaard M. Astroglial cradle in the life of the synapse. Phil Trans R Soc Lond. B Biol Sci. 2014;2014;369(1654):20130595. [CrossRef]
- Cashion JM, Young KM, Sutherland BA. How does neurovascular unit dysfunction contribute to multiple sclerosis? Neurobiol Dis. 2013;178:106028. [CrossRef]
- Díaz-Castro B, Robel S, Mishra A. Astrocyte Endfeet in Brain Function and Pathology: Open Questions. Annu Rev Neurosci. 2023;46:101-121. [CrossRef]
- Hayden MR. Hypothesis: Astrocyte Foot Processes Detachment from the Neurovascular Unit in Female Diabetic Mice May Impair Modulation of Information Processing-Six Degrees of Separation. Brain Sci. 2019;9(4):83. [CrossRef]
- Milner R, Hung S, Wang X, Spatz M, del Zoppo GJ. The rapid decrease in astrocyte-associated dystroglycan expression by focal cerebral ischemia is protease-dependent. J Cereb Blood Flow Metab. 2008;28(4):812–823.. [CrossRef]
- Scharfman HE, Binder DK. Aquaporin-4 water channels and synaptic plasticity in the hippocampus. Neurochemistry International. 2013;63(7):702-711. [CrossRef]
- Nedergaard M, Verkhratsky A. Artifact versus reality--how astrocytes contribute to synaptic events. Glia. 2012;60(7):1013-23. [CrossRef]
- Skucas VA, Mathews IB, Yang J, Cheng Q, Treister A, Duffy AM, et al. Impairment of select forms of spatial memory and neurotrophin-dependent synaptic plasticity by deletion of glial aquaporin-4. Neurosci. 2011;31(17):6392-6397. [CrossRef]
- González-Marrero I, Hernández-Abad LG, González-Gómez M, Soto-Viera M, Carmona-Calero EM, Castañeyra-Ruiz L, Castañeyra-Perdomo A. Altered Expression of AQP1 and AQP4 in Brain Barriers and Cerebrospinal Fluid May Affect Cerebral Water Balance during Chronic Hypertension. Int J Mol Sci. 2022; 23(20):12277. [CrossRef]
- Li YK, Wang F, Wang W, Luo Y, Wu PF, Xiao JL, Hu ZL, Jin Y, Hu G, Chen JG.
- Chelini G, Pantazopoulos H, Durning P, Berretta S. The tetrapartite synapse: a key concept in the pathophysiology of schizophrenia. Eur Psychiatry. 2018;50:60-69. [CrossRef]
- Mathiisen TM, Lehre KP, Danbolt NC, Ottersen OP. The perivascular astroglial sheath provides a complete covering of the brain microvessels: An electron microscopic 3D reconstruction. Glia. 2010;58:1094–1103. [CrossRef]
- Rotta J , Perosa V, Yakupov R, Kuijf HJ, Schreiber F, Dobisch L, et al. Detection of Cerebral Microbleeds With Venous Connection at 7-Tesla MRI. 2021; 96(16):e2048-e2057. [CrossRef]
- Schmid F, Barrett MJ, Jenny P, Weber B. Vascular density and distribution in neocortex. NeuroImage. 2019;197:792–805. [CrossRef]
- Lai AY, Dorr A., Thomason LAM, Koletar MM, Sled JG, Stefanovic B, McLaurin J. Venular degeneration leads to vascular dysfunction in a transgenic model of Alzheimer’s disease. Brain. 2015;138:1046–1058. [CrossRef]
- Keith J, Gao F, Noor R, Kiss A, Balasubramaniam G, Au K, Rogaeva E, Masellis M, Black SE. Collagenosis of the Deep Medullary Veins: An Underrecognized Pathologic Correlate of White Matter Hyperintensities and Periventricular Infarction? J. Neuropathol. Exp. Neurol. 2017;76:299–312. [CrossRef]
- Hartmann DA, Hyacinth HI, Liao F, Shih AY. Does pathology of small venules contribute to cerebral microinfarcts and dementia? J. Neurochem. 2018;144:517–526. [CrossRef]
- Shih AY, Ruhlmann C, Blinder P, Devor A, Drew PJ, Friedman B, Knutsen PM, Lyden PD, Mateo C, Mellander L, et al. Robust and fragile aspects of cortical blood flow in relation to the underlying angioarchitecture. Microcirculation. 2015;22:204–218. [CrossRef]
- Klakotskaia D., Agca C., Richardson R.A., Stopa E.G., Schachtman T.R., Agca Y. Memory deficiency, cerebral amyloid angiopathy, and amyloid-plaques in APP+PS1 double transgenic rat model of Alzheimer’s disease. PLoS ONE. 2018;13:e0195469. [CrossRef]
- Cohen RM, Rezai-Zadeh K, Weitz TM, Rentsendorj A, Gate D, Spivak I, Bholat Y, Vasilevko V, Glabe CG, Breunig JJ, et al. A Transgenic Alzheimer Rat with Plaques, Tau Pathology, Behavioral Impairment, Oligomeric Aβ, and Frank Neuronal Loss. J Neurosci. 2013;33:6245–6256. [CrossRef]
- Joo IL, Lai AY, Bazzigaluppi P, Koletar MM, Dorr A, Brown ME, Thomason LAM, Sled JG, McLaurin J, Stefanovic B. Early neurovascular dysfunction in a transgenic rat model of Alzheimer’s disease. Sci. Rep. 2017;7:srep46427. [CrossRef]
- Revesz T, Holton JL, Lashley T, Plant G, Rostagno A, Ghiso J, Frangione B. Sporadic and Familial Cerebral Amyloid Angiopathies. Brain Pathol. 2002;12:343–357. [CrossRef]
- Michaud JP, Bellavance MA, Préfontaine P, Rivest S. Real-Time In Vivo Imaging Reveals the Ability of Monocytes to Clear Vascular Amyloid Beta. Cell Rep. 2013;5:646–653. [CrossRef]
- Dorr A, Sahota B, Chinta LV, Brown ME, Lai AY, Ma K, Hawkes CA, ΜcLaurin J, Stefanovic B. Amy-loid-beta-Dependent compromise of microvascular structure and function in a model of Alzheimer’s disease. Brain. 2012;135:3039–3050. [CrossRef]
- Weller RO, Boche D, Nicoll JAR. Microvasculature changes and cerebral amyloid angiopathy in Alzheimer’s disease and their potential impact on therapy. Acta Neuropathol. 2009;118:87–102. [CrossRef]
- Weller RO, Massey A, Newman TA, Hutchings M, Kuo Y, Roher AE. Cerebral Amyloid Angiopathy: Amyloid Ac cumulates in Putative Interstitial Fluid Drainage Pathways in Alzheimer’s Disease. Am. J. Pathol. 1998;153:725–733. [CrossRef]
- Duvernoy, H.; Delon, S.; Vannson, JL. Cortical blood vessels of the human brain. Brain Res. Bull. 1981;7:519–579. [CrossRef]
- Iadecola I, Smith EE, Anrather J, Gu C, Mishra A, Misra S, et al. The Neurovasculome: Key Roles in Brain Health and Cognitive Impairment: A Scientific Statement From the American Heart Association/American Stroke Association. Stroke. 2023;54(6):e251-e271. [CrossRef]
- Smith EE, Schneider JA, Wardlaw JM, Greenberg SM. Cerebral microinfarcts: The invisible lesions. Lancet Neurol. 2012;11:272–282. [CrossRef]
- van Veluw SJ, Charidimou A, Andre J. van der Kouwe AJ, Arne Lauer A, Reijmer YD, Costantino I, et al. Microbleed and microinfarct detection in amyloid angiopathy: a high-resolution MRI-histopathology study. Brain. 2016;139(12): 3151–3162. [CrossRef]
- Morrone CD, Bishay J, McLaurin J. Potential Role of Venular Amyloid in Alzheimer's Disease Pathogenesis. Int J Mol Sci. 2020;21(6):1985. [CrossRef]
Figure 1.
Comparing the ultrastructure transmission electron microscopy (TEM) appearance and illustrations of the true capillary neurovascular unit to the precapillary arteriole and the postcapillary venule with its perivascular spaces (PVS) and enlarged perivascular spaces (EPVS) that exists in the post capillary perivascular unit (PVU). Panel A demonstrates a precapillary arteriole, which initially has a larger perivascular space (PVS) at its origin from the subarachnoid space that narrows to a nanometer sized PVS (pseudo-colored green) that ends at the true capillary in the cortical grey and subcortical white matter. Panel B demonstrates the primary or true capillary, which has lost the pia mater layer and does not have a PVS. In the true capillary, note how the perivascular astrocyte endfeet (pvACef) tightly abut and are directly adherent to the NVU mural cells (brain endothelial cells (ECs), and pericytes foot processes (PcP - Pcfp) basement membrane(s) (BMs) via the pvACef dystroglycans. The true capillary is the substrate for both the neurovascular unit (NVU) and its blood-brain barrier. Note the interrogating microglia cell (iMGC white closed arrow). Panel C demonstrates a postcapillary venule which is identified via the presence of PVS and in this image depicts a resident perivascular macrophage (rPVMΦ). Importantly, the perivascular spaces serve as the construct and structure that is responsible for carrying the metabolic waste from the interstitial spaces to the cerebrospinal fluid and is known as the glymphatic system-pathway that also forms the perivascular unit (PVU). Scale bars = 3μm; 0.5μm; 5μm respectively. Panels A, B, C are in cross section and downward red arrows indicate corresponding illustrations in D, E, and F. Panels D, E, F illustrate longitudinal views of the precapillary arterioles, true capillary, and postcapillary venules respectively, while the cyan green lines represent the glia limitans of the pvACef. Importantly, note the presence of contractile pericytes and their processes in panels C and F that allow for neurovascular coupling in postcapillary venules. The TEM figures are provided by utilizing the graphic abstract by CC 4.0 [2]. AC = perivascular astrocytes; ACef = astrocyte endfeet – perivascular astrocyte endfeet; AQP4 = aquaporin 4; CL = capillary lumen; dAQP4 = dysfunction aquaporin 4 red lettering; EC = brain endothelial cell; EPVS = enlarged perivascular spaces; gS = glymphatic space – perivascular space; iMGC = interrogating microglial cell; Lys = lysosome; Mt = mitochondria; N = nucleus; NVU = neurovascular unit; Pc = pericyte; PcP = pericyte foot processes; PcN = pericyte nucleus; RBC = red blood cell; rMΦ = reactive macrophage; TJ/AJ = tight and adherens junctions.
Figure 1.
Comparing the ultrastructure transmission electron microscopy (TEM) appearance and illustrations of the true capillary neurovascular unit to the precapillary arteriole and the postcapillary venule with its perivascular spaces (PVS) and enlarged perivascular spaces (EPVS) that exists in the post capillary perivascular unit (PVU). Panel A demonstrates a precapillary arteriole, which initially has a larger perivascular space (PVS) at its origin from the subarachnoid space that narrows to a nanometer sized PVS (pseudo-colored green) that ends at the true capillary in the cortical grey and subcortical white matter. Panel B demonstrates the primary or true capillary, which has lost the pia mater layer and does not have a PVS. In the true capillary, note how the perivascular astrocyte endfeet (pvACef) tightly abut and are directly adherent to the NVU mural cells (brain endothelial cells (ECs), and pericytes foot processes (PcP - Pcfp) basement membrane(s) (BMs) via the pvACef dystroglycans. The true capillary is the substrate for both the neurovascular unit (NVU) and its blood-brain barrier. Note the interrogating microglia cell (iMGC white closed arrow). Panel C demonstrates a postcapillary venule which is identified via the presence of PVS and in this image depicts a resident perivascular macrophage (rPVMΦ). Importantly, the perivascular spaces serve as the construct and structure that is responsible for carrying the metabolic waste from the interstitial spaces to the cerebrospinal fluid and is known as the glymphatic system-pathway that also forms the perivascular unit (PVU). Scale bars = 3μm; 0.5μm; 5μm respectively. Panels A, B, C are in cross section and downward red arrows indicate corresponding illustrations in D, E, and F. Panels D, E, F illustrate longitudinal views of the precapillary arterioles, true capillary, and postcapillary venules respectively, while the cyan green lines represent the glia limitans of the pvACef. Importantly, note the presence of contractile pericytes and their processes in panels C and F that allow for neurovascular coupling in postcapillary venules. The TEM figures are provided by utilizing the graphic abstract by CC 4.0 [2]. AC = perivascular astrocytes; ACef = astrocyte endfeet – perivascular astrocyte endfeet; AQP4 = aquaporin 4; CL = capillary lumen; dAQP4 = dysfunction aquaporin 4 red lettering; EC = brain endothelial cell; EPVS = enlarged perivascular spaces; gS = glymphatic space – perivascular space; iMGC = interrogating microglial cell; Lys = lysosome; Mt = mitochondria; N = nucleus; NVU = neurovascular unit; Pc = pericyte; PcP = pericyte foot processes; PcN = pericyte nucleus; RBC = red blood cell; rMΦ = reactive macrophage; TJ/AJ = tight and adherens junctions.
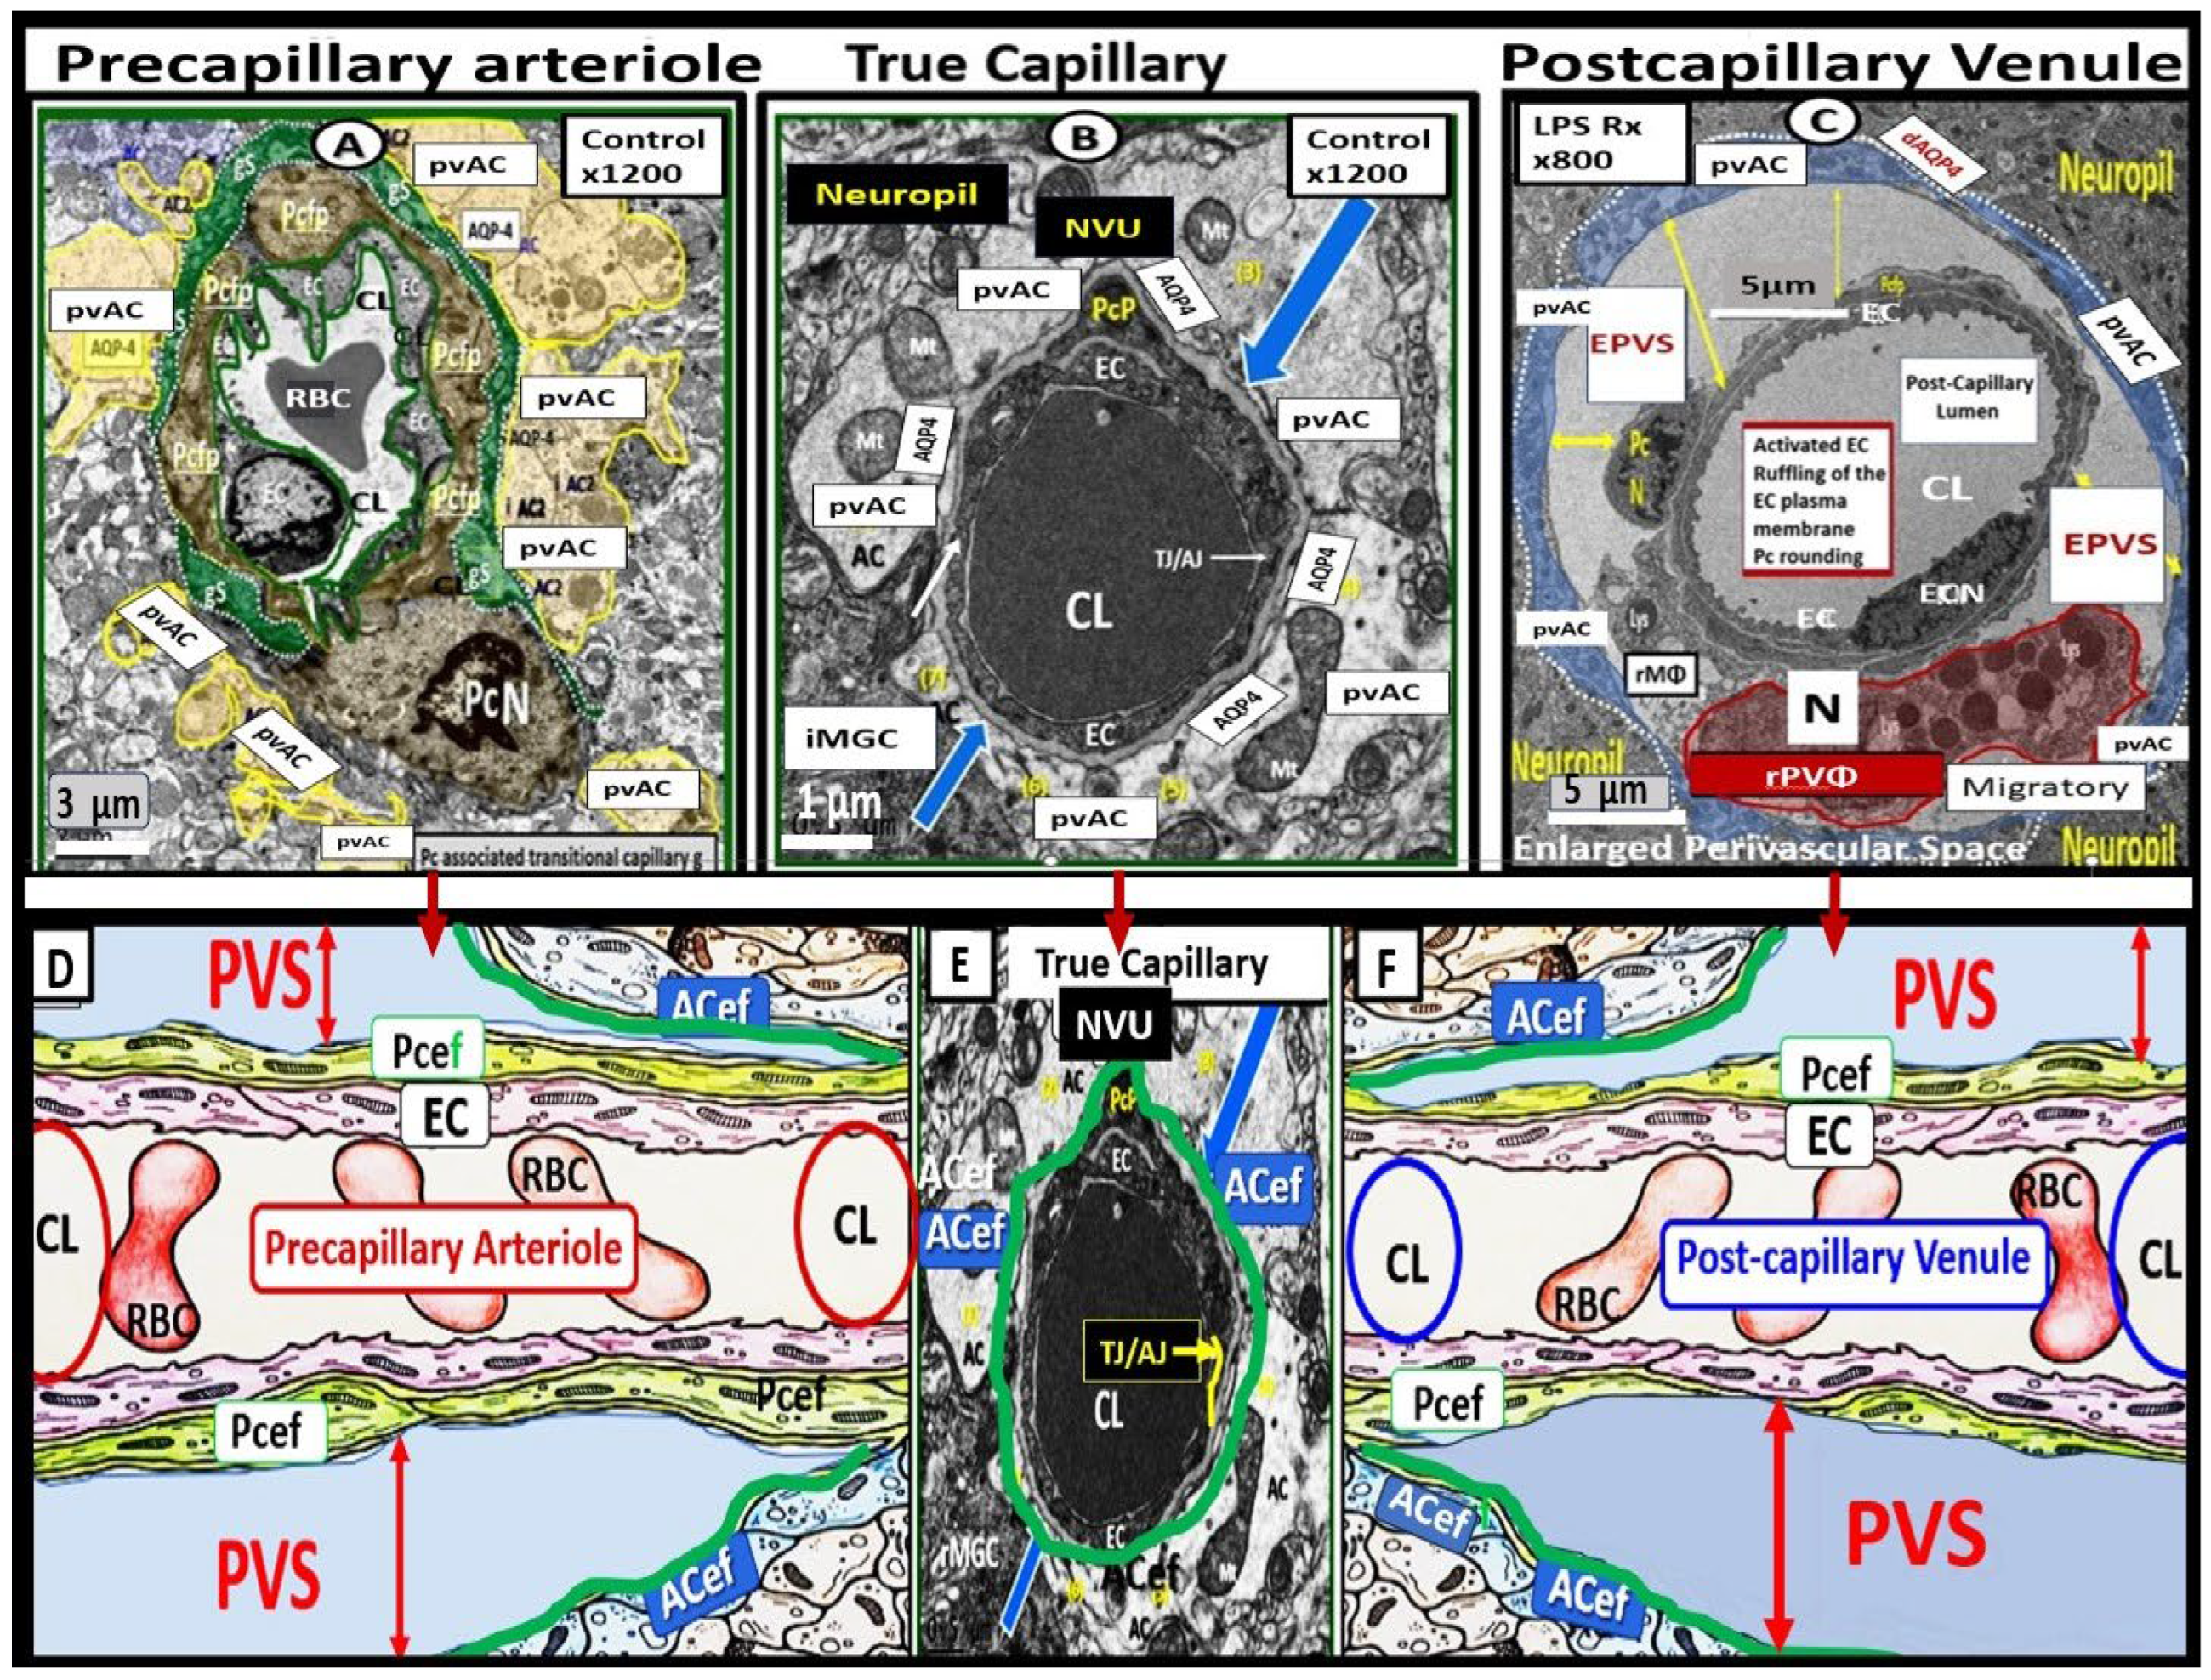
Figure 2.
Illustrations of precapillary influx, postcapillary efflux venules, and perivascular spaces (PVS). Panel A illustrates the PVS, which is bounded by the arterial and venous endothelial/pericyte basement membranes and the pia mater/astrocyte endfeet (ACef) (glia limitans). endfeet glia limitans that is responsible for the influx of cerebrospinal fluid (CSF) to the interstitial fluid (ISF) spaces. Likewise, the postcapillary venules, venules, and veins PVS are responsible for delivery of the ISF admixed with metabolic waste to the SAS and eventually to the systemic circulation via arachnoid granulations. The outermost pia mater abruptly stops at the true capillary and does not exist in the postcapillary venules and veins. Panel B illustrate the important role of the arachnoid villus and its granulations for exchange of ISF and metabolic waste with the dural venous sinus blood and dural lymphatics (cyan color) and-or the paranasal sinuses (not shown) to reach the systemic circulation bloodstream. Panel C illustrates NVU and the perivascular astrocyte endfeet (pvACef with blue coloring) barrier with a few 20nm gaps creating a rate-limiting barrier for water and solute exchange. Notably, the pvACef contain the polarized aquaporin 4 (AQP4) water channels, which are known to be important in fluid and solute exchange in addition to the transfer of metabolic waste to the CSF. Note the key in image. Image provided by CC 4.0 [2].
Figure 2.
Illustrations of precapillary influx, postcapillary efflux venules, and perivascular spaces (PVS). Panel A illustrates the PVS, which is bounded by the arterial and venous endothelial/pericyte basement membranes and the pia mater/astrocyte endfeet (ACef) (glia limitans). endfeet glia limitans that is responsible for the influx of cerebrospinal fluid (CSF) to the interstitial fluid (ISF) spaces. Likewise, the postcapillary venules, venules, and veins PVS are responsible for delivery of the ISF admixed with metabolic waste to the SAS and eventually to the systemic circulation via arachnoid granulations. The outermost pia mater abruptly stops at the true capillary and does not exist in the postcapillary venules and veins. Panel B illustrate the important role of the arachnoid villus and its granulations for exchange of ISF and metabolic waste with the dural venous sinus blood and dural lymphatics (cyan color) and-or the paranasal sinuses (not shown) to reach the systemic circulation bloodstream. Panel C illustrates NVU and the perivascular astrocyte endfeet (pvACef with blue coloring) barrier with a few 20nm gaps creating a rate-limiting barrier for water and solute exchange. Notably, the pvACef contain the polarized aquaporin 4 (AQP4) water channels, which are known to be important in fluid and solute exchange in addition to the transfer of metabolic waste to the CSF. Note the key in image. Image provided by CC 4.0 [2].
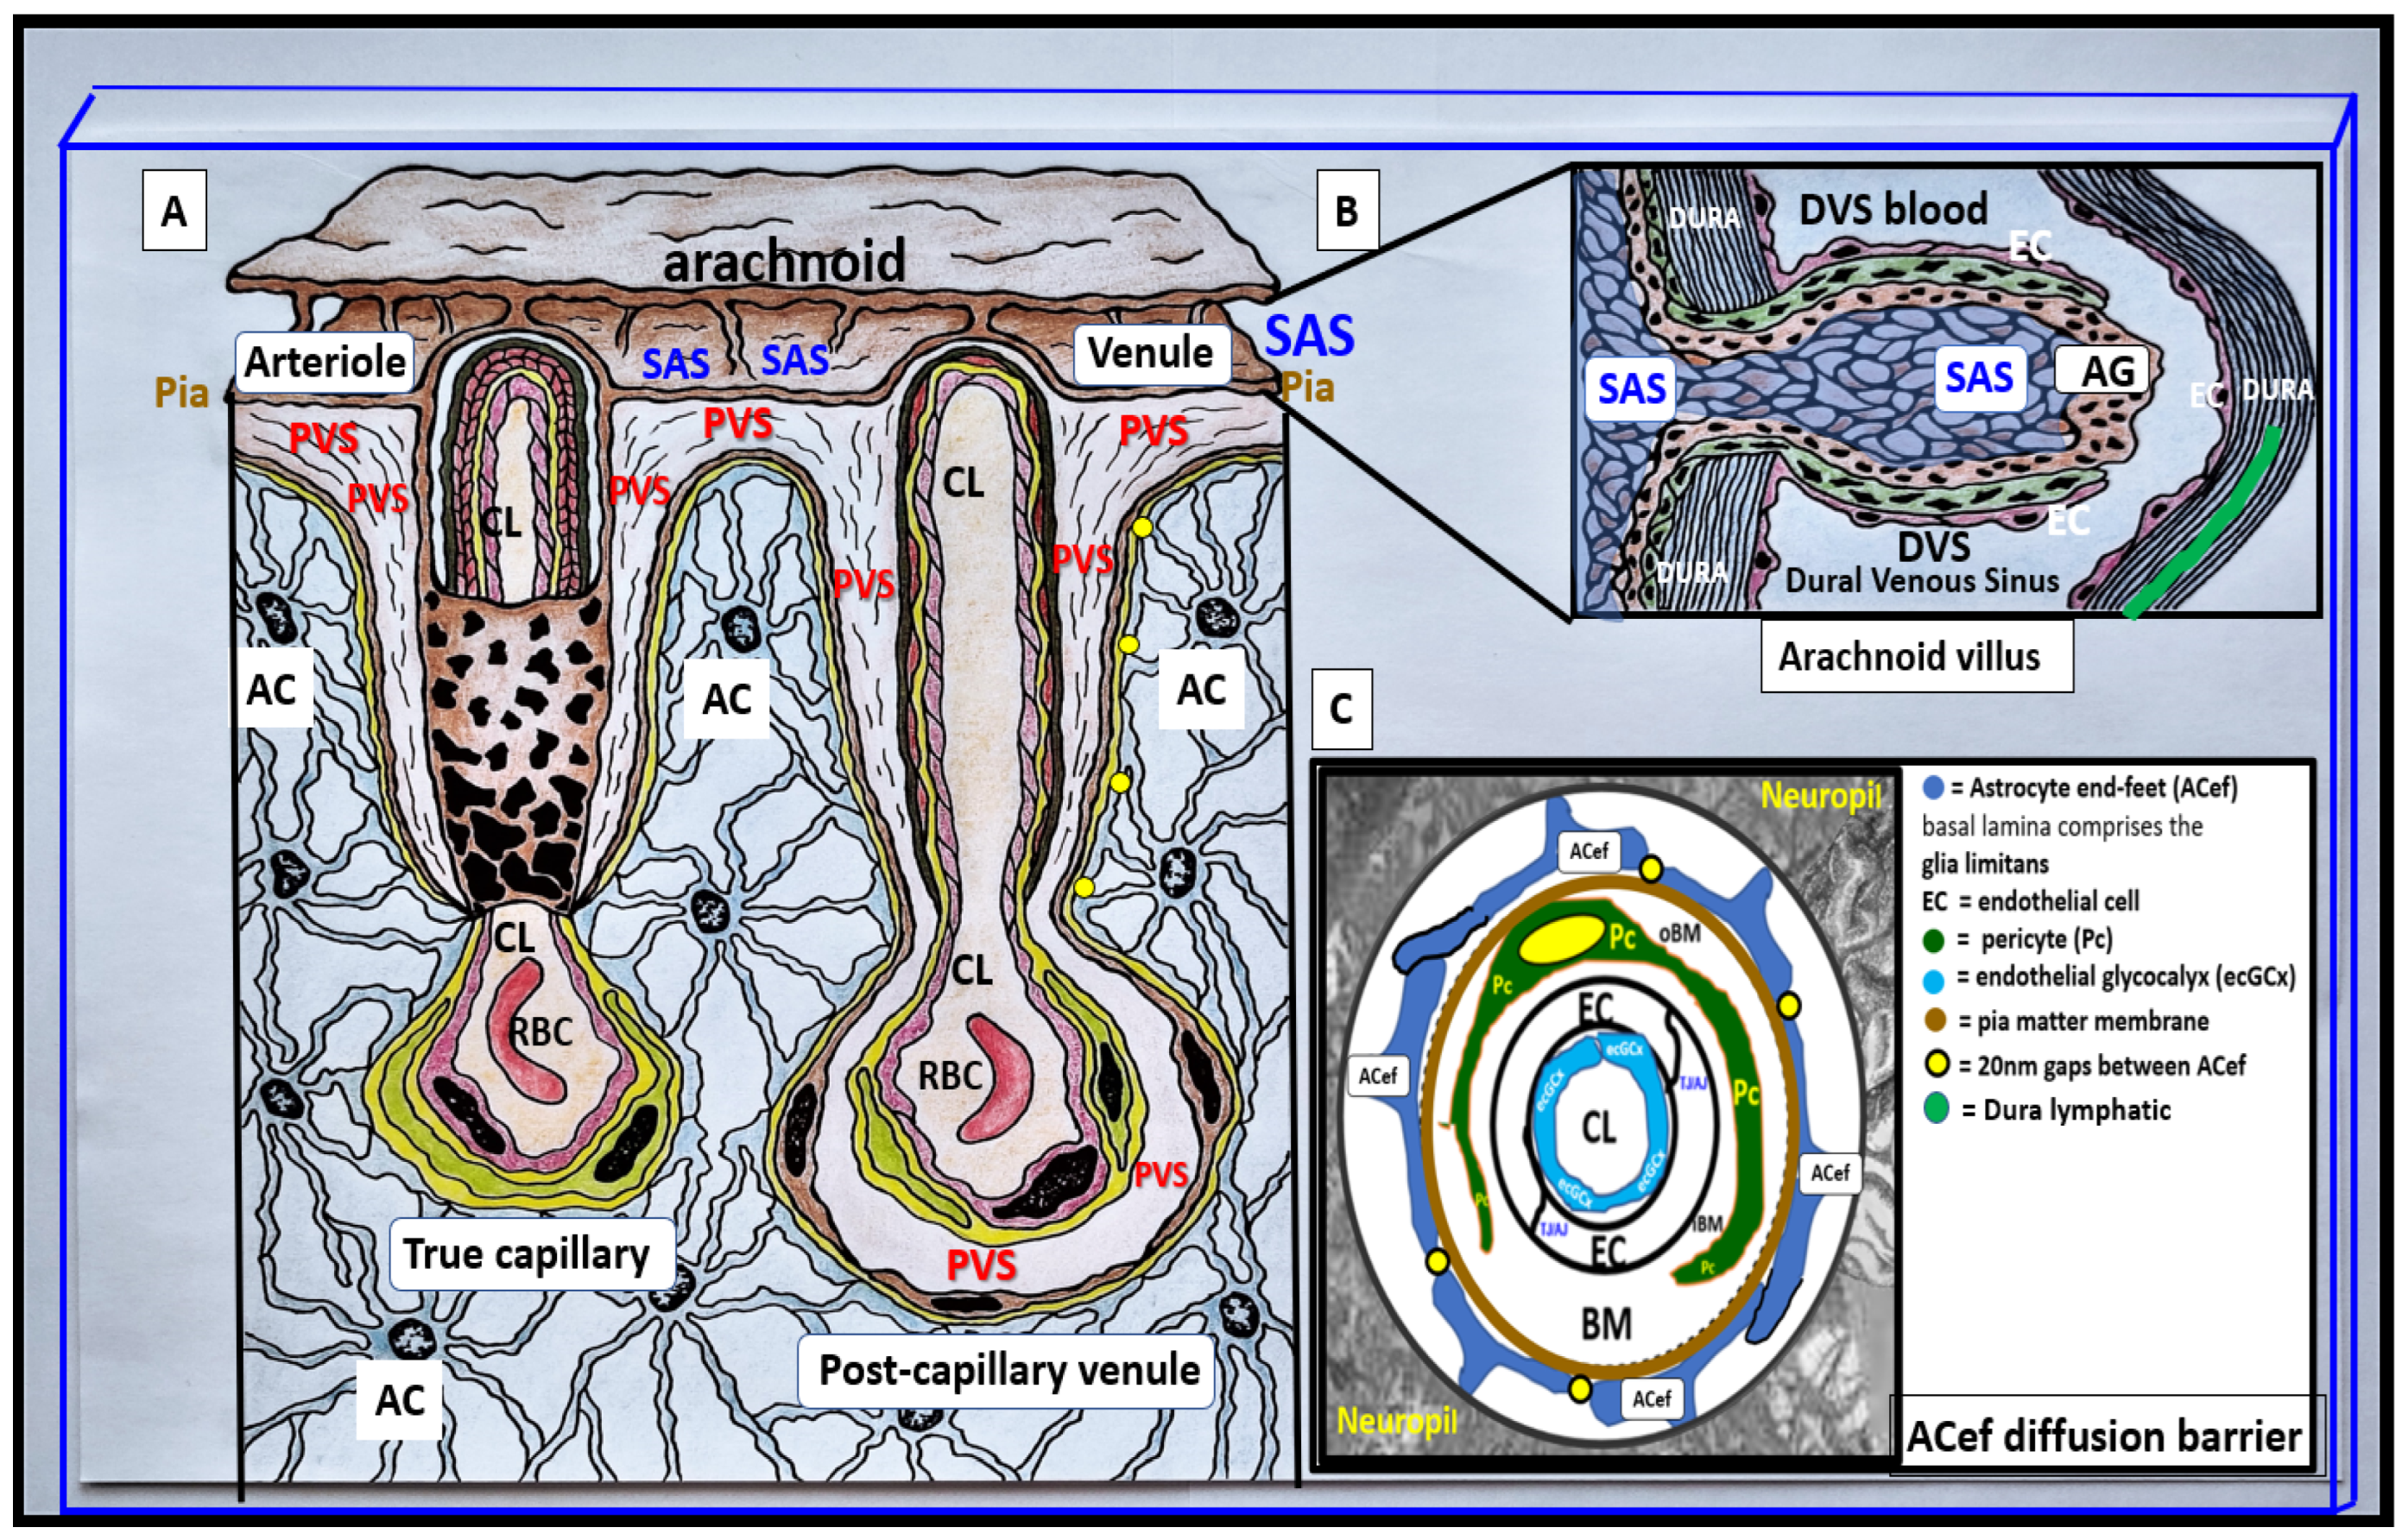
Figure 3.
Cross and longitudinal section of transmission electron microscopic (TEM) images of the neurovascular unit (NVU) and true capillary. Panel A demonstrates a TEM cross section of a true capillary NVU. Panel B demonstrates this true capillary NVU in longitudinal section. The pseudo-colored cyan green line represents and highlights the basement membrane of protoplasmic perivascular endfeet termed the glia limitans perivascularis of the perivascular astrocyte endfeet (panels A and B) and the golden pseudo-colored astrocyte endfeet (panel A) represent the critical importance of the perivascular endfeet to the neurovascular unit. Importantly, the pia mater membrane is lost at the level of the true capillary and also the postcapillary venules, venules, and veins of the perivascular unit. Further, note the perivascular astrocyte endfeet (AC) represent the AC clear zone (panel B, not pseudo-colored as in panel A). Modified images provided by CC 4.0 [5]. Magnification x4000; scale bar = 1 μm. AC = perivascular astrocyte endfeet; cap = capillary microvessel; EC = brain endothelial cell; iMGC = interrogating microglia cell; L = lumen; Mt = mitochondria.
Figure 3.
Cross and longitudinal section of transmission electron microscopic (TEM) images of the neurovascular unit (NVU) and true capillary. Panel A demonstrates a TEM cross section of a true capillary NVU. Panel B demonstrates this true capillary NVU in longitudinal section. The pseudo-colored cyan green line represents and highlights the basement membrane of protoplasmic perivascular endfeet termed the glia limitans perivascularis of the perivascular astrocyte endfeet (panels A and B) and the golden pseudo-colored astrocyte endfeet (panel A) represent the critical importance of the perivascular endfeet to the neurovascular unit. Importantly, the pia mater membrane is lost at the level of the true capillary and also the postcapillary venules, venules, and veins of the perivascular unit. Further, note the perivascular astrocyte endfeet (AC) represent the AC clear zone (panel B, not pseudo-colored as in panel A). Modified images provided by CC 4.0 [5]. Magnification x4000; scale bar = 1 μm. AC = perivascular astrocyte endfeet; cap = capillary microvessel; EC = brain endothelial cell; iMGC = interrogating microglia cell; L = lumen; Mt = mitochondria.
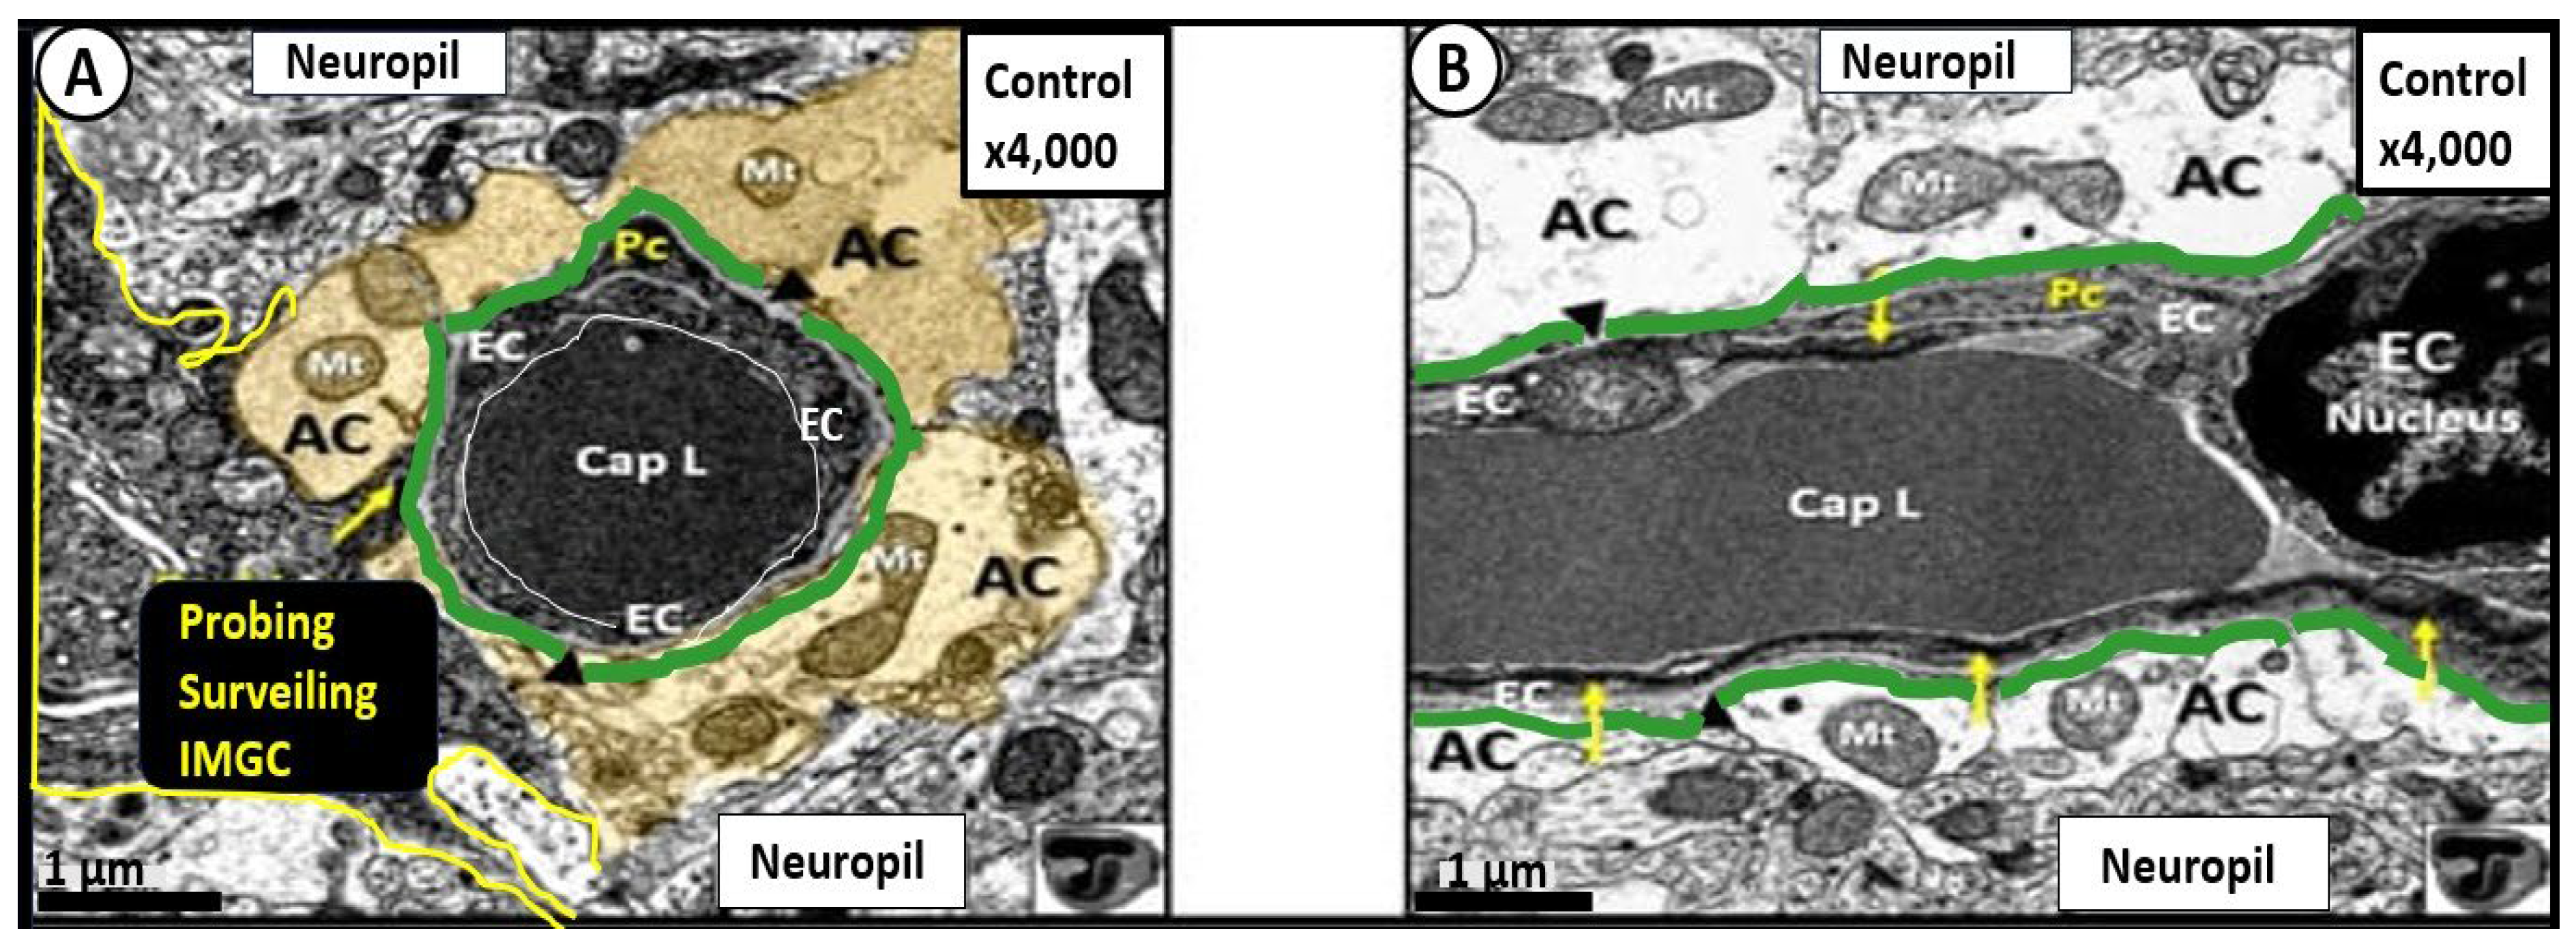
Figure 4.
Illustration of the neurovascular unit (NVU) with blood-brain barrier (BBB). Note that not only do the perivascular astrocyte endfeet connect to neurons and dendrites but also the tripartite synapse (not to scale). Key for abbreviations reside within the figure.
Figure 4.
Illustration of the neurovascular unit (NVU) with blood-brain barrier (BBB). Note that not only do the perivascular astrocyte endfeet connect to neurons and dendrites but also the tripartite synapse (not to scale). Key for abbreviations reside within the figure.
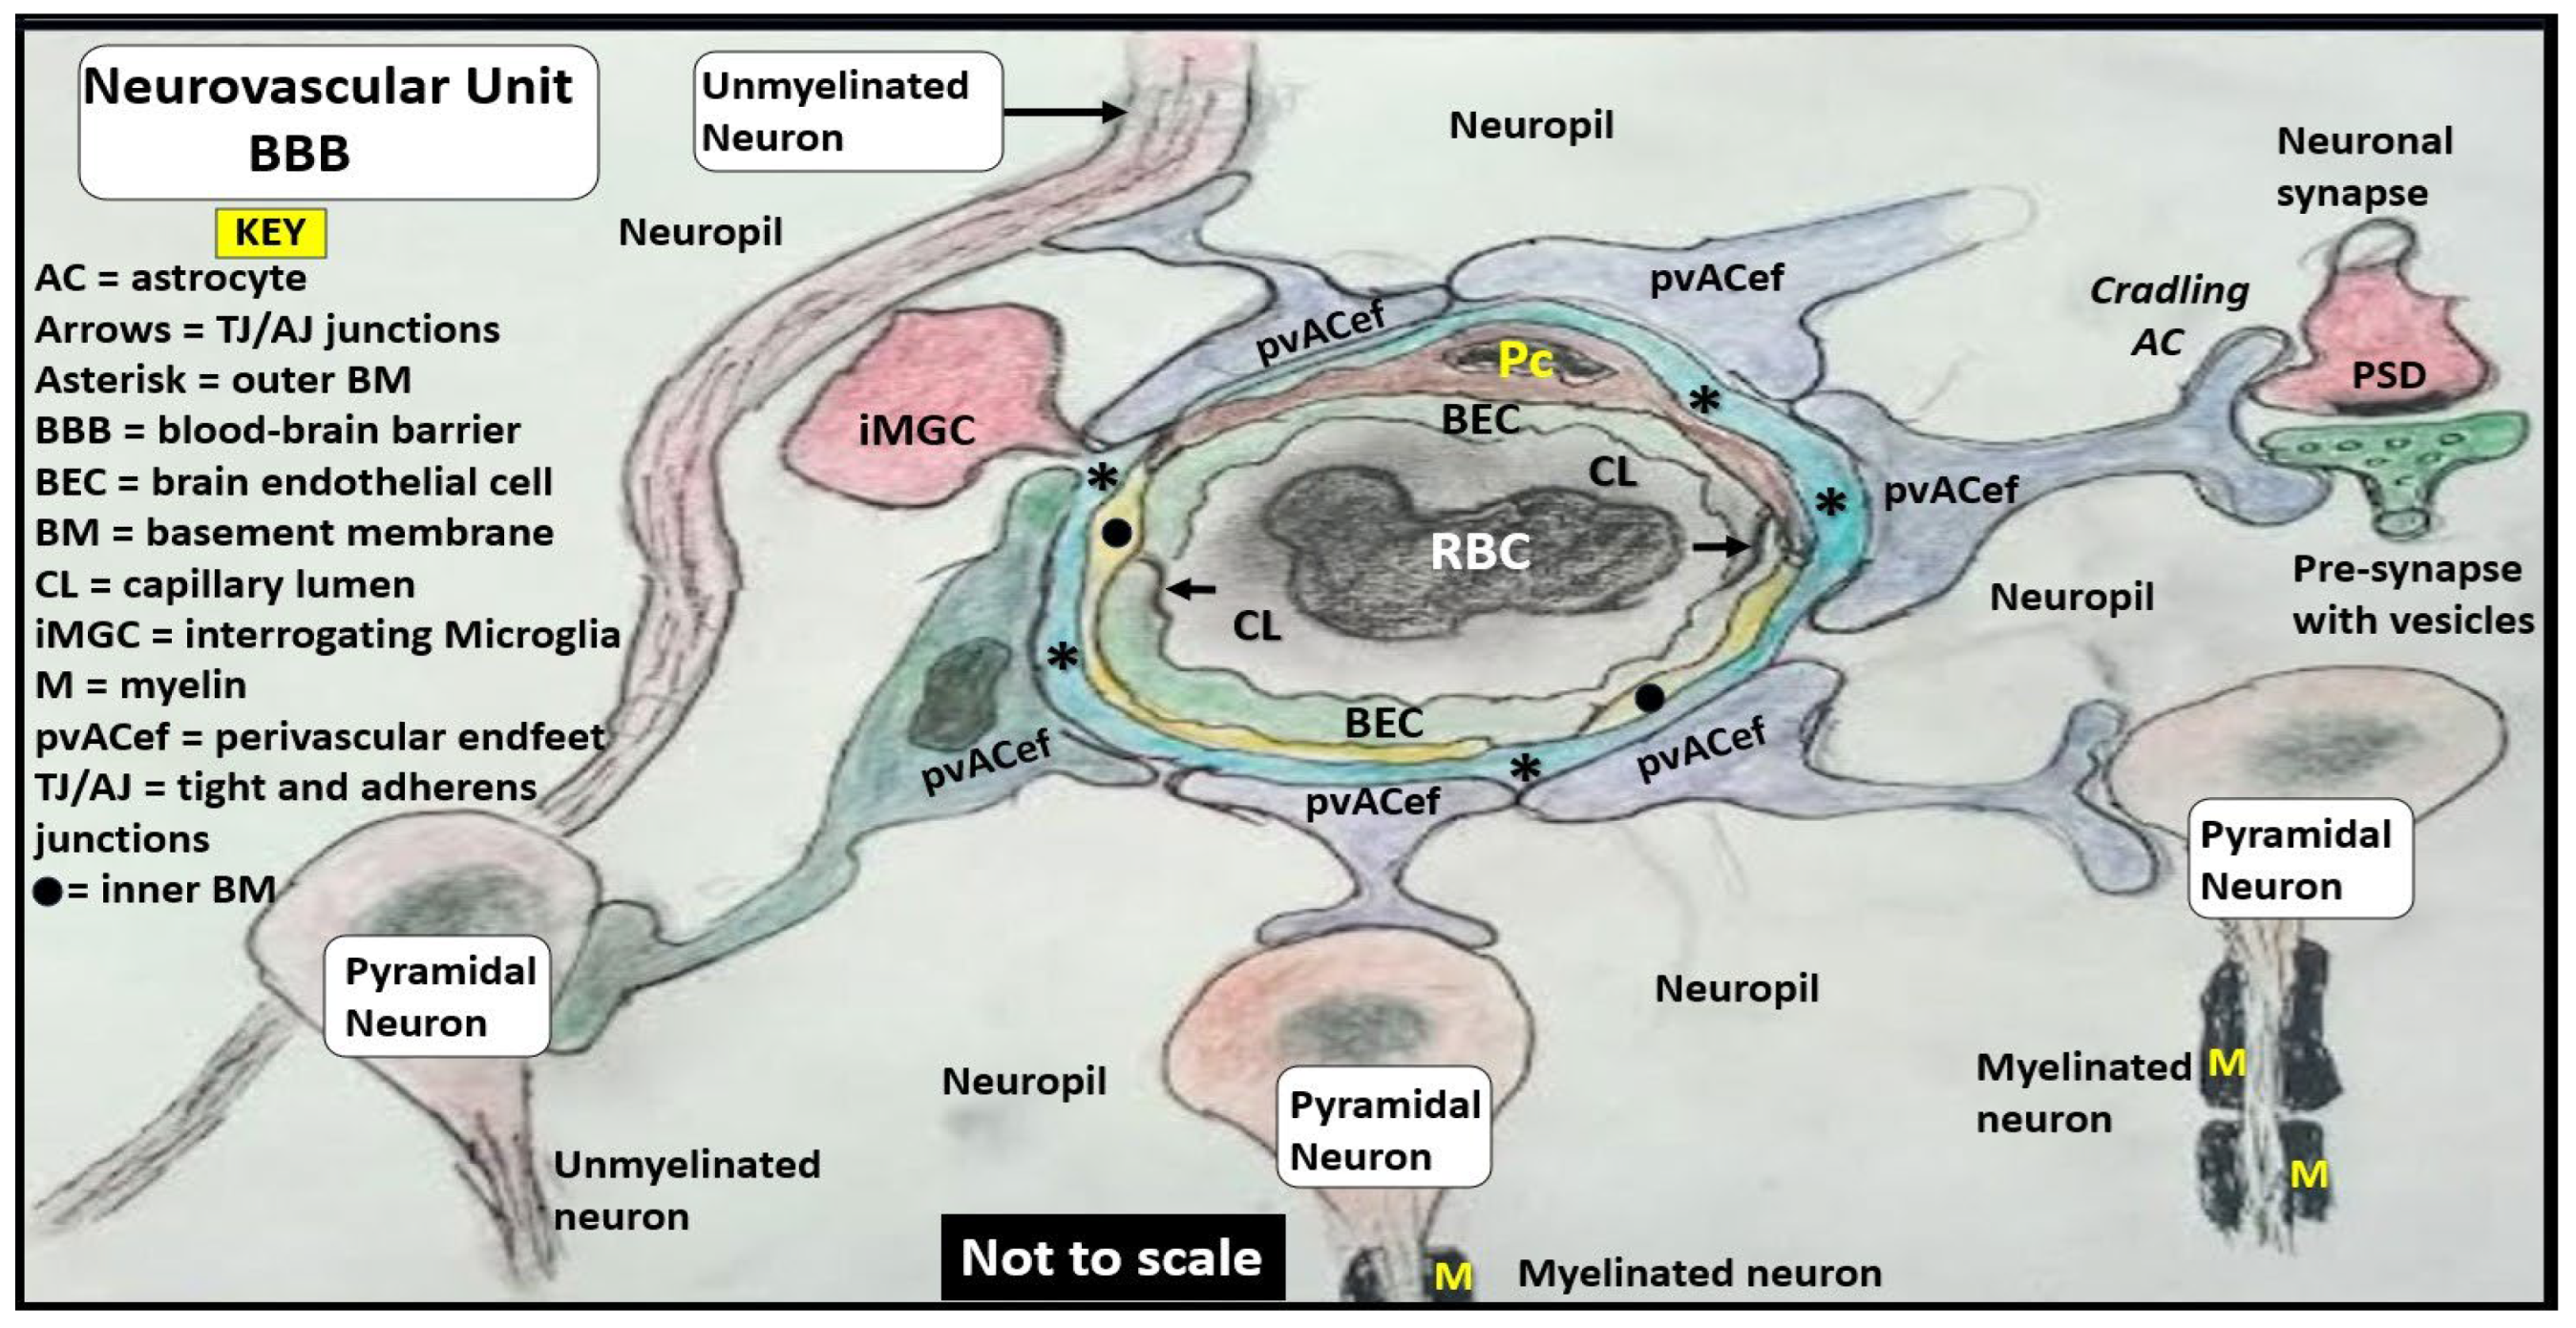
Figure 5.
Comparison of the true capillary neurovascular unit (NVU) to the postcapillary venule perivascular unit (PVU). The NVU protoplasmic perivascular astrocyte endfeet (pvACef) (pseudo-colored blue) within the true capillary illustration (panel A) are the connecting and creating cells that allow remodeling of the normal perivascular unit (PVU panel B) perivascular spaces (PVS) to transform and remodel into the pathologic enlarged perivascular space (EPVS, which measure 1-3 millimeter on magnetic resonance imaging). Panel A illustrates the hand-drawn and pseudo-colored control true capillary neurovascular unit (NVU) (representing the transmission electron microscopic (TEM in Figure 1B, Figure 3). Note that when the brain endothelial cells (BECs) become activated and NVU BBB disruption develops, due to BEC activation and dysfunction (BECact/dys) (from multiple causes), there develops an increased permeability of fluids, peripheral cytokines and chemokines, and peripheral immune cells with a neutrophile (N) depicted herein penetrating the tight and adherens junctions (TJ/AJs) paracellular spaces to enter the postcapillary venule along with monocytes (M) and lymphocytes (L) into the postcapillary venule PVS of the PVU (panel B) for step one of the two-step process of neuroinflammation. Panel B depicts the postcapillary venule that contains the PVU, which includes both the normal PVS that has the capability to remodel to the pathological EPVS. Note how the proinflammatory leukocytes enter the PVS along with fluids, solutes, and cytokines/chemokines from an activated, disrupted, and leaky NVU in panel A. Note how the pvACef (pseudo-colored blue) and its glia limitans (pseudo-colored brown in the control NVU in panel A to the cyan color with exaggerated thickness for illustrative purposes) in panel B that faces and adheres to the NVU BM extracellular matrix and face the PVS PVU lumen, since this has detached and separated and allowed the creation of a perivascular space that transforms to an EPVS in panel B. Also, note how the glia limitans becomes pseudo-colored red, once the EPVS have developed and then become breeched due to activation of matrix metalloproteinases and degradation of the proteins in the glia limitans, which allow neurotoxins and proinflammatory cells to leak into the interstitial spaces of the neuropil and mix with the ISF and result in neuroinflammation (step two) of the two-step process of neuroinflammation [10]. Note that the dysfunctional pvACef AQP4 water channel is associated with the dysfunctional bidirectional signaling between the neuron (N) and the dysfunctional pvACef AQP4 water channel. Image provided by CC 4.0 graphic abstract [9]. AQP4 = aquaporin 4; Asterisk = tight and adherens junction; BBB = blood-brain barrier; BM = both inner (i) and outer (o) basement membrane; dpvACef = dysfunctional astrocyte endfeet; EC = brain endothelial cell; ecGCx = endothelial glycocalyx; EVPS = enlarged perivascular space; fAQP4 = functional aquaporin 4; GL = glia limitans; H2O = water; L = lymphocyte; M = monocyte; N = neutrophile and neuron; Pc = pericyte; PVS = perivascular space; PVU = perivascular unit; rPVMΦ = resident perivascular macrophage; TJ/AJ = tight and adherens junctions.
Figure 5.
Comparison of the true capillary neurovascular unit (NVU) to the postcapillary venule perivascular unit (PVU). The NVU protoplasmic perivascular astrocyte endfeet (pvACef) (pseudo-colored blue) within the true capillary illustration (panel A) are the connecting and creating cells that allow remodeling of the normal perivascular unit (PVU panel B) perivascular spaces (PVS) to transform and remodel into the pathologic enlarged perivascular space (EPVS, which measure 1-3 millimeter on magnetic resonance imaging). Panel A illustrates the hand-drawn and pseudo-colored control true capillary neurovascular unit (NVU) (representing the transmission electron microscopic (TEM in Figure 1B, Figure 3). Note that when the brain endothelial cells (BECs) become activated and NVU BBB disruption develops, due to BEC activation and dysfunction (BECact/dys) (from multiple causes), there develops an increased permeability of fluids, peripheral cytokines and chemokines, and peripheral immune cells with a neutrophile (N) depicted herein penetrating the tight and adherens junctions (TJ/AJs) paracellular spaces to enter the postcapillary venule along with monocytes (M) and lymphocytes (L) into the postcapillary venule PVS of the PVU (panel B) for step one of the two-step process of neuroinflammation. Panel B depicts the postcapillary venule that contains the PVU, which includes both the normal PVS that has the capability to remodel to the pathological EPVS. Note how the proinflammatory leukocytes enter the PVS along with fluids, solutes, and cytokines/chemokines from an activated, disrupted, and leaky NVU in panel A. Note how the pvACef (pseudo-colored blue) and its glia limitans (pseudo-colored brown in the control NVU in panel A to the cyan color with exaggerated thickness for illustrative purposes) in panel B that faces and adheres to the NVU BM extracellular matrix and face the PVS PVU lumen, since this has detached and separated and allowed the creation of a perivascular space that transforms to an EPVS in panel B. Also, note how the glia limitans becomes pseudo-colored red, once the EPVS have developed and then become breeched due to activation of matrix metalloproteinases and degradation of the proteins in the glia limitans, which allow neurotoxins and proinflammatory cells to leak into the interstitial spaces of the neuropil and mix with the ISF and result in neuroinflammation (step two) of the two-step process of neuroinflammation [10]. Note that the dysfunctional pvACef AQP4 water channel is associated with the dysfunctional bidirectional signaling between the neuron (N) and the dysfunctional pvACef AQP4 water channel. Image provided by CC 4.0 graphic abstract [9]. AQP4 = aquaporin 4; Asterisk = tight and adherens junction; BBB = blood-brain barrier; BM = both inner (i) and outer (o) basement membrane; dpvACef = dysfunctional astrocyte endfeet; EC = brain endothelial cell; ecGCx = endothelial glycocalyx; EVPS = enlarged perivascular space; fAQP4 = functional aquaporin 4; GL = glia limitans; H2O = water; L = lymphocyte; M = monocyte; N = neutrophile and neuron; Pc = pericyte; PVS = perivascular space; PVU = perivascular unit; rPVMΦ = resident perivascular macrophage; TJ/AJ = tight and adherens junctions.
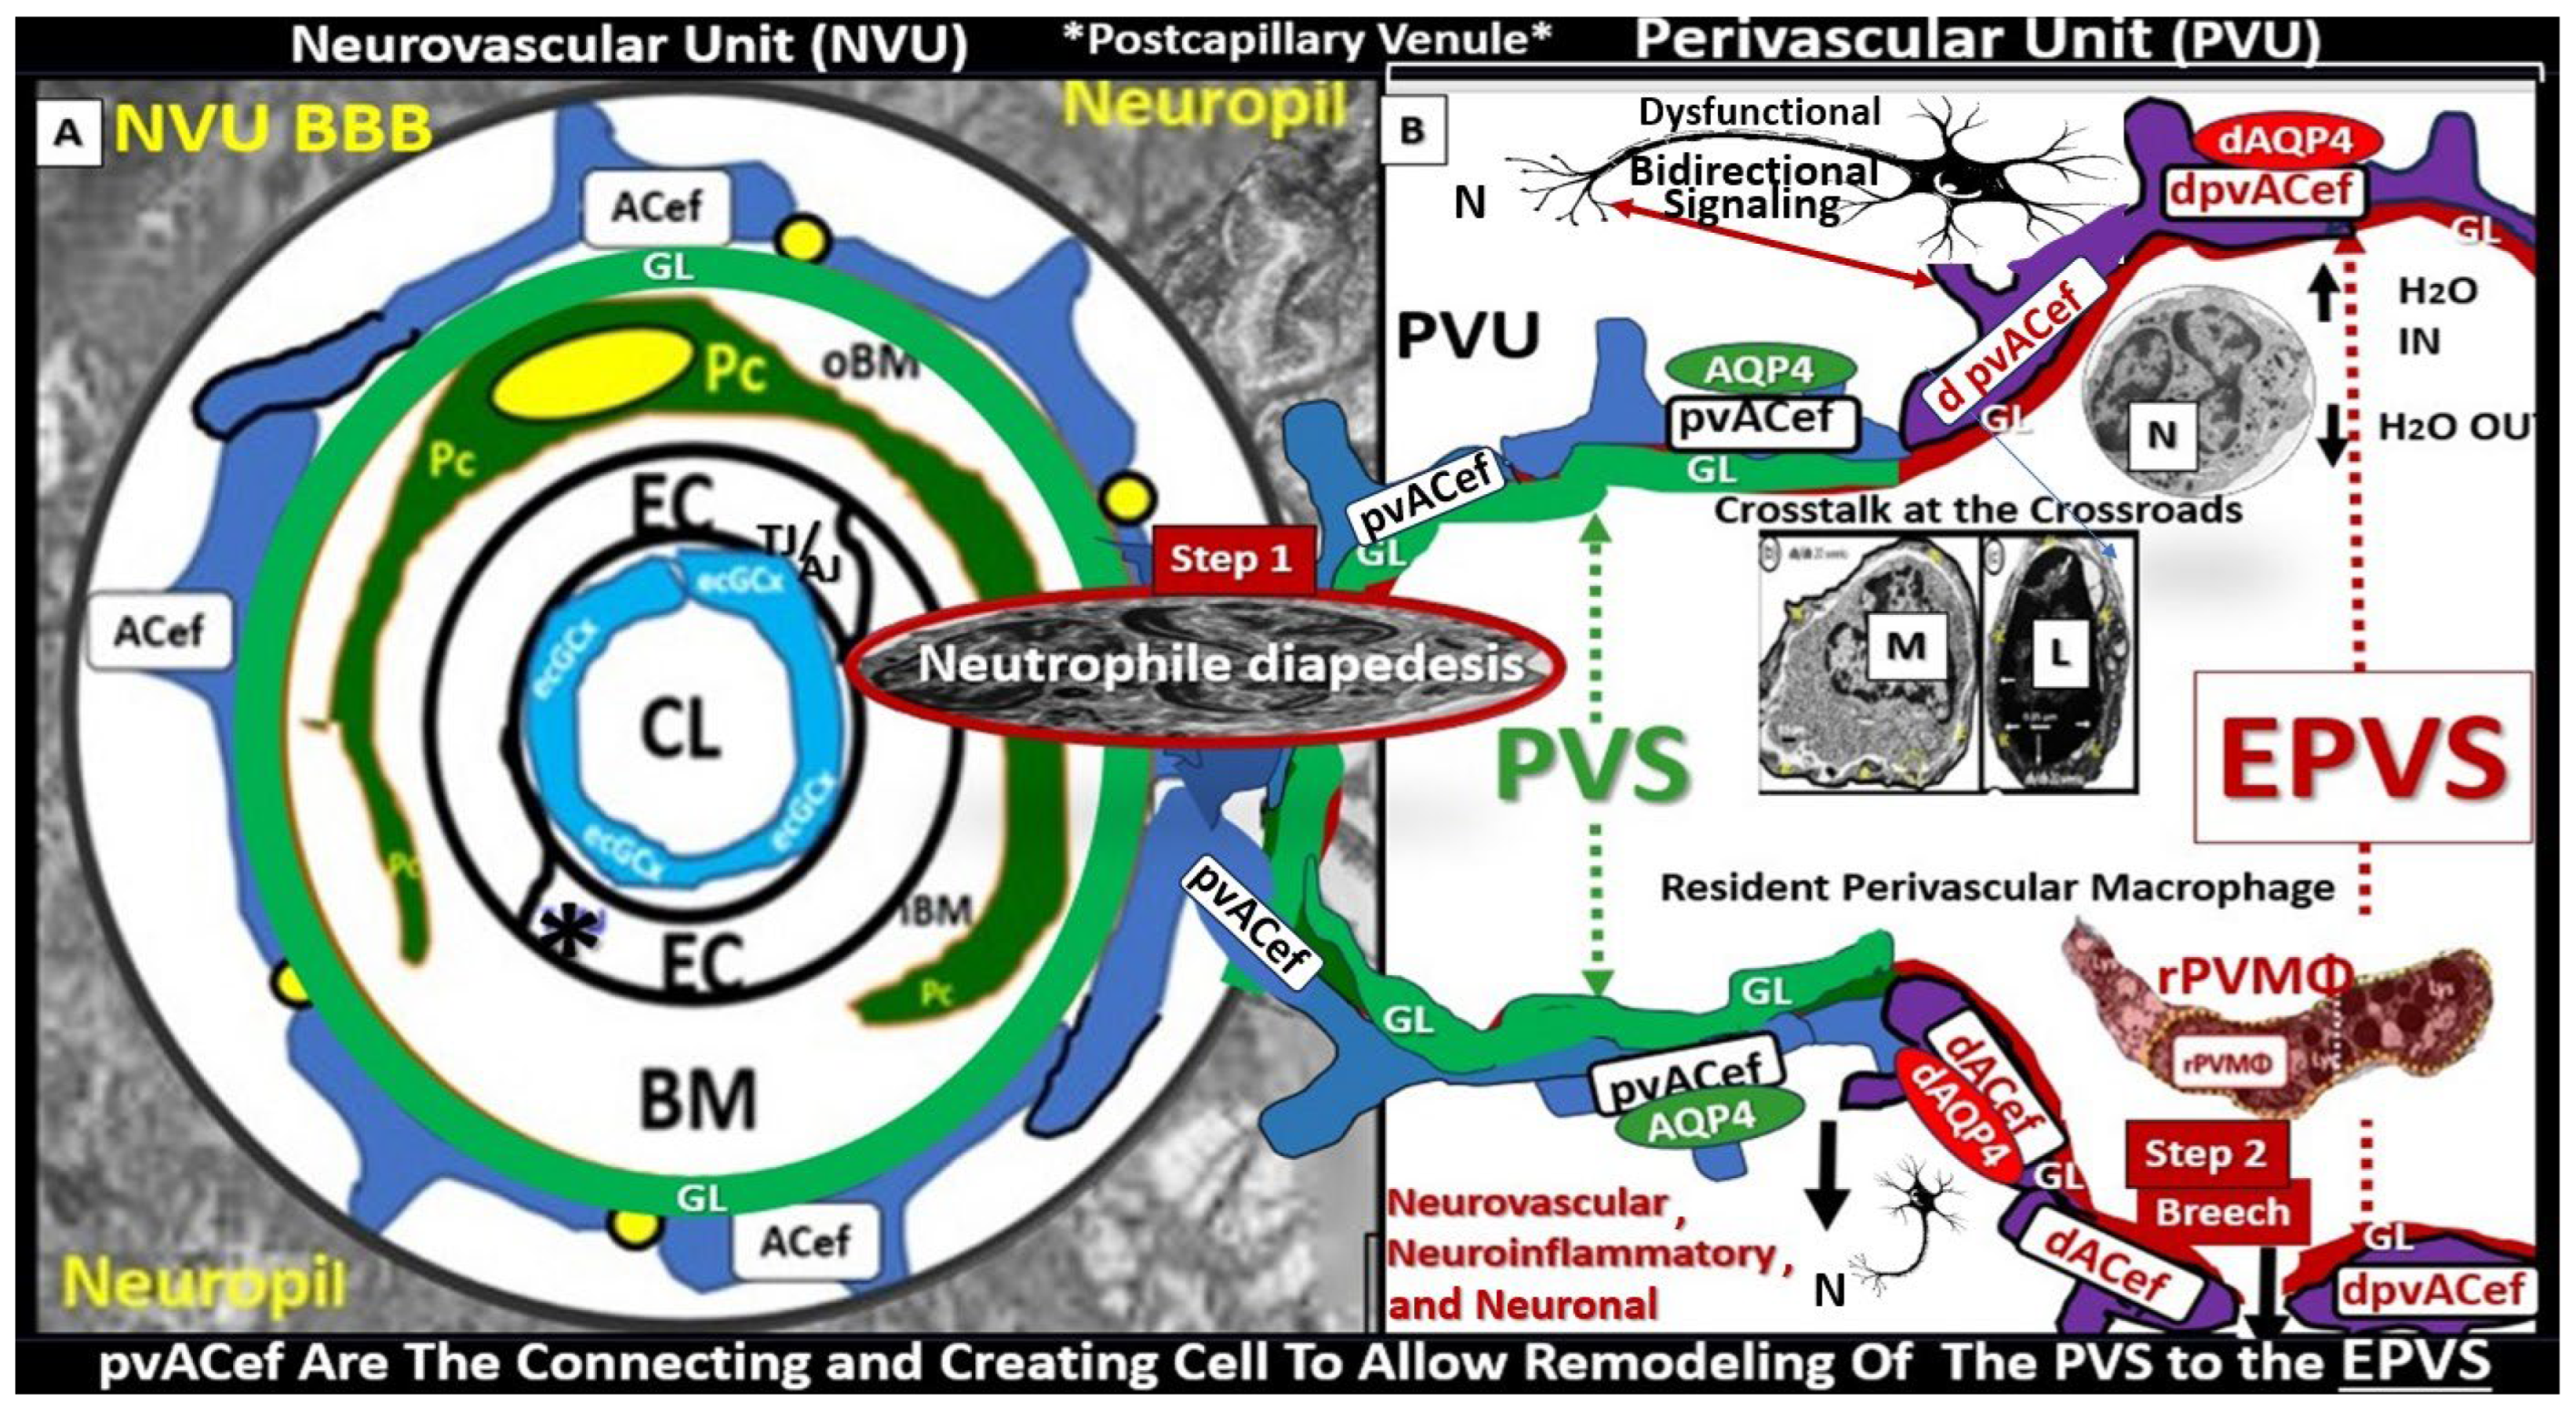
Figure 6.
Illustration of the perivascular unit (PVU) with its normal-benign perivascular spaces (PVS) and pathologic enlarged dilated perivascular spaces (EPVS), which lie immediately adjacent to the neurovascular unit true capillary as it transitions from the precapillary arteriole. The vertical red line divides the PVU into the normal PVS on the left-hand side and the pathologic EPVS on the right-hand side of the red line divider. Note the white dots, which represent the attenuation and clumped discontinuous brain endothelial glycocalyx (ecGCx) of the pathologic EPVS in contrast to the continuous ecGCx in the normal PVS. ACef = astrocyte endfeet/pvACef; ecGCx = brain endothelial cell glycocalyx; nl = normal; Pc = pericyte; pvACef = perivascular astrocyte endfeet; RBC = red blood cell; rPVMΦ = resident perivascular macrophage antigen presenting cell; aBEC = activated brain endothelial cell; ACef = astrocyte endfeet/pvACef; ecGCx = brain endothelial cell glycocalyx; nl = normal; Pc = pericyte; pvACef = perivascular astrocyte endfeet; RBC = red blood cell; rMGC = reactive microglial cell; rPVMΦ = resident perivascular macrophage antigen presenting cell.
Figure 6.
Illustration of the perivascular unit (PVU) with its normal-benign perivascular spaces (PVS) and pathologic enlarged dilated perivascular spaces (EPVS), which lie immediately adjacent to the neurovascular unit true capillary as it transitions from the precapillary arteriole. The vertical red line divides the PVU into the normal PVS on the left-hand side and the pathologic EPVS on the right-hand side of the red line divider. Note the white dots, which represent the attenuation and clumped discontinuous brain endothelial glycocalyx (ecGCx) of the pathologic EPVS in contrast to the continuous ecGCx in the normal PVS. ACef = astrocyte endfeet/pvACef; ecGCx = brain endothelial cell glycocalyx; nl = normal; Pc = pericyte; pvACef = perivascular astrocyte endfeet; RBC = red blood cell; rPVMΦ = resident perivascular macrophage antigen presenting cell; aBEC = activated brain endothelial cell; ACef = astrocyte endfeet/pvACef; ecGCx = brain endothelial cell glycocalyx; nl = normal; Pc = pericyte; pvACef = perivascular astrocyte endfeet; RBC = red blood cell; rMGC = reactive microglial cell; rPVMΦ = resident perivascular macrophage antigen presenting cell.
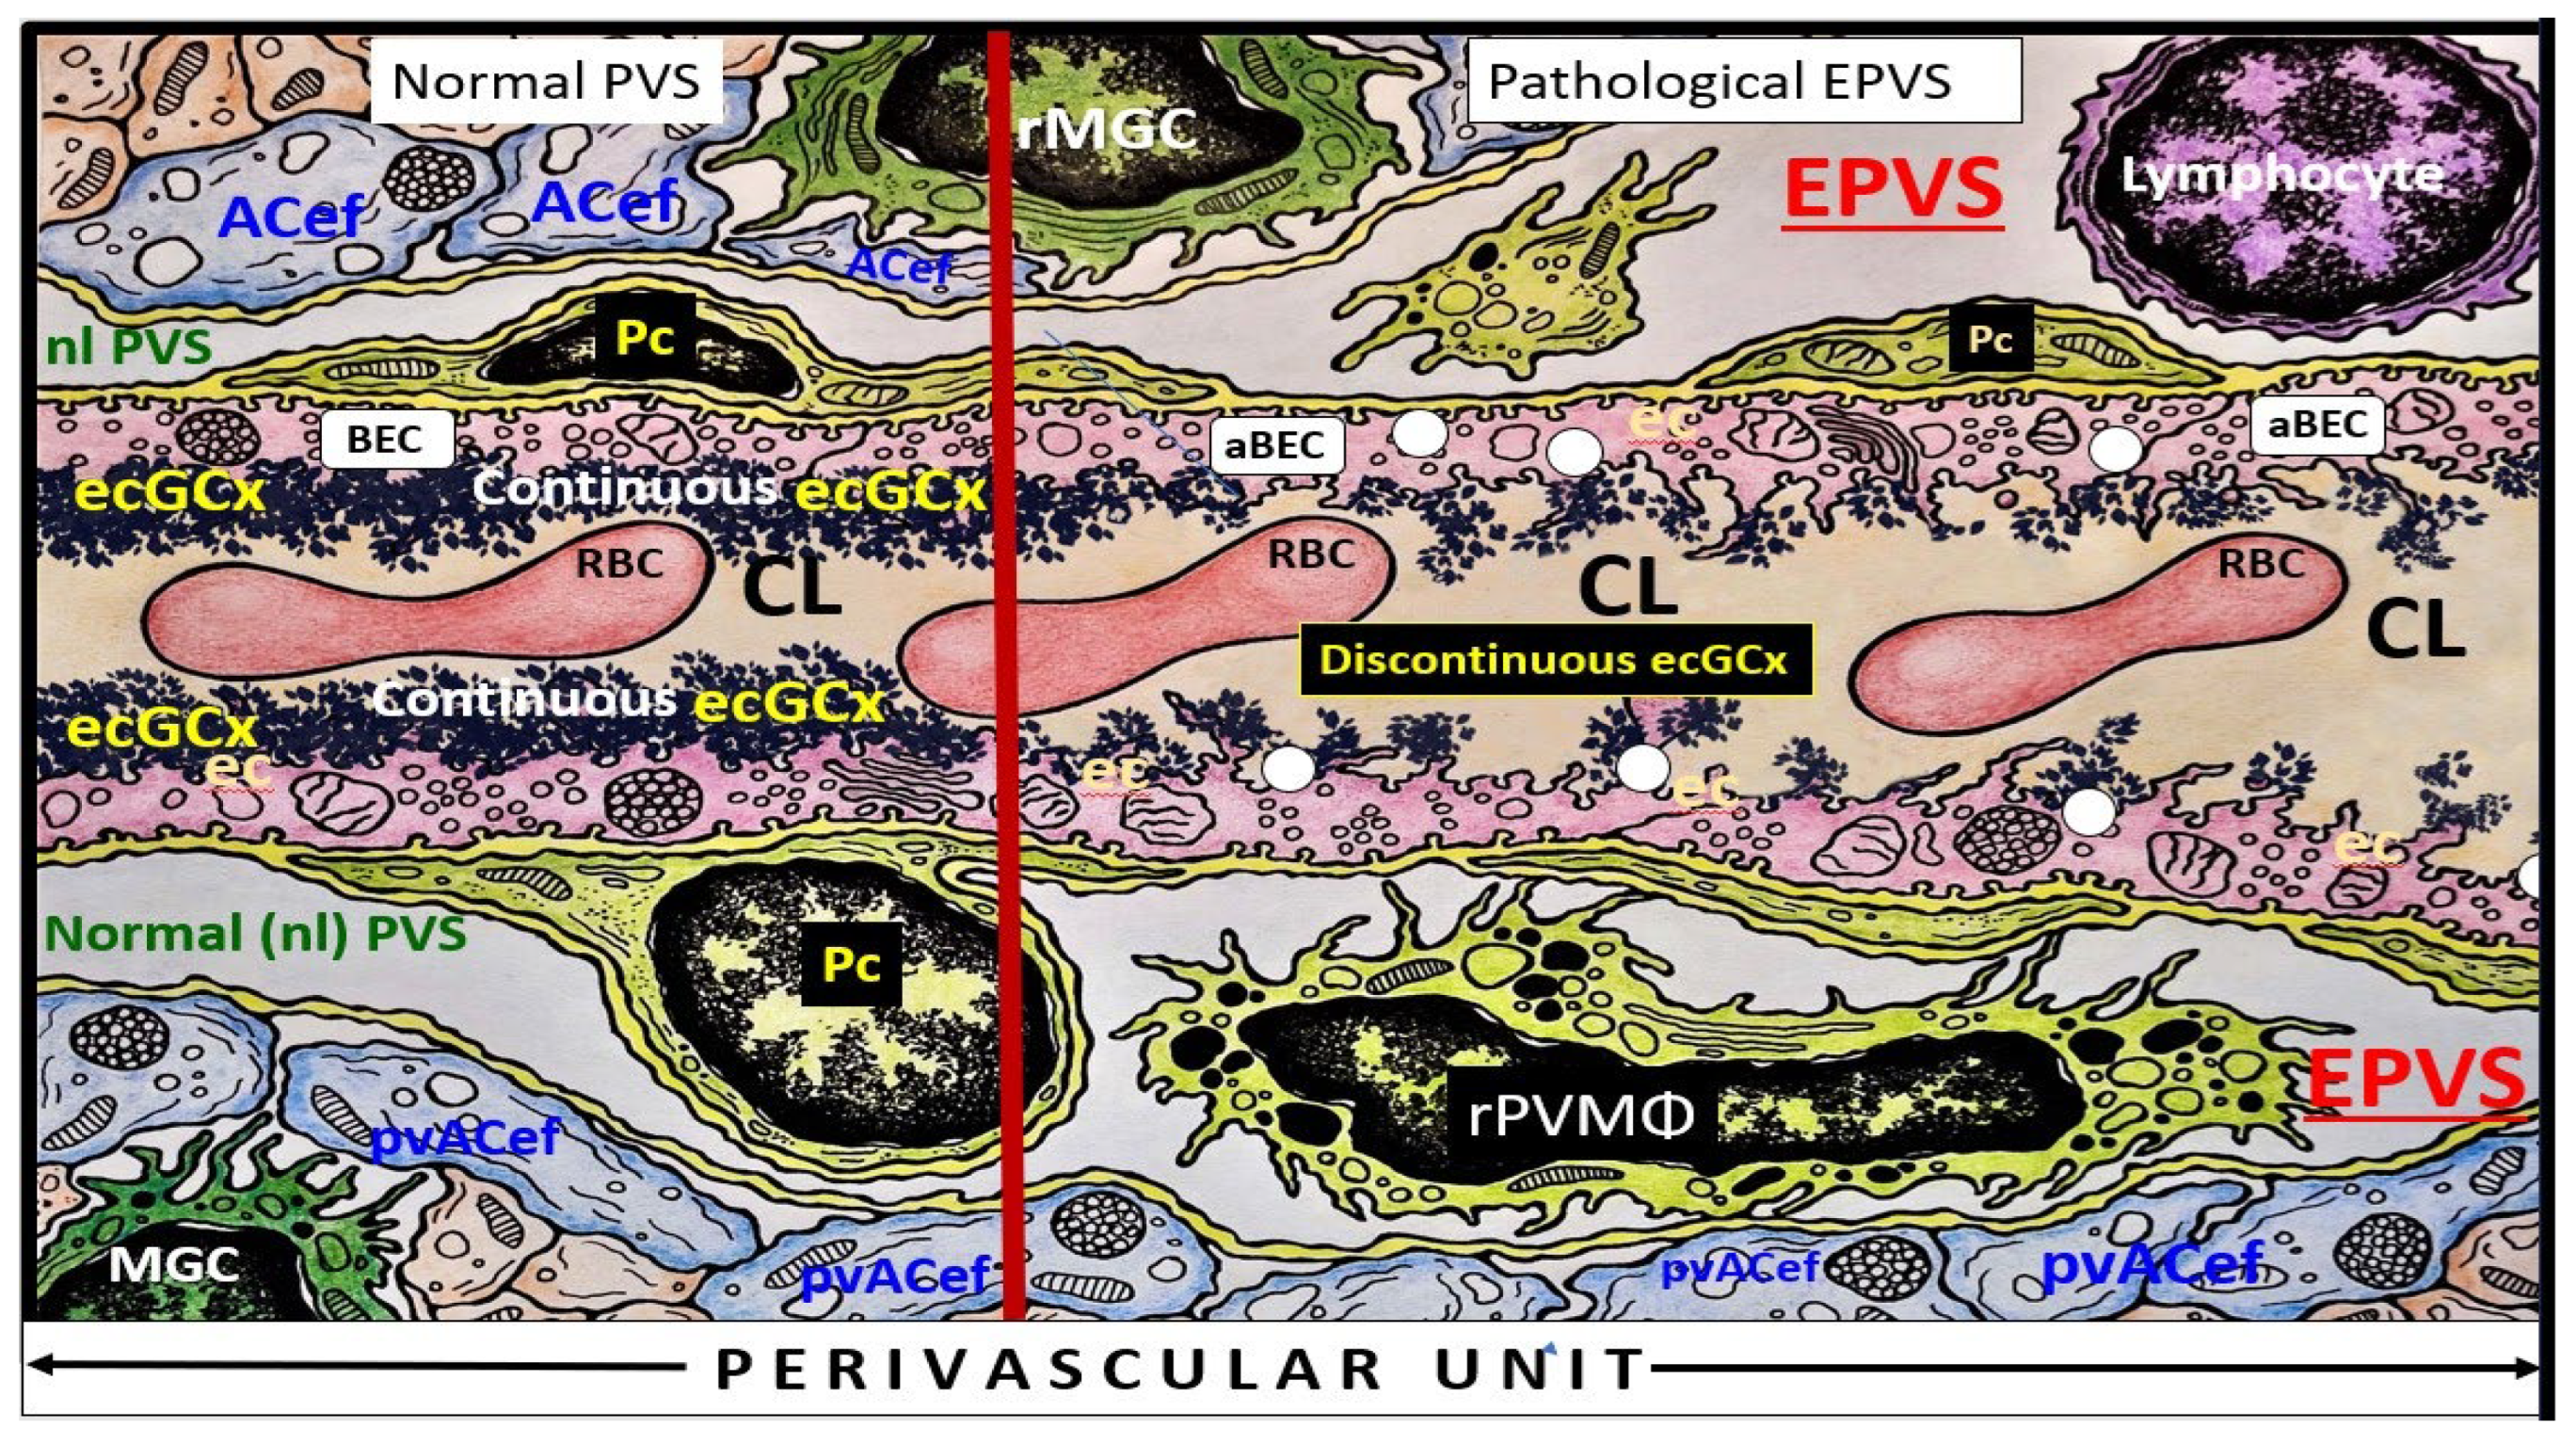
Figure 7.
Obesity, Metabolic syndrome (MetS), type 2 diabetes mellitus (T2DM), cerebral small vessel disease (SVD), perivascular spaces (PVS) and enlarged perivascular spaces (EPVSs). The visceral adipose tissue (VAT), obesity, and hyperlipidemia (atherogenic dyslipidemia) located in the lower left-hand side of the letter X appears to drive the MetS, peripheral insulin resistance (IR), and brain IR (BIR) that is also located central with the other three arms of the letter X, that includes the associated hyperinsulinemia to compensate for IR lower right, hypertension, vascular stiffening upper right, and hyperglycemia upper left, with impaired glucose tolerance (prediabetes) and with or without manifest T2DM. Follow the prominent closed red arrows emanating from VAT to cerebrocardiovascular disease (CCVD), SVD, transient ischemic attacks (TIA), stroke, cerebral microbleeds, and hemorrhages. Brain endothelial cell activation and dysfunction (BECact/dys), with its proinflammatory and prooxidative properties, result in endothelial nitric oxide synthesis (eNOS) uncoupling with increased superoxide (O2•−) and decreased nitric oxide (NO) bioavailability in addition to neurovascular unit uncoupling with increased permeability. Importantly, note that obesity, MetS, T2DM, and decreased bioavailable NO interact to result in capillary rarefaction that may allow EPVS to develop, which are biomarkers for cerebral cSVD. While this review does not lend itself to a full discussion of the important role of gut dysbiosis and lipopolysaccharide (LPS) with extracellular vesicles exosomes of LPS producing metainflammation, it was included in this figure. Figure adapted with permission by CC 4.0 [1,8,9,31]. AGE = advanced glycation end-products; RAGE = receptor for AGE; AGE/RAGE = advanced glycation end-products and its receptor interaction; βcell = pancreatic islet insulin-producing beta cell; cSVD = cerebral small vessel disease; FFA = free fatty acids—unsaturated long chain fatty acids; IGT = impaired glucose tolerance; LOAD = late-onset Alzheimer’s disease; ROS = reactive oxygen species; RSI = reactive species interactome; Sk = skeletal: TG Index = triglyceride/glucose index; TIA = transient ischemia attack.
Figure 7.
Obesity, Metabolic syndrome (MetS), type 2 diabetes mellitus (T2DM), cerebral small vessel disease (SVD), perivascular spaces (PVS) and enlarged perivascular spaces (EPVSs). The visceral adipose tissue (VAT), obesity, and hyperlipidemia (atherogenic dyslipidemia) located in the lower left-hand side of the letter X appears to drive the MetS, peripheral insulin resistance (IR), and brain IR (BIR) that is also located central with the other three arms of the letter X, that includes the associated hyperinsulinemia to compensate for IR lower right, hypertension, vascular stiffening upper right, and hyperglycemia upper left, with impaired glucose tolerance (prediabetes) and with or without manifest T2DM. Follow the prominent closed red arrows emanating from VAT to cerebrocardiovascular disease (CCVD), SVD, transient ischemic attacks (TIA), stroke, cerebral microbleeds, and hemorrhages. Brain endothelial cell activation and dysfunction (BECact/dys), with its proinflammatory and prooxidative properties, result in endothelial nitric oxide synthesis (eNOS) uncoupling with increased superoxide (O2•−) and decreased nitric oxide (NO) bioavailability in addition to neurovascular unit uncoupling with increased permeability. Importantly, note that obesity, MetS, T2DM, and decreased bioavailable NO interact to result in capillary rarefaction that may allow EPVS to develop, which are biomarkers for cerebral cSVD. While this review does not lend itself to a full discussion of the important role of gut dysbiosis and lipopolysaccharide (LPS) with extracellular vesicles exosomes of LPS producing metainflammation, it was included in this figure. Figure adapted with permission by CC 4.0 [1,8,9,31]. AGE = advanced glycation end-products; RAGE = receptor for AGE; AGE/RAGE = advanced glycation end-products and its receptor interaction; βcell = pancreatic islet insulin-producing beta cell; cSVD = cerebral small vessel disease; FFA = free fatty acids—unsaturated long chain fatty acids; IGT = impaired glucose tolerance; LOAD = late-onset Alzheimer’s disease; ROS = reactive oxygen species; RSI = reactive species interactome; Sk = skeletal: TG Index = triglyceride/glucose index; TIA = transient ischemia attack.
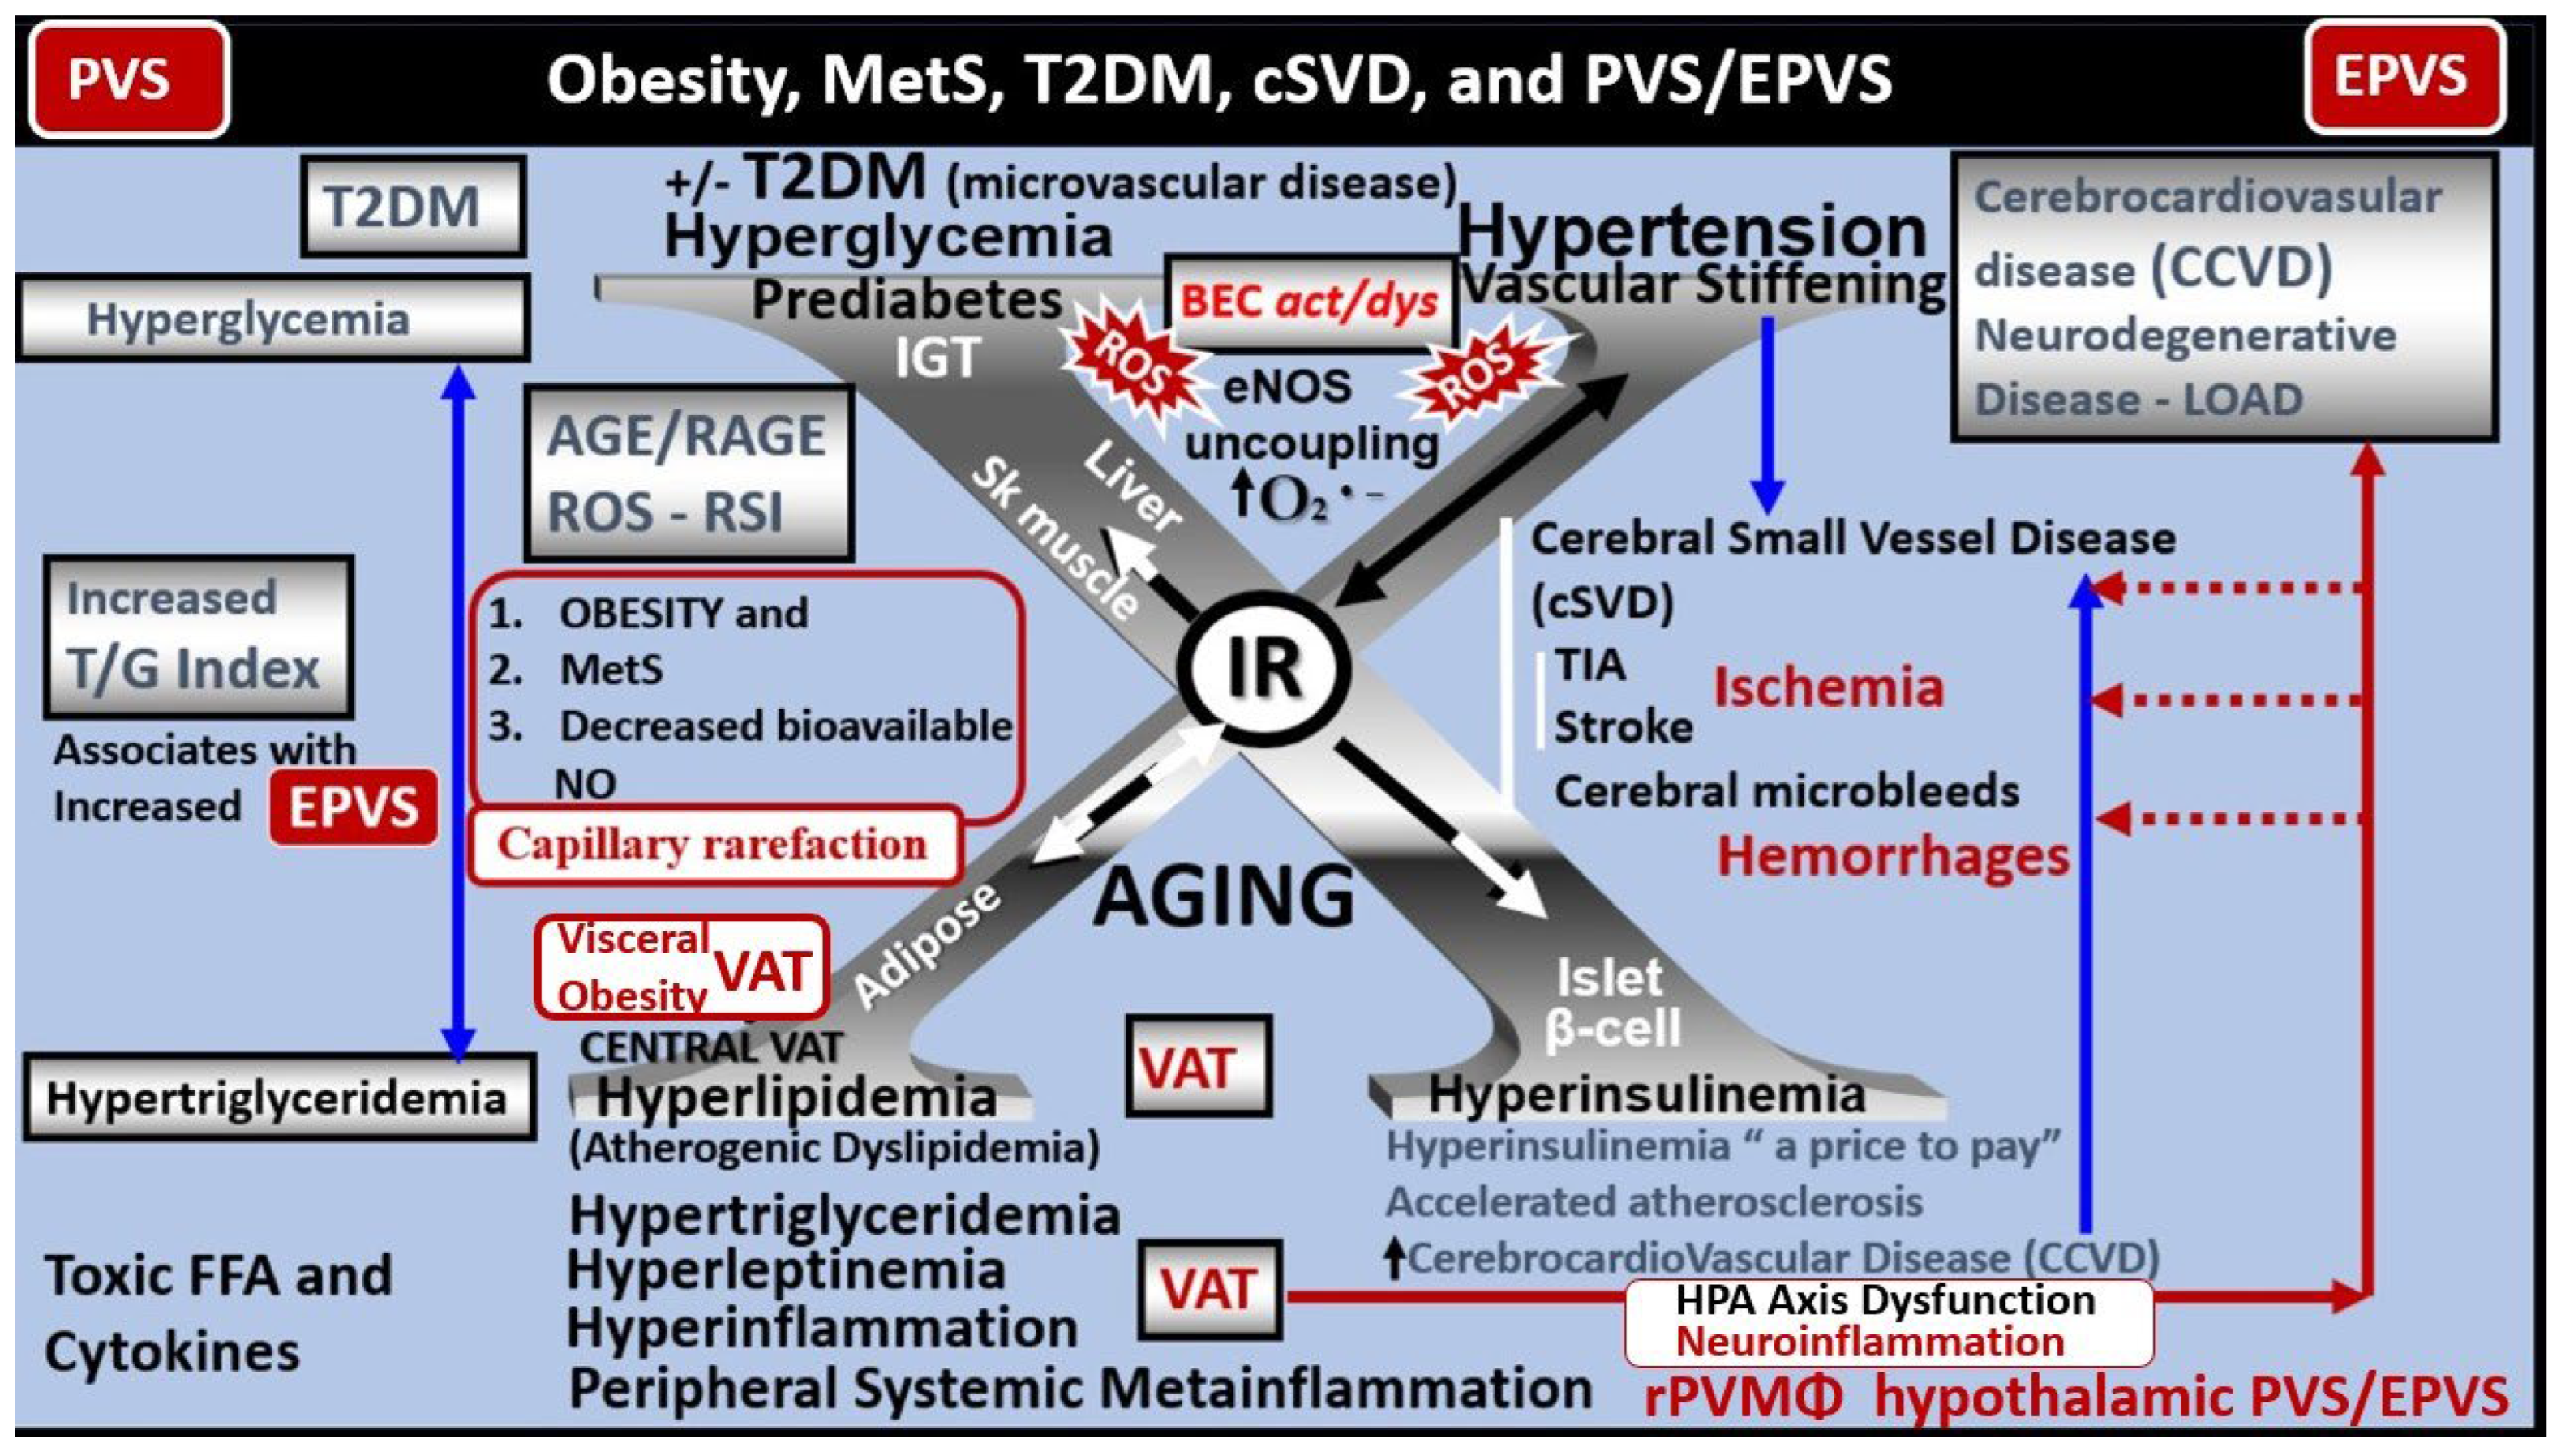
Figure 8.
Six panel image depicting cerebral microbleeds-hemorrhages in preclinical female obese metabolic syndrome, and type 2 diabetes mellitus genetic models. Each of these six panels depict a cerebral microbleed identified by a large white X. Images provided by CC 4.0 [5]. N = nucleus; RBC = red blood cell; X = microbleed.
Figure 8.
Six panel image depicting cerebral microbleeds-hemorrhages in preclinical female obese metabolic syndrome, and type 2 diabetes mellitus genetic models. Each of these six panels depict a cerebral microbleed identified by a large white X. Images provided by CC 4.0 [5]. N = nucleus; RBC = red blood cell; X = microbleed.
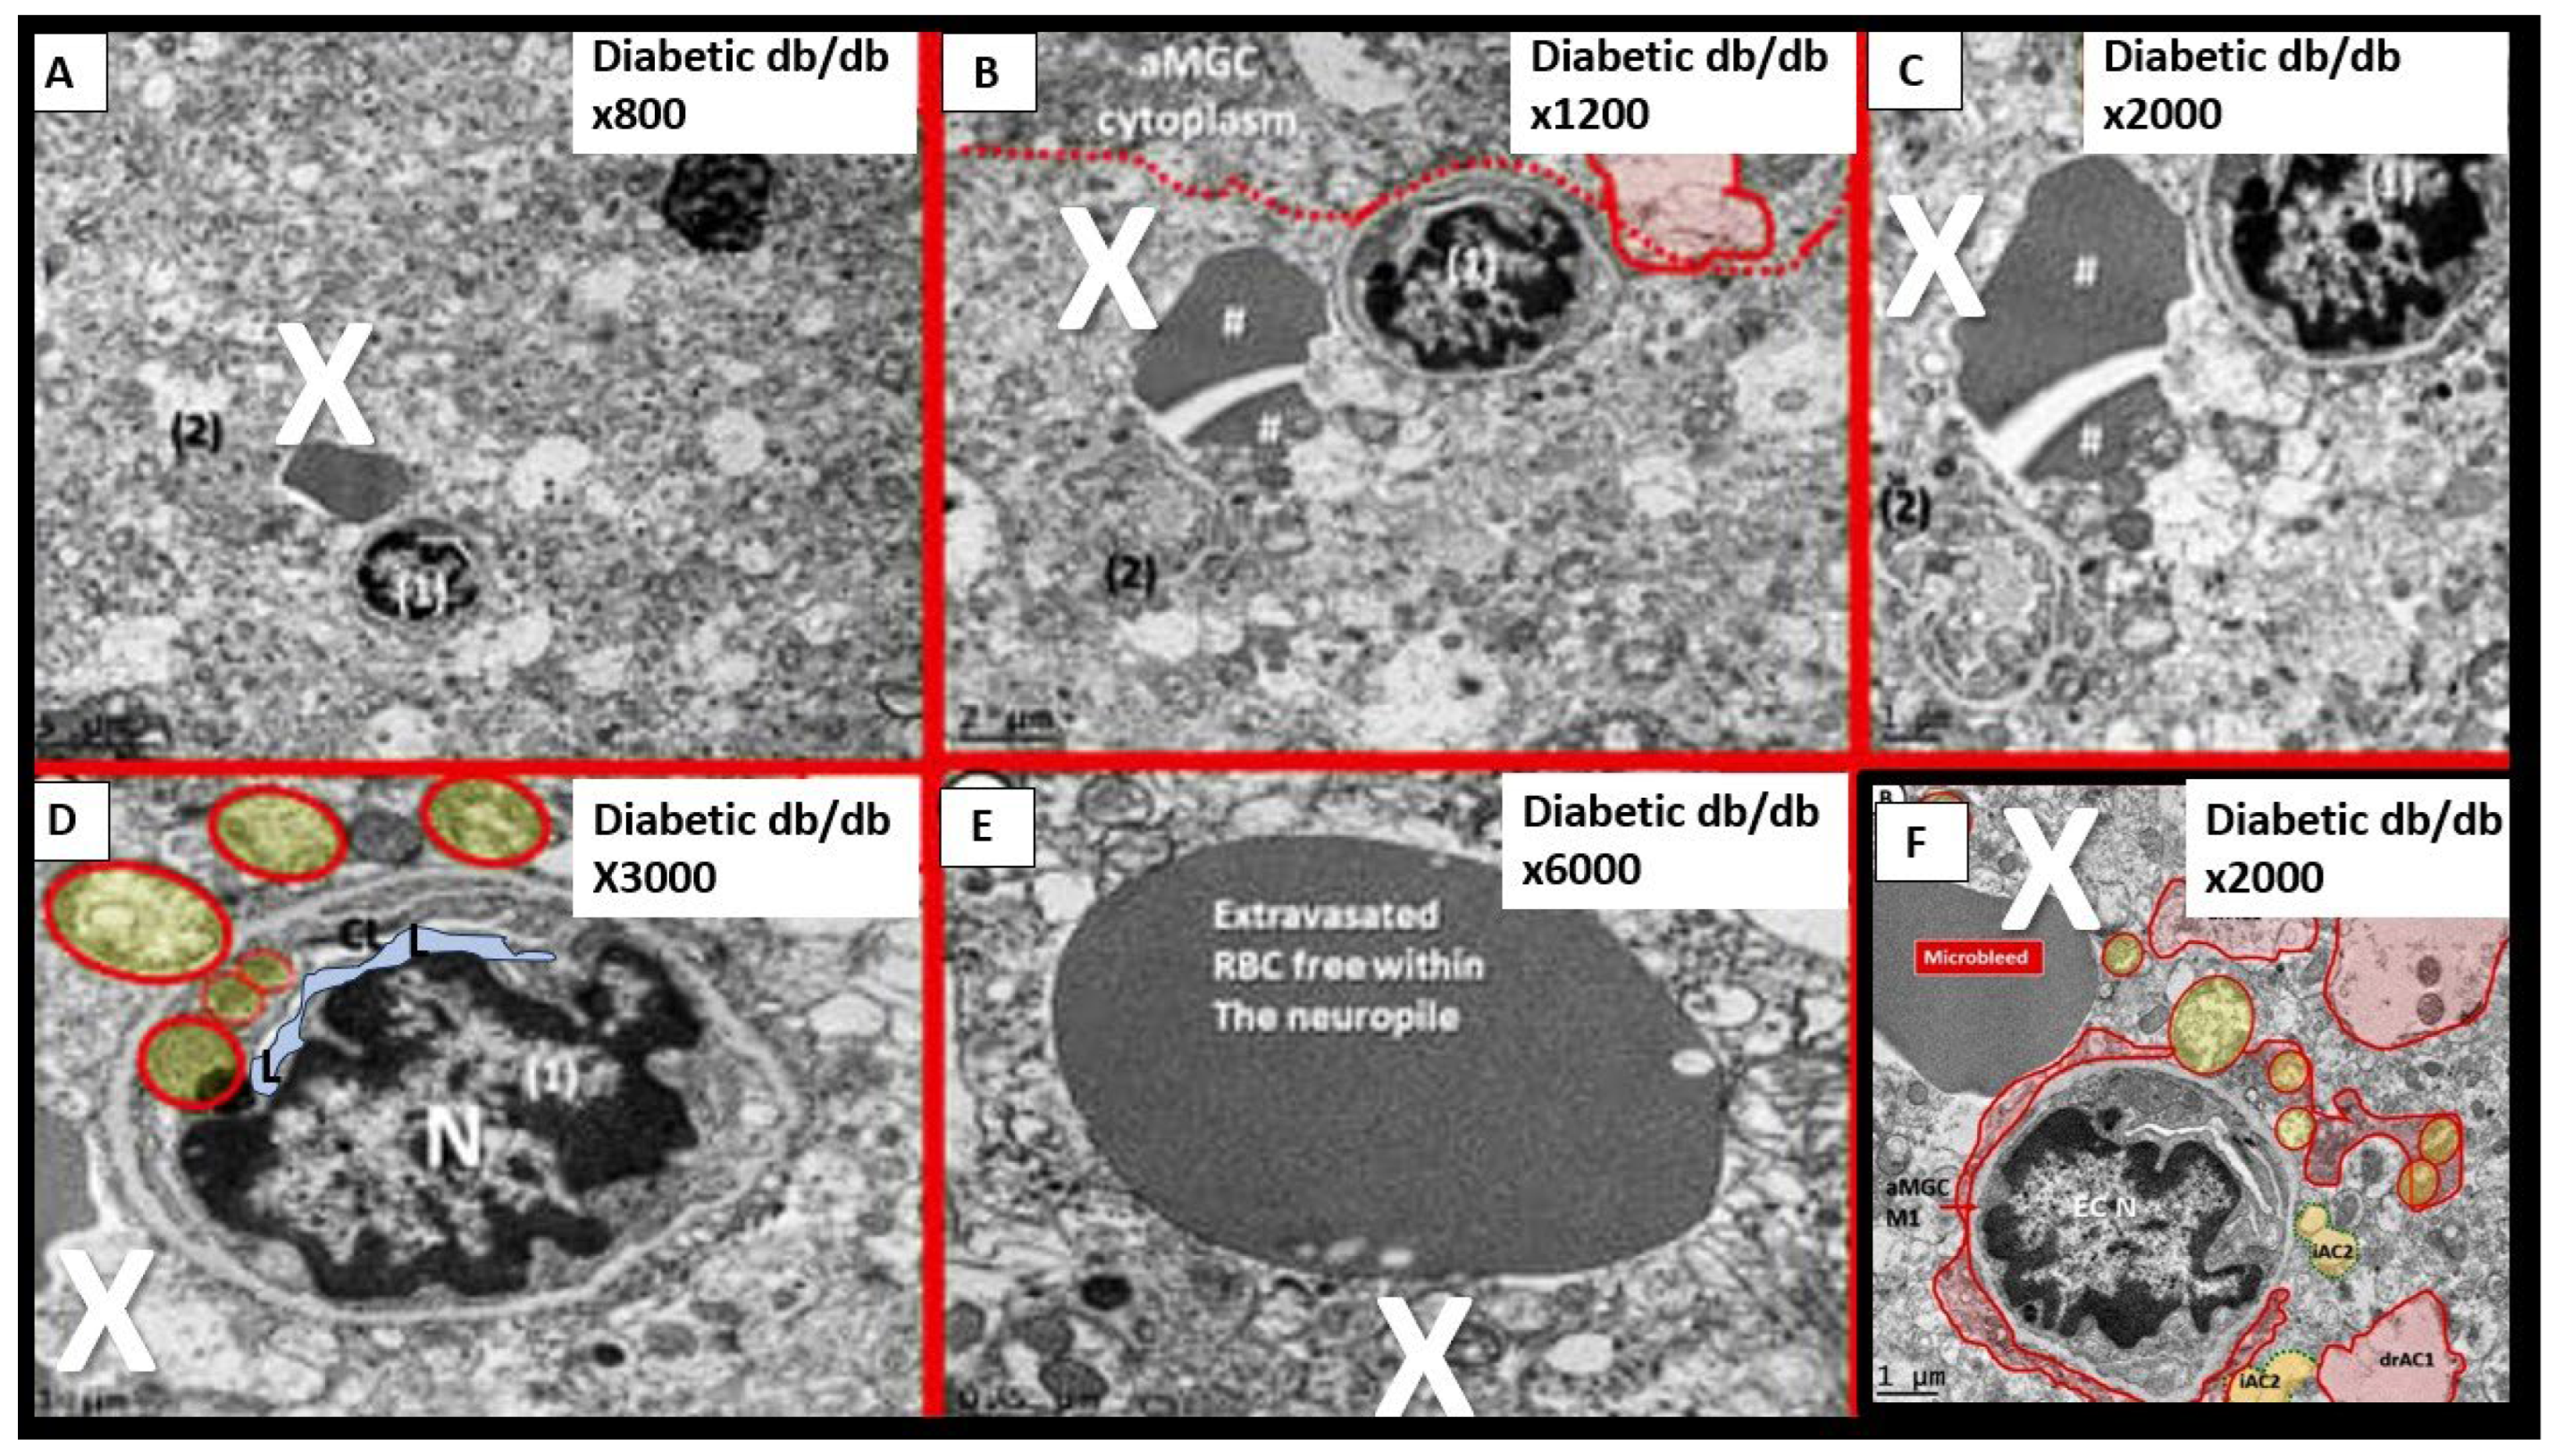
Figure 9.
A microbleed (~5μm) immediately adjacent to a contracted microvessel (~5μm). Note how the lumen of this microvessel (pseudo-colored light blue) is nearly collapsed and that the brain endothelial cell (BEC) nucleus is contracted with extremely prominent chromatin condensation instead of being heterogenous suggesting BEC activation and dysfunction. These similar morphological contracted BEC remodeling changes and nuclear remodeling changes were observed in the aortic endothelium of activated endothelial cells in female Western diet fed mice at 20-weeks of age. Also, note that the reactive microglia (pseudo-colored red) encircle this microvessel that it contains multiple aberrant mitochondria (aMt), which provide excessive mitochondria-derived reactive oxygen species that provide BEC injury for the response to injury wound healing mechanisms at the level of this microvessel to result in BEC activation and dysfunction. Importantly, note reactive astrocyte detachment and separation of reactive perivascular astrocytes. These remodeling changes allow for microvessel disruption and microbleeds. Image provided by CC 4.0 [5]. AC = astrocyte; CMB = cerebral microbleed; EC N = brain endothelial nucleus; iAC = intact attached astrocyte; rMGC = reactive microglia cell; Pc = pericyte; X = microbleed-microhemorrhage.
Figure 9.
A microbleed (~5μm) immediately adjacent to a contracted microvessel (~5μm). Note how the lumen of this microvessel (pseudo-colored light blue) is nearly collapsed and that the brain endothelial cell (BEC) nucleus is contracted with extremely prominent chromatin condensation instead of being heterogenous suggesting BEC activation and dysfunction. These similar morphological contracted BEC remodeling changes and nuclear remodeling changes were observed in the aortic endothelium of activated endothelial cells in female Western diet fed mice at 20-weeks of age. Also, note that the reactive microglia (pseudo-colored red) encircle this microvessel that it contains multiple aberrant mitochondria (aMt), which provide excessive mitochondria-derived reactive oxygen species that provide BEC injury for the response to injury wound healing mechanisms at the level of this microvessel to result in BEC activation and dysfunction. Importantly, note reactive astrocyte detachment and separation of reactive perivascular astrocytes. These remodeling changes allow for microvessel disruption and microbleeds. Image provided by CC 4.0 [5]. AC = astrocyte; CMB = cerebral microbleed; EC N = brain endothelial nucleus; iAC = intact attached astrocyte; rMGC = reactive microglia cell; Pc = pericyte; X = microbleed-microhemorrhage.
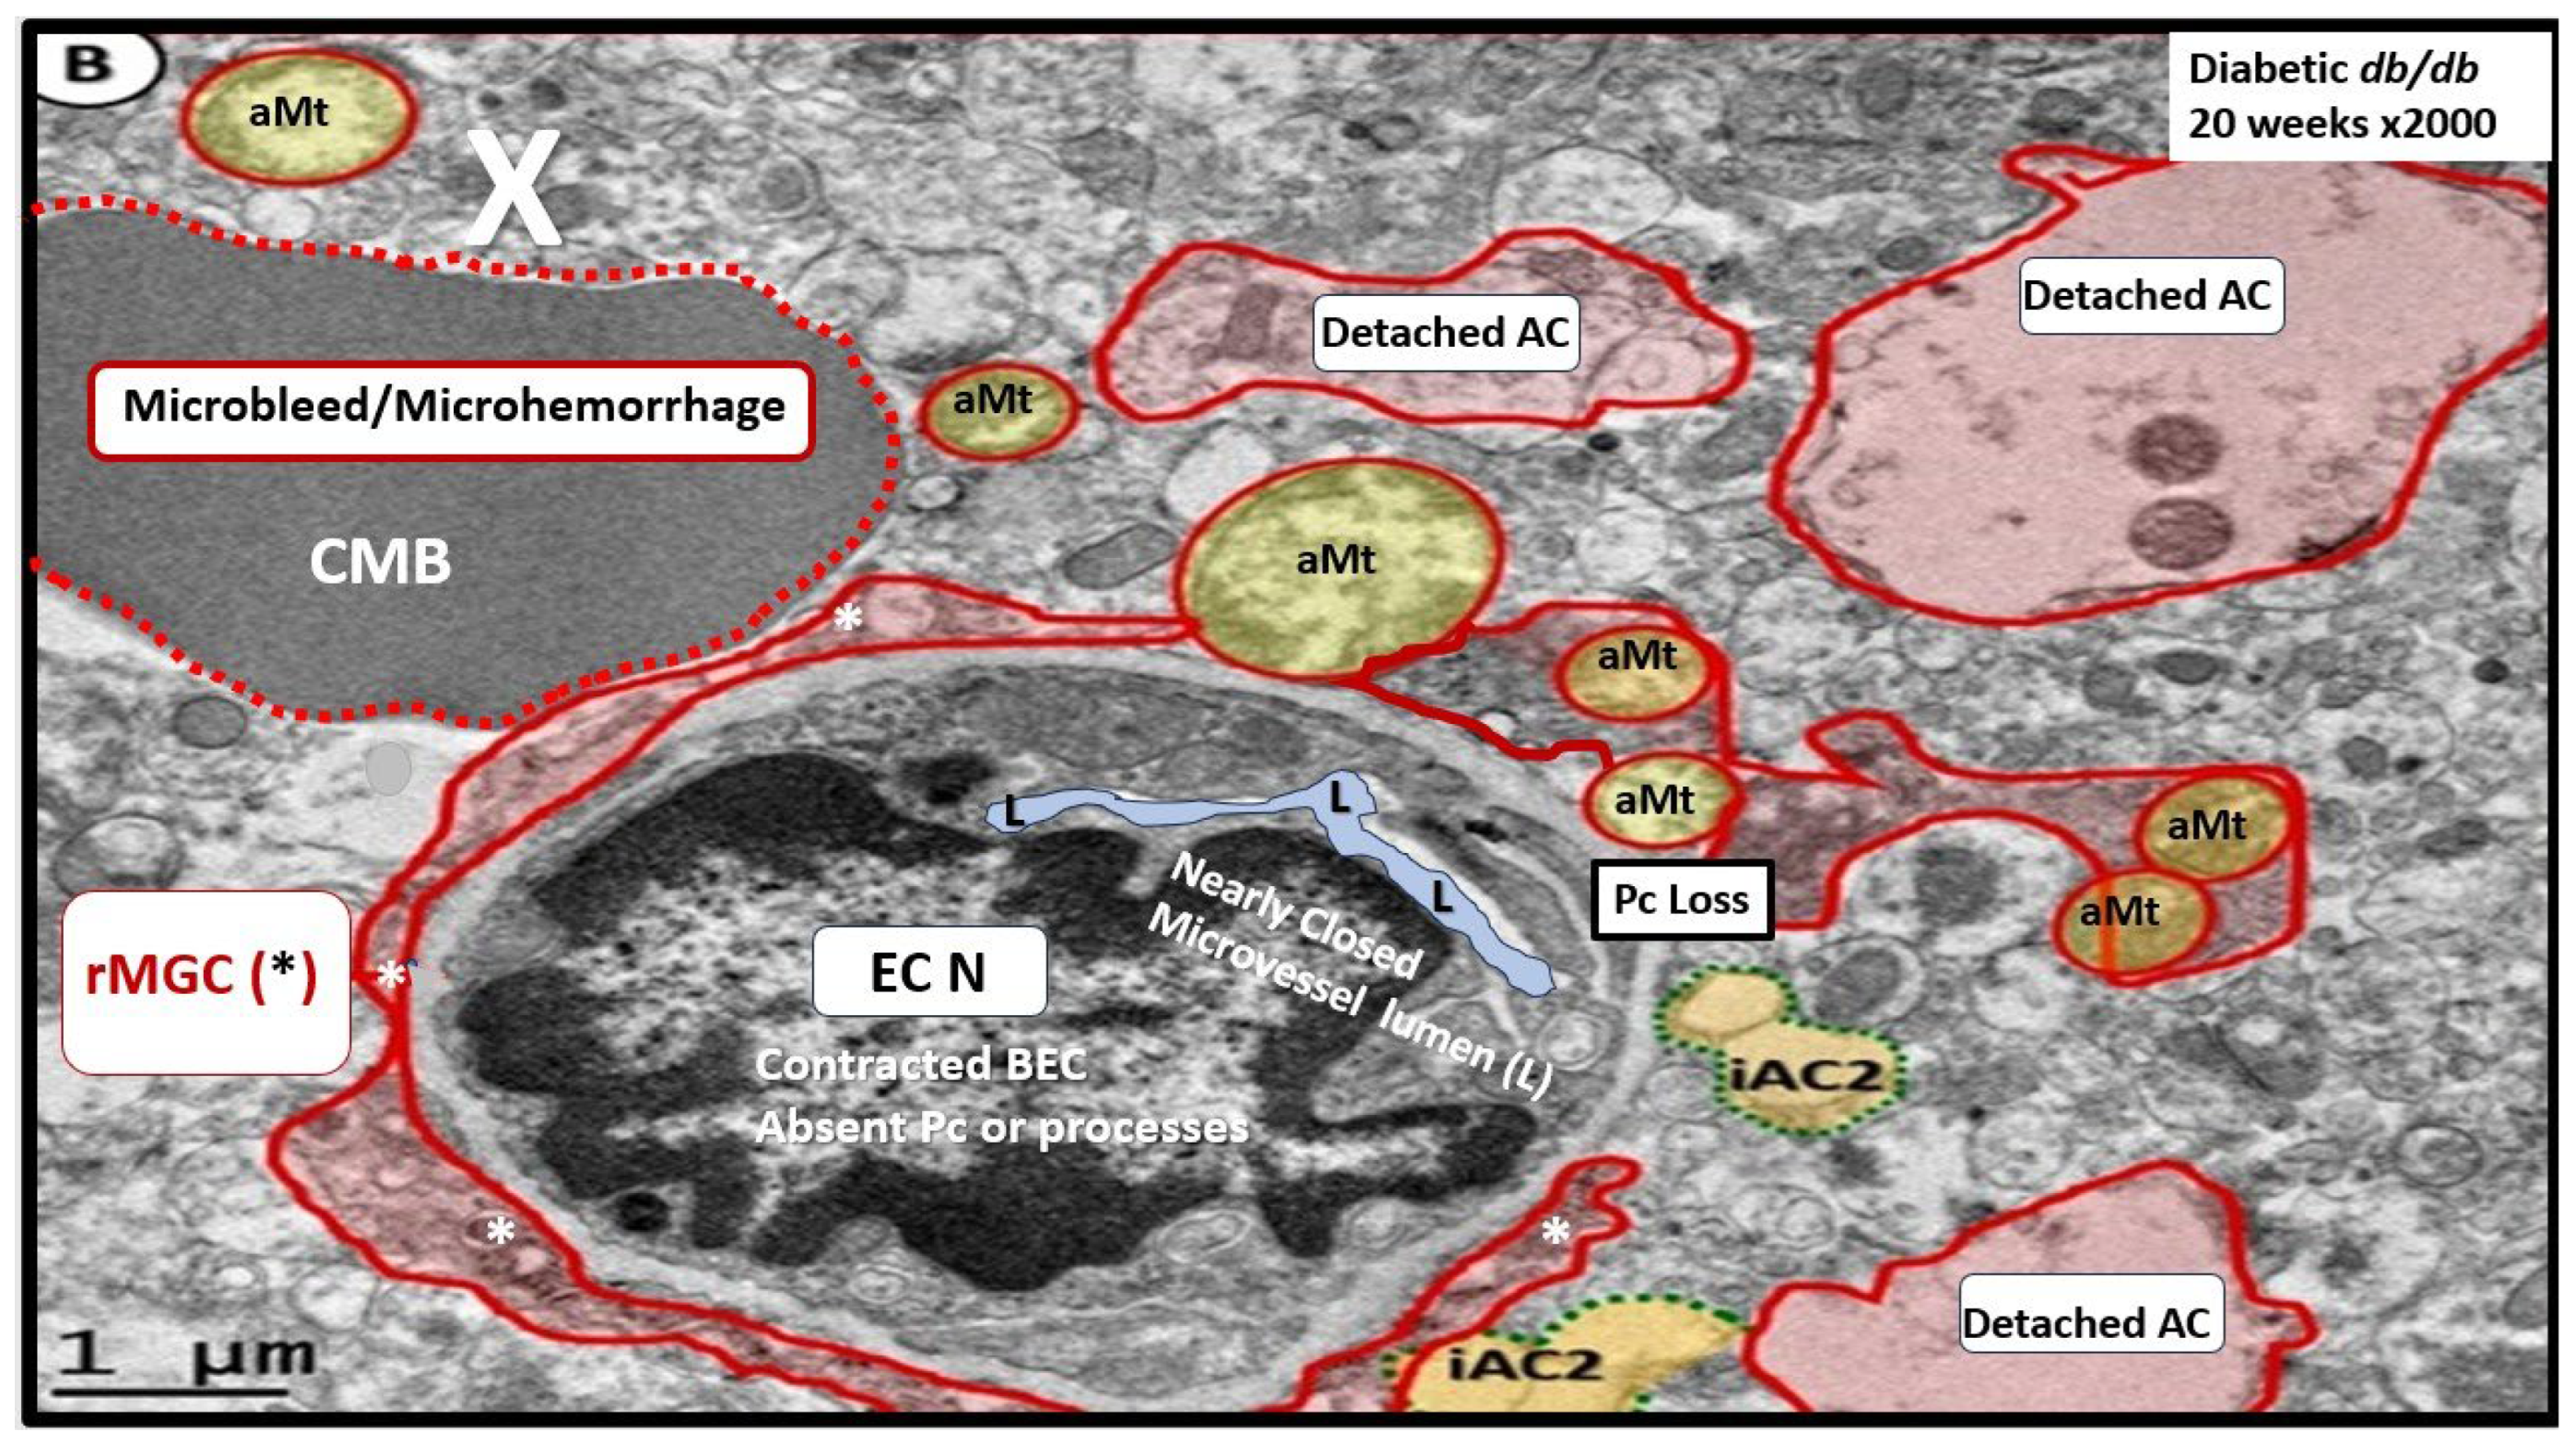
Figure 10.
Microvessel rarefaction: Cross and longitudinal sections representative of pre- and postcapillary arterioles and venules with an ensheathing perivascular space (PVS) of the perivascular unit (PVU). Cross and longitudinal sections representative of pre- and postcapillary arterioles and venules with an ensheathing perivascular space (PVS). Panel A depicts a cross-section of a capillary microvessel surrounded by PVS (solid double red arrows and light blue color) and its increase in total volume to become an enlarged perivascular space (EPVS) (dashed double red arrows), which represents capillary rarefaction. Note the AQP4 red bars that associate with the perivascular astrocyte endfeet. Panel B demonstrates a control longitudinal precapillary arteriole, postcapillary venule, and a neurovascular unit (NVU) capillary that runs through an encompassing PVS (light blue). Panel C depicts capillary microvascular rarefaction (CR) in a longitudinal view, and note how the volume of the PVS increases its total percentage volume once the capillary has undergone rarefaction as in obesity, metabolic syndrome, and type 2 diabetes mellitus. Panel D depicts the progression of a normal precapillary arteriole and postcapillary venule PVS to an EPVS once the capillary has undergone rarefaction, allowing for an increase in its total percentage volume of the PVS (1.–3.). Panels B, C provided with permission by CC 4.0 [9]. ACef = perivascular astrocyte endfeet; AQP4 = aquaporin 4 (red bars); BEC = brain endothelial cells; BECact/dys = brain endothelial cell activation and dysfunction; CL =capillary lumen; EC = endothelial cell; lpsEVexos = lipopolysaccharide extracellular vesicle exosomes; NVU = neurovascular unit; Pcef = pericyte endfeet.
Figure 10.
Microvessel rarefaction: Cross and longitudinal sections representative of pre- and postcapillary arterioles and venules with an ensheathing perivascular space (PVS) of the perivascular unit (PVU). Cross and longitudinal sections representative of pre- and postcapillary arterioles and venules with an ensheathing perivascular space (PVS). Panel A depicts a cross-section of a capillary microvessel surrounded by PVS (solid double red arrows and light blue color) and its increase in total volume to become an enlarged perivascular space (EPVS) (dashed double red arrows), which represents capillary rarefaction. Note the AQP4 red bars that associate with the perivascular astrocyte endfeet. Panel B demonstrates a control longitudinal precapillary arteriole, postcapillary venule, and a neurovascular unit (NVU) capillary that runs through an encompassing PVS (light blue). Panel C depicts capillary microvascular rarefaction (CR) in a longitudinal view, and note how the volume of the PVS increases its total percentage volume once the capillary has undergone rarefaction as in obesity, metabolic syndrome, and type 2 diabetes mellitus. Panel D depicts the progression of a normal precapillary arteriole and postcapillary venule PVS to an EPVS once the capillary has undergone rarefaction, allowing for an increase in its total percentage volume of the PVS (1.–3.). Panels B, C provided with permission by CC 4.0 [9]. ACef = perivascular astrocyte endfeet; AQP4 = aquaporin 4 (red bars); BEC = brain endothelial cells; BECact/dys = brain endothelial cell activation and dysfunction; CL =capillary lumen; EC = endothelial cell; lpsEVexos = lipopolysaccharide extracellular vesicle exosomes; NVU = neurovascular unit; Pcef = pericyte endfeet.
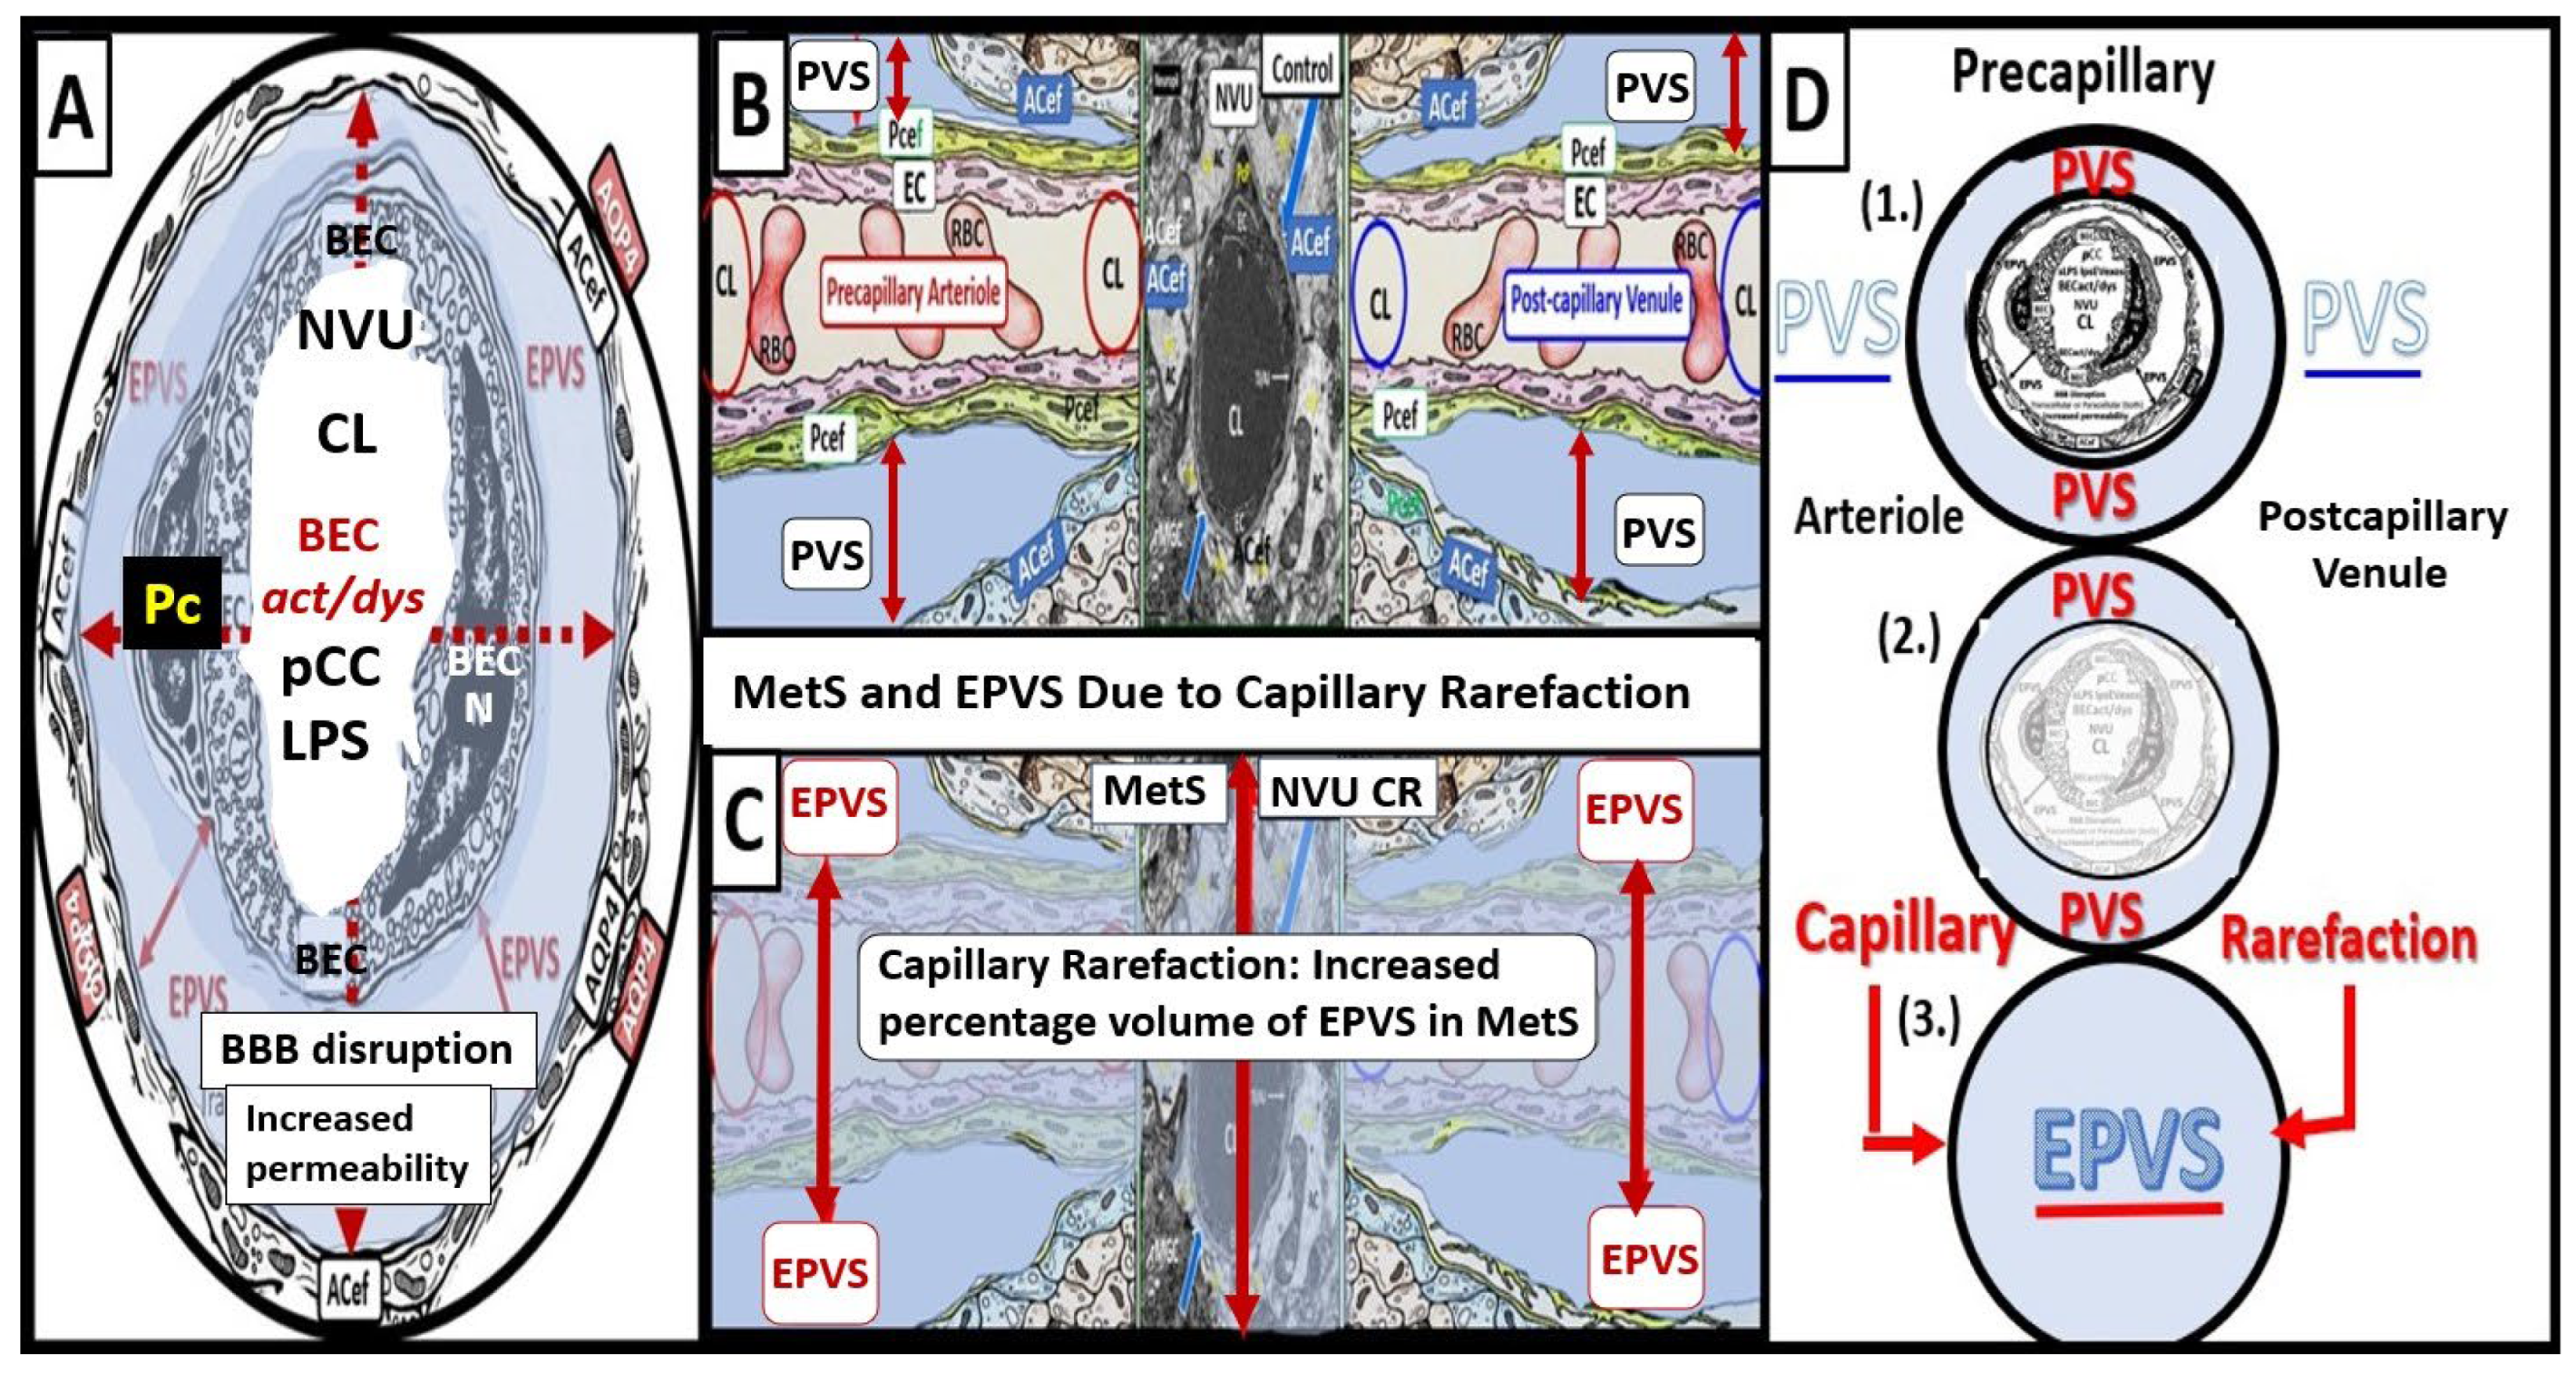
Figure 11.
Combining Zlokovic’s 2-hit hypothesis with the neurovascular unit (NVU), perivascular unit (PVU), and the development of enlarged perivascular spaces (EPVS). Panel A illustrates the NVU true capillary and the PVU with its normal perivascular spaces (PVS) and pathologic EPVS. When the true capillary NVU becomes disrupted it allows neurotoxins including proinflammatory cytokines/chemokines and proinflammatory cells into the perivascular units PVS. Also, note that panel A depicts step-1 of Owens 2-step process of neuroinflammation as well as the 1st hit of Zlokovic’s 2-hit vascular hypothesis [10,47]. Panel B depicts the PVU with its divisions into the normal PVS and the pathologic EPVS divided by the vertical red line and note the discontinuous endothelial glycocalyx and the presence of the resident perivascular macrophage (rPVMΦ). Panel C also depicts the PVU; however, its EPVS specifically depicts the breeching of the glia limitans (cyan green) representing step -2 of neuroinflammation [10] as well as the impaired clearance of amyloid beta and accumulation (hit-2) of Zlokovic’s 2hit-hypothesis [47]. Note that the red circles depict various neurotoxin groups that are divided into three groups (1., 2., 3.) that contribute to neuroinflammation, neurodegeneration, and impaired cognition.
Figure 11.
Combining Zlokovic’s 2-hit hypothesis with the neurovascular unit (NVU), perivascular unit (PVU), and the development of enlarged perivascular spaces (EPVS). Panel A illustrates the NVU true capillary and the PVU with its normal perivascular spaces (PVS) and pathologic EPVS. When the true capillary NVU becomes disrupted it allows neurotoxins including proinflammatory cytokines/chemokines and proinflammatory cells into the perivascular units PVS. Also, note that panel A depicts step-1 of Owens 2-step process of neuroinflammation as well as the 1st hit of Zlokovic’s 2-hit vascular hypothesis [10,47]. Panel B depicts the PVU with its divisions into the normal PVS and the pathologic EPVS divided by the vertical red line and note the discontinuous endothelial glycocalyx and the presence of the resident perivascular macrophage (rPVMΦ). Panel C also depicts the PVU; however, its EPVS specifically depicts the breeching of the glia limitans (cyan green) representing step -2 of neuroinflammation [10] as well as the impaired clearance of amyloid beta and accumulation (hit-2) of Zlokovic’s 2hit-hypothesis [47]. Note that the red circles depict various neurotoxin groups that are divided into three groups (1., 2., 3.) that contribute to neuroinflammation, neurodegeneration, and impaired cognition.
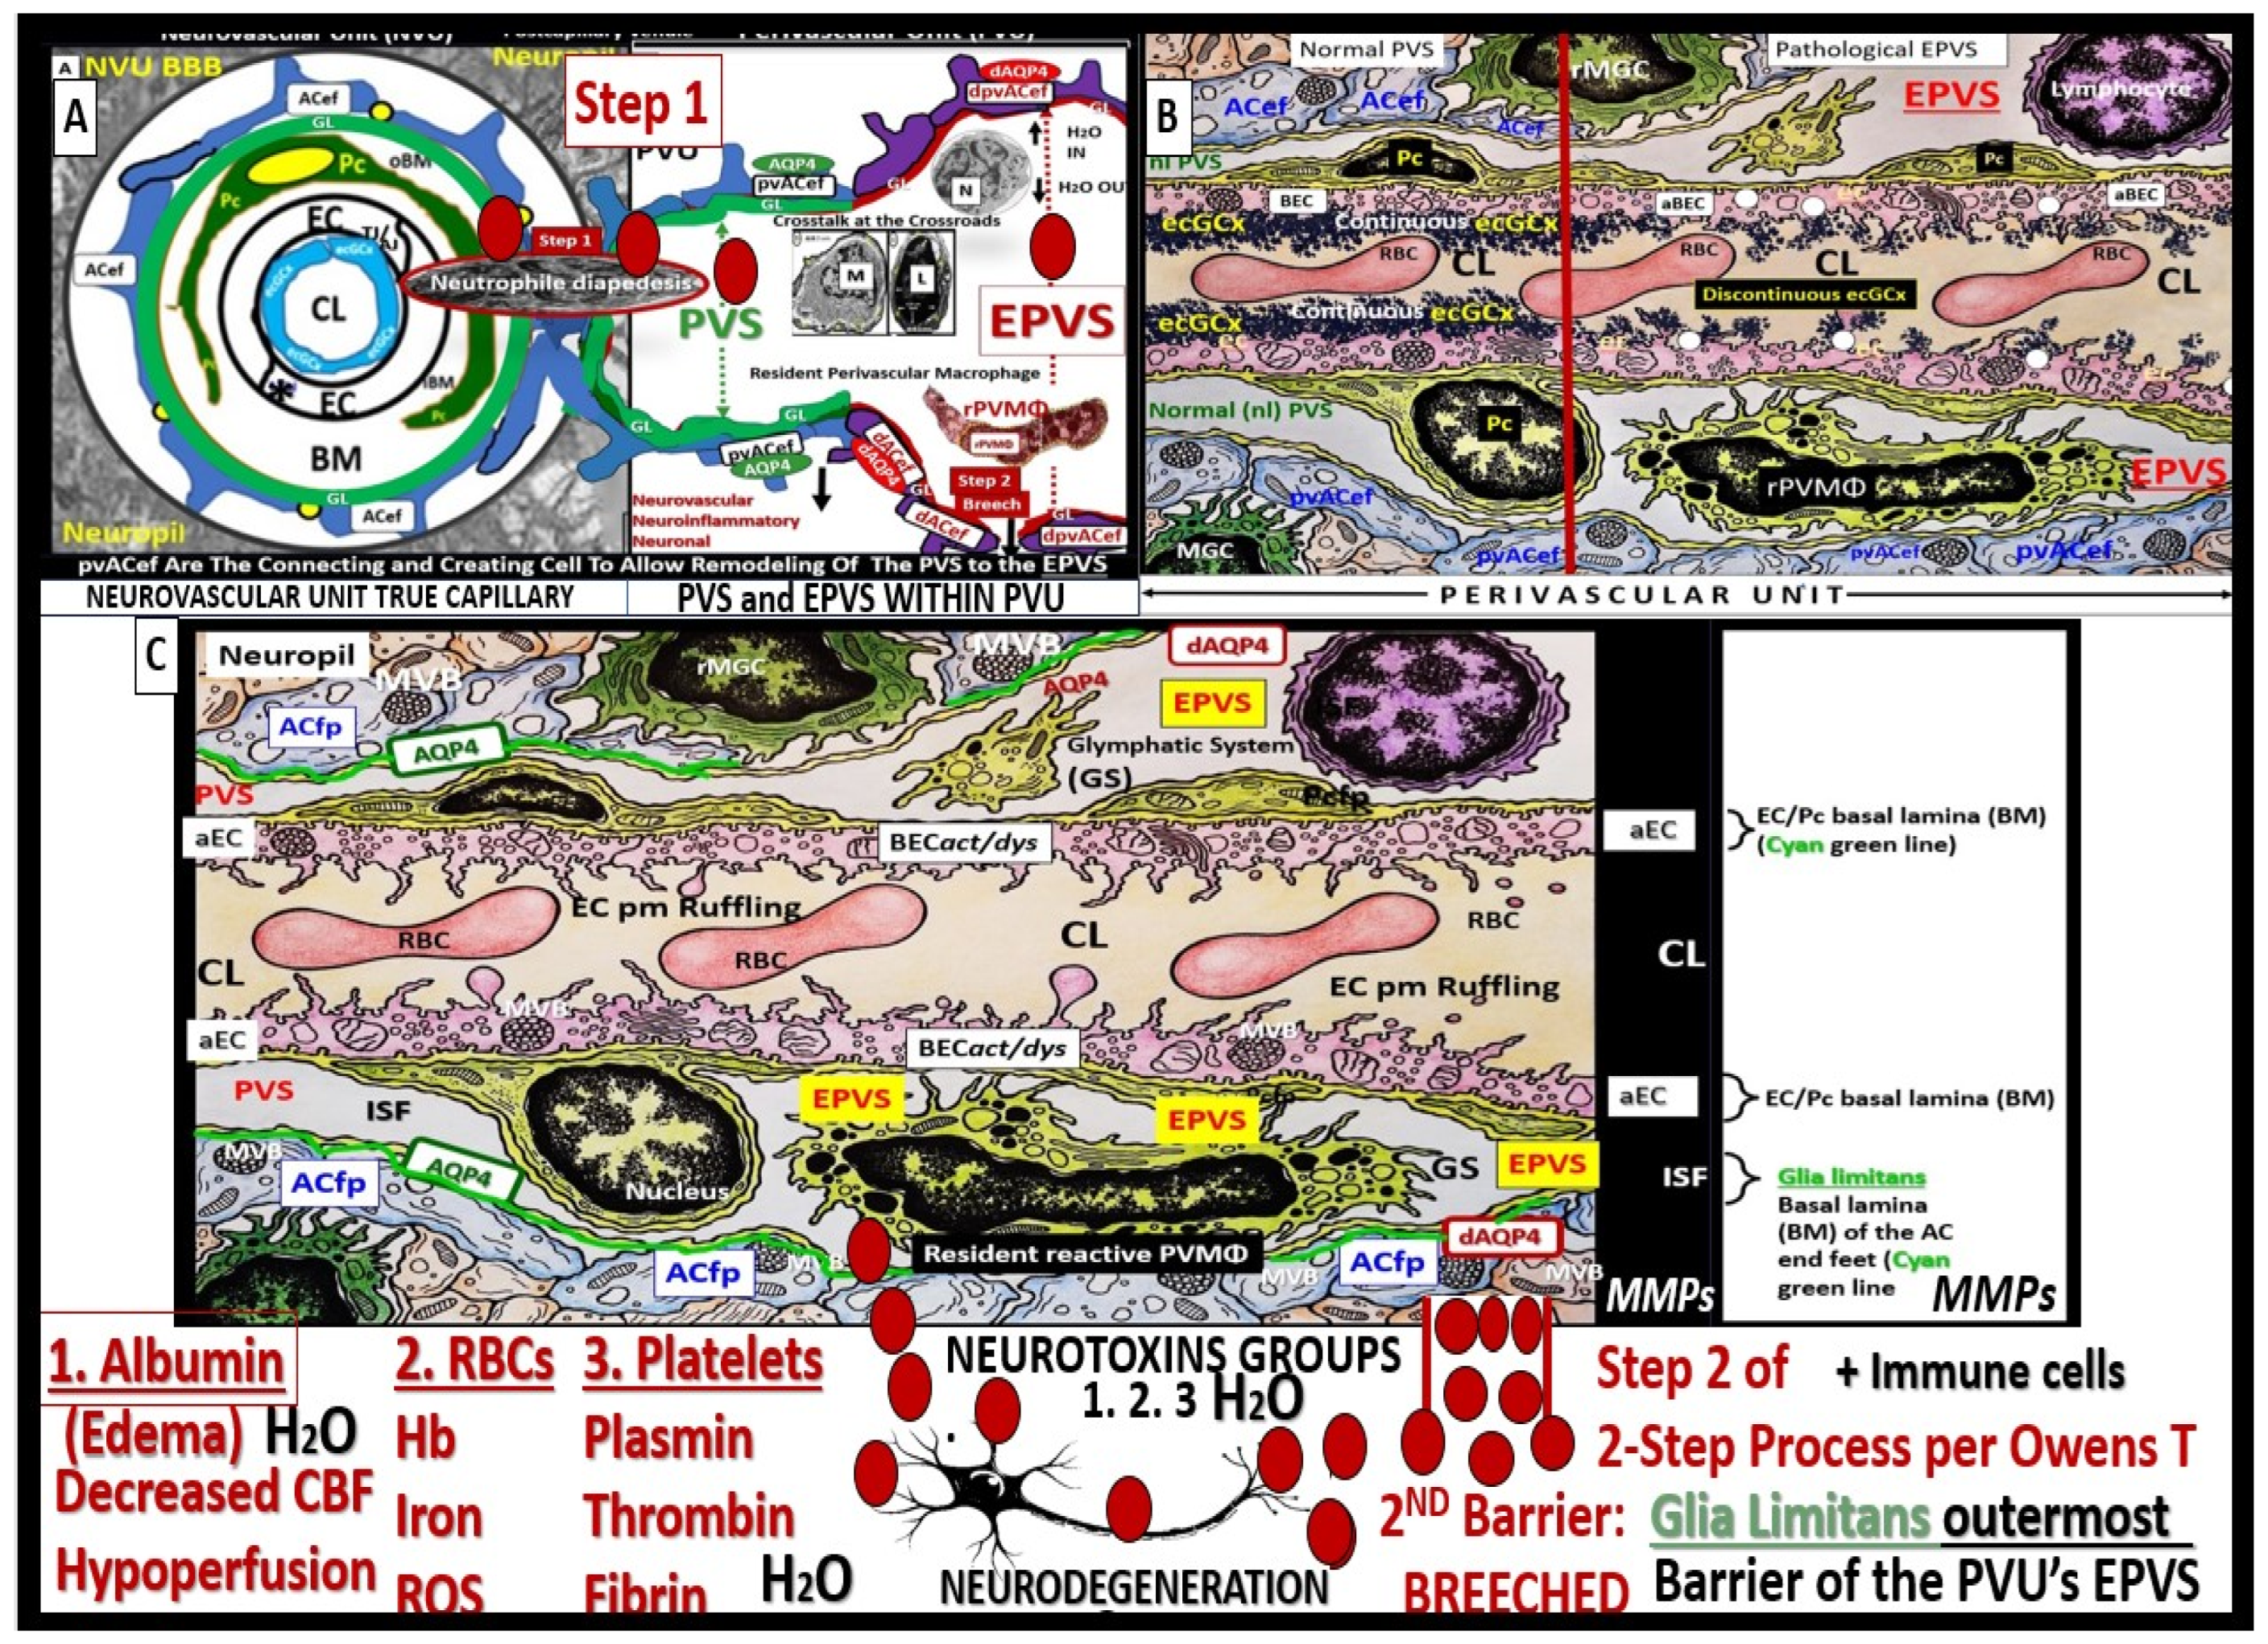
Figure 12.
The perivascular unit (PVU) provides a crossroad for multicellular crosstalk communication for vascular, neuroinflammatory, and neuronal systems due to the metainflammation associated with obesity, metabolic syndrome (MetS), and type 2 diabetes mellitus (T2DM). Panel A demonstrates the normal appearing (background pseudo-colored green) perivascular spaces (PVS) indicating its normal function that is immediately adjacent to the true capillary of the neurovascular unit (NVU). Note the highway intersection icon left-lower panel A. Panel B depicts a pathologic enlarged perivascular space (EPVS) (background pseudo-colored red), which suggests pathologic enlargement that resides within the perivascular unit (PVU). Note that this EPVS contains multiple proinflammatory cells (innate immune neutrophils and monocytes, and adaptive immune lymphocytes) that are induced due to the effects of the visceral obesity-associated peripheral inflammation induced at the NVU with BEC activation and dysfunction with increased permeability to allow the proinflammatory cells and neurotoxic cytokines/chemokines to enter the PVS that results in the pathologic remodeling to create EPVS. As one can note, this PVU and EPVS allows for a crossroad or gathering space to form and create the extensive crosstalk communication between the vascular, neuroinflammatory, and neuronal systems to interact to result in neuroinflammation and neurodegenerative changes with resulting impaired cognition that is associated with obesity, MetS, and T2DM. Note that the red-dashed line represents the glia limitans that is breeched to allow step-two of neuroinflammation and subsequent neuronal remodeling. Image available by CC 4.0 [7]. BBB = blood-brain barrier; BECact/dys = brain endothelial cell activation and dysfunction; CL = capillary lumen; EC = brain endothelial cells; EPVS = enlarged perivascular space; Pc = pericytes; rPVMΦ = resident reactive perivascular macrophage(s).
Figure 12.
The perivascular unit (PVU) provides a crossroad for multicellular crosstalk communication for vascular, neuroinflammatory, and neuronal systems due to the metainflammation associated with obesity, metabolic syndrome (MetS), and type 2 diabetes mellitus (T2DM). Panel A demonstrates the normal appearing (background pseudo-colored green) perivascular spaces (PVS) indicating its normal function that is immediately adjacent to the true capillary of the neurovascular unit (NVU). Note the highway intersection icon left-lower panel A. Panel B depicts a pathologic enlarged perivascular space (EPVS) (background pseudo-colored red), which suggests pathologic enlargement that resides within the perivascular unit (PVU). Note that this EPVS contains multiple proinflammatory cells (innate immune neutrophils and monocytes, and adaptive immune lymphocytes) that are induced due to the effects of the visceral obesity-associated peripheral inflammation induced at the NVU with BEC activation and dysfunction with increased permeability to allow the proinflammatory cells and neurotoxic cytokines/chemokines to enter the PVS that results in the pathologic remodeling to create EPVS. As one can note, this PVU and EPVS allows for a crossroad or gathering space to form and create the extensive crosstalk communication between the vascular, neuroinflammatory, and neuronal systems to interact to result in neuroinflammation and neurodegenerative changes with resulting impaired cognition that is associated with obesity, MetS, and T2DM. Note that the red-dashed line represents the glia limitans that is breeched to allow step-two of neuroinflammation and subsequent neuronal remodeling. Image available by CC 4.0 [7]. BBB = blood-brain barrier; BECact/dys = brain endothelial cell activation and dysfunction; CL = capillary lumen; EC = brain endothelial cells; EPVS = enlarged perivascular space; Pc = pericytes; rPVMΦ = resident reactive perivascular macrophage(s).
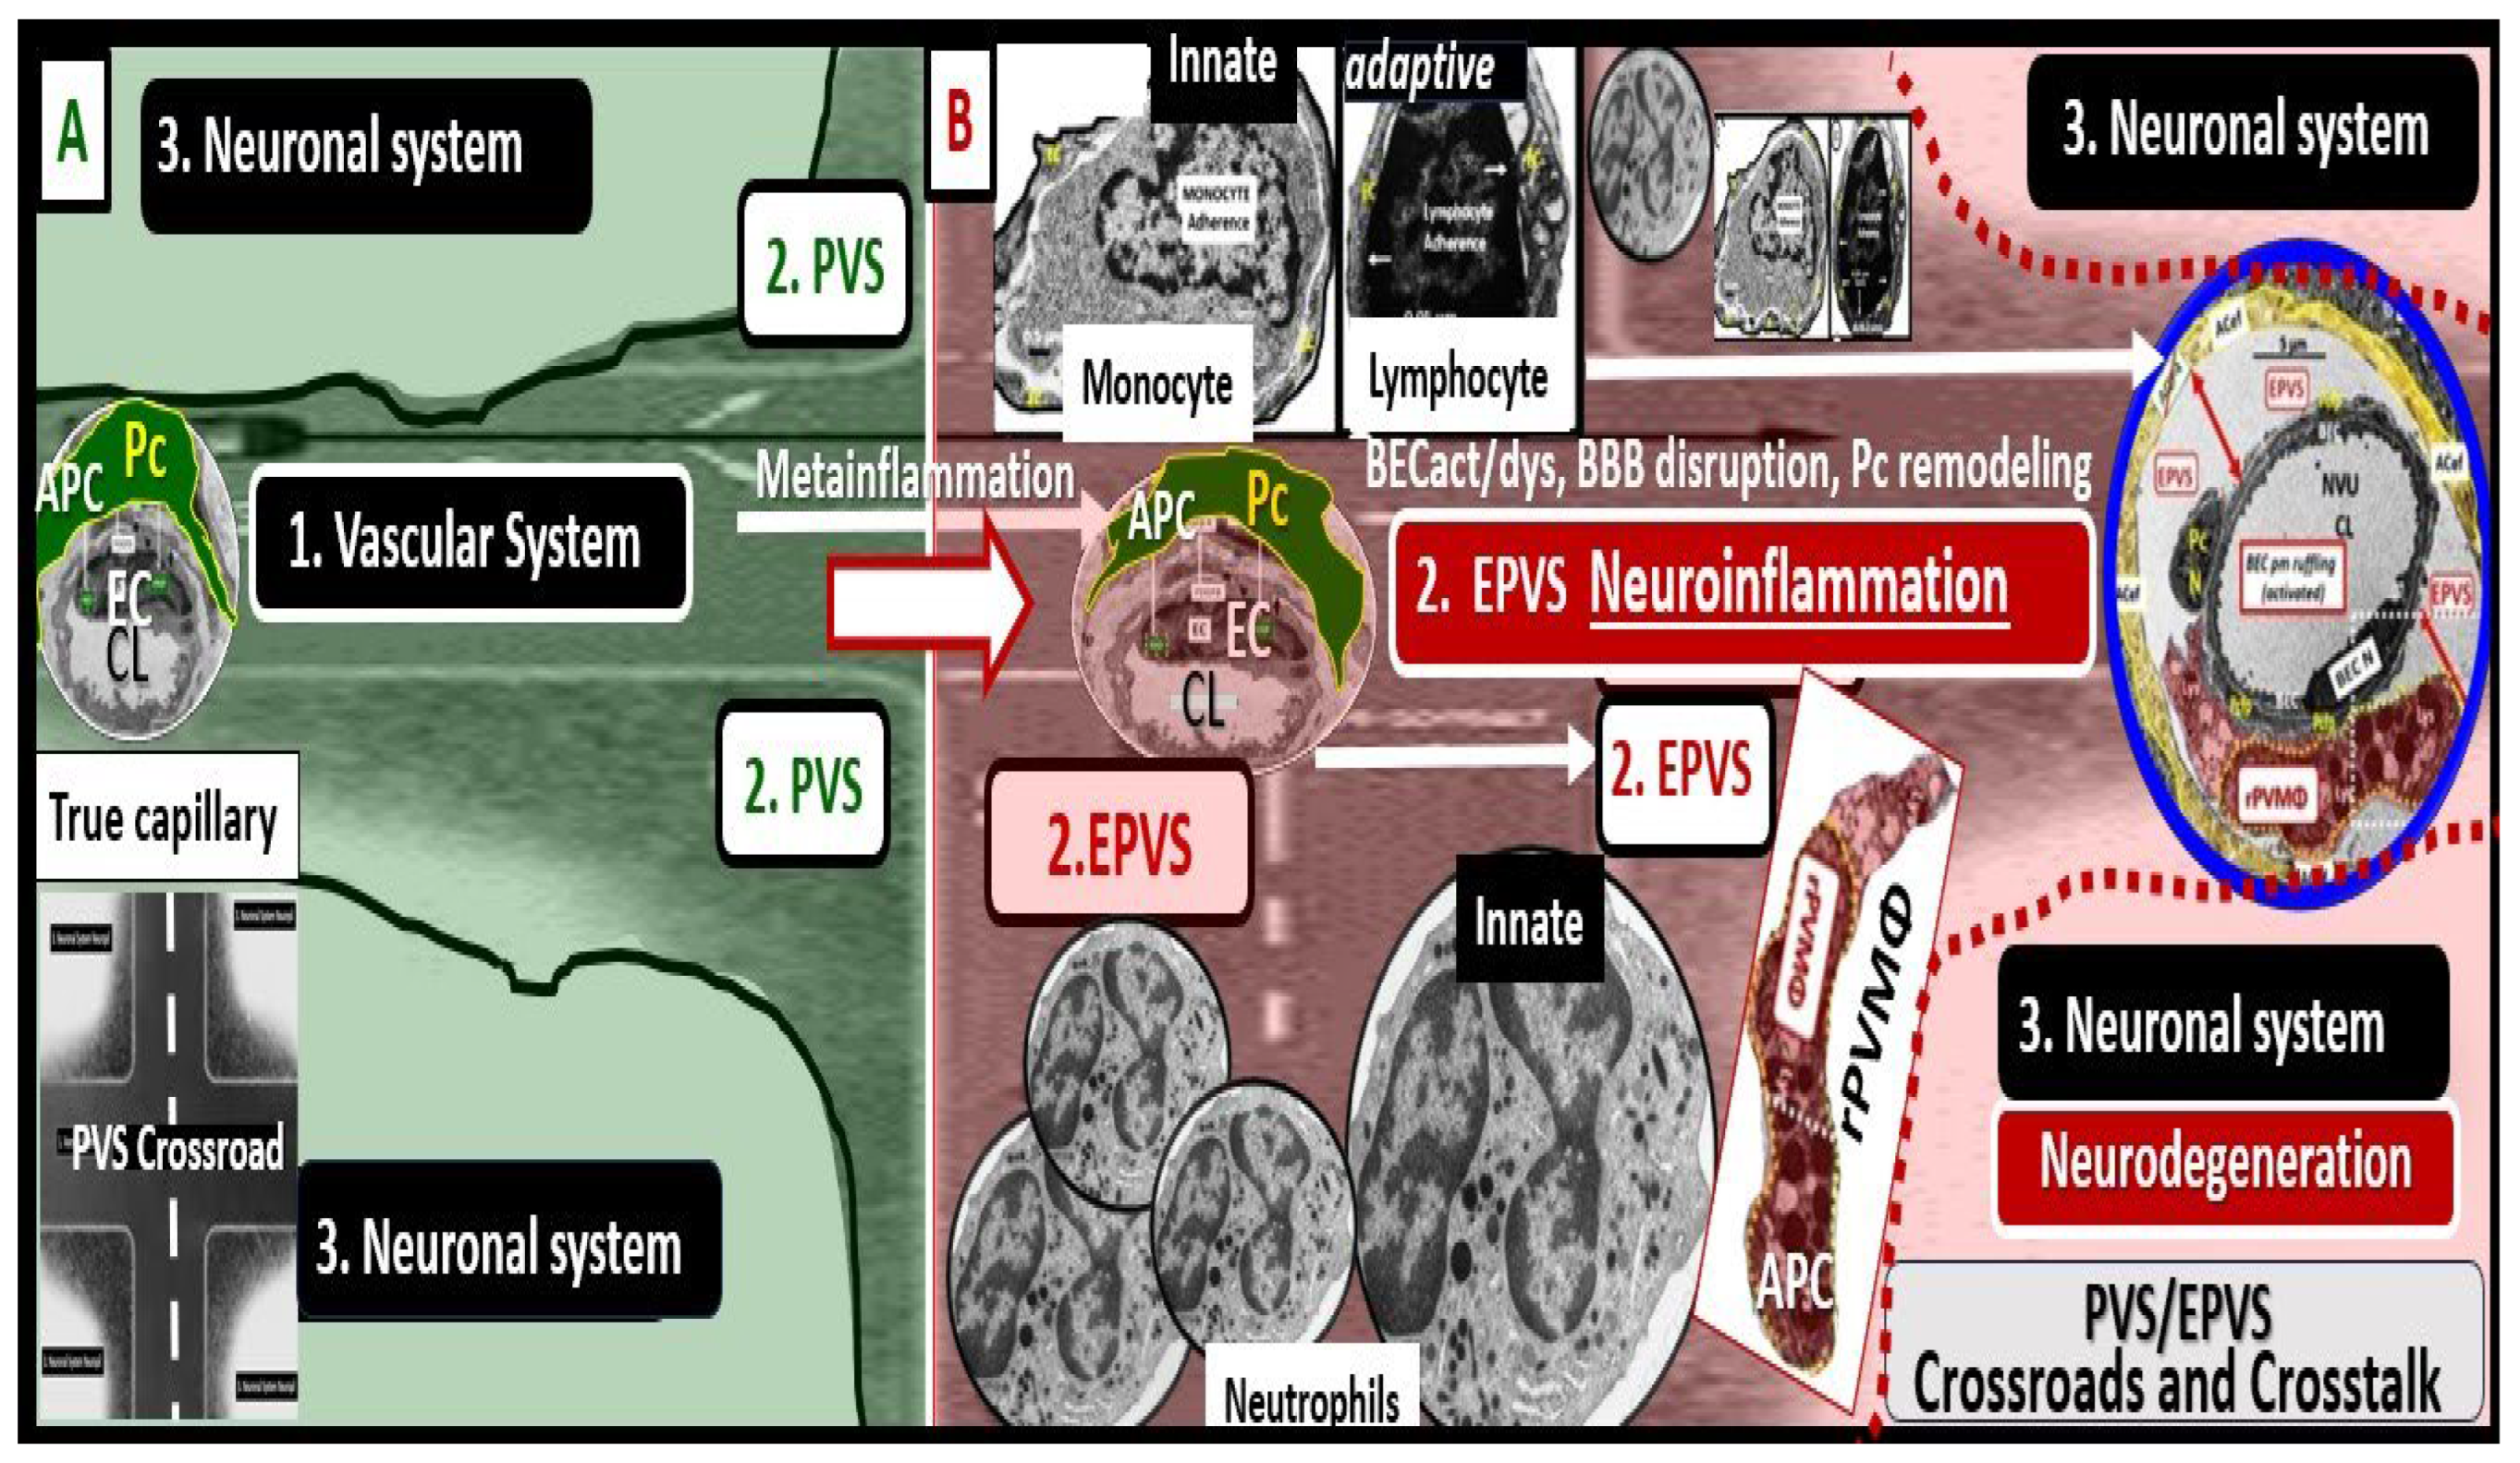
Figure 13.
Crosstalk at the Crossroad of perivascular unit (PVU). Multicellular crosstalk between the resident perivascular macrophage (rPVMΦs) and the brain endothelial cells (BECs), pericytes (Pcs), and perivascular astrocyte endfeet (pvACef). Panel A demonstrates the normal true capillary of the neurovascular unit (NVU) blood-brain barrier (BBB) interface with peg and socket communicating gap-junctions, connexin 43 (Cx43) and N-cadherin junctions with encircling Pcs and the cellular signaling utilizing nitric oxide (NO) and platelet-derived growth factor beta (PDGFβ) and vascular endothelial cell growth factor (VEGF). Panel B depicts the cellular crosstalk between the BECs, Pcs, Pcef, and the pvACef and the rPVMΦs (yellow, red, and white dashed lines respectively) due to their close proximity within the EPVS. Figure provided by CC 4.0 [7]. ACef = perivascular astrocyte endfeet (pvACef); Asterisk = activated BECs; EC = brain endothelial cell; Lys = lysosomes; N = nucleus; Pcfp = pericyte foot process-endfeet.
Figure 13.
Crosstalk at the Crossroad of perivascular unit (PVU). Multicellular crosstalk between the resident perivascular macrophage (rPVMΦs) and the brain endothelial cells (BECs), pericytes (Pcs), and perivascular astrocyte endfeet (pvACef). Panel A demonstrates the normal true capillary of the neurovascular unit (NVU) blood-brain barrier (BBB) interface with peg and socket communicating gap-junctions, connexin 43 (Cx43) and N-cadherin junctions with encircling Pcs and the cellular signaling utilizing nitric oxide (NO) and platelet-derived growth factor beta (PDGFβ) and vascular endothelial cell growth factor (VEGF). Panel B depicts the cellular crosstalk between the BECs, Pcs, Pcef, and the pvACef and the rPVMΦs (yellow, red, and white dashed lines respectively) due to their close proximity within the EPVS. Figure provided by CC 4.0 [7]. ACef = perivascular astrocyte endfeet (pvACef); Asterisk = activated BECs; EC = brain endothelial cell; Lys = lysosomes; N = nucleus; Pcfp = pericyte foot process-endfeet.
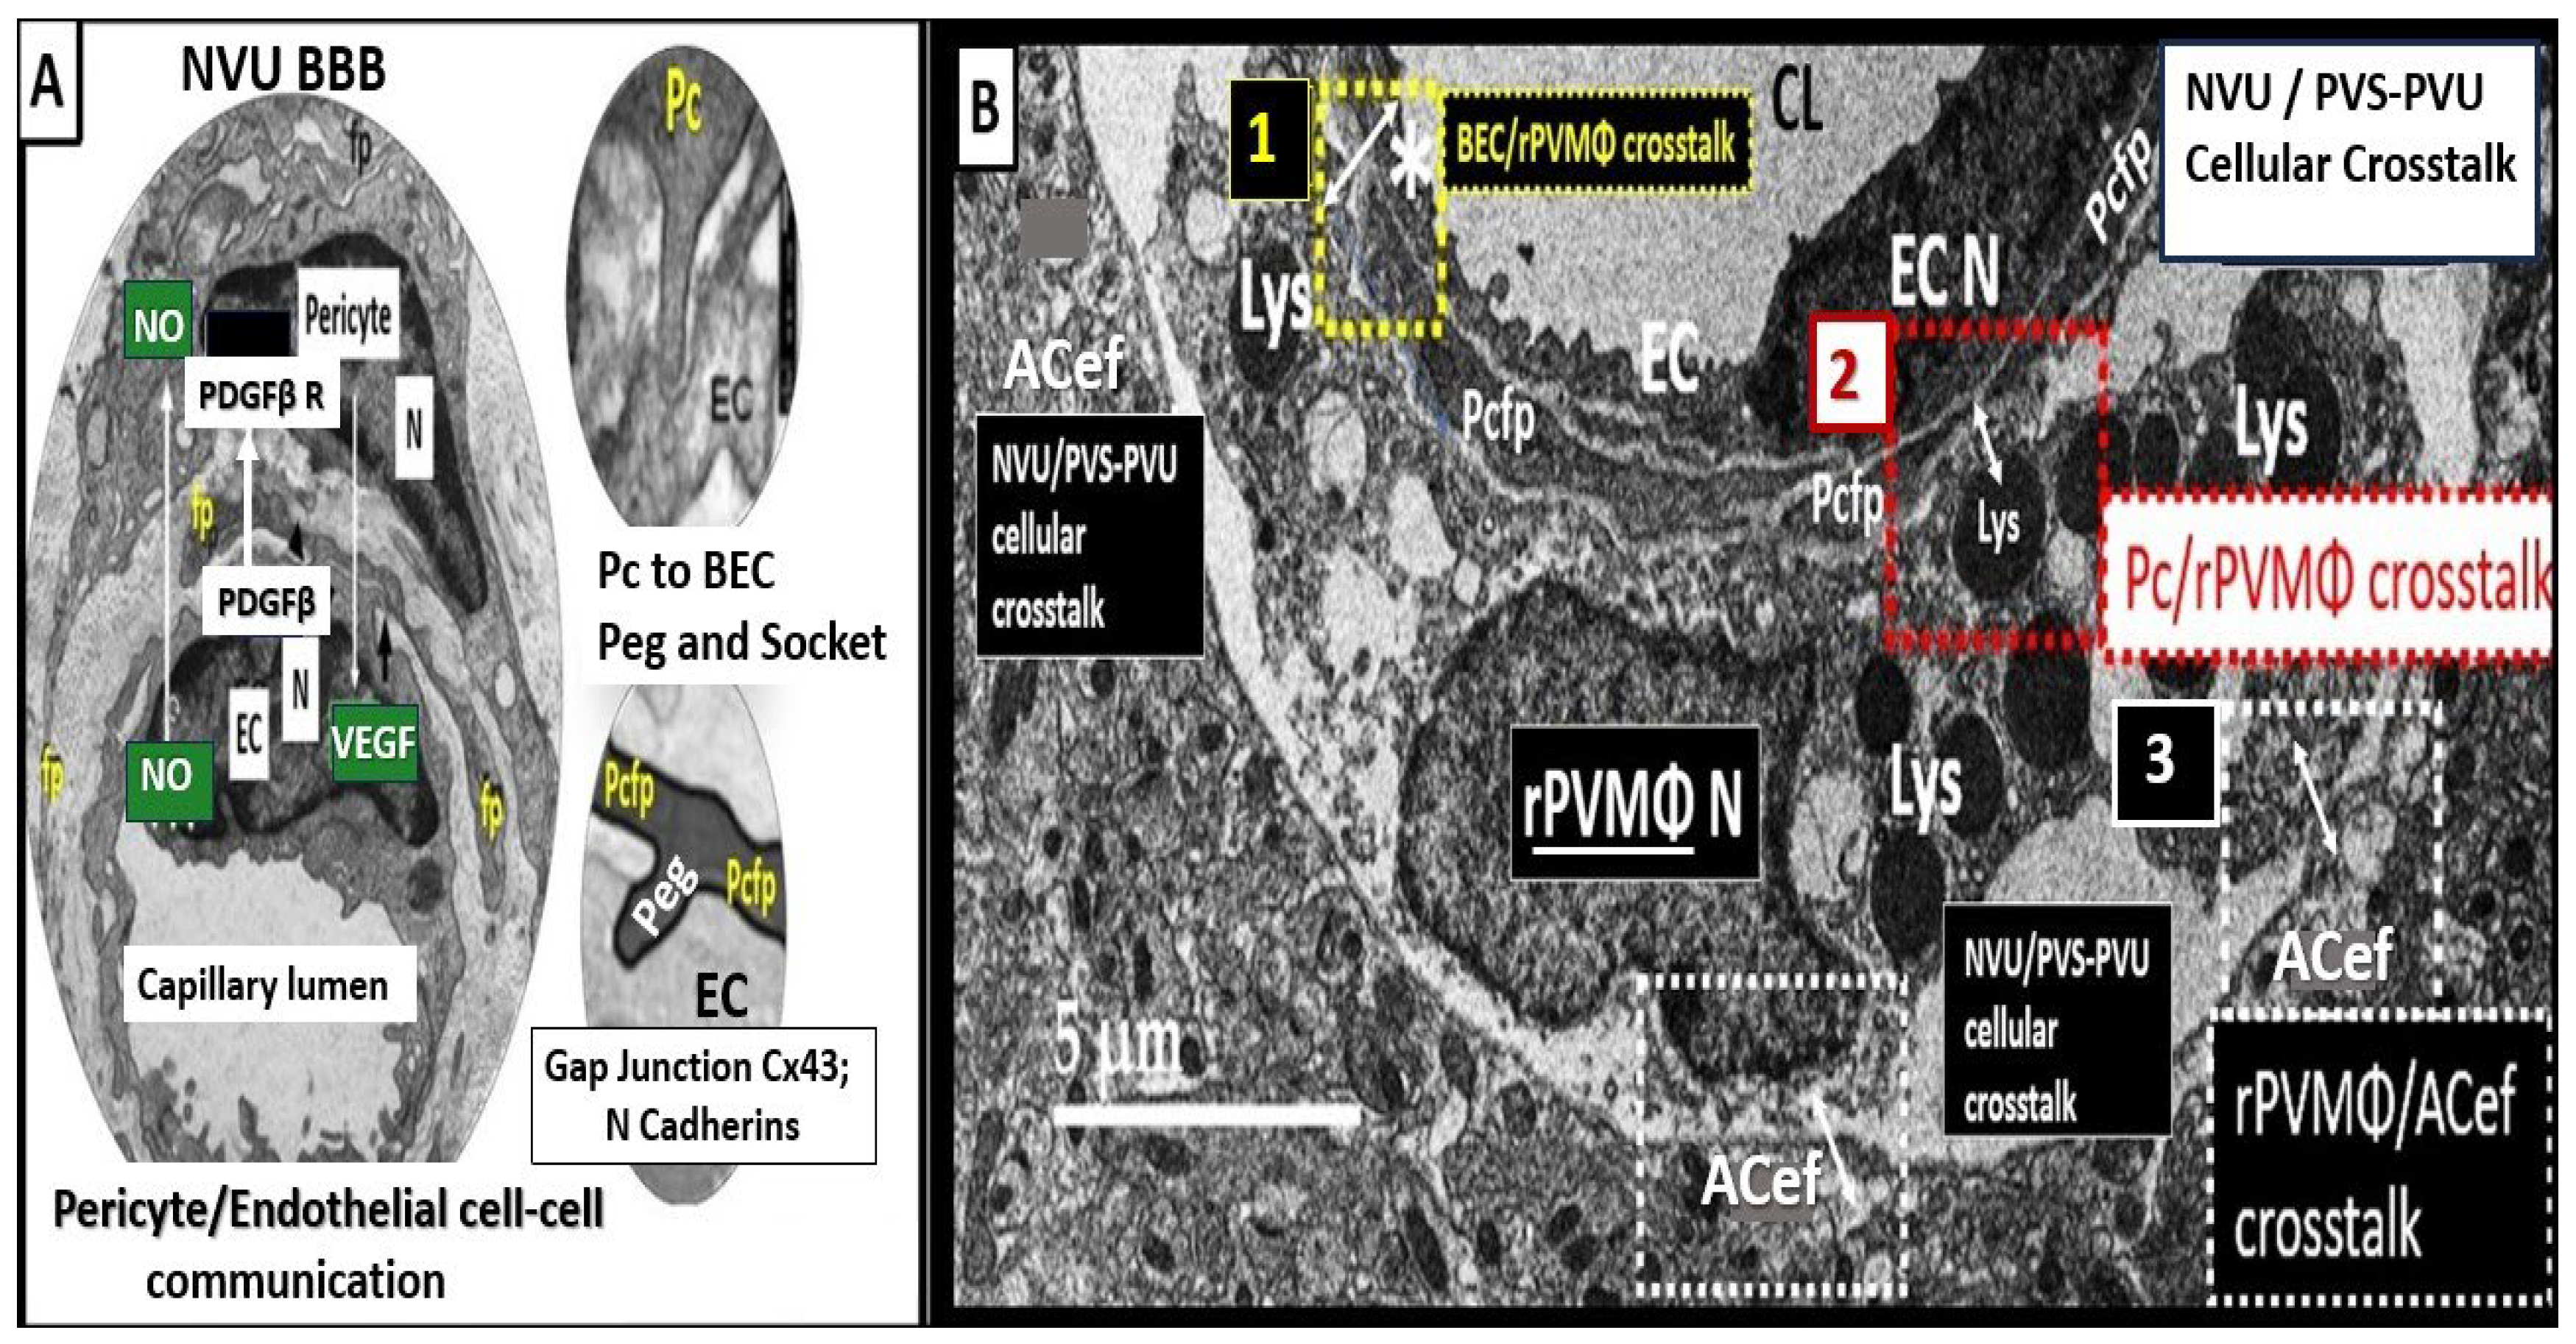
Figure 14.
Magnetic resonance imaging (MRI) indentification and comparison of basal ganglia (BG) to centrum semiovale (CSO) enlarged perivascular spaces (EPVS). Panel A depicts the paired EPVSs within the BG that are traced in open on the left and masked yellow on the right BG. Note the white spaces within the paired dashed lines just above the paired BG structures. MRI image from a 75 y/o male status post-stroke, recovered with small vessel disease. Panel B depicts the paired elongated oval structures outlined by yellow dashed lines to enclose multiple white enlarged perivascular spaces. Note the open white arrows outlined in red pointing to prominent EPVSs. MRI image from a 79 y/o female with history of transient ischemic attacks. Importantly, note that BG EPVS are strongly associated with cerebral small vessel disease (SVD) in panel A and that CSO EPVSs are strongly associated with late-onset Alzheimer’s disease and cerebral amyloid angiopathy (CAA) in panel B. Incidentally, EPVS are more commonly associated with CSO in atherosclerosis, arteriolosclerosis, obesity, metabolic syndrome and T2DM. Image reproduced with permission by CC 4.0 [64].
Figure 14.
Magnetic resonance imaging (MRI) indentification and comparison of basal ganglia (BG) to centrum semiovale (CSO) enlarged perivascular spaces (EPVS). Panel A depicts the paired EPVSs within the BG that are traced in open on the left and masked yellow on the right BG. Note the white spaces within the paired dashed lines just above the paired BG structures. MRI image from a 75 y/o male status post-stroke, recovered with small vessel disease. Panel B depicts the paired elongated oval structures outlined by yellow dashed lines to enclose multiple white enlarged perivascular spaces. Note the open white arrows outlined in red pointing to prominent EPVSs. MRI image from a 79 y/o female with history of transient ischemic attacks. Importantly, note that BG EPVS are strongly associated with cerebral small vessel disease (SVD) in panel A and that CSO EPVSs are strongly associated with late-onset Alzheimer’s disease and cerebral amyloid angiopathy (CAA) in panel B. Incidentally, EPVS are more commonly associated with CSO in atherosclerosis, arteriolosclerosis, obesity, metabolic syndrome and T2DM. Image reproduced with permission by CC 4.0 [64].
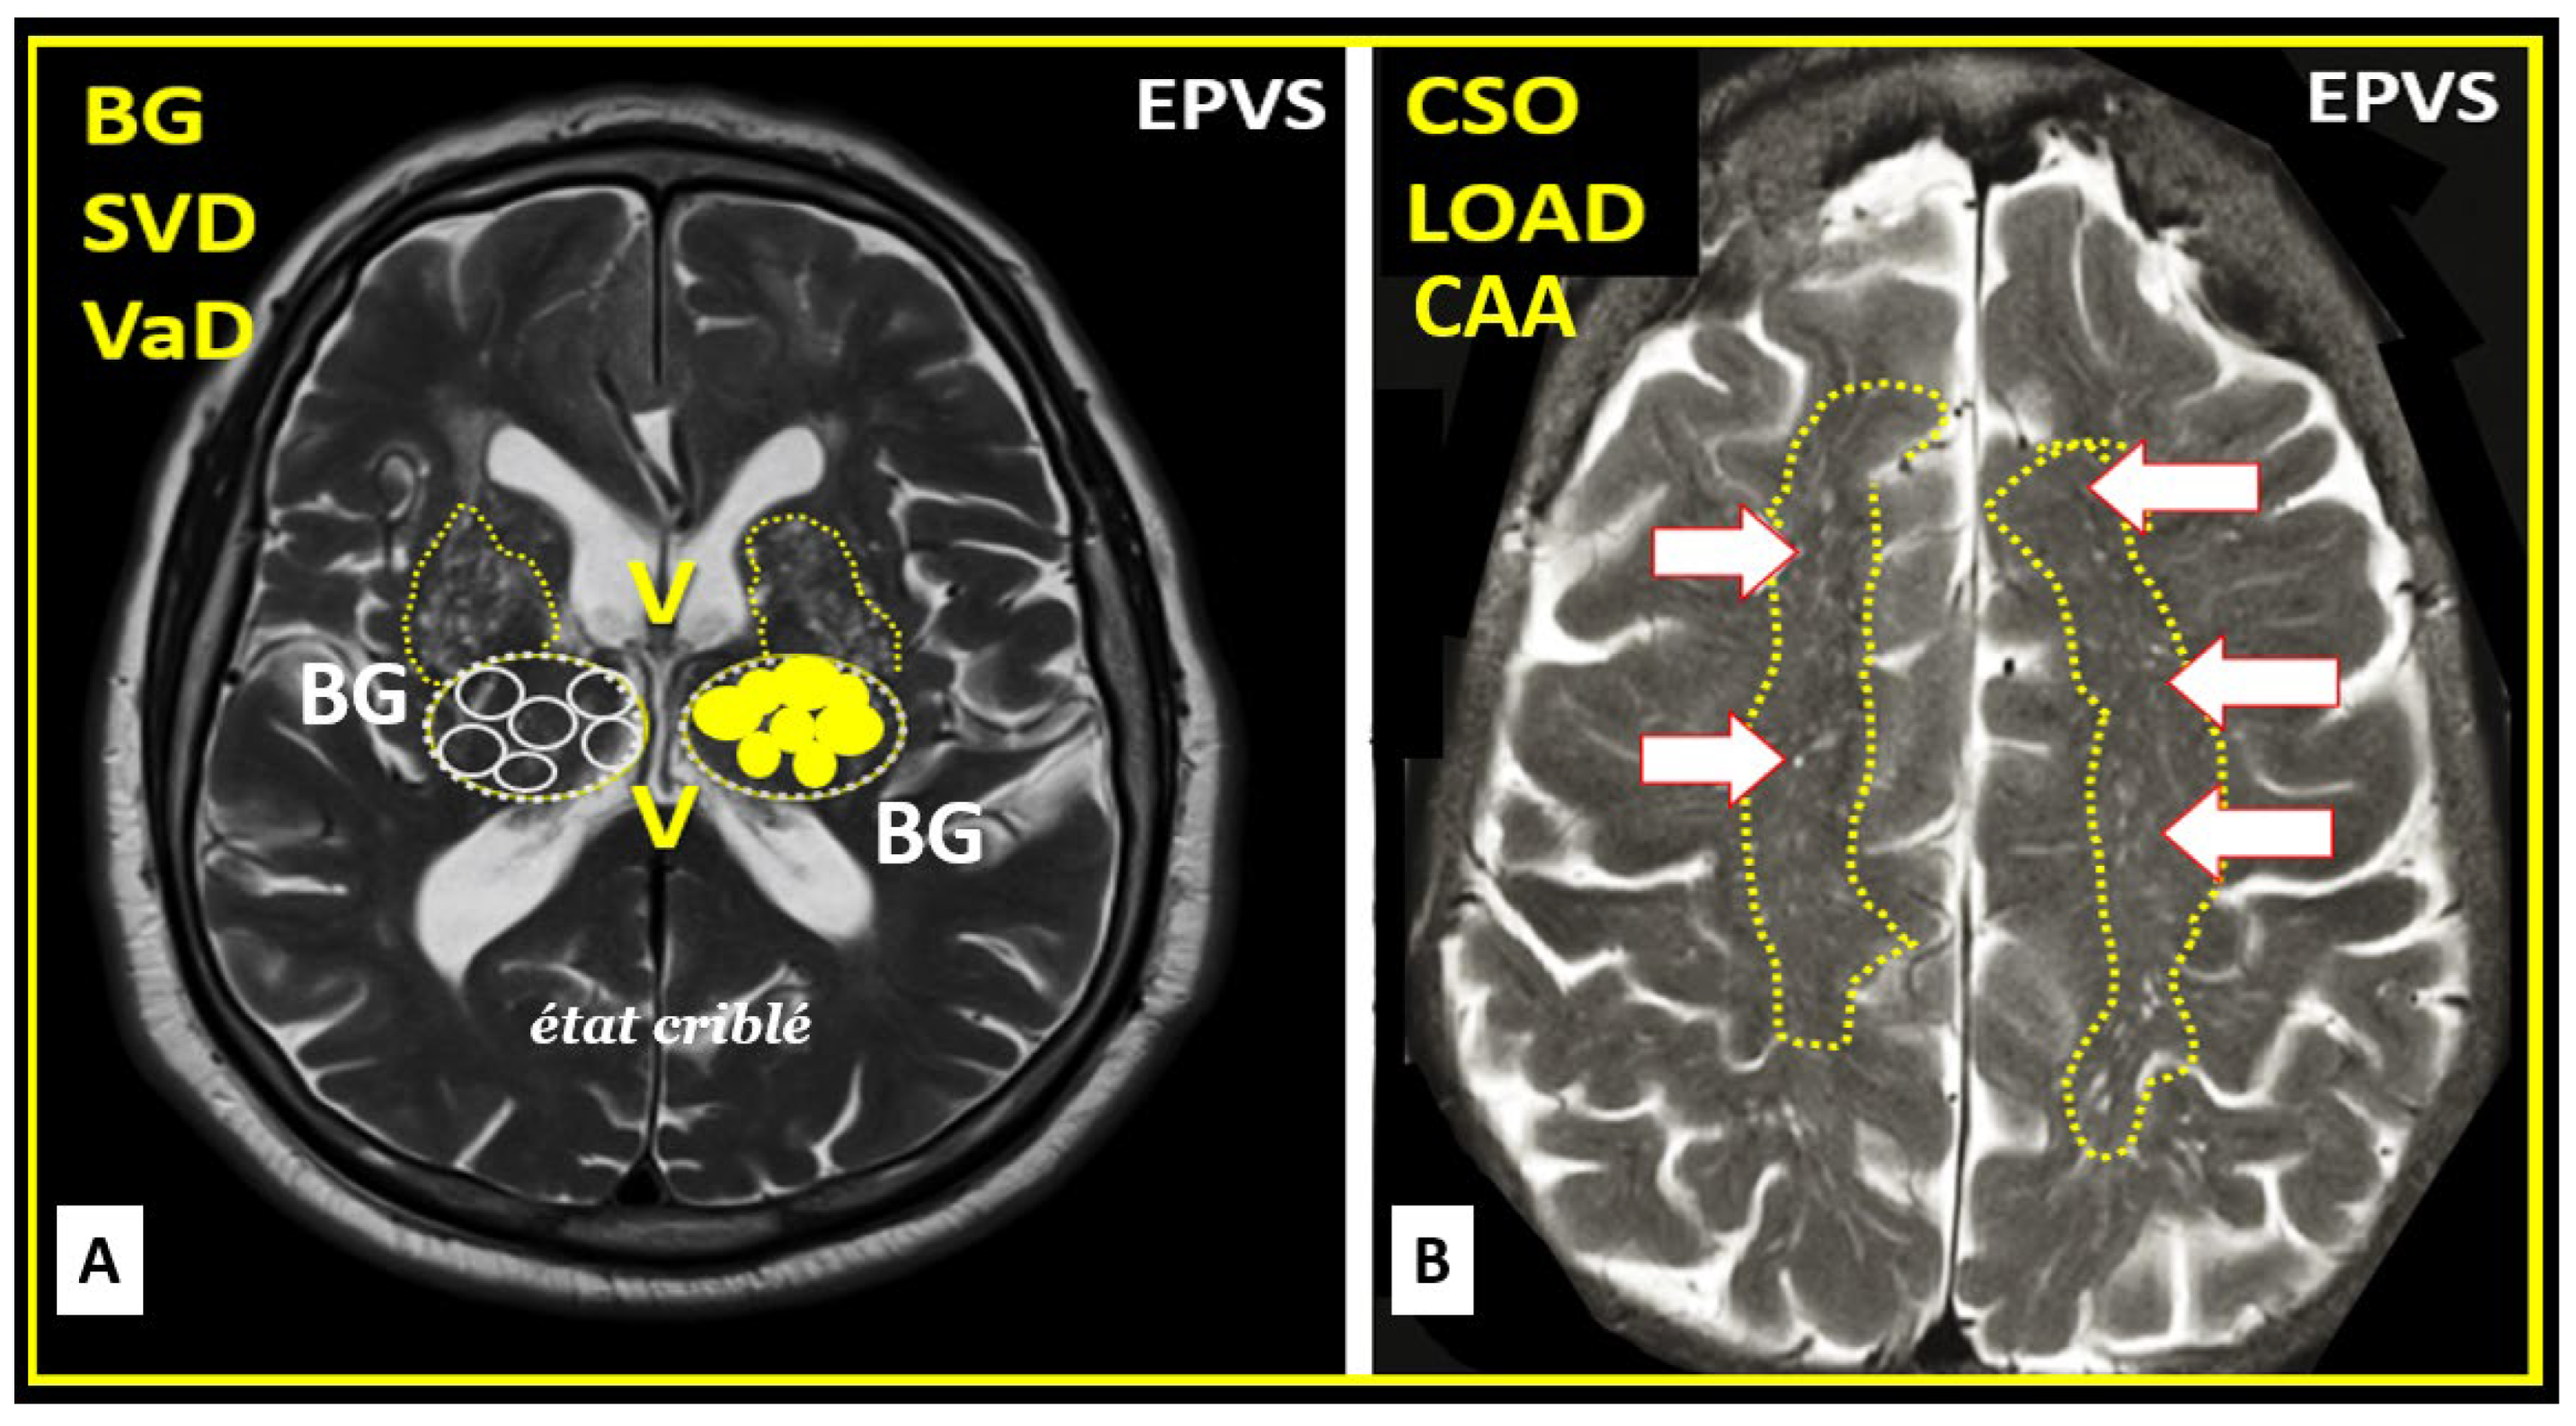
Figure 15.
The perivascular astrocyte end feet (pvACef) with its polarized aquaporin 4 (AQP4) water channels delimits the abluminal perivascular unit (PVU) with its perivascular spaces/enlarged perivascular spaces (PVS/EPVS) and perisynaptic astrocyte endfeet (psACef). Panels A and B each demonstrate (via immunohistochemical staining) the presence of AQP4 in the pvACef surrounding a postcapillary venule in an individual with hepatic cirrhosis in the thalamus of the brain. Panel C is a schematic rendering of the AQP4 channel and illustrates water moving into the PVS to contribute the PVS enlargement when AQP4 is dysfunctional and or lost. Panel D illustrates in younger models that AQP4 is tightly polarized to the plasma membrane of the pvACef as compared to panel E, which depicts a loss of AQP4 polarization in older models. Modified image provided with permission by CC 4.0 [64]. Scale bar = 500μm. CL = capillary lumen; IHC = immunohistochemistry; N = nucleus.
Figure 15.
The perivascular astrocyte end feet (pvACef) with its polarized aquaporin 4 (AQP4) water channels delimits the abluminal perivascular unit (PVU) with its perivascular spaces/enlarged perivascular spaces (PVS/EPVS) and perisynaptic astrocyte endfeet (psACef). Panels A and B each demonstrate (via immunohistochemical staining) the presence of AQP4 in the pvACef surrounding a postcapillary venule in an individual with hepatic cirrhosis in the thalamus of the brain. Panel C is a schematic rendering of the AQP4 channel and illustrates water moving into the PVS to contribute the PVS enlargement when AQP4 is dysfunctional and or lost. Panel D illustrates in younger models that AQP4 is tightly polarized to the plasma membrane of the pvACef as compared to panel E, which depicts a loss of AQP4 polarization in older models. Modified image provided with permission by CC 4.0 [64]. Scale bar = 500μm. CL = capillary lumen; IHC = immunohistochemistry; N = nucleus.
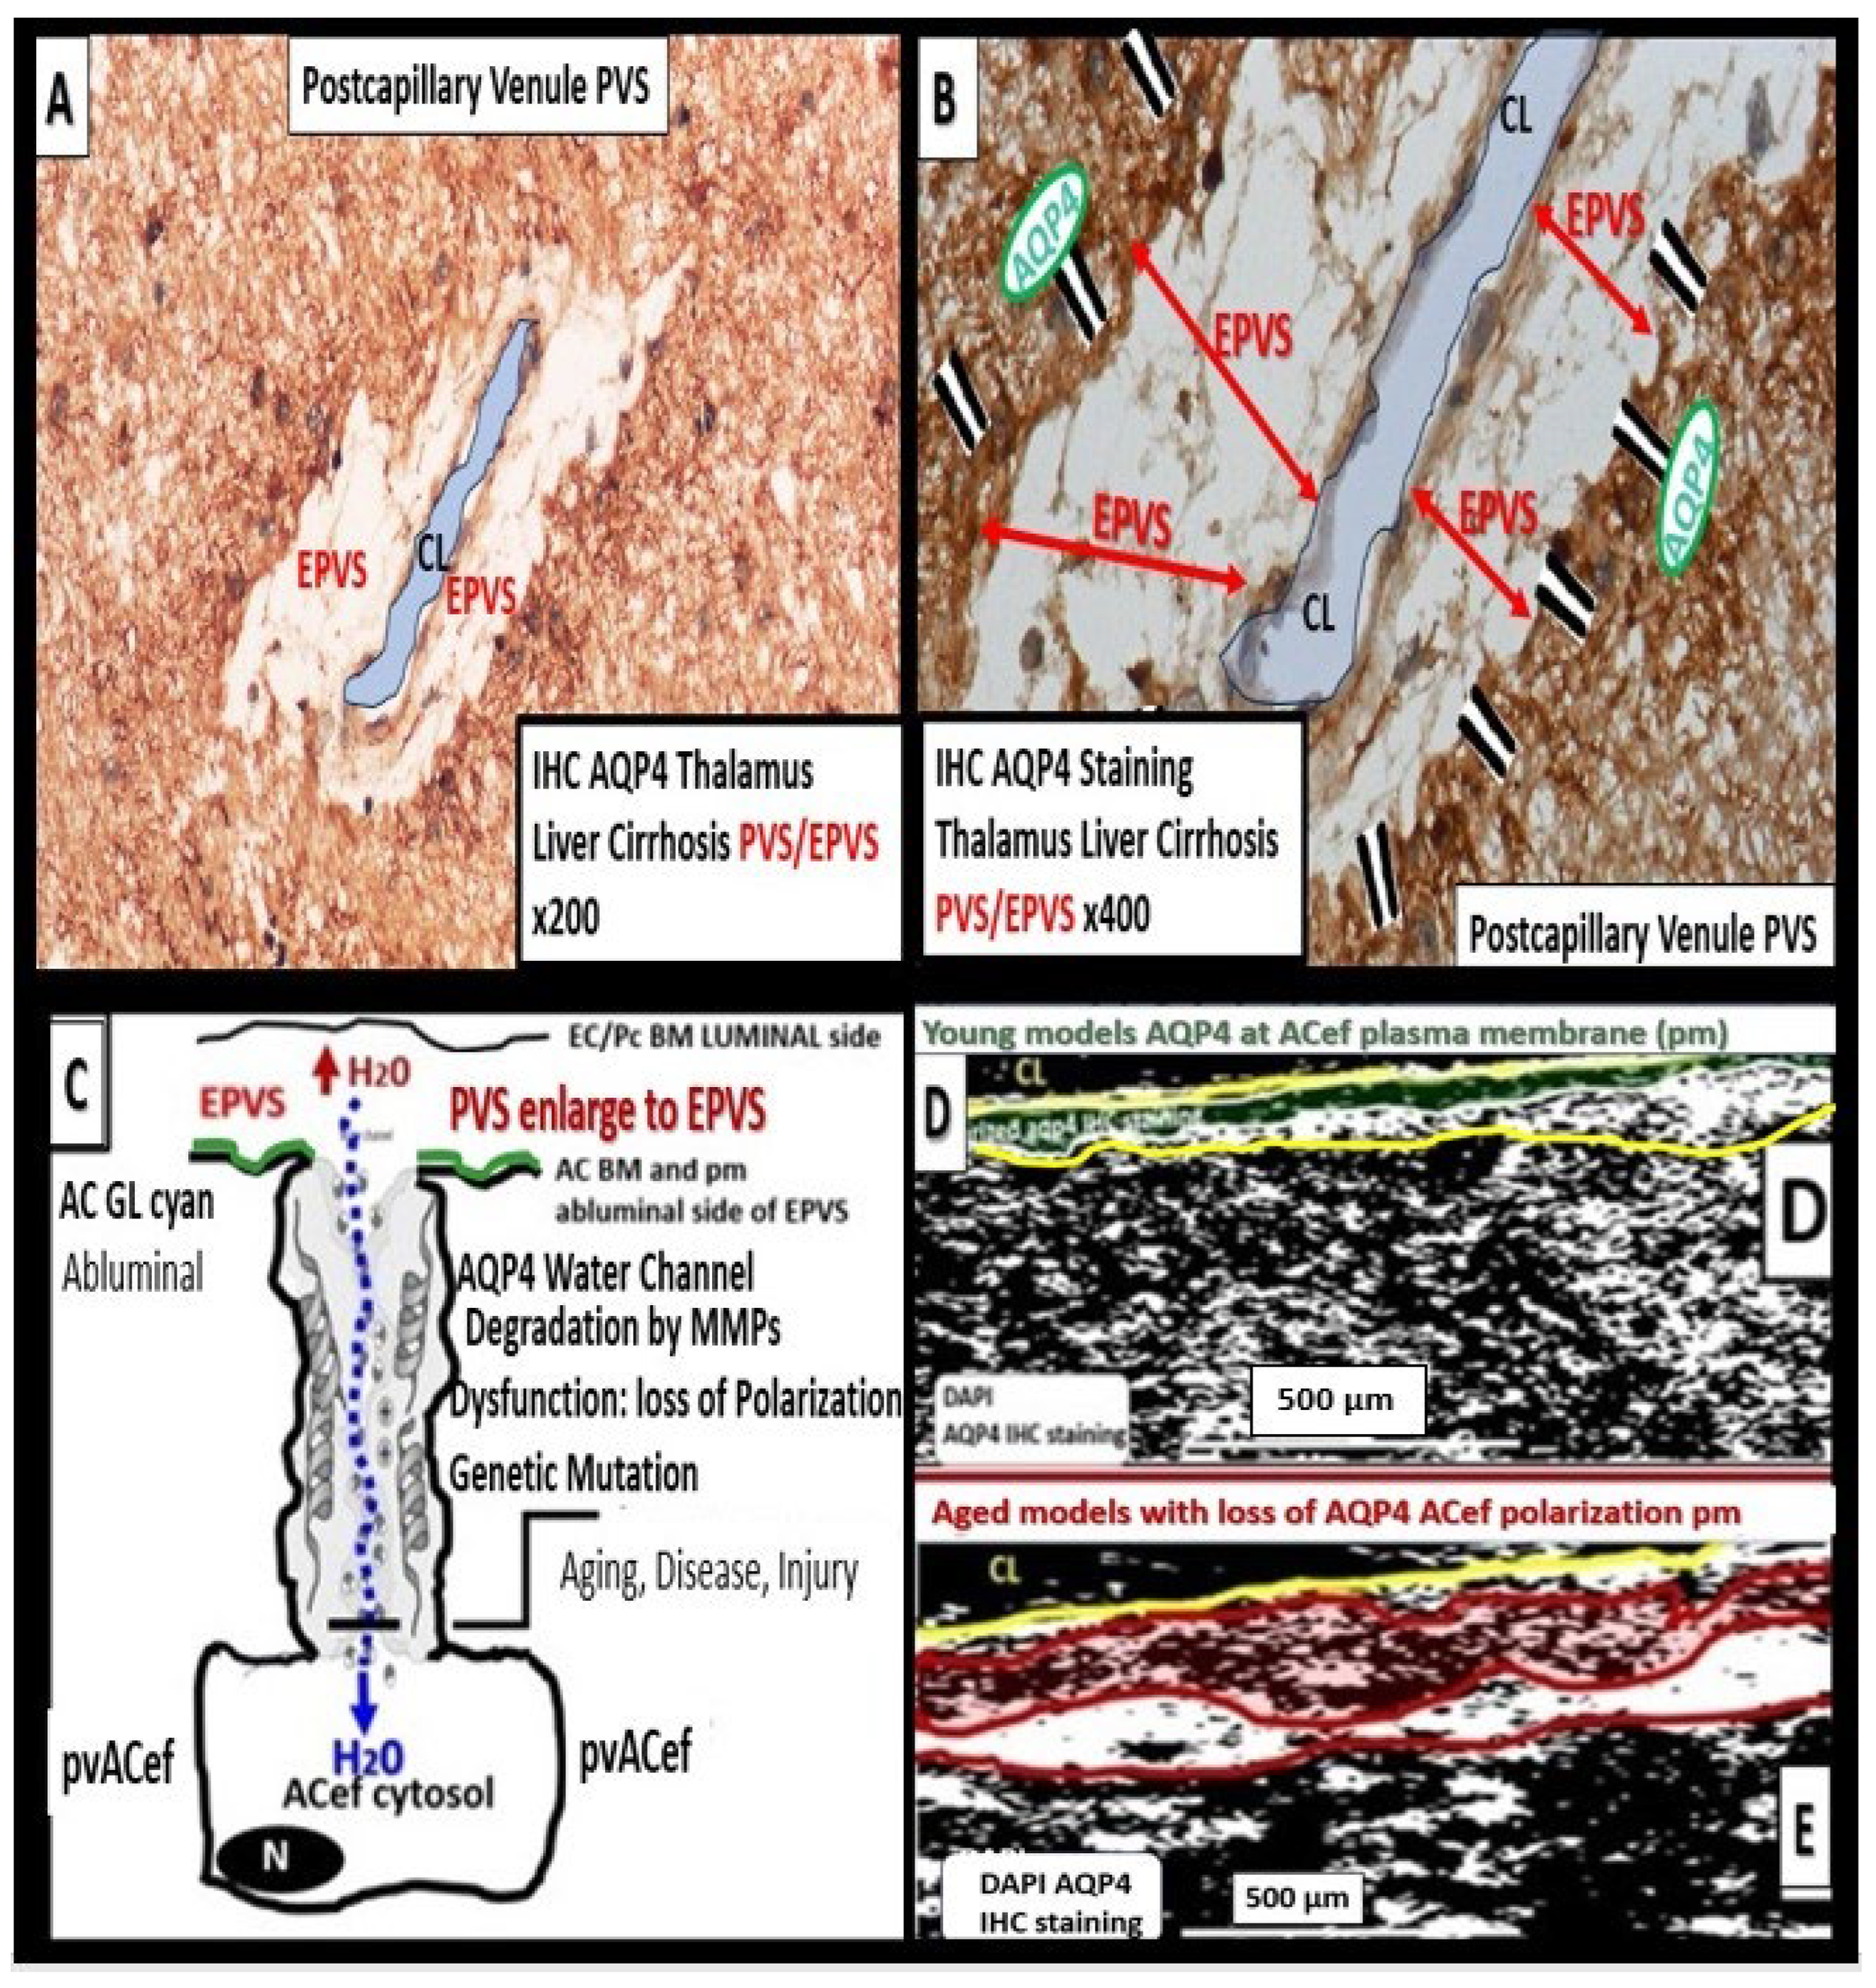
Figure 16.
Detachment and retraction of perivascular astrocyte endfeet (pvACef) from the neurovascular unit (NVU) in obese, insulin resistant, female diabetic db/db mice. Panel A demonstrates the NVU capillary in control non-diabetic models. Note how the pvACef tightly adhere to the NVU endothelial (EC) and pericyte-pericyte foot processes Pc-Pcfp outer basement membrane (BM). Panel B depicts the detachment and retraction of reactive pvACef (drpvACef) (yellow arrows) from the NVU. Panel C is and illustration demonstrating the involved proteins and integrins that are degraded in order for the drpvACef to detach and retract due to increased permeability of the NVU due to NVU disruption. AQP4 = aquaporin 4; AC = astrocyte; BM = basement membrane; EC = brain endothelial cell – endothelium; Fn = fibronectin; MMP2 and MMP 9 = matrix metalloproteinases 2, 9; ROS = reactive oxygen species.
Figure 16.
Detachment and retraction of perivascular astrocyte endfeet (pvACef) from the neurovascular unit (NVU) in obese, insulin resistant, female diabetic db/db mice. Panel A demonstrates the NVU capillary in control non-diabetic models. Note how the pvACef tightly adhere to the NVU endothelial (EC) and pericyte-pericyte foot processes Pc-Pcfp outer basement membrane (BM). Panel B depicts the detachment and retraction of reactive pvACef (drpvACef) (yellow arrows) from the NVU. Panel C is and illustration demonstrating the involved proteins and integrins that are degraded in order for the drpvACef to detach and retract due to increased permeability of the NVU due to NVU disruption. AQP4 = aquaporin 4; AC = astrocyte; BM = basement membrane; EC = brain endothelial cell – endothelium; Fn = fibronectin; MMP2 and MMP 9 = matrix metalloproteinases 2, 9; ROS = reactive oxygen species.
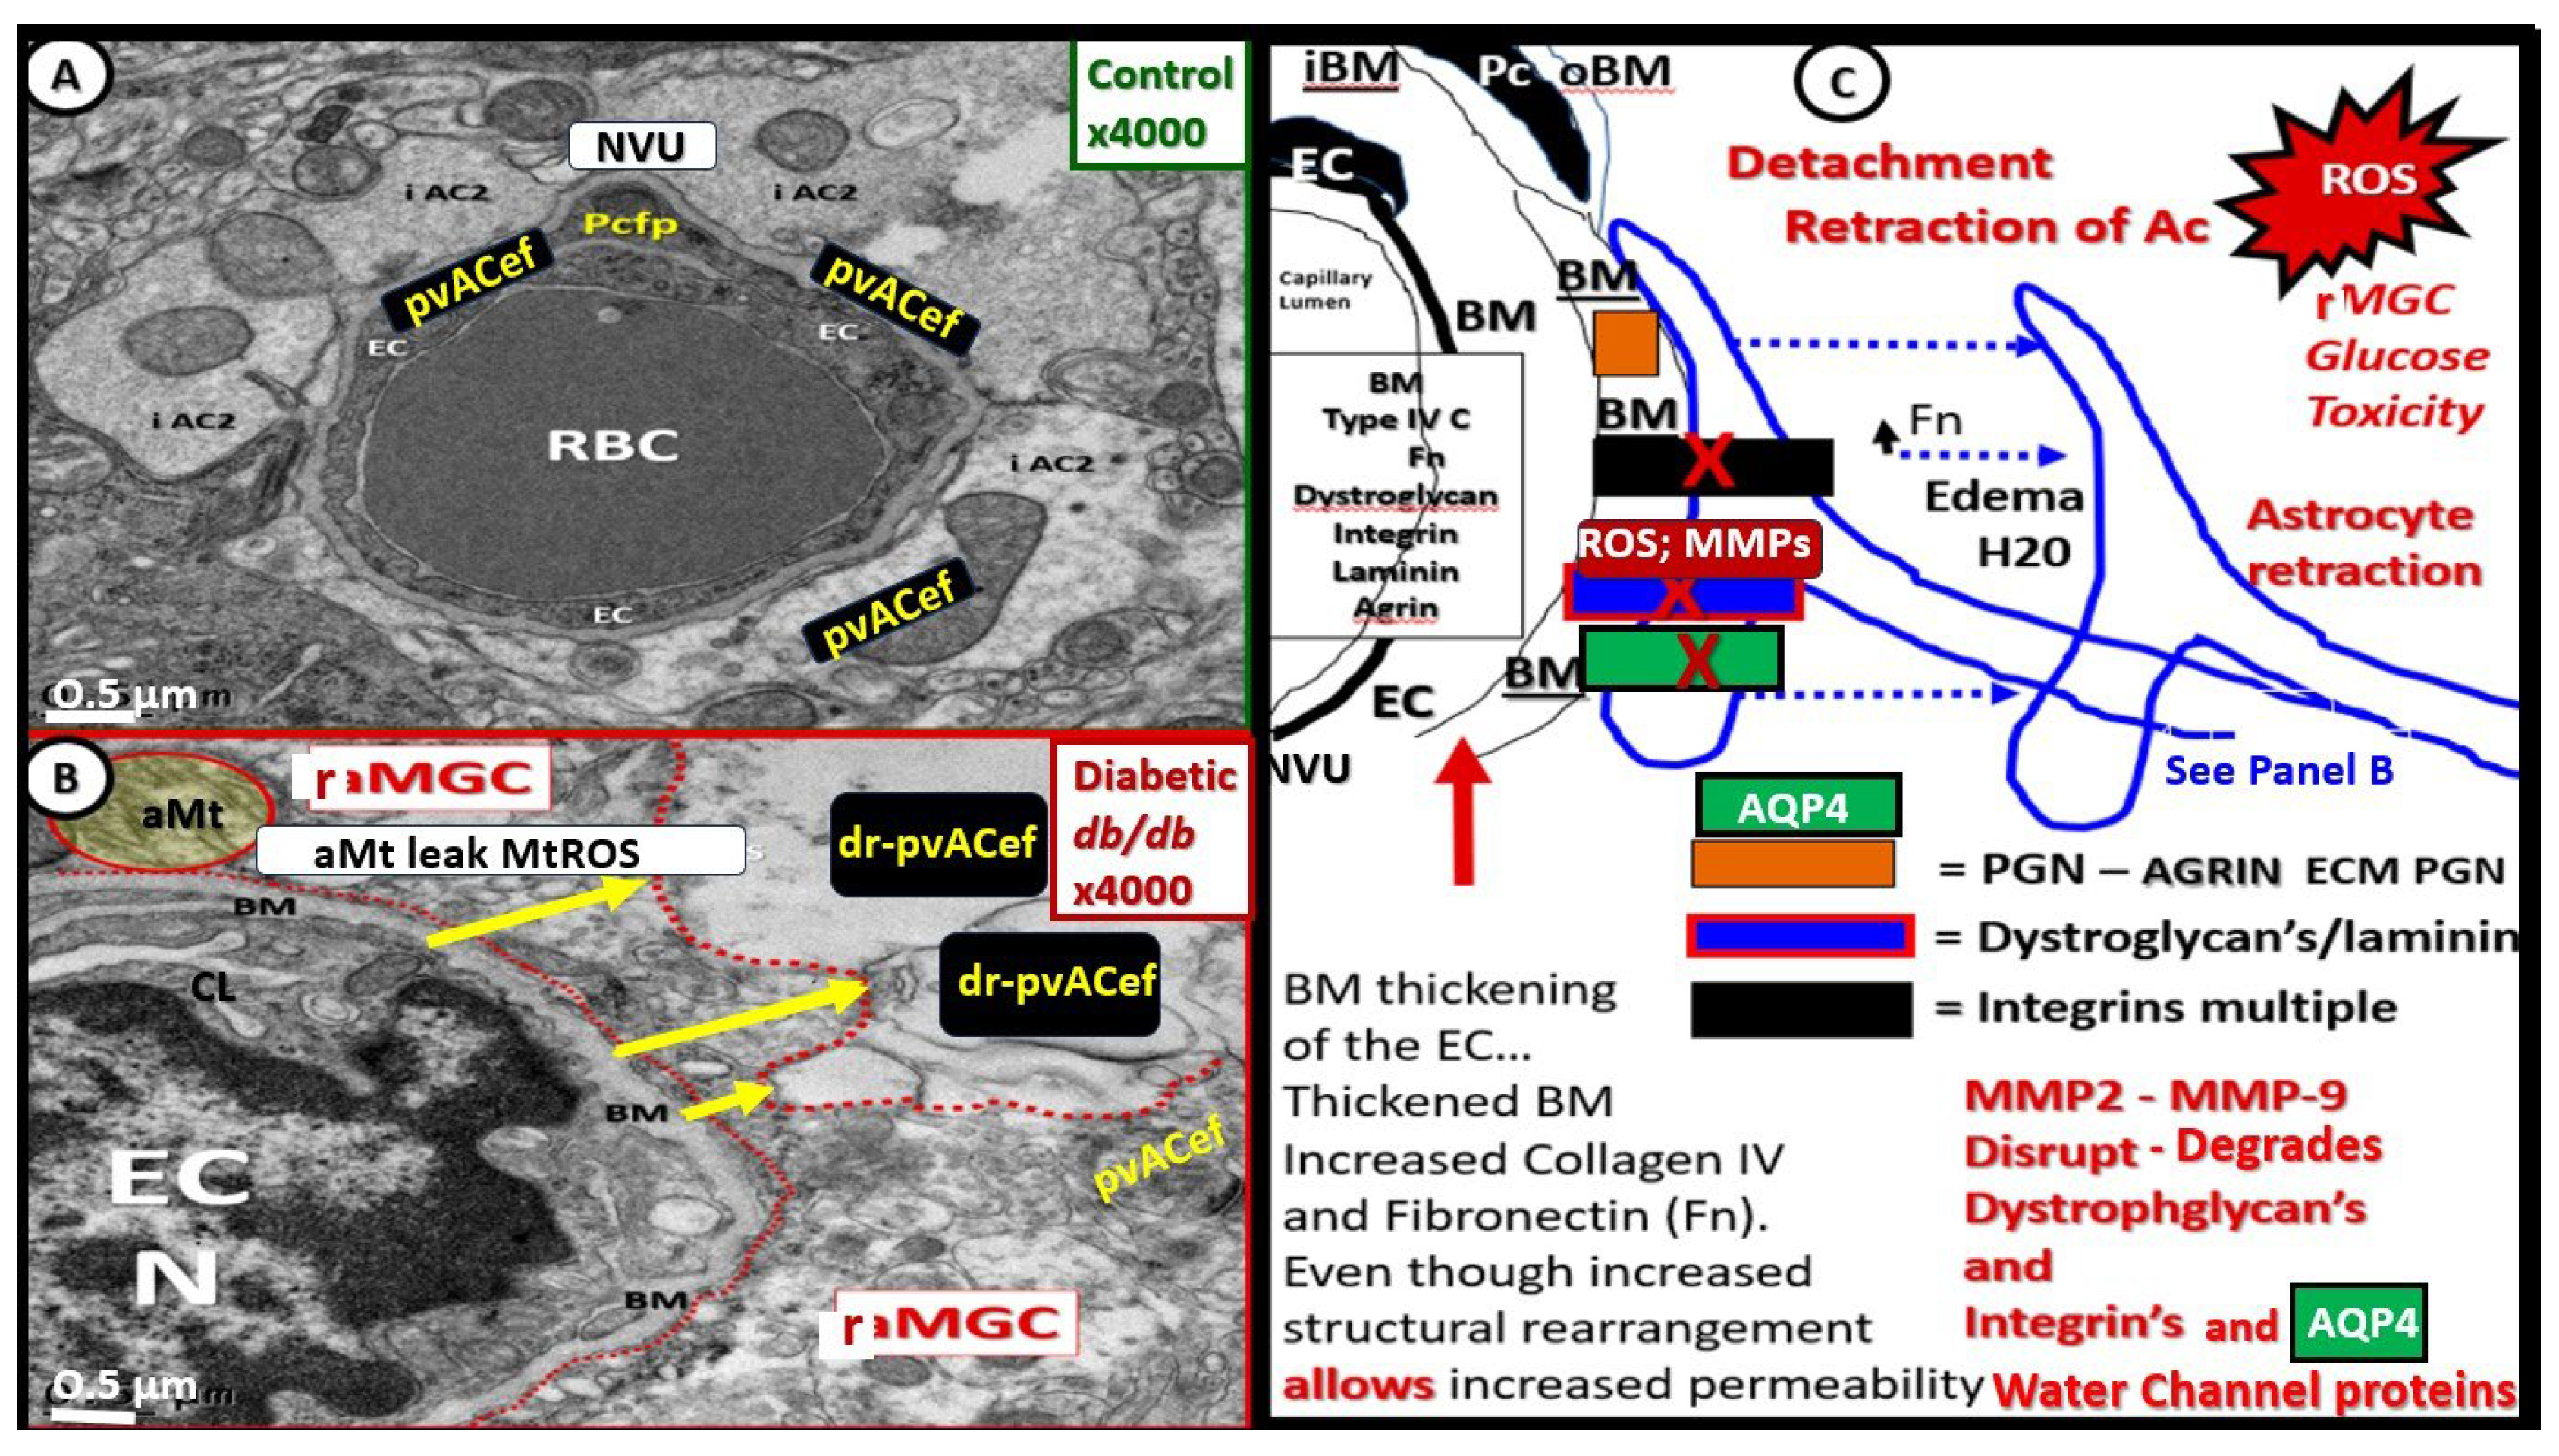
Figure 17.
Similarities and comparisons between perivascular astrocyte endfeet (pvACef) and the cradling perisynaptic astrocyte endfeet (psACef) detachment and separation. These similarities implicate damaged or dysfunctional aquaporin 4 (AQP4) either due to activated proteases such as matrix metalloproteinases (MMP-2, 9) or to loss of polarization of AQP4 from the plasma membranes (psACef) resulting in impaired synaptic transmission and impaired cognition or the timing of arrival of incoming information to disturb multiple networks of informational transfer. A and C are from 20-week-old female controls and Panels B and D are from 20-week-old female diabetic db/db models with tissues obtained from the frontal cortex, cortical layer III and depict detachment and separation of pvACef in panel B and psACef in panel D. Note that this detachment and separation creates a perivascular space (PVS) (B) and a perisynaptic space (D) that may continue to become enlarged with dysfunctional dystroglycan (dysDG) and dysfunctional aquaporin4 (dysAQP4). Note that the cyan green line denoting the glia limitans in panel B is not present in panel D. Images in A and B are reproduced courtesy CC 4.0 [7]. Scale bars = 0.5μm in (A, B) and100nm (panels D, E). BBB = blood-brain barrier; CL = capillary lumen; dys = dysfunctional; DG = dystroglycans; EC = brain endothelial cell; NVU = neurovascular unit; PcP = pericyte process; PSD = post synaptic density; TJ/AJ = tight and adherens junctions.
Figure 17.
Similarities and comparisons between perivascular astrocyte endfeet (pvACef) and the cradling perisynaptic astrocyte endfeet (psACef) detachment and separation. These similarities implicate damaged or dysfunctional aquaporin 4 (AQP4) either due to activated proteases such as matrix metalloproteinases (MMP-2, 9) or to loss of polarization of AQP4 from the plasma membranes (psACef) resulting in impaired synaptic transmission and impaired cognition or the timing of arrival of incoming information to disturb multiple networks of informational transfer. A and C are from 20-week-old female controls and Panels B and D are from 20-week-old female diabetic db/db models with tissues obtained from the frontal cortex, cortical layer III and depict detachment and separation of pvACef in panel B and psACef in panel D. Note that this detachment and separation creates a perivascular space (PVS) (B) and a perisynaptic space (D) that may continue to become enlarged with dysfunctional dystroglycan (dysDG) and dysfunctional aquaporin4 (dysAQP4). Note that the cyan green line denoting the glia limitans in panel B is not present in panel D. Images in A and B are reproduced courtesy CC 4.0 [7]. Scale bars = 0.5μm in (A, B) and100nm (panels D, E). BBB = blood-brain barrier; CL = capillary lumen; dys = dysfunctional; DG = dystroglycans; EC = brain endothelial cell; NVU = neurovascular unit; PcP = pericyte process; PSD = post synaptic density; TJ/AJ = tight and adherens junctions.
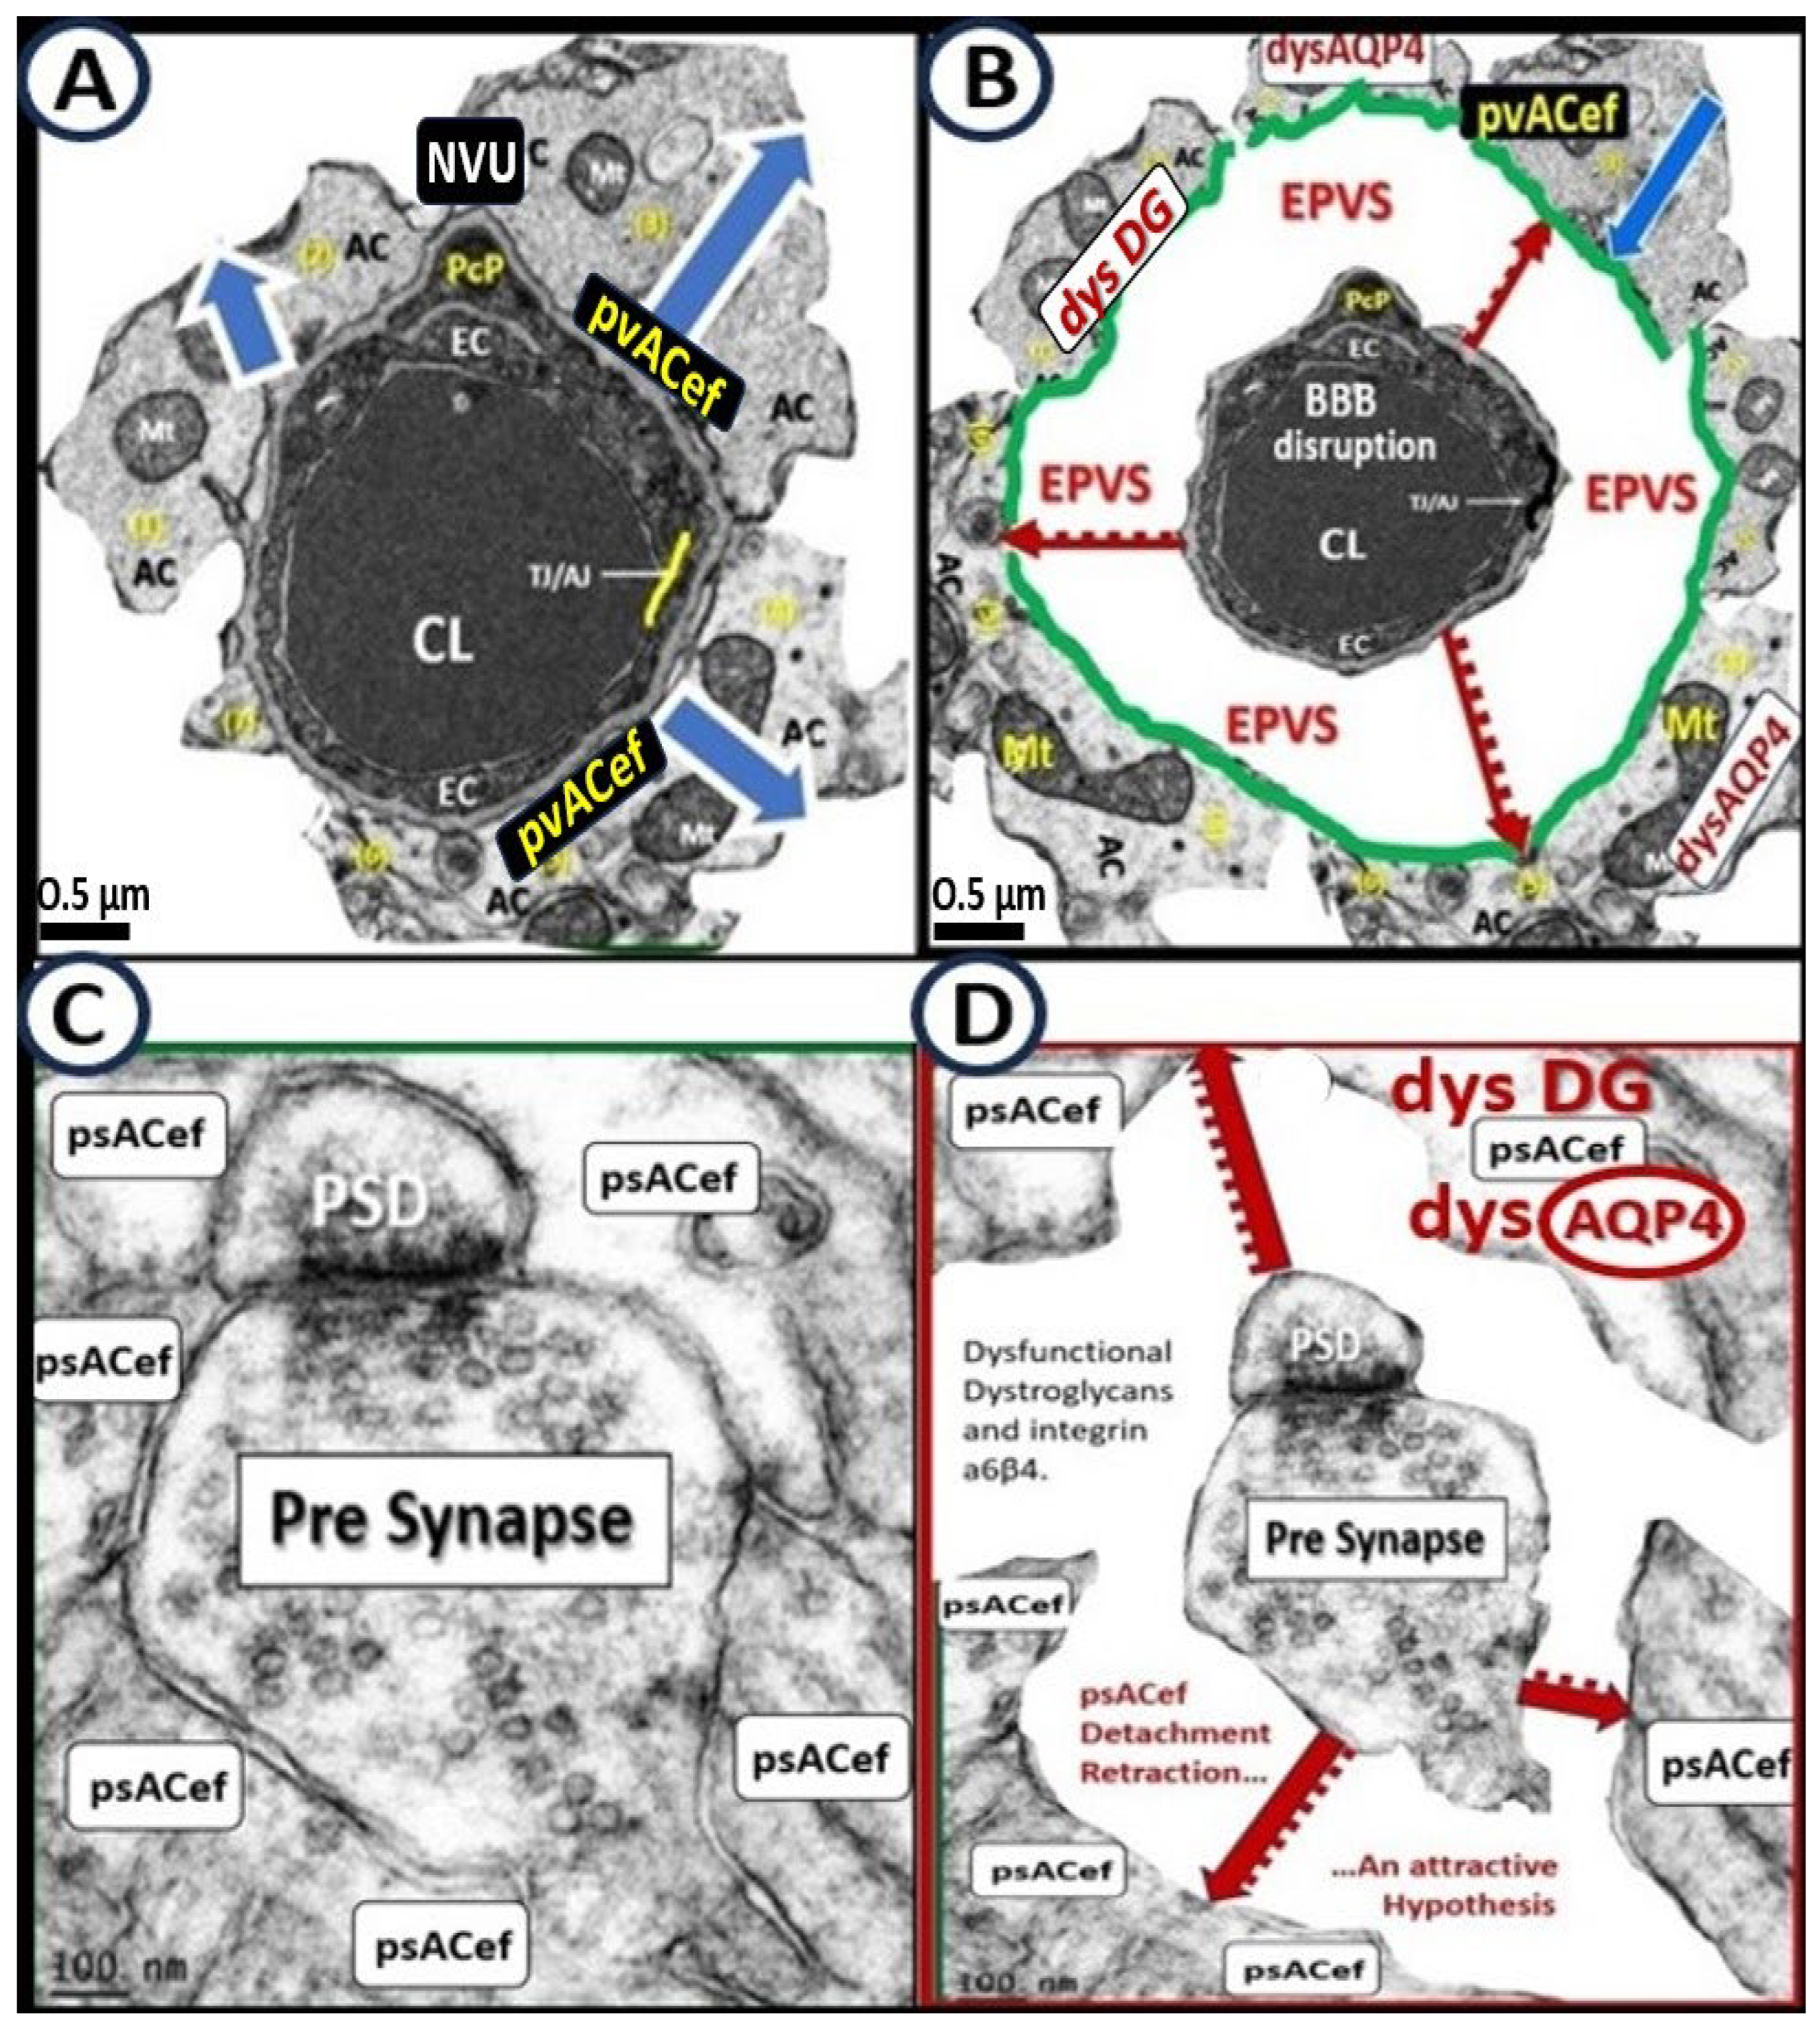
Figure 18.
Protoplasmic astrocytes are multifunctional and may be perivascular (perivascular astrocytes endfeet (pvACef)) or perisynaptic (perisynaptic astrocyte endfeet (psACef)) or both. This image illustrates a central astrocyte (AC) with its nucleus and soma with multiple protoplasmic extensions. Lower-left image illustrates a transmission electron microscopic (TEM) image of the control true capillary neurovascular unit/neuro-glial-vascular unit (NVU) with a protoplasmic extension connecting with the golden yellow pvACef. Upper-right image illustrates a perisynaptic unit (PSU) with cradling psACef with a protoplasmic AC extension connecting to the psACef that cradle the synapse. Upper-left-hand image illustrates a similar central AC connection to both a NVU and a PSU, image supplied by 4.0 [94]. Lower-right-hand image also illustrates a similar AC connective morphologic image with the central AC connecting to both a NVU and a PSU. Images upper left and lower left and right provided by CC 4.0 [9].
Figure 18.
Protoplasmic astrocytes are multifunctional and may be perivascular (perivascular astrocytes endfeet (pvACef)) or perisynaptic (perisynaptic astrocyte endfeet (psACef)) or both. This image illustrates a central astrocyte (AC) with its nucleus and soma with multiple protoplasmic extensions. Lower-left image illustrates a transmission electron microscopic (TEM) image of the control true capillary neurovascular unit/neuro-glial-vascular unit (NVU) with a protoplasmic extension connecting with the golden yellow pvACef. Upper-right image illustrates a perisynaptic unit (PSU) with cradling psACef with a protoplasmic AC extension connecting to the psACef that cradle the synapse. Upper-left-hand image illustrates a similar central AC connection to both a NVU and a PSU, image supplied by 4.0 [94]. Lower-right-hand image also illustrates a similar AC connective morphologic image with the central AC connecting to both a NVU and a PSU. Images upper left and lower left and right provided by CC 4.0 [9].
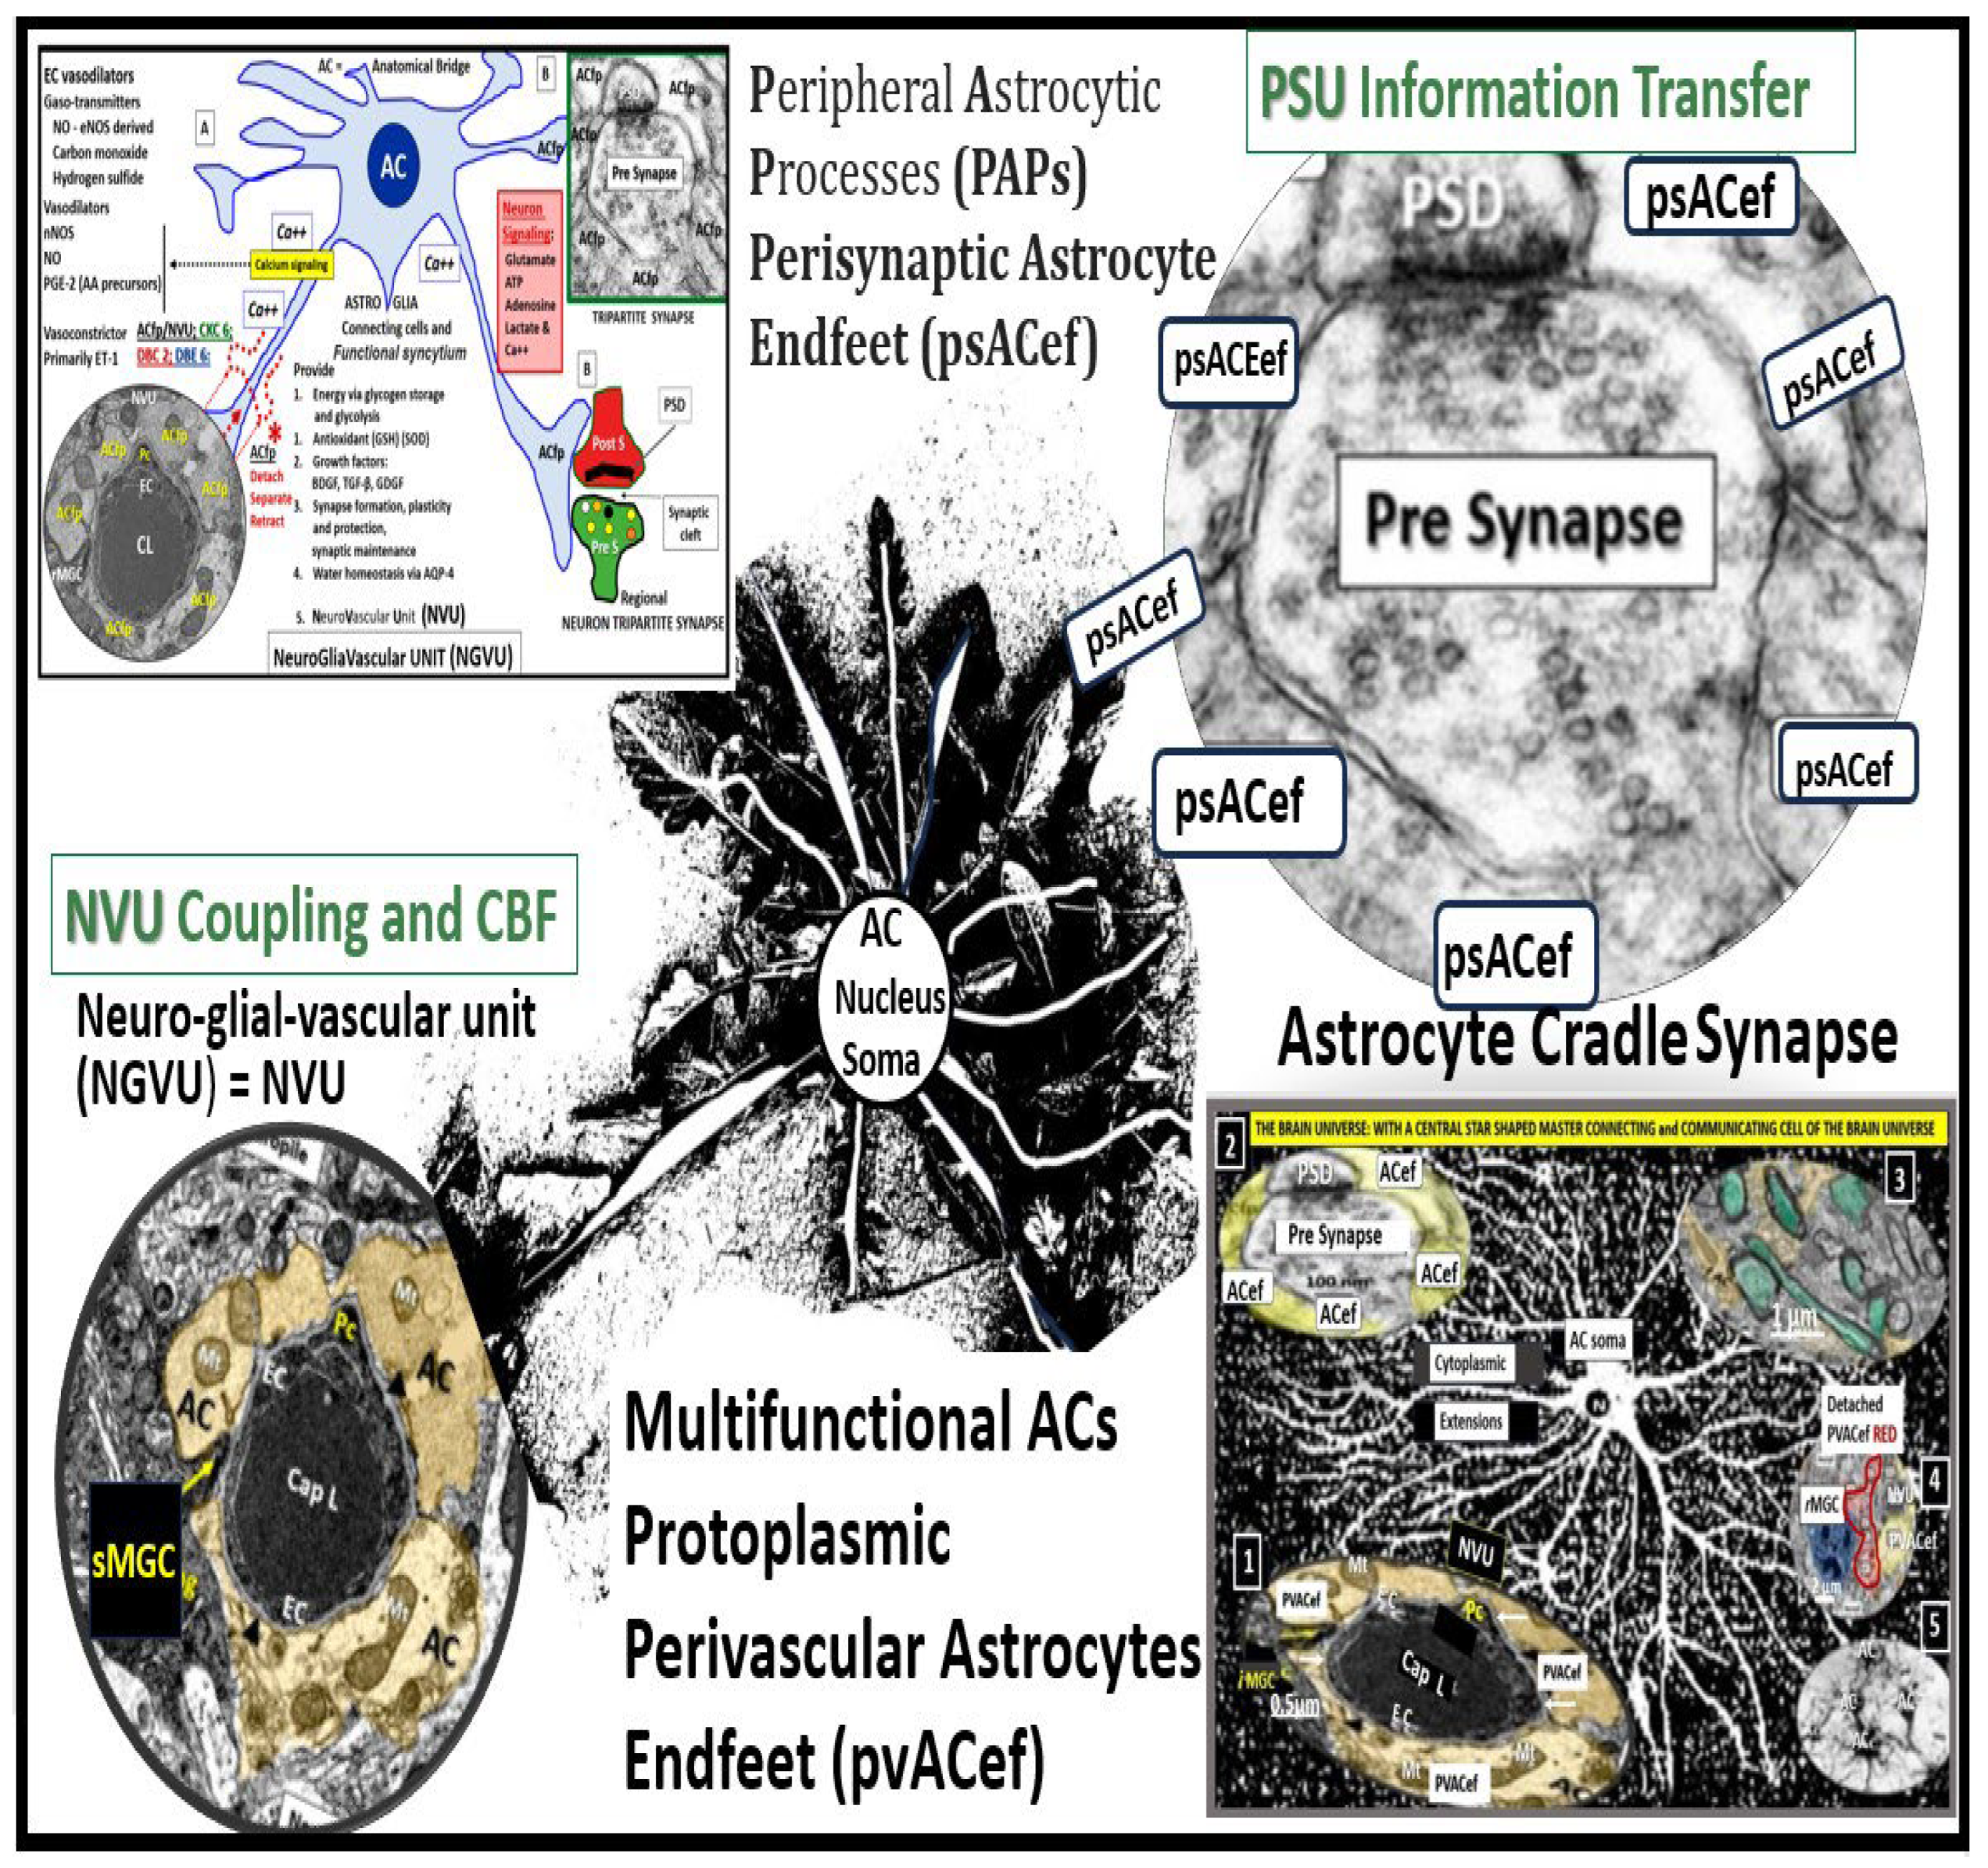
Figure 19.
Illustration comparison of a single postcapillary venule microthrombus with enlarged perivascular spaces (EPVS) of the perivascular unit (PVU) compared with a single precapillary arteriole/true capillary microthrombus. Panel A illustrates a single microvessel thrombosis in a postcapillary PVU venule that may affect between 4-5 penetrating precapillary arterioles or true capillaries and a much larger vulnerable neuronal region due to decreased cerebral blood flow and ischemia. This also, may result in increased microinfarcts, neuronal dysfunction, and even neurodegeneration as compared to the microthrombosis of a single penetrating arteriole as illustrated in panel B. Panel B illustrates that a single precapillary arteriole/true capillary microthrombosis may affect a much smaller vulnerable neuronal parenchymal regional volume as compared to a single venular microthrombosis as in panel A.
Figure 19.
Illustration comparison of a single postcapillary venule microthrombus with enlarged perivascular spaces (EPVS) of the perivascular unit (PVU) compared with a single precapillary arteriole/true capillary microthrombus. Panel A illustrates a single microvessel thrombosis in a postcapillary PVU venule that may affect between 4-5 penetrating precapillary arterioles or true capillaries and a much larger vulnerable neuronal region due to decreased cerebral blood flow and ischemia. This also, may result in increased microinfarcts, neuronal dysfunction, and even neurodegeneration as compared to the microthrombosis of a single penetrating arteriole as illustrated in panel B. Panel B illustrates that a single precapillary arteriole/true capillary microthrombosis may affect a much smaller vulnerable neuronal parenchymal regional volume as compared to a single venular microthrombosis as in panel A.
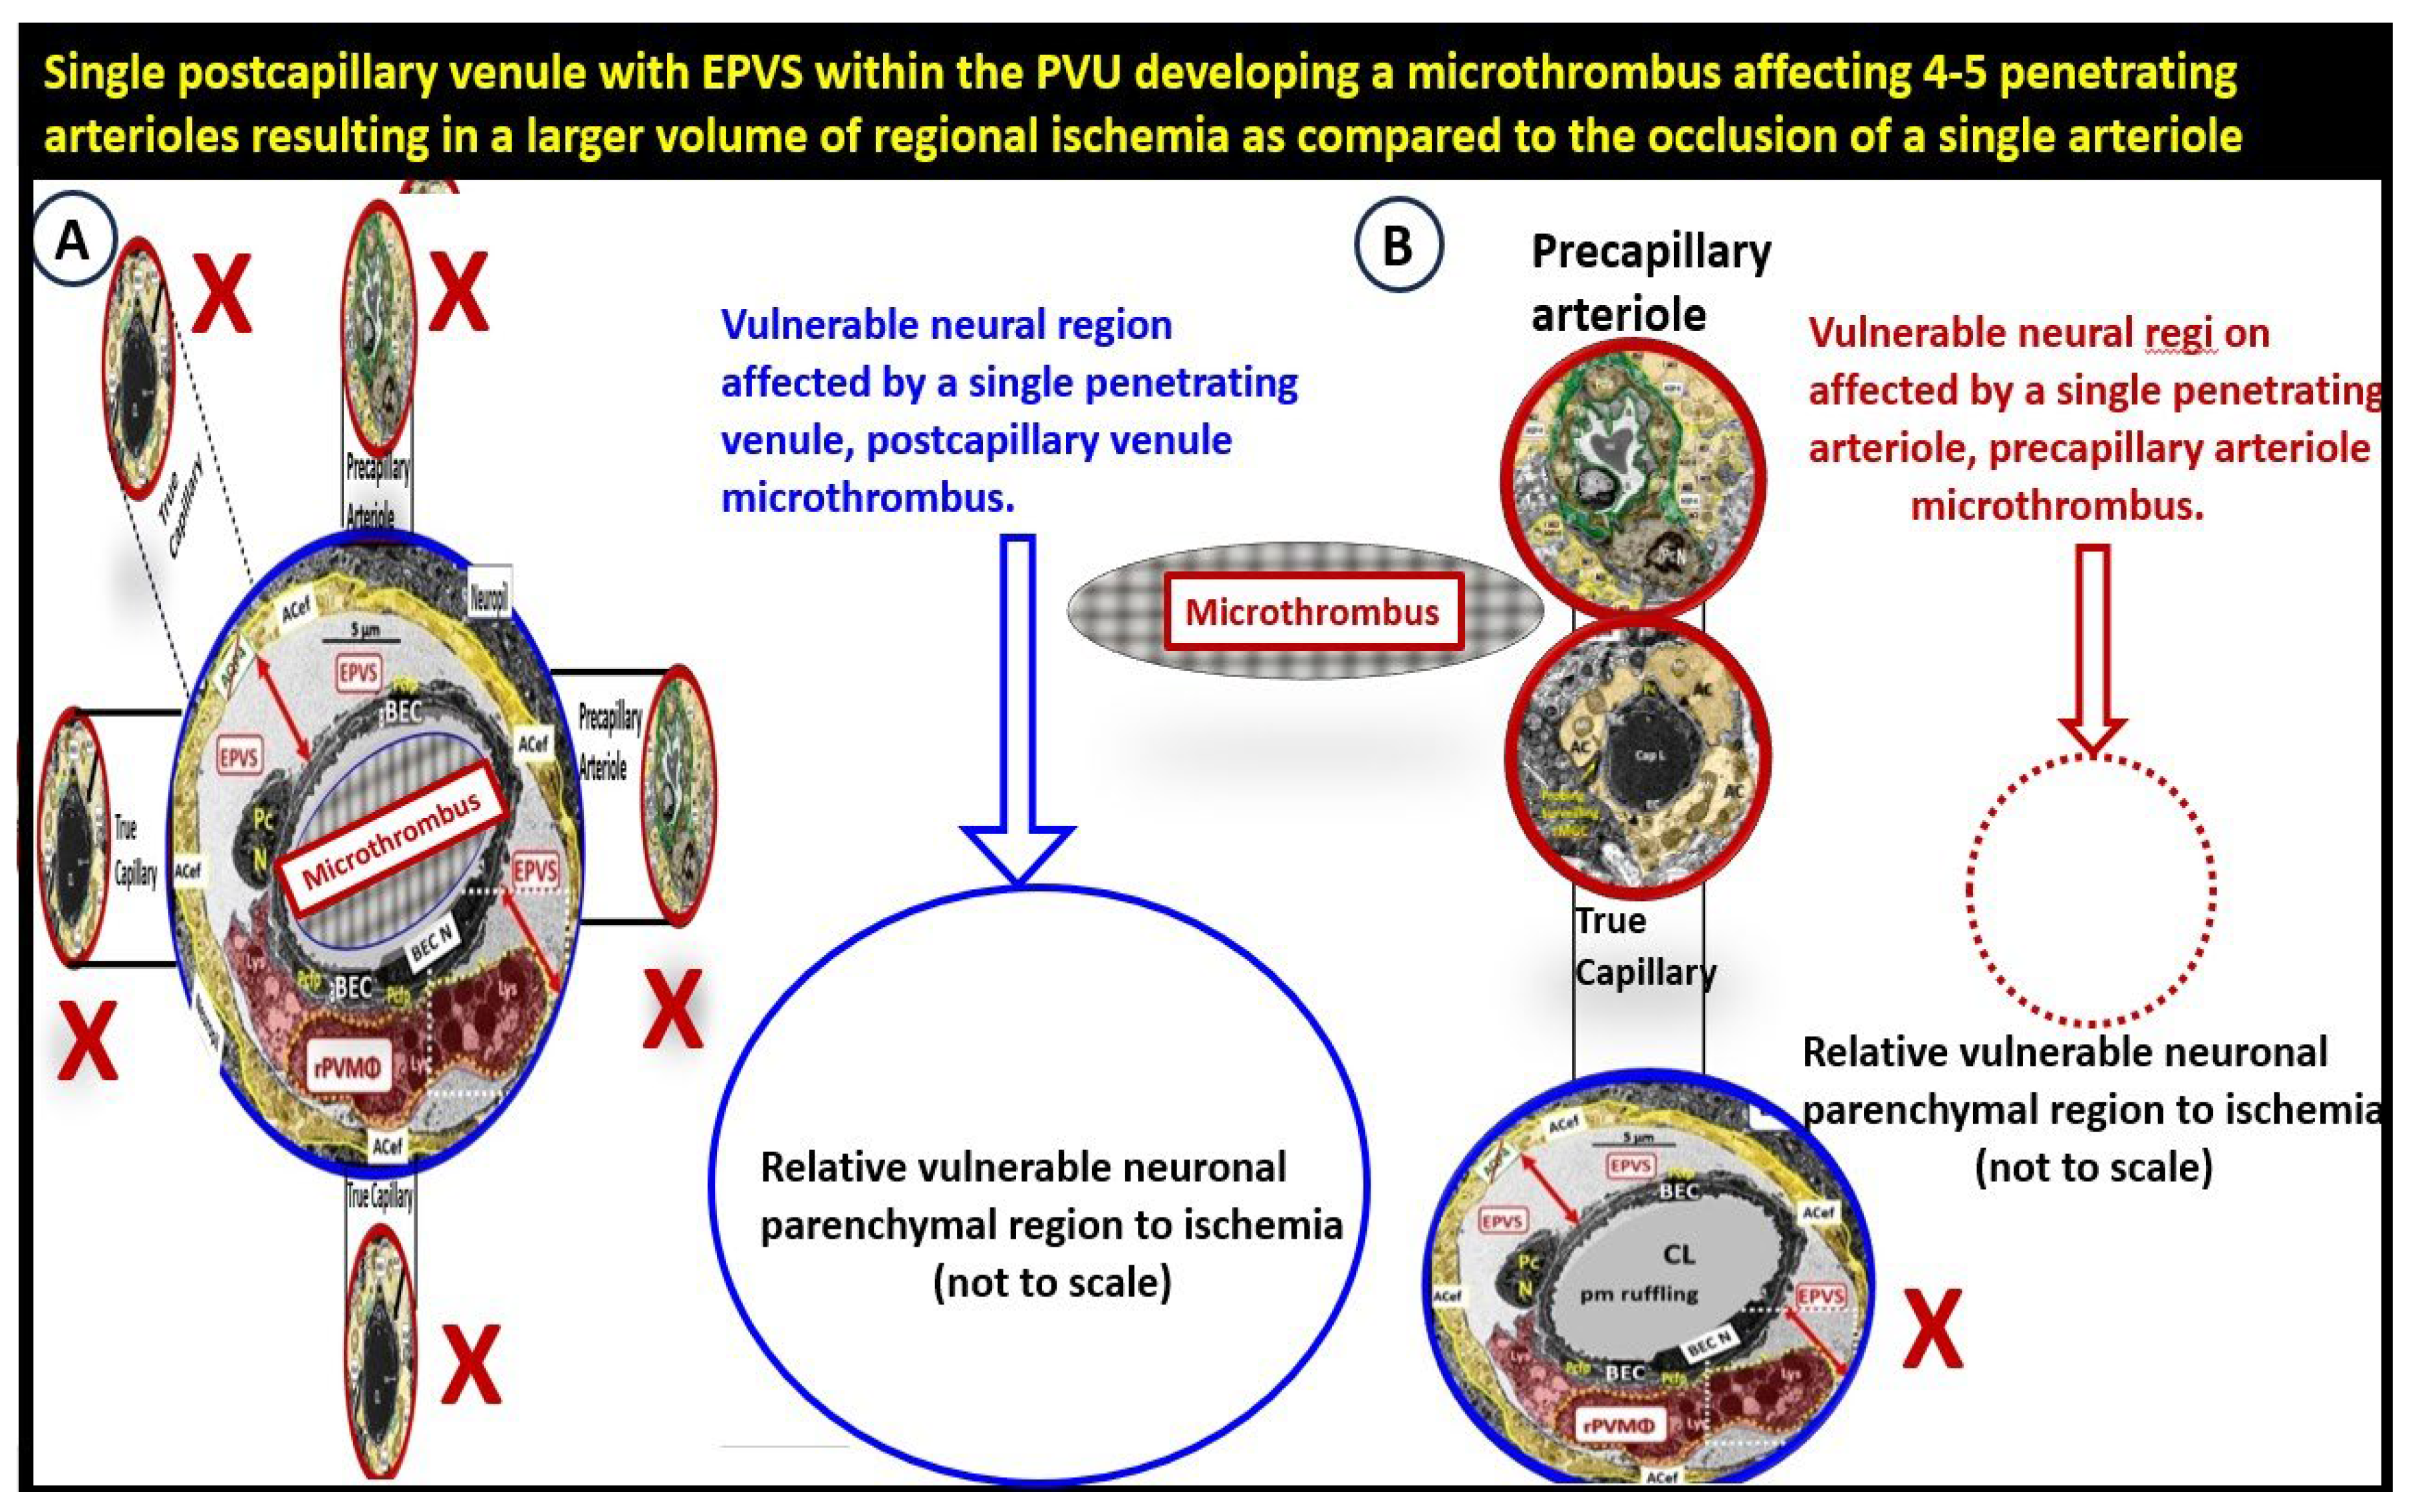

Table 1.
Similarities and differences between the neurovascular unit (NVU) and the perivascular unit (PVU) cellular composition and function. Note the more vulnerable glia limitans – pvACef basement membrane to being breeched and that the PVU has a unique proinflammatory resident PVMΦ (boxed-in red lettering). APCs = antigen presenting cells; BM = basement membrane; Pc = pericyte; pvACef = protoplasmic perivascular astrocyte endfeet; TJ/AJ = tight and adherens junctions of the blood-brain barrier.
Table 1.
Similarities and differences between the neurovascular unit (NVU) and the perivascular unit (PVU) cellular composition and function. Note the more vulnerable glia limitans – pvACef basement membrane to being breeched and that the PVU has a unique proinflammatory resident PVMΦ (boxed-in red lettering). APCs = antigen presenting cells; BM = basement membrane; Pc = pericyte; pvACef = protoplasmic perivascular astrocyte endfeet; TJ/AJ = tight and adherens junctions of the blood-brain barrier.
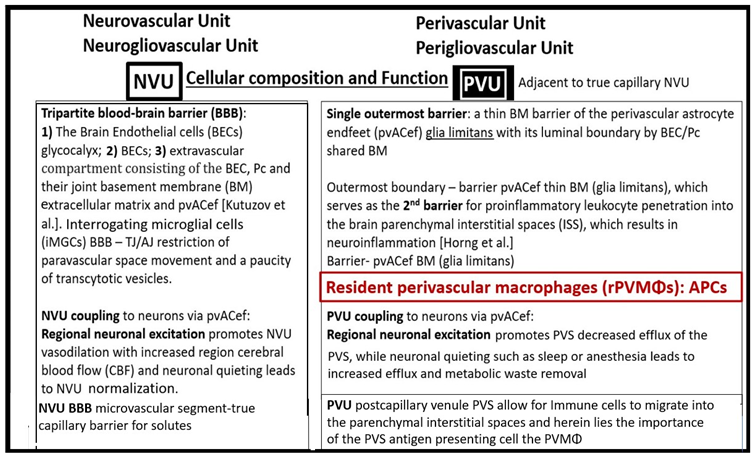 |
Table 2.
Similarities and differences between function and dysfunction of the neurovascular unit (NVU), perivascular unit (PVU), and the perisynaptic astrocyte endfeet cradle unit (psACef). Note in this table that the psACef and its relation to the tripartite synapse with its perisynaptic cradling unit (PSU) may play an important role in the synaptic transmission of information. Further, note that the NVU and PVU function in a collaborative manner to provide homeostatic neurovascular coupling.
Table 2.
Similarities and differences between function and dysfunction of the neurovascular unit (NVU), perivascular unit (PVU), and the perisynaptic astrocyte endfeet cradle unit (psACef). Note in this table that the psACef and its relation to the tripartite synapse with its perisynaptic cradling unit (PSU) may play an important role in the synaptic transmission of information. Further, note that the NVU and PVU function in a collaborative manner to provide homeostatic neurovascular coupling.
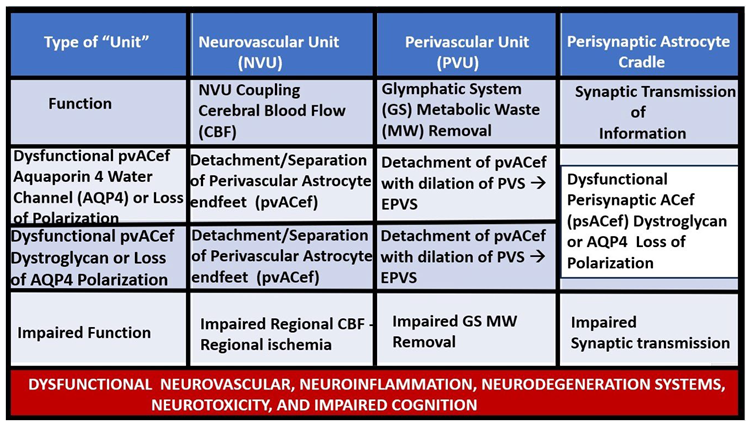 |
Disclaimer/Publisher’s Note: The statements, opinions and data contained in all publications are solely those of the individual author(s) and contributor(s) and not of MDPI and/or the editor(s). MDPI and/or the editor(s) disclaim responsibility for any injury to people or property resulting from any ideas, methods, instructions or products referred to in the content. |
© 2023 by the authors. Licensee MDPI, Basel, Switzerland. This article is an open access article distributed under the terms and conditions of the Creative Commons Attribution (CC BY) license (http://creativecommons.org/licenses/by/4.0/).
Copyright: This open access article is published under a Creative Commons CC BY 4.0 license, which permit the free download, distribution, and reuse, provided that the author and preprint are cited in any reuse.


