
Submitted:
14 December 2023
Posted:
15 December 2023
You are already at the latest version
Abstract
In the literature, the question of the amount of data necessary and sufficient to validate different models of the occurrence of risk of adverse events for patients or the classification of the presence or absence of pathological features has been repeatedly raised. In the presented study, we propose a new approach to determine the necessary and enough studies for validation of medical software based on artificial intelligence technology, whose main task is to classify medical X-rays according to the presence of normality and pathology. It is shown that for several studies in a dataset, when AUC ROC has maximum heterogeneity, it varies depending on the balance of "norm"/"pathology" classes. Thus, for a balance of "normal"/"abnormality", where 90% is "normal" and 10% is "abnormality", maximum heterogeneity is achieved for 190 studies, for a balance of 80% ("normal")/20% ("abnormality") for 80 studies, for a balance of 70% ("norm")/30% ("abnormality") - 120 trials, for a balance of 60% ("norm")/40% ("abnormality") the maximum heterogeneity is reached at 110 trials, and for a balance of 50% ("norm")/50% ("abnormality") - at 70 trials. The obtained data are in good agreement with the previous results. They allow us to determine a sufficient (necessary) number of studies in the dataset to perform an unbiased assessment of AUC ROC.
Keywords:
number of samples
; AUC ROC
; AI-technology
; X-rays according
; diagnostic radiology
; diagnostic accuracy
1. Introduction
Computer vision and artificial intelligence technologies are beginning to form a decision support system for doctors for detecting pathologies in patients. In the operation of the most computer vision systems, it is customary to distinguish several stages, in particular, image preprocessing, recognition (classification of the detected object by various categories) and the final decision by the system about a presence of the object of interest in the image [1]. Recognition of objects in the image can be assigned to AI-based software (SW) in the medical application of "norm" or "abnormality" [2].
Software based on artificial intelligence technology automates the image classification process, reducing an influence of the human factor on the object detection process (“abnormalities” in medical images). A success of using AI-based software in computer vision applications has been demonstrated in several papers [3,4,5,6,7,8]. Application of software with artificial intelligence technology based on several neural network topologies in the classification of "norm"/"abnormality" in medical X-rays images are covered in the study "Deep Residual Learning for Image Recognition" [9].
When building software with artificial intelligence technology based on neural networks, a dependence of a quality of the classification on the network depth was revealed [3]. When used in medical applications, a result of “abnormality” recognition depends on the quality of training data [8] and requires a large amount of data for pre-training neural networks.
Thus in [7], a recognition of the “abnormality” by means of neural networks trained on a large amount of data – about 100,000 X-ray images obtained from more than 30,000 patients is covered. The authors note that a quality of forecasting the “norm” or “abnormality” strongly depends on data quality on which the neural network was trained (a presence of technological defects in the image that make it difficult to recognize a target “abnormality”). In papers [3,4,5,6,7,8,9], the amount of data on which the neural network was trained exceeded 100 studies. However, the question of data amount necessary and sufficient for training is not covered, as well as the issue of balance between the “norm” and “abnormality” in training data.
The issue of data amount required for a construction and validation of prognostic models was considered on regression models of developing the disease in patients [10,11]. It is noted in [10], that a considerable amount of data is required for the correct construction of a prognostic model of the disease development (the authors used more than 1.5 million data). Whereas for the validation purposes (testing predictive ability), the models recommend a sample size of 100, 200 or more values, which coincides with the results obtained in [11]. The paper [11] notes the importance of the balance between negative outcomes (patient death) and positive outcomes (patient recovery) in a construction of the prognostic model, however, a methodology for assessing a balance required for the model validation has not been proposed. Experimental studies have been conducted to assess diagnostic accuracy on sample sizes much larger than 100 and 200 studies (more than 10000 studies) [12], but this approach cannot always be achieved in clinical practice.
Therefore, when building AI-based software, the quality, quantity, and balance of classes in the data used for training and verifying the model results (validation) are of key importance.
The proposed work considers a methodology for determining a balance of classes "norm"/"abnormality" and proposes a statistical approach to determine the data amount necessary for testing AI-based software (validation).
2. Materials and Methods
For validating the results of training AI-based software, previously approved by the Ethics Committee, and registered at ClinicalTrials (NCT04489992) study was used. Mammograms were classified by the presence of breast cancer ("abnormality") and the absence of breast cancer ("norm"). The general set contains 123,301 unique studies for the period from September 1, 2021 to December 27, 2021. The original balance of classes in the study was "norm" 89.3%/"abnormality" 10.7%. Before use, the data was pre-processed in terms of deleting patients’ personal information (anonymization). The input data were a study containing 4 images – two projections of each breast. As the results of AI-based software (ML-algorithm), a probability of the presence of pathology in the entire study was taken. The following values were used as empirical data (GT): 0 – in case of Bi-RADS [13] classes 1 or 2 diagnosed by a doctor, and 1 – in case of Bi-RADS classes 3,4,5.
A validation of neural network training results took place in several stages. At the first stage, the data were divided into two groups – norm and abnormality. From the divided data, samples were randomly formed with balances of the "norm"/"abnormality" classes, containing "abnormality" in the amount of 50%, 40%, 30%, 20%, 10%. The minimum sample size formed randomly contained 30 research results, then the data sample size increased in increments of 10, considering the preservation of the "abnormality" share.
Each data sample is transferred to AI-based software for processing. Quality metrics are calculated based on its results: AUC ROC [14,15]. All the described actions were repeated 10,000 times for all the studied balances of "norm"/"abnormality". Based on the results of AUC ROC calculations, mean values were calculated for different random data series with the same balances. Figure 1 shows a block diagram of the described algorithm.
Mean AUC ROC values were subjected to two types of analysis:
- Fourier analysis of the AUC ROC values depending on the amount of data presented to the pre-trained neural network.
- Analysis of the nature of statistical distribution of AUC ROC values, followed by a calculation of the coefficient of variation for the established distribution.
Analysis of the distribution nature was carried out based on a comparison of the minimum of the Akaike [16] and Bayes [17] criteria for a proximity of 10 theoretical distributions to the actual AUC ROC distribution:
- Normal:
where sd is the mean square deviation of the AUC; μ is the mathematical expectation of the AUC distribution.
- 2.
- Logarithmically normal:
- 3.
- Exponential:
where λ= 1/μ is the inverse of the mathematical expectation.
- 4.
- Poisson:
where k is the number of events (studies).
- 5.
- Cauchy:
where s is the scale factor; x0 is the shift factor.
- 6.
- Gamma:
- 7.
- Logistic:
- 8.
- Binomial:
Where n – all number of studies; k - number of studies with AUC data;p - probability of a given AUC value;
- 9.
- Geometric:
- 10.
- Weibull:
Where a is the shape factor of the Weibull distribution; b is the scale factor of the Weibull distribution.
The entire calculation of quality metrics and a formation of subsamples from the general population was carried out in Python, version 3.6. Fourier analysis and analysis of distributions was carried out on software implemented in the R language.
3. Results and Discussion
Figure 2 shows the results of calculating the AUC ROC quality metric for the studied AI-based software.
A preliminary analysis of the behavior of AUC ROC values shows a presence of the periodic dependence of a mean value on the sample size. For "norm"/"abnormality" balances with the "abnormality" share of 10%, 20% (Figure 2a and 2b), a downward trend is observed from 30 to 5,000 studies (yellow line), and an upward trend in the dependence of AUC ROC values on the number of studies for the balance with 40% "abnormality" share (Figure 2d). Further, this trend changes to a linear one. A completely linear trend in the dependence of AUC ROC on the number of studies is observed for balances with a proportion of “abnormality” of 30% and 50% (Figure 2c and 2e). It should be noted that the nature of fluctuations in AUC ROC values depending on the number of studies is very similar to the behavior of noise of various electromagnetic signals, and it has a periodical nature. In the most general form, the dependence of AUC on the number of trials can be represented as:
Where F(n) - some periodic function depending on the number of trials.
If the function F(n) is continuous and integrable over the whole range of changes in the number of trials, then we can define the spectral density as:
Where F(n) – function eq. (11); n – number of samples; N - total number of studies; γ - spectral function argument:
Where Re() - the real part of the spectral function; Im() - Imaginary part of the spectral function.
Given the results presented in Figure 2 and equations (12) and (13), a Fourier analysis of the mean AUC ROC values was performed to identify features in the AUC ROC behavior. The results of calculating the argument (13) of the spectral function (12) depending on the number of trials obtained by Fourier analysis are presented in Figure 3.
In Figure 3, for all balances, two main patterns of behavior of the main maxima and minima of the argument of the AUC ROC spectral function can be distinguished. The exception is a behavior of the maxima of the argument of AUC ROC spectral function of the balance of "norm"/"abnormality" classes with 10% "abnormality" share. The values of the main maxima and minima of the AUC ROC spectral function argument were further analyses for the presence of symmetry [16] of the species:
Where - symmetry point of the spectral function argument.
Figure 4 shows the dependence of the number of samples corresponding to the major maxima and minima of the AUC ROC argument function on the proportion of "abnormality" in the balance of the "normal"/"abnormality" classes.
The blue line in Figure 4 indicates the midpoint of the interval between the first maxima and minima of the argument of the AUC ROC spectral functions. For all considered fractions of "abnormality" in the balance of "normal"/"abnormality" classes, the middle of the interval corresponds to the value of 11940 studies. The resulting value is the nT transition point.
To find the maximum deviation from the trend line (Figure 2) of the average diagnostic accuracy metric to the left and right of the transition point (11940 studies), we determine the closest type of simple distribution (Equations 1 - 10). The closest type of simple distribution is determined by the minimum of the Akaike and Bayesian information criteria. Table 1 shows the results of comparing the distribution of AUC ROC values on the left and right of the transition point.
From the results of the analysis of the behavior of the argument of the AUC ROC spectral function and the analysis of the nearest theoretical distribution, it follows that up to the transition point (11940 trials) the same type of distribution, the Cauchy distribution, is maintained. After the transition point (11940 studies), the type of distribution changes. Normal distribution is observed at 10% and 20% " abnormality", logistic distribution at 30% and 50% " abnormality", and log-normal distribution of AUC ROC values at 40% "abnormality ".
To assess the uniformity of AUC ROC values, analysis of the coefficient of variation depending on the number of studies (up to 11940 studies) was undertaken. In the case of the Cauchy distribution, the coefficient of variation was calculated by the equation:
where γ – scale parameter in Cauchy distribution; x0 – shift parameter in Cauchy distribution.
Figure 5 shows results of calculating a dependence of the coefficient of variation of the distribution of AUC ROC values on the number of studies for five “abnormality” shares in the balance of “norm”/ “abnormality” classes.
A maximum value of the coefficient of variation of AUC ROC values for 10% “abnormality” share is achieved at the number of studies equal to 190; for the 20% share, it is 80 studies; for the 30% share – 120 studies, for the 40% share – 110 studies, and for the 50% share – 70 studies. Thus, the maximum deviation of AUC ROC values from the general average is observed in the balance of “norm”/ “abnormality” classes with 10% “abnormality” share and with the number of studies equal to 190.
The application of the Fourier transforms to fluctuations in AUC ROC values allowed identifying several studies, which is a kind of border between two types of statistical distributions. This limit corresponds to the value of 11940 studies. When using less or equal number of studies for validation of AI-based software, the AUC ROC values for all studied “abnormality” shares in the balance of “norm”/ “abnormality” classes are distributed according to the laws close to the Cauchy distribution. And if the number of studies was above this value, the AUC ROC have a normal distribution for 10% and 20% "abnormality" shares, a logistic – for 30% and 50% "abnormality" shares, and a logarithmically normal – for 40% "abnormality" share.
To assess a uniformity of AUC ROC values depending on the number of studies, an analysis of the coefficient of variation of Cauchy distribution was carried out which showed that the most heterogeneous AUC ROC values were observed at 10% “abnormality” share in the balance of “norm”/ “abnormality” classes and the number of studies equal to 190.
The developed approach of determining the number of studies required for validation can be implemented in the software monitoring system based on artificial intelligence technology [19].
5. Conclusions
Summarizing the conducted study results, it can be concluded that when testing AI-based software, it is necessary to consider that the number of studies reflecting the greatest heterogeneity of AUC ROC values (the largest deviation from the mean value) is different for various class balances. If the purpose of validation is to establish the worst-case behavior of AUC ROC values, then for the studied AI-based software, the "abnormality" share should be 10%, and the number of studies 190. If the validation is carried out under conditions of a limited amount of data, then the "abnormality" share should be 50% and the number of studies equal to 70. In this case, there will be a maximum deviation from the mean AUC ROC value for the studied AI-based software. It should also be noted that the deviation of the average value of AUC ROC from the trend line with increasing number of studies decreases, which indicates that when using software based on artificial intelligence technology in clinical practice will demonstrate metrics of diagnostic accuracy different from the diagnostic accuracy obtained in pre-testing, for this reason at the stage of pre-testing and validation of software based on artificial intelligence systems it is necessary to determine the maximum limits of change of diagnostic accuracy metrics.
Author Contributions
Conceptualization, Y.V. and A.V..; methodology, N.N.; software, N.N.; validation, T.B. and S.C.; formal analysis, T.B.; investigation, K.A.; resources, O.O.; data curation, T.B.; writing—original draft preparation, N.N.; writing—review and editing, T.B.; visualization, N.N.; supervision, K.A.; project administration, A.V.; funding acquisition, O.O. All authors have read and agreed to the published version of the manuscript.
Funding
This paper was prepared by a group of authors as a part of the research and development effort titled "Development of a platform to generate data sets containing diagnostic imaging studies" (USIS No.: 123031500003-8) in accordance with the Order No. 1196 dated December 21, 2022 "On approval of state assignments funded by means of allocations from the budget of the city of Moscow to the state budgetary (autonomous) institutions subordinate to the Moscow Health Care Department, for 2023 and the planned period of 2024 and 2025" issued by the Moscow Health Care Department.
Institutional Review Board Statement
The study was conducted in accordance with the Declaration of Helsinki, and approved by the Independent Ethics Committee of MRO RORR (protocol code 2/2020 and date of approval 20 February 2020). Clinical trial: NCT04489992.
Informed Consent Statement
Not applicable.
Data Availability Statement
The data presented in this study are available upon request from the corresponding author. The datasets are not publicly available.
Acknowledgments
The authors of this publication would like to thank Celsus (LLC “Medical Screening Systems”) for the opportunity to conduct research on their software with artificial intelligence technology.
Conflicts of Interest
The authors declare no conflict of interest.
Study limitations
The conducted studies were limited to one version of AI-based software and the “abnormality” share up to 50%. Further studies will be carried out a similar analysis for the full balance of classes with a share of "abnormality" from 0 to 100% in 10% increments and more versions of AI-based software to identify a more general pattern.
References
- Chervyakov, N. I.; Lyakhov, P. A.; Deryabin, M. A.; Nagornov, N. N.; Valueva, M. V.; Valuev, G. V. (2020). "Residue Number System-Based Solution for Reducing the Hardware Cost of a Convolutional Neural Network". Neurocomputing. 407: 439–453. [CrossRef]
- Russakovsky, Olga; Deng, Jia; Su, Hao; Krause, Jonathan; Satheesh, Sanjeev; Ma, Sean; Huang, Zhiheng; Karpathy, Andrej; Khosla, Aditya; Bernstein, Michael; Berg, Alexander C. (December 2015). "ImageNet Large Scale Visual Recognition Challenge". International Journal of Computer Vision. 115 (3): 211–252.
- Christian Szegedy, Wei Liu, Yangqing Jia, Pierre Sermanet, Scott Reed, Dragomir Anguelov, Dumitru Erhan, Vincent Vanhoucke, Andrew Rabinovich. Going Deeper with Convolutions // Computer Vision Foundation, 2015. https://www.cv-foundation.org/openaccess/content_cvpr_2015/papers/Szegedy_Going_Deeper_With_2015_CVPR_paper.pdf.
- Alex Krizhevsky, Ilya Sutskever, Geoffrey E. Hinton. ImageNet Classification with Deep Convolutional Neural Networks. // Advances in Neural Information Processing Systems, 2012 V. 25. ISBN: 9781627480031 https://proceedings.neurips.cc/paper/2012/file/c399862d3b9d6b76c8436e924a68c45b-Paper.pdf.
- Bhagirathi Halalli and Aziz Makandar. Computer Aided Diagnosis - Medical Image Analysis Techniques // World's largest Science, Technology & Medicine. Open Access book publisher. 2018, V. 5, pp. 85-109. [CrossRef]
- Ramprasaath, R. Selvaraju, Michael Cogswell, Abhishek Das, Ramakrishna Vedantam, Devi Parikh, Dhruv Batra. Grad-CAM: Visual Explanations from Deep Networks via Gradient-based Localization//Dida Machine Learning, 2019, pp.1-23. arXiv:1610.02391v4 [cs.CV] 3 Dec 2019.
- Ivo, M. Baltruschat, Hannes Nickisch, MichaelGrass, Tobias Knopp, Axel Saalbach. Comparison of Deep Learning Approaches for Multi-Label Chest X-Ray Classifcation//Scientific reports. 2019, 9:6381. [CrossRef]
- Assessment of maturity of artificial intelligence technologies for healthcare: methodological recommendations. - Moscow: Scientific and Practical Clinical Centre of Diagnostics and Telemedicine Technologies of the Moscow City Health Department, 2023. - 28 с.
- Kaiming He, Xiangyu Zhang, Shaoqing Ren, Jian Sun. Deep Residual Learning for Image Recognition arXiv:1512.03385v1 [cs.CV] 10 Dec 2015.
- Richard, D. Riley, Thomas P. A. Debray, Gary S. Collins, Lucinda Archer, Joie Ensor, Maarten van Smeden, Kym I. E. Snell. Minimum sample size for external validation of a clinical prediction model with a binary outcome// Statistics in Medicine, 2021. V. 40, Issue 19, pp.4230-4251.
- Frank, E. Harrell Jr., Kerry L. Lee and Daniel B. Mark. Multivariable prognostic models: Issues in developing models, evaluating assumptions and adequacy, and measuring and reducing errors.// Statistics in Medicine, 1996. V. 15, pp. 361-387.
- "Description and interpretation of mammographic study data using artificial intelligence" / Yu. A. Vasiliev, A. V. Vladzimirsky, K. M. Arzamasov [et al.] // Healthcare Manager. - 2023. - № 8. - С. 54-67. -. [CrossRef]
- Breast Imaging Reporting & Data System / American College of Radiology [Internet]. [cited 2023 Apr 8]. Available from: https://www.acr.org/Clinical-Resources/Reporting-and-Data-Systems/Bi-Rads.
- M H Zweig, G Campbell, Receiver-operating characteristic (ROC) plots: a fundamental evaluation tool in clinical medicine, Clinical Chemistry, Volume 39, Issue 4, 1 April 1993, Pages 561–577. [CrossRef]
- Fawcett, Tom (2006); An introduction to ROC analysis, Pattern Recognition Letters, 27, 861—874.
- H. Akaike, in Applications of Statistics, edited by P. R. Krishnaiah North-Holland, Amsterdam, 1977, p. 27; Y. Sakamoto, M. Ishiguro, and G. Kitagawa, Akaike Information Criterion Statistics Reidel, Dordrecht, 1983.
- Sakamoto, Yosiyuki, Makio Ishiguro, and Genshiro Kitagawa. "Akaike information criterion statistics." Dordrecht, The Netherlands: D. Reidel 81.10.5555 (1986): 26853.
- Kashyap, Anil, ed. Dynamic stochastic models from empirical data. Academic Press, 1976.
- Certificate of State Registration of Computer Programme No. 2023665713 Russian Federation. Web platform for technological and clinical monitoring of the results of algorithms for analysing digital medical images : No. 2023664691 : applied. 11.07.2023 : publ. 19.07.2023 / Yu. A. Vasiliev, A. V. Vladzimirskiy, O. V. Omelyanskaya [and others] ; applicant State Budgetary Institution of Health Care of Moscow "Scientific and Practical Clinical Centre of Diagnostics and Telemedicine Technologies of the Department of Health Care of Moscow".
Figure 1.
Block diagram of the algorithm for calculating the diagnostic accuracy metric.
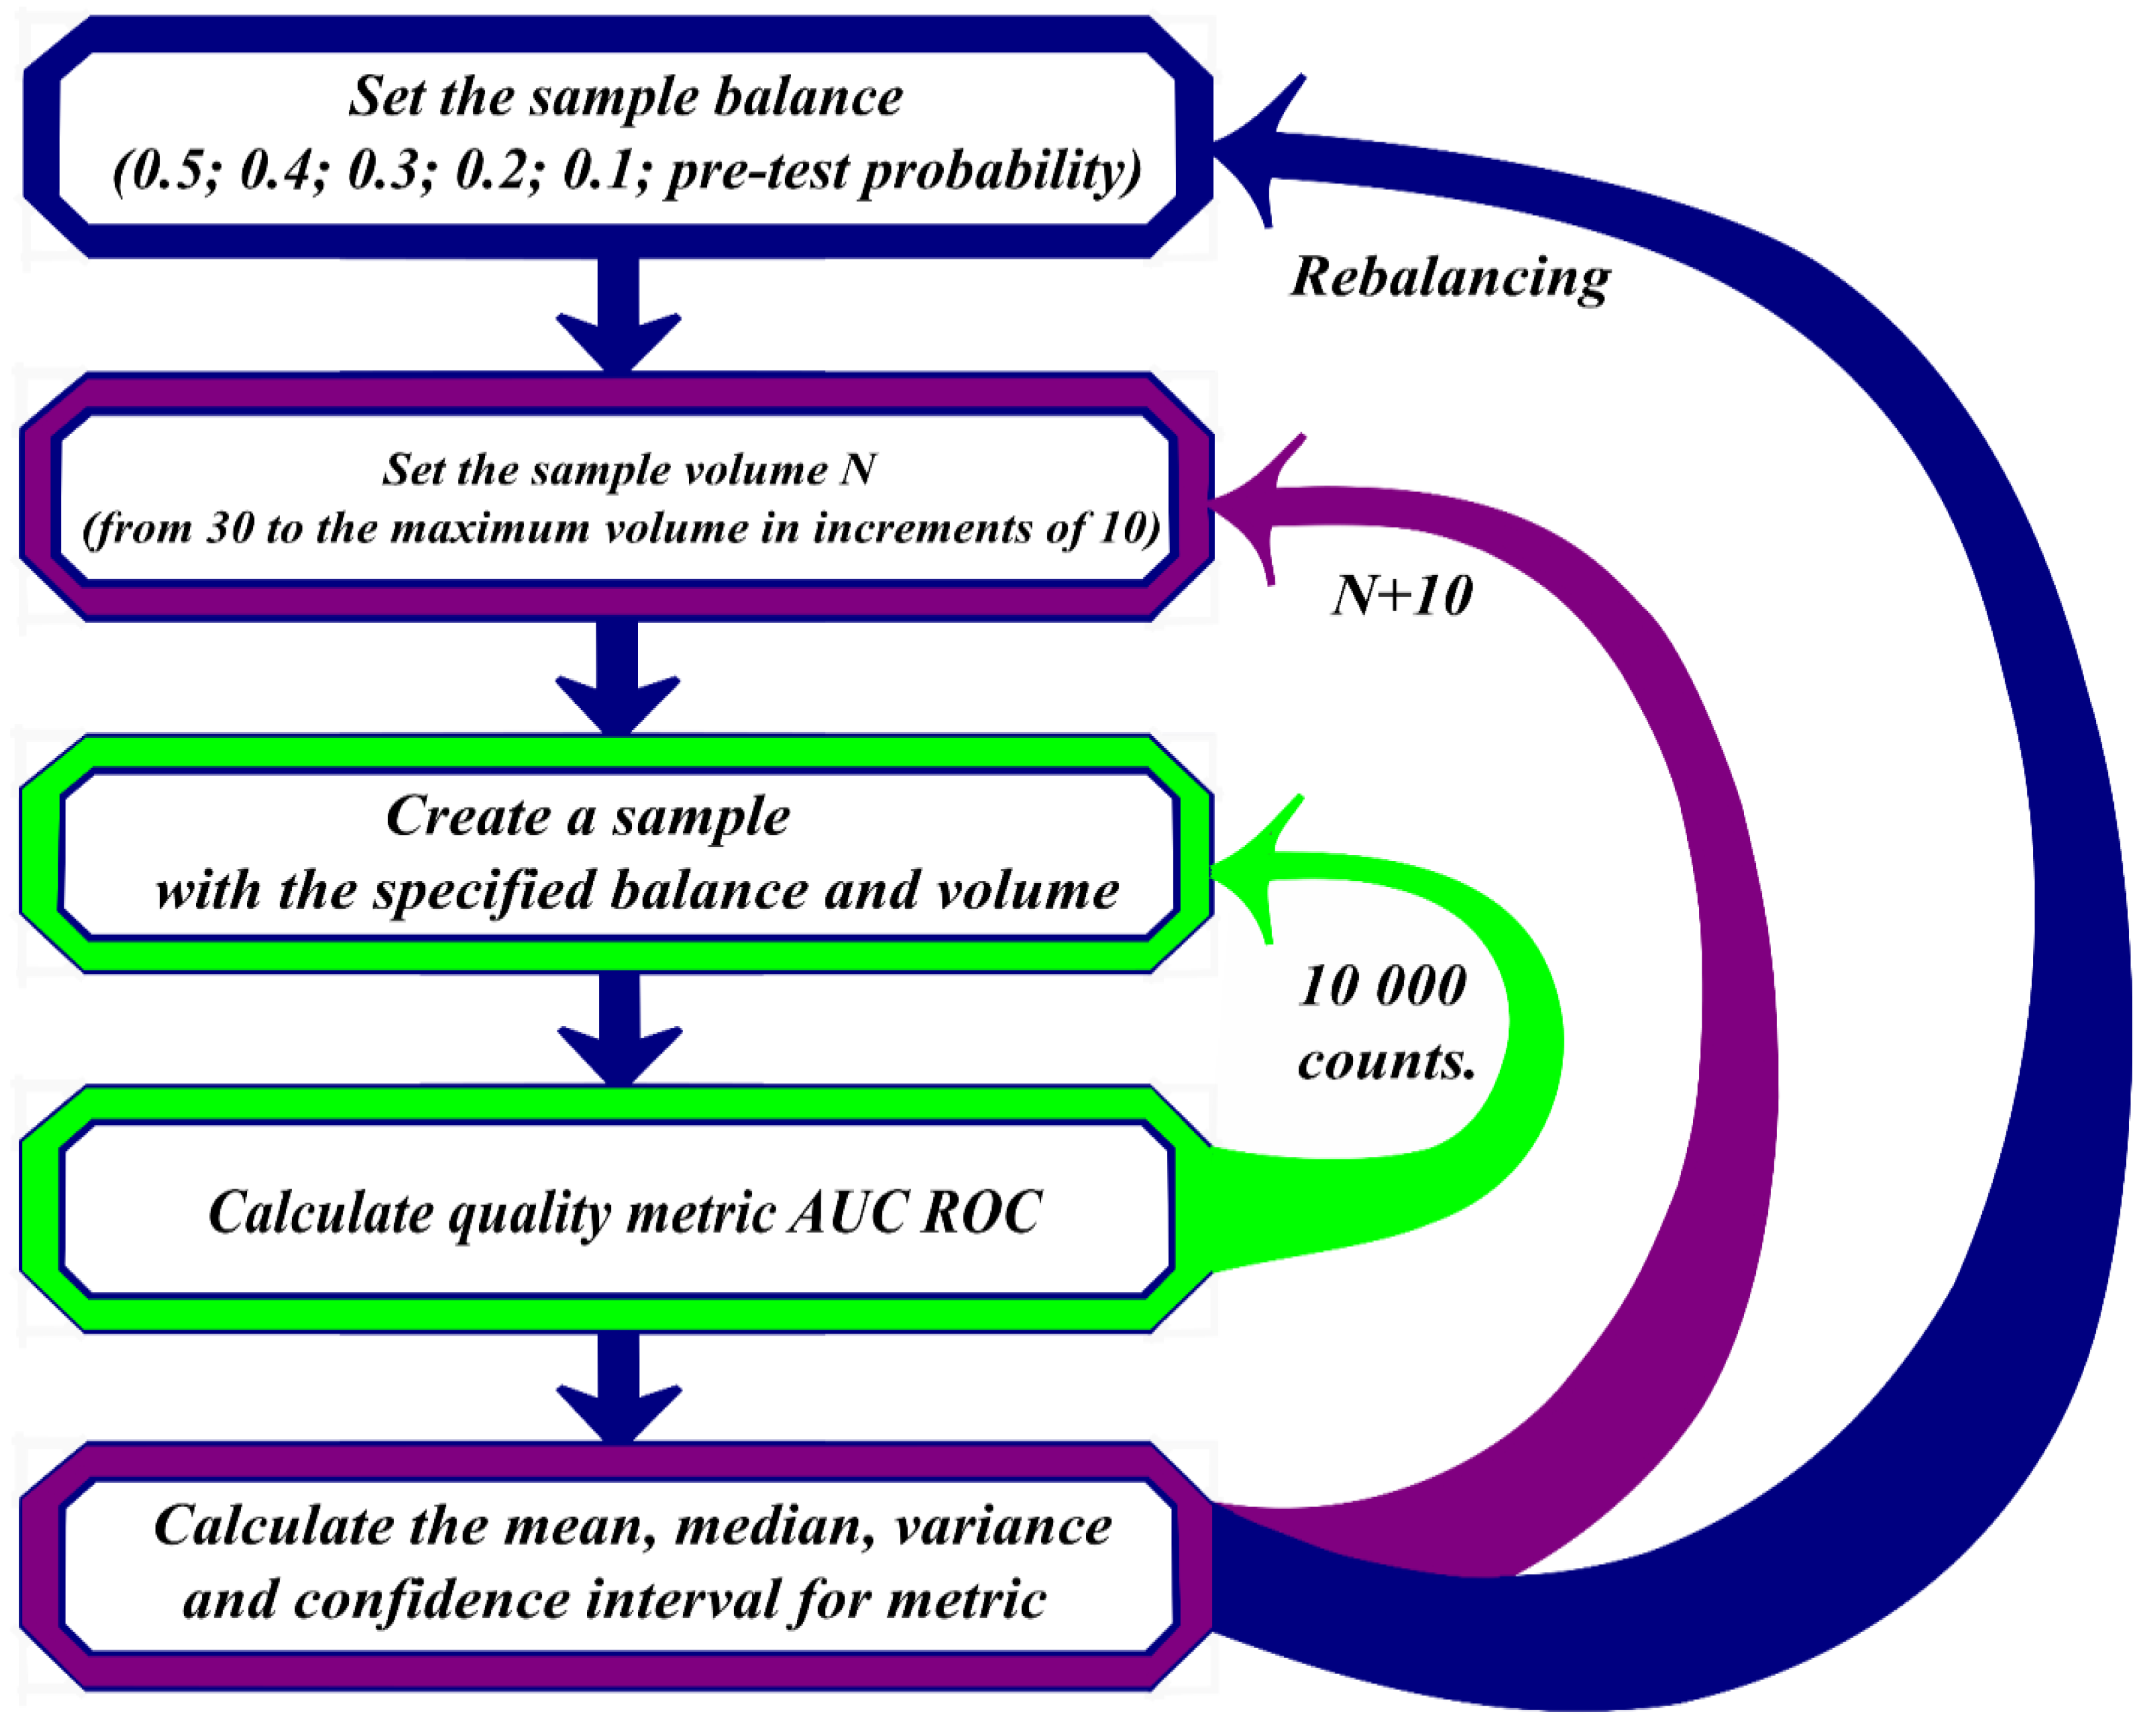
Figure 2.
Behavior of mean AUC ROC values for various balances. The yellow line indicates the approximating curve. a) Balance of "norm"/"abnormality" classes with 10% "abnormality" share; b) "norm"/"abnormality" balance with 20% "abnormality" share; c) "norm"/"abnormality" balance with 30% "abnormality" share; d) "norm"/"abnormality" balance with 40% "abnormality" share; e) "norm"/"abnormality" with 50% "abnormality". share.
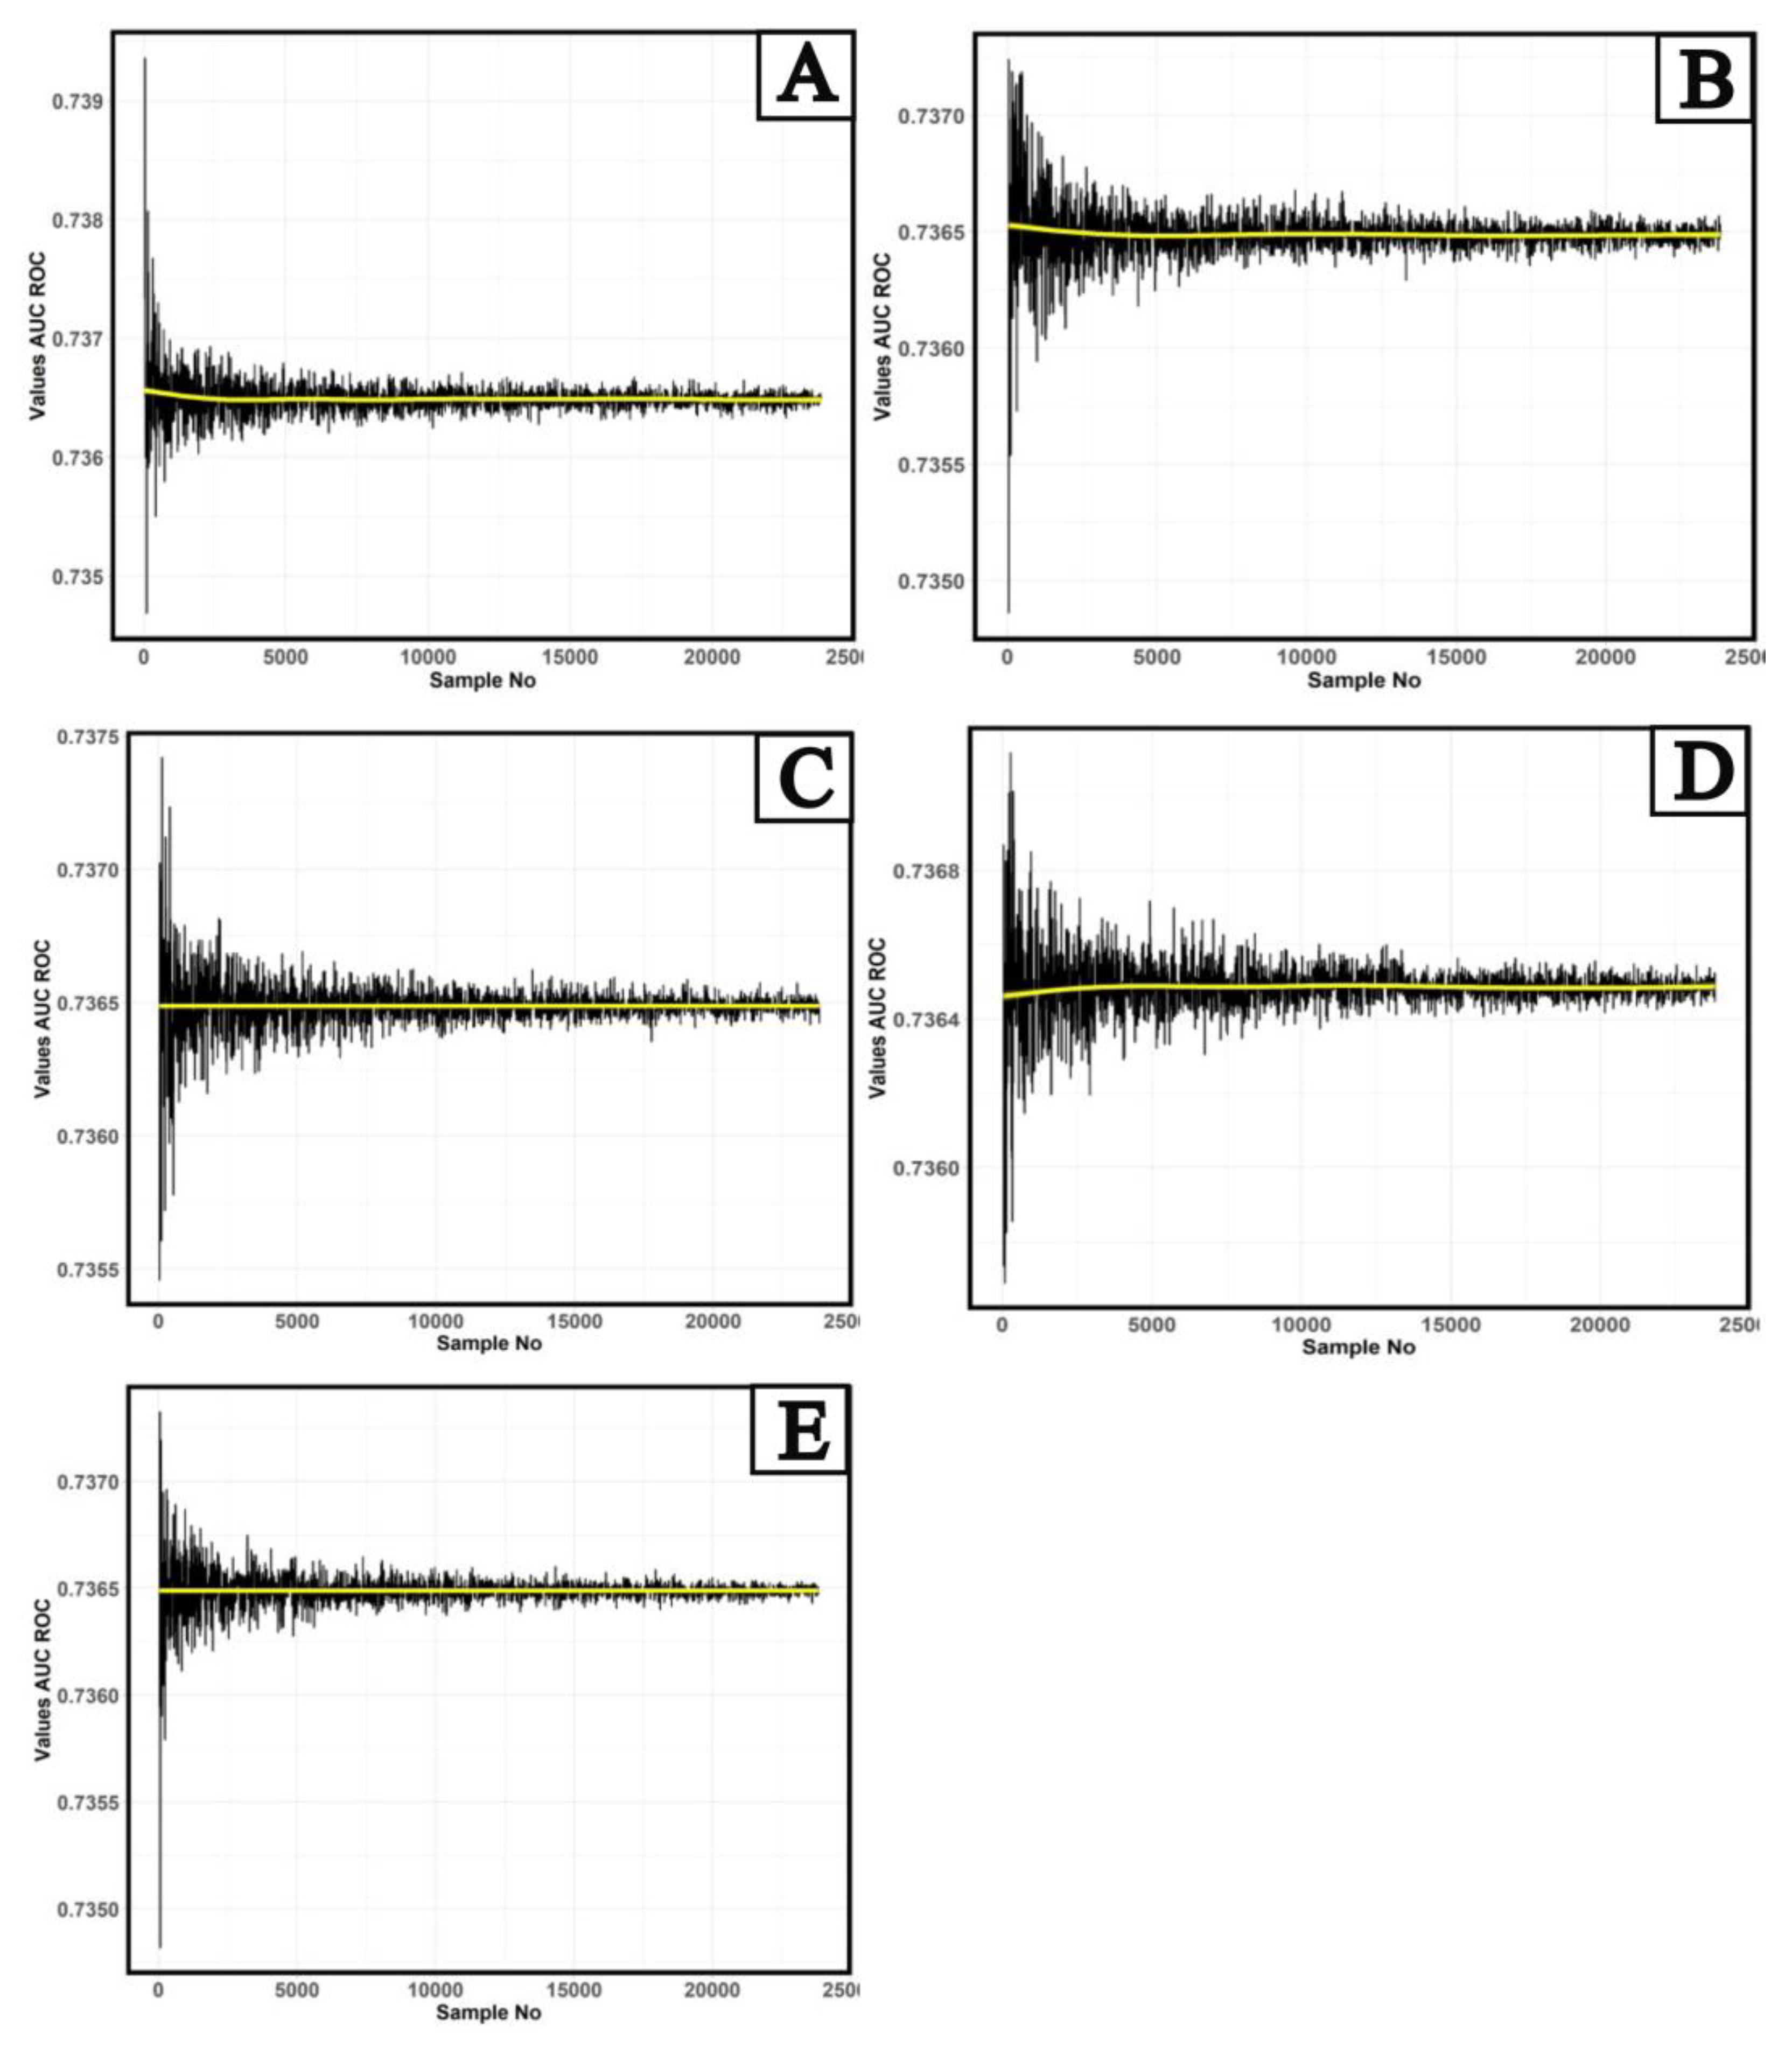
Figure 3.
Dependence of the argument of Fourier spectral function of the AUC ROC on the number of studies in the sample. a) balance of "norm"/"abnormality" classes with 10% "abnormality" share; b) "norm"/"abnormality" balance with 20% "abnormality" share; c) "norm"/"abnormality" balance with 30% "abnormality" share; d) "norm"/"abnormality" balance with 40% "abnormality" share; e) "norm"/"abnormality" balance with 50% "abnormality" share.
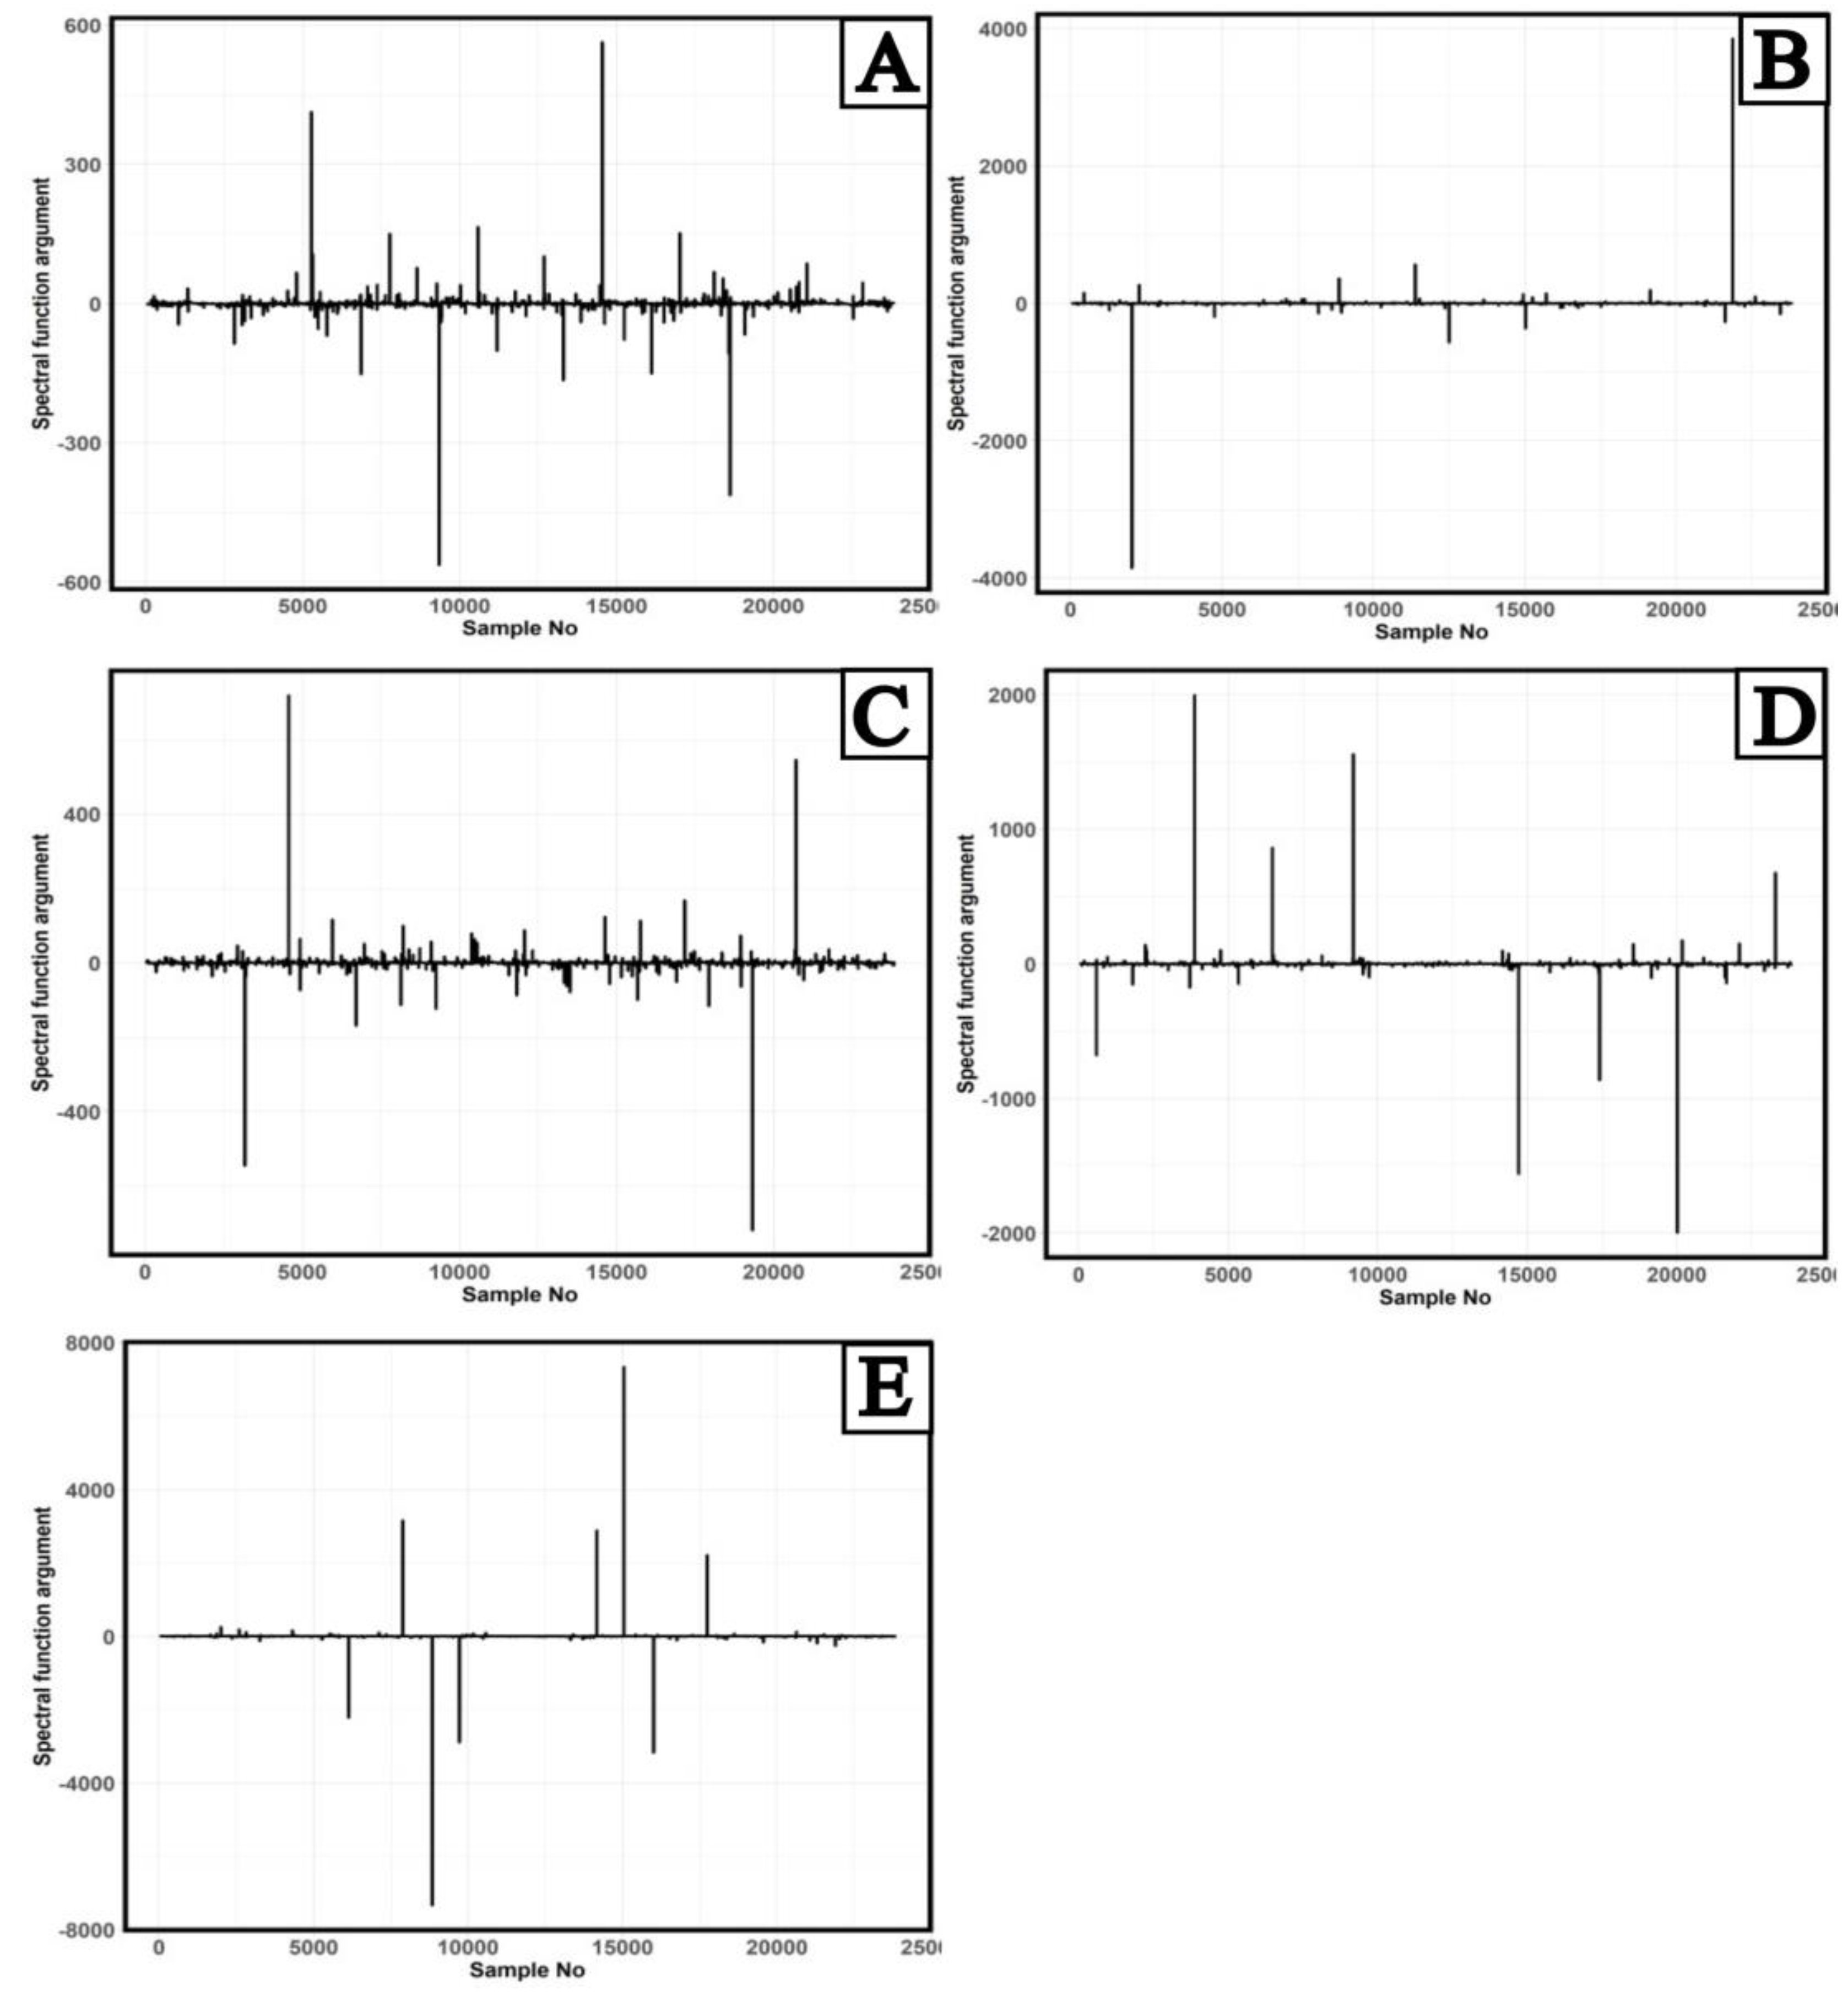
Figure 4.
Dependence of the number of studies corresponding to the main maxima and minima of the argument of AUC ROC spectral function on the “abnormality” share in the balance of “norm “/"abnormality” classes.
Figure 4.
Dependence of the number of studies corresponding to the main maxima and minima of the argument of AUC ROC spectral function on the “abnormality” share in the balance of “norm “/"abnormality” classes.
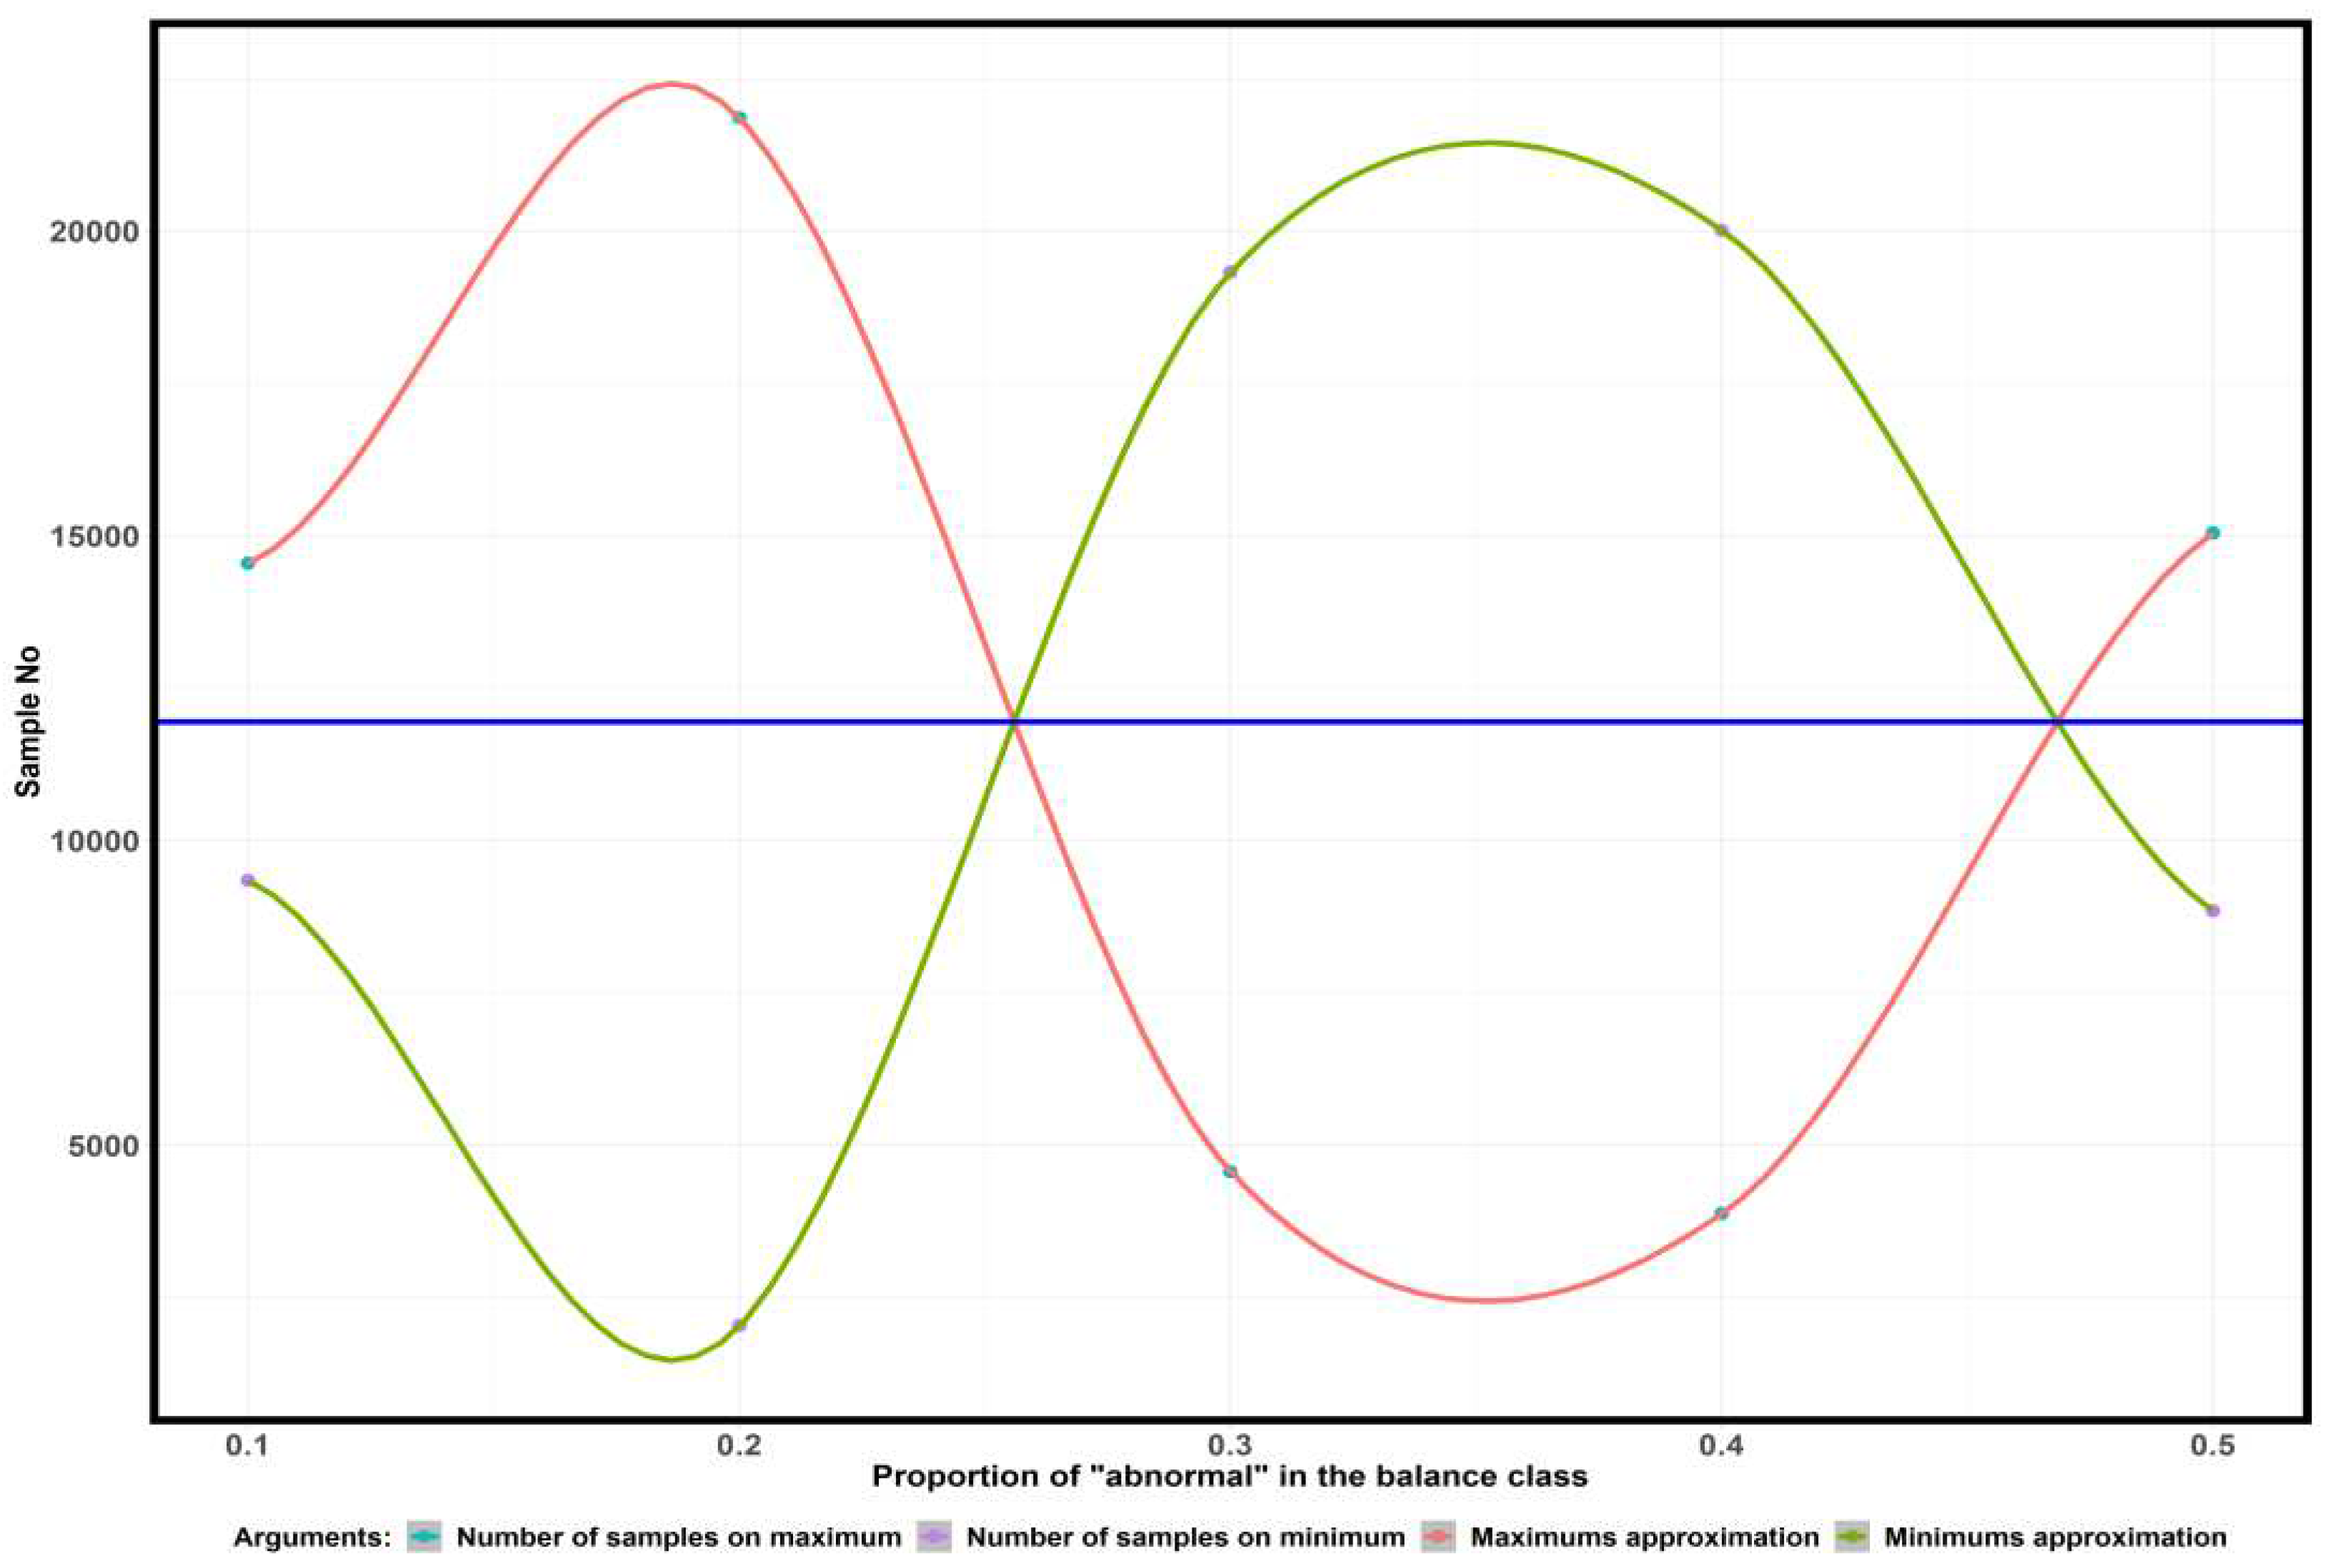
Figure 5.
Coefficient of variation of AUC ROC values depending on the number of studies. a) for 10% "abnormality" share; b) for 20% "abnormality" share; c) for 30% "abnormality" share; d) for 40% "abnormality" share; e) for 50% "abnormality" share; f) a generalized representation for all “abnormality” shares in the balance of “norm”/“abnormality” classes.
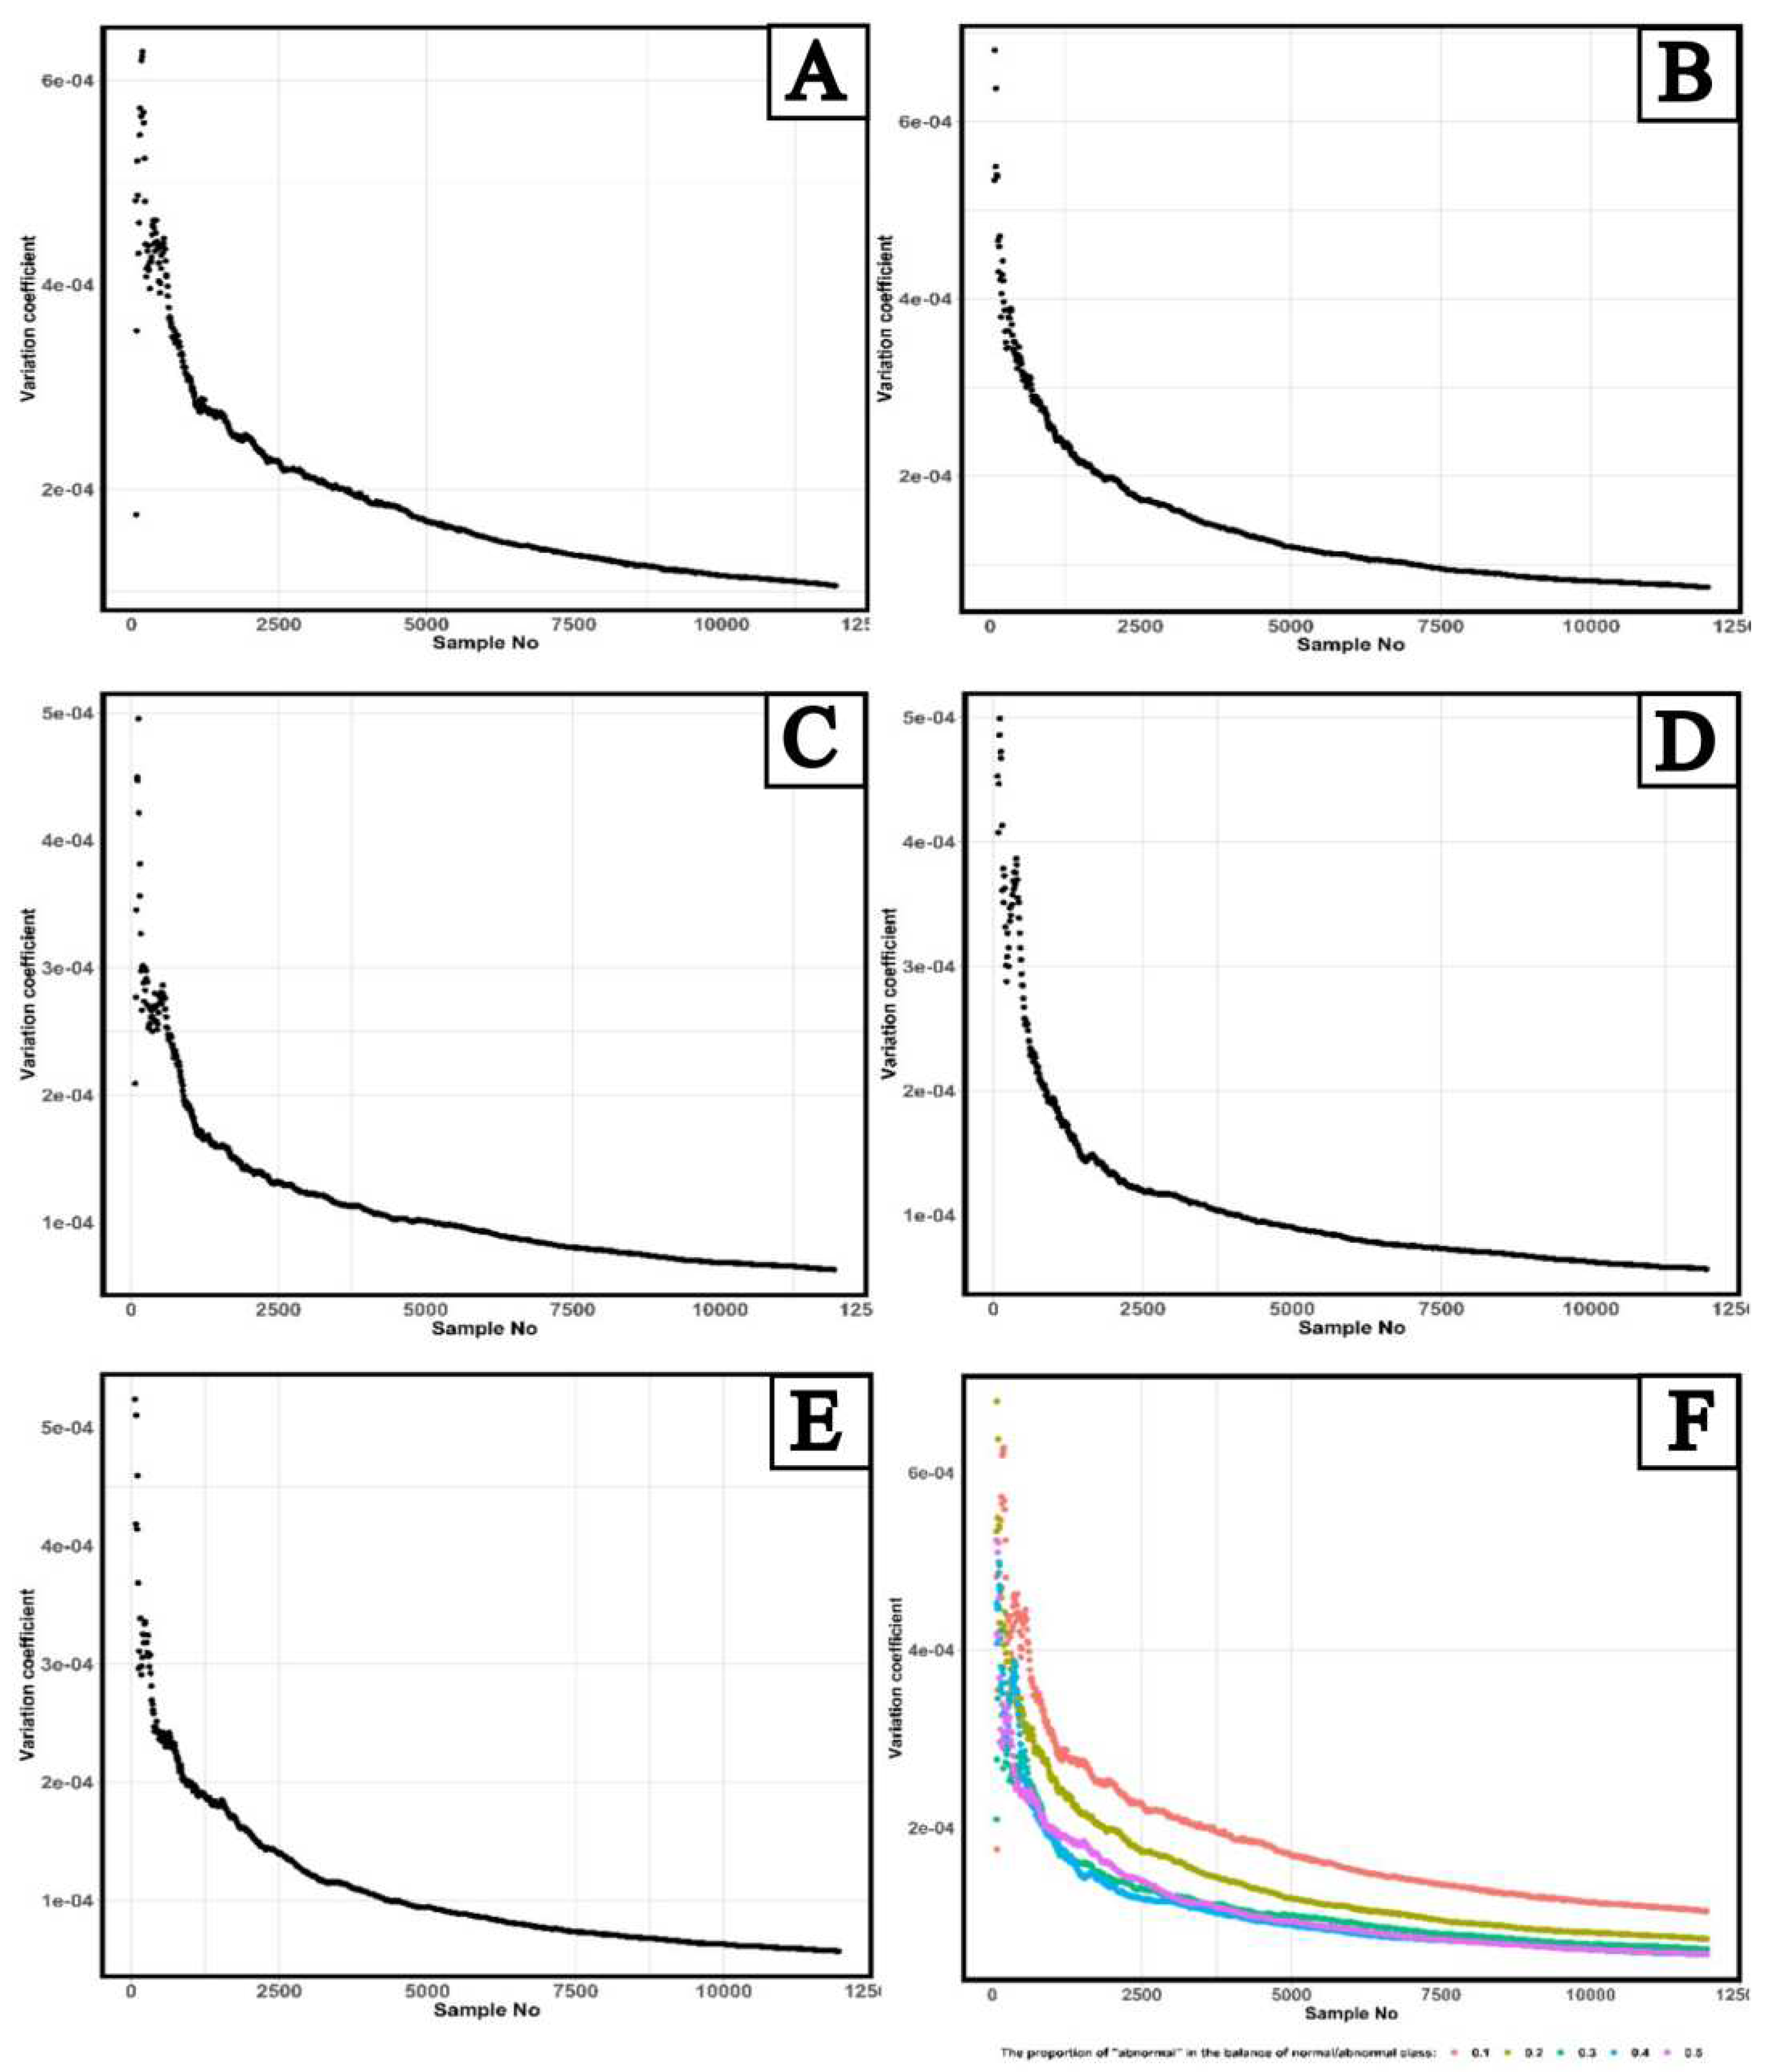

Table 1.
Types of distributions up to and after transition point nT (11940 studies).
| № | “Abnormality” share in the “norm“/ "abnormality” balance | Type of distribution up to nT | Type of distribution after nT |
|---|---|---|---|
| 1 | 0.1 | Cauchy | Normal |
| 2 | 0.2 | Cauchy | Normal |
| 3 | 0.3 | Cauchy | Logistic |
| 4 | 0.4 | Cauchy | Logarithmically normal |
| 5 | 0.5 | Cauchy | Logistic |
Disclaimer/Publisher’s Note: The statements, opinions and data contained in all publications are solely those of the individual author(s) and contributor(s) and not of MDPI and/or the editor(s). MDPI and/or the editor(s) disclaim responsibility for any injury to people or property resulting from any ideas, methods, instructions or products referred to in the content. |
© 2023 by the authors. Licensee MDPI, Basel, Switzerland. This article is an open access article distributed under the terms and conditions of the Creative Commons Attribution (CC BY) license (http://creativecommons.org/licenses/by/4.0/).
Copyright: This open access article is published under a Creative Commons CC BY 4.0 license, which permit the free download, distribution, and reuse, provided that the author and preprint are cited in any reuse.


