
Submitted:
24 October 2025
Posted:
27 October 2025
You are already at the latest version
Abstract
This study aims to develop an explainable radiomics-based model for the automatic as-sessment of image quality in breast cancer Dynamic Contrast-Enhanced Magnetic Reso-nance Imaging (DCE-MRI) data. A cohort of 280 images obtained from a public database was annotated by two clinical experts, resulting in 110 high-quality and 110 low-quality images. The proposed methodology involved the extraction of 819 radiomic features and two No-Reference image quality metrics per patient, using both the whole image and the background as regions of interest. Feature extraction was performed under two scenarios: (i) from a sample of 12 slices per patient, and (ii) from the middle slice of each patient. Following model training, a range of machine learning classifiers was applied with ex-plainability assessed through SHapley Additive Explanations (SHAP). The best perfor-mance was achieved in the second scenario, where combining features from the whole image and background with a support vector machine classifier yielded sensitivity, speci-ficity, accuracy, and AUC values of 85.51%, 80.01%, 82.76%, and 89.37%, respectively. This proposed model demonstrates potential for integration into clinical practice and may also serve as a valuable resource for large-scale repositories and subgroup analyses aimed at ensuring fairness and explainability.
Keywords:
image quality assessment
; dce mri
; radiomics
; breast imaging
; objective quality metrics
; machine learning
; explainability
1. Introduction
Assessing image quality is a task of utmost importance both for conventional diagnosis but also for Artificial Intelligence (AI) assisted decision support systems. Efforts have been made to assess the effect of image quality on performance metrics [1]. Moreover, ongoing efforts to build large image repositories show great interest in identifying automatically the level of data quality, in all contributed datasets, to be aligned with the principles and optimal practices of AI in medicine [2]. Acquiring information on image quality is also closely related to traceability as a measure to describe model input and relate it to the output. Robustness is also examined with respect to image quality fluctuations which are expected and well-received within large data volumes but, on the other hand, should be registered in a consistent manner. To this end, evaluation of image quality plays a major role in the recommended frame of trustworthy AI use in medicine, as defined within the FUTURE AI framework [3,4], in order to improve adaptness and deliver impactful service to the patients.
In a conventional human expert based diagnostic environment, assessment on image quality happens almost intuitively by the expert who will either reject the diagnosis based on an image of unaccepted quality or will ignore non-significant image degradation factors. However, the development of large imaging infrastructures requiring massive data contributions intensify the need for automated tools that are able to recognize severely degraded images which may compromise the general ability of the dataset to deliver accurate and trustworthy results. On the other hand, subtle degradations and artefacts are expected and, to large degree, well-received as part of a real world dataset, characterized by heterogeneity, which is also an aspect of AI model generalizability. Subtle degradation refers to images presenting sub-optimal characteristics, as opposed to severe degradation which potentially jeopardizes diagnosis.
For this reason, the task of image quality assessment can be decomposed on the below important pillars: Firstly, to assess image quality and blacklist images of unacceptable quality and secondly to identify and rank images of adequate quality.
Breast Dynamic Contrast-Enhanced Magnetic Resonance Imaging (DCE-MRI) sequence constitutes the cornerstone of breast diagnosis at high risk population and also for disease progression, as the type of enhancement is a basic criterion and as such, certain quality criteria are recommended by breast imaging societies. DCE-MRI is a technically challenging sequence, especially in the anatomic region of the breast for a number of reasons. Firstly, the solid frame of the coil with the variable breast size allows for different types of mispositioning the human body in the coil, being either far from the receiver coil in the case of small breast causing low Signal-to-Noise Ratio (SNR) or touching the coil in the opposite case causing incomplete inhomogeneous fat signal suppression and thus low Contrast-to-Noise Ratio (CNR). Moreover, the need for keeping temporal requirements of the dynamic acquisition do not allow for optimal spatial resolution settings or -if spatial resolution is uncompromised, noisy images may occur. The nature of DCE-MRI gradient echo acquisitions also favors a number of artifacts, such as zebra artifacts, although usually presented not within the useful field of view.
Other challenges related to breast MRI and not to any other anatomy is the significant tissue-air interface area enhancing susceptibility related degradation, the massive heart flow artifact present in the field of view and also the presence of anatomic areas in the image not covered by receiver coil, such as the spine, presented inevitably with high noise over signal. These unique characteristics render breast DCE-MRI a very challenging instance of breast MRI acquisition.
1.1 Related IQA works:
In the current literature, prior works assessing Internal Quality Assurance (IQA) in MRI with AI techniques are mainly focused on deep learning techniques in different parts of the human body that lack explainability due to the nature of deep learning itself. More specifically, Piccini et al. developed a deep convolutional neural network (IQ-DCNN) to automatically assess the quality of 3D whole-heart MRI data, mimicking expert human evaluations [5]. IQ-DCNN showed strong agreement with human assessments and effectively tracked image quality improvements during reconstruction. In addition, Lin et al. developed a deep learning algorithm to assess prostate MRI quality and found that higher-quality T2-weighted images significantly improved the specificity of detecting extraprostatic extension (EPE) in prostate cancer [6]. Also they found that high-quality T2W images were associated with more accurate prediction of EPE at final pathology. Furthermore, Stepien et al. proposed a novel no-reference deep learning method for MR IQA by fusing complementary network architectures and leveraging multi-level features using two image quality benchmark datasets with various body locations such as: spine, knee, shoulder, brain, wrist, hip, pelvis, elbow and ankle [7]. This deep learning method outperformed existing techniques, showing strong correlation (Pearson’s r = 0.9062) with radiologists' quality ratings.
A review paper of 2025 by Herath et al. regarding IQA in MRI highlighted two deep learning methods for the detection of motion artifacts in cardiac and fetal brain MRI addressed by multi-task learning with k-space motion artifact augmentation and semi-supervised models respectively [1]. The review also indicated an IQ-DCNN, for whole-heart MRI reconstruction monitoring and an Optimized Deep Knowledge-based No-reference Image Quality Index (ODK-NIQI) for denoising.
Works in the literature concerning machine learning methodologies are limited. For example, Chabert et al. developed a machine learning method to classify MR image quality based on radiologist perception, focusing on lumbar MR data [8]. In particular, the authors used the Support Vector Machine (SVM) classifier with features extracted from 95 exams and achieved an average recall of 82% and AUC of 77%, showing promising results for future real-time IQA. There is also a work of Ma et al. that incorporated traditional image quality metrics such as Peak Signal-to-Noise Ratio (PSNR) and Structural Similarity Index (SSIM), Blind/Referenceless Image Spatial Quality Evaluator (BRISQUE) and Natural Image Quality Evaluator (NIQE) and correlated them with the opinion of 13 expert radiologists [9]. The findings highlight the importance of aligning objective IQA models with radiologist judgments to enhance clinical relevance in MRI quality assessment. However, the aforementioned study relied on simulated artifacts and is constrained by the unique challenges of medical image data used in clinical practice.
Most recently, efforts have been put on brain MRI [10,11,12], while few of them are anatomy agnostic allowing for the assessment of breast -MRI acquisitions [13]. To the authors knowledge this work is the first effort to develop a breast DCE-MRI specific explainable model for automatically assessing image quality, embracing the specific requirements of breast anatomy and DCE-MRI acquisition characteristics.
2. Materials and Methods
2.1 Patient population / Imaging protocol
For the needs of this study the MAMMA-MIA dataset [14] was used in order to classify images of high or low quality. The dataset comprises 4 public datasets (Duke, ISPY1, ISPY2, Nact) resulting in 1506 homogenized DCE-MRI images with variable protocols. Further information about patient characteristics and imaging protocols can be found in Table 1 and Table 2 of [14].
2.2 Image Quality Labeling
With the support of an in-house built IQA tool [15], two experts (a radiologist and a medical physicist with 11 and 13 years of experience respectively) annotated the DCE-MRI series with respect to their quality. Randomly selected images at equal volumes from each one of the four datasets were included in the dataset for further analysis (280 cases). We considered a minimum threshold of 110 patients to populate each one of the classes, also achieving consensus among the two experts with respect to their decision. The high quality class (labelled 0) contained excellent or very good images, as assessed in a series base, while the latter contained noisy, blurry, low contrast or images presented with severe artifacts grouped, indifferently of the cause to form a single, low quality class, (labelled 1). The overall image quality labeling process is depicted in Figure 1. In addition, as an example, a visual representation of image quality of the studied dataset is presented in Figure 2.
Experimental Set Up
In this work, image quality was assessed on a patient level basis in two different scenarios (Figure 3). Firstly, image quality was examined in 12 images of the first post contrast image of the DCE-MRI sequence for every patient. Specifically, 6 equidistant images from the middle third of the data acquisition volume and 3 from the top and bottom third of the volume, respectively. The rationale behind the selection of a subset of images across the series, was to address the possibility of having local degradations in a sub-region of anatomy, related to coil sensitivity variation, patient anatomy or presence of foreign objects in the body such as surgical clips. Secondly, image quality was examined, only, at the middle slice in the z-axis of the first post-contrast image to reduce computational effort. The middle slice was chosen as strongly representative of a global notion of image quality within a series acquired by a certain imaging protocol set-up.
For both scenarios two regions of interest (ROI) were examined i.e. the whole image (red rectangle in Figure 3) and the background region (blue rectangle in Figure 3), which were used for feature extraction as separate regions as well as combined in a single set of features. It is noteworthy to mention that the background ROI was obtained automatically in a square region (⅛ of image width and ⅛ of image height) pixels in each of the four corners of the image. Since the protocols consisted of both axial and sagittal images, the noise region was determined on the basis of lowest SNR among the two squares and the constraint not to be diagonal. This criterion was able to locate two background regions per slice irrespectively of the acquisition plane orientation.
Radiomics Extraction
The first post-contrast images were standardized using z-score normalization based on the whole image to adjust for the arbitrary intensity values of the MRI scans. The radiomics analysis was initiated by extracting 819 radiomic features from the whole image as well as the defined background region. Moreover, two objective No-Reference (NR) image quality metrics (BRISQUE and total variation) were calculated from PyTorch Image Quality (PIQ) library [16,17] to complement the analysis, adding up to a final set of 821 features. The radiomic features were extracted using the open-source python library PyRadiomics version 3.0.1 [18], in compliance with the Image Biomarker Standardization Initiative (IBSI) guidelines. Features were extracted from the original images as well as from images processed with the wavelet filter and the Laplacian of Gaussian (LoG) filter, applying four different values of sigma (2, 3, 4, and 5) to highlight various image textures. A total of 819 radiomics features were extracted for each image-segmentation pair, including first-order features (n = 162) and higher-order textural features (n = 657). The textural features consisted of Gray Level Co-occurence Matrix (GLCM) features (n = 198), Gray Level Dependence Matrix (GLDM) features (n = 126), Gray Level Run Length Matrix (GLRLM) features (n = 144), Gray Level Size Zone Matrix (GLSZM) features (n = 144), and Neighbouring Gray Tone Difference Matrix (NGTDM) features (n = 45). Lastly, the abovementioned radiomic features were calculated after applying the Fixed Bin Size (FBS) discretization technique, recommended by the IBSI with two different bin widths (1 and 54) in order to see the impact of image intensity grouping in the quality classification and computational time. The bin width of 54 was determined by calculating the mean intensity range within the ROI and dividing by a Fixed Bin Number (FBN) of 64, a commonly accepted value [19,20].
Classification – machine learning pipeline
To identify which features are the most dominant to assess image quality, a radiomics/machine learning pipeline was developed using a variety of widely used classifiers including: Logistic Regression, Support vector Machine (SVM) using the radial basis function kernel ,K-Neighbors Classifier (KNN), Random Forest Classifier, AdaBoost Classifier and GaussianNB. All classifiers were trained and evaluated in a 10-fold cross-validation scheme on the extracted features. Data stratification was applied on a patient basis across folds, avoiding sample selection bias and overfitted models.
To evaluate and compare the performance of image quality classification, a variety of common evaluation metrics were deployed. More specifically, for every fold, sensitivity, specificity, accuracy (ACC) and the area under the curve (AUC) along with their standard deviations (SD) were calculated on the unseen testing sets in each fold. Furthermore, for the first scenario, meaning for patient-level evaluation, predicted probabilities from all 12 slices belonging to the same patient were aggregated using a soft voting scheme (i.e., averaging probabilities across slices/samples). Final class predictions were obtained by thresholding the averaged probability at 0.5.
The feature selection process relied on a three-step scheme. Firstly, a variance threshold was applied to remove features with zero variance (constant features). Secondly, ANOVA (analysis of variance) was used as a univariate method to reduce noisy information in the feature space. Thirdly, a multivariate method based on the L1 penalty that minimizes the coefficients of the redundant features was used. More information about the feature dimensionality reduction can be found in [21,22].
Explainability Analysis
To evaluate the interpretability of the image quality models, Shapley Additive Explanations (SHAP) were employed to provide insights into individual predictions. SHAP values are model-agnostic, making them suitable for explaining any type of machine learning algorithm. Rooted in game theory, SHAP assigns an importance score to each feature based on its contribution to the overall prediction, similar to how each player’s role is assessed in a cooperative game. In the context of machine learning, these values quantify the influence each feature has on the model’s output. The Shapley value represents the average contribution of a given feature across all possible feature combinations [23,24] .
Feature-level interpretability is crucial, especially for uncovering hidden relationships in complex data that are not immediately apparent. In this study, summary plots were generated based on the fold with the highest performance in terms of ACC and AUC for all image quality scenarios.
3. Results
A number of classifiers were deployed to accomplish the classification of an image based on the calculated image features into low and high quality classes. For both of the aforementioned scenarios, i.e., training the model either with a set of 12 images per patient across the series or with a single image in the center of the imaging volume for each patient, the performance metrics, using the whole image, are presented in Table 1.
Results in Table 1 are calculated at a patient level. For all cases of 12-slice evaluation a probability based voting was utilized, i.e., the mean probability for each patient was calculated as the average probability across all 12 slices according to a soft voting approach, i.e., a threshold of 0.5 probability for each class (high /low quality) assigned the high quality/ low quality label to the whole set of 12 slices of this individual patient. This action also alleviated the imbalance in the number of examined slices for each patient case, as in the first scenario the prediction would be ambiguous for a significant degree of discordance among slices. Moreover, if only cases with all slices converged to the same decision were used, the number of instances participating for the performance evaluation would be above one order of magnitude larger in the 12-slice evaluation option. In addition, the results for the second scenario (features used only from the middle slice) are presented in Table 2.
From the results presented in Table 1 and Table 2 , it can be easily deduced that single slice analysis has superior performance than the 12 slices analysis based on the best performing classifier (Random Forest), apart from the, apparent reduction in computational cost. Also, the SVM converges to the same result, i.e., the single slice analysis outperforms the 12-slice analysis.
As a next step, the explainability analysis for the single slice in the middle of the acquisition volume was performed, utilizing the combined radiomics from the whole image and the background. Thus, the summary plot of SHAP values for the best model is presented in Figure 4.
4. Discussion
This work focused on the development of breast DCE-MRI specific tool for automatic detection of image quality. The superiority of the single slice model over the 12 slice model (scenario 1) that runs across the whole imaging volume can be attributed to the fact that the middle slice is dominantly occupied by patients’ anatomy with radiological/diagnostic interest, while the rest of the anatomy that is undercovered by imaging coils remains the same. Moreover, for certain patients’ anatomic characteristics, i.e. small breast volume, the upper and lower part of the acquisition volume were not indicative of image quality and possibly contaminated the analysis with non-relevant information.
From the metrics presented in Table 1 and Table 2 it is obvious that the background region has inferior performance than the whole image, which can be attributed to the fact that the anatomy of interest is excluded from the examined region. However, given the fact that it focuses on a part of the image that isolates and thus is able to capture noise levels and presence of artifacts (most prominent in anatomy free regions), it was considered meaningful to adapt the final outcome and produce a more complex model that uses both the whole image region and the noise region synergistically. To achieve this, we produced a model by using the radiomic features from the whole image along with those from the background region. The final model had double the number of features compared to the ones used before.
The explainability results (Figure 4) show that gray level Non-Uniformity, both in the Wavelet decomposed as well as in the original image, are among the top 3 features, which is aligned with what is intuitively expected to distinguish a blurred indicating inhomogeneity across intensity values. The participation of the background region confirms the initial assumption that the air region should be included and can improve the overall performance.
Also zone entropy metrics play an important role for the whole image which is also a metric of the uncertainty or randomness which can also be associated with characteristics of heterogeneous texture patterns. For the background regions the metrics showing a powerful effect on the model decision is the NGTDM Complexity which quantifies differences between a pixel's gray value and the mean gray value of its neighbors, showing uniformity in the area free of anatomy which can probably capture sensitivity uniformities or presence of artifacts.
It is of importance that the objective NR metrics did not appear in the SHAP analysis to have a strong effect in the decision. For this outcome, the non-medical orientation, of NR metrics, might be an explanation since the images of the breast region are inherently expected to have large areas of blurring and low SNR (massive heart flow artifact, back and spine region without coil coverage, absent anatomy in many slices for some body types or pathologies) and thus the DCE breast MRI image has a very precise definition of quality which is different from natural images. Moreover, DCE-MRI is a dynamic fast acquisition which is error prone by design in order to achieve the desired temporal resolution to capture contrast agent dynamics. It is expected therefore that even excellent images have areas of sub-optimal quality due to the nature of the acquisition and thus the NR non-medical metrics are not effective, as also observed by Kastryulin et al. [25]
The experimentation with bin size was initiated by the thought that pixel intensity grouping might obscure heterogeneities in pixels varying at a small degree and that could have a negative effect if those pixels are neighbouring, i.e., flattening the contrast. However, when omitting this grouping of signal intensities, i.e., using bin width =1 (no discretization), the results were not improved. Hence, the discretization process was applied using the FBS technique, as recommended by the IBSI, with a bin width of 54. This value was chosen based on the signal intensities in order not to raise the computational cost without a measurable benefit.
The decision to use a more complex model with the whole image radiomics and background radiomics instead of the best performing model of the whole image was based on the rational that in MR images the background region is the one most indicative of noise levels and also is the region accommodating most of the artifacts or highlighting them as they are more prominent in a low signal region. The whole image analysis is indispensable however as blurring can only be seen in the imaging volume. Based on this rationale a complex model using both areas was preferred, since the computational cost was not considered prohibitive.
Based on the presented results, and the abovementioned criteria we concluded to the final settings of the proposed model of this work. The tool achieved similar sensitivity and specificity values, meaning that possible misclassifications are equally possible either to have false positives (bad images in the high quality class) or false negatives (good images in the low quality class). Since these events are sporadic, given the achieved performance, the tool delivers a trustworthy output for statistical descriptive features given a large dataset. This in turn is a valid metric of dataset value in a multi-centric and/or multi-vendor diverse protocol setting. In a per-patient classification application, the tool is able to capture consistent factors of image degradation, such as a coil failure, a room temperature modification or any other factor affecting the anatomy representations. This can serve as an alert mechanism and be an effective tool for service auditing in clinical sites.
To extend the best of our models into a real world clinical scenario, the model combining the whole image and background radiomics was also tested on the whole MAMA-MIA dataset to predict each image as high or low quality. To be noted the MAMA-MIA dataset comprises four publicly available datasets named DUKE ISPY_1, ISPY_2 and NACT. Interestingly, for each of these subsets of MAMA-MIA’s dataset we found the percentage of low quality images for NACT 7/63 (11%), ISPY1 26/171 (15%), DUKE 74/283 (26%) and ISPY2 97/972 (10%). The measured percentage of low quality images as well as the heterogeneity among different protocols is within the expected by experience percentages that the evaluators of this work (radiologist and medical physicist) encounter in clinical practice and evaluate as acceptable within a realistic working environment.
As the image quality per se might not be the question of utmost clinical importance, as a future step the image quality classification task can be correlated to tangible benefit for the patient, as the final and most important recipient of any medical action. Such a final outcome can stem from achieving better performance in. a treatment prediction model or a risk estimation outcome. Moreover the dataset deployed during this work was limited in volume. In the case of a larger examined dataset for expert labelling and training it could enable a more detailed classification of images with respect to the aetiology of degradation, i.e., specifying the dominant factor of quality compromisation. Another limitation is the recruitment of only two experts of different expertise. The analysis would have improved if more than two experts assessed the quality to also address interobserver disagreements more efiiciently. It has also to be noted that the deployment of such a tool in other anatomies or modalities is not constrained by the general framework of this work and thus can be configured to have anatomy or modality specific modules.
5. Conclusions
To summarize, an automatic detection of image quality assessment model was specified for first pass DCE-MRI data. The model was optimized for performance and computational cost. This model can be integrated in real clinical practice but can also serve as a valuable tool for large volume repositories and subgroup analysis for fairness and explainability control. As image quality per se is not a clinical endpoint, it can also be deployed for the benefit of the end user, i.e. the patient to correlate image quality with treatment response prognosis or disease classification performance metrics.
Author Contributions
Conceptualization, K.N. and V.K.; methodology, G.K. and G.S.I.; data curation, A.D. and G.K.; writing—original draft preparation, G.S.I. and K.N.; writing—review and editing, V.K., O.D., K.L. and A.D.; visualization, G.S.I.; supervision, K.M.; project administration, V.K.; All authors have read and agreed to the published version of the manuscript.
Funding
Please add: This research and the APC was funded by the RadioVal project, EU Grant agreement ID: 101057699/
Institutional Review Board Statement
Not applicable. This study used the publicly available MAMA-MIA breast cancer dataset [13].
Informed Consent Statement
Not applicable
Data Availability Statement
The data that support the findings of this study are available from the corresponding author upon reasonable request.
Conflicts of Interest
The authors declare no conflicts of interest.
References
- Herath, H.M.S.S.; Herath, H.M.K.K.M.B.; Madusanka, N.; Lee, B. Il A Systematic Review of Medical Image Quality Assessment. Journal of Imaging 2025, 11, 100. [Google Scholar] [CrossRef] [PubMed]
- Martí-Bonmatí, L.; Blanquer, I.; Tsiknakis, M.; Tsakou, G.; Martinez, R.; Capella-Gutierrez, S.; Zullino, S.; Meszaros, J.; Bron, E.E.; Gelpi, J.L.; et al. Empowering Cancer Research in Europe: The EUCAIM Cancer Imaging Infrastructure. Insights Imaging 2025, 16, 1–10. [Google Scholar] [CrossRef] [PubMed]
- Lekadir, K.; Frangi, A.F.; Porras, A.R.; Glocker, B.; Cintas, C.; Langlotz, C.P.; Weicken, E.; Asselbergs, F.W.; Prior, F.; Collins, G.S.; et al. FUTURE-AI: International Consensus Guideline for Trustworthy and Deployable Artificial Intelligence in Healthcare. BMJ 2025, 388. [Google Scholar] [CrossRef] [PubMed]
- Piccini, D.; Demesmaeker, R.; Heerfordt, J.; Yerly, J.; Sopra, L. Di; Masci, P.G.; Schwitter, J.; Van De Ville, D.; Richiardi, J.; Kober, T.; et al. Deep Learning to Automate Reference-Free Image Quality Assessment of Whole-Heart MR Images. Radiol Artif Intell 2020, 2. [Google Scholar] [CrossRef]
- Lin, Y.; Belue, M.J.; Yilmaz, E.C.; Law, Y.M.; Merriman, K.M.; Phelps, T.E.; Gelikman, D.G.; Ozyoruk, K.B.; Lay, N.S.; Merino, M.J.; et al. Deep Learning-Based Image Quality Assessment: Impact on Detection Accuracy of Prostate Cancer Extraprostatic Extension on MRI. Abdom Radiol (NY) 2024, 49, 2891–2901. [Google Scholar] [CrossRef] [PubMed]
- Stępień, I.; Oszust, M. No-Reference Image Quality Assessment of Magnetic Resonance Images with Multi-Level and Multi-Model Representations Based on Fusion of Deep Architectures. Eng Appl Artif Intell 2023, 123, 106283. [Google Scholar] [CrossRef]
- Chabert, S.; Castro, J.S.; Muñoz, L.; Cox, P.; Riveros, R.; Vielma, J.; Huerta, G.; Querales, M.; Saavedra, C.; Veloz, A.; et al. Image Quality Assessment to Emulate Experts’ Perception in Lumbar MRI Using Machine Learning. Applied Sciences 2021, Vol. 11, Page 6616 2021, 11, 6616. [Google Scholar] [CrossRef]
- Ma, Y.; Lou, J.; Tanguy, J.Y.; Corcoran, P.; Liu, H. RAD-IQMRI: A Benchmark for MRI Image Quality Assessment. Neurocomputing 2024, 602, 128292. [Google Scholar] [CrossRef]
- Esteban, O.; Birman, D.; Schaer, M.; Koyejo, O.O.; Poldrack, R.A.; Gorgolewski, K.J. MRIQC: Advancing the Automatic Prediction of Image Quality in MRI from Unseen Sites. PLoS One 2017, 12, e0184661. [Google Scholar] [CrossRef] [PubMed]
- Bhalerao, G.; Gillis, G.; Dembele, M.; Suri, S.; Ebmeier, K.; Klein, J.; Hu, M.; Mackay, C.; Griffanti, L. Automated Quality Control of T1-Weighted Brain MRI Scans for Clinical Research Datasets: Methods Comparison and Design of a Quality Prediction Classifier. Imaging Neuroscience 2025, 3, 2025. [Google Scholar] [CrossRef] [PubMed]
- Chen, Q.; Liu, F.; Duan, H.; Wang, Y.; Min, X.; Zhou, Y.; Zhai, G. MRIQA: Subjective Method and Objective Model for Magnetic Resonance Image Quality Assessment. 2022 IEEE International Conference on Visual Communications and Image Processing, VCIP 2022 2022. [CrossRef]
- Kapsner, L.A.; Balbach, E.L.; Folle, L.; Laun, F.B.; Nagel, A.M.; Liebert, A.; Emons, J.; Ohlmeyer, S.; Uder, M.; Wenkel, E.; et al. Image Quality Assessment Using Deep Learning in High B-Value Diffusion-Weighted Breast MRI. Scientific Reports 2023, 13, 1–13. [Google Scholar] [CrossRef] [PubMed]
- Garrucho, L.; Kushibar, K.; Reidel, C.A.; Joshi, S.; Osuala, R.; Tsirikoglou, A.; Bobowicz, M.; del Riego, J.; Catanese, A.; Gwoździewicz, K.; et al. A Large-Scale Multicenter Breast Cancer DCE-MRI Benchmark Dataset with Expert Segmentations. Scientific Data 2025, 12, 1–14. [Google Scholar] [CrossRef] [PubMed]
- Nikiforaki, K.; Karatzanis, I.; Dovrou, A.; Bobowicz, M.; Gwozdziewicz, K.; Díaz, O.; Tsiknakis, M.; Fotiadis, D.I.; Lekadir, K.; Marias, K. Image Quality Assessment Tool for Conventional and Dynamic Magnetic Resonance Imaging Acquisitions. Journal of Imaging 2024, 10, 115. [Google Scholar] [CrossRef] [PubMed]
- Kastryulin, S.; Zakirov, D.; Prokopenko, D. PyTorch Image Quality: Metrics and Measure for Image Quality Assessment 2019.
- Kastryulin, S.; Zakirov, J.; Prokopenko, D.; Dylov, D. V PyTorch Image Quality: Metrics for Image Quality Assessment 2022.
- Van Griethuysen, J.J.M.; Fedorov, A.; Parmar, C.; Hosny, A.; Aucoin, N.; Narayan, V.; Beets-Tan, R.G.H.; Fillion-Robin, J.C.; Pieper, S.; Aerts, H.J.W.L. Computational Radiomics System to Decode the Radiographic Phenotype. Cancer Res 2017, 77, e104–e107. [Google Scholar] [CrossRef] [PubMed]
- Wichtmann, B.D.; Harder, F.N.; Weiss, K.; Schönberg, S.O.; Attenberger, U.I.; Alkadhi, H.; Pinto Dos Santos, D.; Baeßler, B. Influence of Image Processing on Radiomic Features from Magnetic Resonance Imaging. Invest Radiol 2023, 58, 199–208. [Google Scholar] [CrossRef] [PubMed]
- Duron, L.; Balvay, D.; Perre, S. Vande; Bouchouicha, A.; Savatovsky, J.; Sadik, J.C.; Thomassin-Naggara, I.; Fournier, L.; Lecler, A. Gray-Level Discretization Impacts Reproducible MRI Radiomics Texture Features. PLoS One 2019, 14, e0213459. [Google Scholar] [CrossRef] [PubMed]
- Ioannidis, G.S.; Joshi, S.; Kalliatakis, G.; Nikiforaki, K.; Kilintzis, V.; Kondylakis, H.; Diaz, O.; Bobowicz, M.; Lekadir, K.; Marias, K. Radiomics Prediction of Pathologic Complete Response to Neoadjuvant Chemotherapy in Breast Cancer: Interpretation and Imaging Pitfalls. In Lecture Notes of the Institute for Computer Sciences, Social-Informatics and Telecommunications Engineering, LNICST; Springer, Cham, 2025; Vol. 611 LNICST, pp. 340–352.
- Ioannidis, G.S.; Trivizakis, E.; Krasagakis, K.; Lallas, A.; Apalla, Z.; Evangelou, G.; Marias, K. A Machine Learning Framework for Hair Type Categorization to Optimize the Hair Removal Algorithm in Dermatoscopy Images. In Proceedings of the 2023 IEEE EMBS Special Topic Conference on Data Science and Engineering in Healthcare, Medicine and Biology; IEEE, December 7 2023; pp. 121–122. [Google Scholar]
- Lundberg, S.M.; Lee, S.-I. A Unified Approach to Interpreting Model Predictions. In Proceedings of the Advances in Neural Information Processing Systems; Guyon, I., Luxburg, U. V, Bengio, S., Wallach, H., Fergus, R., Vishwanathan, S., Garnett, R., Eds.; Curran Associates, Inc., 2017; Vol. 30. [Google Scholar]
- Ioannidis, G.S.; Pigott, L.E.; Iv, M.; Surlan-Popovic, K.; Wintermark, M.; Bisdas, S.; Marias, K. Investigating the Value of Radiomics Stemming from DSC Quantitative Biomarkers in IDH Mutation Prediction in Gliomas. Front Neurol 2023, 14. [Google Scholar] [CrossRef] [PubMed]
- Kastryulin, S.; Zakirov, J.; Pezzotti, N.; Dylov, D. V. Image Quality Assessment for Magnetic Resonance Imaging. IEEE Access 2023, 11, 14154–14168. [Google Scholar] [CrossRef]
Figure 1.
Image quality labelling process for model training.
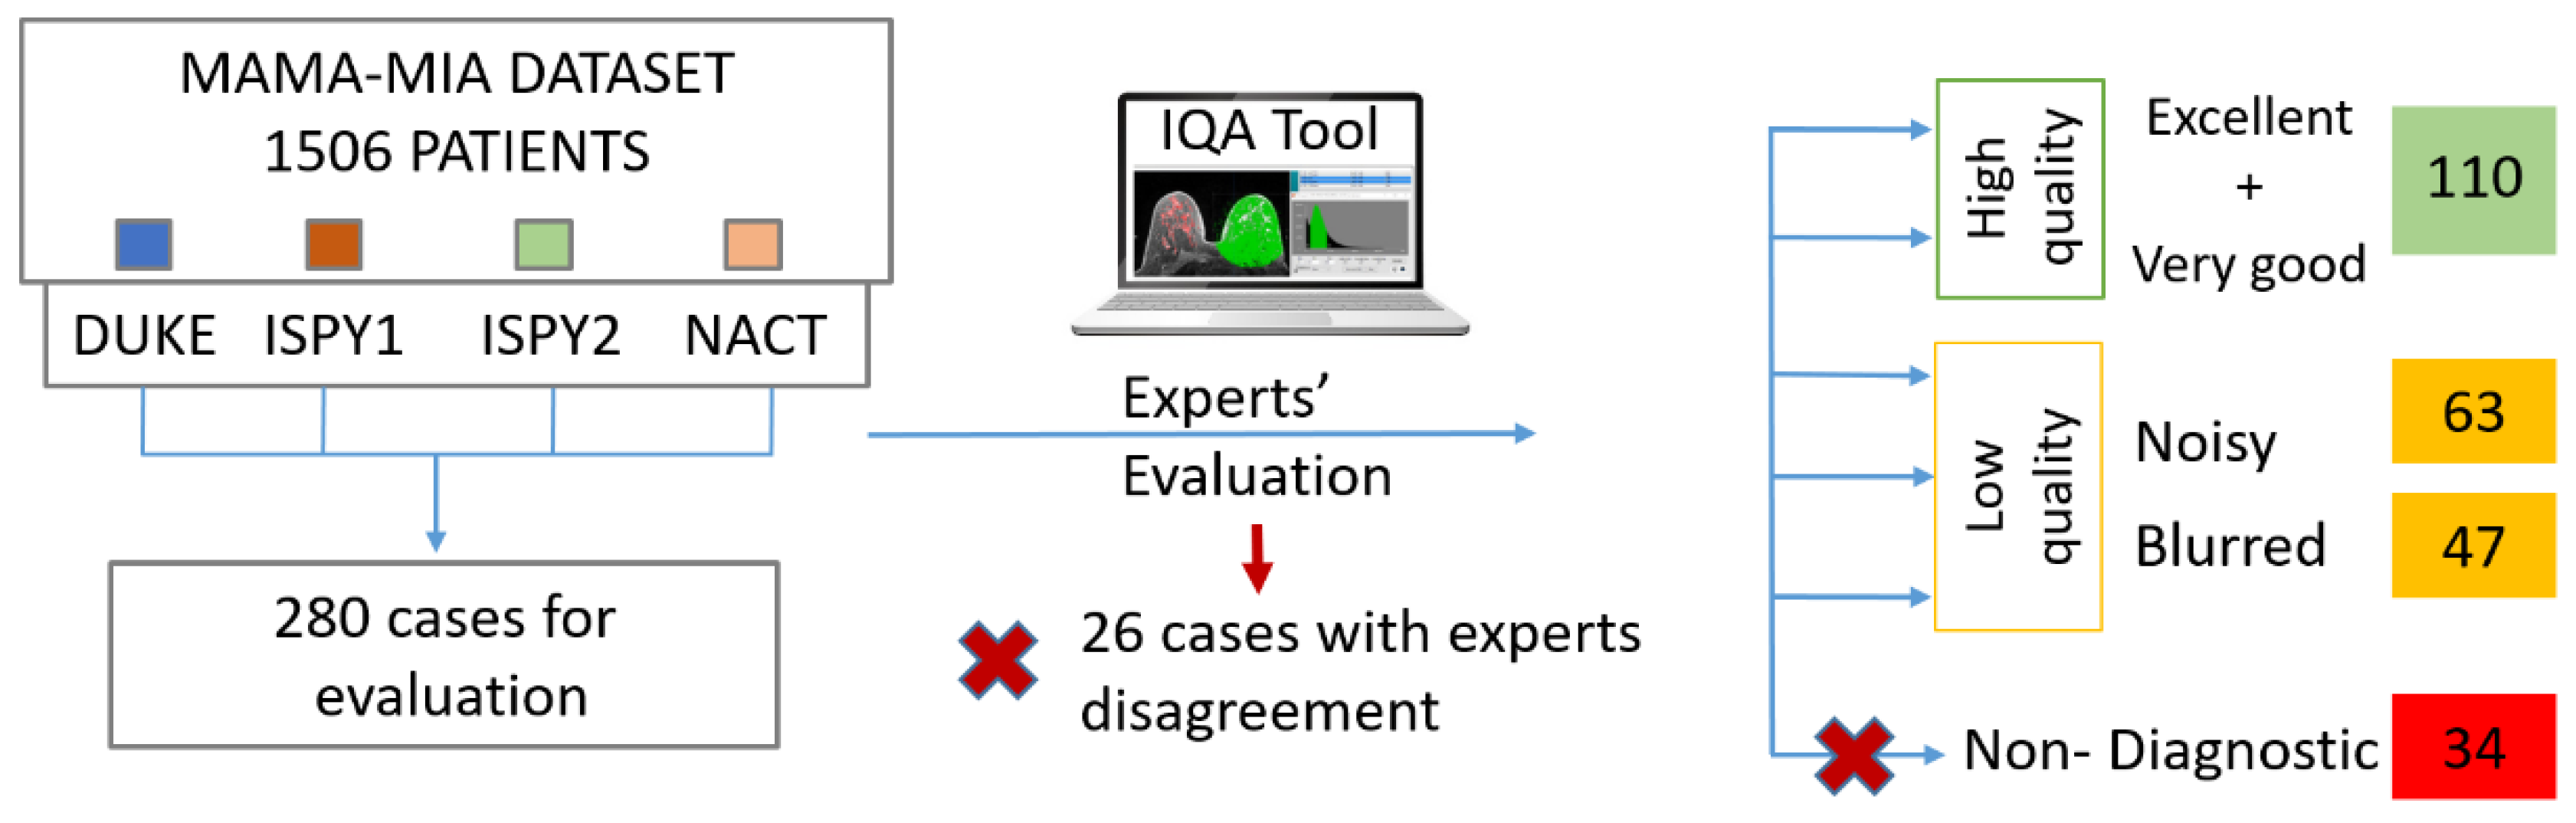
Figure 2.
Image quality labeling examples. a) High quality image, b) low quality image (noisy), c) low quality image of unacceptable quality (non-diagnostic, excluded from the analysis, blurred also presenting a number of artifacts, i.e., zebra, aliasing and susceptibility). At the bottom of each image the anonimized patient's identifier is presented.
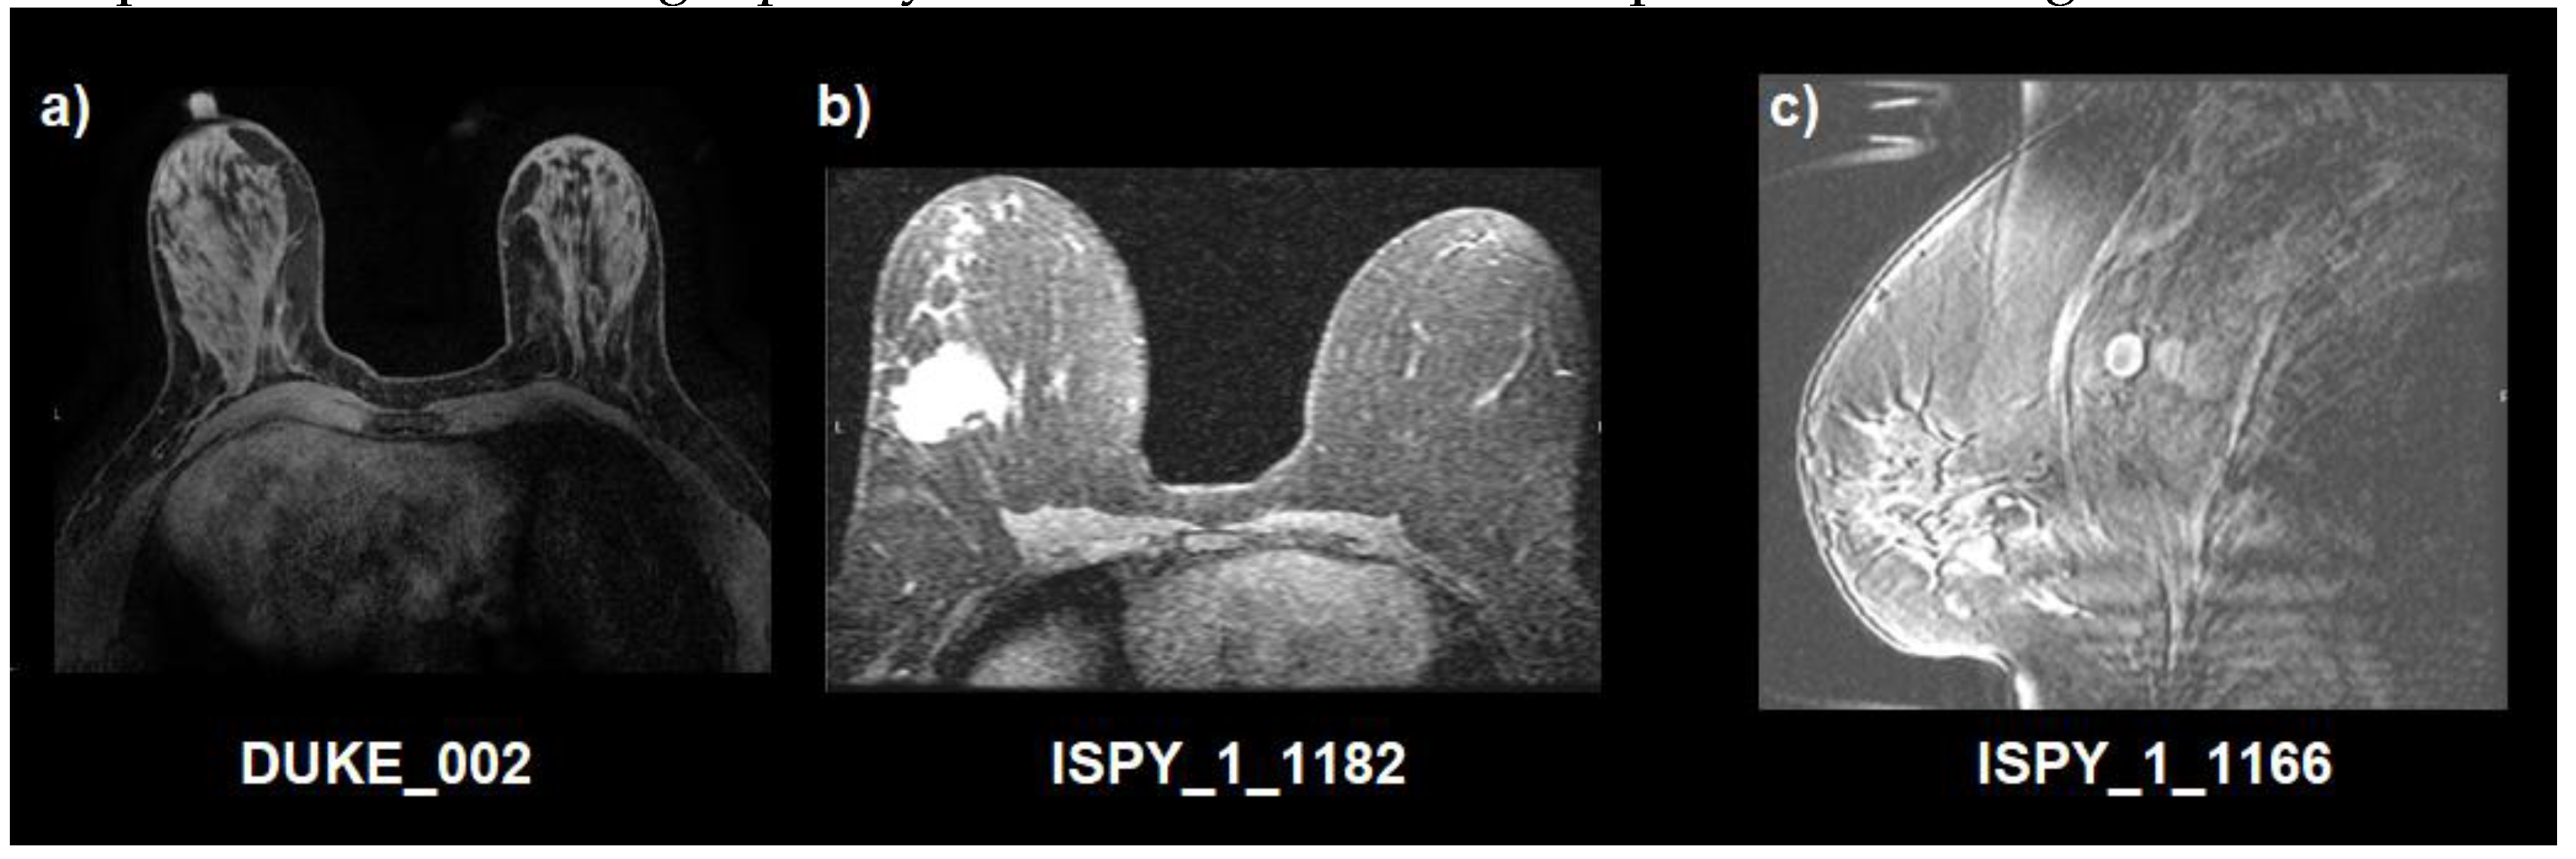
Figure 3.
Experimental set up - workflow of IQA showing the two scenarios explored.
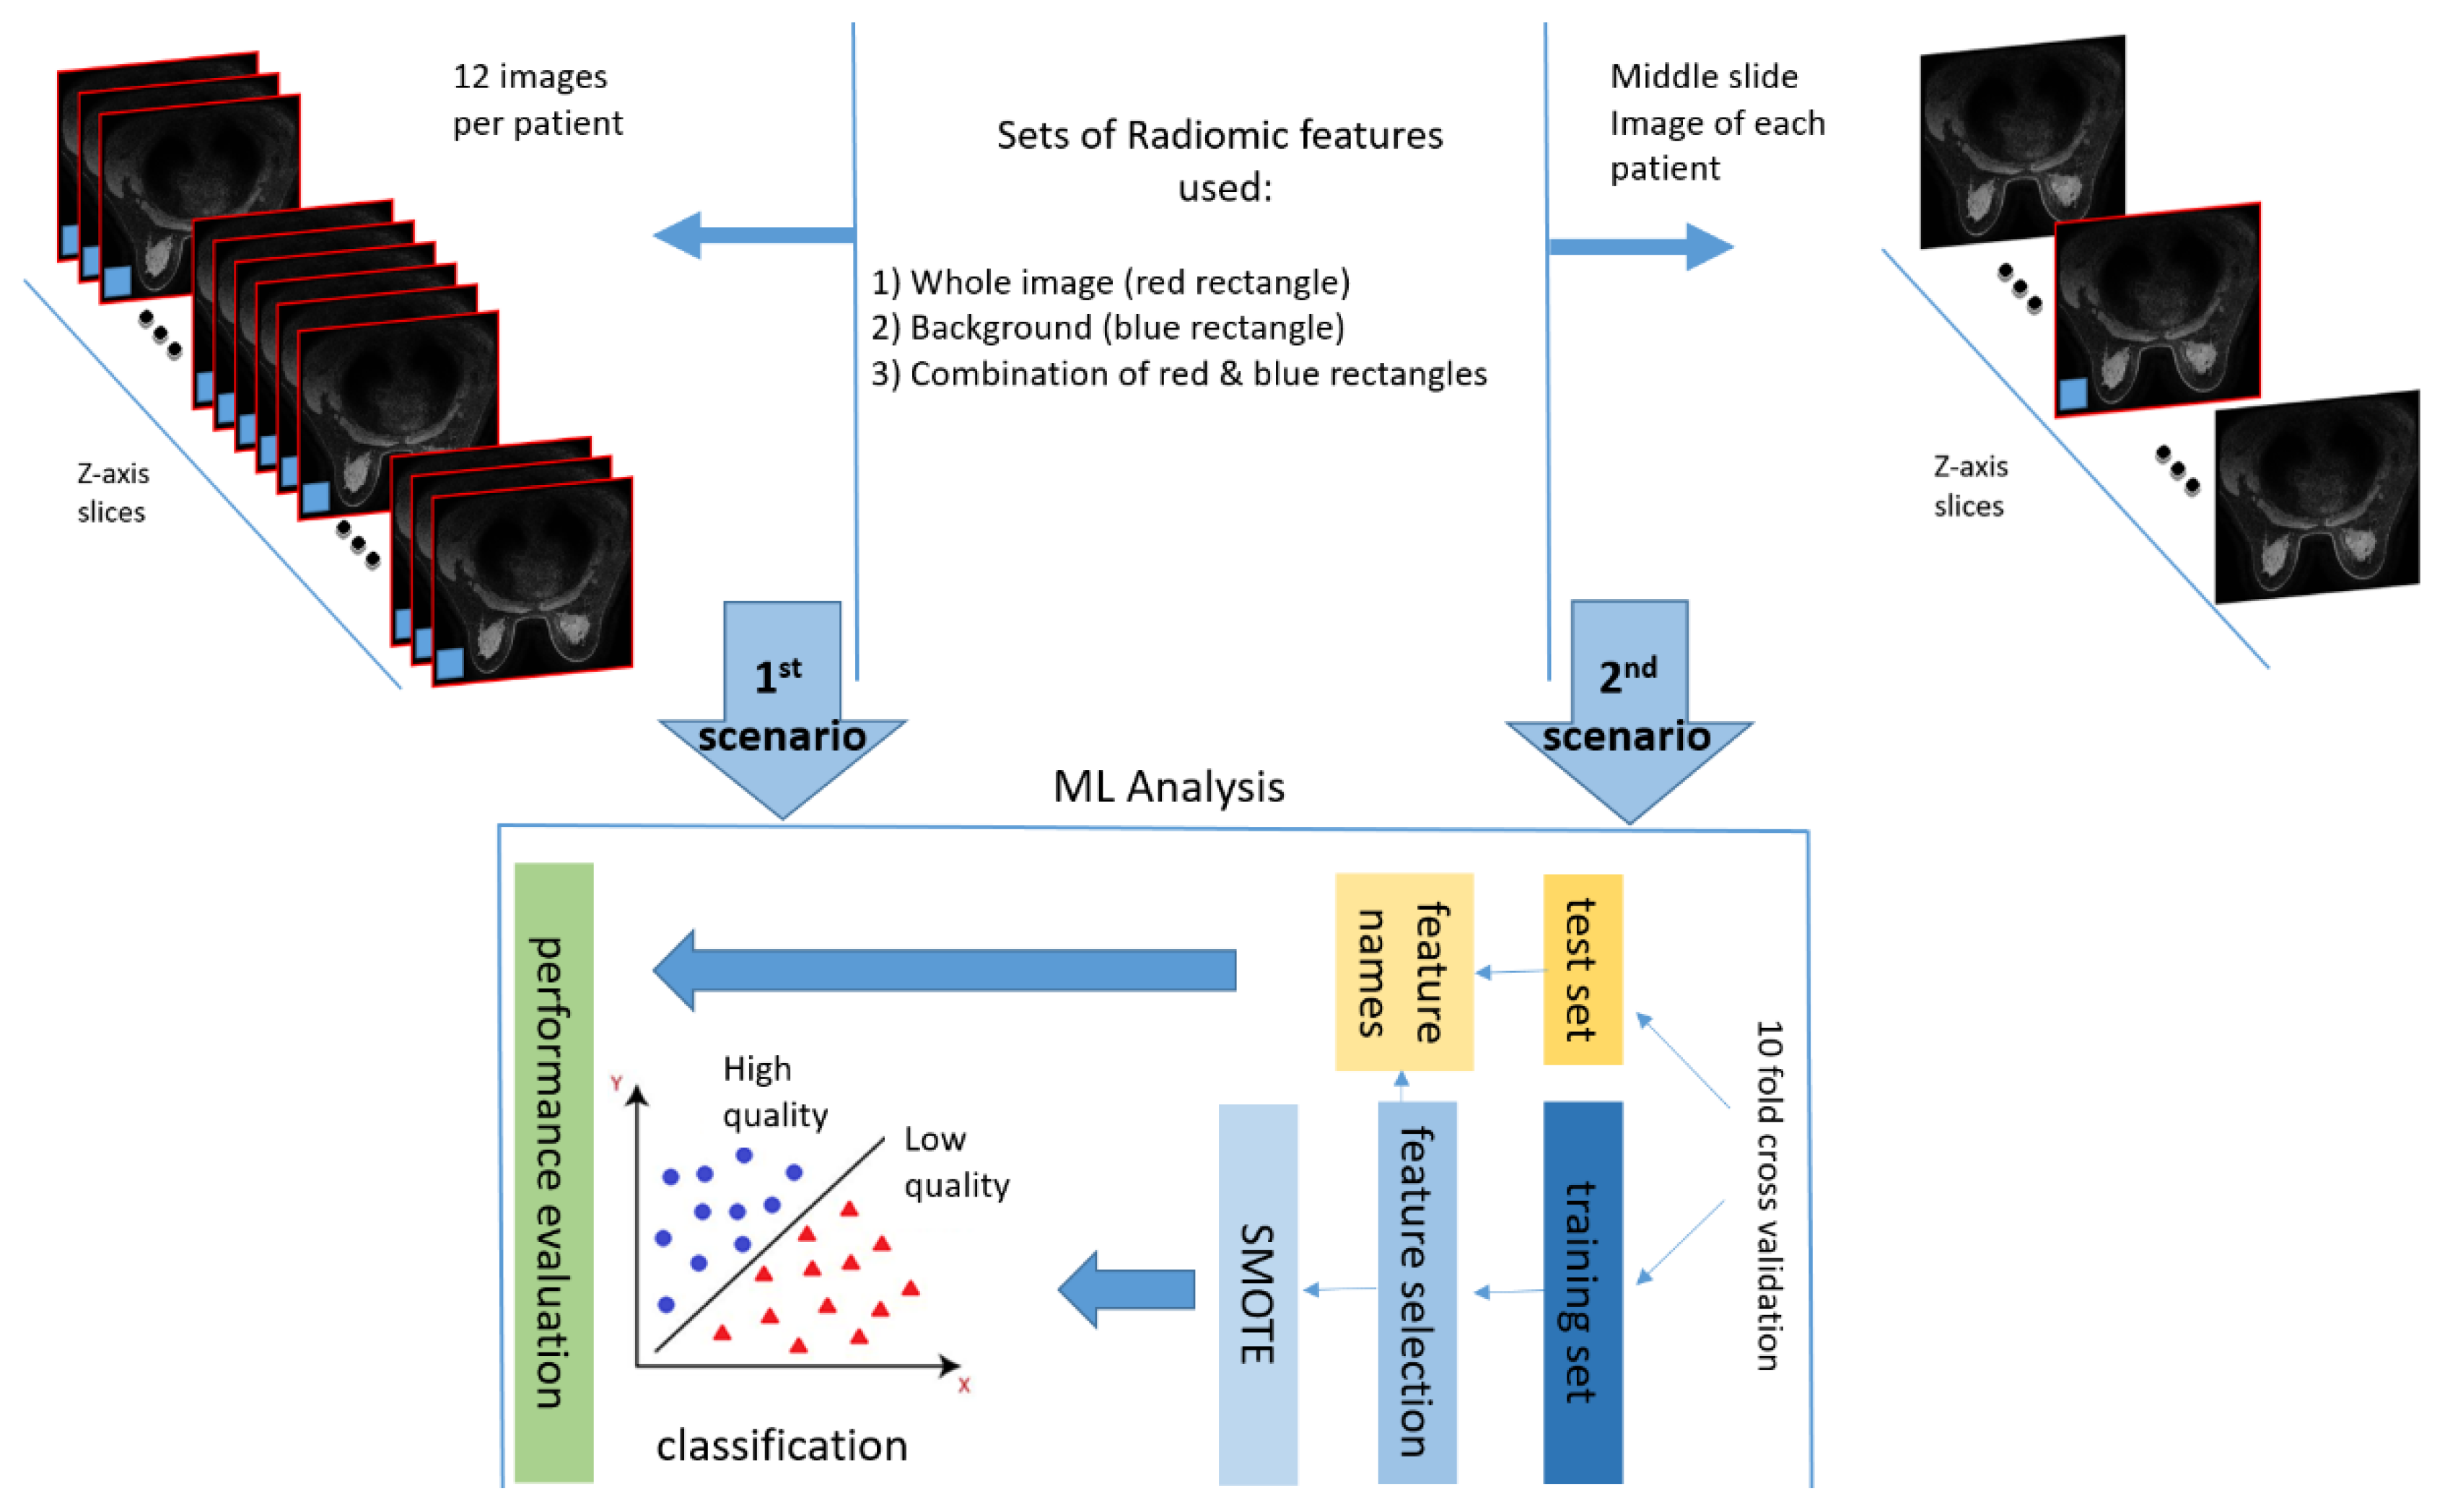
Figure 4.
Best model’s (middle slice and combination of radiomics from whole image and background) summary plot of the SHAP analysis explaining the impact/importance of each feature to classify between high and low image quality with the SVM classifier. It has to be noted that feature names that end with ‘_bg’ refer to the background ROI features.
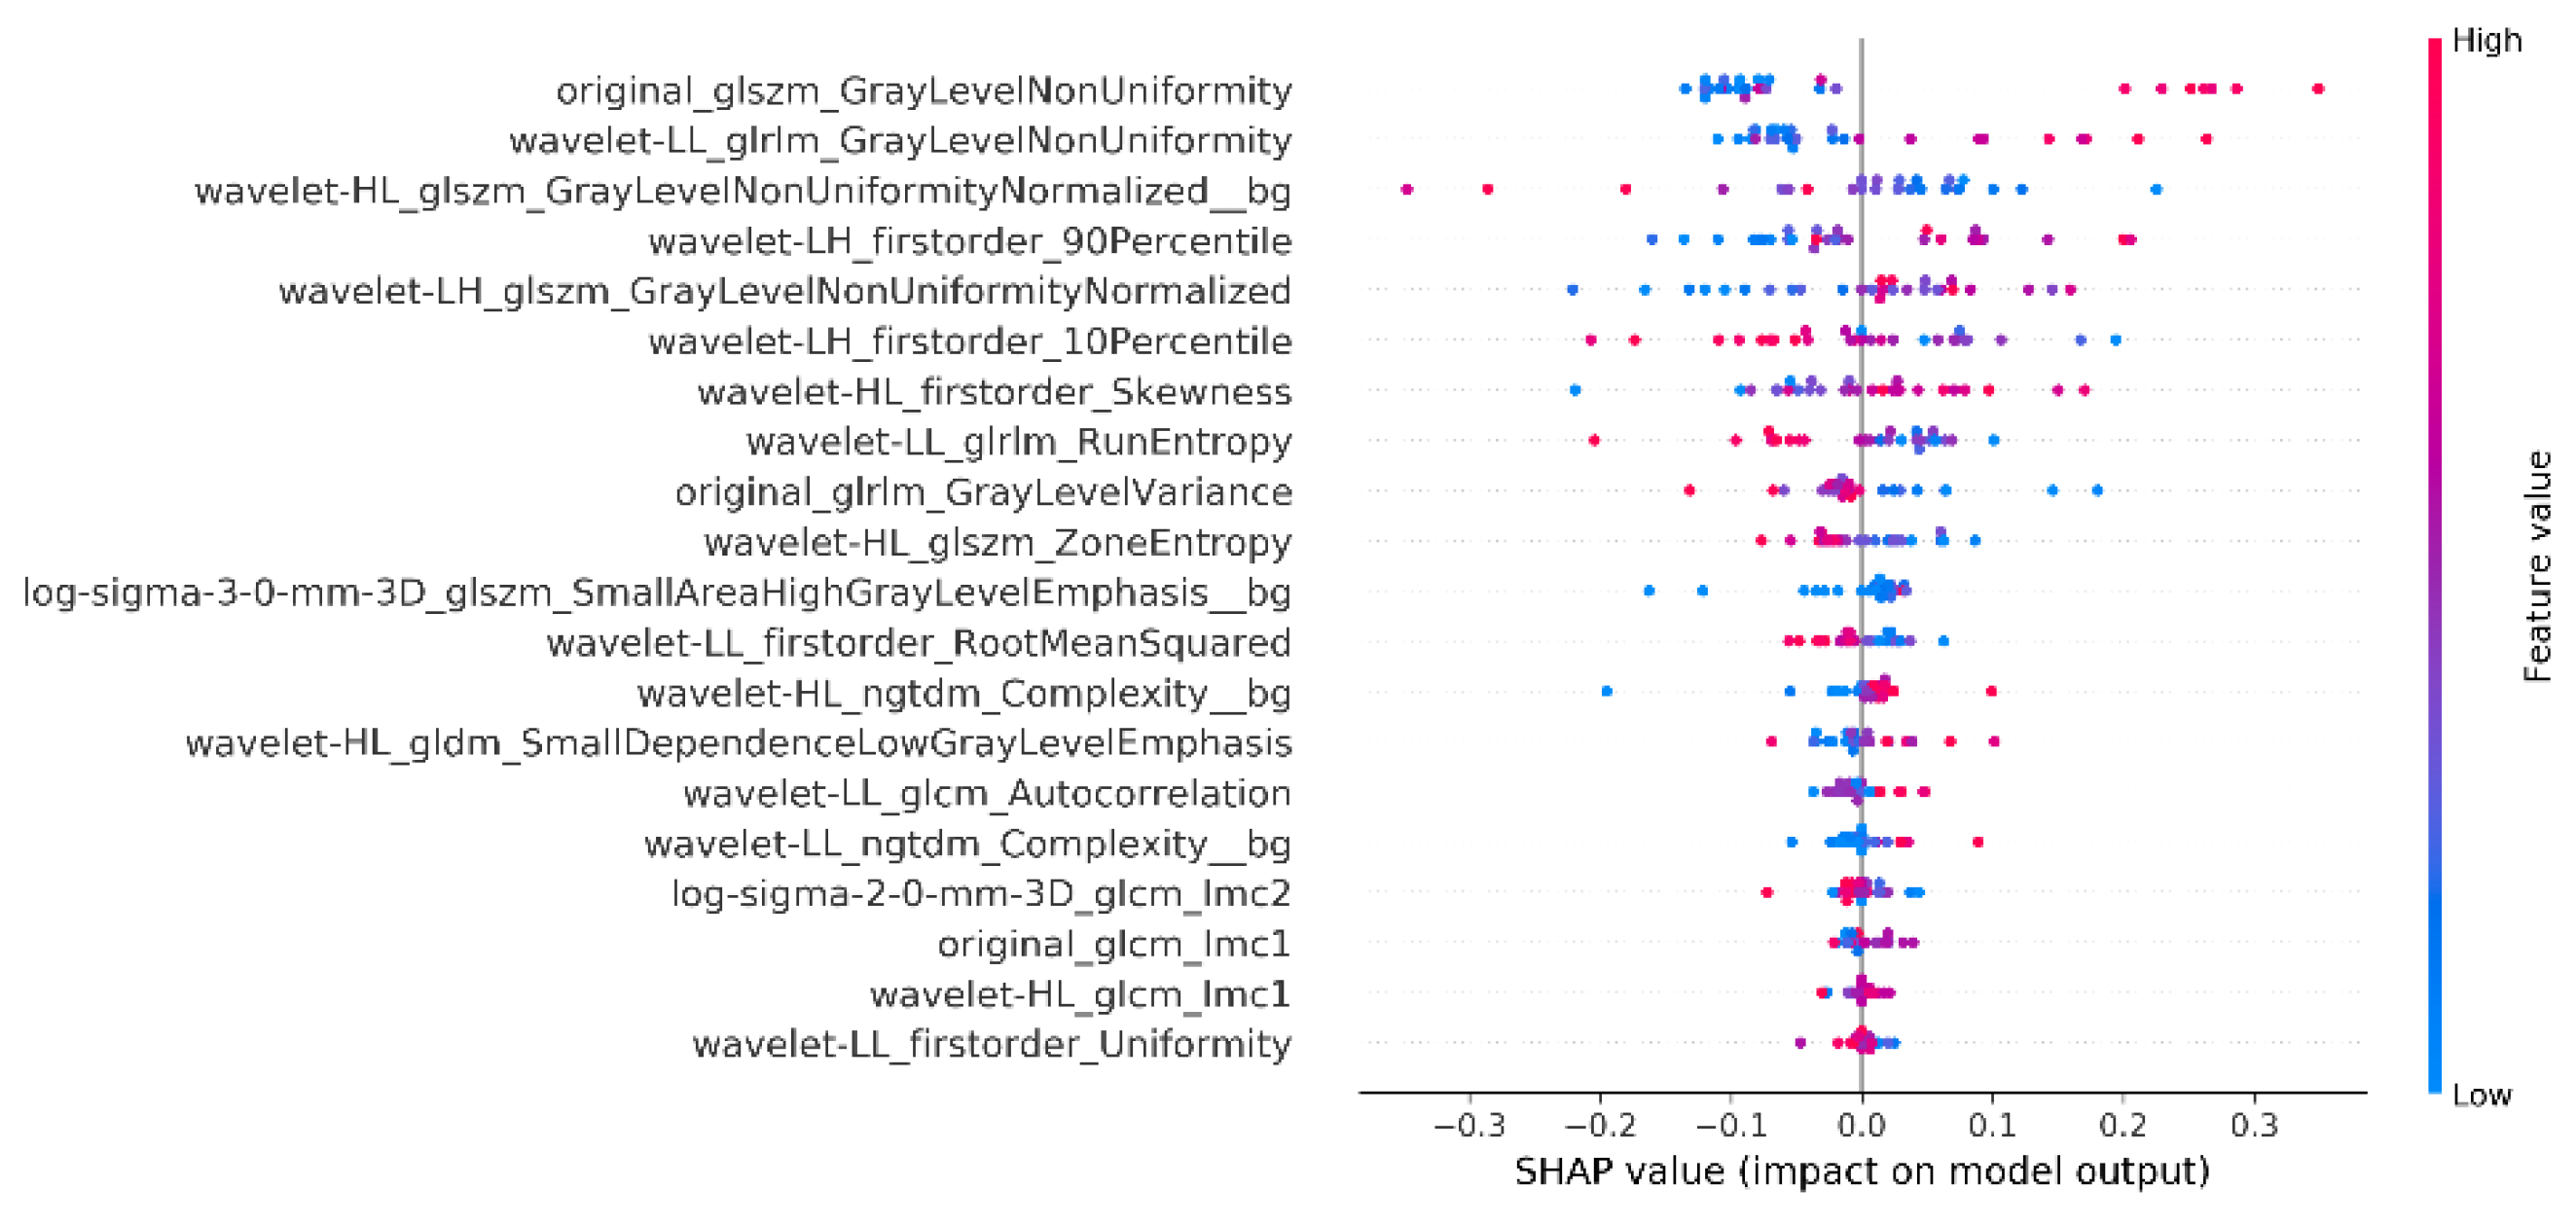

Table 1.
Performance evaluation metrics for classification of images as high or low quality images for a number of different classifiers. The results presented are for the whole image, background region as well as the combined analysis with features from both areas. Values correspond to mean ± standard deviation (SD) and are evaluated on the 12-slice per patient option (1st scenario).
| Set of features used | Classifier | Sensitivity (± SD) | Specificity (± SD) | ACC (± SD) | AUC (± SD) |
| Whole Image | Logistic Regression | 69.99 ± 10.76 | 78.91 ± 7.32 | 74.54 ± 4.14 | 83.49 ± 5.07 |
| SVM | 75.34 ± 14.65 | 80.77 ± 11.01 | 78.11 ± 7.27 | 86.15 ± 4.04 | |
| KNN | 66.21 ± 12.78 | 81.80 ± 8.04 | 74.06 ± 7.01 | 82.26 ± 5.40 | |
| Random Forest | 74.38 ± 11.37 | 83.59 ± 10.05 | 79.03 ± 5.85 | 85.96 ± 4.68 | |
| AdaBoost | 73.42 ± 14.08 | 78.16 ± 10.74 | 75.91 ± 5.66 | 83.46 ± 5.20 | |
| Gaussian NB | 60.78 ± 14.21 | 67.10 ± 16.76 | 64.10 ± 4.80 | 72.79 ± 6.41 | |
| Background | Logistic Regression | 66.67 ± 12.43 | 87.23 ± 7.86 | 80.42 ± 5.24 | 85.35 ± 4.24 |
| SVM | 69.94 ± 15.38 | 80.70 ± 7.33 | 77.29 ± 7.47 | 80.82 ± 8.16 | |
| KNN | 66.67 ± 12.43 | 74.24 ± 11.99 | 71.88 ± 9.00 | 78.64 ± 9.87 | |
| Random Forest | 52.98 ± 17.40 | 90.80 ± 3.27 | 78.48 ± 6.66 | 85.25 ± 7.16 | |
| AdaBoost | 59.23 ± 23.61 | 86.20 ± 9.45 | 77.35 ± 8.42 | 80.03 ± 10.23 | |
| Gaussian NB | 31.25 ± 19.25 | 94.37 ± 6.18 | 73.66 ± 8.33 | 60.89 ± 19.24 | |
|
Whole Image + Background |
Logistic Regression | 71.15 ± 7.45 | 79.95 ± 11.06 | 75.62 ± 6.03 | 83.73 ± 5.66 |
| SVM | 70.19 ± 8.10 | 81.59 ± 8.14 | 76.07 ± 6.15 | 83.13 ± 6.80 | |
| KNN | 61.54 ± 10.88 | 86.26 ± 4.26 | 74.18 ± 5.08 | 78.96 ± 6.51 | |
| Random Forest | 69.23 ± 9.42 | 81.66 ± 11.38 | 75.59 ± 9.01 | 87.30 ± 7.74 | |
| AdaBoost | 73.08 ± 12.76 | 81.66 ± 10.81 | 77.53 ± 9.82 | 84.59 ± 7.20 | |
| Gaussian NB | 67.31 ± 12.01 | 49.45 ± 15.18 | 58.17 ± 10.54 | 67.34 ± 9.84 |
* Bold row indicates the best performance.
Table 2.
Performance evaluation metrics for classification of images as high or low quality images for a number of different classifiers. The results presented are for the whole image, background region as well as the combined analysis with features from both areas. Values correspond to mean ± standard deviation (SD) and are evaluated on the single (middle) slice per patient option (2nd scenario).
| Set of features used | Classifier | Sensitivity (± SD) | Specificity (± SD) | ACC (± SD) | AUC (± SD) |
| Whole Image | Logistic Regression | 72.32 ± 9.06 | 74.11 ± 13.80 | 73.21 ± 7.99 | 80.04 ± 6.97 |
| SVM | 67.86 ± 11.29 | 78.57 ± 13.36 | 73.21 ± 9.62 | 84.63 ± 5.11 | |
| KNN | 39.29 ± 17.86 | 91.07 ± 11.15 | 65.18 ± 6.12 | 78.16 ± 5.50 | |
| Random Forest | 77.68 ± 6.62 | 77.68 ± 16.15 | 77.68 ± 6.86 | 84.41 ± 6.00 | |
| AdaBoost | 70.54 ± 13.09 | 75.89 ± 11.26 | 73.21 ± 3.99 | 81.51 ± 4.98 | |
| Gaussian NB | 54.46 ± 17.83 | 76.79 ± 10.56 | 65.63 ± 7.97 | 75.77 ± 7.12 | |
| Background | Logistic Regression | 30.29 ± 20.16 | 71.70 ± 9.48 | 51.00 ± 12.17 | 53.10 ± 16.36 |
| SVM | 25.55 ± 17.09 | 82.55 ± 11.74 | 54.05 ± 12.84 | 49.57 ± 14.76 | |
| KNN | 23.83 ± 21.59 | 66.00 ± 14.79 | 44.92 ± 9.23 | 41.89 ± 14.92 | |
| Random Forest | 30.84 ± 19.27 | 67.03 ± 10.78 | 48.94 ± 8.81 | 52.69 ± 12.57 | |
| AdaBoost | 41.00 ± 20.83 | 67.03 ± 9.30 | 54.02 ± 7.38 | 55.53 ± 11.58 | |
| Gaussian NB | 28.50 ± 17.89 | 87.16 ± 7.94 | 57.83 ± 11.04 | 51.37 ± 16.69 | |
|
Whole Image + Background |
Logistic Regression | 79.81 ± 9.28 | 80.84 ± 10.30 | 80.32 ± 7.26 | 86.26 ± 7.21 |
| SVM | 85.51 ± 8.70 | 80.01 ± 8.54 | 82.76 ± 6.28 | 89.37 ± 4.64 | |
| KNN | 68.27 ± 11.58 | 79.05 ± 11.12 | 73.66 ± 5.80 | 85.16 ± 5.14 | |
| Random Forest | 73.63 ± 11.27 | 81.04 ± 14.16 | 77.34 ± 7.12 | 88.08 ± 6.64 | |
| AdaBoost | 74.52 ± 10.77 | 82.83 ± 9.97 | 78.67 ± 4.01 | 84.19 ± 6.68 | |
| Gaussian NB | 68.20 ± 22.93 | 82.83 ± 10.78 | 75.52 ± 13.13 | 82.98 ± 10.21 |
* Bold rows indicate the best performance.
Disclaimer/Publisher’s Note: The statements, opinions and data contained in all publications are solely those of the individual author(s) and contributor(s) and not of MDPI and/or the editor(s). MDPI and/or the editor(s) disclaim responsibility for any injury to people or property resulting from any ideas, methods, instructions or products referred to in the content. |
© 2025 by the authors. Licensee MDPI, Basel, Switzerland. This article is an open access article distributed under the terms and conditions of the Creative Commons Attribution (CC BY) license (http://creativecommons.org/licenses/by/4.0/).
Copyright: This open access article is published under a Creative Commons CC BY 4.0 license, which permit the free download, distribution, and reuse, provided that the author and preprint are cited in any reuse.


