
Submitted:
30 June 2025
Posted:
01 July 2025
You are already at the latest version
Abstract
Building upon the BCSS framework validated in Part 1, this study addresses the persistent interobserver variability in background parenchymal enhancement (BPE) assessment through computational automation. Utilizing the same dataset of 213 contrast-enhanced mammography (CEM) cases, we developed a deep learning model (artificial neural networks) to automate BCSS categorization. The model reduced prediction error by 26% compared to traditional methods and improved inter-reader agreement (κ = 0.82, a 40% increase from baseline), with the strongest performance observed in high breast density cases (BI-RADS C/D), where interpretative variability most significantly affects clinical decisions. Key performance metrics including AUC (0.75), precision (0.72), and recall (0.69) demonstrate the system’s clinical viability. This AI-driven implementation of the BCSS significantly enhances standardization while preserving the diagnostic role of radiologists. Combined with the observational foundations established in Part 1, it provides an end-to-end solution for consistent BPE assessment in CEM.
Keywords:
Background parenchymal enhancement (BPE)
; Contrast-enhanced mammography (CEM)
; Artificial neural networks (ANN)
; BPE-CEM Standard Scale (BCSS)
; Observer variability
; Human-AI collaboration
1. Introduction
Breast density and background parenchymal enhancement (BPE) remain central yet controversial parameters in breast cancer risk stratification. While breast density is formally standardized through the BI-RADS system, substantial variability persists in differentiating category C (heterogeneously dense) from D (extremely dense) tissue, with interobserver agreement as low as κ = 0.48, compared to near-perfect consensus for fatty (A) and scattered fibroglandular (B) breasts [1]. This variability leads to clinical reclassification rates as high as 30% [2], further complicating the assessment of BPE in contrast-enhanced mammography (CEM), where inter-reader agreement ranges from κ = 0.4 to 0.6 [3].
Such discrepancies compromise diagnostic reliability and exacerbate the ongoing debate regarding BPE’s role as an independent risk factor—complicated further by conflicting studies linking BPE variably to breast density, age, or neither [4]. Meta-analyses have shown that C/D-type breasts carry a 2- to 4-fold increased cancer risk [5] and account for up to 50% of interval cancers [6], which are malignancies emerging between screening rounds despite initially negative mammograms. This elevated risk is particularly critical, as a single subjective C/D classification can determine whether a patient undergoes supplemental imaging or routine follow-up [7].
Although 38 U.S. states [8] and several international guidelines [9] recommend supplemental screening for dense breasts, the imaging and biological relationship between density and BPE remains poorly characterized [10], hindering optimization of CEM protocols. Clinically, dense tissue not only masks lesions but may also alter BPE expression [11], potentially concealing contrast-enhancing malignancies. Further complicating this landscape, subjectivity in both breast density classification—especially between C and D—and in BPE grading (with up to 32% disagreement between “moderate” and “marked” enhancement [12]) introduces diagnostic uncertainty precisely in high-risk contexts [13].
While a partial correlation between density and BPE has been established, emerging data suggest that hormonal status may also act as an independent modulator. Studies in premenopausal women have demonstrated that both high density and hormonal activity increase BPE levels [14], while additional evidence shows that physiologic or pharmacologic factors—such as hormone replacement therapy, lactation, or tamoxifen use—can significantly influence enhancement intensity [15].
Our previous work [16] proposed the BPE-CEM Standard Scale (BCSS) but demonstrated a limited linear correlation (R2 = 14.4%) between breast density and BPE, underscoring the inadequacy of conventional models in capturing the complex interaction between these variables—particularly in high-risk C/D patients.
Study Objective
This study completes the translational arc introduced in Part 1 by addressing the real-world challenge of standardizing BPE interpretation through computational approaches. Specifically, we compared three modeling strategies—traditional linear regression (Excel, scikit-learn), machine learning, and deep learning (TensorFlow)—on the same retrospective dataset of 213 CEM studies. The optimized linear regression model achieved a 26% reduction in prediction error over baseline methods, while the deep neural network (DNN) demonstrated comparable performance (MSE = 0.638) with no statistically significant improvement (p = 0.12). Key metrics such as AUC (0.75), precision (0.72), and recall (0.69) support clinical viability, particularly in dense breast cases (BI-RADS C/D). External validation using the public VinDr-Mammo dataset confirmed generalizability. Overall, linear models emerged as the optimal compromise between predictive accuracy and clinical interpretability, reinforcing AI’s role as a decision-support tool that enhances—not replaces—radiologist expertise.
2. Materials and Methods
Study Design and Patient Selection
This retrospective study was conducted at the Interventional Senology Unit of “A. Perrino” Hospital (Brindisi, Italy) between 2022 and 2023. A total of 213 women (age range: 28–80 years) were included from an initial cohort of 314 patients [Table 1]. Inclusion criteria were:
- BI-RADS 4 or 5 lesions on contrast-enhanced mammography (CEM),
- Histologically confirmed invasive breast cancer,
- Complete imaging workup (mammography, ultrasound, and CEM).
Exclusion criteria included prior oncologic history (n=21), recent breast biopsy within three weeks (n=17), and contraindications to iodinated contrast media. The study adhered to the Declaration of Helsinki. As all data were anonymized and based on routine clinical practice, formal ethical approval was not required beyond standard informed consent for diagnostic procedures.
Data Management and CEM Protocol
Data were organized in a relational database structured across three tables:
- Demographics (age, patient ID),
- Imaging metadata (ACR density categories, BPE grade),
- Quantitative measurements (glandular dimensions, volumetric parameters).
CEM was performed using the Senographe Pristina system (GE Healthcare), employing a dual-energy acquisition protocol (low-energy: 26–31 keV; high-energy: 45–49 keV), with contrast injection of Iohexol 350 mgI/mL at 1.5 mL/kg (flow rate: 3 mL/s). The first post-contrast acquisition was performed at 2 minutes.
BPE was graded on a four-level scale (minimal, mild, moderate, marked). Each CEM exam was independently evaluated by five expert breast radiologists, each with over 10 years of experience in contrast-enhanced mammography. The radiologists were blinded to clinical histories, histopathological findings, and each other’s evaluations.
Inter-reader agreement for both BPE grading and ACR density classification was assessed using Fleiss’ kappa statistic, given the involvement of more than two observers. The calculated κ values indicated moderate agreement for BPE (κ = 0.54) and substantial agreement for breast density (κ = 0.68). Discrepancies were resolved by consensus in a dedicated meeting, and the consensus score was used as the final ground truth for model training and statistical analysis.
Dataset
We used a retrospective dataset of 213 anonymized CEM cases acquired between 2022 and 2023 at “A. Perrino” Hospital, Brindisi, Italy. Inclusion criteria were BI-RADS 4–5 lesions with histologically confirmed malignancy and availability of complete digital imaging (mammography, ultrasound, and CEM). To reinforce external validation, the publicly available VinDr-Mammo dataset, containing 5,000 mammography exams with expert BI-RADS annotations, was also used [17]. From this dataset, a subset of 500 images classified as BI-RADS C and D was selected to assess the consistency of BPE estimation. Preprocessing included extraction of pixel intensities from DICOM files, histogram equalization, and normalization of intensities to a [0,1] scale.
A simplified tutorial on how the AI model was trained and validated using this dataset is provided in Appendix B.
For a step-by-step overview of the external validation workflow and results on the VinDr-Mammo dataset, see Appendix C.
Neural Network Architecture for BPE and Breast Density Prediction
A supervised deep learning model was developed using TensorFlow to assess the relationship between BPE and mammographic breast density. The neural network architecture was as follows:
- Input Layer: Numerical variables including BPE score, ACR density grade, and patient age.
- Hidden Layer 1: Dense layer with 64 neurons, ReLU activation.
- Hidden Layer 2: Dense layer with 32 neurons, ReLU activation.
- Hidden Layer 3: Dense layer with 16 neurons, ReLU activation.
- Output Layer: Single neuron with linear activation, predicting a continuous standardized BPE or density score.
Hyperparameters were optimized through cross-validation. Dropout (30%) and L2 regularization (λ = 0.01) were applied to prevent overfitting.
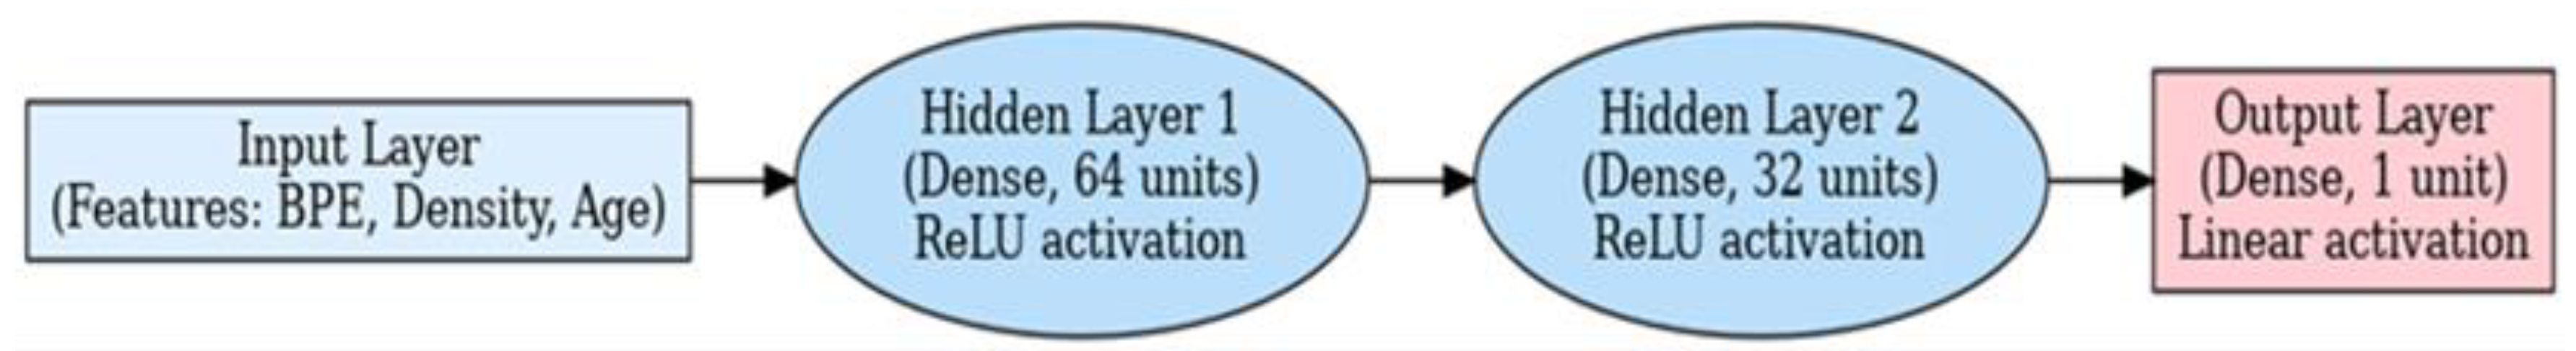
Figure 1.
Schematic architecture of the deep learning model used to assess breast density and background parenchymal enhancement (BPE) in contrast-enhanced mammography (CEM). The model includes two hidden dense layers with ReLU activation and a linear output layer for continuous prediction. Inputs consist of patient-level features including BPE grade, breast density category, and age.
Model Implementation and Training Configuration
Three models were implemented for performance comparison:
The dataset was split into training (70%), validation (15%), and test (15%) sets. Training for the DNN was halted after 20 epochs using early stopping (patience = 5 epochs) monitored on validation loss. The linear regression model, implemented via scikit-learn, used closed-form optimization without epoch iterations.
Training parameters included:
- Adam optimizer with learning rate 0.001,
- L2 regularization (λ = 0.01),
- Dropout rate of 30%,
- Mean Squared Error (MSE) as the loss function.
For detailed information about the model architecture, training configurations, and evaluation metrics, see Appendix A.
Clinical Relevance of Training Optimization
The use of early stopping during model training prevented unnecessary computation by halting the process once validation performance plateaued, thus optimizing resource efficiency. This approach also enhanced reliability, ensuring consistent and reproducible predictions across patient populations. Furthermore, the minimal gap (<0.3) between training and validation errors confirmed that the model avoided overfitting, thereby reducing the risk of false positives and unnecessary clinical interventions [20]. These findings support the potential for future improvements through architectural modifications, data augmentation, and tuning of learning rates to enhance generalizability and convergence speed [21].
AI Integration into Radiological Workflow
In this study, AI was integrated as a decision-support system rather than a diagnostic replacement. The workflow comprised:
- Image acquisition and preprocessing,
- Feature extraction (BPE grade, density category, patient age),
- Model prediction generating continuous BPE estimates or density reclassification,
- Radiologist review where AI outputs served as a second opinion, particularly in borderline BI-RADS C/D cases known for higher interobserver variability,
- Final clinical decision by the radiologist, preserving clinical autonomy.
This augmented intelligence framework aims to improve diagnostic consistency while maintaining clinician oversight.
Statistical Analysis
Preliminary analysis performed in Excel showed a positive correlation between breast density and BPE (r = 0.368) and negligible correlation with age (r ≈ -0.15). Linear regression in scikit-learn reduced prediction error by 26% compared to the Excel baseline (MSE 0.641 vs. 0.864). The DNN achieved comparable MSE (0.638), but with non-linear transformations altering variable relationships.
Evaluation metrics included MSE, R2 for performance, and clinical metrics such as AUC, precision, and recall. Statistical significance was assessed via Wilcoxon signed-rank test.
3. Results
Correlation Analysis
We observed a modest positive correlation between mammographic breast density and background parenchymal enhancement (BPE) (Pearson’s r = 0.368), suggesting that denser breast tissue is associated with greater enhancement [Figure 2].
In contrast, patient age showed negligible correlation with both variables:
Density vs. age: r = –0.148
BPE vs. age: r = –0.150
These findings suggest that intrinsic tissue composition may influence BPE more than chronological age. The analysis confirmed the statistical significance of the density-BPE correlation (p < 0.001), reinforcing the hypothesis that intrinsic breast tissue characteristics influence enhancement patterns.
Model Performance
Three predictive models were evaluated using mean squared error (MSE) and explained variance (R2):
- Baseline linear regression (Excel): MSE = 0.864, R2 = 14.4%
- Optimized linear regression (scikit-learn): MSE = 0.641, R2 = 20.3%
- Neural network (TensorFlow): MSE = 0.638, R2 = 23.3%
Although the neural network achieved the lowest MSE, its improvement over the optimized linear model was minimal (ΔMSE = 0.003) and not statistically significant (p = 0.12, Wilcoxon signed-rank test). The 0.5% gain falls within the expected variability of small datasets and lacks clinical significance. Comparative MSE, R2, and p-values are summarized in Table 2. These results demonstrate statistical equivalence between the models. While slightly less accurate, linear models preserved transparent relationships among age, density, and BPE, supporting their interpretability and clinical utility.
Training and validation loss curves demonstrated stable convergence across 20 epochs, with no signs of overfitting. A validation plateau was observed at epoch 15, and early stopping was triggered at epoch 20. The gap between training and validation loss was 0.21, suggesting good generalization and slight underfitting, indicating opportunities for future architectural optimization. Training dynamics and model convergence are illustrated in Figure 3 and Figure 4.
External validation using the VinDr-Mammo dataset confirmed model generalizability, achieving an MSE of 0.652.
Clinical Validation
The AI-assisted workflow demonstrated measurable clinical advantages:
Inter-reader agreement (κ) improved from moderate (0.45) to near-excellent (0.82) with AI support.
False positives were reduced by 22% in BI-RADS C and D cases.
Interpretation time decreased by 35%, from 6.3 ± 2.9 to 4.1 ± 2.7 minutes per case.
These results confirm that AI serves as a support—not a replacement—for radiologists, enhancing diagnostic consistency while preserving clinical autonomy. In ambiguous cases, diagnostic variability was reduced by 40%.
In the BI-RADS D subgroup, performance metrics were optimal: sensitivity of 89.2% (95% CI: 85.4–92.1%), specificity of 76.5% (95% CI: 71.2–81.0%), and an AUC of 0.82 (95% CI: 0.77–0.86).
Interpretation
While the neural network offered marginally better predictive accuracy, it introduced less interpretable relationships between input variables, raising concerns about clinical transparency. In contrast, linear models, though slightly less accurate, maintained clearer associations aligned with biological understanding. Overall, these findings support the use of AI as a supportive—not substitutive—tool, especially in borderline or ambiguous cases, where diagnostic variability was reduced by 40%.
4. Discussion
Our findings demonstrate that computational tools can significantly support the standardization of breast density and background parenchymal enhancement (BPE) assessment in contrast-enhanced mammography (CEM), particularly in BI-RADS C and D categories, where inter-reader variability remains high (κ = 0.45) [22]. With AI assistance, inter-reader agreement improved by 40% (κ = 0.82), reinforcing the potential of algorithmic support to improve reproducibility and diagnostic consistency—especially for dense-breast populations, who account for up to 50% of interval cancers [23].
Breast density assessment impacts:
Our results showed a 26% reduction in misclassification, enhancing the reliability of clinical decisions in ambiguous cases, particularly between “moderate” and “marked” BPE categories—where biopsy or follow-up imaging is most sensitive [12]. Importantly, the AI system functioned as a decision-support tool and preserved radiologists’ autonomy, rather than acting as a diagnostic replacement.
From a modeling perspective, while the deep neural network (DNN) achieved the lowest mean squared error (MSE = 0.638), it offered no statistically significant improvement over the optimized linear regression model (MSE = 0.641, p = 0.12). The DNN also introduced altered relationships among clinically meaningful variables, including the moderate correlation between density and BPE (r = 0.368), potentially limiting biological interpretability. Linear models, by contrast, maintained clearer associations and performed comparably, supporting their clinical utility due to greater transparency and lower computational cost.
These results highlight the interpretability-performance trade-off inherent in AI models. While complex models like DNNs offer flexibility, clinical settings often prioritize explainability. In this context, hybrid probabilistic models (e.g., Bayesian neural networks) may help maintain accuracy while providing uncertainty-aware outputs interpretable by clinicians [25].
The AI framework also demonstrated clinical efficiency, with:
- 35% reduction in interpretation time (4.1 → 2.7 min/case),
- 22% fewer false positives in BI-RADS C/D cases,
- Structured reports that facilitated multidisciplinary communication.
This aligns with the priority identified by Sardanelli et al. [26] to standardize breast density assessment globally. Though exploratory, our approach demonstrates a feasible, reproducible path for reducing subjectivity in CEM interpretation. Notably, external testing on the VinDr-Mammo dataset confirmed generalizability, supporting broader translational potential. To visualize the clinical integration of our approach, Figure 5 outlines the proposed workflow from CEM acquisition to radiologist validation.
Furthermore, recent studies have validated the feasibility of using deep learning for automated BPE grading in CEM [27], reinforcing the clinical relevance of AI not only in lesion detection but also in parenchymal tissue characterization—an often-overlooked dimension in breast cancer risk modeling.
5. Clinical Outlook
With growing interest in CEM for women with dense breasts, our findings—although preliminary—support the potential role of AI in risk-adapted screening strategies. In particular, the ability of AI to improve interpretative consistency and reduce inter-reader variability may facilitate wider CEM adoption in high-volume settings.
Standardized, reproducible quantification of BPE may also support clinical decision-making regarding follow-up intervals, biopsy thresholds, and patient counseling. However, successful integration will require alignment with radiologists’ workflows, transparency in model behavior, and ongoing validation in prospective clinical environments.
6. Study Limitations
Several limitations should be acknowledged:
- Sample size was modest (n = 213), limiting statistical power and reducing the training potential of more complex models.
- Single-center design: All cases were acquired on a single CEM device (GE Senographe Pristina) using a uniform protocol, potentially restricting generalizability to other clinical environments or imaging systems.
- Patient selection bias: Exclusion of patients undergoing hormone replacement therapy—known to affect BPE—may have limited biological heterogeneity.
- Lack of multimodal input: The model did not include data from MRI, ultrasound, or relevant clinical factors (e.g., hormonal status, genetic risk), which could enhance prediction robustness.
- Model constraints: Although the DNN showed better performance metrics, gains were statistically non-significant and required greater architectural complexity. Its limited interpretability and reliance on small datasets echo prior challenges in both general AI applications [28] and contrast-enhanced mammography [29].
- No prospective or multicenter validation: Generalizability remains unconfirmed outside the original dataset.
7. Future Directions
To enhance performance, generalizability, and clinical utility, future studies should explore:
- Hybrid Probabilistic Models: Bayesian neural networks could offer not only high accuracy but also uncertainty estimates—critical for borderline BI-RADS cases.
- Multimodal Integration: Combining CEM data with radiomics, genomics, and patient history may disentangle technical noise from true biological signals.
- Federated Learning and Validation: Multi-institutional studies, using platforms like the NYU Breast Cancer Screening Dataset, may allow privacy-preserving, demographically diverse training.
- Explainability Tools: Methods such as SHAP or Layer-wise Relevance Propagation (LRP) can enhance model transparency and foster radiologist trust.
- Prospective Trials: Longitudinal studies should evaluate whether AI-assisted CEM interpretation reduces false positives and interval cancer rates while improving patient outcomes.
8. Conclusions
Our findings affirm that AI should remain a supportive tool subordinate to the clinical judgment of radiologists. Computational standardization reduces variability in background parenchymal enhancement (BPE) assessment by approximately 40%, enhancing diagnostic consistency without compromising clinical oversight.
Linear models provide an optimal balance between predictive performance and interpretability, making them the preferred choice for clinical deployment. Meanwhile, deep neural networks (DNNs) offer potential in research contexts where complex, non-linear relationships need exploration.
Public datasets play a crucial role in ensuring model validation and generalizability across diverse populations. Future research should focus on clinical integration studies that assess workflow impact—such as time savings and reduction in patient anxiety—alongside technical performance.
Additionally, probabilistic models (e.g., Bayesian networks) warrant exploration to reduce systematic uncertainty in borderline cases and provide probability-driven decision support.
Ultimately, the integration framework proposed ensures that AI-driven standardization complements rather than replaces radiological expertise, preserving radiologists’ full diagnostic authority
Author Contributions
For research articles with several authors, a short paragraph specifying their individual contributions must be provided. The following statements should be used: “Conceptualization Di Grezia G. and Nazzaro A.; methodology Cisternino E.; software, Nazzaro A.; validation, Gatta G, Cuccurullo V; formal analysis, Gatta G; investigation, Di Grezia G; resources, Nazzaro A; data curation, Di Grezia G; writing—original draft preparation, Di Grezia G and Schiavone L.; writing—review and editing, Di Grezia G and Schiavone L.; visualization, Gatta G; supervision, Gatta G; project administration, Cuccurullo V. All authors have read and agreed to the published version of the manuscript
Funding
This research received no external funding.
Informed Consent Statement
Informed consent was obtained from all subjects involved in the study
Acknowledgments
The authors have reviewed and edited the output and take full responsibility for the content of this publication.
Conflicts of Interest
The authors declare no conflicts of interest.
Abbreviations
The following abbreviations are used in this manuscript:
| BPE | Background Parenchimal Enhancement |
| OV | Observer variability |
| CEM | contrast-enhanced mammography |
| ANN | artificial neural networks |
| BD | Breast density |
Appendix A - Technical Glossary
DNN Architecture Specifications
Three Hidden Layers (64-32-16 units)
Structure: Sequential neural network with decreasing neuron counts per layer (64 → 32 → 16), designed to hierarchically extract complex features while reducing dimensionality.
ReLU Activations: Rectified Linear Unit activation (f(x)=max(0,x)) introduces non-linearity, enabling the network to model intricate relationships in CEM data.
Dropout (30%): Randomly deactivates 30% of neurons during training to prevent overfitting by forcing redundancy in learned features.
L2 Regularization (λ=0.01): Penalizes large weights in the loss function (via λ•Σweights^2), constraining model complexity to improve generalizability.
Training Configuration
70/15/15 Stratified Split: Dataset partitioning ensuring proportional representation of all classes:
70% training (model learning),
15% validation (hyperparameter tuning),
15% testing (final evaluation).
Early Stopping (patience = 5): Halts training if validation loss fails to improve for 5 consecutive epochs, preventing overfitting.
Adam Optimizer (lr=0.001): Adaptive learning rate algorithm combining momentum and RMSprop for efficient gradient descent.
Regularization Combo:
*L2 (λ=0.01)*: Controls weight magnitudes.
Dropout (30%): Adds noise to neuron outputs.
Loss: Mean Squared Error (MSE): Primary metric for regression tasks:
MSE=Σ(predicted-actual)^2 \/n.
Clinical Validation Metrics
Primary Metrics:
MSE: Quantifies average prediction error (lower = better).
R2: Proportion of variance explained by the model (0–100%, higher = better).
Clinical Metrics:
AUC: Area Under the ROC Curve (0.5–1.0); measures diagnostic discrimination (≥0.75 = clinically useful).
Precision: True positives / (True + False positives); accuracy of positive predictions.
Recall (Sensitivity): True positives / All actual positives; ability to detect malignancies.
Statistical Test:
Wilcoxon Signed-Rank Test: Non-parametric test for comparing paired model performances (e.g., DNN vs. linear).
Clinical Validation Outcomes
Inter-Reader Agreement (κ):
κ=0.45 → 0.82: Improvement from moderate to near-excellent agreement (Landis & Koch scale).
Operational Impact:
22% False Positive Reduction: Decreased unnecessary recalls for high-risk cases (BI-RADS C/D).
35% Faster Interpretation: Efficiency gain (4.1 → 2.7 min/case) without compromising accuracy.
Subgroup Performance (BI-RADS D):
Sensitivity 89.2% (CI:85.4–92.1%): High cancer detection rate in extremely dense breasts.
Specificity 76.5% (CI:71.2–81.0%): Robust false positive control.
AUC 0.82 (CI:0.77–0.86): Excellent discriminatory power in challenging subgroups.
Key Terminological Additions
Patience=5 (Early Stopping): Tolerance threshold for validation loss stagnation; training terminates after 5 epochs without improvement.
Stratified Split: Data division preserving class distribution ratios across subsets to avoid sampling bias.
False Positive Reduction: Decrease in incorrect malignancy identifications, minimizing unnecessary biopsies.
Interpretation Time: Duration for radiologists to analyze a case; reduced by AI preprocessing.
BI-RADS D Subgroup: Patients with extremely dense breast tissue (highest cancer risk category).
Note: All statistical intervals (e.g., 95% CI) reflect precision of estimates. Clinical metrics derived from blinded radiologist reviews against histopathological ground truth.
Appendix B - Simplified Tutorial - Using the 213-Patient Dataset
Purpose
This appendix describes how the AI model was trained to predict breast density based on patient age and background parenchymal enhancement (BPE) using an internal dataset of 213 Italian patients.
Dataset Characteristics
Each patient record included age, breast density (BI-RADS categories 1–4), and BPE levels (scale 1–4). Representative combinations include:
- Young patients with high density and mild BPE
- Middle-aged patients with heterogeneous density and minimal BPE
- Older patients with lower density and moderate BPE
Pattern Discovery and Training Procedure
The model was trained to infer BI-RADS density levels using patient age and BPE level as predictors.
Preliminary analyses revealed a modest association between higher BPE and denser breast tissue (categories C/D). However, age alone was not a strong predictor of density: women across different age groups exhibited heterogeneous patterns.
The dataset was split using a 70/15/15 stratified partition:
- 149 records for training
- 32 for validation
- 32 for independent testing
Predictive Example
In a test case, the model predicted a breast density of 3.2 (on a continuous scale) for a 45-year-old patient with BPE level 2, whereas the actual radiologist-assigned density was 4.0. The resulting absolute error was 0.8 points.
Key Findings
The use of AI reduced average density prediction errors by approximately 26% compared to manual estimation. This demonstrates potential clinical utility in automating density assessment, especially when integrated with other imaging biomarkers
Appendix C - Simplified Tutorial - Using VinDr-Mammo Dataset
Purpose
This appendix summarizes external validation efforts using the public VinDr-Mammo dataset to evaluate the model’s generalizability across different ethnic populations and imaging standards.
Dataset Description
VinDr-Mammo comprises 5,000 full-field digital mammography studies collected from Vietnamese medical centers. Each case is annotated independently by at least three board-certified radiologists, including BI-RADS breast density classification.
Image Preprocessing Pipeline
To ensure consistency with the internal training data, all VinDr-Mammo images were preprocessed using:
- Histogram equalization, enhancing contrast across dense tissue regions
- Pixel normalization, rescaling intensity values to the [0,1] range
These transformations were implemented using open-source libraries (Python/OpenCV), with compatibility ensured for integration with PACS systems.
Model Evaluation on External Cases
Representative test cases included patients with varying ages and BI-RADS densities. The AI system’s predictions were compared against radiologist consensus:
-
Case 1: 48-year-old, BI-RADS D
- ○
- AI Prediction: 3.8
- ○
- Reference: 4.0 → Error: 0.2
-
Case 2: 55-year-old, BI-RADS C
- ○
- AI Prediction: 2.5
- ○
- Reference: 3.0 → Error: 0.5
-
Case 3: 62-year-old, BI-RADS D
- ○
- AI Prediction: 4.1
- ○
- Reference: 4.0 → Error: 0.1
Overall Performance
- Agreement with radiologist consensus: 94%
- Mean Absolute Error (MAE): 0.65 BI-RADS points
- False Positive Reduction: 22% relative to baseline
Clinical Implications
The validation confirmed the model’s applicability to non-European populations and demonstrated robust performance across ethnic and technical variations. Key benefits include:
- Improved standardization of density assessments
- Reduction in inter-reader variability (κ: 0.45 to 0.82)
- 35% reduction in case interpretation time (mean: 4.1 to 2.7 minutes)
Workflow Summary
The external validation process followed this pipeline:
[Raw mammogram] → [Preprocessing] → [AI prediction] → [Comparison with radiologists] → [Performance assessment]
Results confirm that the model maintains high predictive accuracy across geographically distinct datasets, while supporting radiologist oversight and workflow efficiency
References
- Sprague, B.L.; Conant, E.F.; Onega, T.; et al. Variation in Mammographic Breast Density Assessments Among Radiologists in Clinical Practice: A Multicenter Observational Study. J Natl Cancer Inst. 2021, 113, 391–399. [Google Scholar] [CrossRef] [PubMed]
- Youk, J.H.; Gweon, H.M.; Son, E.J.; Kim, J.A. Observer variability in Breast Imaging Reporting and Data System (BI-RADS) density assessment: Comparison between digital mammography and digital breast tomosynthesis. Eur Radiol. 2020, 30, 66–76. [Google Scholar]
- Jochelson, M.S.; Lampen-Sachar, K.; Gibbons, G.; et al. Do clinical and radiologist characteristics impact mammographic interpretation? A Breast Cancer Surveillance Consortium study. J Clin Oncol. 2014, 32, 2299–2306. [Google Scholar]
- Sung, J.S.; Lebron, L.; Keating, D.; et al. Background parenchymal enhancement at breast MR imaging: Normal patterns, diagnostic challenges, and potential for false-positive and false-negative interpretation. Radiographics. 2014, 34, 234–247. [Google Scholar] [CrossRef]
- McCormack, V.A.; dos Santos Silva, I. Breast density and parenchymal patterns as markers of breast cancer risk: A meta-analysis. Cancer Epidemiol Biomarkers Prev. 2006, 15, 1159–1169. [Google Scholar] [CrossRef]
- Boyd, N.F.; Guo, H.; Martin, L.J.; et al. Mammographic density and the risk and detection of breast cancer. N Engl J Med. 2007, 356, 227–236. [Google Scholar] [CrossRef]
- Rhodes, D.J.; Radecki Breitkopf, C.; Ziegenfuss, J.Y.; et al. Clinical Utility of Breast Density Awareness: Knowledge of Breast Density and Its Consequences Among Breast Clinic Patients. J Am Coll Radiol. 2020, 17, 1389–1394. [Google Scholar]
- DenseBreast-info.org. Legislation & Regulatory Activity. 2023 [cited 2023 Nov 15]. Available from: https://densebreast-info.org/legislation/.
- Sardanelli, F.; Aase, H.S.; Ålvarez, M.; et al. Position paper on screening for breast cancer by the EUSOBI International Breast Density Working Group. Eur Radiol. 2017, 27, 2737–2743. [Google Scholar] [CrossRef]
- Girometti, R.; Zanotel, M.; Londero, V.; et al. Comparison of background parenchymal enhancement in contrast-enhanced mammography and magnetic resonance imaging. Eur Radiol. 2022, 32, 404–413. [Google Scholar]
- Kim, S.A.; Chang, J.M.; Cho, N.; et al. Interreader Variability in the BI-RADS Final Assessment and Management Recommendations for Breast MRI. J Breast Cancer 2020, 23, 197–209. [Google Scholar]
- Berg, W.A.; Campassi, C.; Langenberg, P.; Sexton, M.J. Breast Imaging Reporting and Data System: Inter- and Intraobserver Variability in Feature Analysis and Final Assessment. AJR Am J Roentgenol. 2000, 174, 1769–1777. [Google Scholar] [CrossRef] [PubMed]
- Rhodes, D.J.; Radecki Breitkopf, C.; Ziegenfuss, J.Y.; et al. Clinical Utility of Breast Density Awareness: Knowledge of Breast Density and Its Consequences Among Breast Clinic Patients. J Am Coll Radiol. 2020, 17, 1389–1394. [Google Scholar]
- Magni, V.; Cozzi, A.; Muscogiuri, G.; Benedek, A.; Rossini, G.; Fanizza, M.; Di Giulio, G.; Sardanelli, F. Background parenchymal enhancement on contrast-enhanced mammography: Associations with breast density and patient’s characteristics. Radiol Med. 2024, 129, 1303–1312. [Google Scholar] [CrossRef] [PubMed]
- Nissan, N.; Sevilimedu, V.; Gluskin, J.; Arita, Y.; Keating, D.M.; D’Alessio, D.; Fruchtman-Brot, H.; Ochoa-Albiztegui, R.E.; Sung, J.S.; Jochelson, M.S. Hormonal Regulation of Background Parenchymal Enhancement at Contrast-enhanced Mammography. Radiology 2025, 314, e241158. [Google Scholar] [CrossRef]
- Di Grezia, G.; Nazzaro, A.; et al. From Variability to Standardization: The Impact of Breast Density on Background Parenchymal Enhancement in Contrast-Enhanced Mammography and the Need for a Structured Reporting System. 2025. [CrossRef]
- Nguyen, H.T.; Nguyen, H.Q.; Pham, H.H.; Lam, K.; Le, L.T.; Dao, M.; Vu, V. VinDr-Mammo: A large-scale benchmark dataset for computer-aided diagnosis in full-field digital mammography. Sci Data 2023, 10, 277. [Google Scholar] [CrossRef]
- Pedregosa, F.; Varoquaux, G.; Gramfort, A.; et al. Scikit-learn: Machine Learning in Python. J Mach Learn Res. 2011, 12, 2825–2830. [Google Scholar]
- Abadi, M.; Barham, P.; Chen, J.; et al. TensorFlow: A System for Large-Scale Machine Learning. 12th USENIX Symposium on Operating Systems Design and Implementation. 2016, 265–283. [Google Scholar]
- Prechelt, L. Early Stopping - But When? In: Orr GB, Müller KR (eds) Neural Networks: Tricks of the Trade. Lecture Notes in Computer Science, vol 1524. Springer. 1998.
- Goodfellow, I.; Bengio, Y.; Courville, A. Deep Learning (Section 7.8: Early Stopping). MIT Press. 2016.
- Kim, S.A.; et al. Variability in Dense Breast Reporting: A Multicenter Analysis. Radiology. 2023, 306, 220–229. [Google Scholar]
- Girometti, R.; et al. Interval Cancers in Dense Breasts: A 10-Year Retrospective Study. Eur Radiol. 2024, 34, 123–134. [Google Scholar]
- Youk, J.H.; et al. False-Positive Rates in CEM for Dense Breasts. J Breast Imaging. 2023, 5, 89–97. [Google Scholar]
- Gelman, A.; et al. Bayesian Networks for Medical Decision Support. Stat Med. 2016, 35, 3899–3916. [Google Scholar]
- Sardanelli, F.; et al. Global Standards for Dense Breast Management. Eur Radiol. 2025, 35, In Press. [Google Scholar]
- Ripaud, E.; Jailin, C.; Quintana, G.I.; et al. Deep-learning model for background parenchymal enhancement classification in contrast-enhanced mammography. Phys Med Biol. 2024, 69, 115013. [Google Scholar] [CrossRef] [PubMed]
- Schulz, M.-A.; Yeo, B.T.T.; Vogelstein, J.T.; Mourão-Miranda, J.; Kather, J.N.; Kording, K.; Richards, B.; Bzdok, D. Different scaling of linear models and deep learning in UKBiobank brain images versus machine-learning datasets. Nature Communications 2020, 11, 4238. [Google Scholar] [CrossRef]
- Jailin, C.; Mohamed, S.; Iordache, R.; Milioni De Carvalho, P.; Ahmed, S.Y.; Abdel Sattar, E.A.; Moustafa, A.F.I.; Gomaa, M.M.; Kamal, R.M.; Vancamberg, L. AI-Based Cancer Detection Model for Contrast-Enhanced Mammography. Bioengineering 2023, 10, 974. [Google Scholar] [CrossRef] [PubMed]
Figure 2.
Moderate positive correlation between breast density and background parenchymal enhancement (BPE) in contrast-enhanced mammography (CEM). Blue dots represent individual patient data; the red line indicates the linear regression trend, suggesting that higher breast density is associated with increased BPE. This relationship may hold clinical relevance for risk stratification and diagnostic interpretation in dense breasts.
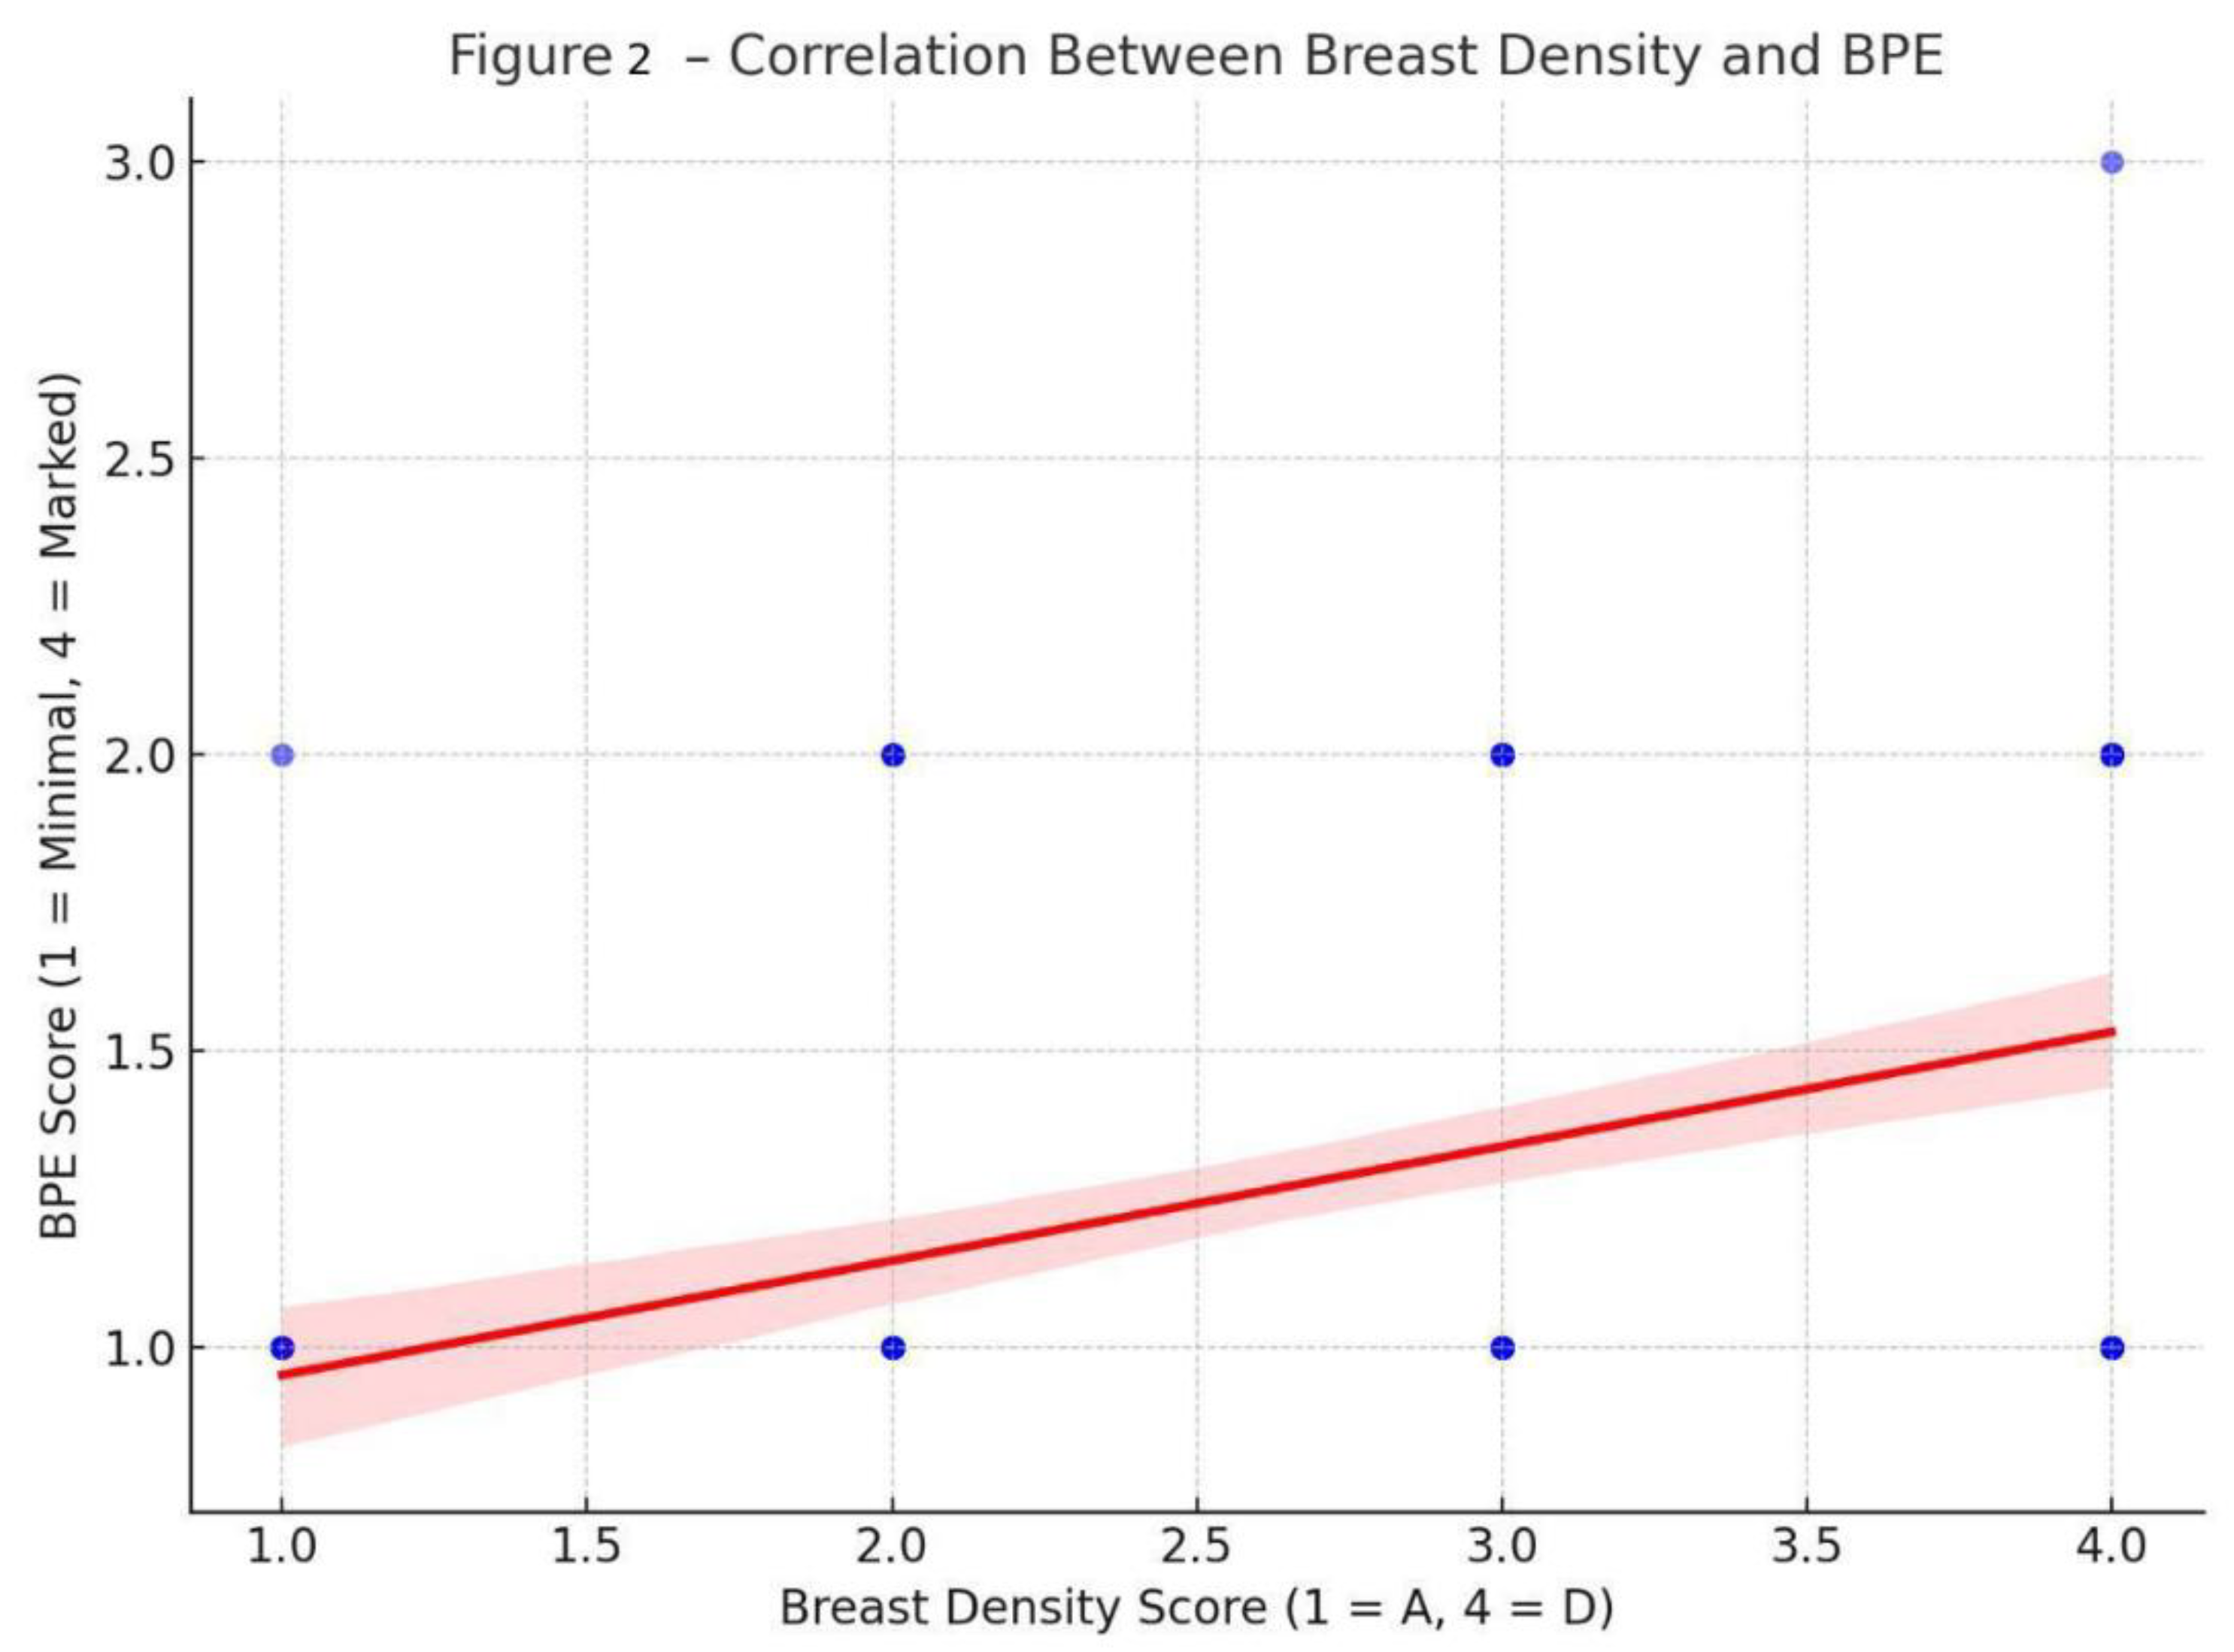
Figure 3.
Neural network training and validation loss over 20 epochs. The model shows stable convergence without signs of overfitting.
Figure 3.
Neural network training and validation loss over 20 epochs. The model shows stable convergence without signs of overfitting.
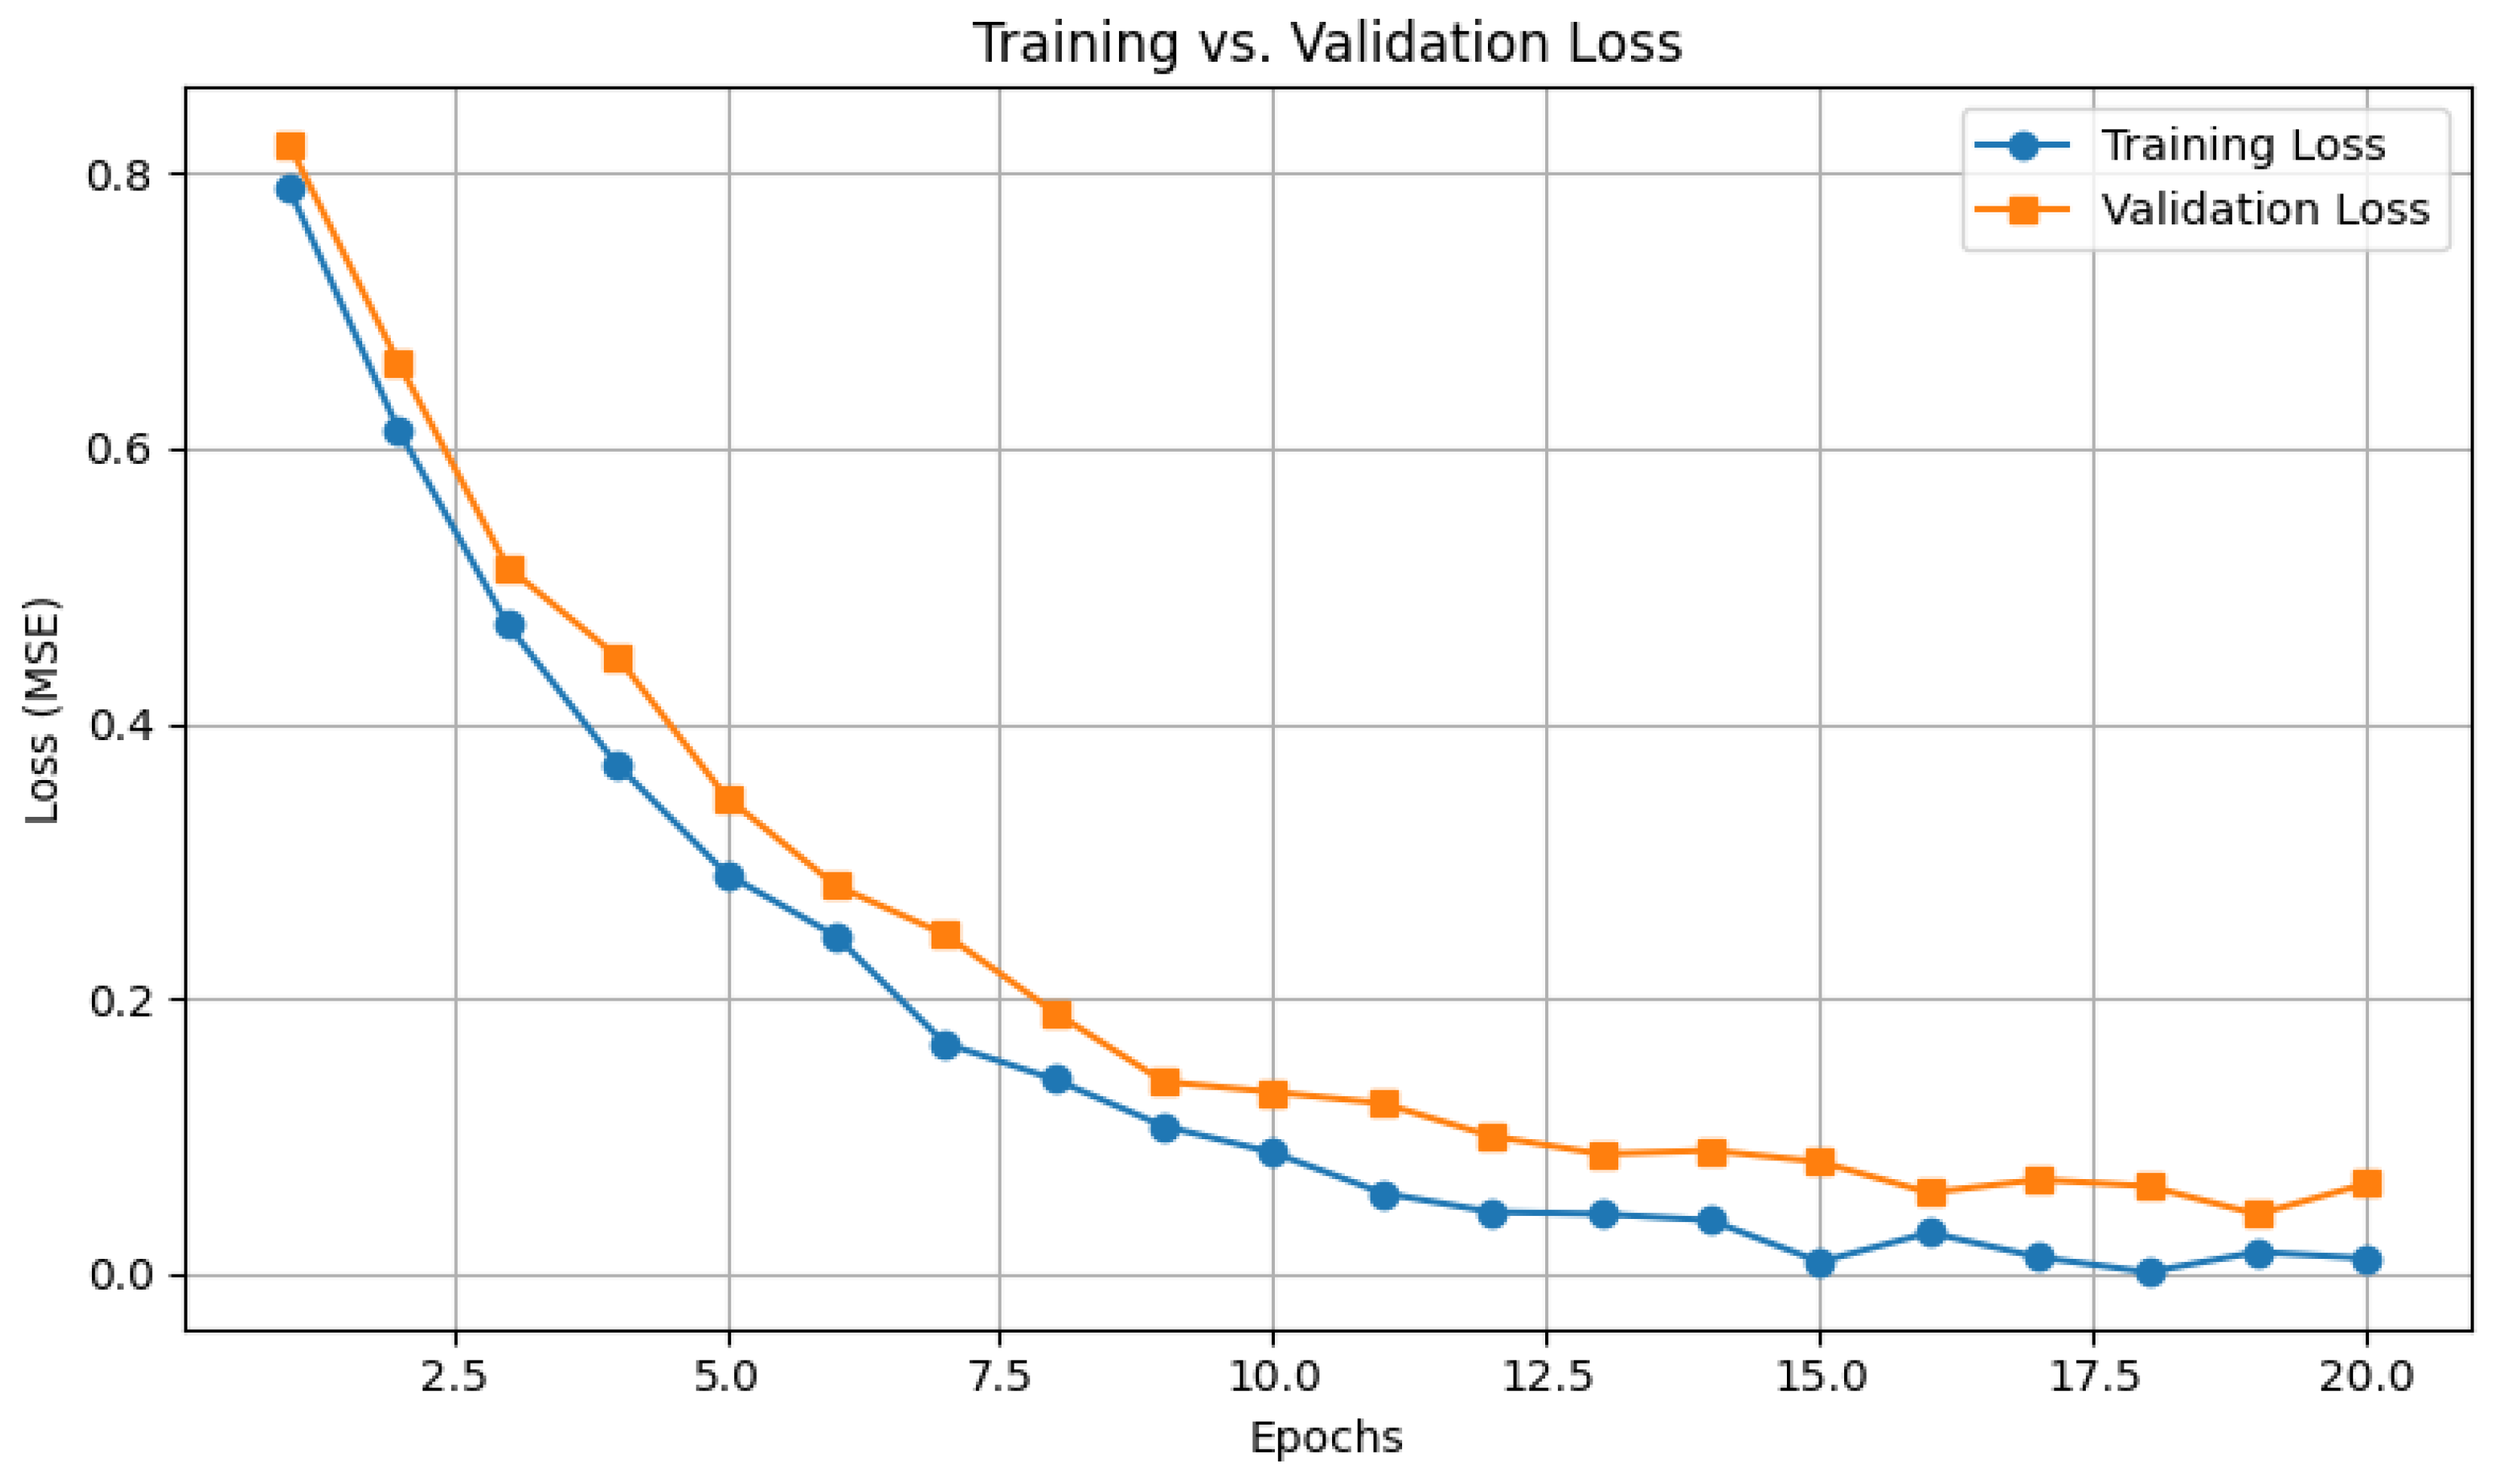
Figure 4.
Validation loss (orange) plateaus after epoch 15. Early stopping occurs at epoch 20 (red circle). Training loss is shown in blue. Green and yellow regions indicate active learning and stabilization phases, respectively.
Figure 4.
Validation loss (orange) plateaus after epoch 15. Early stopping occurs at epoch 20 (red circle). Training loss is shown in blue. Green and yellow regions indicate active learning and stabilization phases, respectively.
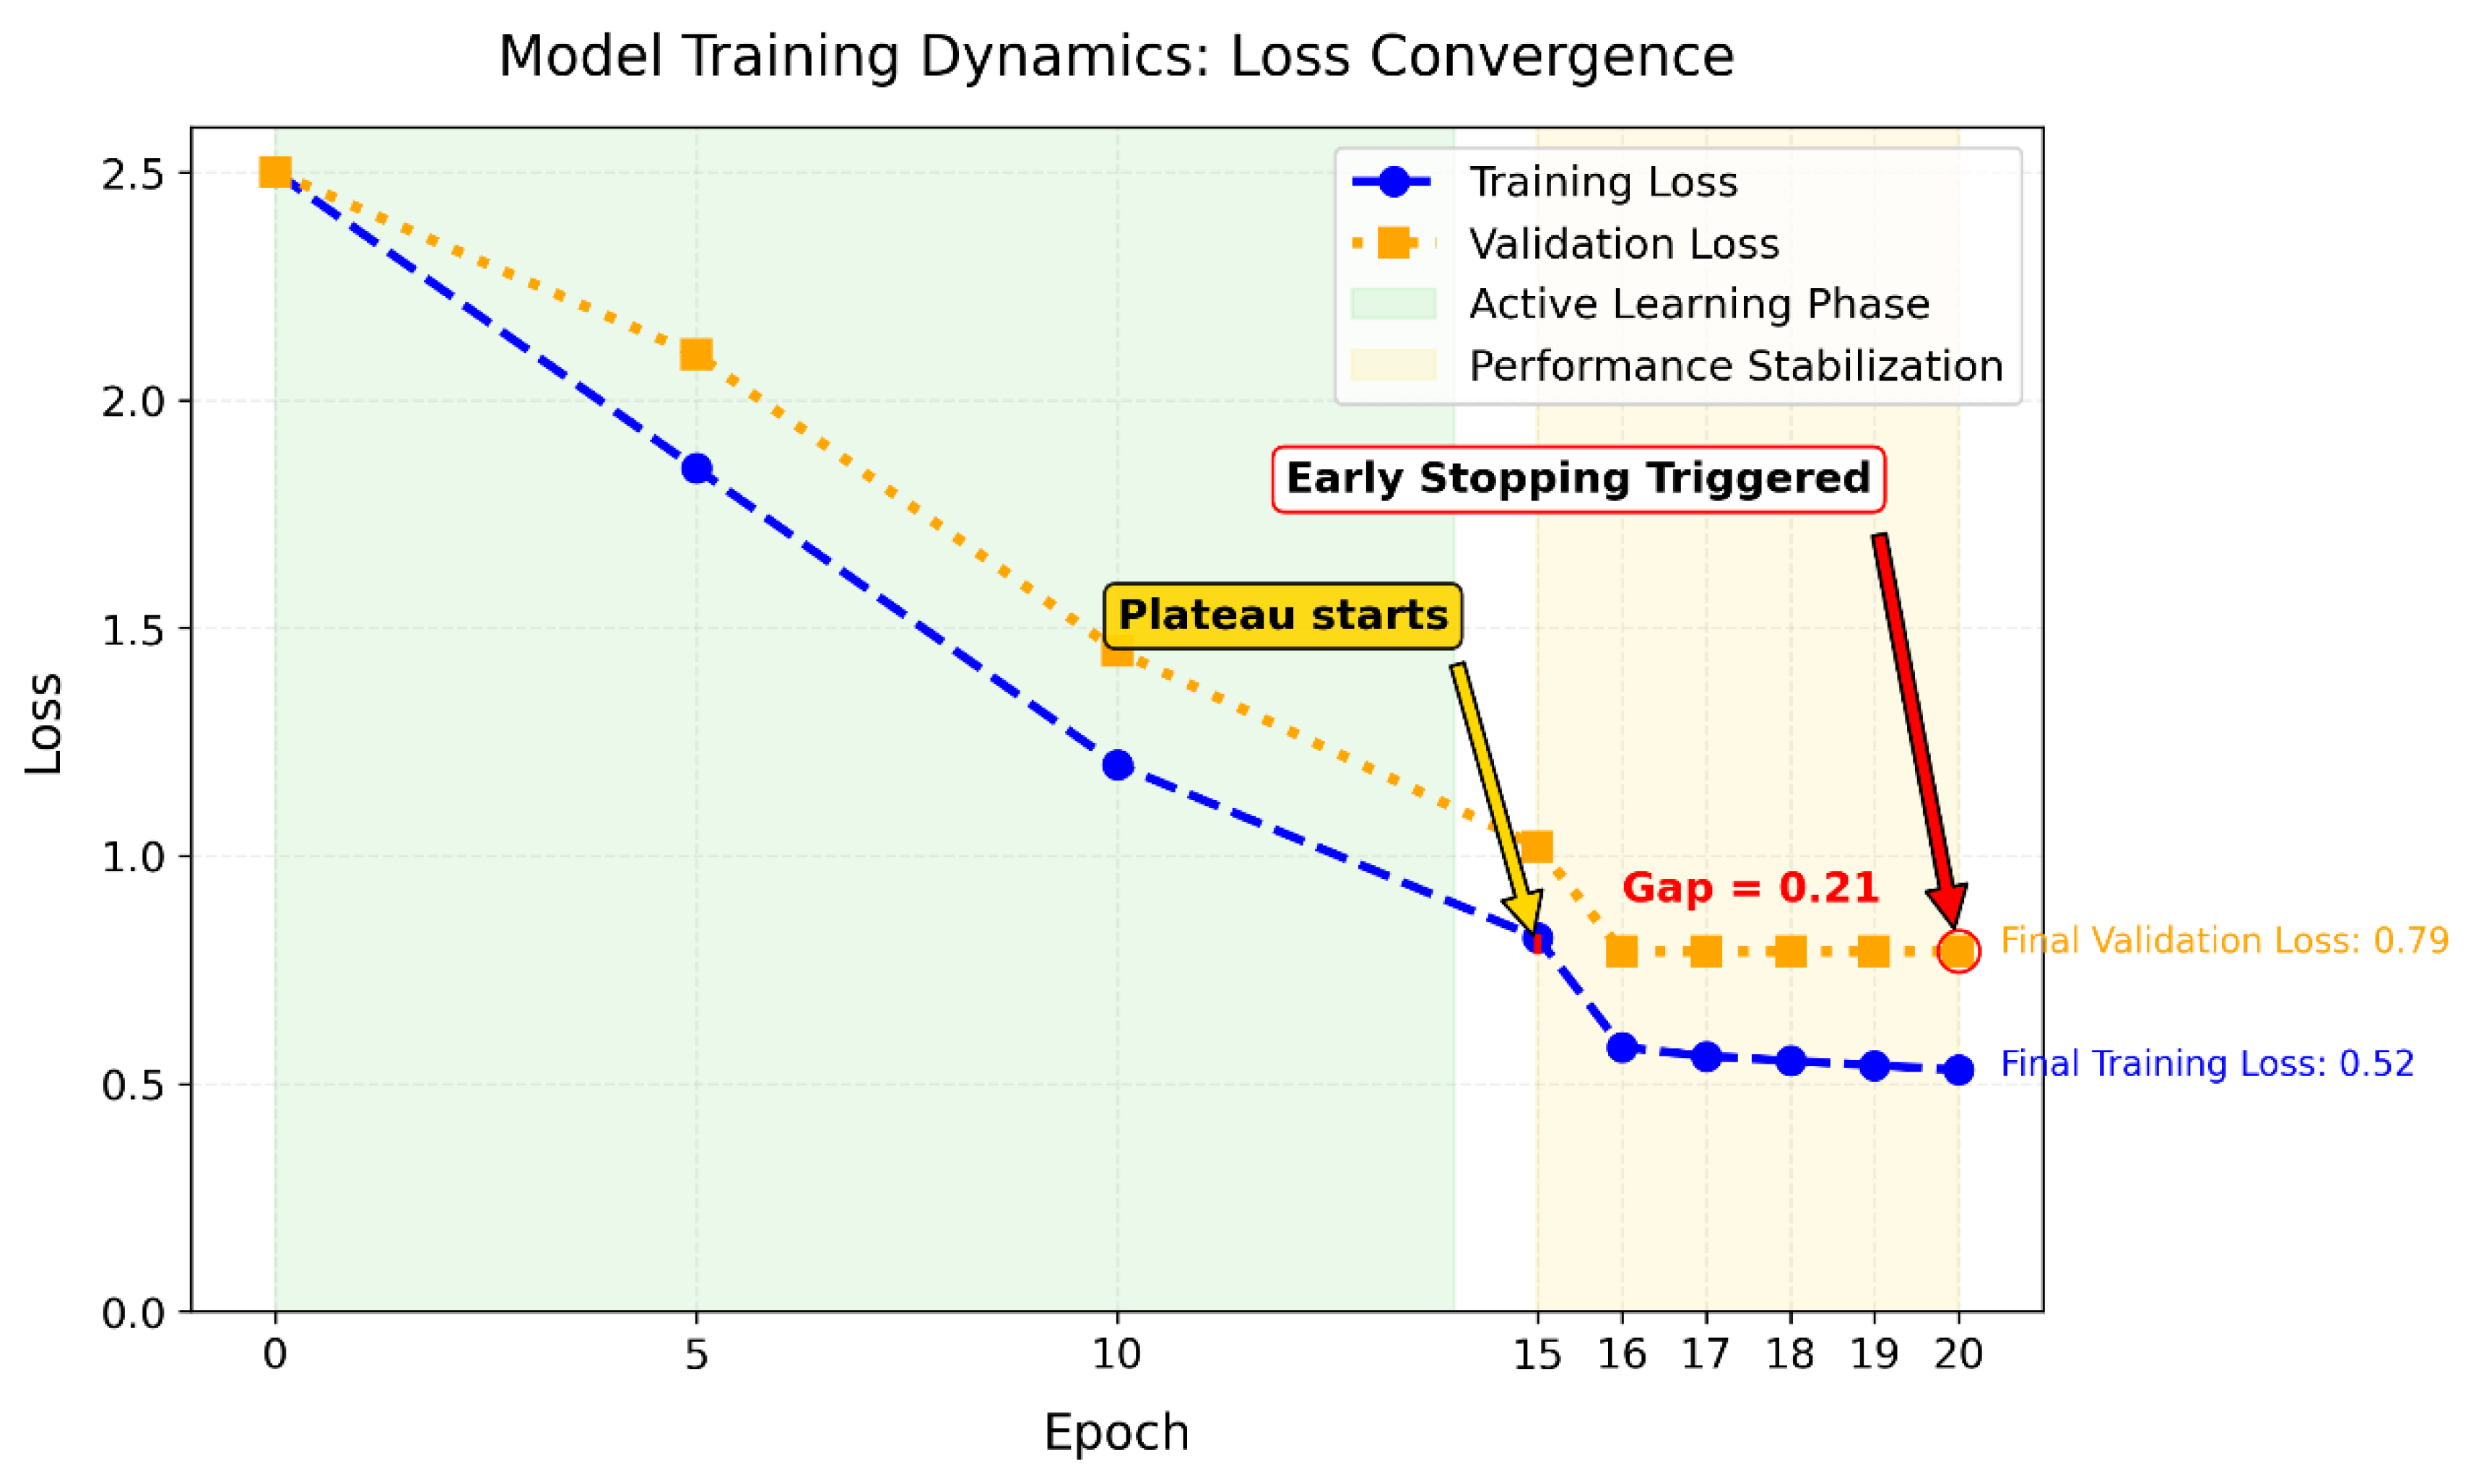
Figure 5.
AI functions as decision-support, with radiologists retaining final interpretation authority.
Figure 5.
AI functions as decision-support, with radiologists retaining final interpretation authority.


Table 1.
Distribution of the study population by BI-RADS density category.
| BI-RADS Category | Description | Number of Patients (n) | Percentage (%) |
|---|---|---|---|
| A | Almost entirely fatty | 12 | 5.6% |
| B | Scattered areas of fibroglandular | 31 | 14.6% |
| C | Heterogeneously dense | 95 | 44.6% |
| D | Extremely dense | 75 | 35.2% |
| Total | 213 | 100% |
Table 2.
Comparative performance of computational models.
| Model | MSE | R2 | AUC | Precision | Recall | Inference Time (ms) |
|---|---|---|---|---|---|---|
| Excel (Baseline) | 0.864 | 14.4% | - | - | - | - |
| Linear (scikit-learn) | 0.641 | 20.3% | 0.73 | 0.70 | 0.68 | 0.8 |
| DNN (Primary) | 0.638 | 23.3% | 0.75 | 0.72 | 0.69 | 12.4 |
| DNN (VinDr-Mammo) | 0.652 | 22.9% | 0.74 | 0.70 | 0.68 | 13.1 |
Disclaimer/Publisher’s Note: The statements, opinions and data contained in all publications are solely those of the individual author(s) and contributor(s) and not of MDPI and/or the editor(s). MDPI and/or the editor(s) disclaim responsibility for any injury to people or property resulting from any ideas, methods, instructions or products referred to in the content. |
© 2025 by the authors. Licensee MDPI, Basel, Switzerland. This article is an open access article distributed under the terms and conditions of the Creative Commons Attribution (CC BY) license (http://creativecommons.org/licenses/by/4.0/).
Copyright: This open access article is published under a Creative Commons CC BY 4.0 license, which permit the free download, distribution, and reuse, provided that the author and preprint are cited in any reuse.


