
Submitted:
13 December 2023
Posted:
13 December 2023
You are already at the latest version
Abstract
Anthocyanins extract from purple tomato (PTA) was incorporated with polyvinyl alcohol (PVA) so that a series of colorimetric films of PVA/PTA (based on PVA) were prepared. The role of anthocyanin on color response, FTIR, thickness, water content, mechanical properties, antioxidant activity, and permeation of water vapor through the films was examined. In addition, its application in smart packaging to assess the freshness of shrimp was studied. It was found that the tensile strength, contact angle and WVP of PVA/PTA films increases with the addition of more PTA, while the elongation at break and water content decreased. FTIR analysis showed that there are interactions between PTA and PVA matrix. The addition of anthocyanins caused to a significant improvement for the antioxidant properties of PVA films. Furthermore, the total volatile alkaline nitrogen (TVB-N), total plate count (TPC) and pH value of shrimp were monitored after 4 days of refrigeration, and the color change of the indexes was recorded. The PVA/PTA films changed color from purple to yellow-green during the storage time of 0-4d for shrimp, this suggests that the film could be used in smart packaging as a real-time freshness indicator for shrimp.
Keywords:
purple tomato anthocyanin
; polyvinyl alcohol
; intelligent packaging
; shrimp
1. Introduction
With the improvement of living standards, people pay more and more attention to the safety and quality of food, colorimetric indicator films have gradually become a research hotspot in the domain of smart packaging since it provides shelf life, safety, and quality information by monitoring changes inside the package [1]. The ideal colorimetric indicator combines natural colors that meet food-grade standards with a stable, solid carrier substrate. Among these substrates, a variety of natural polymer materials have been selected, including but not limited to starch, cellulose, chitosan, chitin, gelatin, and polyvinyl alcohol (PVA), as well as their blends, which have been used as carrier matrices [2,3]. In which, as a biodegradable synthetic polymer with non-toxic, good film formation and mechanical properties [4], PVA is widely applied in intelligent packaging and food packaging [5,6,7,8].
Recently, researchers have paid special attention to the use of plant-derived anthocyanins as colorimetric dyes, due to their non-toxicity, health benefits, and environmental friendliness [9]. Anthocyanins are a class of water-soluble natural pigments widely found in some fruits and vegetables involving red cabbage, purple sweet potato, black carrot and blueberry. It was found that the plant species from which anthocyanins originated had a great influence on the function and physical properties of their colorimetric indicator films. Zhang et.al [10] prepared active chitosan/PVA films containing different anthocyanins extracted from purple sweet potato extracts (PSPE) and red cabbage extracts (RCE) for monitoring the freshness of shrimp. Compared with PS-RCE film, PS-PSPE films exhibit more vivid color changes, better mechanical properties, and lower light transmittance at lower leachables at lower leachables, indicating that the color change of the indicator can reflect shrimp spoilage. Sani et.al [11] successfully prepared a new pH-sensitive colorimetric film by incorporating red berberberry anthocyanin (RBA) into a composite chitin nanofiber and methylcellulose matrix. It was shown that RBA are responsive to changes in pH and ammonia generation, and therefore can be used as a colorimetric indicator to identify signs of food spoilage, and the effectiveness of this indicator for assessing the freshness and spoilage status of fish was verified. It was found that the mechanical, thermal and antibacterial properties of films were better when cooperating with anthocyanins.
On the other hand, for intelligent films, the doped anthocyanins are from red cabbage, black carrot, purple sweet potato, blueberry, black wolfberry and so on [12], however, there are not many reports of anthocyanins in purple tomatoes. The study showed that the source of anthocyanins has a great influence on the function and physical properties of the indicator films [13]. In this study, anthocyanins extracted from purple tomatoes were used in combination with PVA to prepare colorimetric indicator films. The physicochemical properties of the PVA/PTA film were investigated. And its color sensitivity to the freshness of shrimp was examined to assess the potential as a visual indicator.
2. Materials and Methods
2.1. Materials
PVA was purchased from Shanpu Chemical Co., Ltd (Shanghai, China). PTA with 54% (w/w) of the purity was from Zhejiang Bison Biotechnology., Ltd (China). Glacial acetic acid (analytical purity) was purchased from Bohuatong Chemical Products Sales Center (Tianjin, China). 2,2-diphenyl-1-trinitrophenylhydrazine (DPPH) containing 95% free radicals was purchased from Sinopharm Chemical Reagent Co., Ltd. (Shanghai, China). Shrimp was purchased from Zhongbai Warehouse in Wuhan (Hubei, China). All chemicals used are high-purity analytical grade chemicals. The solvent in all formulations is deionized water.
2.2. Preparation of the PVA/PTA films
PVA/PTA films were prepared by solution casting method. The PVA/PTA solution was prepared by dissolving 10g of PVA in 500 mL of solution, stirring vigorously, then adding a certain amount of PTA (0.1 g, 0.3 g or 0.5 g) to the PVA solution and stirring continuously for 30 min until it was suitable for the PVA/PTA mixture with PTA concentrations of 1%, 3% and 5% (w/w, based on PVA). At last, 80 mL of the mixed mixture or PVA solution was placed in a 15cm diameter Petri dish and dried and treated at 45°C for 18 h.
2.3. Characterization of PTA or PVA/PTA films
2.3.1. Color and UV-vis spectra of PTA
At varying pH values (pH2-12), the camera was used to capture the color changes of PTA solution, and the visible light spectrum was scanned by UV-vis spectrophotometer (756PC, Shanghai Haoyu Hengping Scientific Instruments Co., Ltd., China) with the wavelength ranging from 200nm to 800nm [14].
2.3.2. pH-response of PVA/PTA films
The prepared PVA/PTA films (4cm × 4cm) were exposed to buffer solutions of pH 2, 3, 4, 5, 6, 7, 8, 9, 10, 11 or 12, respectively. The change in color of the films in response to pH was measured by a colorimeter (CR-10, Konica Minolta, Japan). The value of the total color difference (ΔE) was calculated according to Eq. (1).
where, L, a and b are the values of the samples; , , and are the values of the standard PVA/PTA film (pH7).
2.3.3. Thickness of PVA/PTA films
The PVA/PTA films’ thickness measurements were performed with a digital micrometer (SM-114, Shanghai Liuling Instrument Factory, China) [15]. The final value is the average of 10 replicates.
2.3.4. Fourier transform infrared (FTIR) spectroscopy of PVA/PTA films
The FTIR spectra of the PVA/PTA film(1m)with 5% PTA concentration and pure PVA film were obtained between wavenumbers 400 and 4000 cm−1 via a FTIR spectrophotometer (Tensor 27, Bruker Optics, Germany).
2.3.5. Mechanical properties of PVA/PTA films
The mechanical properties of the PVA/PTA films were measured with Electro-mechanical Universal Testing Machines (UTM4104, SUNS, China) at a crosshead speed of 50 mm min-1 at 26 °C. The sample is a rectangular film with a size of 100 mm × 15 mm. A total of six samples were measured and averaged as the final test data. The tensile strength (TS) and elongation at break (EAB) of the samples were obtained by the Eqs. (2) and Eqs. (3), respectively.
where P was breaking load (N), b was sample width (mm) and d was sample thickness (mm).and L was original and final elongated lengths (mm) of the film, respectively.
2.3.6. Moisture content of PVA/PTA films
A moisture meter (MB120, OHAUS Instruments, China) was used to determine the moisture percentage in the films. The films’ moisture content was calculated according to Eq. (4).
where, M0 represents the starting weight of the film, M1 represents the constant weight of the film after drying.
2.3.7. Water vapor permeability of PVA/PTA films
The water vapor permeability (WVP) of the samples was determined based on GB/T 1037-1988 by using a moisture permeation meter (W3/031X, Labthink, China). The film samples were cut into 74 mm diameter circles, placed in triplicate, in a permeation cell containing deionized water (90% relative humidity at 28 °C), weighed and placed in a desiccator, and averaged using a water vapor transmission rate tester.
2.3.8. Antioxidant activity of PVA/PTA films
The antioxidant activity of films was measured according to the reference [16]. The films were immersed in 95% ethanol at 65°C for 5h, 1 mL of the sample was blended with 4 mL of 0.1 mM DPPH dissolved in ethanol. Next, the absorbance of the mixture at a wavelength of 517 nm was determined. Each sample was tested in triplicate copies. Each sample had three replicates. The antioxidant clearance was calculated according to Eq (5).
where and represent the absorbance values of the dipstick-treated and non-dipstick solutions, respectively.
2.4. Monitoring freshness of shrimp
2.4.1. Packaging
Place a 20 g shrimp sample into a Petri dish and seal with a Petri dish lid with a colorimetric indicator film (4cm ×4cm) that adheres to the inside of the lid [17]. Then, the samples were stored at 4 °C and 60 %RH for 4d. During the storage, the color changes of the film were pictured at each day.
2.4.2. Microbial colony measurement
The microbial colony was measured by plate counting method [18]. The shrimp was transferred into bags containing 135 ml of 0.1% (w/w) saline solution and homogenized using a homogenizer (JX-05, TUOHE Electromechanical Technology, China) for 3min. Then the diluted homogenized solutions were plated by agar prior to being incubated at 37°C for 48h.
2.4.3. pH and total volatile basic nitrogen (TVB-N) measurement
A 20 g shrimp sample was first homogenized by mixing with 180 ml of distilled water, and then a digital pH meter (PhS-3E, INESA Scientific Instruments Co., Ltd., China) was used to accurately measure the pH of the resulting mixture slurry (PhS-3E, INESA Scientific Instruments Co., Ltd., China). Simultaneously, the total volatile basic nitrogen (TVB-N) in shrimp was determined by using a semi-micro Kjeldahl distiller according to the method described in Ref [19].
2.5. Statistical analysis
Data results were reported as mean ± standard deviation and one-way ANOVA was performed using SPSS software (22.0, SPSS Statistical software, Inc., USA). The significance difference between the means of each group was determined by Duncan’s multiple range test, and the significance level was set to P < 0.05.
3. Results and discussion
3.1. Color and UV-vis spectra of PTA
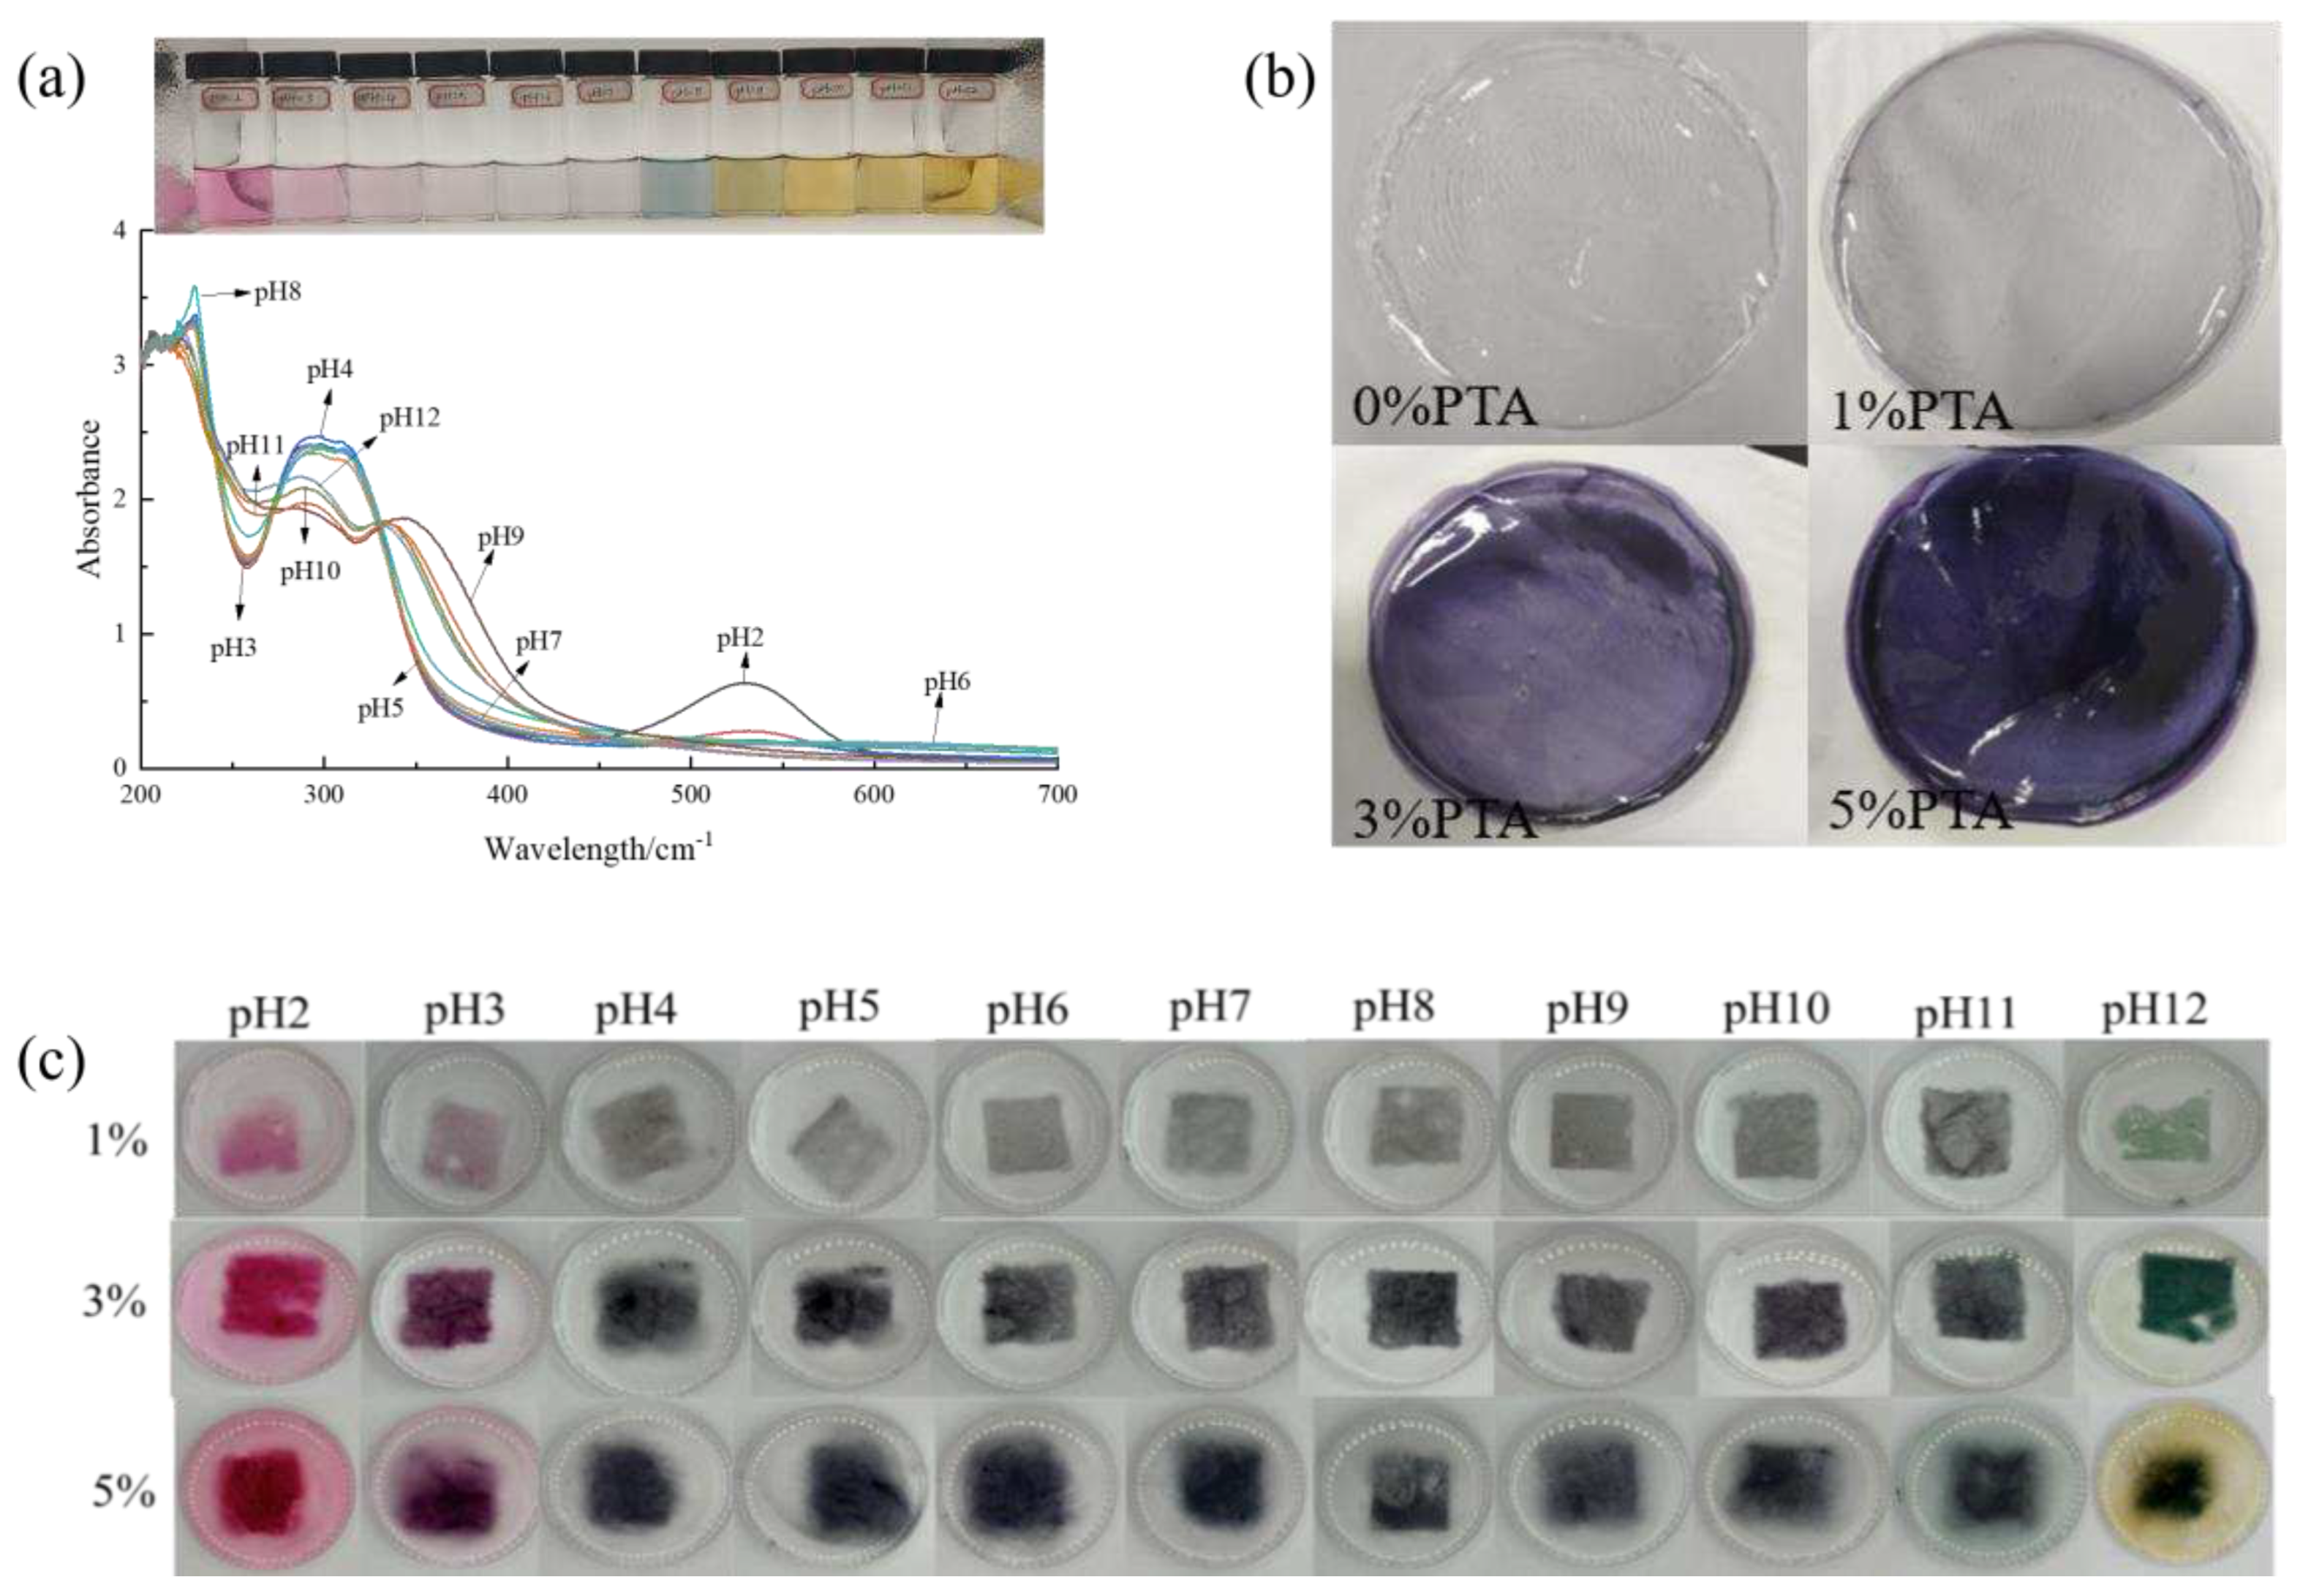
The visual color and UV-vis spectra of PTA are indicated in Figure 1a. PTA was pH-sensitive and changed color from purple red (pH2) to blue (pH3-4), then to colorless (pH5-6), finally to yellow when pH>7 due to degradation caused by strong base [16]. Being similar to the our study, Reyes et al. [20] found that the higher the pH, the faster the degradation of anthocyanins. Figure 1a records the UV-visible spectra of PTA in varying buffer solutions. It was found that at pH 2-8, the maximum absorption peak of anthocyanins was gradually shifted from 527 nm to 538 nm in the spectral range, and the absorption intensity of PTA slowly decreases with increasing pH. When the pH value exceeds 9, the absorption intensity is observed to increase gradually with a further increase in pH, and the maximum absorption peak shifts from 570 nm to 660 nm. The UV-visible spectra also verified the pH sensitivity of PTA.
3.2. Original films
Digital photos and color parameters of PVA/PTA films were displayed in Figure 1b and Table 1. It was found the color and opacity values were affected by PTA concentration. As shown in Figure 1b, the pure PVA were transparent, the films were lavender at a concentration of 1%, the films were purple at a concentration of 3%, and the films were dark purple at a concentration of 5%. From Table 1, it can be seen that the L*, a* and b* values of the films were dramatically influenced by the concentrations of anthocyanins (P<0.05). With the addition of PTA, the color of the composite films has obviously changed, and the ΔE value increased significantly (P<0.05), with the highest ΔE value of 65.94 for the 5% concentration film. At the same time, the brightness of the films decreased significantly (P<0.05), and the L* value of the 5% concentration film was the lowest and gradually tended to black. a* value increased significantly (P<0.05) and appeared red. This is mainly because the hydrolysis product of polyvinyl alcohol is vinyl alcohol, and the carbon-carbon double bond in vinyl alcohol has adsorption of electrons, and the solution is acidic, while the anthocyanins will change color due to the change of environmental pH. The b* values of the films were <0, indicating a blueish color and low transparency of the films. The incorporation of pigments makes the clarity of the film significantly lower, however, the color of the film is our most intuitive impression of the food packaging, which will affect the consumer’s observation, and controlling the amount of natural pigments added is one of the ways to adjust the color of the film.
3.3. pH-response of films
The films containing PTA extract showed a color change with pH shown in Figure 1c, which was similar to that observed for PTA extract (Figure 1a). The color of the films shifted roughly as follows: purplish red→ colorless→ blue-green→ light yellow. Under acidic conditions, the reduction of the anthocyanin double bond, i.e. the protonation of flavonoid cations, explains the observed color change. Under alkaline conditions, the trend is yellow-green due to the degradation of anthocyanins in strongly alkaline media. Several studies have demonstrated that anthocyanin-rich films can respond significantly to changes in pH [11].
Figure 1.
UV-visible spectra (a); visual colorof PTA at pH 2-12 (b) ; color response of PVA/PTA films with different concentrations of PTA at pH2-12 (c) an total color difference (ΔE) of PVA/PTA films containing 1%, 3% and 5% PTA respectively, as a function of pH (d).
Figure 1.
UV-visible spectra (a); visual colorof PTA at pH 2-12 (b) ; color response of PVA/PTA films with different concentrations of PTA at pH2-12 (c) an total color difference (ΔE) of PVA/PTA films containing 1%, 3% and 5% PTA respectively, as a function of pH (d).
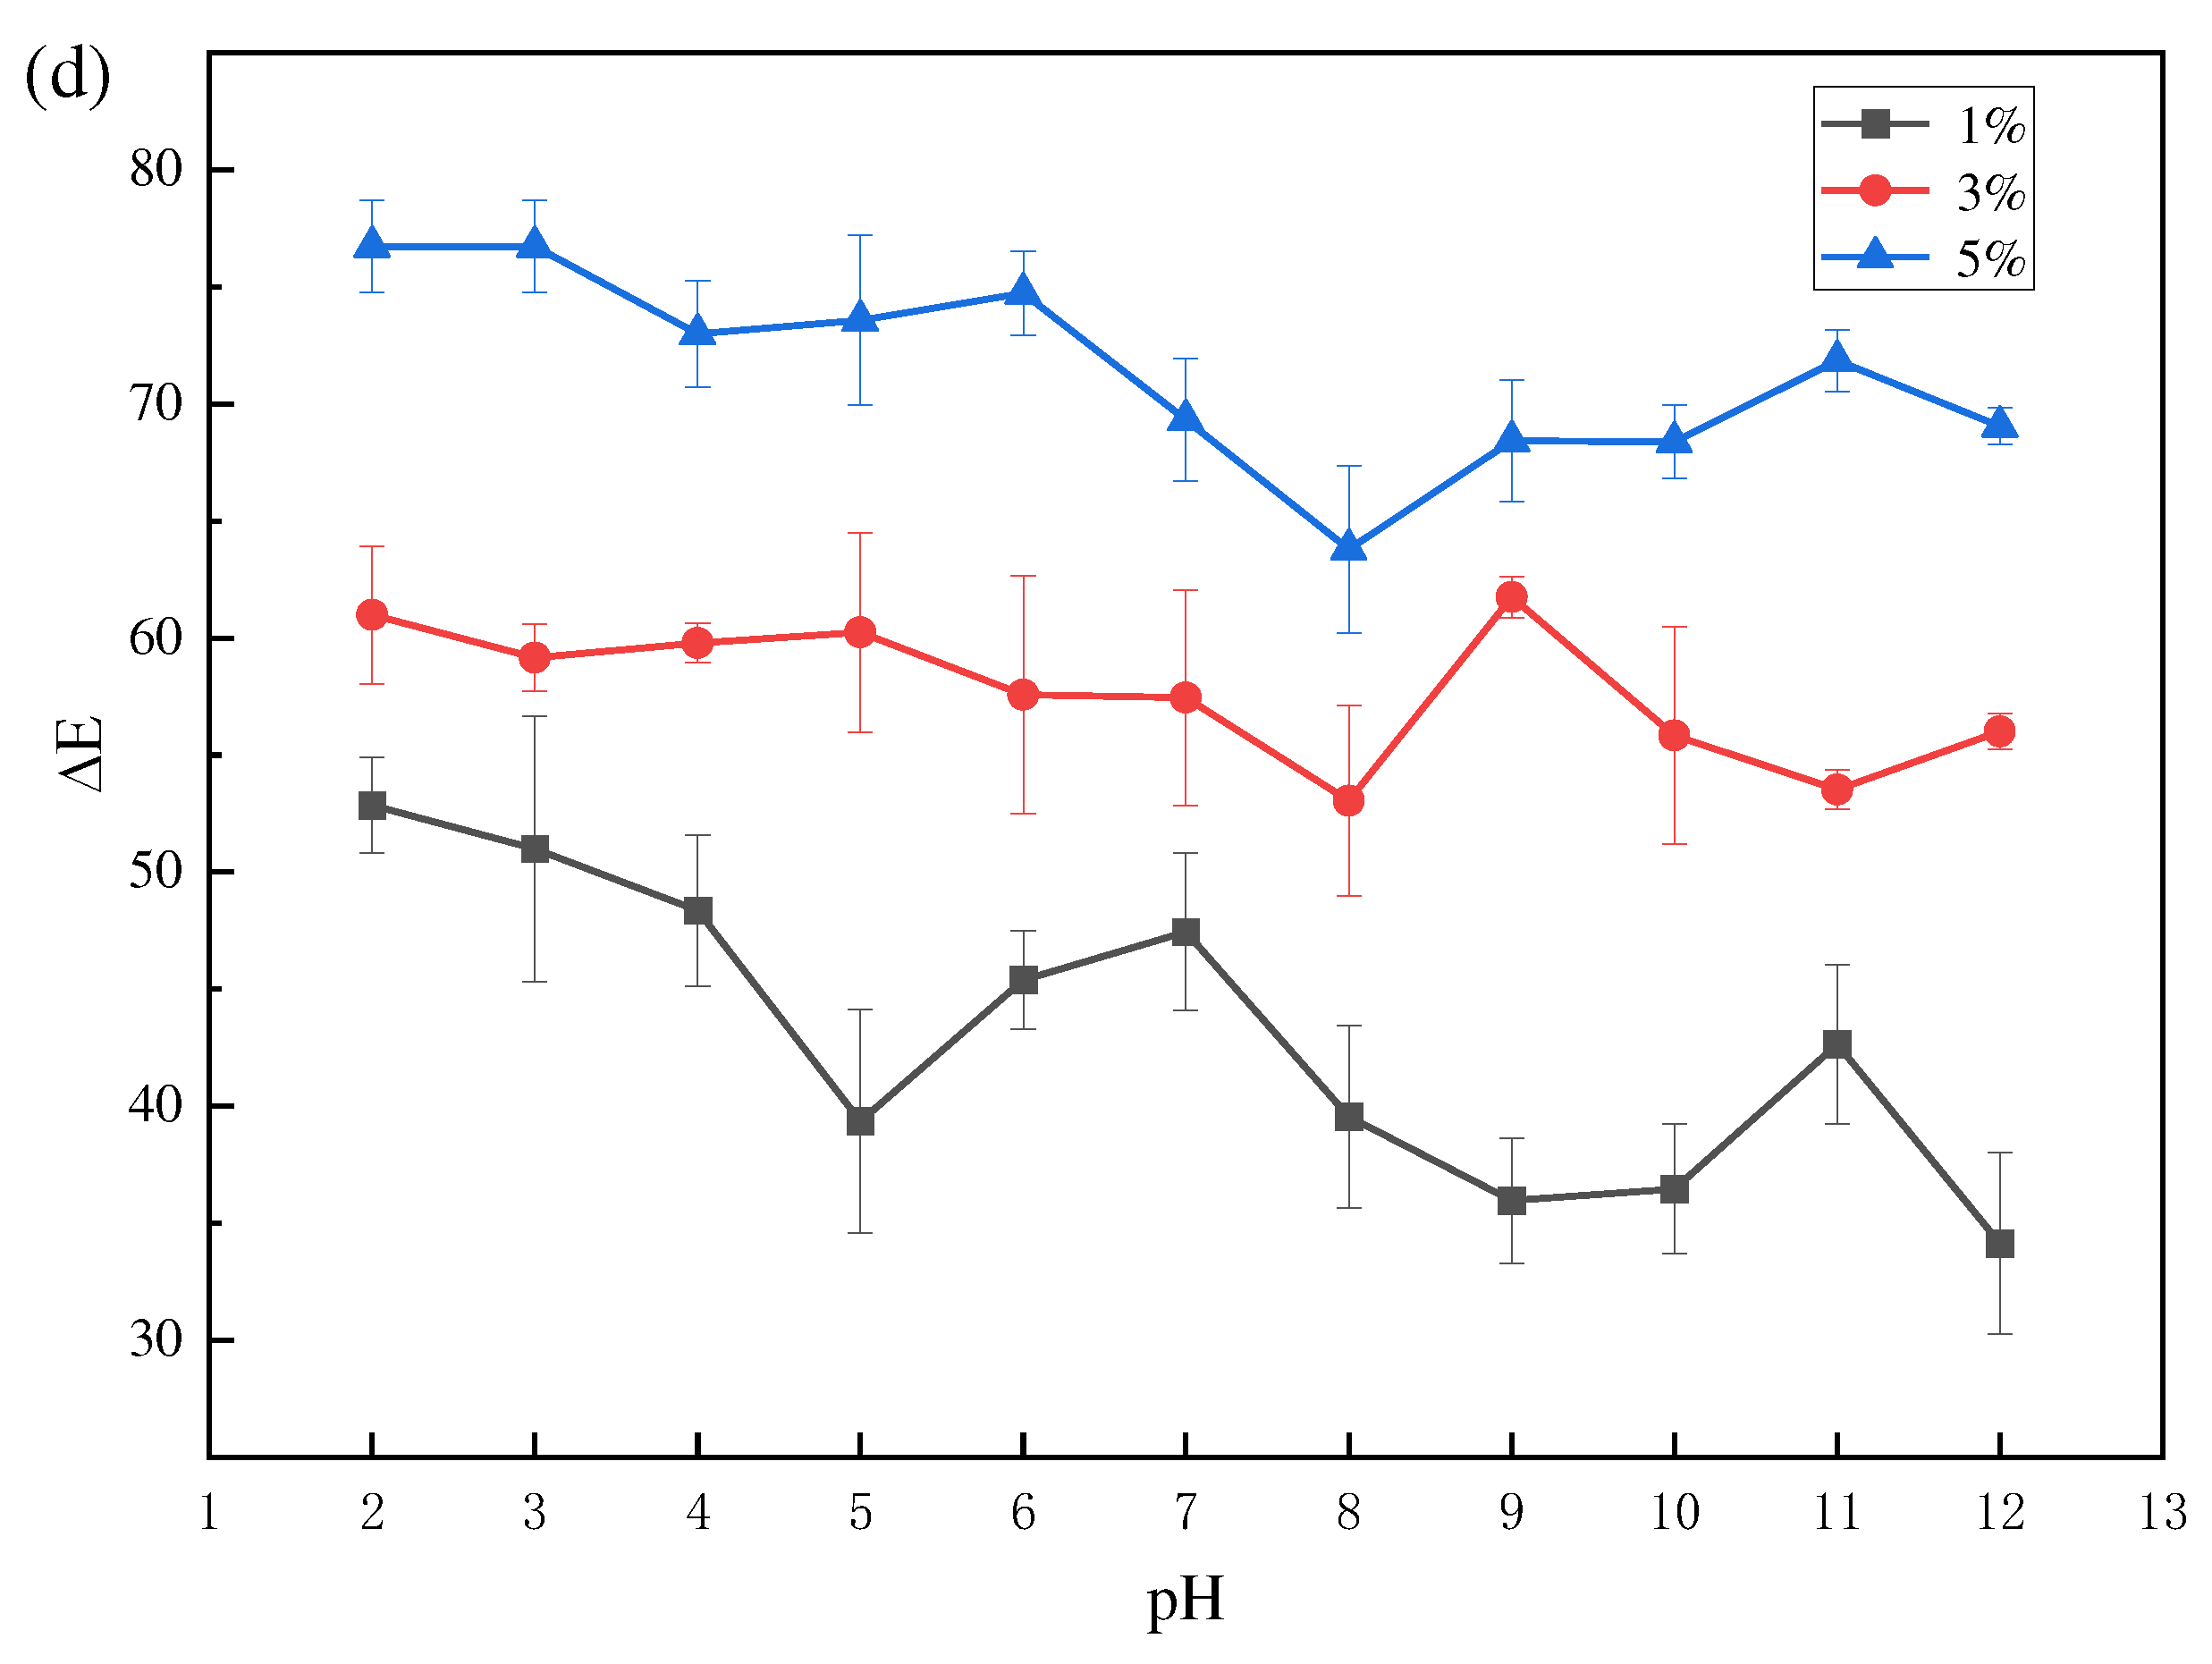
The change in ΔE with pH is also an important point when evaluating a smart indication labeling system. It is necessary to make the change in ΔE indicator visible enough so that the consumer can easily see this color change and know the quality of the product. Figure 1d shows the variation of ΔE for the PVA/PTA composite film. ΔE for PVA/5% PTA did not change appreciably with pH from 3 to 5 and 9-11, but varied considerably at pH=5-7 and pH=8-10. However, the ΔE of PVA/1% PTA and PVA/3% PTA and the compositions varied sharply with pH 2-12. Therefore, among the three films tested, PVA/1% PTA and PVA/3% PTA were the ones that responded better to pH in terms of color. From the color change results, anthocyanin extracts are used in combination with polyvinyl alcohol and have great potential as a chromogenic material in food packaging.
3.4. Mechanical properties of films
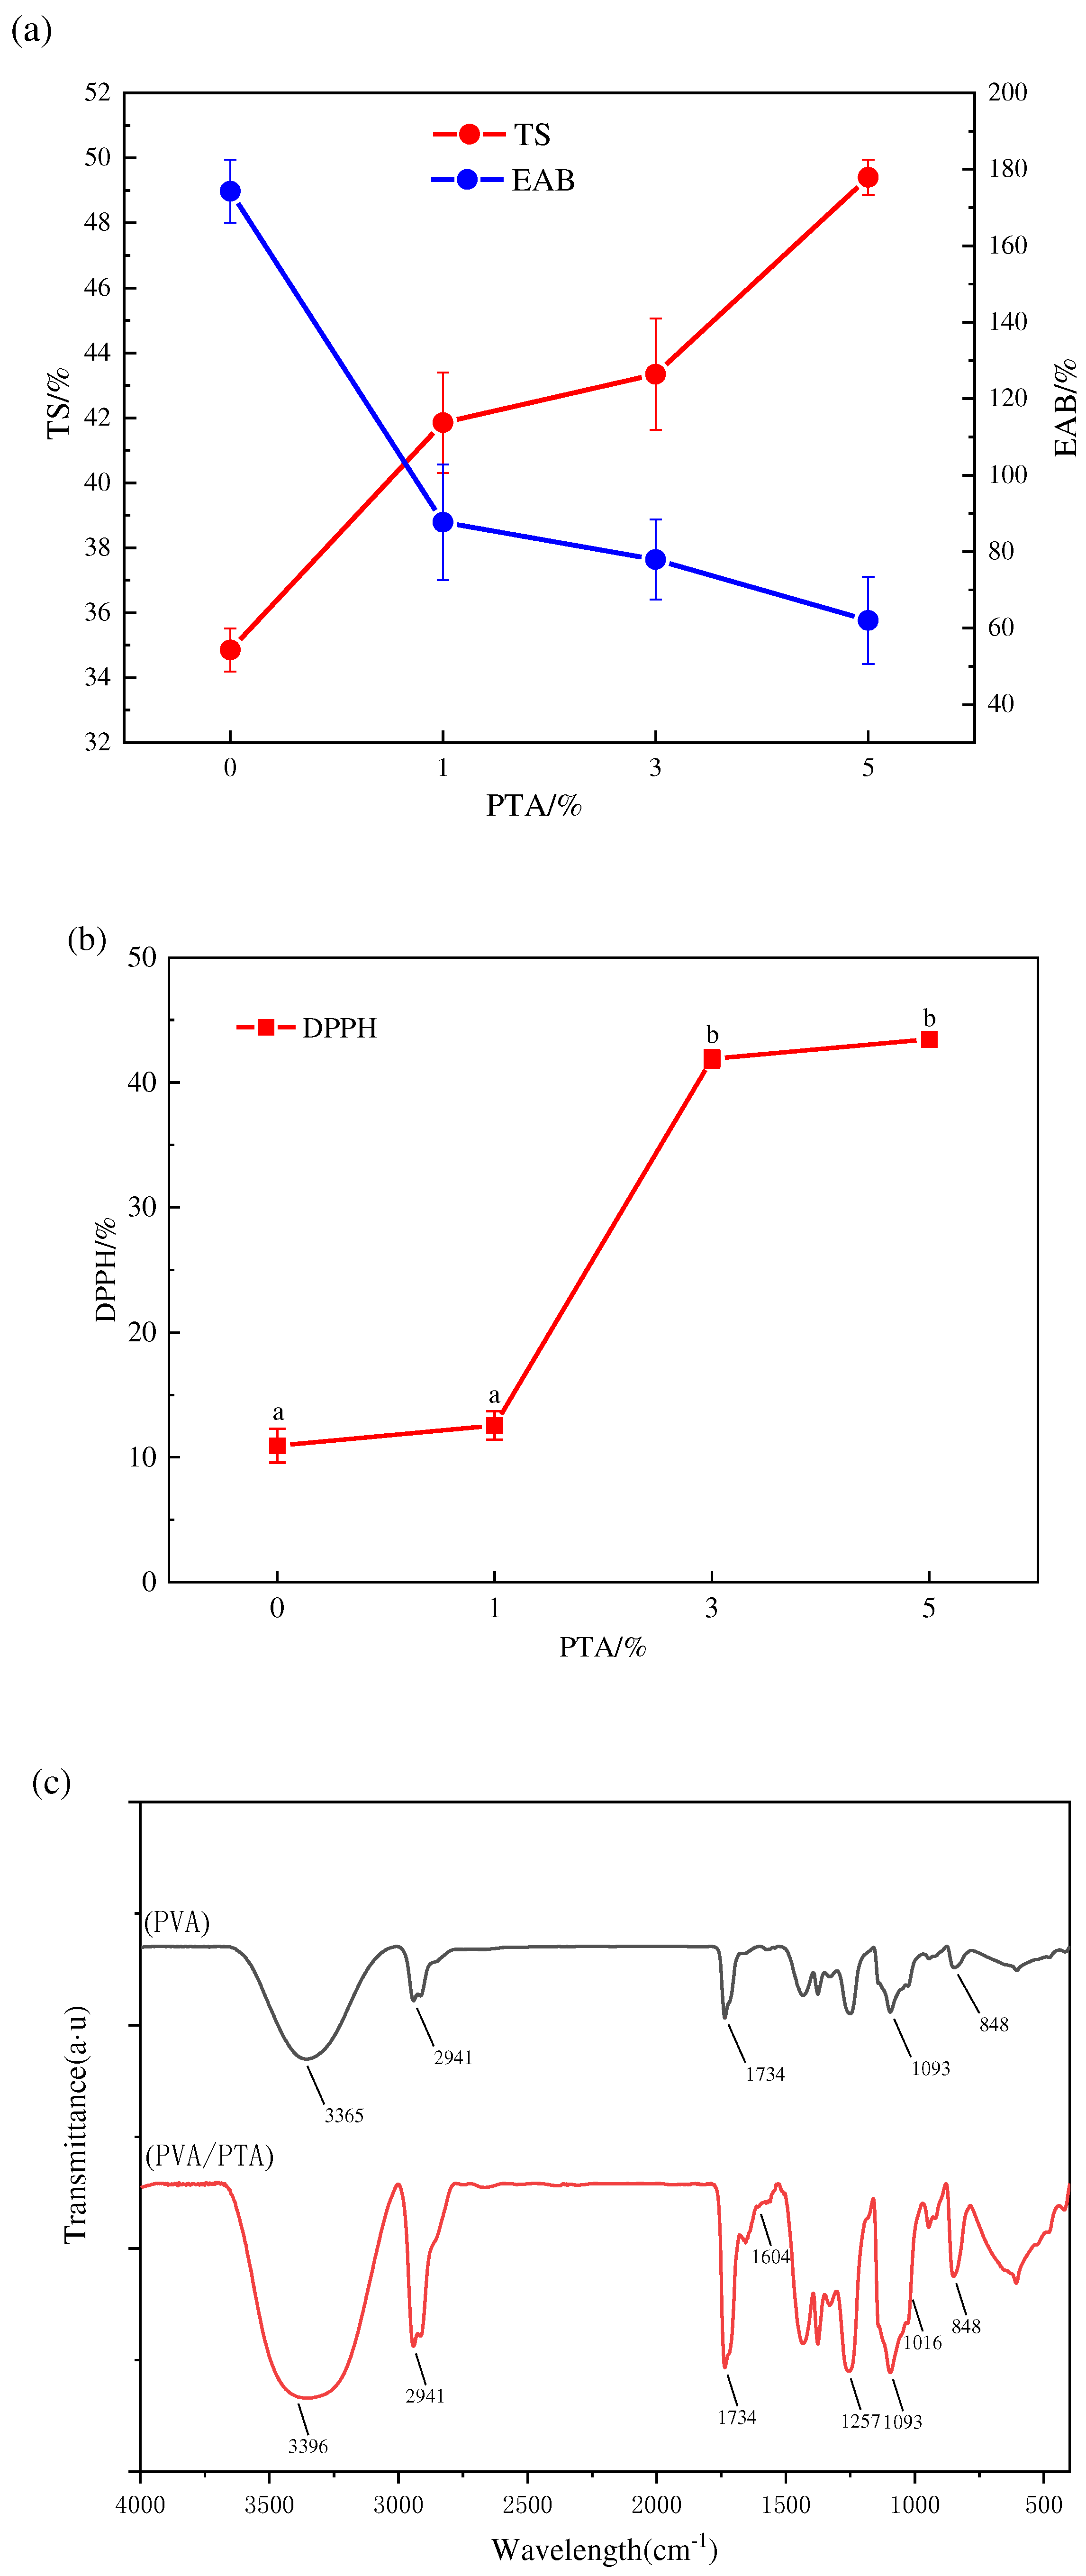
As shown in Figure 2a, TS tended to increase and EAB decreased significantly (P < 0.05) with the elevation of PTA concentration, showing that the addition of PTA extract could increase the mechanical resistance and decrease the flexibility of the film. The formation of hydrogen bonds between PTA and film matrix increases the intermolecular forces and tighter structure, which can increase their mechanical resistance [21]. On the other hand, PTA hinder chain-chain interactions between film components, and water molecules can act as plasticizers to exert greater elasticity and flexibility in the film structure, thus decreasing the flexibility of the film and the elongation at break of the film is reduced [22].
3.5. Film thickness, Moisture content and water vapor permeability of films
The film thickness was impacted by the composition of the components and the intermolecular forces [23]. Table 2 illustrates that significant statistical differences (P < 0.05) were present between the films of varying concentrations. With the increase of anthocyanin concentration, the film thicknesses all increased significantly by 7.5%, 18.1% and 20.1%, respectively. The thickness of the films was influenced by the film-forming matrix and may be related to the increase in the solid content of the polymer [24]. The decrease in the MC of the films may be due to the phenolic hydroxyl groups of the PTA molecules forming more hydrogen bonds with the hydroxyl groups of the film-forming matrix, thus limiting the cross-linking between the composite film and the water molecules, resulting in a decrease in the MC [25], but the anthocyanin concentration did not have a significant effect on the water content of the PVA/PTA composite film (P > 0.05).
WVP is an important index to evaluate the waterproof performance of food packaging film. As shown in Table 2, there are significant differences between the 1%, 3%, and 5% concentrations of PVA/PTA films (P < 0.05). The WVP of the control group with the highest PTA content was (2.7±0.05) ×10−8 g (m·s·Pa)-1. The increase of WVP is due to the fact that anthocyanins contain a large number of hydrophilic groups, which promote the water absorption and expansion of the film, making water molecules more easily pass through the composite film, reducing the barrier efficiency, and thus improving the water vapor transmission coefficient [26].
3.6. FTIR analysis of films
The FTIR spectroscopy of PVA/PTA and PVA films was shown in Figure 2c. It was found that the hydroxyl groups of PVA showed a intense and broad peak at 3365 cm−1. The peaks observed at 2941 cm-1, 1093 cm−1 and 1734 cm−1 belong to the tensile vibrations of –CH2, C–O and the deformation vibration of –OH on PVA, respectively [23,27,28], respectively. Comparing with PVA (a), PVA/PTA (b) film showed the new peaks at 1016 cm−1 and 1604 cm−1, which are due to the tensile vibration of C-O and C=O by anthocyanins [28]. Furthermore, it was found that the characteristic absorption peak of hydroxyl on PVA shifted from 3365 cm-1 to 3396 cm-1 after combination with PTA, which suggests the interactions between C=C on aromatic ring of anthocyanins and the hydroxyl groups on polyvinyl alcohol [10,29].
3.7. Antioxidant activity of films
The DPPH method can determine the scavenging ability of compounds against free radicals and is widely used to determine the antioxidant properties of samples. As shown in Figure 2b, the antioxidant activity of the films was obviously improved (P < 0.05) with the increase of anthocyanin concentration by 14.72%, 223.19%, and 7.96%, respectively, where the DPPH radical scavenging rate of 5% concentration of anthocyanin films reached 43.79%, mainly because anthocyanins are polyphenolic substances that can eliminate free radicals by forming phenoxy groups acting as an antioxidant [30]. There was a partially significant difference (P<0.05) between the different concentrations, and the lower antioxidant rate of anthocyanin films at 1% concentration may be due to the influence of factors such as the cross-linking of the active ingredient with the polymer, the solubility and microstructure of the film, and also the release environment of the film [31].
Figure 2.
Mechanical properties of the PVA/PTA films (a); DPPH radical scavenging activity of PVA/PTA films (b),and FTIR spectra of PVA and PVA/PTA films (c).
Figure 2.
Mechanical properties of the PVA/PTA films (a); DPPH radical scavenging activity of PVA/PTA films (b),and FTIR spectra of PVA and PVA/PTA films (c).
3.8. Application of PVA/PTA films for monitoring shrimp freshness
Fresh shrimp freshness was examined in PVA/PTA films with different concentrations of PTA at 4°C with Figure 3 Enzymes and microorganisms are the main factors in the spoilage of aquatic products, a process that is often accompanied by a rise in pH and the production of volatile compounds such as ammonia and amines during protein degradation, which enhances the fresh shrimp off-flavor [30,32]. Nitrogen-containing compounds containing alkaline pH can cause changes in the structure of PTA, which can result in color changes. As shown in Table 3, during a 48-hour storage period, the TVB-N (Total Volatile Basic Nitrogen) levels in the shrimp showed a significant increase, rising from an initial (7.2 ± 0.3) mg per 100g to (28.6 ± 0.01) mg per 100g. As per the Chinese National Standard (GB 2733–2015) for marine fish and shrimp, TVB-N levels should be kept below 30 mg per 100g of consumption. This indicates that after 48 hours of storage, the shrimp samples had nearly reached the spoilage threshold and were deemed unsuitable for consumption. The initial pH value of fish was 7.1, similar with the variation of TVB-N value, which increased gradually during storage at 4°C. Notably, the color changes of the chromatic films correlated closely with the shifts in TVB-N and pH values in the shrimp. Throughout the monitoring period, the variations in color of the colorimetric films became increasingly pronounced as the TVB-N levels rose. Initially, the 5% PVA/PTA film was purple, which then transitioned to blue-green at 48 h, and by 92 h, it had changed to a yellow-green hue, with the ΔE values of film changing from 65.94±0.42 to 30±0.1 (as shown in Table 3). The change of total color difference is obvious and can be recognized by naked eye.
Microbial growth in freshness shrimp during storage of total plate count (TPC) is shown in Table 3. Fresh shrimp limit of acceptable microbiological was 7 log CFU/ g [18]. During the storage, the microorganisms gradually increased incrementally, and the microbial count was about to reach its peak on day 4. As fresh shrimp began to have a slight odor at day 2, the odor was clearly inedible at day 4 and all spoiled at day 5, consistent with the TVB-N value of fresh shrimp. Due to the significant color change of shrimp during storage, the film developed in this study can be used as a colorimetric index to visualize the freshness of shrimp.
4. Conclusions
In this study, different concentrations of PTA were added into PVA to prepare intelligent packaging films, which was used for real-time monitoring of fresh shrimp freshness. The findings indicated that the physiochemical properties of PVA films were functional with PTA that the cooperation of PTA improved the mechanical properties, contact angle and antioxidant activity of PVA, this means that PVA/PTA films have the potential to be used as active packaging materials. However, the elongation at break and barrier were significantly decreased (P0.05) with the addition of PTA. FTIR results showed that there is a chemical interaction between PTA with PVA. When the films were applied to shrimp freshness detection, the visible changes of film were observed, therefore the prepared PVA/PTA films have potential application in intelligent packaging as a smart label indicator.
Author Contributions
Yangyang Qi: Conceptualization, Data curation, Investigation, Roles/Writing –Formal analysis, Writing – review & editing. Yana Li: Conceptualization, Methodology, Software, Roles/Writing – original draft, Writing – review & editing.
Data Availability Statement
Research data are not shared.
Acknowledgments
This research received funding from the Research and Innovation Initiatives of WHPU (Grant No. 2023Y29).
Conflicts of Interest
There is no conflict of interests in this studied.
References
- Yam, K.L.; Takhistov, P.T.; Miltz, J. Intelligent packaging: Concepts and applications. J. Food Sci. 2005, 70, 1–10. [Google Scholar] [CrossRef]
- Kuswandi, B.; Jayus; Restyana, A. ; Abdullah, A.; Heng, L.Y.; Ahmad, M. A novel colorimetric food package label for fish spoilage based on polyaniline film. Food Control. 2012, 25, 184–189. [Google Scholar] [CrossRef]
- Kim, D.; Lee, S.; Lee, K.; Baek, S.; Seo, J. Development of a pH indicator composed of high moisture-absorbing materials for real-time monitoring of chicken breast freshness. Food Sci Biotechnol. 2017, 26, 37–42. [Google Scholar] [CrossRef] [PubMed]
- Bonilla, J.; Fortunati, E.; Atarés, L.; Chiralt, A.; Kenny, J.M. Physical, structural and antimicrobial properties of poly vinyl alcohol-chitosan biodegradable films. Food Hydrocoll. 2014, 35, 463–470. [Google Scholar] [CrossRef]
- Ge, C.; Lansing, B.; Lewis, C.L. Thermoplastic starch and poly(vinyl alcohol) blends centered barrier film for food packaging applications. Food Packag. Shelf Life. 2021, 27, 100610. [Google Scholar] [CrossRef]
- Göksen, G.; Fabra, M.J.; Pérez-Cataluña, A.; Ekiz, H.I.; Sanchez, G.; López-Rubio, A. Biodegradable active food packaging structures based on hybrid cross-linked electrospun polyvinyl alcohol fibers containing essential oils and their application in the preservation of chicken breast fillets. Food Packag. Shelf Life. 2021, 27, 100613. [Google Scholar] [CrossRef]
- Hoseyni, S.Z.; Jafari, S.M.; Shahiri Tabarestani, H.; Ghorbani, M.; Assadpour, E.; Sabaghi, M. Release of catechin from Azivash gum-polyvinyl alcohol electrospun nanofibers in simulated food and digestion media. Food Hydrocoll. 2021, 112, 106366. [Google Scholar] [CrossRef]
- Vafa, E.; Bazargan-Lari, R.; Bahrololoom, M.E. Electrophoretic deposition of polyvinyl alcohol/natural chitosan/bioactive glass composite coatings on 316L stainless steel for biomedical application. Prog. Org. Coat. 2021, 151, 106059. [Google Scholar] [CrossRef]
- Cavalcanti, RN.; Santos, D.T.; Meireles, M.A.A. Non-thermal stabilization mechanisms of anthocyanins in model and food systems-An overview. Food Res. Int. 2011, 44, 499–509. [Google Scholar] [CrossRef]
- Zhang, K.; Huang. TS.; Yan, H.; Hu, X.Z.; Ren, T. Novel pH-sensitive films based on starch/polyvinyl alcohol and food anthocyanins as a visual indicator of shrimp deterioration. Int. J. Biol. Macromol. 2020, 145, 768–776. [Google Scholar] [CrossRef]
- Sani, M.A.; Tavassoli, M.; Hamishehkar, H.; McClements, D.J. Carbohydrate-based films containing pH-sensitive red barberry anthocyanins: Application as biodegradable smart food packaging materials. Carbohydr. Polym. 2021, 255, 117488. [Google Scholar] [CrossRef] [PubMed]
- Li, Y.; Wu, K.; Wang, B.; Li, X. Colorimetric indicator based on purple tomato anthocyanins and chitosan for application in intelligent packaging. Int. J. Biol. Macromol. 2021, 174, 370–376. [Google Scholar] [CrossRef] [PubMed]
- Li, Y.; Li, Z.; Wang, Y.; Sun, L.; Pei, H. Anthocyanins/chitosan films doped by nano zinc oxide for active and intelligent packaging: Comparison of anthocyanins source from purple tomato or black wolfberry. Front Chem Sci Eng. 2023, 17, 704–715. [Google Scholar] [CrossRef]
- Choi, I.; Lee, J.Y.; Lacroix, M.; Han, J. Intelligent pH indicator film composed of agar/potato starch and anthocyanin extracts from purple sweet potato. Food Chem. 2017, 218, 122–128. [Google Scholar] [CrossRef] [PubMed]
- Valencia, G.A.; Luciano, C.G.; Lourenço, R.V.; Bittante, A.M.Q.B.; Sobral, P.J.D. Morphological and physical properties of nano-biocomposite films based on collagen loaded with laponite®. Food Packag. Shelf Life. 2019, 19, 24–30. [Google Scholar] [CrossRef]
- Liu, J.; Wang, H.; Guo, M.; Li, L.L.; Chen, M.M.; Jiang, S.W.; et al. Extract from Lycium ruthenicum Murr. Incorporating κ-carrageenan colorimetric film with a wide pH–sensing range for food freshness monitoring. Food Hydrocoll. 2019, 94, 1–10. [Google Scholar] [CrossRef]
- Merz, B.; Capello, C.; Leandro, G.C.; Moritz, D.E.; Monteiro, A.R.; Valencia, G.A. A novel colorimetric indicator film based on chitosan, polyvinyl alcohol and anthocyanins from jambolan (Syzygium cumini) fruit for monitoring shrimp freshness. Int. J. Biol. Macromol. 2020, 153, 625–632. [Google Scholar] [CrossRef] [PubMed]
- Kimbuathong, N.; Leelaphiwat, P.; Harnkarnsujarit, N. Inhibition of melanosis and microbial growth in Pacific white shrimp (Litopenaeus vannamei) using high CO2 modified atmosphere packaging. Food Chem. 2020, 312, 126114. [Google Scholar] [CrossRef] [PubMed]
- Mohammadalinejhad, S.; Almasi, H.; Moradi, M. Immobilization of Echium amoenum anthocyanins into bacterial cellulose film: A novel colorimetric pH indicator for freshness/spoilage monitoring of shrimp. Food Control. 2020, 113, 107169. [Google Scholar] [CrossRef]
- Reyes, L.F.; Cisneros-Zevallos, L. Degradation kinetics and colour of anthocyanins in aqueous extracts of purple- and red-flesh potatoes (Solanum tuberosum L.). Food Chem. 2007, 100, 885–894. [Google Scholar]
- Qin, Y.; Liu, Y.; Yuan, L.; Yong, H.M.; Liu, J. Preparation and characterization of antioxidant, antimicrobial and pH-sensitive films based on chitosan, silver nanoparticles and purple corn extract. Food Hydrocoll. 2019, 96, 102–111. [Google Scholar] [CrossRef]
- Yoshida, C.M.P.; Maciel, V.B.V.; Mendonça, M.E.D.; Franco, T.T. Chitosan biobased and intelligent films: Monitoring pH variations. LWT. 2014, 55, 83–89. [Google Scholar] [CrossRef]
- Liu, D.; Cui, Z.; Shang, M.; Zhong, Y. A colorimetric film based on polyvinyl alcohol/sodium carboxymethyl cellulose incorporated with red cabbage anthocyanin for monitoring pork freshness. Food Packag. Shelf Life. 2021, 28, 100641. [Google Scholar] [CrossRef]
- Zhang, Y.; Han, J.H. Plasticization of pea starch films with monosaccharides and polyols. J. Food Sci. 2006, 7, 253–261. [Google Scholar] [CrossRef]
- Zhai, X.; Shi, J.; Zou, X.; Wang, S.; Jiang, C.; Zhang, J.; et al. Novel colorimetric films based on starch/polyvinyl alcohol incorporated with roselle anthocyanins for fish freshness monitoring. Food Hydrocoll. 2017, 69, 308–317. [Google Scholar] [CrossRef]
- Huang, J.; Chen, M.; Zhou, Y.; Li, Y.; Hu, Y. Functional characteristics improvement by structural modification of hydroxypropyl methylcellulose modified polyvinyl alcohol films incorporating roselle anthocyanins for shrimp freshness monitoring. Int. J. Biol. Macromol. 2020, 162, 1250–1261. [Google Scholar] [CrossRef]
- Mansur, H.S.; Oréfice, R.L.; Mansur, A.A.P. Characterization of poly(vinyl alcohol)/poly(ethylene glycol) hydrogels and PVA-derived hybrids by small-angle X-ray scattering and FTIR spectroscopy. Polymer (Guildf). 2004, 45, 7193–7202. [Google Scholar] [CrossRef]
- Koosha, M.; Hamedi, S. Intelligent Chitosan/PVA nanocomposite films containing black carrot anthocyanin and bentonite nanoclays with improved mechanical, thermal and antibacterial properties. Prog. Org. Coat. 2019, 127, 338–347. [Google Scholar] [CrossRef]
- Pourjavaher, S.; Almasi, H.; Meshkini, S.; Pirsa, S.; Parandi, E. Development of a colorimetric pH indicator based on bacterial cellulose nanofibers and red cabbage (Brassica oleraceae) extract. Carbohydr. Polym. 2017, 156, 193–201. [Google Scholar] [CrossRef]
- Zhang, J.; Zou, X.; Zhai, X.; Huang, X.; Jiang, C.; Holmes, M. Preparation of an intelligent pH film based on biodegradable polymers and roselle anthocyanins for monitoring pork freshness. Food Chem. 2019, 272, 306–312. [Google Scholar] [CrossRef]
- Piñeros-Hernandez, D.; Medina-Jaramillo, C.; López-Córdoba, A.; Goyanes, S. Edible cassava starch films carrying rosemary antioxidant extracts for potential use as active food packaging. Food Hydrocoll. 2017, 63, 488–195. [Google Scholar] [CrossRef]
- Alizadeh-Sani, M.; Tavassoli, M.; McClements, D.J.; Hamishehkar, H. Multifunctional halochromic packaging materials: Saffron petal anthocyanin loaded-chitosan nanofiber/methyl cellulose matrices. Food Hydrocoll. 2021, 111, 106237. [Google Scholar] [CrossRef]
Figure 3.
Color change of films based on PVA/PTA films used to monitored shrimp freshness.
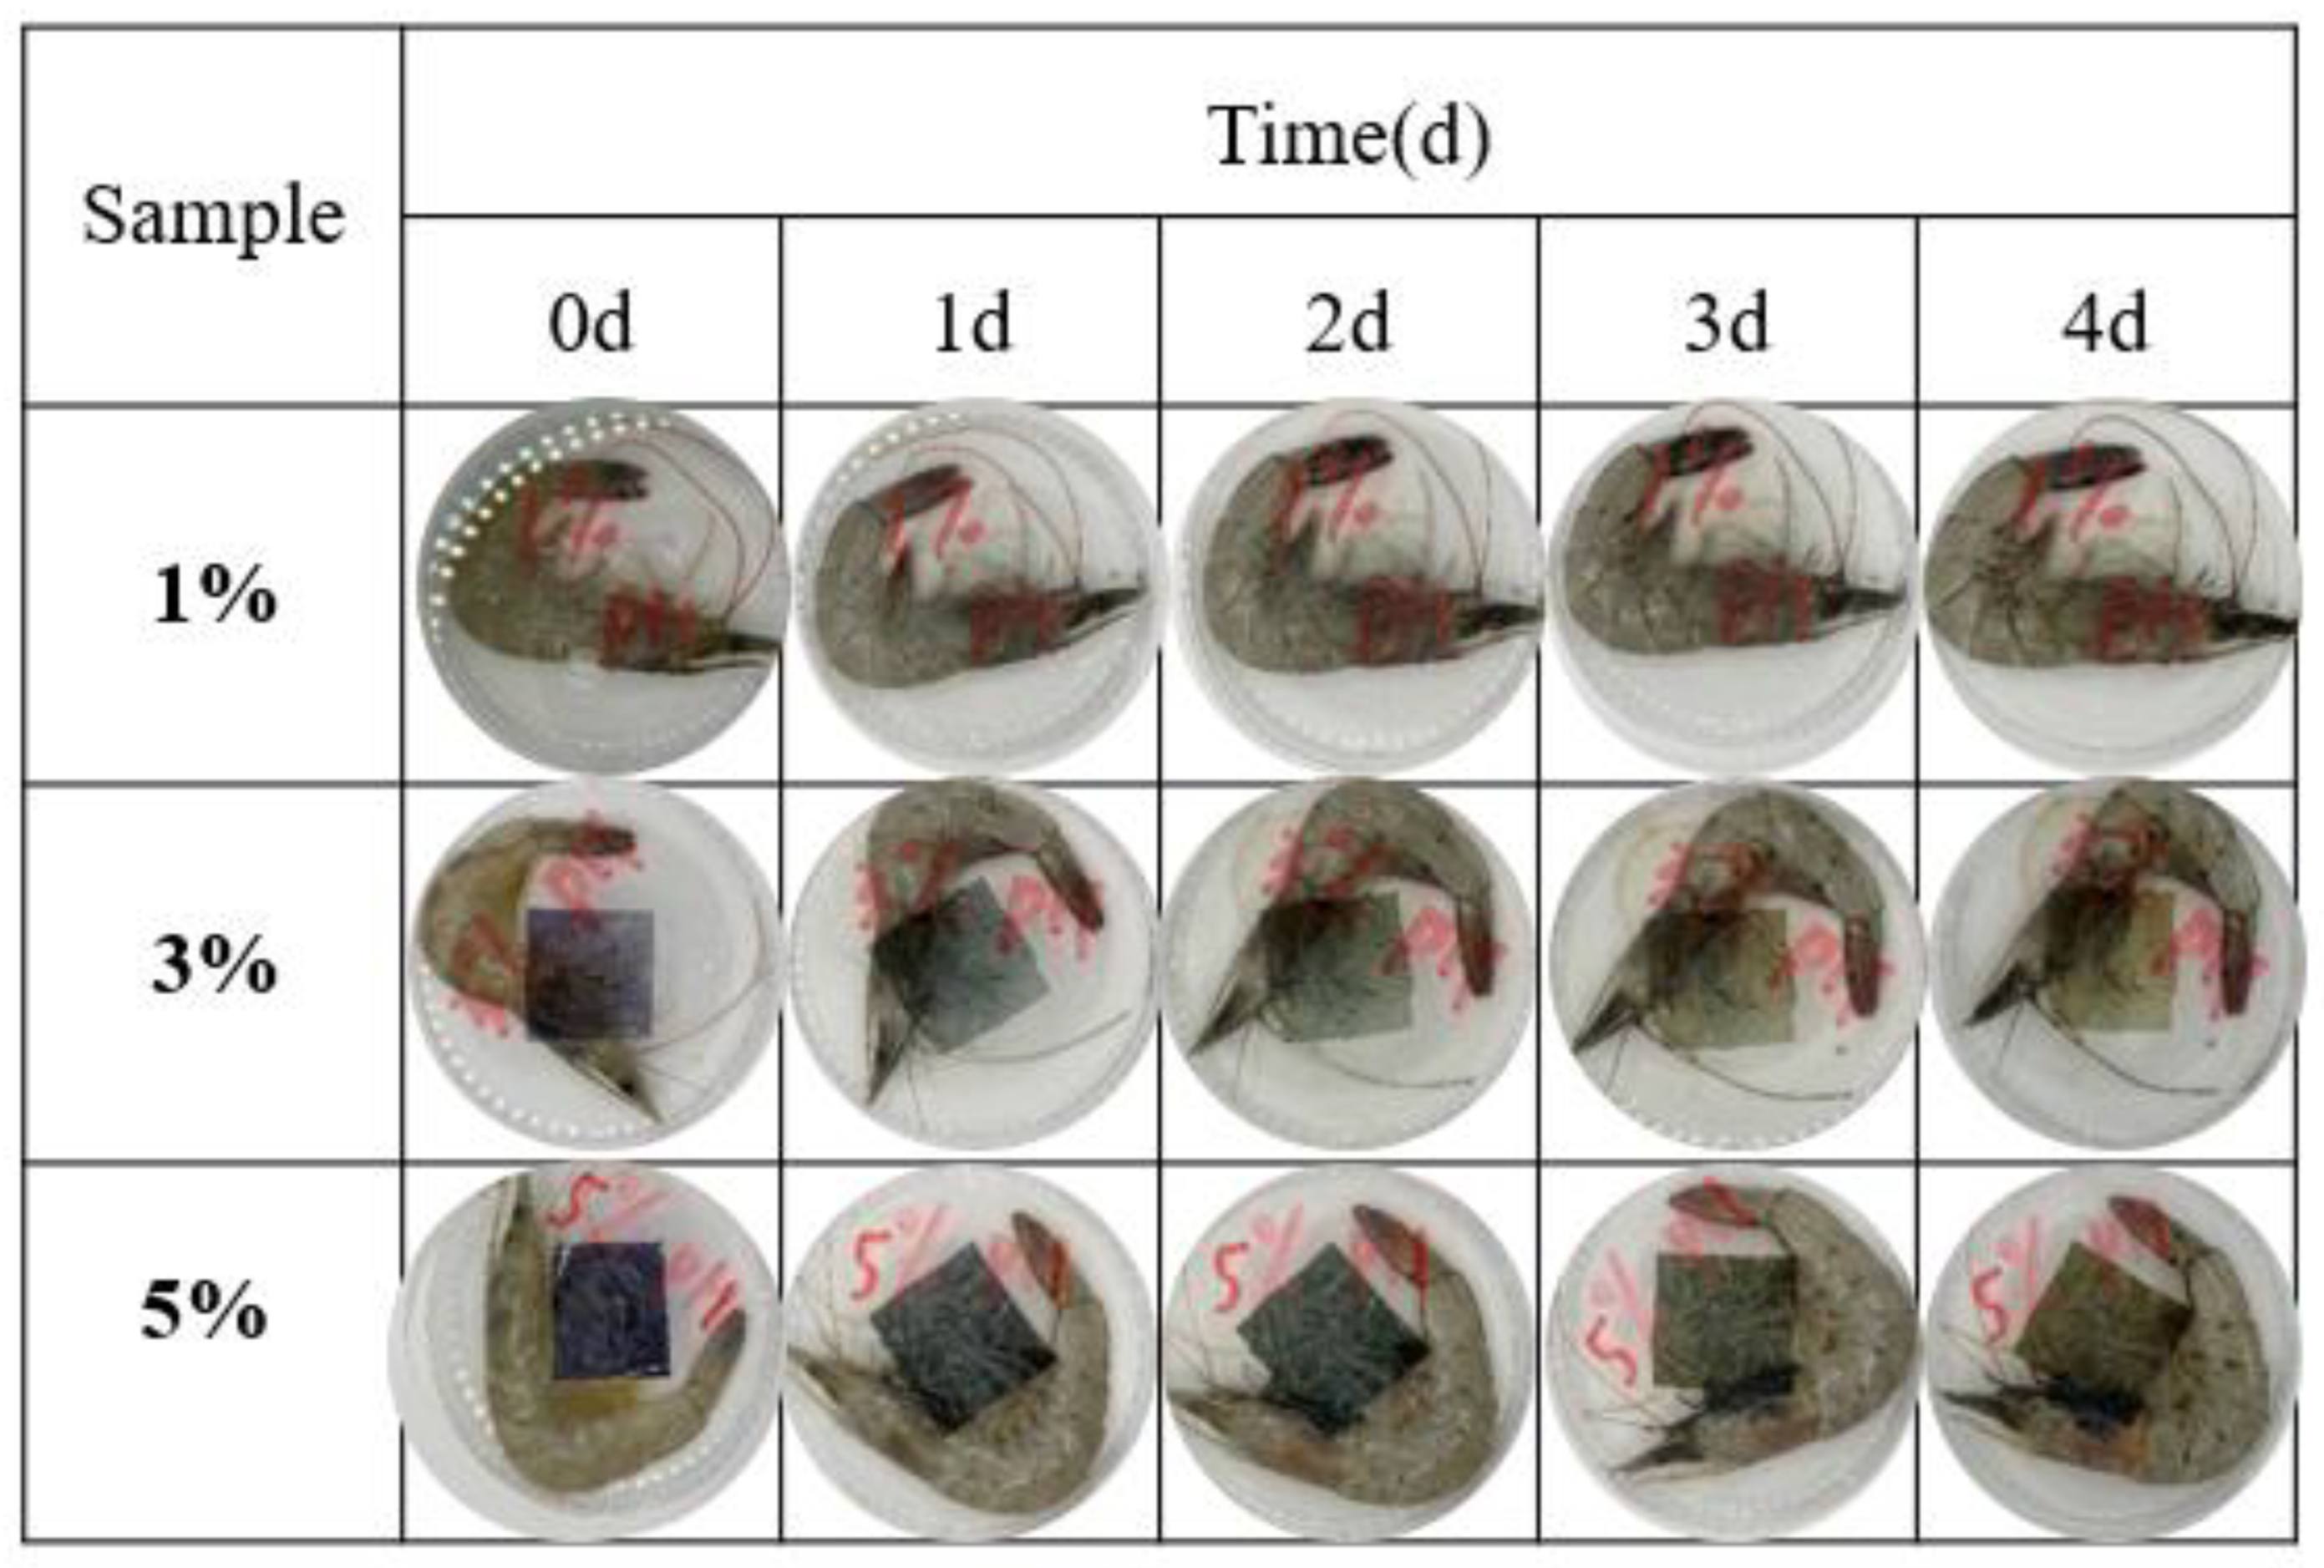

Table 1.
Color parameters (L∗, a∗, b∗ and ΔE∗) of original PVA /PTA films.
| PTA (%) | L* | a* | b* | E* |
|---|---|---|---|---|
| 0% | 85.16±0.15a | 3.26±0.05c | -8.8±0.25a | 14.32±0.21d |
| 1% | 57.16±3.64b | 6.32±0.79a | -9.76±0.43a | 37.21±0.36c |
| 3% | 45.68±3.41c | 5.22±0.25b | -12.68±1.06b | 48.67±3.01b |
| 5% | 27.06±1.01d | 4.84±0.59b | -11.7±1.72b | 65.94±0.42a |
Note: Values in the table are expressed as mean ± standard deviation; different lowercase letters indicate significant differences (P<0.05).
Table 2.
Film thickness, water content and water vapor transmission coefficient.
| PTA (%) |
Thickness (μm) |
MC (%) |
WVP (10−8 g per m. s. Pa) |
|---|---|---|---|
| 0% | 57.86±2.4c | 6.82±0.26a | 2.08±0.33b |
| 1% | 62.2±8.14bc | 6.58±0.16a | 1.72±0.23b |
| 3% | 73.48±9.98b | 6.22±0.59a | 1.24±0.02c |
| 5% | 88.22±8.41a | 6.40±0.37a | 2.7±0.05a |
Note: Values in the table are expressed as mean ± standard deviation; different lowercase letters indicate significant differences (P<0.05).
Table 3.
Changes of freshness monitor (TPC, pH, TVB-N) and ΔE values of shrimp using 5 % PVA/PTA indicator films during storage at 4 °C.
Table 3.
Changes of freshness monitor (TPC, pH, TVB-N) and ΔE values of shrimp using 5 % PVA/PTA indicator films during storage at 4 °C.
| Time(d) | pH | TVB-N content (mg per 100g) | TPC (log CFU per g) |
ΔE |
|---|---|---|---|---|
| 0 | 7.1±0.2 | 7.2±0.3 | 5.261±0.2 | 65.9±0.4 |
| 1 | 7.4±0.1 | 19.3±0.1 | 5.378±0.1 | 58.78±0.2 |
| 2 | 7.8±0.1 | 28.6±0.1 | 5.457±0.1 | 44.18±0.2 |
| 3 | 8.0±0.1 | 38.0±0.2 | 5.659±0.1 | 35.89±0.2 |
| 4 | 8.4±0.1 | 50.0±0.1 | 6.767±0.2 | 30.12±0.1 |
Note: Values in the table are expressed as mean ± standard deviation.
Disclaimer/Publisher’s Note: The statements, opinions and data contained in all publications are solely those of the individual author(s) and contributor(s) and not of MDPI and/or the editor(s). MDPI and/or the editor(s) disclaim responsibility for any injury to people or property resulting from any ideas, methods, instructions or products referred to in the content. |
© 2023 by the authors. Licensee MDPI, Basel, Switzerland. This article is an open access article distributed under the terms and conditions of the Creative Commons Attribution (CC BY) license (http://creativecommons.org/licenses/by/4.0/).
Copyright: This open access article is published under a Creative Commons CC BY 4.0 license, which permit the free download, distribution, and reuse, provided that the author and preprint are cited in any reuse.


