
Submitted:
11 December 2023
Posted:
12 December 2023
You are already at the latest version
Abstract
A milk drink flavored with dates syrup produced at a lab scale level was evaluated. The production process of date syrup involves a sequence of essential unit operations, commencing with the extraction, filtration, and concentration processes from two cultivars: Sukkary and Khlass. Date syrup was then mixed with cow’s and camel’s milk at four percentages to form a nutritious, natural, sweet, and energy milk drink. Sensory, physical, and chemical characteristics of the milk drinks flavored with date syrup were examined. The objective of this work was to measure physiochemical properties of dates fruits and milk drinks flavored with dates syrup, then to evaluate the physical properties of milk drinks utilizing a non-destructive NIR spectra. The study assessed the characteristics of the milk drink enhanced with date syrup by employing near-infrared spectra (NIR) spectra and analyzed utilizing partial least-square regression (PLSR) and artificial neural network (ANN) analysis. The NIR spectrum proved to be highly effective in estimating the physiochemical attributes of the flavored milk drink. The ANN model outperformed the PLSR model in this context. RMSECV is considered a more reliable indicator of a model's future predictive performance compared to RMSEC, R2 ranged between 0.946 and 0.989. Consequently, non-destructive NIR technology demonstrates significant promise for accurately predicting and contributing to the entire production process of the product's properties examined.
Keywords:
Milk
; Dates
; Syrup
; Sukkary
; Drink
; modeling
; NIR
; ANN .quality
Practical Applications
- This research is important to introduce and evaluate a nutritional and sweetener milk drink flavored with dates syrup.
- The drink can be introduced to commercial dairy plants that would be competitive with drinks with synthetic flavors and sweeteners.
- Reduce dates losses in SA to encourage the production of dates syrup with the introduction and evaluation of an added value and nutritious milk flavored with dates.
- Improve health at the national level in schools, hospitals as well and other sectors of society through the utilization of dairy products into more innovative drinks flavored with nutritious and energy source dates.
- It is hoped that the results of this study will lead to the manufacture of unique natural and high-nutritional-value products at an industrial level.
- Hopefully, it can be utilized as a scientific base for further research and commercial applications.
- NIR spectrophotometry is a tool for forecasting physiochemical properties and holds significant potential for practical implementation across the entire food production, processing, transportation, storage, and retail chain. This utilization can be instrumental in monitoring product 'quality' and 'shelf life,'.
Introduction
The date palm, scientifically known as Phoenix dactylifera L., is regarded as one of the most ancient fruit-bearing trees on the planet. Date palm trees are cultivated mainly in the Middle East, and North Africa, as well as other parts of Central and South America, Southern Europe, India, and Pakistan [1,2,3]. World date production is 9.8 million tons (2021) [4]. Saudi Arabia is one of the top producers of dates estimated at 1.6 million tons of dates from 34 million palm trees [5].
The current worldwide food security problems necessitate the need to create added-value products from locally available agricultural products that have high losses. Dates are still consumed as fresh fruit, which has low prices in the market. Dates losses are estimated to be up to 26% in the market chain. Traditional packaging of raw dates is commonly practiced in most date-producing countries. Added value date products can be an important economic resource for producing and processing countries. There is a need to utilize and manufacture added-value products from dates (second or third grade). Possible processed products from dates include syrup, vinegar, liquid sugar, yeast, medical alcohol, and fodder. Furthermore, date syrup is a superior natural and sweetener concentrate and can be utilized and added to other foods such as dairy products for both nutrition and sweeteners.
The dairy industry in the Saudi Kingdom is one of the most advanced and successful food industrial sectors in the region. The Kingdom's production reaches 2.55 million tons per year from 700 thousand cows [6]. This industrial sector produces many high-value dairy products, such as pasteurized, sterilized, low-fat, and skimmed milk, as well as yogurt, cheese, butter, ice cream, and others. These dairy industries utilize flavors such as chocolate, strawberry, vanilla, caramel, or coffee to milk and other dairy products. These flavored milk drinks available in supermarkets are typically made from milk with artificial or natural fruit flavors. Furthermore, those milk drinks typically contain added processed sugars.
The world production of camel milk has reached five million tons per year. Saudi Arabia has more than 813,000 camels that produce 353.21 thousand tons per year [5]. The consumption of camel milk has increased due to its high nutritional value and significant health benefits [4,7].
The availability of both raw milk and dates in Saudi Arabia indicates the need to utilize these products in a unique drink characterized by nutrition, healthy, and natural sweeteners. One of these added-value products is a milk drink flavored and sweetened with date syrup. This would create new outlets for marketing dates and dairy products, thus providing an exclusive nutritional and health drink for consumers especially for children and in schools as well as others [8]. The mixture of fresh milk and dates can be competitive with the currently available milk drinks available with synthetic chocolate, vanilla, coffee, caramel, banana, or strawberry flavors.
Recently, Near-infrared spectroscopy (NIR) has become a widely adopted non-destructive method for swiftly evaluating various food properties. Numerous studies have endeavored to forecast the physical and chemical attributes of food products, whether fresh or during processing and storage, using NIR [9,10,11,12,13,14,15,16]. Additionally, researchers have explored the correlation between spectroscopy and sensory evaluations of food items [17,18,19,20,21]. The coupling of NIR and statistical analysis serves as a potent approach for elucidating food properties and sensory assessments. Developing a quality index model for food attributes and subsequently employing NIR to express this quality index can streamline and expedite food quality assessments along the production and shelf-life stages [22,23,24,25,26,27,28,29,30,31,32,33].
In recent research, Tian et al. [34] developed an NIR model to predict three flavonoid components (total flavonoids, phloridin, and trilobatin) in sweet tea leaves as a cost-effective and time-saving alternative to conventional chemical analyses. The R2 values of the NIR models were 0.967 for calibration, 0.858 for validation, and 0.818 for prediction sets, clearly indicating the rapid and convenient ability of NIR to determine flavonoid content in sweet tea. Moreover, Zhang et al. [35] established correlations between green tea components (caffeine, epigallocatechin-3-gallate (EGCG), and moisture content) and NIR during production, highlighting the utility of the model for online monitoring of tea product quality during production processes. They emphasized the advantages of NIR analysis, including its speed, non-destructiveness, and lower sample size requirements compared to traditional HPLC analysis.
Pandiselvam et al. [36] investigated diverse spectroscopic techniques, including NIR, to assess oxidative stability, detect adulteration, and identify harmful additives, pathogens, and toxins in coconut products. These non-destructive methods, including NIR, demonstrated success in authenticating and determining the quality of coconut products, including the identification of adulterants in coconut oil. Araújo et al. [37] established strong correlations between NIR spectra of green coffee beans and experimental values of electrical conductivity and potassium leaching, obtaining impressive R2 values of 0.97 and 0.88 for electrical conductivity and potassium leaching, respectively. Cano-Reinoso et al. [38] assessed and established a linkage between the chemical composition, specifically (α-guaiene and azulene), in 84 samples of patchouli aromatic oil from Indonesia using NIR spectroscopy.
The most effective calibration model was based on the second derivative, with an R2 exceeding 0.90 and a coefficient of variation below 2.98 %, affirming NIR's applicability for the quality assessment of patchouli oil. Ghooshkhaneh et al. [39] conducted a noteworthy study on the early detection of citrus black rot disease caused by fungi using NIR spectra. Oranges inoculated with Alternaria were assessed at wavelengths ranging from 200 to 1100 nm during the first, second, and third-weeks post-inoculation. The accuracy in distinguishing healthy and infected samples in the first week was 60 %, in the second week was 60 %, and in the third week reached 100 %.
To date, no published reports quantify both objective and subjective measurements of the properties of milk drinks flavored with date syrup using NIR, and ANN techniques. The present research aimed to develop and evaluate physiochemical properties of milk drinks (cow and camel) flavored with date syrup (Khlass and Sukkary) at different percentages utilizing NIR spectra with PLSR and ANN analysis.
2. Materials, Methods, and Production
2.1. Materials
Two of the most common dates varieties (Sukkary and Khlass) produced in Saudi Arabia, were obtained from a local date market in Riyadh and stored at a temperature of 5 °C until the start of the experiments.
Full-fat milk (both cow and camel) that was pasteurized by a brand-name dairy company was bought from a local market in Riyadh region. Milk samples were delivered in cold containers to the Food Engineering Laboratory (FEL) and kept refrigerated for a maximum of two days until the start of the experiments.
2.2. Methods
Date syrup production
Date syrup was produced utilizing a lab-scale level at FEL. The major unit operations include the removal of date pits, mechanical mincing to produce date paste, and mixing and heating of the date paste with water (at a w/w ratio of 2.5:1 (paste: water (weight/weight)) to produce a homogenized date suspension [40,41]. This was followed by press filtration of the date suspension to produce clarified date juice (Seitz Lab Filter Press, Model A20z, K150, Germany). Dates juice was then concentrated under vacuum using a lab-scale rising film natural convection evaporator (QVF Teaching system, CTSY Evaporation, Climbing Film and Natural Circulation Evaporator, QVF, Germany) to produce high-quality date syrup. Dates syrup can be preserved for several months at room temperature since sugar content reaches 80%.
Preparation of milk drinks flavored with date syrup
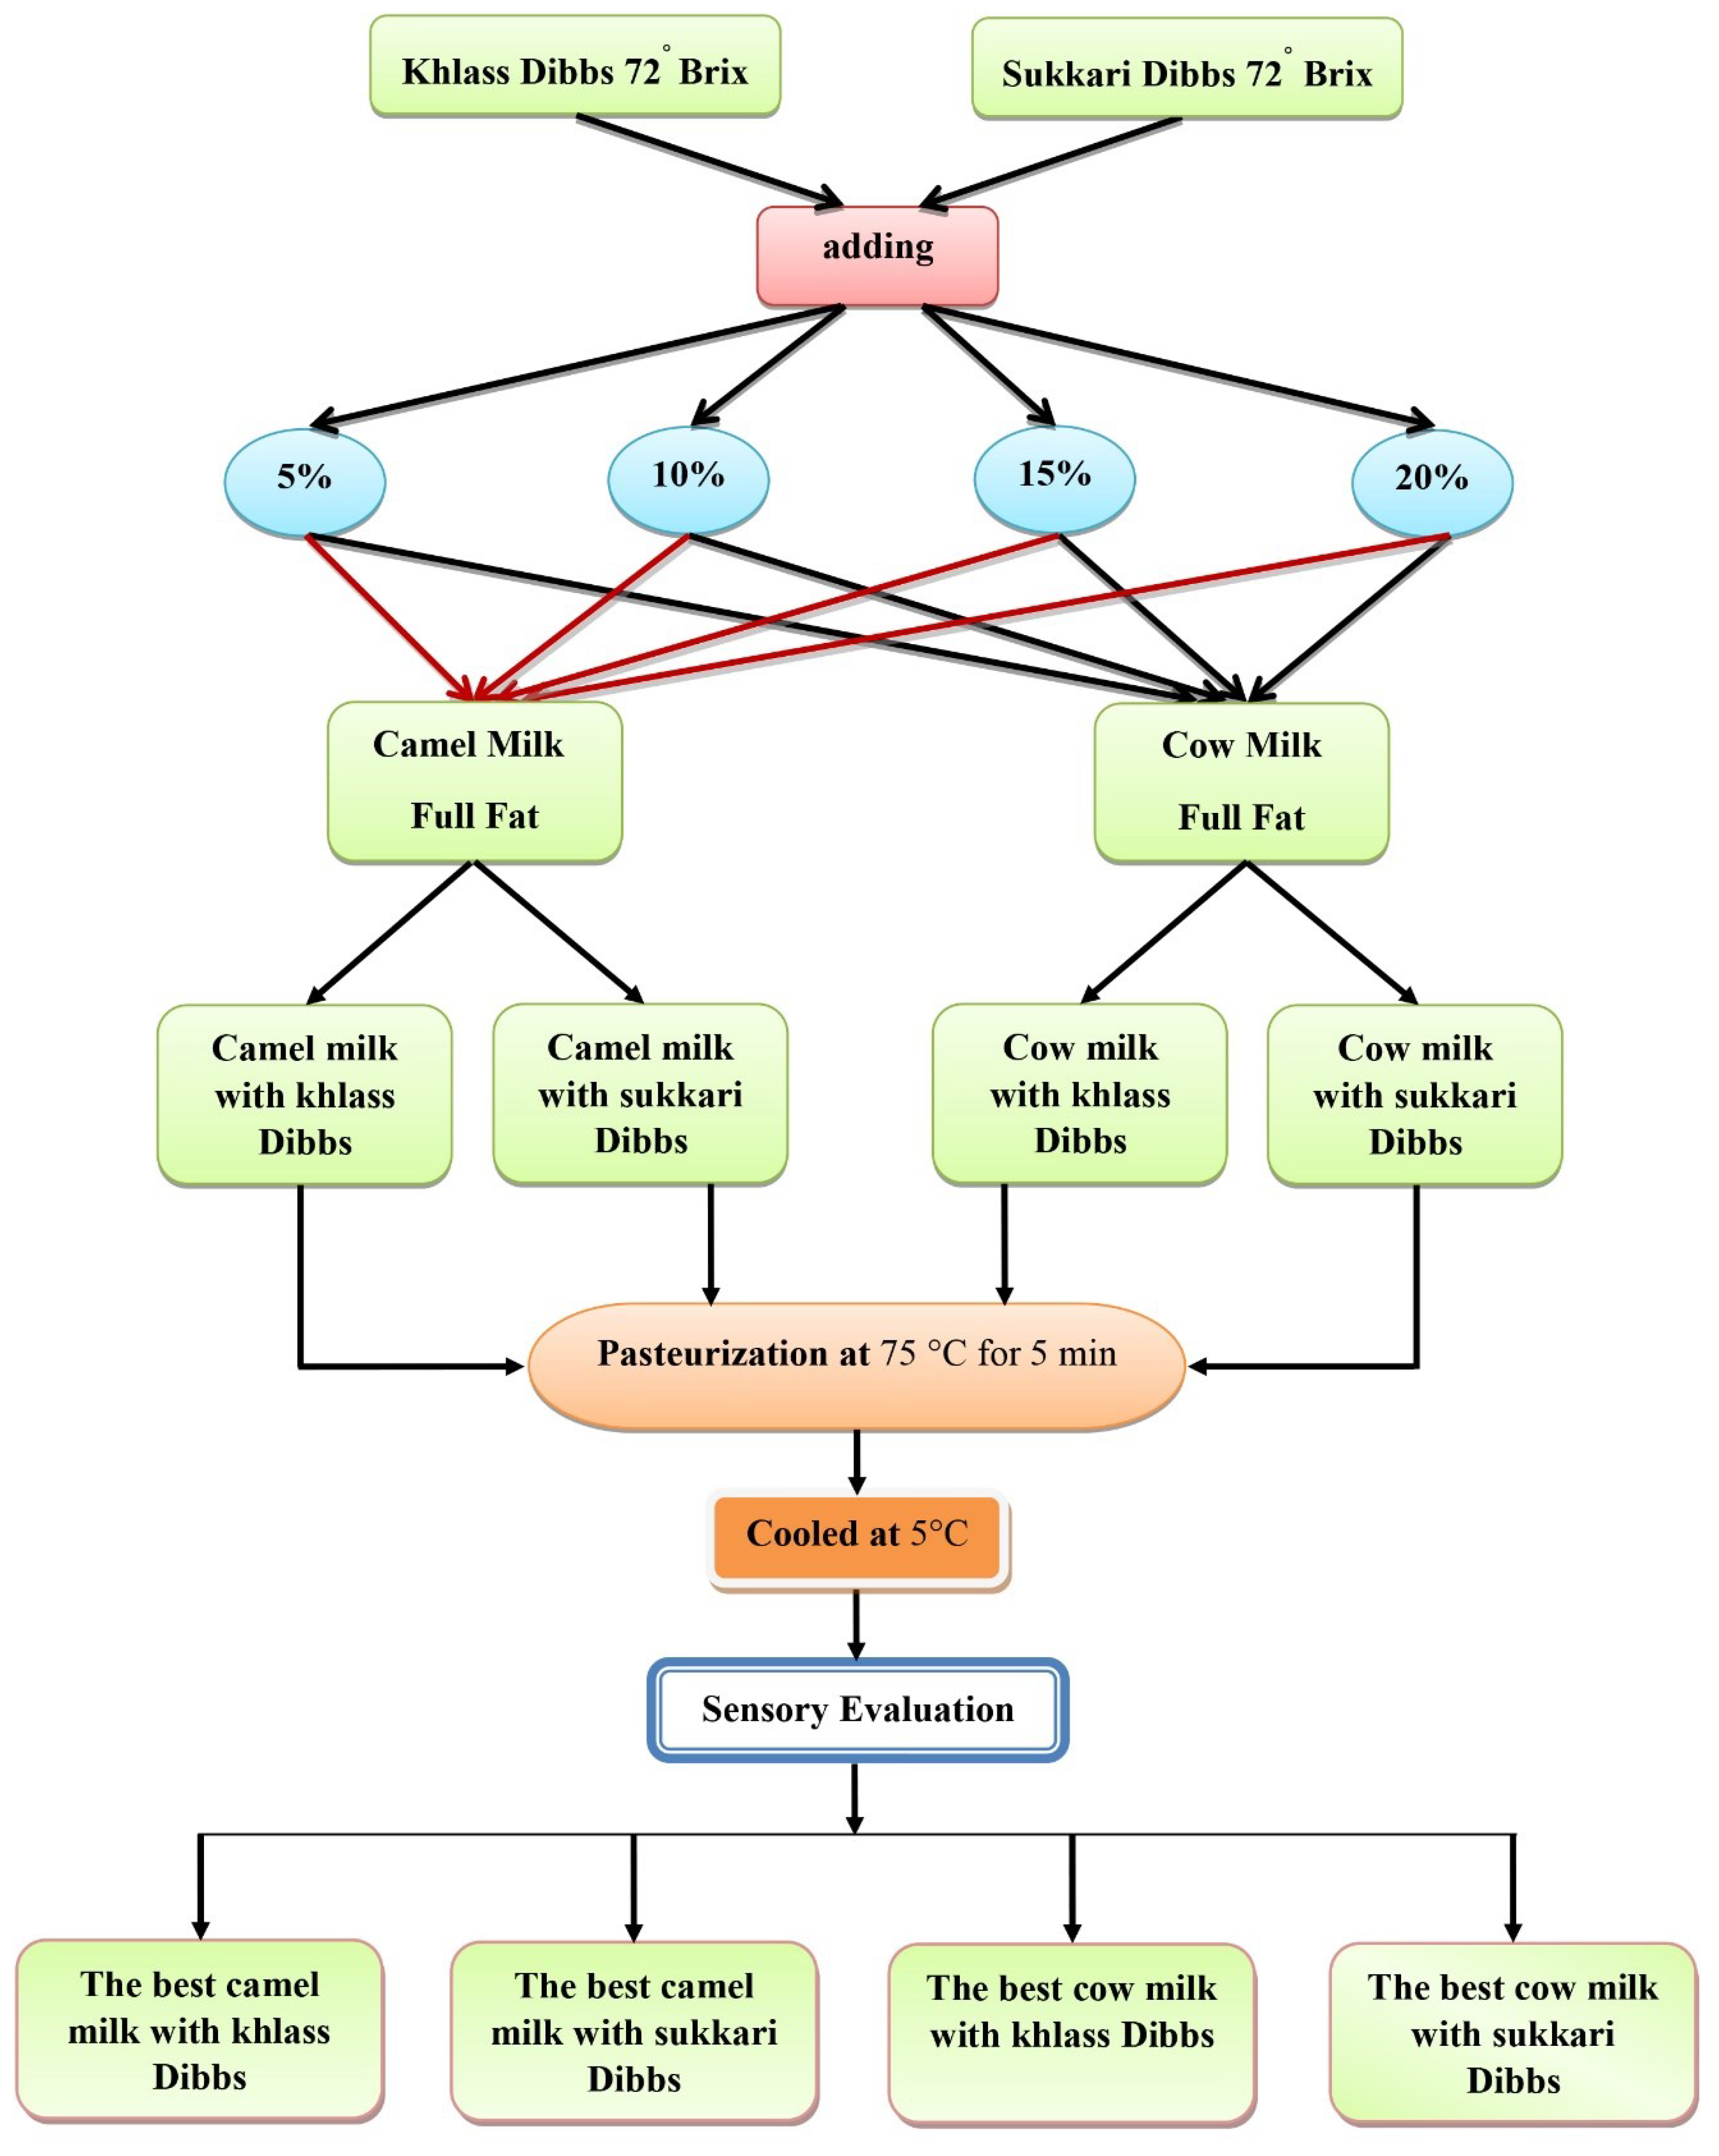
At the start of experiments, 16 batches of milk flavored with dates syrup were prepared as shown in Figure 1. Four amounts of date syrup (5, 10, 15, and 20 gm) from two date cultivars (Sukkary and Khlass) were added to milk (95, 90, 85, and 80 gm, respectively for cow and camel) so the total milk drink batch would be 100 gm. The initial sensory evaluation revealed that four batches were favorable from the sixteen mixes as reported in details by Elamshity and Alhamdan [41,42]. The chemical and physical measurements were then performed on those four favorable mixtures which were 15% milk drink flavored with Sukkary date syrup, and 10% milk drink flavored with Khlass date syrup for both cow and camel milk.
The drink samples were then pasteurized in a water bath (Kenwood, KM070 Series, and the UK) at 75 °C for 5 min [41,43]. The samples were then cooled in an ice-water bath with a mixer (Cofrimell & Coldream 2 M, Italy) to 5 °C. It was thus ready to conduct physiochemical experiments as well as sensory assessment.
Physiochemical Evaluation
- a)
- Physical properties
The standard method for measuring the moisture content was conducted for the four Date syrup-flavored milk drinks [44]. A vacuum oven (Vacutherm model VT 6025, Heraeus Instrument, D-63450. Hannover, Germany) was used to dry samples at a temperature of 70 °C under a vacuum of 200 mmHg for 48 hrs. Aqua Lab instrument (Model Series 3, Decagon Devices, Inc. Pullman, Washington 99163, and the USA) was used to measure water activity at room temperature (25 °C). The total soluble solids (TSS) of samples were measured using a refractometer (ABBE 5, Bellingham & Stanley Ltd., Longfield Rd, TunbridgeWells TN2 3EY, UK). The pH values of the samples were measured using a pH meter (Jenway, model 3510, Bibby Scientific Ltd., Stone, Staffordshire, UK) with measuring accuracy ± 0.01. After each measurement, the electrode was standardized using a pH 7.0 buffer. The total soluble solids and refraction indices of the samples were estimated using a refractometer (ABBA 5 (code 44-501), Bellingham and Stanley Ltd (BS), Jena, Germany) at lab temperature (25 ° C).
Figure 1.
Preparation of milk and Dibb's drinks.
The densities of the sample drinks were determined at different temperatures (from 5 to 80 °C) using a density meter (DMA4100M, Anton Paar GmbH, Graz, Austria).
The basic color coefficients (L*, a*, and b*) of the samples were estimated using a color instrument (Color 45/0, Hunter Associates Laboratory, Inc., VA, USA). L* indicates whiteness or brightness/darkness, a* indicates redness/greenness, b* indicates yellowness/blueness, and L0*, a0*, and b0* are the corresponding values at zero time. Color derivatives of Chroma, Hue Angle, and Browning Index (BI) were calculated from basic color coefficients [45,46,47]:
Where:
- b)
- Chemical analysis
Chemical analysis was performed for the fresh milk(cow and camel), date syrup (Khlass and Sukkary), and the four date syrup-flavored milk drinks. The chemical analysis was conducted according to the standards of the Association of Official Analytical Chemists [44].
- c)
- Sensory evaluation
Sensory evaluation was carried out in two steps. The first was to evaluate the best drinks formulated from date syrup (5 to 20%) of the two date cultivars (Sukkary and Khlass) and add cow’s milk and camel's milk as described and detailed by [41,42]. A nine-point structured hedonic scale [48,49,50,51,52,53,54] was used, with a score of 9 indicating “like extremely”, and 1 meaning “dislike extremely”. The sensory characteristics were taste, flavor, texture, color, and general acceptance of the product. Thirty judges (professors, employees, and students from the departments of Agricultural Engineering and Food Science and Nutrition, Food Science and Agriculture College, King Saud University.
Evaluation of physicall properties of milk drinks utilizing NIR
The non-destructive assessment of samples properties was conducted with near-infrared spectroscopy (NIR) by a handheld NIR meter (F-750, Firmware v.1.2.0 build 7041, Felix Instruments, Camas, WA, USA)."
The F-750 system was equipped with a Zeiss MMS1 VIS-NIR spectrometer operating in the range of 310–1100 nm at 3 nm intervals. Prior to sample physical properties measurements, optical readings were taken for all samples. The F-750 device featured a reference shutter, allowing for the calculation of dark current and ambient light effects with each measurement, particularly when scanning with the lamp off. For each sample, 300 hundred scans were recorded and averaged. During the validation phase, spectra were acquired for a distinct set of samples under the same conditions at 5°C.
Following spectrum capture, the data was transferred from the F-750 SD-Card to a computer for analysis. The stored data was imported and saved as a comma-separated values file (CSV file) using Data Viewer Software. Spectra underwent pre-processing via the Savitzky–Golay second derivative. Calibration models were then established using a dataset comprising 1200 samples, 840 spectra (training), 240 spectra (test), and 120 spectra (validate). Two analysis tools were employed for calibration model development: partial least squares regression (PLSR) and artificial neural network (ANN).
PLSR entailed examining the spectra as a linear multivariate relationship [55]. This method involved identifying latent variables (LVs) that elucidate the most significant variance in the data. LVs were discerned by exploring sub-spaces enhancing covariance between predictor and response variables [56].
In parallel, artificial neural networks (ANNs) were employed, providing a robust nonlinear pattern recognition approach capable of modeling intricate diversities, environmental factors, and instrument variations [57]. The estimated data was analyzed using App-Builder v2.1.7 software (Felix Instruments, Camas, WA, USA). Evaluation of prediction performance relied on calibration and validation results, assessed with correlation coefficient (R2), root mean square error in calibration (RMSEC), and cross-validation (RMSECV) [11]."
2.3. Statistical analysis
All quantifiable properties were subjected to analysis using a statistical software package (SAS software, Version 9.2, SAS Institute Inc., Cary, NC, USA) [58]. Experimental data were utilized for the analysis of variance (ANOVA). The least significant difference (LSD) was calculated at P ≤ 0.05. The prediction performance was assessed based on calibration and validation results utilizing AppBuilder v2.1.7 software (Felix Instruments, Camas, WA, USA). Graphs, plots, and other calculations were performed using the Microsoft Office 365 package (Microsoft, Redmond, WA, USA).
3. Results
The approach of this study was to produce date syrup and then adding it to formulate milk drinks flavored with the syrup. The milk drinks would be evaluated for two cultivars of syrup, two types of milk, and at different added concentrations. From the objective and subjective assessments of the selected milk drinks, NIR models would be developed.
All data of the physicochemical properties and sensory evaluation of the date syrup, fresh milk, and the four preferred milk drinks are presented in the following sections.
3.1. Physical properties (MC, aw, TSS, color, density, pH)
Dates syrup was successfully produced at the lab scale level. Basic physical properties (moisture content, water activity, total soluble solids, and pH) were experimentally measured for the date syrup, fresh milk, and preferred milk drinks flavored with date syrup are shown in Table 1. Though values appeared to be similar within each group, the variations are significantly different within date syrup, fresh milk, and milk drinks except for TSS of dates syrup. There are variations of the properties of the four date syrup-flavored milk drinks. The initial values of the fresh milk and date syrup have an apparent effect on the milk drinks properties. It can be noticed that fresh milk has a notable effect on milk drinks properties due to the high % of milk (85 to 90%) compared to that of syrup (10 to 15%). The experimental results for the four drinks are summarized in Table 1 for mean values and variance analysis.
Color
Table 2 shows mean values of the basic color parameters (L*, a*, b*) and their derivatives parameters (Chroma, Hue Angle, and BI). They were measured at room temperature (25 °C) for the date Syrup, fresh milk, and preferred milk drinks.
It can be seen from Table 2 that there are variations and significantly difference within date syrup, fresh milk, and milk drinks due to nature of milk, dates, in addition to storage and processing parameters. It is apparent that (L*) values are way higher for fresh milk (whiteness) compared to syrup (darkness). This shows the importance of (L*) parameter compared to (a*) and (b*) parameters for the samples examined in this study.
Mean values of the basic parameter (L*) of the milk drinks which range between zero for darkness and 100 for whiteness (brightness) varied from 85.133 to 88.667. This indicated the effect of date’s syrup (dark brown) on darkening the color of the milk drinks. The mean value of (a*) varied from −0.075 to 0.418 whereas the mean value of (b*) varied from 13.383 to 15.262.

Table 2.
Mean values of the basic and derivatives color parameters for the date syrup, fresh milk, and four preferred milk/Date syrup drinks.
Table 2.
Mean values of the basic and derivatives color parameters for the date syrup, fresh milk, and four preferred milk/Date syrup drinks.
| Product type | Basic color parameters | Derivative color parameters | ||||
|---|---|---|---|---|---|---|
| L* | a* | b* | Chroma | Hue angle | BI | |
| Date syrup Sukkary | 4.444b | 1.673b | 5.348b | 5.604b | 51.730b | 339.689a |
| Date syrup Khlass | 6.892a | 2.231a | 7.588a | 7.910a | 52.103a | 277.498b |
| Cow Milk | 95.795a | -2.113a | 9.064a | 9.307a | -53.303a | 8.064a |
| Camel Milk | 94.912b | -1.274b | 5.627b | 5.770b | -53.432b | 4.978b |
| Cow’s milk + Sukkary (15%) | 86.128c | 0.038c | 13.991c | 13.991c | 57.474a | 17.346c |
| Cow’s milk + Khlass (10%) | 88.667a | −0.075d | 13.383d | 13.383d | −57.426d | 15.915d |
| Camel milk + Sukkary (15%) | 85.133d | 0.379b | 15.262a | 15.267a | 57.104b | 19.630a |
| Camel milk + Khlass (10%) | 87.873b | 0.418a | 14.444b | 14.450b | 57.034c | 17.895b |
* The similar letter in each column indicates that the average values are not significantly different at P<0.05.
Density
Densities for date syrup, fresh milk, milk drinks samples were measured at a temperature range from 5 to 80 °C shown in Table 3. It is interesting to note that all samples' densities were higher than 1.00 except that of camel milk at 80 °C. Density values for all samples decreased with the increase of temperature.
Mean values of density values for the four milk drinks within a temperature range of 5 to 80 °C are shown in Figure 2. It is apparent that density values for all four samples decreased with temperature increase. Over the experimental temperature range, average density values ranged from 1.030 to 1.079 g/cm3 (Table 3.).
Densities of each sample of fresh milk, syrup, and milk drink were correlated linearly well with temperature (R2: 0.970 to 0.988) as shown in Table 4.
Table 3.
Mean values of density (g/cm3) of the date syrup (for the two cultivars) at different temperatures (between 5 and 80 °C), fresh milk (for the two types), and four preferred milk/Date syrup drinks.*.
Table 3.
Mean values of density (g/cm3) of the date syrup (for the two cultivars) at different temperatures (between 5 and 80 °C), fresh milk (for the two types), and four preferred milk/Date syrup drinks.*.
| Temperature, °C | 5 | 10 | 25 | 40 | 60 | 80 |
|---|---|---|---|---|---|---|
| Date syrup Sukkary | 1.373b | 1.370b | 1.364b | 1.356a | 1.346a | 1.332a |
| Date syrup Khlass | 1.378a | 1.376a | 1.367a | 1.359a | 1.345a | 1.330a |
| Cow Milk | 1.034a | 1.033a | 1.029a | 1.023a | 1.013a | 1.010a |
| Camel Milk | 1.033a | 1.032a | 1.028a | 1.022a | 1.012a | 1.000a |
| Cow’s milk + Sukkary (15%) | 1.077b | 1.076b | 1.070b | 1.064b | 1.054b | 1.041a |
| Cow’s milk + Khlass (10%) | 1.063d | 1.062d | 1.057d | 1.051d | 1.041d | 1.031c |
| Camel milk + Sukkary (15%) | 1.079a | 1.078a | 1.074a | 1.067a | 1.057a | 1.041a |
| Camel milk + Khlass (10%) | 1.068c | 1.068c | 1.063c | 1.056c | 1.046c | 1.032c |
* Similar letters in each column within a group indicates that the average values are not significantly different at P<0.05.
Figure 2.
Density values for the four milk drinks at different temperatures.
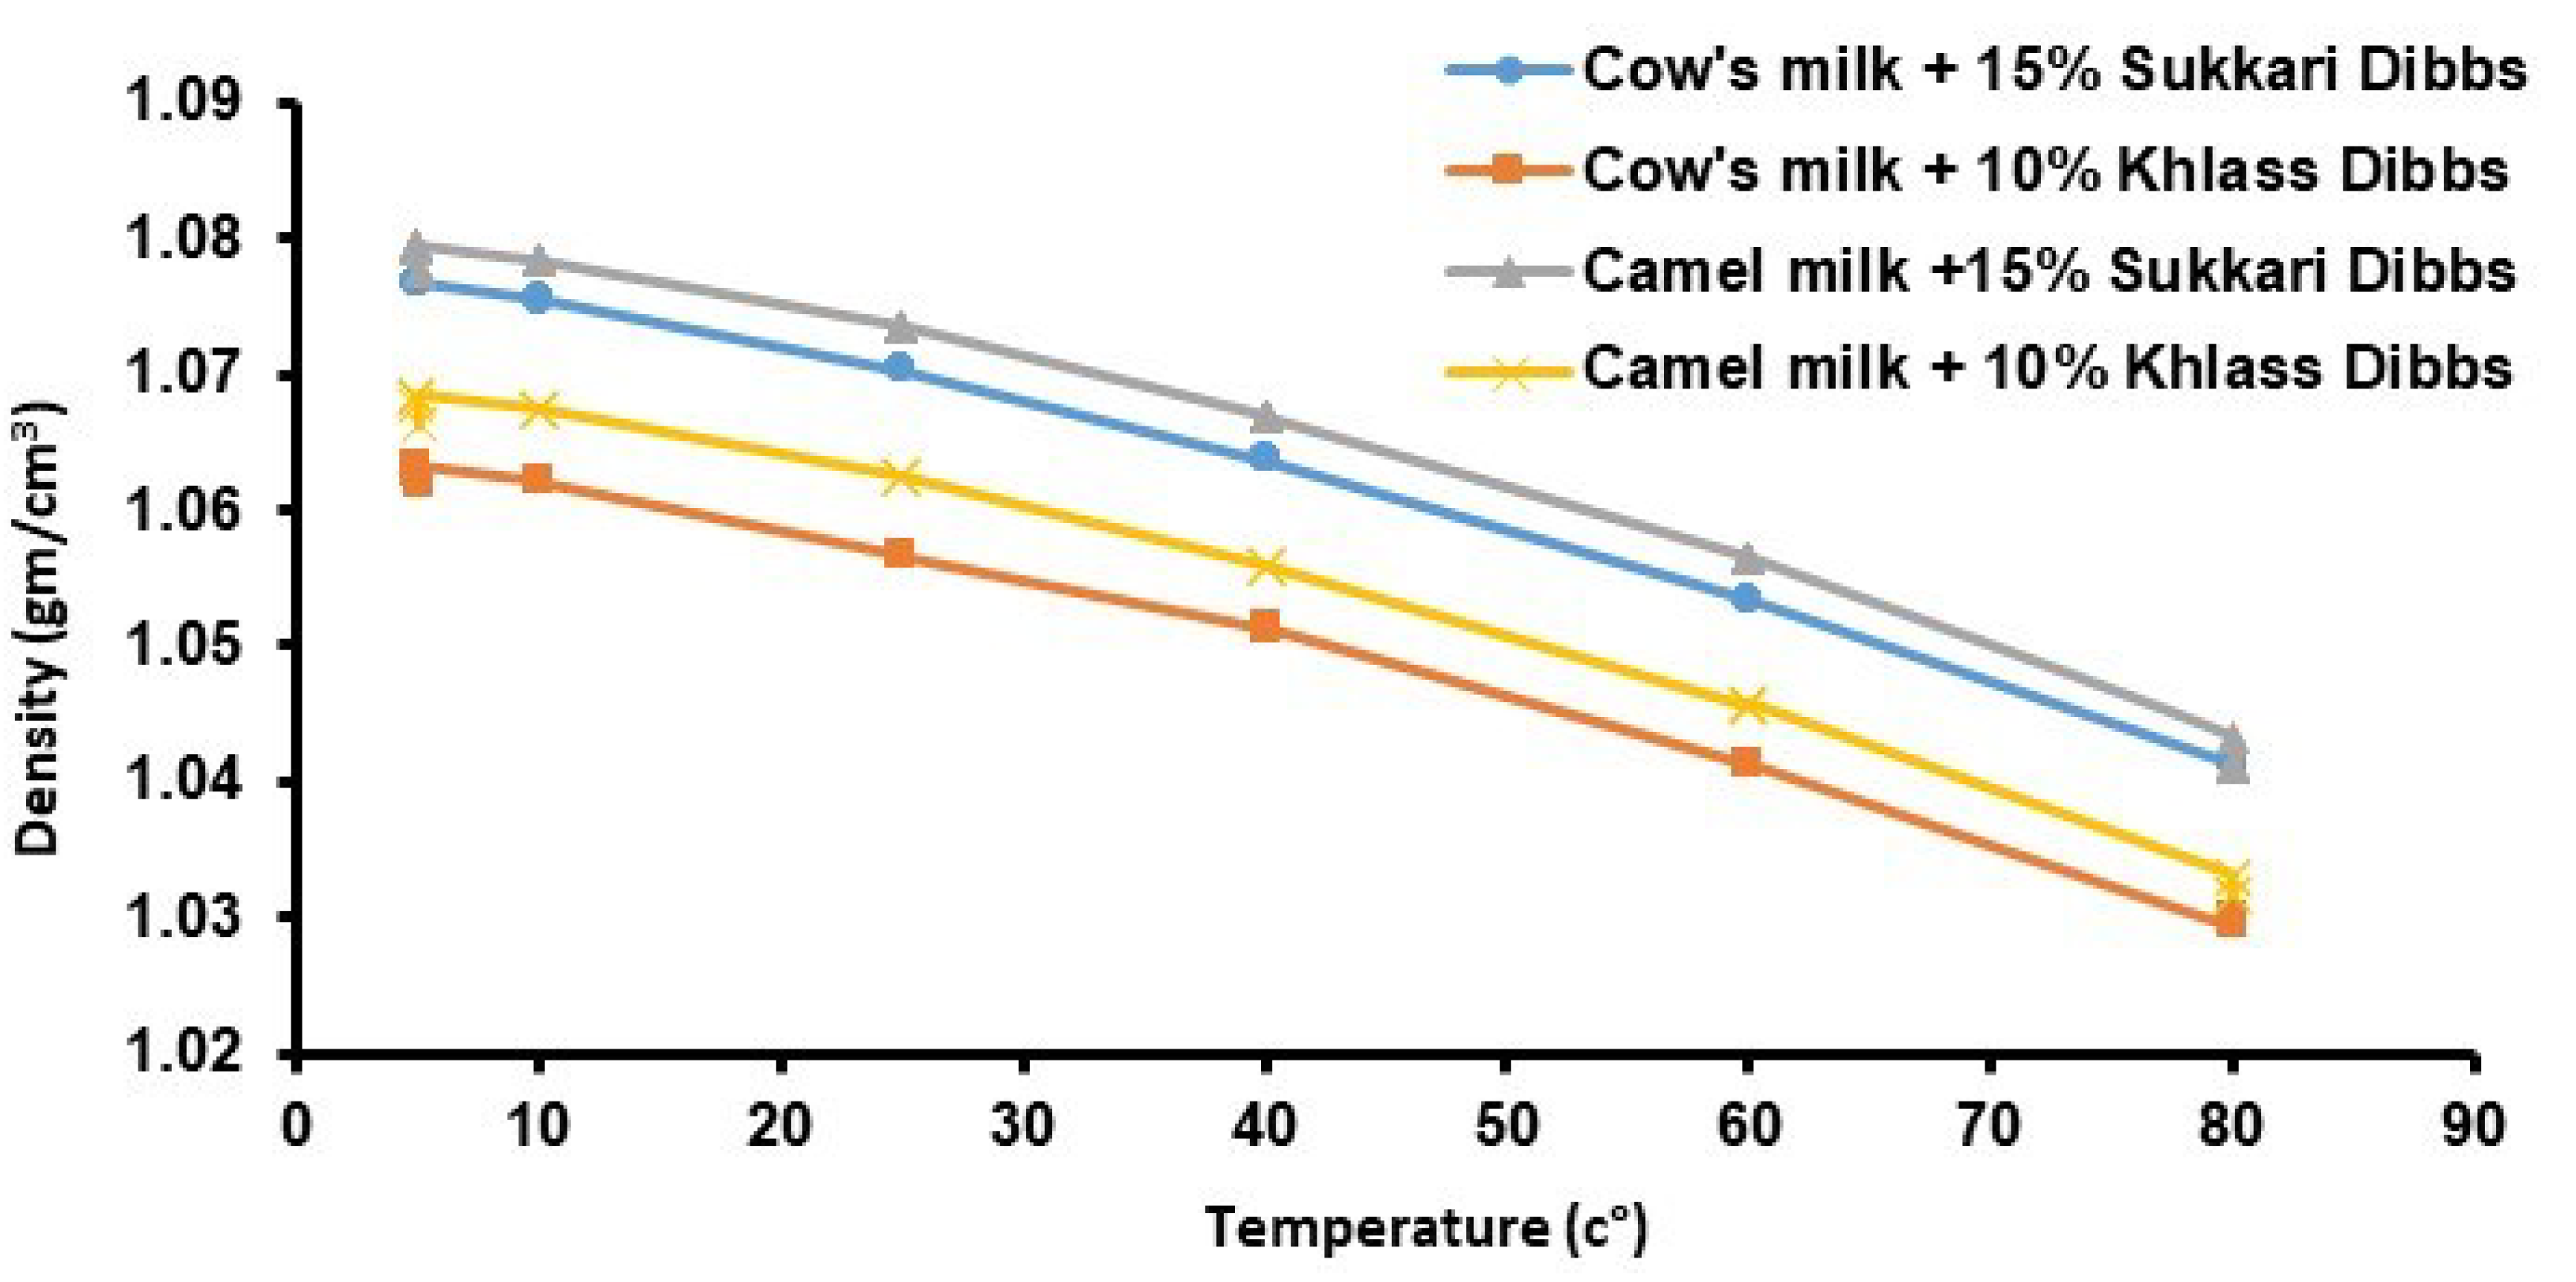
Table 4.
Linear density prediction equations and their constants and correlation coefficients for the date syrup, fresh milk, and four milk drinks valid for temperature range of 5 to 80 °C.
Table 4.
Linear density prediction equations and their constants and correlation coefficients for the date syrup, fresh milk, and four milk drinks valid for temperature range of 5 to 80 °C.
| Product type | = a T + b | R2 | |
|---|---|---|---|
| a | b | ||
| Date syrup Sukkary | -0.0005 | 1.376 | 0.992 |
| Date syrup Khlass | -0.0006 | 1.383 | 0.995 |
| Cow Milk | -0.0004 | 1.038 | 0.978 |
| Camel Milk | -0.0004 | 1.037 | 0.972 |
| Cow’s milk + Sukkary (15%) | −0.0005 | 1.081 | 0.988 |
| Cow’s milk + Khlass (10%) | −0.0004 | 1.067 | 0.985 |
| Camel milk + Sukkary (15%) | −0.0005 | 1.084 | 0.970 |
| Camel milk + Khlass (10%) | −0.0005 | 1.072 | 0.975 |
3.2. Sensory evaluation of all samples of milk drinks flavored with date syrup
The sensory evaluations of the milk drinks were conducted by sixty participants, using a nine-point structured hedonic scale for taste, flavor, texture, color, and overall acceptability. The tests were conducted for cow's and camel milk flavored with date syrup (Sukkary and Khlass cultivars) at different concentrations. Summary of the sensory evaluation results for the four milk drinks are illustrated in Figure 3.
3.3. Chemical analysis of fruits, milk, syrup, and milk drinks
The analysis data for the chemical composition of the fruit flesh of dates (Sukkary and Khlass) is shown in Table 5. Probably, the most noticeable observation in comparing dates of the two cultivars is Phosphorus content in which Sukkary is double that of Khlass. The second note is the % of sugars (7.8, 8.9, 63.4 gm/100gm dm) for Sukkary to (42.3, 54.5, 0.3) for Khlass of (Glucose, Fructose, and Sucrose) sugars; respectively.
Table 6 shows the chemical composition of the fresh milk, date syrup, and the four milk drinks. There were significant differences between the average experimental values of the chemical components of the four date syrup-flavored milk drinks. Vitamin (A) was in the range of 37.13 to 556.5 IU/100g and 10.00 IU/100g for vitamin D. Total energy varied between 78.50 to 99.00 kcal/100g. Concentrations of the most important metals ranged between 867 to 1002 ppm for calcium, 106 to 142 ppm for magnesium, 289 to 372 ppm for sodium, and 1702 to 2242 ppm for potassium.
Table 5.
Chemical composition of dates fruits (flesh) for Sukkary and Khlass cultivars (Tamr stage of maturity)*.
Table 5.
Chemical composition of dates fruits (flesh) for Sukkary and Khlass cultivars (Tamr stage of maturity)*.
| Chemical Component | Sukkary | Khlass | Method/Ref. |
|---|---|---|---|
| Moisture | 31.11±0.51c | 15.21±0.71a | AOAC 2005-925.45 |
| Units: (g/100g dm)** Crude Protein |
3.37 ±0.05c |
2.35±0.13b |
AOAC 2005-920.152 |
| Total Fat | 0.14 ±0.01a | 0.13±0.04a | AOAC 2005-989.05 |
| Crude Fiber | 4.13 ±0.23b | 3.97±0.31b | AOAC 2005-962.09 |
| Ash | 1.65 ±0.18a | 1.80±0.10a | AOAC 2005-930.30 |
| Total Carbohydrate | 90.70 ±0.36a | 92.13±0.50b | CALCULATION |
| Total Sugars | 79.83 ±1.46a | 88.27±1.95b | AOAC 2005-977.20 |
| Fructose | 7.52 ±0.16a | 42.36±0.16b | AOAC 2005-977.20 |
| Glucose | 8.90 ±0.59a | 45.55±0.93c | AOAC 2005-977.20 |
| Sucrose | 63.40 ±0.75c | 0.36±0.11a | AOAC 2005-977.20 |
| Units: (kcal/100g) | |||
| Total energy | 377.59 ±1.70a | 379.11±2.55ab | CALCULATION |
| Units: (mg/100g dm) | |||
| Calcium | 67.40 ±6.83c | 52.38±11.28ab | AOAC 2005-985.35 |
| Phosphorus | 90.91 ±13.28b | 54.15±1.40a | AOAC 2005-985.35 |
| Sodium | 9.27 ±2.71a | 12.03±4.00a | AOAC 2005-985.35 |
| Potassium | 687.21±32.69a | 682.58±55.85a | AOAC 2005-985.35 |
| Magnesium | 77.88±3.89b | 60.35±1.96a | AOAC 2005-985.35 |
| Iron | 1.35 ±0.02a | 1.27±0.03a | AOAC 2005-985.35 |
| Total soluble solids (Brix) | 76.23 ±0.55a | 88.17±0.06c | AOAC 2005-983.17 |
| pH- 10% @ | 7.70 ±0.03c | 6.31±0.15a | AOAC 2005-981.12 |
| Acidity as Citric Acid (mg/100g dm) | 0.27 ±0.09a | 0.34±0.04a | AOAC 2005-942.15 |
*The same letter in a row in same group means no significant differences at p<0.05.; **dm- dry matter.
Table 6.
Mean values of the chemical components of the fresh milk, date syrup, and the four milk/Date syrup drinks.
Table 6.
Mean values of the chemical components of the fresh milk, date syrup, and the four milk/Date syrup drinks.
| Chemical components | Fresh Milk | Date syrup | Milk Drinks | Unit | Method/Ref. | |||||
|---|---|---|---|---|---|---|---|---|---|---|
| Cow | Camel | Sukkary | Khlass | Cow milk + Sukkary15% | Cow milk +Khlass10% | Camel milk +Sukkary15% | Camel milk +Khlass10% | |||
| Total Carbohydrate | 15.6b | 15.71a | 75.76a | 75.05b | 15.95b | 12.61d | 16.09a | 12.62c | (g/100g) | Calculation |
| Total Sugar | 4.72b | 4.83a | 53.83a | 53.05b | 15.01 | 12.48 | 15.67 | 12.38 | (g/100g) | AOAC 2005-977.20 |
| Fructose | 0.000 | 0.000 | 13.08a | 26.54b | 2.6d | 3.95a | 2.66c | 3.65b | (g/100g) | AOAC 2005-977.20 |
| Glucose | 0.000 | 0.000 | 8.09b | 26.51a | 1.84d | 4.18a | 2.09c | 4.07b | (g/100g) | AOAC 2005-977.20 |
| Sucrose | 0.000 | 0.000 | 29.09a | 0.10b | 5.91a | 0.1c | 5.84b | 0.1c | (g/100g) | AOAC 2005-977.20 |
| Maltose | 0.000 | 0.000 | 3.57a | 0.10b | 1.26b | 0.45d | 1.41a | 0.54c | (g/100g) | AOAC 2005-977.20 |
| Lactose | 4.72b | 4.83a | 0.000 | 0.000 | 3.40d | 3.80 b | 3.67 c | 4.02 a | (g/100g) | AOAC 2005-977.20 |
| Proteins | 3.06b | 3.10a | 1.47a | 0.88b | 2.90c | 2.92b | 2.88d | 2.93a | (g/100g) | FOSS-AN-300 |
| Caseins | 2.45a | 2.25b | 0.10a | 0.10a | 2.15b | 2.30 a | 1.87 d | 2.03 c | (g/100g) | AOAC 2005-998.06 |
| Crude Fiber | 0.10a | 0.10a | 0.10a | 0.10a | 0.1 | 0.1 | 0.1 | 0.1 | (g/100g) | AOAC 2005-962.09 |
| Fat | 2.95a | 2.86b | 0.10a | 0.10a | 2.64b | 2.78a | 1.75d | 1.81c | (g/100g) | AOAC 2005-989.05 |
| Ash | 0.69b | 0.82a | 1.42a | 1.49a | 0.71c | 0.60d | 0.86a | 0.83b | (g/100g) | AOAC 2005-930.30 |
| Calcium | 938b | 1125a | 494a | 424b | 867d | 885c | 965b | 1002a | ppm | AOAC 2005-985.35 |
| Magnesium | 99a | 78b | 427a | 420a | 142a | 123b | 123b | 106c | ppm | AOAC 2005-985.35 |
| Sodium | 293b | 383a | 212a | 164b | 297c | 289d | 357b | 372a | ppm | AOAC 2005-985.35 |
| Potassium | 1382b | 1827a | 0.53a | 0.54a | 1967c | 1702d | 2242a | 2082b | ppm | AOAC 2005-985.35 |
| Standard acidity (Lactic acid) |
0.08a | 0.08a | 1a | 1a | 0.26a | 0.21c | 0.22b | 0.21c | (g/100g) | AOAC 2005-935.57 |
| Vitamin A | 56.8b | 70.30a | 1a | 1a | 430.44b | 556.50a | 43.17c | 37.13d | IU/100 g | HPLC-LUNN |
| Vitamin D | 45.4a | 19.44b | 10a | 10a | 10a | 10a | 10a | 10a | IU/100 g | HPLC-LUNN |
| Total energy | 58a | 58a | 309a | 304b | 99a | 87c | 91.63b | 78.50d | kcal/100g | Calculation |
*The same letter in a row means no significant differences based on the least square difference (LSD) test and a significance level at p<0.05.
3.4. Near Infrared Spectroscopy (NIR)
Mean second absorbance derivative spectra were generated for the fresh milk, date syrup, milk drinks consisting of 1200 samples within the wavelength range of 729–975 nm. Two analytical tools were utilized: Partial Least Squares Regression (PLSR) and Artificial Neural Networks (ANN).
PLSR performance of calibration and cross-validation for M.C., aw, TSS, pH, and BI, properties for milk drinks are shown in Table 7. In the calibration models, R2 and RMSEC values were 0.988 and 0.777 for M.C.; 0.984 and 0.746 for aw; 0.941 and 0.727 for TSS; 0.957 and 0.755 for pH; 0.978 and 0.743 for BI; respectively.
The performance of ANN in calibrating and cross-validating for the properties of the favorable drink (cow’s milk with 10% Khlass) is summarized in Table 8. In the calibration models, the R2 and RMSEC values were 0.989 and 0.745 for M.C.; 0.984 and 0.755 for aw; 0.946 and 0.715 for TSS; 0.955 and 0.740 for pH; 0.978 and 0.735 for BI; respectively. In the cross-validation assessments, R2 and RMSECV values were 0.989 and 0.744 for M.CD; 0.984 and 0.725 for aw; 0.946 and 0.754 for TSS; 0.955 and 0.711 for pH; 0.978 and 0.713 for BI; respectively.
Table 7.
PLSR performance for M.C., aw, TSS, pH, and BI properties for the favored milk drink (FD), and TSS, BI properties for fresh milk (FM), and date syrup Khlass (DSK) for both calibration and cross-validation models.
Table 7.
PLSR performance for M.C., aw, TSS, pH, and BI properties for the favored milk drink (FD), and TSS, BI properties for fresh milk (FM), and date syrup Khlass (DSK) for both calibration and cross-validation models.
| Parameter | Calibration | Cross-Validation | ||
| R2 | RMSRC | R2 | RMSECV | |
| M.C.FD | 0.988 | 0.777 | 0.982 | 0.788 |
| AwFD | 0.984 | 0.746 | 0.996 | 0.764 |
| TSSFD | 0.941 | 0.727 | 0.687 | 0.727 |
| pHFD | 0.957 | 0.755 | 0.955 | 0.723 |
| BIFD | 0.978 | 0.743 | 0.988 | 0.703 |
| TSSFM | 0.948 | 0.680 | 0.948 | 0.680 |
| BIFM | 0.978 | 0.762 | 0.946 | 0.643 |
| TSSDSK | 0.958 | 0.603 | 0.965 | 0.603 |
| BIDSK | 0.966 | 0.625 | 0.942 | 0.557 |
Table 8.
ANN performance for M.C., aw, TSS, pH, and BI properties for the favorable milk drink (FD), and TSS, BI properties for fresh milk (FM), and date syrup Khlass (DSK) for both calibration and cross-validation models.
Table 8.
ANN performance for M.C., aw, TSS, pH, and BI properties for the favorable milk drink (FD), and TSS, BI properties for fresh milk (FM), and date syrup Khlass (DSK) for both calibration and cross-validation models.
| Parameter | Calibration | Cross-Validation | ||
| R2 | RMSRC | R2 | RMSECV | |
| M.C.FD | 0.989 | 0.745 | 0.989 | 0.744 |
| AwFD | 0.984 | 0.755 | 0.984 | 0.725 |
| TSSFD | 0.946 | 0.715 | 0.946 | 0.754 |
| pHFD | 0.955 | 0.740 | 0.955 | 0.711 |
| BIFD | 0.978 | 0.735 | 0.978 | 0.713 |
| TSSFM | 0.948 | 0.684 | 0.948 | 0.648 |
| BIFM | 0.978 | 0.715 | 0.978 | 0.633 |
| TSSDSK | 0.959 | 0.592 | 0.959 | 0.598 |
| BIDSK | 0.966 | 0.611 | 0.966 | 0.547 |
The second derivative of NIR spectra was introduced to enhance data quality. Specifically, the mean second absorbance derivative spectra were generated for the fresh milk, date syrup Khlass, and the favorable milk drink (cow’s milk flavored with 10% Khlass) are consisting of 1200 samples within the wavelength range of 729–975 nm, as illustrated in Figure 4. It can be noted that the spectra behavior of both fresh milk and milk drink are closer compared to dates syrup apparently due to the low amount of syrup in the milk drink.
4. Discussion
4.1. Physical properties (MC, aw, TSS, color, density, pH)
It can be observed that the moisture content of Sukkary date syrup was higher than that of Khlass. This might be due to the initial moisture content of the Sukkary dates (9.5%wb) while it was (6.7%wb) for Khlass. A similar trend was observed for water activity. The average moisture content showed significant differences where the camel's milk flavored with Khlass date syrup (10%) was higher than that of the other three samples.
The water activity and pH of cow’s milk flavored with Khlass date syrup (10%) were higher than those of the other three samples. TSS was found to be higher in cow's milk flavored with Sukkary date syrup at 15%, which can be attributed to lower moisture content and higher amounts of date syrup.
From basic color parameters, derivative parameters can be obtained. The mean values of the derivative color parameters (Chroma, Hue angle, and BI) for the samples ranged from 13.383 to 15.267, −57.426 to 57.474, and 15.915 to 19.630, respectively. These data showed significant differences in the derivative color parameters of milk drinks. The differences might be attributed to the initial color of the raw dates fruit milk. BI values for the four milk drinks were higher than that of the raw milk but lower than that of date syrup (as shown in Table 2). The decrease in BI values of the four milk drinks was due to the high amount of milk present.
Density of all samples decreased with the increase of in temperature due to the expansion of sample volume. The elevated temperature leads to the weakening of the forces between molecules bonds and thus molecules of the sample expanded. Thus, the effect of temperature on density and volume should be considered in the design of pasteurization and sterilization processes of milk drinks flavored with date syrup.
4.2. Sensory evaluation of all samples of milk drinks flavored with date syrup
The results of the sensory evaluation revealed that the most favorable milk drink was cow milk flavored with Khlass date syrup (10%) followed by cow milk with Sukkary date syrup (15%). The third preference was camel milk with Sukkary date syrup (15%) and lastly, camel milk with 10% of Khlass date syrup. Details results of the sensory evaluation can be found in [41,42]. They showed that the most flavored milk drink was chosen from sixteen milk drinks (mix of 5 to 20%). The favorable drink was cow’s milk flavored with 10% Khlass as indicated by its taste, flavor, texture, color, and overall acceptability (7.200, 7.333, 7.467, 7.267, and 7.200, respectively) [42]. There is a need for further sensory investigation to include students from different grades, and additional sectors of the society (probably based on age, gender, location, and education). Furthermore, it is recommended to evaluate such milk drinks with sensory evaluation along the shelf-life of the pastoralized and sterilized milk drinks.
4.3. Chemical analysis of the milk drink with date syrup
The most pronounced differences of milk drinks were in total carbohydrates, fructose, glucose, sucrose, maltose, casein, fat, ash, and total energy. These differences are due to the chemical components of both date cultivar and milk type. Milk with Sukkary date syrup at a relatively higher concentration (15%) increased total carbohydrate, sucrose, maltose, and total energy compared with that of milk with Khlass date syrup at 10%. Mean values of the chemical components in the four milk drinks varied in the range of 12.61–16.09 gm/100g for total carbohydrates, 2.60–3.95 gm/100g for fructose, 1.84–4.18 gm/100g for glucose, 0.10–5.91 gm/100g for sucrose, 0.45–1.41 gm/100g for maltose, 3.40–4.02 gm/100g for lactose, 2.88–2.93 gm/100g for proteins, 1.87–2.30 gm/100g for Casein, 1.75–2.78 gm/100g for fat, 0.60–0.86 gm/100g for ash, and 0.21–0.26 gm/100g for standard acidity (lactic acid). These variations of milk drinks composition and sensory evaluation must be considered in marketing, nutritional values, and total cost for each selected milk drink.
4.4. Evaluating physical properties utilizing NIR technique
Recently, near-infrared spectroscopy (NIR) has gained more attention with the advancement and high speed computers. It has more wide applications in identifying food properties. One valuable technique for eliminating extraneous signals from the spectra involves the application of derivatives of NIR spectroscopy [59,60].
Several methods of pre-processing can be implemented prior to modeling [11,61]. After the completion of NIR experiments, two analytical tools can be utilized: PLSR and ANN.
In this study, PLSR revealed that R2 and RMSECV values were 0.982 and 0.788 for M.C.; 0.996 and 0.764 for aw; 0.687 and 0.727 for TSS; 0.955 and 0.723 for pH; 0.988 and 0.703 for BI; respectively. For ANN, the correlation coefficient (R2) values fell within the range of 0.942 to 0.996, indicating a very good model performance. This range signifies an excellent model quality in which R2 values exceeding 0.70 are generally deemed satisfactory in NIR modeling [62,63,64]. These findings underscore the effectiveness of the PLSR and ANN techniques as a robust statistical tool for accurately predicting both the objective properties and subjective evaluation of foods, here, milk drinks.
These results affirm the excellence of the ANN technique in predicting the properties of the milk drinks. It is evident that the correlation coefficients in the ANN model surpass those of PLSR. RMSEC serves as a measure indicating how well the calibration model aligns with the calibration set, typically decreasing as the number of factors increases. However, RMSECV, which represents the root mean square error in cross-validation may occasionally rise with the addition of more factors. RMSECV is considered a more reliable indicator of a model's future predictive performance compared to RMSEC [65]. Thus, both analytical techniques, PLSR and ANN, have demonstrated their effectiveness in modeling NIR data during the calibration and cross-validation phases in this study. Furthermore, the ANN model is preferred for the present data over PLSR due to the higher correlation coefficients. Therefore, these analyses validate the strong alignment between NIR and the properties of the preferred milk drink.
In practical applications, a non-destructive handheld NIR spectrophotometry meter can be successfully employed by food producers, processors, and regulatory authorities throughout the entire production, processing, transportation, storage, and retail chain to assess product quality. This technology holds the potential to serve as a foundational framework for further research and commercial applications.
5. Conclusion
Dates syrup was produced successfully on a lab scale level that can be utilized as a sweetener and a high nutritional value. The obtained date syrup (Sukkary and Khlass cultivars) was then added to cow's and camel's milk at different ratios (5, 10, 15, and 20%) constituting a combination of sixteen drinks (1200 samples) of milk flavored with date syrup. From the sixteen drinks, four mixes were selected based on sensory evaluation.
The study initially delved into the analysis of the physical and chemical composition of the four preferred milk drinks, which were all flavored with date syrup. These milk drinks exhibited noteworthy disparities in their chemical constituents, encompassing total carbohydrates, fructose, glucose, sucrose, maltose, casein, fat, ash, and total energy. Sensory evaluation discerned that the milk drink, combining cow's milk with 10% Khlass date syrup, outperformed the other variants.
The resulting date syrup-flavored milk drinks represent a natural and highly nutritious sweet product, highlighting the potential to establish a new market that leverages locally sourced date and milk products. It is an aspiration that the findings of this study will foster the production of distinctive, natural, and nutritionally rich products on an industrial scale.
The application of near-infrared spectroscopy (NIR) facilitated the correlation between reflectance/absorbance and the physiochemical attributes of food products. Notably, NIR enables the direct measurement and tracking of both sensory and objective assessments through NIR analysis, employing both partial least-square regression (PLSR) and artificial neural network (ANN) approaches.
NIR proved effective in accurately predicting physiochemical properties and aligning well with measured sample attributes (moisture content, water activity, total soluble solids, pH, Browning index properties). The coefficient of determination (R2) ranged from 0.987 to 0.996, underlining the competence of NIR technology in estimating the physiochemical properties of the favorable milk drink with date syrup. These predictions were affirmed in both the calibration and cross-validation phases.
Consequently, non-destructive NIR spectrophotometry stands as a robust tool for forecasting physiochemical properties and holds significant potential for practical implementation across the entire food production, processing, transportation, storage, and retail chain. This utilization can be instrumental in monitoring product 'quality' and 'shelf life,' aligning with the standards set forth by relevant authorities, such as SFDA.FD 150-1/2018 [66].
Funding
Funding this research from project #IFKSURC-1-5618.
Institutional Review Board Statement
Not applicable.
Informed Consent Statement
Not applicable.
Data Availability Statement
The datasets generated for this study are available on request to the author.
Acknowledgments
The authors extend their appreciation to the Deputyship for Research & Innovation, Ministry of Education in Saudi Arabia for funding this research # (IFKSURC-1-5618).
Conflicts of Interest
The author declares no conflict of interest.
References
- Al-Qarawi, A.A.; Ali, B.H.; Al-Mougy, S.A.; Mousa, H.M. Gastrointestinal Transit in Mice Treated with Various Extracts of Date (Phoenix Dactylifera L.). Food and Chemical Toxicology 2003, 41, 37–39. [Google Scholar] [CrossRef] [PubMed]
- Al-Shahib, W.; Marshall, R.J. The Fruit of the Date Palm: Its Possible Use as the Best Food for the Future? International Journal of Food Sciences and Nutrition 2003, 54, 247–259. [Google Scholar] [CrossRef] [PubMed]
- Baliga, M.S.; Baliga, B.R.V.; Kandathil, S.M.; Bhat, H.P.; Vayalil, P.K. A Review of the Chemistry and Pharmacology of the Date Fruits (Phoenix Dactylifera L.). Food Research International 2011, 44, 1812–1822. [Google Scholar] [CrossRef]
- FAOSTAT. Food and Agriculture Organization 2016.
- Ministry of Environment Water and Agriculture Annual Agricultural Statistical Yearbook. Department of Planning and Statistics, Ministry of Environment, Water and Agriculture. 2014, 27.
- AOAD (Arab Organization for Agricultural Development) Arab Agricultural Statistics Yearbook. Arab Agricultural Statistics Yearbook 2016, 36.
- Azzeh, F.S. Camel Milk as Functional Food: Review Paper. Arab Journal of Food and Nutrition 2012, 29, 94–111. [Google Scholar]
- Hassan, B.H. Production of Dibbs and High Fructose Sugar of Dates on an Industrial Scale. In Engineering Applications in the Manufacturing Dates; King Saud University: Riyadh, 2008; pp. 109–131. [Google Scholar]
- Ratcliffe, M.; Panozzo, J.F. The Application of Near Infrared Spectroscopy to Evaluate Malting Quality. Journal of the Institute of Brewing 1999, 105, 85–88. [Google Scholar] [CrossRef]
- Alhamdan, A.M.; Atia, A. Non-Destructive Method to Predict Barhi Dates Quality at Different Stages of Maturity Utilising near-Infrared (NIR) Spectroscopy. International Journal of Food Properties 2017, 20, S2950–S2959. [Google Scholar] [CrossRef]
- Nørgaard, L.; Lagerholm, M.; Westerhaus, M. Artificial Neural Networks and Near Infrared Spectroscopy-A Case Study on Protein Content in Whole Wheat Grain Dedicated Analytical Solutions A White Paper from FOSS Artificial Neural Networks and Near Infrared Spectroscopy-A Case Study on Protein Content in Whole Wheat Grain. 2013. [Google Scholar]
- Hernández-Jiménez, M.; Hernández-Ramos, P.; Martínez-Martín, I.; Vivar-Quintana, A.M.; González-Martín, I.; Revilla, I. Comparison of Artificial Neural Networks and Multiple Regression Tools Applied to near Infrared Spectroscopy for Predicting Sensory Properties of Products from Quality Labels. Microchemical Journal 2020, 159, 105459. [Google Scholar] [CrossRef]
- Walsh, K.B.; McGlone, V.A.; Han, D.H. The Uses of near Infra-Red Spectroscopy in Postharvest Decision Support: A Review. Postharvest Biology and Technology 2020, 163. [Google Scholar] [CrossRef]
- Walsh, K.B.; Blasco, J.; Zude-Sasse, M.; Sun, X. Visible-NIR ‘Point’ Spectroscopy in Postharvest Fruit and Vegetable Assessment: The Science behind Three Decades of Commercial Use. Postharvest Biology and Technology 2020, 168, 111246. [Google Scholar] [CrossRef]
- Mancini, M.; Mazzoni, L.; Gagliardi, F.; Balducci, F.; Duca, D.; Toscano, G.; Mezzetti, B.; Capocasa, F. Application of the Non-Destructive NIR Technique for the Evaluation of Strawberry Fruits Quality Parameters. Foods 2020, Vol. 9, Page 441 2020, 9, 441. [Google Scholar] [CrossRef] [PubMed]
- Sun, X.; Subedi, P.; Walker, R.; Walsh, K.B. NIRS Prediction of Dry Matter Content of Single Olive Fruit with Consideration of Variable Sorting for Normalisation Pre-Treatment. Postharvest Biology and Technology 2020, 163, 111140. [Google Scholar] [CrossRef]
- Cayuela, J.A.; Camino, M. del C.P. Prediction of Quality of Intact Olives by near Infrared Spectroscopy. European Journal of Lipid Science and Technology 2010, 112, 1209–1217. [Google Scholar] [CrossRef]
- Parpinello, G.P.; Nunziatini, G.; Rombolà, A.D.; Gottardi, F.; Versari, A. Relationship between Sensory and NIR Spectroscopy in Consumer Preference of Table Grape (Cv Italia). Postharvest Biology and Technology 2013, 83, 47–53. [Google Scholar] [CrossRef]
- Inarejos-García, A.M.; Gómez-Alonso, S.; Fregapane, G.; Salvador, M.D. Evaluation of Minor Components, Sensory Characteristics and Quality of Virgin Olive Oil by near Infrared (NIR) Spectroscopy. Food Research International 2013, 50, 250–258. [Google Scholar] [CrossRef]
- Liu, R.; Solah, V.A.; Wei, Y.; Wu, G.; Wang, X.; Crosbie, G.; Fenton, H. Sensory Evaluation of Chinese White Salted Noodles and Steamed Bread Made with Australian and Chinese Wheat Flour. Cereal Chemistry 2019, 96, 66–75. [Google Scholar] [CrossRef]
- Alhamdan, A.M.; Fickak, A.; Atia, A.R. Evaluation of Sensory and Texture Profile Analysis Properties of Stored Khalal Barhi Dates Nondestructively Using Vis/NIR Spectroscopy. Journal of Food Process Engineering 2019, 42, e13215. [Google Scholar] [CrossRef]
- Lauteri, C.; Ferri, G.; Pennisi, L. A Quality Index Method-Based Evaluation of Sensory Quality of Red Mullet (Mullus Barbatus) and Its Shelf-Life Determination. Ital J Food Safety 2023, 12. [Google Scholar] [CrossRef]
- Genç, I.Y.; Diler, A. Development of Shelf Life Prediction Model in Rainbow Trout Stored at Different Temperatures. Journal of Aquatic Food Product Technology 2019, 28, 1027–1036. [Google Scholar] [CrossRef]
- Amaral, G.V.D.; Freitas, D.D.G.C. Método do índice de qualidade na determinação do frescor de peixes. Cienc. Rural 2013, 43, 2093–2100. [Google Scholar] [CrossRef]
- Ólafsdóttir, A. DEVELOPMENT OF A QUALITY INDEX METHOD (QIM) SCHEME FOR FARMED SENEGALESE SOLE (Solea Senegalensis) AND ITS APPLICATION IN A SHELF LIFE STUDY.
- Hyldig, G.; Bremner, A.; Martinsdóttir, E.; Schelvis, R. Quality Index Methods. In Handbook of Meat, Poultry and Seafood Quality; Nollet, L.M.L., Ed.; Wiley, 2007; pp. 529–548. ISBN 978-0-8138-2446-8. [Google Scholar]
- Aparecida Barros De Oliveira, H.; Viana Abranches, M.; Mattos Della Lucia, C.; Pinheiro Sant’Ana, H.M. DEVELOPMENT AND APPLICATION OF A METHOD FOR QUALITY ASSESMENT OF PERISHABLE FOOD SUPPLIERS FROM A FOOD SERVICE. Rev. chil. nutr. 2011, 38, 331–341. [Google Scholar] [CrossRef]
- Du, J.; Zhang, M.; Zhang, L.; Law, C.L.; Liu, K. Shelf-Life Prediction and Critical Value of Quality Index of Sichuan Sauerkraut Based on Kinetic Model and Principal Component Analysis. Foods 2022, 11, 1762. [Google Scholar] [CrossRef] [PubMed]
- Joshy, C.G.; Ninan, G.; Panda, S.K.; Zynudheen, A.A.; Kumar, K.A.; Ravishankar, C.N. Development of Demerit Score-Based Fish Quality Index (FQI) for Fresh Fish and Shelf Life Prediction Using Statistical Models. Journal of Aquatic Food Product Technology 2020, 29, 55–64. [Google Scholar] [CrossRef]
- Sveinsdottir, K.; Hyldig, G.; Martinsdottir, E.; Jørgensen, B.; Kristbergsson, K. Quality Index Method (QIM) Scheme Developed for Farmed Atlantic Salmon (Salmo Salar). Food Quality and Preference 2003, 14, 237–245. [Google Scholar] [CrossRef]
- Bernardi, D.C.; Mársico, E.T.; Freitas, M.Q.D. Quality Index Method (QIM) to Assess the Freshness and Shelf Life of Fish. Braz. arch. biol. technol. 2013, 56, 587–598. [Google Scholar] [CrossRef]
- Sant’Ana, L.S.; Soares, S.; Vaz-Pires, P. Development of a Quality Index Method (QIM) Sensory Scheme and Study of Shelf-Life of Ice-Stored Blackspot Seabream (Pagellus Bogaraveo). LWT - Food Science and Technology 2011, 44, 2253–2259. [Google Scholar] [CrossRef]
- Diler, A.; Genç, İ.Y. A Practical Quality Index Method (QIM) Developed for Aquacultured Rainbow Trout (Oncorhynchus Mykiss ). International Journal of Food Properties 2018, 21, 858–867. [Google Scholar] [CrossRef]
- Tian, Z.; Tan, Z.; Li, Y.; Yang, Z. Rapid Monitoring of Flavonoid Content in Sweet Tea (Lithocarpus Litseifolius (Hance) Chun) Leaves Using NIR Spectroscopy. Plant Methods 2022, 18, 1–9. [Google Scholar] [CrossRef]
- Zhang, S.; Zuo, Y.; Wu, Q.; Wang, J.; Ban, L.; Yang, H.; Bai, Z. Development and Validation of Near-Infrared Methods for the Quantitation of Caffeine, Epigallocatechin-3-Gallate, and Moisture in Green Tea Production. Journal of Analytical Methods in Chemistry 2021, 2021. [Google Scholar] [CrossRef] [PubMed]
- Pandiselvam, R.; Kaavya, R.; Monteagudo, S.I.M.; Divya, V.; Jain, S.; Khanashyam, A.C.; Kothakota, A.; Prasath, V.A.; Ramesh, S.V.; Sruthi, N.U.; et al. Contemporary Developments and Emerging Trends in the Application of Spectroscopy Techniques: A Particular Reference to Coconut (Cocos Nucifera L.). Molecules 2022, Vol. 27, Page 3250 2022, 27, 3250. [Google Scholar] [CrossRef] [PubMed]
- da Silva Araújo, C.; Vimercati, W.C.; Macedo, L.L.; Ferreira, A.; Prezotti, L.C.; Teixeira, L.J.Q.; Saraiva, S.H. Predicting the Electric Conductivity and Potassium Leaching of Coffee by NIR Spectroscopy Technique. Food Analytical Methods 2020, 13, 2312–2320. [Google Scholar] [CrossRef]
- Mauricio Cano Reinoso, D.; Wayan Budiastra, I.; Suro Mardjan, S.; Cano-Reinoso, D.M.; Purwanto, Y.A.; Budiastra, I.W.; Kuroki, S.; Widodo, S.; Kamanga, B.M. Determination of α-Guaiene and Azulene Chemical Content in Patchouli Aromatic Oil (Pogostemon Cablin Benth.) from Indonesia by Near-Infrared Spectroscopy; 2021; Volume 12, pp. 256–262. [Google Scholar] [CrossRef]
- Ghanei Ghooshkhaneh, N.; Golzarian, M.R.; Mamarabadi, M. Withdrawn: Spectral Pattern Study of Citrus Black Rot Caused by Alternaria Alternata and Selecting Optimal Wavelengths for Decay Detection. Food Science & Nutrition 2022, 10, 1694–1706. [Google Scholar] [CrossRef]
- Barreveld, W.H. Date Palm Products; Food and Agriculture Organization of the United Nations, 1993; ISBN 92-5-103251-3. [Google Scholar]
- Elamshity, M.G.K. Development of a Nutritional Drink from Cow’s and Camel’s Milk with Date Syrup. MS thesis, King Saud University, Riyadh, 2014. [Google Scholar]
- Elamshity, M.G.; Alhamdan, A.M. Developing a Preference Map for Assessing Cow’s and Camel’s Milk Enriched with Date Syrup. Under publication. Foods 2023, 275779. [Google Scholar]
- Dalim M Khaskheli M, B.M.H.S.A.H.; GB, K. Production and Comparison of Banana and Chikoo Flavored Milk-Based Beverages. Pakistan Journal of Nutrition 2012, 11, 600–604. [Google Scholar] [CrossRef]
- Official Methods of AnalysisTM, 21st Edition (2019) - AOAC INTERNATIONAL. Available online: https://www.aoac.org/official-methods-of-analysis-21st-edition-2019/ (accessed on 18 January 2023).
- Maskan, M. Kinetics of Colour Change of Kiwifruits during Hot Air and Microwave Drying. Journal of Food Engineering 2001, 48, 169–175. [Google Scholar] [CrossRef]
- Fairchild, M.D. Color Appearance Models. 2013, 474. [Google Scholar]
- Kalloniatis, M.; Luu, C. The Perception of Color; 1995. [Google Scholar]
- Larmond, Elizabeth. Laboratory Methods for Sensory Evaluation of Food. Agriculture Canada, Research Branch, 1977; ISBN 0-662-01271-2. [Google Scholar]
- Meilgaard, M.; Civille, G.V.C.B.T. Sensory Evaluation Techniques, Fourth Edition - Morten C. Meilgaard, B. Thomas Carr, Gail Vance Civille - Google Books, 4th ed.CRC press, Inc., 2007. [Google Scholar]
- Lawless, H.T.; Heymann, H. Sensory Evaluation of Food. 2010. [Google Scholar] [CrossRef]
- Daroub, H.; Olabi, A.; Toufeili, I. Designing and Testing of an Arabic Version of the Hedonic Scale for Use in Acceptability Tests. Food Quality and Preference 2010, 21, 33–43. [Google Scholar] [CrossRef]
- Nicolas, L.; Marquilly, C.; O’Mahony, M. The 9-Point Hedonic Scale: Are Words and Numbers Compatible? Food Quality and Preference 2010, 21, 1008–1015. [Google Scholar] [CrossRef]
- Lim, J. Hedonic Scaling: A Review of Methods and Theory. Food Quality and Preference 2011, 22, 733–747. [Google Scholar] [CrossRef]
- Silva, A.N. da; Silva, R. de C. dos S.N. da; Ferreira, M.A.M.; Minim, V.P.R.; Costa, T. de M.T. da; Perez, R. Performance of Hedonic Scales in Sensory Acceptability of Strawberry Yogurt. Food Quality and Preference 2013, 30, 9–21. [Google Scholar] [CrossRef]
- Nordey, T.; Joas, J.; Davrieux, F.; Chillet, M.; Léchaudel, M. Robust NIRS Models for Non-Destructive Prediction of Mango Internal Quality. Scientia Horticulturae 2017, 216, 51–57. [Google Scholar] [CrossRef]
- Kusumiyati; Munawar, A.A.; Suhandy, D.; Kusumiyati; Munawar, A.A.; Suhandy, D. Fast, Simultaneous and Contactless Assessment of Intact Mango Fruit by Means of near Infrared Spectroscopy. AIMS Agriculture and Food 2021 1:172 2021, 6, 172–184. [Google Scholar] [CrossRef]
- Silalahi, D.D.; Reaño, C.E.; Lansigan, F.P.; Panopio, R.G.; Bantayan, N.C. Using Genetic Algorithm Neural Network on Near Infrared Spectral Data for Ripeness Grading of Oil Palm (Elaeis Guineensis Jacq.) Fresh Fruit. Information Processing in Agriculture 2016, 3, 252–261. [Google Scholar] [CrossRef]
- SAS Help Center: January 2023 (SAS 9.4, Rev. 940_23w05). Available online: https://documentation.sas.com/doc/en/pgmsascdc/9.4_3.5/whatsnew/p0yboy27v7icphn164oaw57agk1l.htm (accessed on 5 November 2023).
- Whitbeck, M.R. Second Derivative Infrared Spectroscopy. Appl Spectrosc 1981, 35, 93–95. [Google Scholar] [CrossRef]
- Basile, T.; Marsico, A.D.; Perniola, R. Use of Artificial Neural Networks and NIR Spectroscopy for Non-Destructive Grape Texture Prediction. Foods 2022, 11, 281. [Google Scholar] [CrossRef]
- Spectroscopy, U.-V.; Owen, A.J. Uses of Derivative Spectroscopy Application Note Agilent Technologies Innovating the HP Way. 1995. [Google Scholar]
- Bakeev, K.A. Process Analytical Technology: Spectroscopic Tools and Implementation Strategies for the Chemical and Pharmaceutical Industries: Second Edition. 2010. [Google Scholar] [CrossRef]
- Bhargava, R.; Levin, I.W. Spectrochemical Analysis Using Infrared Multichannel Detectors. Spectrochemical Analysis Using Infrared Multichannel Detectors 2007, 1–308. [Google Scholar] [CrossRef]
- Irudayaraj, J.; Reh, Christoph. Nondestructive Testing of Food Quality; Blackwell Pub./IFT Press, 2008; ISBN 978-0-8138-2885-5. [Google Scholar]
- Burns, D.A.; Ciurczak, E.W. Handbook of Near-Infrared Analysis, Third Edition. 2008. [Google Scholar]
- SFDA Standard SFDA Standard. Riyadh, Saudi Arabia 2018, pp. 8–8.
Figure 3.
Sensory preference of the taste, flavor, texture, color, and overall acceptability for the four milk drinks.
Figure 3.
Sensory preference of the taste, flavor, texture, color, and overall acceptability for the four milk drinks.
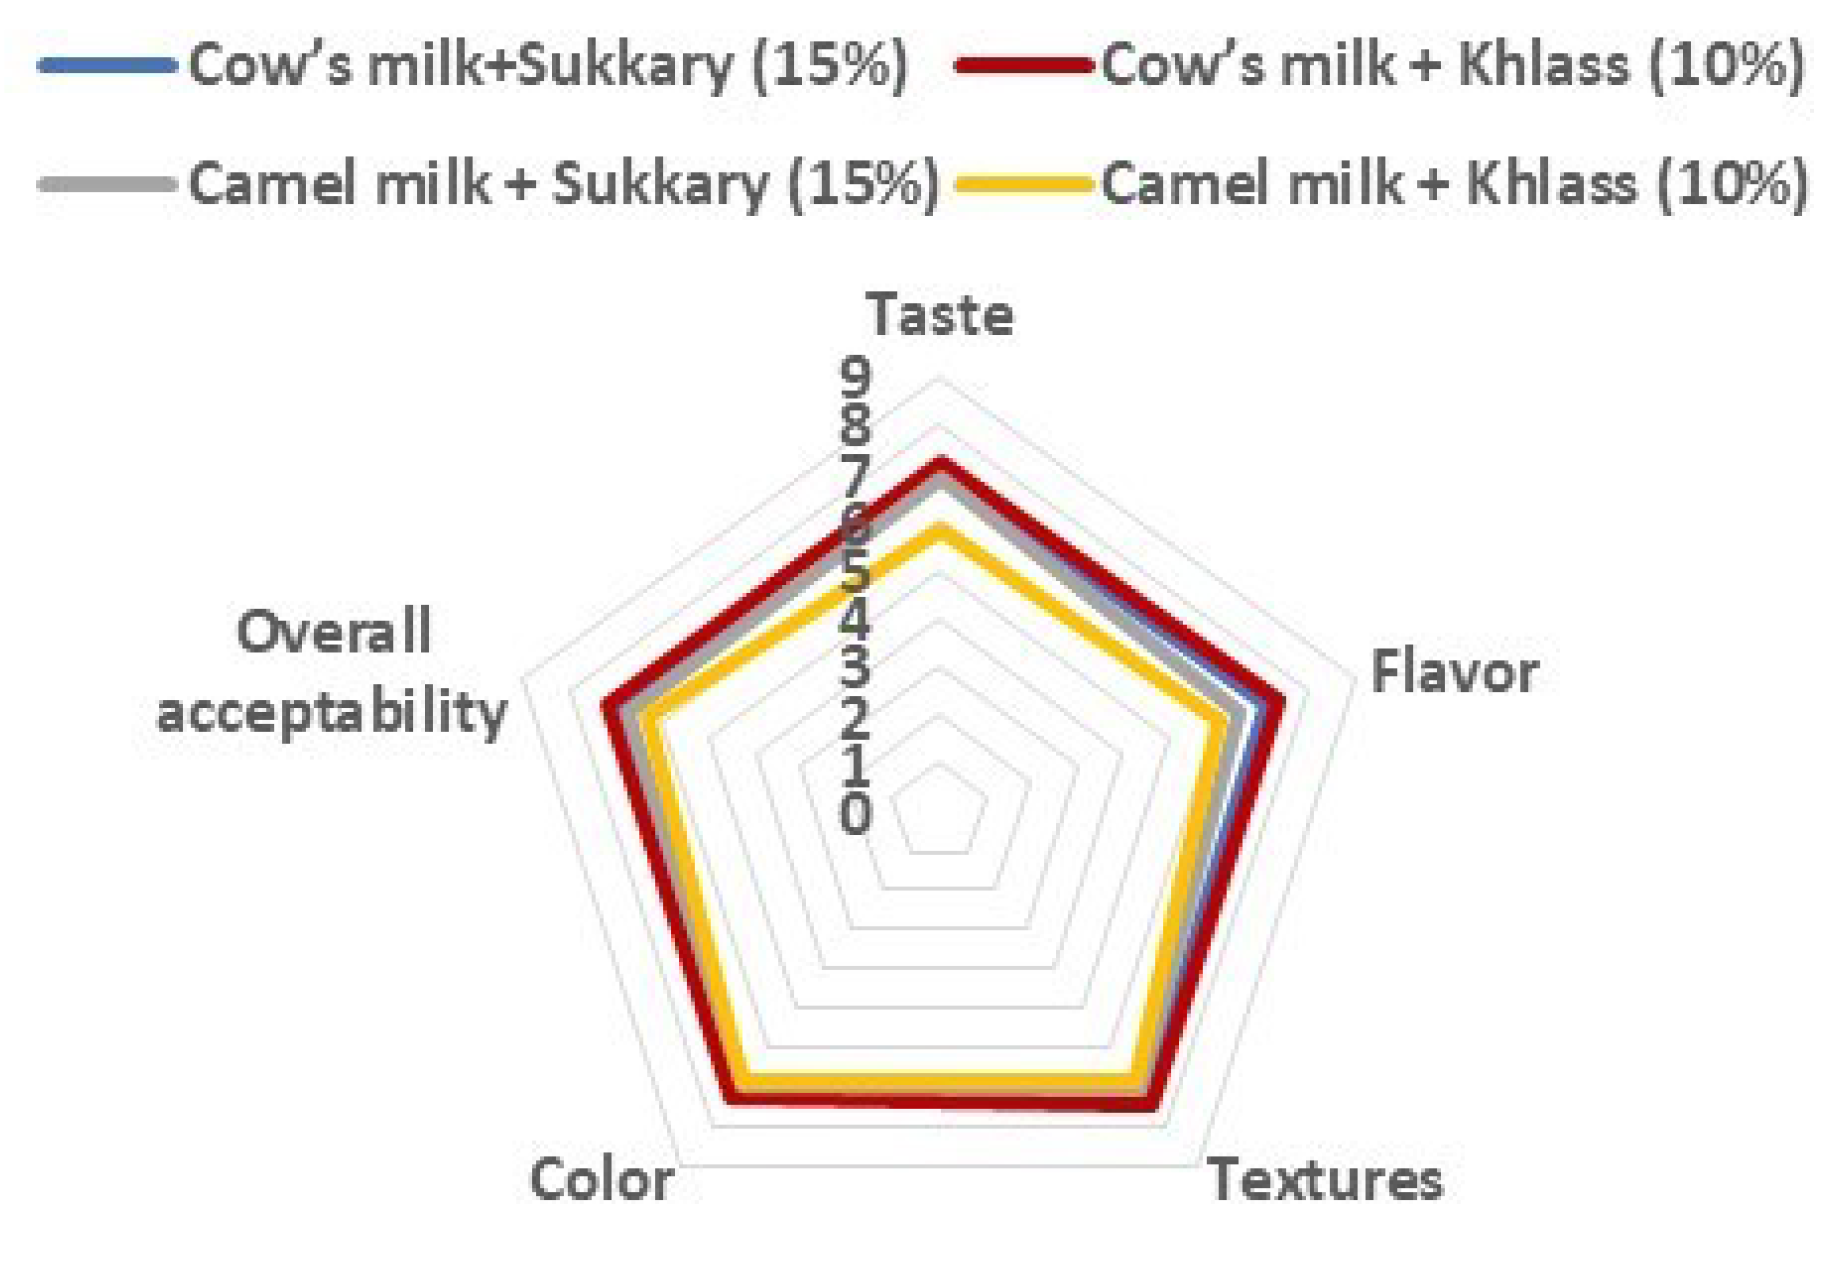
Figure 4.
The average second derivative of absorbance within the wavelength range of (729–975 nm) for the fresh milk, date syrup Khlass, and the favorable milk drink (cow’s milk with 10% Khlass).
Figure 4.
The average second derivative of absorbance within the wavelength range of (729–975 nm) for the fresh milk, date syrup Khlass, and the favorable milk drink (cow’s milk with 10% Khlass).
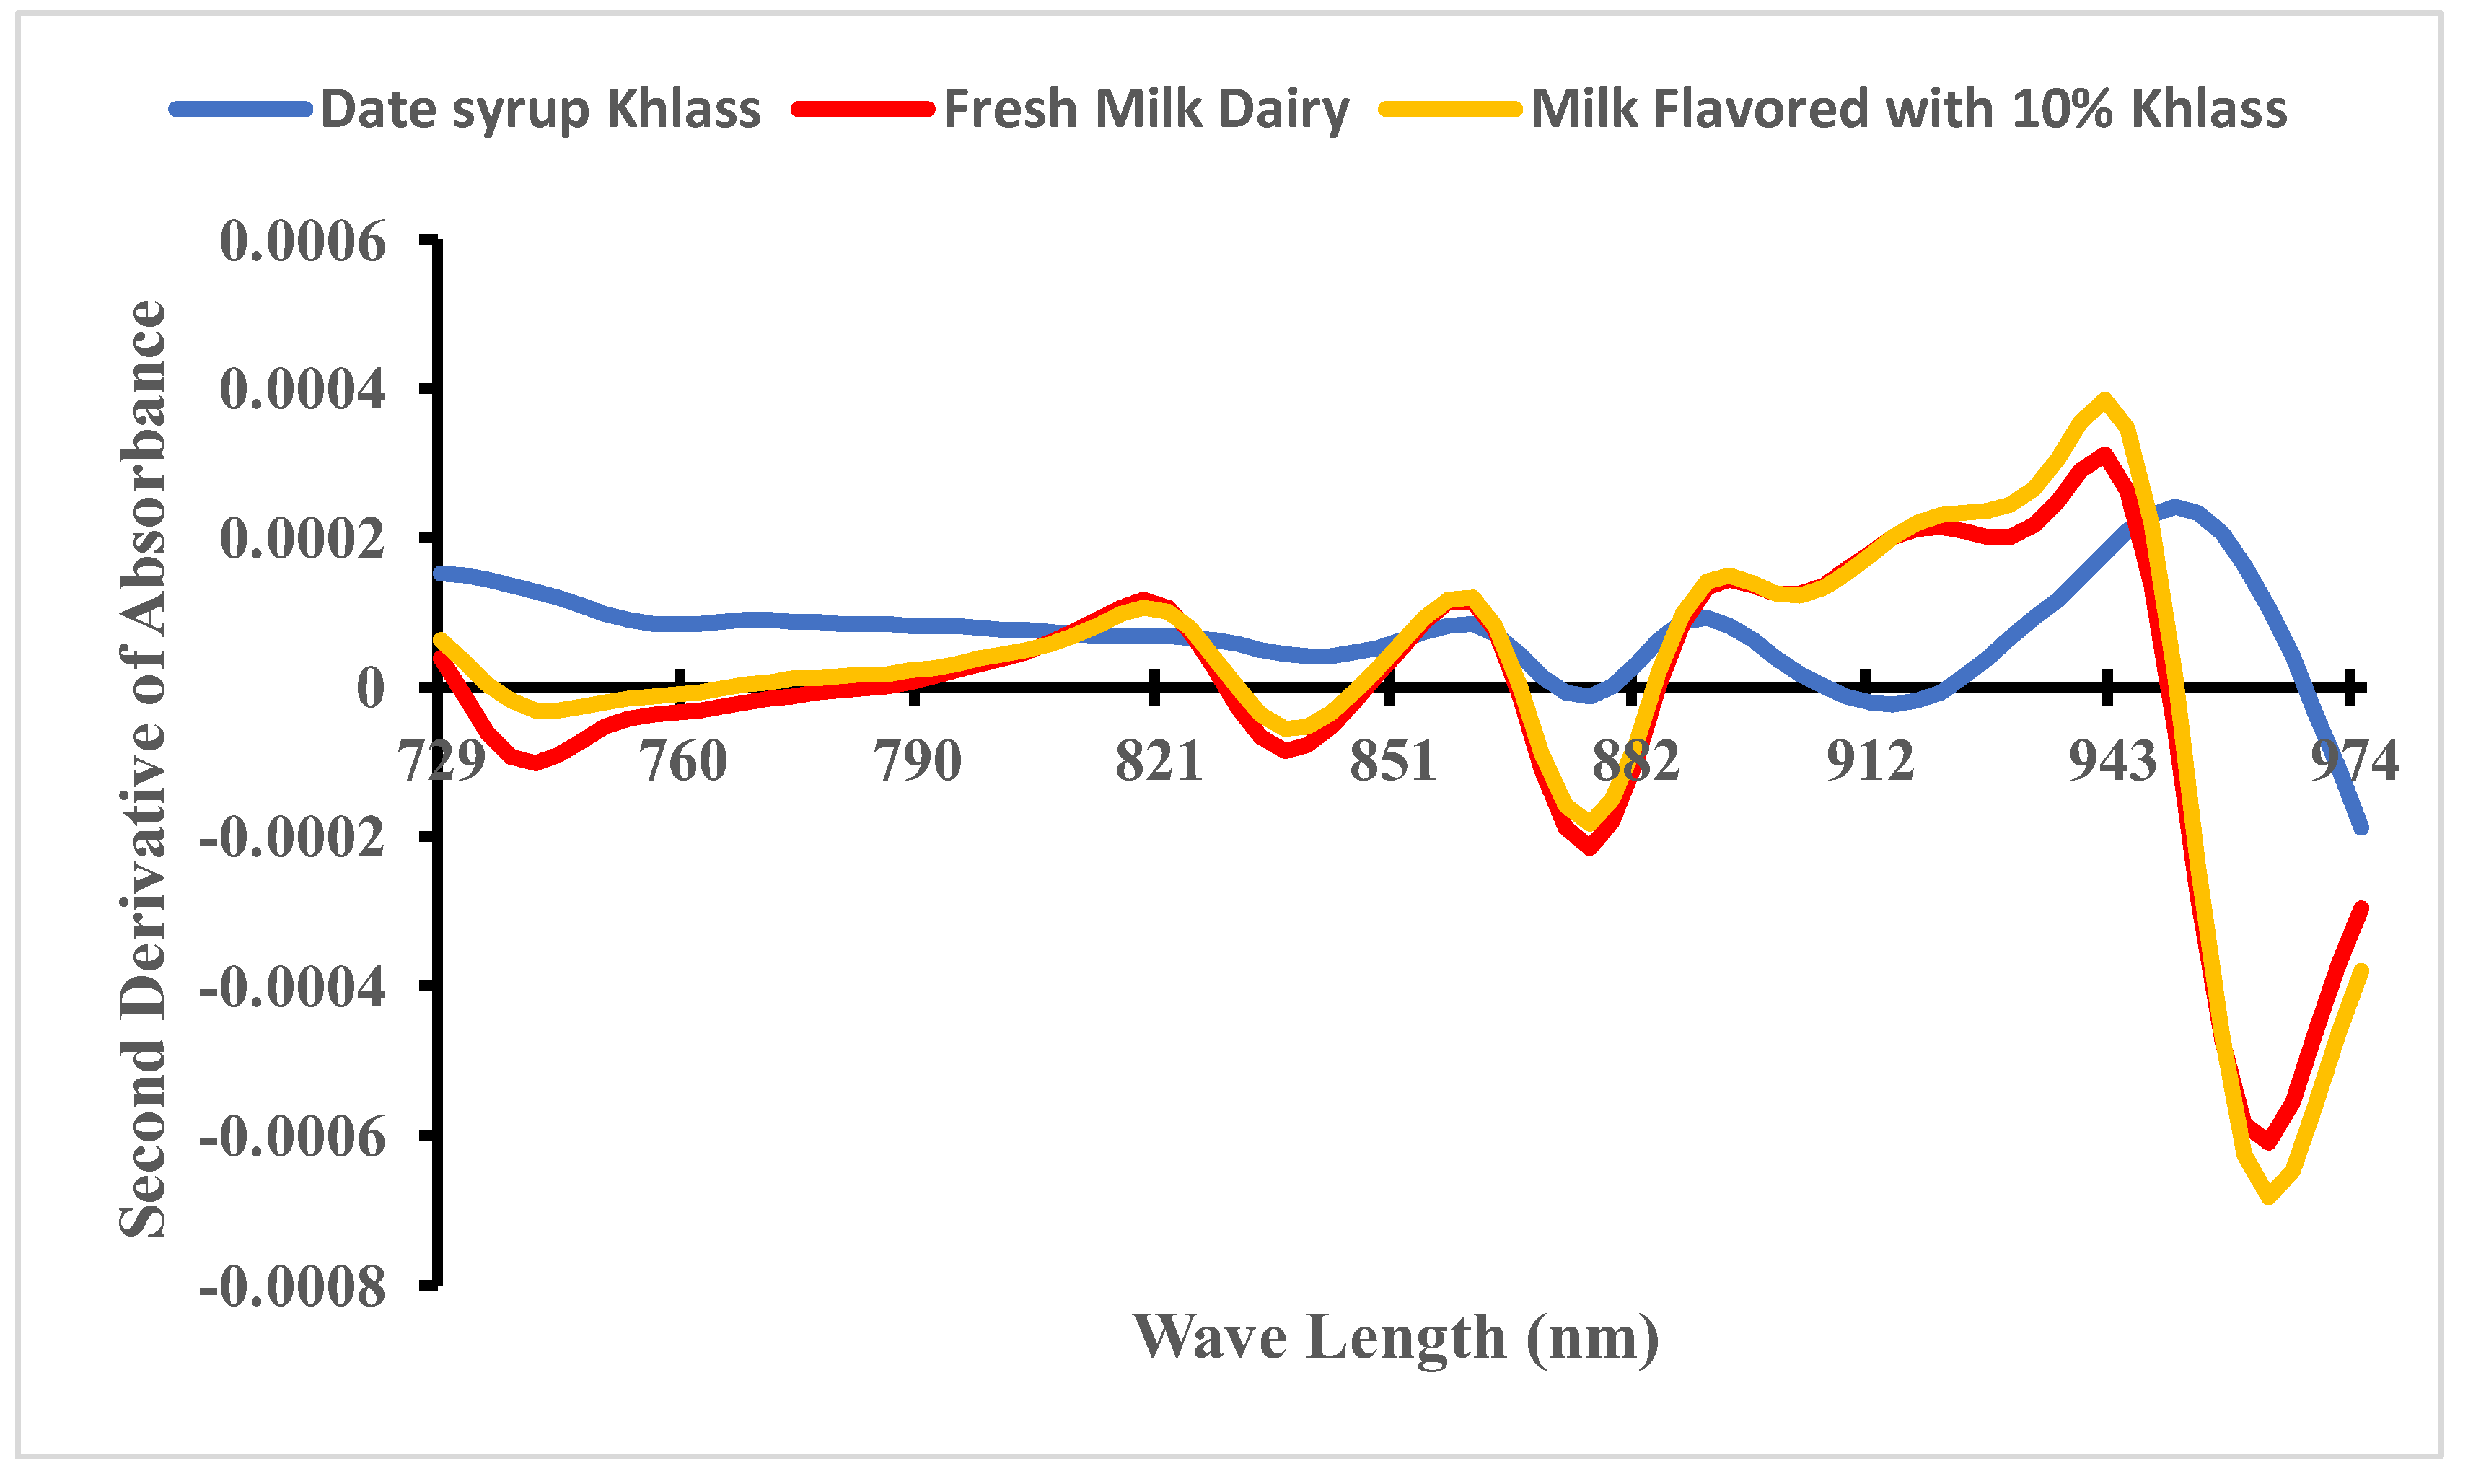
Table 1.
Mean values of the basic physical properties of the date syrup, fresh milk, and the four preferred milk drinks.
Table 1.
Mean values of the basic physical properties of the date syrup, fresh milk, and the four preferred milk drinks.
| Product type | Moisture content (w.b.)(%) | Water activity | Total soluble sugars (Brix°) | pH |
|---|---|---|---|---|
| Date syrup: Sukkary |
26.263a |
0.765a |
72.200a |
4.944b |
| Khlass | 25.405b | 0.703b | 72.600a | 5.120a |
| Milk: Cow |
87.392b |
0.996a |
11.600a |
6.764a |
| Camel | 88.933a | 0.989b | 9.100b | 6.554b |
| Favored milk drinks: Cow’s milk + Sukkary (15%) |
77.134d |
0.977b |
22.86a |
6.533b |
| Cow’s milk + Khlass (10%) | 80.215b | 0.982a | 19.78c | 6.663a |
| Camel milk + Sukkary (15%) | 77.810c | 0.963c | 22.19b | 6.353c |
| Camel milk + Khlass (10%) | 80.831a | 0.977b | 19.16d | 6.535b |
* The similar letter in each column with each group indicates that the average values are not significantly different at P<0.05.
Disclaimer/Publisher’s Note: The statements, opinions and data contained in all publications are solely those of the individual author(s) and contributor(s) and not of MDPI and/or the editor(s). MDPI and/or the editor(s) disclaim responsibility for any injury to people or property resulting from any ideas, methods, instructions or products referred to in the content. |
© 2023 by the authors. Licensee MDPI, Basel, Switzerland. This article is an open access article distributed under the terms and conditions of the Creative Commons Attribution (CC BY) license (http://creativecommons.org/licenses/by/4.0/).
Copyright: This open access article is published under a Creative Commons CC BY 4.0 license, which permit the free download, distribution, and reuse, provided that the author and preprint are cited in any reuse.


