
Submitted:
11 December 2023
Posted:
12 December 2023
You are already at the latest version
Abstract
Background: Number of investigations, which are focused on arbuscular mycorrhiza fungi (AMF) biodiversity is still limited. The analysis of AMF taxa in the North Caucasus, a temperate biodiversity hotspot, used to be limited by the genera level. The aim of this study was to define AMF biodiversity at the species level in the North Caucasus biotopes.
Methods: Molecular genetic identification of fungi was carried out with ITS1 and ITS2 regions as barcodes, sequencing by Illumina MiSeq, analysis of phylogenetic trees for individual genera, searching the operational taxonomic units (OTUs) with identification at the species level. Sequences from MaarjAM and NCBI GenBank were used as references.
Results: We analyzed >10 million reads in soil samples for 3 biotopes to estimate fungal biodiversity. 50 AMF species from 20 genera were found. The valley biotopes (disturbed ecosystems, grasslands) were characterized by a greater AMF diversity, as well as the number of OTUs and species, in comparison with the forest biotopes.
Conclusion: Our hypothesis is that high AMF biodiversity for the river valley can be associated with a higher percentage of annual plants in these biotopes, as well as with the active development of restorative successional processes.
Keywords:
biodiversity
; arbuscular mycorrhizal fungi
; Glomeromycetes
; Caucasus
; ITS1
; ITS2
; hotspot
1. Introduction
One of the key factors of species diversity conservation is the existence of biodiversity hotspots – regions with extremely high levels of species richness, endemism, and number of threatened species [1,2]. The conception of hotspots was suggested originally for tropical forests [3], but with intensive investigation of global biota many various hotspots have been discovered on the Earth. There are 36 biodiversity hotspots according to the last revision [4]. The hotspots conception has been subjected to considerable criticism (summarized in [2]), mostly because the majority of studies in the field of hotspots biodiversity have only focused on plant and vertebrate species, whereas the diversity of invertebrates and fungi has not been studied enough [5]. The modern approach to biodiversity conservation should be more complex and includedifferent aspects, like interactions between various organisms [2]. Arbuscular mycorrhizal fungi (AMF) can play an important role in addressing biodiversity conservation. AMF are microscopic soil fungi that form the most common type of plant-microbial symbiosis. A total of 71 % of terrestrial plants are characterized by obligate symbiotic relationships with AMF and only 7 % of plants form inconsistent “nonmycorrhizal – mycorrhizal” associations [6]. Plants receive a number of benefits from this interaction: fungi improve the uptake of phosphorus, other nutrients and water, increase resistance to pathogens, and protect plants from toxic heavy metals [7]; Edlinger et al., 2022; Kakouridis et al., 2022.
Research of AMF diversity in some tropical biodiversity hotspots has revealed a significant richness of species in these areas. For instance, 49 AMF species were identified in Cerrado hotspot, Brazil [8]; 58 AMF species were found in the rhizosphere of plants from the Atlantic Forest [9]; 72 species were discovered on a tropical mountain in Brazil [10]. While some research has been carried out on tropical AMF, few studies have investigated AMF diversity in temperate hotspots.
One of the richest temperate regions on the Earth is the Caucasus [11]. Since 2000 it has been considered as a biodiversity hotspot [1]. The Caucasus is a region on the isthmus between the Black and the Caspian seas, on the border between Europe and Asia. The Caucasus ecoregion is shared by Russia (Karachay-Cherkess Republic, Republic of Dagestan, Republic of Ingushetia, Kabardino-Balkarian Republic, Republic of North Ossetia–Alania, Chechen Republic), Georgia, Armenia, Azerbaijan, Turkey, and Iran. The Karachay-Cherkess Republic located on the northern macro slope of the Caucasus Mountains [12] is a promising region for the study of biodiversity. It is characterized by a complex relief, a variety of natural obstacles, frequent changes of ecotopes, mosaic vegetation cover, and phytocenoses diversity in the mountainous southern part of the region. The main waterway is the Kuban river, which has only left tributaries descending from the Caucasus Mountains (such as the Teberda river). Investigations on AMF diversity in biotopes of river valleys, forests, alpine and subalpine meadows of the Karachay-Cherkessia are very limited. While previous studies of fungal biodiversity in Caucasus have been carried out at the family [13] or the genus level [14] by molecular genetic methods, no studies have addressed AMF biodiversity in Caucasus at the species level. Twelve AMF species were found in soil-root samples from southern Georgia [15]. But this study employed only morphology-based identification, whereas the molecular-based methods allows to identify more taxa from the same soil and roots samples than the morphological approach [16,17].
To assess molecular diversity of AMF, researchers use the DNA-metabarcoding approach, including high-throughput sequencing of the DNA barcode from soil and root samples, followed by bioinformatics analysis. The critical point for fungal metabarcoding is the length of obtained sequences, therefore high-throughput sequencing platforms able to produce long reads are used. Before 2020 mainly pyrosequencing (454-Roche) was employed [16,18,19,20], now Illumina MiSeq prevails in fungal metabarcoding studies [17,21,22,23]. Another promising platform is PacBio, which can obtain a sequence of 2.5 kb of rDNA in one read [24].
There are no consensus metabarcoding markers for AMF, but almost all currently employed barcodes are parts of the rDNA cistron. In the last decade internal transcribed spacers (ITSs) of rDNA have become the most common universal fungal metabarcoding marker [25]. Fragments of SSU (small sub-units, or 18S) rRNA gene [16,20,22]; ITS [19,26]; and fragments of LSU (large subunit, or 28S) rRNA gene [18,27] are frequently used as barcodes for AMF. For amplification of SSU rRNA gene fragments, AMF-specific primers pairs are being developed (for example, [28]). In case the goal of the study is to observe not only AMF, but the diversity of various fungi classes, ITS and D1/D2 regions are used [18,19]. For identification based on ITSs, universal eucaryotic primers or a combination of fungi-specific primers with universal primers are used [19].
Besides rDNA other DNA markers are seldom used as barcodes. The pilot experiment showed that glomalin, a homolog of a heat shock protein, is a good marker for AMF identification [29]. However, the major drawback of introduction of new barcodes is a lack of reference data. For successful identification of species, a reference database should contain a representative number of correctly identified taxa. Almost 350 species of AMF have been correctly described according to the Botanical Nomenclature Code [30]. The biggest public database GenBank NCBI [31] contains glomalin data only for 24 species. In addition to glomalin, the following genes and regions were used as barcodes: 1) the mitochondrial cytochrome c oxidase 1, COX1 or COI [32,33]; 2) LSU of mitochondrial rRNA [34]; 3) I and II subunits of RNA polymerase II [35]; 4) H+-ATPase [36]; 5) β-tubulin [37]; 6) actin; 7) elongation factor 1-alpha, EF 1-α; 8) phosphate transporters; 9) RNA polymerase II subunits (RPB1 and less RPB2) [38,39]. Most of these markers have not been widely used due to the low nucleotide polymorphism between closely related AMF species. Perhaps the rpb1 gene can become the second barcode in quality after 18S-ITS1-5.8S-ITS2-28S region, as rpb1 was successfully used for identification of AMF species [39,40].
The systematics of AMF is quite complex and controversial. There are many synonyms; many genera were taxonomically revised, but after the revisions not all AMF species names were effectively published according to the Botanical Nomenclature Code. Many taxa found in soil samples are described only by the DNA barcode and have no proper scientific names. AMF form the Glomeromycota phylum and are classified into one class, Glomeromycetes, and four orders [Schüßler, 2023]. But, according to Castillo et al. [42], AMF form the Glomeromycota phylum and are classified into three classes and five orders. According to the database curated by SYMPLANTA (Symbiosis and Plant-Microbe Association Research Laboratory), there are four orders, 12 families, 44genera and 443 species of AMF fungi [30]. Various genera are represented in the GenBank NCBI unevenly. The database contains the majority of species from Claroideoglomus, Dominikia, Septoglomus, Corymbiglomus, Diversispora genera. Poorly represented genera include Glomus sensu lato, Scutellospora, Paraglomus, and Pacispora. Thus, the GenBank database is not complete and lacks many species. Due to the problem of precise identification of AMF species, dozens of virtual taxa were obtained [17,20,21,43]. The alternatives for GenBank NCBI database are the specialized reference databases. One of the main curated databases is MaarjAM that includes mainly SSU rRNA gene-based barcodes and checked metadata for each entry [44]. This database is regularly updated and now contains data for different barcodes [45]. We can assume that the most accurate assessment of biodiversity of AMF (Glomeromycetes) and other fungal classes is their identification using rDNA ITSs as universal barcodes.
One of the most important directions of modern studies is to identify the key factors causingAMF biodiversity. Among them are: temperature conditions, agrochemical properties of soils (including the pH level), usage of meadows as grassland, changes of plant communities in the process of succession [46–49]. According to Horn et al. [50], biotic factors have a more significant impact on the composition of AMF communities in comparison with abiotic factors. The development of succession from a meadow to a forest accompanied by an increase in the proportion of perennial plants in the ecosystem may be the reason for a decrease in the abundance of AMF [51,52]. According to Torrecillas et al., annual plants had a higher AMF diversity [53]. However, no convincing unambiguous evidence has been obtained for the presence of a key factor determining the high species diversity of AMF. Another factor that is consideredas an important one is an altitude. For example, a subalpine meadow (>2,500 m above sea level) in the Head Mountain, Inner Mongolia Autonomous Region, was shown to have the greatest diversity of AMF [49]. On the other hand, in the Southern-Central zone of Chile, the “natural grassland” ecosystem had the greatest diversity of AMF species at a significantly lower altitude (<500 m above sea level) [42]. Perhaps, there are no direct correlations between altitude and AMF biodiversity [50,54–57]. Further elucidation of the factors contributing to the increase in AMF species diversity is required. Thus, it is essential to test the supposition that the biodiversity of AM fungi may be primarily related to such factors as soil pH, phosphorus content, altitude above sea level, and plant species richness. This study aim to detect the AMF hotspots and define the AMF biodiversity in rhizospheric soils of different biotopes in the North Caucasus (such as a subalpine meadow, a forest and a river valley). Research objectives are: 1) to sequence fungal DNA samples from the rhizospheric soil using Illumina MiSeq and ITS1 and ITS2 regions as barcodes; 2) to assess the species diversity of AM fungi; 3) to assess the key relationships between parameters of the biodiversity of AM fungi and plant species richness, altitude for trial plots, and agrochemical soil parameters.
2. Materials and Methods
2.1. The Characteristics of the Stationary Trial Plots
The characteristics of Stationary Trial Plots (STPs, study areas, sample plot), as well as the soils in which the species diversity of AMF was determined, are presented in Table 1 and Table S1. The following STPs were analyzed in different altitudes: 1) in subalpine meadow biotopes – STP 1 (subalpine meadow-4, Malaya Hatipara ridge, 2,437 m above sea level), STP 3 (subalpine meadow-3, Malaya Hatipara ridge, 2,401 m above sea level), and STP 4 (subalpine meadow-2, Malaya Hatipara ridge, 2,186 m above sea level); 2) in forest biotopes – STP 7 (fir forest-3, Malaya Hatipara mountain, 1,900 m above sea level), STP 8 (pine forest-3, Malaya Hatipara mountain, 1,890 m above sea level), and STP 9 (mixed forest near the Bolshaya Hatipara river, Bolshaya Hatipara mountain, 1,507 m above sea level); 3) in river valley biotopes – STP 11 (grassland in the valley of the Teberda river, Teberda town, 1,342 m above sea level), STP 12 (grassland in the valley of the Teberda river, the border of New Teberda village, 1,026 m above sea level), and STP 13 (grassland in the valley of the Kuban river, Ordzhonikidzevsky village, 795 m above sea level). The trial area was 10 m x 10 m. A botanical survey of test sites, STPs located in undisturbed ecosystems of the North Caucasus, the Teberdinsky National Park and adjacent territories, was carried out using A.S. Zernov’s determinants ([12,58]; see Table S2). In each STP, the soil samples were collected for molecular genetic analysis of fungal diversity from the upper 0-5 cm horizon of the soil without litter according to [14], and the samples of the upper horizon of the soil without litter were collected for agrochemical analysis according to [59].The total phosphorus content (Ptotal, %) by the Ginzburg&Shcheglova's method, the content of phosphorus available for plant nutrition (Pi, mg/kg) by the Truog method, the total nitrogen content (Ntotal, %) by the Kjeldahl method, pHKCl, the sum of fractions <0.01mm, soil type- by common methods were determined ([60]; see Table S1).
2.2. Molecular Genetic Identification of Fungi
2.2.1. Sampling and Molecular Analysis
For the molecular genetic identification of AMF, a sampling technique for Illumina MiSeq sequencing optimized by the authors was used. In total, 10 samples were taken from each STP. The samples were frozen and transported in 50 ml tubes in liquid nitrogen. Samples of rhizospheric soil containing mycelium and AMF spores were taken for identification (verification by microscopy). To isolate DNA, 0.2 g of frozen soil and 0.5 g of granite sand were taken into a 2 ml test Eppendorf tube for mechanical grinding (degradation) of the material. After that, 700 µl of СТАB buffer was added to the heated test tube with soil, (2% СТАB; 1,4M NaCl; 20mM EDTA; 100mM Tris-HCl pH=8.0). Initially, the material was homogenized in a buffer with granite sand for 15 minutes on a vortex. After that, the test tubes were shaken every 15 minutes by laboratory vortex shaker (Biosan, Latvija) for 1 min during 1 hour at +65 °C. After thermal, chemical and mechanical treatment, the samples were centrifuged for 5 minutes and the supernatant was transferred to new test tubes. DNA was additionally washed off soil residues by 500 mkl of water by shaking soil with water in the vortex for 5 minutes. After additional centrifugation, the second supernatant was combined with the first one. Purification of the obtained DNA was carried out by double extraction with an equal volume of chloroform. Each time after centrifugation (10 min at 14000 rpm, Eppendorf, Germany), a DNA supernatant was selected. Then the DNA was deposited with 2/3 V isopropanol with 0.4 M NaCl, and the precipitate was washed with 70% ethyl alcohol, the precipitate was dried (until the alcohol was completely removed) for 3 minutes and then dissolved in water [61,62]. After that DNA was purified with the Qiagen Gel Extraction Kit (Germany). Purification on columns or with silicon oxide after isolation of a DNA fragment on an agarose gel after electrophoresis does not allow to completely get rid of various PCR inhibiting impurities. Therefore, an additional measure could be the dilution of DNA samples before amplification by 100 times with water (accompanied by diligent mixing) in order to reduce the effect on PCR of inhibitors from the soil, including humic acids.
Purified DNA was used for nested PCR marker regions ITS1 and ITS2 with universal primers. The primers were synthesized in Evrogen, Russia with adapter 5’-TCGTCGGCAGCGTCAGATGTGTATAAGAGACAG-3’ for direct primers and adapter 5’-GTCTCGTGGGCTCGGAGATGTGTATAAGAGACAG-3’ for reverse primers for Illumina MiSeq, such as: primer ITS5 (5’-GGAAGTAAAAGTCGTAACAAGG-3’) and reverse primer ITS-2RK (5’-CGTTCAAAGATTCGATGATTCAC-3’) modified by the authors for amplification of the ITS1 region, as well as primers ITS3 (5’-GCATCGATGAAGAACGCAGC-3’) and reverse ITS4 (5’-TCCTCCGCTTATTGATATGC-3’) for amplification of the ITS2 region. PCR: 1) PCR for the long fragment (ITS1 + ITS2 regions) with primers ITS5 and ITS4; thermal cycling conditions were: 5 min initial denaturation and polymerase activation at 95 °C; 35 cycles of 20 s denaturation at 95 °C, 20 s annealing at 58 °C and 40 s elongation at 72 °C; and final elongation at 72 °C for 10 min; 2)verification of PCR with gel electrophoresis, DNA dilution by 1000 times; 3) 35 PCR cycles into short fragments (separately for ITS1 and ITS2 regions); repetition of the program with primers for nested PCR; 4) quality control with gel electrophoresis, PCR products for ITS1 and ITS2 were combined for each sample and purified on magnetic particles AMРure XP (Beckman Coulter, USA).
Amplicon libraries were sequenced on an Illumina MiSeq device using a set of reagents MiSeq® Reagent Kit v3 (600-cycle) with two-way reading (2x300 bp) ("Illumina, Inc.", USA). The identified sequences were processed using Illumina software ("Illumina, Inc."). As a result of sequencing on the Illumina MiSeq platform, FASTQ sequences were obtained from forward and reverse primers. This format includes sequence records and reading quality indicators (quality score) for each nucleotide position.
2.2.2. Bioinformatics
We uploaded the Illumina data (FASTQ sequences) to the NCBI database; it is now available in the base as the PRJNA646244 bioproject [Bioproject PRJNA646244, 2023]. Data processing was performed with USEARCH [63]. Forward and reverse reads were merged using the command “fastq_mergepairs” with sequences shorter than 120 bp removed. The resulting reads were pooled into a single FASTQ file. Further processing to OTUs with a 97% radius was carried out in two steps. First, sequences from the MaarjAM database [44] were used as OTU centroids, to which the obtained sequences in FASTQ format were mapped. Secondly, the sequences that have not been mapped to the MaarjAM database (with 97% threshold) were processed to OTUs using the UPARSE algorithm [64], where the most abundant sequences are selected as centroids. During this step regions corresponding to primers were removed, and sequences were quality filtered with the value of “fastq_maxee” parameter was equal to 1. Chimeric sequences were removed during OTU construction using the “cluster_otus” command, and residual singletons were removed. Both types of centroids were used to construct the OTU table. The high genetic polymorphism observed in the internal transcribed spacers (ITSs) of AMF [Thiéry et al., 2012] makes it difficult to identify many AMF species accurately [GenBank NCBI, 2023]. Consequently, an increasing number of virtual taxa (VT) are being added to databases [Peña-Venegas et al., 2019; Lara-Pérez et al., 2020; Rasmussen et al., 2022]. For effective assessment of AMF diversity, Operational Taxonomic Units (OTUs) is recommended instead of Amplicon Sequence Variants (ASVs) or Zero-radius OTUs (ZOTUs) for the ITS1 and ITS2 AMF regions.
For taxonomic annotation of the newly obtained OTUs we used the MaarjAM database, as well as the established local reference database consisting of sequences of fungi of the Glomeromycetes class selected from the NCBI database. The annotation was performed using the “usearch_global” command. The coding regions of rRNA were trimmed, leaving the spacer sequences for further processing. Primary clustering was performed by constructing an alignment-free tree using the Neighbor Joining (NJ) method in the paHMM program [65]. Based on this tree, sequence clusters that could be properly aligned were selected. These alignments were supplemented with reference sequences annotated at the species level and were used to construct trees using the Maximum Likelihood (ML) method in the IQ-TREE [66]. Fungi annotation at the phylum level was based on the UTAX reference dataset version 27.10.2022 [67].
The general algorithm for further identification is shown in Figure S1. The alignment of ITS sequences by genera was most effective, since the inter-genus variability in ITS for arbuscular mycorrhiza (AM) fungi is too high and most often did not allow for reliable alignment of sequences, and this is the most significant factor for the construction of reliable phylogenetic trees. With the help of the Mega 7 software package [68], sequences combined by genera into separate files were aligned automatically, and then a manual revision of the alignment was carried out. After manual refinement of the alignment and the BLAST procedure in the NCBI GenBank, some sequences were rejected as not belonging to this genus (rarely, to a taxon of a higher rank), due to the inability to align them within the ITS regions under study. During manual alignment, species-specific mutations were also identified, the analysis of which provided additional information about the similarity of sequences. In some cases, this was the only way to separate sequences of two close species, which is most important in particular for the identification of species from the Rhizophagus genus. After that, phylogenetic trees were reconstructed in the Mega 7 software package. The resulting trees were used to refine the identification at the species level. Sequences clustered together to form a separate clade were identified as sequences belonging to the same taxon. If the resulting clade was found to include reference sequences from the GenBank belonging to the same species, such sequences were assigned to a particular species. To clarify the species affiliation we also used information on the length of phylogenetic branches as well as p-distances calculated by us using the NCBI database for reference sequences (Table S3), bootstrap indexes and the presence or absence of species-specific nucleotide substitutions (e.g. [69]). In complex cases, individual sequences were also identified taking into account the closest sequences based on the results of manual BLAST analysis in the NCBI GenBank, paying attention primarily to the year of obtaining the sequence presented in the GenBank. If the obtained sequences were grouped into a clade, but not grouped with reference sequences, then they were assigned to a virtual taxon (VT) of the species level. If VT was not clustered on a tree with other sequences, forming a well-separated clade and had low p-distance compared to others, then it was identified as VT of the genus level or higher. If such VT consisted of multiple sequences, they were excluded from the analysis to avoid biases in biodiversity estimation, as it was hard to determine the exact number of species they represented.
2.2.3. Assessment of Biodiversity Indices
To assess the taxonomic diversity, Hill numbers were calculated using the iNEXT package [70] for R environment [71]. Species Richness (diversity order q=0), Shannon diversity (q=1) and Simpson diversity (q=2) were calculated. To overcome the limitations associated with different sample sizes, Hill numbers were also calculated, extrapolated to a sample tending to infinity (estimated asymptotic diversities). A 95% confidence interval was calculated for each extrapolated index.
2.2.4. Statistics
Statistical analysis was processed in the R language environment 4.1.0 [71]. The data, OTUs for fungal classes, were normalized by the total-sum scaling method. The analysis of variance (ANOVA) was used to assess the statistical significance (P<0.05) of the differences. Principal Component Analyses (PCA) was applied using the pcaMethods package [72]. For unsupervised dimension reduction multidimensional scaling (MDS) was applied. Spearman’s distances (1-ρ) and MDS were used with stats [71]. Analysis of similarities (ANOSIM) [Warton et al., 2012] was made with the vegan package [Oksanen et al., 2022], and Spearman's distance (1-rho) was used. Hierarchical clustering was carried out using the dendextend package [73]. Spearman’s distances and Ward method for cluster agglomeration were used. The packages of ggplot2 [74] and Venn Diagram [75] were used to plot the graphs.
3. Results
3.1. Analysis of Fungal Sequences
The total number of fungi sequences in ITS1 and ITS2 regions was >10 million (Table 2). The average depth of reads for STPs of meadows, forests and river valleys (pastures) exceeded 1.1 million, and after filtering (merged reads after length trim) – 376,000 reads (Table 2). The number of AM fungi reads according to ITS1 varied widely for, the average for 9 STPs was 1,774 AMF reads per STP. The results of the Illumina MiSeq sequencing analysis showed that of all the sequences, >62% of the reeds (or >90% of OTUs) belong to fungal sequences. Meanwhile, the number of AMF reads varied more widely for STP in ITS2 compared to ITS1, and the average number of reads for 9 STP was 722 AMF reads per STP in the ITS2 region. Thus, the number of AMF rows in the ITS2 region was on average 2.5 times lower than in the ITS1 region. The highest number of AMF reads was also detected in samples STP 11 and STP 13 related to the river valley, and the lowest in samples STP 7 and STP 8 related to forest biotopes.
It is known that most studies are carried out with the removal of singletons due to the fact that the analyzed objects often make up about 50% of all reads. But the rows of AM fungi represent usually only 1-2% of all reads, so the analysis of singletons can contain important information about their diversity. On one hand, singletons often contain chimeric sequences and can be eliminated at the stage of manual alignment. On the other hand, the exclusion of singletons would lead to a significant loss of true fungal species. The application of public database sequences as OTU centroids has provided a number of advantages. First of all, the use of the same centroids for OTU clustering in different experiments made it possible to compare results in a better way. Secondly, the singletons present in the data were successfully mapped with known centroids, and were not lost at the stages of data processing. Therefore, the use of the MaarjAM database to build OTU was justified, and this approach made it possible to save about 15% of reliable singletons in the final data.
The results showed that for the ITS1 region, the number of OTUs of AMF for the river valley biotopes was 2.5 times higher than for the mountain forest biotopes, and 1.7 times higher than for the subalpine meadow biotopes. The number of OTUs for meadow biotopes was also higher than for forest biotopes (by 1.5 times) according to the ITS1 region. According to the ITS2 region, the number of OTUs for the river valley biotopes was 3.7 times higher than for the forest biotopes, and 1.7 times higher than for the subalpine meadow biotopes. The number of OTUs for meadow biotopes was also higher than for forest biotopes (2.2 times) according to the ITS2 region. Summing up the results of the analysis, we can assume that the biotopes of pastures in the river valley may have the greatest diversity of taxa, while the forest biotopes are characterised by the least diversity. Samples representation in low dimensional space revealed from MDS (Figure S2) and score plots from PCA of OTUs profiles (Figure S3) confirmed the differences between the three studied biotopes.
3.2. Taxonomic Composition of Fungal Phyla and Classes in Soil Samples from the River Valley, Subalpine Meadow and Forest
An assessment of the number and ratio of fungal OTUs at the phylum level was carried out to identify the objective ratios of AMF reads and the general structure of fungal communities in the studied ecotopes (Figure S4). The most common fungal phyla were Ascomycota, Basidiomycota, Glomeromycota, Rozellomycota, Mortierellomycota, Chytridiomycota, Mucoromycota (Figure 1). Kickxellomycota, Olpidiomycota, Zoopagomycota accounted for less that 1% (“Others” at the Figure 1). AM fungi are included in the phylum Glomeromycota, a monophyletic group with one class, Glomeromycetes. Glomeromycota had a significantly higher ratio of OTUs in soil from disturbed ecosystems of pastures in river valley than in soil from forest and subalpine meadow and had a significantly lower ratio of OTUs in soil from forest (P<0.05; Student's t-test). The abundance of ectomycorrhizal fungi (Ascomycota, Basidiomycota) in the analyzed biotopes had no significant differences, except for a reduced level (P<0.05) of Basidiomycota for the river valley. Other fungal phyla also did not simultaneously have significant differences in biotopes, like Glomeromycota.
The following classes of fungi (see Figure 2) were identified in soil samples by ITS1 and ITS2 regions according to the proportion of OTUs for the biotopes of the subalpine meadow, forest biotopes and pasture biotopes in the river valley. A total of 9 fungal classes accounted for at least 2% were found in soil samples from subalpine meadow, forest and river valley (Figure 2). The results show that the same trend can be traced as in the analysis of phyla. With regard to Ascomycetes, we found that Sordariomycetes, Dothideomycetes and Pezizomycetes were more common in the river valley, whereas Leotiomycetes was more common in the forest biotope. AM fungi (Glomeromycetes) were also well represented in soil samples from the river valley, but difference between valley and other biotopes was astonishing.
Thus, the results showed a significant proportion of AMF (Glomeromycetes class) in the total number of sequenced samples attributed to the Fungi kingdom, especially for the river valley. In different STPs there were 0.1-6.9% of all reads and 5-11% of OTUs identified as AMF by ITS1 sequencing. 0.01-1.0% of all reads and 1-5% of OTUs were identified as AMF by ITS2 sequencing. The number of OTUs from Glomeromycetes in the river valley were significantly (P<0.05) larger than in subalpine meadow and OTUs number in subalpine meadow were significantly (P<0.05) more than in the forest (Table 2). Thus the greatest diversity of AMF species can be expected in the biotopes of the river valley pastures (STP 11, STP 12, STP 13).
3.3. Identification of AMF Species in the River Valley, Subalpine Meadow and Forest Biotopes
Intraspecific polymorphism is difficult to assess due to the lack and heterogeneity of data in the NCBI GenBank database. In order to solve this problem we focused on the intra-genus p-distance (Table S3) calculated from the NCBI database when complex (remote from the main species clusters) sequences in the samples. In accordance with the developed algorithm (Figure S1), phylogenetic trees were analyzed for more accurate identification of AMF species, known species were identified, as well as virtual taxa of the species level: an example of Maximum-Likelihood (ML) phylogenetic trees for the genera Ambispora and Acaulospora is shown on Figures S2–S5. The virtual taxa at the species level were defined. Ones made up a significant part of the detected sequences. The construction of phylogenetic trees for all AMF genera, based on the analysis of ITS1 and ITS2 individual regions, resulted in identification of a number of AMF available in the analyzed soil samples. Figures 3 and 4 show heat maps with the frequency of occurrence of identified AMF species by the number of reads for the ITS1 and ITS2 regions.
The analysis of phylogenetic trees revealed that a significant number (>42%) of the detected and identified AMF reads to the species level are virtual taxa. Almost the same proportion (~38%) was made up of AMF reads identified to the level of genus, family and higher rank of taxa (it was not included in the performed analysis because cannot characterize species diversity). The assumption is that at the moment the AMF discovered in the North Caucasus are not fully annotated by genetic methods. Only the construction of trees separately by genera (or by groups of close genera) is supposed to identify the taxa at the species level with a high variability of genetic markers. By constructing phylogenetic trees, the following AMF taxa defined up to the species level were reliably identified in STPs in three different biotopes. The following known species have been identified for ITS1 (see Table S4):
- -
- subalpine meadow (Acaulospora alpina, Aс. nivalis, Aс. nivalis, Aс. paulinae, Aс. punctata, Aс. viridis, Ambispora gerdemannii, Am. leptoticha, Archaeospora europaea, Ar. trappei, Claroideoglomus claroideum, Cl. walkeri, Diversispora insculpta, Dominikia bernensis, Do. disticha, Glomus indicum, G. macrocarpum, G. tetrastratosum, Otospora bareae, Paraglomus brasilianum, Paraglomus laccatum, Rhizophagus intraradices, Rhizophagus irregularis, Septoglomus constrictum, S. nigrum), or 24 species from 12 genera, as well as 19 virtual taxa at the species level;
- -
- forest (Acaulospora nivalis, Ac. paulinae, Ac. punctata, Ambispora fennica, Am. gerdemannii, Am. leptoticha, Claroideoglomus claroideum, Diversispora insculpta, Di. slowinskiensis, Di. sporocarpia, Di. spurca, Dominikia bernensis, Glomus indicum, G. macrocarpum, G. tetrastratosum, Otospora bareae, Paraglomus laccatum, Rhizoglomus invermaium, Rhizophagus intraradices, Rhizophagus irregularis, Septoglomus constrictum, S. nigrum), or 22 species from 11 genera, as well as 12 virtual taxa at the species level;
- -
- river valley (Acaulospora delicata, Ac. paulinae, Ambispora fennica, Am. gerdemannii, Archaeospora europaea, Ar. trappei, Claroideoglomus claroideum, Cl. lamellosum, Cl. walkeri, Diversispora celata, Di. varaderana, Dominikia achra, Do. bernensis, Do. disticha, Funneliformis mosseae, Glomus indicum, G. macrocarpum, G. tetrastratosum, Halonatospora pansihalos, Otospora bareae, Palaeospora spainii, Paraglomus laccatum, Rhizoglomus invermaium, Rhizophagus intraradices, Rhizophagus irregularis, Septoglomus constrictum, S. nigrum, S. viscosum), or 28 species from 15 genera, as well as 24 virtual taxa at the species level.
The list of genera with the number of OTUs identified in the ITS1 region is presented in Table S5. The most common genera (54% OTUs) are highlighted in green; the group of minor genera is highlighted in blue (5% OTUs), which include Ambispora, Otospora, Scutellospora, Palaeospora, Halonatospora.
The following known species have been identified for ITS2 (Table S6):
- -
- subalpine meadow (Acaulospora alpina, Ac. brasiliensis, Ac. paulinae, Ambispora gerdemannii, Am. leptoticha, Archaeospora trappei, Claroideoglomus claroideum, C. lamellosum, Diversispora varaderana, Dominikia bernensis, Entrophospora infrequens, Glomus bareae, G. indicum, G. macrocarpum, Paraglomus laccatum, Rhizoglomus melanus, Rhizophagus intraradices, Rhizophagus invermaius, Rhizophagus irregularis), or 19 species from 11 genera, as well as 15 virtual taxa at the species level;
- -
- forest (Acaulospora paulinae, Ambispora gerdemannii, Am. leptoticha, Claroideoglomus claroideum, C. lamellosum, Diversispora slowinskensis, Entrophospora infrequens, Glomus hoi, G. indicum, Paraglomus laccatum, Rhizophagus intraradices, Rhizophagus irregularis, Scutellospora alterata), or 13 species from 9 genera, as well as 7 virtual taxa at the species level;
- -
- river valley (Acaulospora paulinae, Ac. punctata, Ambispora fennica, Am. gerdemannii, Archaeospora spainiae, Ar. trappei, Cetraspora gilmorei, Claroideoglomus claroideum, Cl. hanlinii, Cl. lamellosum, Dominikia bernensis, Do. difficilevidera, Entrophospora infrequens, Funneliformis mosseae, Glomus hoi, G. indicum, G. macrocarpum, Halonatospora pansihalos, Paraglomus laccatum, Rhizophagus aggregatus, Rhizophagus intraradices, Rhizophagus invermaius, Rhizophagus irregularis, Scutellospora pellucida), or 24 species from 13 genera, as well as 20 virtual taxa at the species level.
The list of genera with the number of OTUs detected for region ITS2 is presented in Table S7. The most common genera (54% OTUs) are highlighted in green; the group of minor genera (5% OTUs) is highlighted in blue. As shown in Tables S5 and S7, ~50% of all AM fungi OTUs are the OTUs belonging to only three genera: Rhizophagus, Dominikia and Glomus, both in regions ITS1 and ITS2. The fungi from these genera were present in OTUs of meadows and river valley, but were absent in some cases in STPs belonging to forest biotopes. Minor genera (5% OTUs) for region ITS2 included Scutellospora, Microkamienskia, Rhizoglomus, Diversispora, Cetraspora, Halonatospora.
The construction of phylogenetic trees indicated that employment of ITS1 guarantied identification of more taxa at the species level. The reason is the specificity of primer annealing on the analyzed genetic markers. The sequence analysis revealed the presence of 560 OTUs identfied up to the species level by regions ITS1 and ITS2 for 9 STPs of three biotopes of the North Caucasus. And 161 OTUs were excluded from the OTUs identified up to the species level due to the lack of clustering in phylogenetic trees constructed for individual AMF genera. 285 OTUs were identified up to 38 species from 16 genera and 27 virtual taxa at the species level by ITS1. 273 OTUs were identified up to 32 species from 15 genera and 25 virtual taxa at the species level by ITS2. Therefore the average number of detected OTUs AMF in the sequences analysis of the ITS1 and ITS2 region was equal (slightly less for ITS2), while the total number of detected reads for the fungi of the Glomeromycetes class was 2,5 times higher by ITS1 than by ITS2 (Table 2).
According to the data of all analyzed STPs the following species were the most common at the culculation of the number of reads for ITS1+ITS2 regions: 1) Dominikia bernensis (>2000 reads); 2) Glomus indicum, Rhizophagus intraradices and Entrophospora infrequens (>1000 reads for each species); 3) Ambispora gerdemannii, Rhizophagus irregularis and Paraglomus laccatum (>500 reads for each species). While the culculation of the number of OTUs for the ITS1+ITS2 regions indicated that the most common species were as follows: 1) Rhizophagus intraradices (51 OTUs); 2) Paraglomus laccatum (37 OTUs); 3) Rhizophagus irregularis (33 OTUs); 4) Dominikia bernensis (32 OTUs); 5) Claroideoglomus claroideum (21 OTUs); 6) Funneliformis mosseae (17 OTUs), and 7) Acaulospora paulinae (16 OTUs). The most common genera were: 1) Rhizophagus and Dominikia (>3000 reads for >100 OTUs for each genus); 2) Glomus (>2000 reads for >50 OTUs); 3) Paraglomus and Claroideoglomus (>500 reads for >30 OTUs). The list of endemic species is presented in Table S8. The results showed that among the known species, 7 specific (endemic) species were found for the biotopes of the subalpine meadow, 4 – in the forest, and 17 – for disturbed ecosystems, pastures in the biotopes of the river valley.
For a more accurate comparison of biodiversity in the studied biotopes, the Shannon and Simpson indices were used (Table S9). The AMF species diversity indices calculated from the data obtained using two various markers differ from each other. All Hill numbers were higher for the data obtained for ITS1 than for ITS2. This was typical for both observed and extrapolated indices. The lowest observed diversity indices were noted for the forest ecosystem, the highest ones were for the river valley. The Hill indices (estimated by sample size extrapolation) also revealed the low diversity for the forest ecosystem. The extrapolated value of species richness was maximal for the meadow, but the confidence interval value was also very high for the meadow, so it was complicated to conclude which of the two biotopes had higher index. The extrapolated Shannon and Simpson indices were significantly (P<0.01) higher for the river valley and significantly (P<0.01) lower for the forest according to ITS2 data, but close to each other in all three biotopes according to ITS1 data. A comparison of the observed and extrapolated indices showed that for the river valley the identification of more than 96% of the species diversity was performed in this study with both markers.
The obtained results indicated that the analyzed Caucasus biotopes had different biodiversity and included a different number of specific species of AM fungi. Therefore, it is of an interest to analyze the correlations between biodiversity for individual STPs and agrochemical parameters of sampled rhizospheric soils.
3.4. Correlation Analysis of the Interlinks between AMF Species Richness with STP Height and Agrochemical Parameters of Sampled Rhizosphere Soils
The assumption of this study was the existence of a correlation of species richness with soil agrochemical indicators and STP height (altitude). The analysis was performed with application of rho, Spearman correlation (Figures S6 and S7). The results indicated the existence of a direct positive correlations of AMF biodiversity only with the pH value of soil acidity. The highest greatest correlation was found for OTUs in the ITS1 region (Figure S6). The absence of correlations other soil parameters, as well as with the altitude above sea level was discovered. Linear correlation coefficients (r) between AMF biodiversity parameters, plant biodiversity and agrochemical indicators of STPs are presented in Table S10. A proved (P<0.05) positive correlations were found between the indicators of AMF diversity with “Percentage of annual plants”, with “pHKCl” and in some cases with “Pi, mg/kg” (inorganic phosphorus available for plant nutrition).
4. Discussion
4.1. Applicability of Molecular Genetic Identification of AMF in the Study of Their Biodiversity
Our study focuses on to define AMF biodiversity in the North Caucasus, a temperate biodiversity hotspot for plants and animals, to detect new AMF hotspot. The correct identification of individual AMF species is possible by the morphological method. But AMF do not grow on culture media, so the accuracy of estimating the AMF species richness by this method is low. In this regard, we have been carried out identification using molecular genetic methods based on using Illumina MiSeq. The results are revealed that significant differences among the three analyzed biotopes for Glomeromycetes class, which included all known AMF species. An assessment of the suitability and relevance of the approach used for molecular genetic identification of AMF, its advantages and disadvantages will be discussed further on. We proposed new methodology to solve the problem of high polymorphism of AM fungi for ITS regions by constructing trees by genus and accompanied with manually-verified alignment (Figure S1). Because of the impossibility to construct a phylogenetic tree for the whole Glomeromycetes class for ITS regions, the most studies of AM fungi are provided with conservative genes (for example, the LSU region; [77]). The LSU region is also not fully suitable for constructing a complete reference tree for Glomeromycetes. In the investigation of Delavaux et al., this tree included only 174 sequences of AM fungi assigned to only 112 species [77], despite the fact that 345 species of AMF are known [30]. Thus, this reference tree is not enough to identify most of the species (more than ⅔ of known AMF species). Therefore, the assessment of AMF biodiversity and their identification only by LSU at the species level is not yet possible, and most studies are currently associated with the definition of AMF taxa to the genus level [14,22,17,77]. The SSU region is believed to be slowly evolving, and therefore not sufficiently variable to adequately identify AMF species [78–80]. Suggested in this study algorithm (Figure S1) allows one to eliminate the disadvantage of using polymorphic ITS regions, to carry out correct clustering for AMF identification at the species level. Currently, ITS1 and ITS2 are, as a rule, analyzed unequally [31]. Thus, in the NCBI GenBank database, individual sequences of the ITS2 region are the most frequent, and sequences of the ITS1 region are represented as part of the entire SSU-ITS1-5.8-ITS2-LSU region. According to the data of our study ITS1 analysis demonstrated a significant number of reads, and it can be assumed as a second barcoding region along with the ITS2 region. In all likelihood, the efficiency of primer annealing for the ITS1 and ITS2 regions differs, which is confirmed by the different composition of the identified AMF species; Tables S4 and S6). The assumption is that the analysis of ITS1 and ITS2 regions should complement each other, as if they were different genetic markers.
In the biotopes of the North Caucasus, for ITS1 and ITS2, the total number of AMF species was 50 (the number of clades of the species level with accurate identification) from 20 genera. Currently, 345 AMF species from 44 genera are known [30]. Thus, at least 15% of the world's AMF species diversity has been identified in the studied region of the North Caucasus (from 45% of genera). AM has been actively investigated for several decades, including in the North Caucasus and other regions of Russia. The plant communities of the Teberdinsky National Park, including arbuscular mycorrhizae, have been studied for many years by Onipchenko et al. [81–83]. Authors found out that about 74-77% of the higher plants of the National Park interact with AMF, forming a symbiosis, arbuscular mycorrhiza [83]. However, a detailed assessment of the diversity of AMF species in the North Caucasus has not yet been performed. Evaluation of biodiversity and comparison of different floral complexes (river valley, mountain forest and subalpine meadow) was a difficult task without the application of molecular genetic methods. The main approaches were at the level of classical floristics, geobotany and mycology known as methods of comparative morphological analysis based on species identification only by the morphology of rhizospheric extraradical AMF spores, but not by intraradical AM structures: vesicles, arbuscules and mycelium [84]. Meanwhile AMF peculiarities are concerned to their obligate status in relation to the host plant and fundamental impossibility to grow AMF spores in soils without plants. Therefore, it is very difficult to assess AMF biodiversity by the morphology of spores. On the other hand, the difficulties of molecular genetic identification of AMF by rDNA regions linked to the fact that the concepts of “organism” or “species” are not fully applicable to AMF [38], because AMF contains nuclei of different origin in their hyphae and spores (heterokariosis), i.e. essentially one fungus contains a set of polymorphic genotypes, and since the analysis of genetic diversity is evaluated by the diversity of rDNA, it more correct a definition that one AM fungi has a set of different ribotypes. It is appropriate to consider the community of nuclei within the arbuscular mycorrhiza in the studied STP as a peculiar pangenome, rapidly changing due to horizontal gene transfer [85,87]. It is also known that AMF are able to form anastomoses [88] and, accordingly, the exchange of genetic material. All this is the reason that different OTUs belong to the same AMF species according to the sequencing results, obtained in this and earlier studies [62]. Thus molecular genetic methods including NGS sequencing using Illumina MiSeq have advantages in assessing AMF biodiversity up to the species level in comparison with morphological methods of AMF identification (Table S11). Nevertheless only morphological methods provide reliable information for accurate species identification. And some disadvantages of NGS sequencing should be mentioned (Table S11). The main problem is the high genetic polymorphism of AM fungi.
The genetic mechanisms of heterogeneous nuclei interaction within a single pangenome have not been studied. We assume that the genetic diversity of OTUs revealed in this study with Illumina MiSeq application may be caused by three different phenomena. Firstly, it is a consequence of the heterogeneity of nuclei in hyphae and AMF spores. For example, one spore can contain up to 35,000 nuclei [91]. The reason is that АМ fungi (unlike other eukaryotes) lack the genetic bottleneck of a single-nucleus stage [92].
Secondly, the detected heterogeneity of the AMF genetic material may be a result of conflict of genomes, a “genomic shock” (known from studies on hybrids and allopolyploids of plants). At the rDNA level it is expressed as “nucleolar dominance” known as silencing of the rDNA of one of the parents, a high rate of accumulation of substitutions in the repressed genome and a gradual decrease in the proportion of rDNA of the repressed subgenome in the polyploid genome [93–95]. Such a phenomenon of nucleoli dominance is also found in AM fungi [96]. It is displaied by the appearance of a high number of singletons – unique and quasi-unique rDNA variants represented among reads by a minimum number of copies [93], similarly to what was found in this study. The provided identification of a larger number of OTUs for ITS1 due to the greater ITS1 variability, and, secondly, since AMF contain many nuclei that have different variants of both ITS1 and ITS2. Consequently, the same mycelium of the same AMF species may contain more variants of ITS1 than ITS2. The different variability of the regions (the rate of changes in ITS2 is less than in ITS1) and the different specificity of primers to them indicate that the complex analysis of the both regions significantly complements each other. Singletons oftenly contain chimeric sequences, but, its exclusion can lead to a significant loss of truly existing fungi species. This was estimated in the analysis by Baldrian et al., since 2.5% of 10 million singletons had a more than 97% similarity to fungi species [25].
The third mechanism that can lead to the increase in the diversity of OTU in the studied STPs (in addition to the real taxonomic diversity of the mycota of each site) is a parasexual process that naturally directs to the exchange of genes between nuclei during karyokinesis [97]. The common opinion was that mycorrhizal fungi are asexual. However, the preservation in their genomes of 85% of gene complexes associated with crossing over of sexual forms [98] fully admits the assumption that a hidden parasexual process is possible [84,99].
4.2. Comparative Analysis of AMF Diversity in Different Biotopes
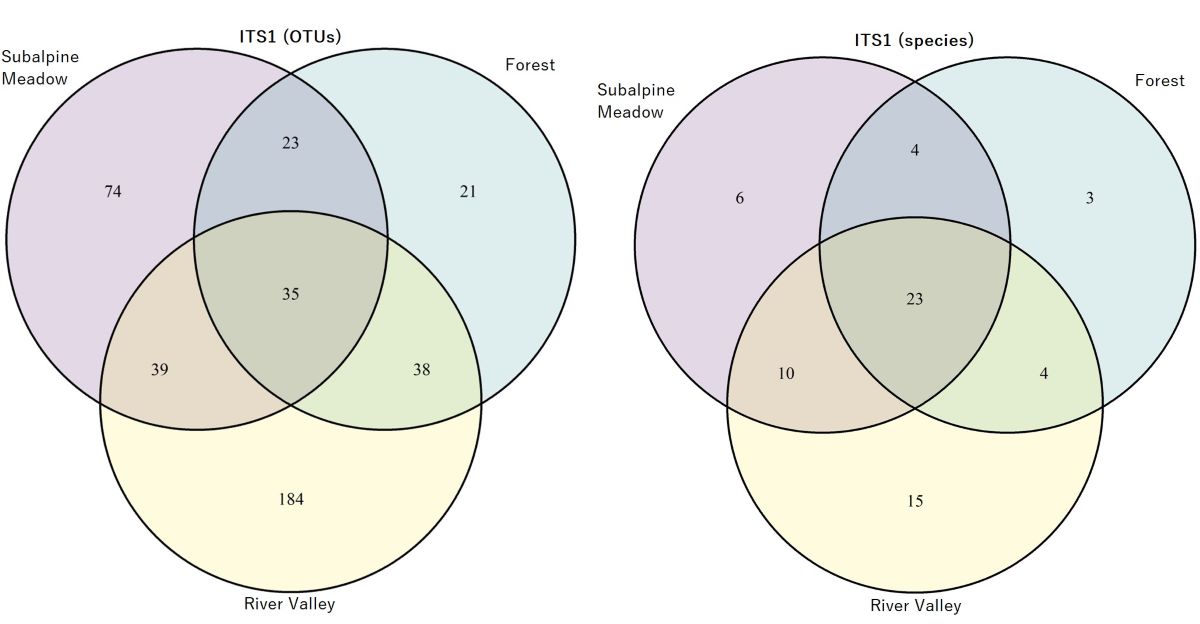
As a result of the OTUs, as well as phylogenetic trees analysis, the AMF species were identified (Tables S4 and S6). The ratio of OTUs and AMF species in three biotopes (subalpine meadow, forest, river valley) is represented in Figure 5 and Figure 6 for the ITS1 and ITS2 regions, respectively. The largest number of specific AMF species was found in the river valley, and the least one was in forest biotopes for both ITS regions, including calculation of specific species without VT (Table S8). The highest number of species has been identified in all biotopes for the ITS1 region in comparison with ITS2.
Among the biotopes of meadows, forests and river valleys, both endemic and common AMF species for different biotopes have been identified (Table S8). The dominant AMF species in the North Caucasus ecosystems are (in descending order of the number of OTUs, species with the number of identified OTUs > 350): R. intraradices, R. irregularis, Entrophospora infrequens, Dominikia indica. Whereas the conclusions about the distribution of a taxon based on the number of OTUs are somewhat risky, it should be noted that they may be correct in the case of dominant and subdominant species. For example, such AMF genera as Rhizophagus and Dominikia are recognized as the most common ones (by the number of OTUs and reads), so it should be considered as cosmopolitan genera. According to literature data [100], R. irregularis and R. intraradices species have been identified in many ecosystems of the world. The Entrophospora genus should be mentioned separately. This is a monophyletic group which has recently been included in AMF [101], and later assigned to the new order of the Entrophosporales (according to some sources, along with Claroideoglomus; [39]). The study of the Paraglomus genus is of a particular interest because its sequences in the NCBI database for ITS regions are not enough for accurate species identification (there are only 3 species out of 9 known by morphology of spores in the database). All AMF of these genera have a significant number of reads in the data sets obtained for the STPs of the North Caucasus (Tables S4 and S6). Furthermore the list of the most represented genera in the ecosystems of the Andes [57] differs from genera in the biotopes of the North Caucasus (Rhizophagus, Dominikia, and Glomus; see Tables S5 and S7). The following genera can be found in the Andes: Acaulospora (>50% reads; the genus is characteristic of high zones), Claroideoglomus, Cetraspora, Rhizophagus [57]. In the Southern Central zone of Chile, the main AMF genera were Acaulospora and Glomus [42]. In Yucatan, Mexico, the main AMF genera associated with tree roots were the others: Glomus, Sclerocystis, Rhizophagus, Redeckera, and Diversispora [17]. In Mt. Taibai of Qinling Mountain, China, the main AMF genera were: Glomus, Septoglomus, Acaulospora, Ambispora, and Rhizophagus [102]. We can assume that mountain biotopes differ significantly in the composition of AMF genera.
Comparative analysis of biotopes revealed common features in the species composition for ecosystems of the same type (Table S4 and S6). In addition to the known species, we identified 52 species-level VTs assigned to 12 genera (for the ITS1 and ITS2 regions). Virtual taxa found in the ecosystems of the North Caucasus, a temperate biodiversity hotspot, are also important because it may represent new, previously unknown uncharacterised AMF species. So in the study in Yucatan, Mexico, Lara-Pérez et al. [17] identified 36 VTs, belonging to 9 genera (for 18S region) were identified. In the Serengeti National Park, Tanzania, Stevens et al. [21] identified 39 VTs (for the SSU region); in the High Arctic, the Zackenberg valley, Northeast Greenland, Rasmussen et al. [43] identified 29 VTs (for SSU region); in the Middle Caquetá River region and the municipality of Leticia, the Colombian Amazon region, Peña-Venegas et al. [20] identified 126 VTs (for SSU region), but the application of SSU as a barcode did not allow the identification of AMF to the species level. The composition of morphological and molecular genetic approaches can significantly expand the possibilities of AMF identification. For examples, in the Iron triangle region, Brazil, Vieira et al. [27] found as many as 62 AMF species from 18 genera (for region 25S).
According to experimental results, for any type of data calculation (reads, OTUs, the number of precisely defined AMF species, the total number of species taking into account the number of virtual AMF taxa at the species level, the values of biodiversity indices), forest ecosystems have the least AMF biodiversity, and river valley ecosystems, on the contrary, have the highest AMF biodiversity. However, according to the estimated species richness (Table S9), the subalpine meadow had equally high diversity with that for river valley meadows. Based on the analysis of over 2 million valid sequences with an average sequence length of 216 bp for each sample, it was shown that the subalpine meadow (2,635 m above sea level) on the western slope of Helan Mountain in Alxa Left Banner, Inner Mongolia Autonomous Region, had the highest diversity according to the Shannon index, the ACE and Chao1 indices, though it manifested the smallest Simpson index [49].
4.3. Reasons for Higher AMF Diversity in River Valley Biotopes
To elucidate the reasons for the taxonomic diversity of AMF, we analyzed a number of factors that could potentially be important. Such abiotic and biotic factors include: climatic conditions, agrochemical composition of soils, human activity, and composition of plant communities [46–49]. Provided multivariate analysis of variance revealed that the STPs of one biotope (subalpine meadow /forest /river valley) are clustered by the number of OTUs in the space obtained using multidimensional scaling (MDS-Spearman). Correlation analysis indicated a significant (P<0.01 for ITS1) positive relationship between soil acidity (pHKCl) and AMF species richness (Figures S6 and S7), and in some cases of AMF biodiversity indicators with the level of available P for plants (“Pi, mg/kg”; Table S10). The effect of other agrochemical soil parameters, and also the altitude of the STPs was weaker or absent (Table S10).
The list of possible reasons for high AMF diversity in a river valley:
- (1)
- Human activity (livestock grazing, etc.) is much more developed in river valleys than in mountain forests and subalpine meadows [12]. The invasion of AM fungi by transferring spores on human shoes and hooves of livestock (cows, horses, etc.) is quite common [48,103]. However, some evidances indicate that ungulate grazing may be associated with the decrease of AM fungal abundance in soil [21]. Along with that AMF spores can migrate with water flows from the mountains to the river valley during erosion [103–105] and after sedimentation it actively enter into nonspecific symbiotic relationship. It is developed despite the fact that the organic reserves in these ecosystems are much higher because of livestock grazing, moreover the ecosystems themselves may have signs of soil degradation and are considered to be disturbed. Nevertheless, AM fungi spores, as a rule, are significantly larger (>40 microns) than the spores of many other fungi, so their distribution distance is relatively short [106]. According to Guo et al. [107], terrain slope can also affect AMF diversity. The biotopes of the river valley analyzed in our study were characterized by much more gentle slope in contrast to the biotopes of subalpine meadows and forests (Table S2). Therefore, it can be assumed that a flat slope will have a positive correlation with AMF biodiversity.
- (2)
- In conditions of intensive percolation water regime and good drainage, there is no stagnation of water and oxygen deficiency in soil, negatively affecting the development of AM fungi [108,109]. The percolation water regime can reduce the content of available phosphate (Pi) in the soil, which makes root mycorrhization an important adaptation for P uptake. It is the water regime is typical for river valleys in the North Caucasus. The correlation between the parameters of AMF biodiversity and “Pi, mg/kg” (inorganic P available for plant nutrition) in many cases was significantly (P<0.05) positive (Table S10). Our data is consistent with results of Guo et al. in terms of that the diversity of AMF had a positive correlation with available P content [107]. Nevertheless, large-scale studies have shown that AMF diversity and abundance decrease with phosphorus available in the soil [Ma et al., 2023]. This issue requires further consideration.
- (3)
- STPs altitude may be a factor influencing AM development. The analyzed biotopes of the forest and subalpine meadow located above the biotopes of the river valley were characterized by a reduced number of identified AMF at the species level (Figure 5 and Figure 6), although linear reliable correlations for the North Caucasus STPs were not found (Table S10). Our results are consistent with literature data [10,113–116]. Thus, AMF biodiversity was practically independent of altitude [50,54–57], or the correlations were negative [10,113–116]. However, this rule is not applicable for the Zackenberg valley in the High Arctic [43]: with an increase in altitude from 33 to 479 m (a small altitude above the sea level), an increase in AM fungi occurrence was observed. Perhaps the reason for the lack of correlation between altitude and AMF biodiversity in the North Caucasus is that there are no biotopes of alpine meadows in the analyzed STPs, which are characterized by lower temperatures. However temperature is considered an important factor for the development of AM [109,117,118]. The optimal average air temperature of the warmest month is +19 °C, but mycorrhizal colonization can be intensively increased with the frosty period not less than 2 months [119].
- (4)
- The biodiversity of AMF and the development of AM are affected by such factors as pollution, salinity, drought, extreme temperatures, CO2, liming, acidity, etc. [120], as well as soil composition, altitude, species composition of plant communities, climatic factors [46–49]. But it is pH, along with temperature, that are the main factors determining AMF biodiversity [59]. pH can have an important direct effect on the growth and productivity of the AM fungus [Wang et al., 1993; Coughlan et al., 2000]. The positive correlation between AMF diversity and pH is mentioned in [107,121]. This is consistent with our data on a significant positive correlation of the pHKCl with a number of biodiversity indicators (“Glomeromycota total reads”, “OTUs number for total species”, “total species number”, both for ITS1 and ITS2; Table S10; Figures S6 and S7).
- (5)
- The phenotypic diversity of OTU AMF is supposed to be under the effect of the phenotypic diversity of plants, which decreases with altitude in the mountains [122]. The colonization of root by AM fungi is not species–specific. The roots of one plant can be colonized by several species of AM fungi, and one AM fungus can colonize different plant species [123]. However, despite the absence of direct correlations between the diversity of AMF and the total number of herbaceous plants (Table S10), it might be expected a decrease in the spectrum of potential partners in the mutualistic symbiotic system, and thus affect AMF species diversity [124]. At the same time, annual plant species have a higher diversity of AMF than perennial plant species, and half of the currently identified AMF species may be more specific to one plant species [53]. Moreover, S. Horn et al. [50] demonstrated that the influence of biotic factors (interaction of AMF with plants) is more significant in comparison with the effect of abiotic factors on the composition of AMF genera. It is known that in the process of succession with an increase in the proportion of woody plants the density of AM fungi spores decreased [51,52]. Thus, higher abundance of annual plants (see “Percentage of annual plants” in Table S2) in river valleys in comparison with the biotopes of the subalpine meadow may be a key factor positively affecting AMF taxonomic diversity. Meanwhile, our studies confirm the relationship between the proportion of annual plant forms and the diversity of AMF. For instance, it was shown that the linear correlation coefficients were reliable (P<0.05; Table S10). The correlation coefficient between “Percentage of annual plants” and “Glomeromycota total reads” r = 0.76 and 0.81 (for ITS1 and ITS2, respectively), and the correlation coefficient between “Percentage of annual plants” and “OTUs number (for total species)” r = 0.67 и 0.77 (for ITS1 and ITS2, respectively). A weak correlation between the proportion of annual plants and AMF species diversity was also shown (r = 0.40 and 0.56 for ITS1 and ITS2, respectively; see Table S10). Similar results were obtained in [42]: the “natural grassland” ecosystem had the highest AMF species diversity among 20 ecosystems of interest. The opposite is also possible. It is shown that in the Teberdinsky National Park, experimental suppression of AM symbiosis always is followed by a decrease in the species richness and number of plants [125]. The observations of OTU diversity in the studied territories in a different season may provide new information, since the species composition and numerical ratios of different OTUs may alter due to the season [126,127]. Changes in the mycorrhization of plants by AM fungi thrughout a year in the Teberdinsky National Park have already been studied earlier [81], but their biodiversity has not been assessed.
4.4. Practical Application of the Results of AMF Biodiversity Research
Rhizophagus irregularis, Funneliformis mosseae and Gigaspora margarita are the species that are most often used in biological preparations to enhance plant growth [44,128–132]. Meanwhile, the results of this study showed that among 10 million of sequences the ones with F. mosseae and Gi. margarita are extremely rare, which requires special attention of researchers, because these fungi are isolated from soils much more often by morphological methods. The isolation of AMF from the analyzed STPs, we collected a large number of R. irregularis spores, a few F. mosseae spores, but failed to isolate Gi. margarita spores from the roots of plants in the North Caucasus (unpublished data). Universal primers are, perhaps, less suitable for sequencing these two species. Other authors reported that these species may be absent [22,23], or rarely occur in the sequencing results, despite the fact that they are identified by morphological methods [9,17,21], or not all species of Gigaspora and Funneliformis genera are found [16,20,27]. Thus, we can assume that the application of universal primers (for ITS1 and ITS2 regions) make it possible to assess AMF biodiversity. In the case of studying a single new species, it may be useful to analyze, for example, the LSU region [77] as another barcoding region.
5. Conclusions
The investigation of the North Caucasus region, in the Teberdinsky National Park and adjacent territories of Karachay-Cherkessia, revealed a significant number of AMF species were identified for the first time: 50 species from 20 genera in three biotopes, like subalpine meadow, forest and river valley. It represented at least 15% of the world species diversity of AMF (from 45% of known genera). Thus the biotopes of the North Caucasus should be considered as a native temperate biodiversity hotspot not only of plants and animals, but also of AM fungi. Modification of the molecular genetic identification of AMF showed the effectiveness of the proposed algorithm (Figure S1), including: 1) using Illumina MiSeq simultaneously for two barcodes (ITS1 and ITS2 regions); 2) inclusion of analysis for genera phylogenetic trees as a separate step as a part of species identification algorithm; 3) selection of sequences from the MaarjAM database as OTUs centroids, which made it possible to use about 15% of reliable singletons and thereby minimize losses of true AMF species. The list of species identified in all biotopes includes: Acaulospora paulinae, Claroideoglomus claroideum, C. lamellosum, Dominikia indica, Glomus hoi, Paraglomus laccatum, Rhizophagus irregularis, R. melanus, R. intraradices. The dominant species, R. intraradices, R. irregularis and D. indica The species specific (endemic) for certain biotopes were identified: 7 species – for biotopes of the subalpine meadow, 4 – in the forest and 17 – for disturbed ecosystems, pastures in the river valley biotopes (Table S8). 52 virtual taxa of the species level were also found, assigned to 12 genera. These taxa may include previously unknown AMF species. Correlation analysis revealed that the main reasons for the high biodiversity in river valleys can be as follows: 1) a higher proportion of annual plant species in river valleys in comparison with biotopes of subalpine meadows and forests, since it is annual plant species that have a higher diversity of AMF than perennial ones; 2) disturbance of river valley biotopes (active grazing on pastures) in contrast to undisturbed biotopes of forests and subalpine meadows, that is a sign of the process of regenerative succession, in which the role of AMF is high; 3) positive correlation of AMF diversity with pH in the soil. Our data prove the importance of future investigations in the North Caucasus region, in the Teberdinsky National Park and adjacent territories of Karachay-Cherkessia. Accumulated data will contribute to the expansion of our knowledge about the role of AMF involvement in the formation of natural biotopes.
Supplementary Materials
The following supporting information can be downloaded at: www.mdpi.com/xxx/s1, Figure S1: The algorithm of AM fungi identification, Table S1: Soil characteristics for analyzed stationary trial plots in the sampling horizon 0-10 cm, Table S2: Characteristics of stationary trial plots and plant communities, Table S3: Average and largest p-distances in ITS1 and ITS2 regions for various AMF genera, Figure S2. Samples representation in low dimensional space revealed from MDS (Multidimesional scaling). Spearman’s distance (1-rho) was used as metric of dissimilarity between OTUs profiles (A – ITS1, B - ITS2). Figure S3. Score plots from PCA of OTUs profiles (A – ITS1, B – ITS2). Figure S4. The relative abundance (%) of OTUs of main fungal phyla in regions ITS1 (A) and ITS2 (B) in three tested biotopes. Figure S5. The relative abundance (%) of OTUs of various fungal classes in regions ITS1 (A) and ITS2 (B) in three tested biotopes. Figure S2: Maximum Likelihood phylogenetic tree built that represent OTUs of Ambispora genus identified for ITS1 region, Figure S3: ML phylogenetic tree built that represent OTUs of Ambispora genus identified for ITS2 region, Figure S4: ML phylogenetic tree built that represent OTUs of Acaulospora genus identified for ITS1 region, Figure S5: ML phylogenetic tree built that represent OTUs of Acaulospora genus identified for ITS2 region, Figure S6: Dependencies between agrochemical parameters of rhizosphere soil and numbers of species and OTUs (for ITS1 region), Figure S7: Dependencies between agrochemical parameters of rhizosphere soil and numbers of species and OTUs (for ITS2 region), Table S4: Identification of arbuscular mycorrhizal fungi: species list according to OTUs founded by ITS1 analysis, Table S5: Identification of arbuscular mycorrhizal fungi: genera list according to OTUs founded by ITS1 analysis, Table S6: Identification of arbuscular mycorrhizal fungi: species list according to OTUs founded by ITS2 analysis, Table S7: Identification of arbuscular mycorrhizal fungi: genera list according to OTUs founded by ITS2 analysis, Table S8: List of common and endemicspecies (except VT) ranked by decreasing number of OTUs, Table S9: Observed and extrapolated values of species richness, Shannon diversity and Simpson diversity by OTUs, Table S10: Linear correlation coefficients (r) between AMF biodiversity parameters, plant biodiversity parameters and agrochemical indicators of STPs. Table S11. The advantages and disadvantages of molecular genetic methods using Illumina MiSeq to identify AMF species in comparison with morphological methods.
Author Contributions
Conceptualization, A.Y., A.A.K., P.Z., Y.M., A.R., T.B. and M.S.; methodology, A.A.K., A.Y., P.Z. and Y.M.; software, A.Y. and A.A.K.; validation, P.Z., Y.M., R.P. and A.A.K.; formal analysis, A.Y., P.Z., Y.M., A.A.K., A.O.G., T.K., A.I.K., A.I.G., E.B., Y.L., R.P. and M.S.; investigation, A.A.K., A.O.G., T.K., A.I.K., A.I.G., E.B. and T.B.; resources, A.Y.; data curation, A.Y., A.A.K., P.Z. and Y.M.; writing—original draft preparation, A.Y., A.A.K., A.O.G., P.Z., Y.M., O.Y. and A.R.; writing—review and editing, A.Y., A.A.K. and M.S.; visualization, A.Y., P.Z., Y.M. and R.P.; supervision, A.Y., A.R. and M.S.; project administration, A.Y. and A.A.K.; funding acquisition, A.Y. All authors have read and agreed to the published version of the manuscript.
Funding
This research was funded by the Russian Science Foundation (RSF, grant number 22-16-00064).
Institutional Review Board Statement
Not applicable.
Informed Consent Statement
Not applicable.
Data Availability Statement
Not applicable.
Acknowledgments
The research was performed using equipment from the Core Center “Genomic Technologies, Proteomics and Cell Biology” in ARRIAM and equipment from the Research Park “Center for Molecular and Cell Technologies” in Saint Petersburg State University.
Conflicts of Interest
The authors declare no conflict of interest.
References
- Myers, N.; Mittermeier, R.A.; Mittermeier, C.G.G.; da Fonseca, A.; Kent, J. Biodiversity hotspots for conservation priorities. Nature 2000, 403, 853–858. [Google Scholar] [CrossRef]
- Marchese, C. Biodiversity hotspots: A shortcut for a more complicated concept. Glob. Ecol. Conserv. 2015, 3, 297–309. [Google Scholar] [CrossRef]
- Myers, N. Threatened biotas: “Hot spots” in tropical forests. Environ. 1988, 83(8), 187–208. [Google Scholar] [CrossRef]
- CEPF (Critical Ecosystem Parthnership Fund). Explore the Biodiversity Hotspots. 2023. Available online: https://www.cepf.net/our-work/biodiversity-hotspots (accessed on 30 October 2023).
- Stork, N.E.; Habel, J.C. Can biodiversity hotspots protect more than tropical forest plants and vertebrates? J. Biogeogr. 2014, 41, 421–428. [Google Scholar] [CrossRef]
- Brundrett, M.C.; Tedersoo, L. Evolutionary history of mycorrhizal symbioses and global host plant diversity. New Phytol. 2018, 220, 1108–1115. [Google Scholar] [CrossRef]
- Newshan, K.K.; Fitter, A.H.; Watkinson, A.R. Multi-functionality and biodiversity in arbuscular mycorrhizas. Review. Trends Ecol. Evol. 1995, 10(10), 407–411. [Google Scholar] [CrossRef]
- De Carvalho, F.; de Souza, F.A.; Carrenho, R.; Escobar, I.E.C.; Oehl, F.; da Silva, G.A. The mosaic of habitats in the high-altitude Brazilian rupestrian fields is a hotspot for arbuscular mycorrhizal fungi. Appl. Soil Ecol. 2012, 52, 9–19. [Google Scholar]
- Bonfim, J.A.; Vasconcellos, R.L.F.; Gumiere, T.; Mescolotti, D.L.C.; Oehl, F.; Cardoso, E.J.B.N. Diversity of arbuscular mycorrhizal fungi in a brazilian atlantic forest toposequence. Microb. Ecol. 2016, 71, 164–177. [Google Scholar] [CrossRef]
- Vieira, L. C. , da Silva, D. K. A., de Melo, M. A. C., Escobar, I. E. C., Oehl, F., da Silva, G. A. Edaphic factors influence the distribution of arbuscular mycorrhizal fungi along an altitudinal gradient of a Tropical Mountain. Microb. Ecol. 2019, 78, 904–913. [Google Scholar] [CrossRef]
- Zazanashvili, N. The Caucasus hotspot. In Status and Protection of Globally Threatened Species in the Caucasus; Zazanashvili, N., Mallon, D., Eds.; Contour Ltd.: Tbilisi, Georgia, 2004; pp. 15–25. [Google Scholar]
- Zernov, A.S.; Alekseev, Yu.E.; Onipchenko, V.G. The determinant of vascular plants of the Karachay-Cherkessia Republic; Association of Scientific Publications “KMK”: Moscow, Russia, 2015. [Google Scholar]
- Vasar, M.; Davison, J.; Sepp, S.-K.; Oja, J.; Al-Quraishy, S.; Bueno, C.G.; Cantero, J.J.; Fabiano, E.C.; Decocq, G.; Fraser, L.; Hiiesalu, I.; Hozzein, W.N.; Koorem, K.; Moora, M.; Mucina, L.; Onipchenko, V.; Öpik, M.; Pärtel, M.; Phosri, C.; Vahter, T.; Tedersoo, L.; Zobel, M. Global taxonomic and phylogenetic assembly of AM fungi. Mycorrhiza 2022, 32, 135–144. [Google Scholar] [CrossRef]
- Tedersoo, L.; Mikryukov, V.; Anslan, S.; Bahram, M.; Khalid, A.N.; Corrales, A.; Agan, A.; Vasco-Palacios, A.-M.; Saitta, A.; Antonelli, A.; et al. The Global Soil Mycobiome consortium dataset for boosting fungal diversity research. Fungal Divers. 2021, 111, 573–588. [Google Scholar] [CrossRef]
- Rożek, K.; Błaszkowski, J.; Nowak, A.; Zalewska-Gałosz, J.; Nobis, M.; Mleczko, P.; Zubek, S. Arbuscular mycorrhizal fungi in Georgia, the Caucasus region: The first report of species diversity and root colonization. Nov. Hedwigia. 2018, 106, 473–483. [Google Scholar] [CrossRef]
- Bidondo, L.F.; Colombo, R.P.; Recchi, R.; Silvani, V.A.; Pérgola, M.; Martínez, A.; Godeas, A.M. Detection of arbuscular mycorrhizal fungi associated with pecan (Carya illinoinensis) trees by molecular and morphological approaches. MycoKeys 2018, 42, 73–88. [Google Scholar] [CrossRef]
- Lara-Pérez, L.A.; Oros-Ortega, I.; Córdova-Lara, I.; Estrada-Medina, H.; O'Connor-Sánchez, A.; Góngora-Castillo, E.; Sáenz-Carbonell, L. Seasonal shifts of arbuscular mycorrhizal fungi in Cocos nucifera roots in Yucatan, Mexico. Mycorrhiza 2020, 30, 269–283. [Google Scholar] [CrossRef]
- Nam, Y.J.; Kim, H.; Lee, J.H.; Yoon, H.; Kim, J.-G. Metagenomic analysis of soil fungal communities on Ulleungdo and Dokdo Islands. J. Gen. Appl. Microbiol. 2015, 61, 67–74. [Google Scholar] [CrossRef]
- Botnen, S.; Kauserud, H.; Carlsen, T.; Blaalid, R.; Høiland, K. Mycorrhizal fungal communities in coastal sand dunes and heaths investigated by pyrosequencing analyses. Mycorrhiza 2015, 25, 447–456. [Google Scholar] [CrossRef]
- Peña-Venegas, C.P.; Kuyper, T.W.; Davison, J.; Jairus, T.; Vasar, M.; Stomph, T.J.; Struik, P.C.; Öpik, M. Distinct arbuscular mycorrhizal fungal communities associate with different manioc landraces and Amazonian soils. Mycorrhiza 2019, 29, 263–275. [Google Scholar] [CrossRef]
- Stevens, B.M.; Propster, J.R.; Öpik, O.; Wilson, G.W.T.; Alloway, S.L.; Mayemba, E.; Johnson, N.C. Arbuscular mycorrhizal fungi in roots and soil respond differently to biotic and abiotic factors in the Serengeti. Mycorrhiza 2020, 30, 79–95. [Google Scholar] [CrossRef]
- Ji, L.; Zhang, Y.; Yang, Y.; Yang, L.; Yang, N.; Zhang, D. Long-term effects of mixed planting on arbuscular mycorrhizal fungal communities in the roots and soils of Juglans mandshurica plantations. BMC Microbiol. 2020, 20(1), 304. [Google Scholar] [CrossRef]
- Xu, Z.; Lv, Y.; Fang, M.; Lui, J.; Zeng, H.; Ban, Y. Diverse and abundant arbuscular mycorrhizal fungi in ecological floating beds used to treat eutrophic water. Appl. Microbiol. Biotechnol. 2021, 105, 6959–6975. [Google Scholar] [CrossRef]
- Kolaříková, Z.; Slavíková, R.; Krüger, C.; Krüger, M.; Kohout, P. PacBio sequencing of Glomeromycota rDNA: a novel amplicon covering all widely used ribosomal barcoding regions and its applicability in taxonomy and ecology of arbuscular mycorrhizal fungi. New Phytol. 2021, 231, 490–499. [Google Scholar] [CrossRef]
- Baldrian, P.; Větrovský, T.; Lepinay, C.; Kohout, P. High-throughput sequencing view on the magnitude of global fungal diversity. Fungal Divers. 2022, 114, 539–547. [Google Scholar] [CrossRef]
- Alaux, P.-L.; Mison, C.; Senés-Guerrero, C.; Moreau, V.; Manssens, G.; Foucart, G.; Cranenbrouck, S.; Declerck, S. Diversity and species composition of arbuscular mycorrhizal fungi across maize fields in the southern part of Belgium. Mycorrhiza 2021, 31, 265–272. [Google Scholar] [CrossRef]
- Vieira, C.K.; Marascalchi, M.N.; Rodrigues, A.V.; de Armas, R.D.; Stürmer, S.L. Morphological and molecular diversity of arbuscular mycorrhizal fungi in revegetated iron-mining site has the same magnitude of adjacent pristine ecosystems. J. Environ. Sci. (China) 2018, 67, 330–343. [Google Scholar] [CrossRef]
- Morgan, B.S.T.; Egerton-Warburton, L.M. Barcoded NS31/AML2 primers for sequencing of arbuscular mycorrhizal communities in environmental samples. Appl. Plant Sci. 2017, 5, 1700017. [Google Scholar] [CrossRef]
- Magurno, F.; Malicka, M.; Posta, K.; Wozniak, G.; Lumini, E.; Piotrowska-Seget, Z. Glomalin gene as molecular marker for functional diversity of arbuscular mycorrhizal fungi in soil. Biol. Fertil. Soils. 2019, 554(55), 411–417. [Google Scholar] [CrossRef]
- Schüßler, A. Glomeromycota species list. Available online: http://www.amf-phylogeny.com and https://docs.google.com/spreadsheets/d/1vHHj9XtfIYj9B60L7UP4rUci8bJeolUP/edit#gid=626676380, last updated 14 Jan 2023 (accessed on 30 October 2023).
- GenBank NCBI. 2023. Available online: https://www.ncbi.nlm.nih.gov/genbank (accessed on 30 October 2023).
- Stockinger, H.; Krüger, M.; Schüssler, A. DNA barcoding of arbuscular mycorrhizal fungi. New Phytol. 2010, 187(2), 461–474. [Google Scholar] [CrossRef]
- Borriello, R.; Bianciotto, V.; Orgiazzi, A.; Lumini, E.; Bergero, R. Sequencing and comparison of the mitochondrial COI gene from isolates of Arbuscular Mycorrhizal Fungi belonging to Gigasporaceae and Glomeraceae families. Mol. Phylogenet. Evol. 2014, 75, 1–10. [Google Scholar] [CrossRef]
- Börstler, B.; Thiéry, O.; Sýkorová, Z.; Berner, A.; Redecker, D. Diversity of mitochondrial large subunit rDNA haplotypes of Glomus intraradices in two agricultural field experiments and two semi-natural grasslands. Mol. Ecol. 2010, 19(7), 1497–1511. [Google Scholar] [CrossRef]
- James, T.Y.; Kauff, F.; Schoch, C.L.; Matheny, P.B.; Hofstetter, V.; Cox, C.J.; Celio, G.; Gueidan, C.; Fraker, E., Miadlikowska J.; et al. Reconstructing the early evolution of Fungi using a six-gene phylogeny. Nature 2006, 443(7113), 818–822. [Google Scholar] [CrossRef]
- Sokolski, S.; Dalpé, Y.; Séguin, S.; Khasa, D.; Lévesque, C.A.; Piché, Y. Conspecificity of DAOM 197198, the model arbuscular mycorrhizal fungus, with Glomus irregulare: molecular evidence with three protein-encoding genes. Botany 2010, 88(9), 829–838. [Google Scholar] [CrossRef]
- Msiska, Z.; Morton, J. Phylogenetic analysis of the Glomeromycota by a partial beta-tubulin gene. Mycorrhiza 2009, 19(4), 247–254. [Google Scholar] [CrossRef]
- Öpik, M.; Davison, J.; Moora, M.; Zobel, M. DNA-based detection and identification of Glomeromycota: the virtual taxonomy of environmental sequences. Botany 2014, 92(2), 135–147. [Google Scholar] [CrossRef]
- Błaszkowski, J.; Sánchez-García, M.; Niezgoda, P.; Zubek, S.; Fernández, F.; Vila, A.; Al-Yahya'ei, M.N.; Symanczik, S.; Milczarski, P.; Malinowski, R.; Cabello, M.; Goto, B.T.; Casieri, L.; Malicka, M.; Bierza, W.; Magurno, F. A new order, Entrophosporales, and three new Entrophospora species in Glomeromycota. Front. Microbiol. 2022, 13, 962856. [Google Scholar] [CrossRef]
- Błaszkowski, J.; Jobim, K.; Niezgoda, P.; Meller, E.; Malinowski, R.; Milczarski, P.; Zubek, S.; Magurno, F.; Casieri, L.; Bierza, W.; Błaszkowski, T.; Crossay, T.; Goto, B.T. New glomeromycotan taxa, Dominikia glomerocarpica sp. nov. and Epigeocarpum crypticum gen. nov. et sp. nov. from Brazil, and Silvaspora gen. nov. from New Caledonia. Front. Microbiol. 2021, 12, 655–910. [Google Scholar] [CrossRef]
- Spatafora, J.W.; Chang, Y.; Benny, G.L.; Lazarus, K.; Smith, M.E.; Berbee, M.L.; Bonito, G.; Corradi, N.; Grigoriev, I.; Gryganskyi, A.; James, T.Y.; O'Donnell, K.; Roberson, R.W.; Taylor, T.N.; Uehling, J.; Vilgalys, R.; White, M.M.; Stajich, J.E. A phylum-level phylogenetic classification of zygomycete fungi based on genome-scale data. Mycologia 2016, 108(5), 1028–1046. [Google Scholar]
- Castillo, C.G.; Borie, F.; Oehl, F.; Sieverding, E. Arbuscular mycorrhizal fungi biodiversity: prospecting in Southern-Central zone of Chile. A review. J. Soil Sci. Plant Nutr. 2016, 16(2), 400–422. [Google Scholar] [CrossRef]
- Rasmussen, P.U.; Abrego, N.; Roslin, T.; Opik, M.; Sepp, S.-K.; Blanchet, F.G.; Huotari, T.; Hugerth, L.W.; Tack, A.J.M. Elevation and plant species identity jointly shape a diverse arbuscular mycorrhizal fungal community in the High Arctic. New Phytol. 2022, 236, 671–683. [Google Scholar] [CrossRef]
- Öpik, M.; Vanatoa, A.; Vanatoa, E.; Moora, M.; Davison, J.; Kalwij, J.M.; Reier, U.; Zobel, M. The online database MaarjAM reveals global and ecosystemic distribution patterns in arbuscular mycorrhizal fungi (Glomeromycota). New Phytol. 2010, 188, 223–241. [Google Scholar] [CrossRef]
- MaarjAM Database. 2023. Available online: http://maarjam.botany.ut.ee (accessed on 30 October 2023).
- Kruger, C.; Kohout, P.; Janouskova, M.; Puschel, D.; Frouz, J.; Rydlova, J. Plant communities rather than soil properties structure arbuscular mycorrhizal fungal communities along primary succession on a mine spoil. Front. Microbiol. 2017, 8, 719. [Google Scholar] [CrossRef]
- Ezeokoli, O.T.; Nwangburuka, C.C.; Adeleke, R.A.; Roopnarain, A.; Paterson, D.G.; Maboeta, M.S.; Bezuidenhout, C.C. Assessment of arbuscular mycorrhizal fungal spore density and viability in soil stockpiles of south African opencast coal mines. South African J. Plant Soil 2019, 36, 91–99. [Google Scholar] [CrossRef]
- Clavel, J.; Lembrechts, J.; Alexander, J.; Haider, S.; Lenoir, J.; Milbau, A.; Nuñez, M.A.; Pauchard, A.; Nijs, I.; Verbruggen, E. The role of arbuscular mycorrhizal fungi in nonnative plant invasion along mountain roads. New Phytol. 2021, 230(3), 1156–1168. [Google Scholar] [CrossRef]
- Yan, P.; Hou, H.; Lv, Y.; Zhang, H.; Li, J.; Shao, L.; Xie, Q.; Liang, Y.; Li, J.; Ni, X. Diversity characteristics of arbuscular mycorrhizal fungi communities in the soil along successional altitudes of Helan Mountain, arid, and semi-arid regions of China. Front. Microbiol. 2023, 14, 1099131. [Google Scholar] [CrossRef]
- Horn, S.; Caruso, T.; Verbruggen, E.; Rillig, M.C.; Hempel, S. Arbuscular mycorrhizal fungal communities are phylogenetically clustered at small scales. ISME J. 2014, 8(11), 2231–2242. [Google Scholar] [CrossRef]
- Zangaro, W.; Assis, R.; Rostirola, L.; Souza, P.; Gonçalves, M.; Andrade, G.; Nogueira, M. Changes in arbuscular mycorrhizal associations and fine root traits in sites under different plant successional phases in southern Brazil. Mycorrhiza 2008, 19, 37–45. [Google Scholar] [CrossRef]
- Zangaro, W.; Rostirola, L.; Souza, P.; Almeida Alves, R.; Lescano, L.; Rondina, A.; Nogueira, M.; Carrenho, R. Root colonization and spore abundance of arbuscular mycorrhizal fungi in distinct successional stages from an Atlantic rainforest biome in southern Brazil. Mycorrhiza 2013, 23, 221–233. [Google Scholar] [CrossRef]
- Torrecillas, E.; Alguacil, M.M.; Roldan, A. Differences in the AMF diversity in soil and roots between two annual and perennial gramineous plants co-occurring in a Mediterranean, semiarid degraded area. Plant Soil 2012, 354, 97–106. [Google Scholar] [CrossRef]
- Gai, J.P.; Tian, H.; Yang, F.Y.; Christie, P.; Li, X.L.; Klironomos, J.N. Arbuscular mycorrhizal fungal diversity along a Tibetan elevation gradient. Pedobiol. 2012, 55, 145–151. [Google Scholar] [CrossRef]
- Coutinho, E.S.; Fernandes, G.W.; Berbara, R.L.L.; Valerio, H.M.; Goto, B.T. Variation of arbuscular mycorrhizal fungal communities along an altitudinal gradient in rupestrian grasslands in Brazil. Mycorrhiza 2015, 25, 627–638. [Google Scholar] [CrossRef] [PubMed]
- Shen, C.C.; Ni, Y.Y.; Liang, W.J.; Wang, J.J.; Chu, H.Y. Distinct soil bacterial communities along a small-scale elevational gradient in alpine tundra. Front. Microbiol. 2015, 6, 582. [Google Scholar] [CrossRef]
- Senés-Guerrero, C.; Schüßler, A. A conserved arbuscular mycorrhizal fungal core-species community colonizes potato roots in the Andes. Fungal Divers. 2015, 77(1), 317–333. [Google Scholar] [CrossRef]
- Zernov, A.S. Flora of the North-West Caucasus; Association of Scientific Publications “KMK”: Moscow, Russia, 2006. [Google Scholar]
- Davison, J.; Moora, M.; Semchenko, M.; Adenan, S.B.; Ahmed, T.; Akhmetzhanova, A.A.; Alatalo, J.M.; Al-Quraishy, S.; Andriyanova, E.; Anslan, S.; et al. Temperature and pH define the realised niche space of arbuscular mycorrhizal fungi. New Phytol. 2021, 231(2), 763–776. [Google Scholar] [CrossRef]
- Sokolov, A.V. Agrochemical Methods of Soil Studies; Nauka: Moscow, Russia, 1975. [Google Scholar]
- Maniatis, T.; Fritsch, E.F.; Sambrook, J. Molecular Cloning, A Laboratory Manual. Cold Spring Harbor Laboratory: NY, USA, 1982.
- Kryukov, A.A.; Gorbunova, A.O.; Machs, E.M.; Mikhaylova, Y.V.; Rodionov, A.V.; Zhurbenko, P.M.; Yurkov, A.P. Perspectives of using Illumina MiSeq for identification of arbuscular mycorrhizal fungi. Vavilovskii Zhurnal Genet. Selektsii 2020, 24(2), 158–167. [Google Scholar]
- Edgar, R.C. Search and clustering orders of magnitude faster than BLAST. Bioinformatics 2010, 26(19), 2460–2461. [Google Scholar] [CrossRef]
- Edgar, R.C. UPARSE: highly accurate OTU sequences from microbial amplicon reads. Nat. Meth. 2013, 10, 996–998. [Google Scholar] [CrossRef]
- Bogusz, M.; Whelan, S. Phylogenetic tree estimation with and without alignment: new distance methods and benchmarking. Syst. Biol. 2017, 66(2), 218–231. [Google Scholar] [CrossRef] [PubMed]
- Nguyen, L.-T.; Schmidt, H.A.; von Haeseler, A.; Minh, B.Q. IQ-TREE: A fast and effective stochastic algorithm for estimating maximum likelihood phylogenies. Mol. Biol. Evol. 2015, 32, 268–274. [Google Scholar] [CrossRef]
- Nilsson, R.H.; Tedersoo, L.; Ryberg, M.; Kristiansson, E.; Hartmann, M.; Unterseher, M.; Porter, T.M.; Bengtsson-Palme, J.; Walker, D.M.; de Sousa, F.; Gamper, H.A.; Larsson, E.; Larsson, K.H.; Kõljalg, U.; Edgar, R.C.; Abarenkov, K. A comprehensive, automatically updated fungal ITS sequence dataset for reference-based chimera control in environmental sequencing efforts. Microbes Environ. 2015, 30(2), 140–150. [Google Scholar] [CrossRef]
- MEGA, Molecular Evolutionary Genetics Analysis. 2023. Available online: https://www.megasoftware.net (accessed on 30 October 2023).
- Yan, L.; Kenchanmane Raju, S.K.; Lai, X.; Zhang, Y.; Dai, X.; Rodriguez, O.; Mahboub, S.; Roston, R.L.; Schnable, J.C. Parallels between natural selection in the cold-adapted crop-wild relative Tripsacum dactyloides and artificial selection in temperate adapted maize. Plant J. 2019, 99(5), 965–977. [Google Scholar] [CrossRef]
- Hsieh, T.C.; Ma, K.H.; Chao, A. iNEXT: an R package for rarefaction and extrapolation of species diversity (Hill numbers). Methods Ecol. Evol. 2016, 7(12), 1451–1456. [Google Scholar] [CrossRef]
- R Core Team. R: A language and environment for statistical computing. R Foundation for Statistical Computing, Vienna, Austria. 2023. Available online: https://www.R-project.org (accessed on 30 October 2023).
- Stacklies, W.; Redestig, H.; Scholz, M.; Walther, D.; Selbig, J. pca Methods – a Bioconductor package providing PCA methods for incomplete data. Bioinformatics 2007, 23, 1164–1167. [Google Scholar] [CrossRef]
- Galili, T. dendextend: an R package for visualizing, adjusting, and comparing trees of ierarchical clustering. Bioinformatics 2015, 31(22), 3718–3720. [Google Scholar] [CrossRef]
- Wickham, H. ggplot2: Elegant Graphics for Data Analysis, 2nd ed.; Springer-Verlag: NY, USA, 2016. [Google Scholar]
- Chen, H.; Boutros, P.C. VennDiagram: a package for the generation of highly-customizable Venn and Euler diagrams in R. BMC Bioinformatics 2011, 12, 35. [Google Scholar] [CrossRef]
- Alberdi, A.; Aizpurua, O.; Gilbert, M.; Bohmann, K. Scrutinizing key steps for reliable metabarcoding of environmental samples. Methods Ecol. Evol. 2018, 9, 134–147. [Google Scholar] [CrossRef]
- Delavaux, C.S.; Ramos, R.J.; Sturmer, S.L.; Bever, J.D. Environmental identification of arbuscular mycorrhizal fungi using the LSU rDNA gene region: an expanded database and improved pipeline. Mycorrhiza 2022, 32(2), 145–153. [Google Scholar] [CrossRef]
- Krüger, M.; Stockinger, H.; Krüger, C.; Schüßler, A. DNA-based species level detection of Glomeromycota: one PCR primer set for all arbuscular mycorrhizal fungi. New Phytol. 2009, 183, 212–223. [Google Scholar] [CrossRef]
- Bruns, T.D.; Taylor, J.W. Comment on “Global assessment of arbuscular mycorrhizal fungus diversity reveals very low endemism”. Science 2016, 351, 826–826. [Google Scholar] [CrossRef]
- Schlaeppi, K.; Bender, S.F.; Mascher, F.; Russo, G.; Patrignani, A.; Camenzind, T.; Hempel, S.; Rillig, M.C.; Heijden, M.G. High-resolution community profiling of arbuscular mycorrhizal fungi. New Phytol. 2016, 212, 780–791. [Google Scholar] [CrossRef]
- Baikalova, A.S.; Onipchenko, V.G. Mycosymbiotrophism of alpine plants in the Teberda Nature Reserve. In Opyt issledovaniya rastitel’nykh soobshchestv v zapovednikakh (Study of Communities in Nature Reserves), Tr. Tsentr. Nauchno-Issled. Lab. Okhotn. Khoz. Zapoved., Moscow, Russia, 1988; 93–107.
- Onipchenko, V.G.; Guzhova, G.A.; Semenova, G.V.; Rabotnova, M.V. Population strategy of Alpine plants of the northwestern Caucasus. In Ekologiya populyatsii (Ecology of Populations); Nauka: Moscow, Russia, 1991; pp. 165–180. [Google Scholar]
- Onipchenko, V.G.; Zobel, M. Mycorrhiza, vegetative mobility and responses to disturbance of alpine plants in the Northwestern Caucasus. Folia Geobot. 2000, 35(1), 1–11. [Google Scholar] [CrossRef]
- Wipf, D.; Krajinski, F.; van Tuinen, D.; Recorbet, G.; Courty, P.E. Trading on the arbuscular mycorrhiza market: from arbuscules to common mycorrhizal networks. New Phytol. 2019, 223(3), 1127–1142. [Google Scholar] [CrossRef]
- Rosendahl, S. Communities, populations and individuals of arbuscular mycorrhizal fungi. New Phytol. 2008, 178(2), 253–266. [Google Scholar] [CrossRef]
- Mathieu, S.; Cusant, L.; Roux, C.; Corradi, N. Arbuscular mycorrhizal fungi: intraspecific diversity and pangenomes. New Phytol. 2018, 220(4), 1129–1134. [Google Scholar] [CrossRef]
- Schoen, C.; Montibeler, M.; Costa, M.D.; Antunes, P.M.; Stürmer, S.L. Inter and intra-specific variability in arbuscular mycorrhizal fungi affects hosts and soil health. Symbiosis 2021, 1–17. [Google Scholar] [CrossRef]
- Daubois, L.; Beaudet, D.; Hijri, M.; de la Providencia, I. Independent mitochondrial and nuclear exchanges arising in Rhizophagus irregularis crossed-isolates support the presence of a mitochondrial segregation mechanism. BMC Microbiol. 2016, 16(1), 1–12. [Google Scholar] [CrossRef]
- Yurkov, A.P.; Kryukov, A.A.; Gorbunova, A.O.; Kojemyakov, A.P.; Stepanova, G.V.; Machs, E.M.; Rodionov, A.V.; Shishova, M.F. Molecular genetic identification of arbuscular mycorrhizal fungi. Ecol. Genet. 2018, 16(2), 11–23. [Google Scholar] [CrossRef]
- Stockinger, H.; Walker, C.; Schüßler, A. 'Glomus intraradices DAOM197198', a model fungus in arbuscular mycorrhiza research, is not Glomus intraradices. New Phytol. 2009, 183(4), 1176–1187. [Google Scholar] [CrossRef]
- Hosny, M.; Gianinazzi-Pearson, V.; Dulieu, H. Nuclear DNA content of 11 fungal species in Glomales. Genome 1998, 41(3), 422–428. [Google Scholar] [CrossRef]
- Marleau, J.; Dalpé, Y.; St-Arnaud, M.; Hijri, M. Spore development and nuclear inheritance in arbuscular mycorrhizal fungi. BMC Evol. Biol. 2011, 11, 51. [Google Scholar] [CrossRef]
- Rodionov, A.V.; Amosova, A.V.; Krainova, L.M.; Machs, E.M.; Mikhailova, Yu.V.; Gnutikov, A.A.; Muravenko, O.V.; Loskutov, I.G. Phenomenon of multiple mutations in the 35S rRNA genes of the C subgenome of polyploid Avena L. species. Russ. J. Genet. 2020, 56(6), 674–683. [Google Scholar] [CrossRef]
- Borowska-Zuchowska, N.; Kovarik, A.; Robaszkiewicz, E.; Tuna, M.; Tuna, G.S.; Gordon, S.; Vogel, J.P.; Hasterok, R. The fate of 35S rRNA genes in the allotetraploid grass Brachypodium hybridum. Plant J. 2020, 103(5), 1810–1825. [Google Scholar] [CrossRef]
- Lunerova, J.; Renny-Byfield, S.; Matyášek, R.; Leitch, A.; Kovařík, A. Concerted evolution rapidly eliminates sequence variation in rDNA coding regions but not in intergenic spacers in Nicotiana tabacum allotetraploid. Plant Sys. Evol. 2017, 303(8), 1043–1060. [Google Scholar] [CrossRef]
- Robbins, C.; Corella, J.C.; Aletti, C.; Seiler, R.; Mateus, I.D.; Lee, S.J.; Masclaux, F.G.; Sanders, I.R. Generation of unequal nuclear genotype proportions in Rhizophagus irregularis progeny causes allelic imbalance in gene transcription. New Phytol. 2021, 231(5), 1984. [Google Scholar] [CrossRef]
- Chen, E.C.H.; Mathieu, S.; Hoffrichter, A.; Sedzielewska-Toro, K.; Peart, M.; Pelin, A.; Ndikumana, S.; Ropars, J.; Dreissig, S.; Fuchs, J.; Brachmann, A.; Corradi, N. Single nucleus sequencing reveals evidence of inter-nucleus recombination in arbuscular mycorrhizal fungi. eLife 2018, 7, e39813. [Google Scholar] [CrossRef]
- Tisserant, E.; Kohler, A.; Dozolme-Seddas, P.; Balestrini, R.; Benabdellah, K.; Colard, A.; Croll, D.; Da Silva, C.; Gomez, S.K.; Koul, R.; et al. The transcriptome of the arbuscular mycorrhizal fungus Glomus intraradices (DAOM 197198) reveals functional tradeoffs in an obligate symbiont. New Phytol. 2012, 193(3), 755–769. [Google Scholar] [CrossRef]
- Corradi, N.; Brachmann, A. Fungal mating in the most widespread plant symbionts? Trends Plant Sci. 2017, 22, 175–183. [Google Scholar] [CrossRef] [PubMed]
- Formey, D.; Molès, M.; Haouy, A.; Savelli, B.; Bouchez, O.; Bécard, G.; Roux, C. Comparative analysis of mitochondrial genomes of Rhizophagus irregularis – syn. Glomus irregulare – reveals a polymorphism induced by variability generating elements. New Phytol. 2012, 196(4), 1217–1227. [Google Scholar] [CrossRef]
- Sieverding, E.; Oehl, F. Revision of Entrophospora and description of Kuklospora and Intraspora, two new genera in the arbuscular mycorrhizal Glomeromycetes. J. Appl. Bot. Food Qual. 2006, 80(1), 69–81. [Google Scholar]
- Zhang, M.; Shi, Z.; Yang, M.; Lu, S.; Cao, L.; Wang, X. Molecular diversity and distribution of arbuscular mycorrhizal fungi at different elevations in Mt. Taibai of Qinling mountain. Front. Microbiol. 2021, 12, 609386. [Google Scholar] [CrossRef]
- Anderson, R.S.; Homola, R.L.; Davis, R.B.; Jacobson, Jr.G.L. Fossil remains of the mycorrhizal fungal Glomus fasciculatum complex in postglacial lake sediments from Maine. Rev. Can. Bot. 1984, 62, 2325–2328. [Google Scholar] [CrossRef]
- Miehe, G.; Miehe, S.; Kaiser, K.; Reudenbach, C.; Behrendes, L.; La, D.; Schlütz, F. How old is pastoralism in Tibet? An ecological approach to the making of a Tibetan landscape. Palaeogeogr. Palaeoclimatol. Palaeoecol. 2009, 276(1-4), 130–147. [CrossRef]
- Ghosh, R.; Paruya, D.K.; Acharya, K.; Ghorai, N.; Bera, S. How reliable are non-pollen palynomorphs in tracing vegetation changes and grazing activities? Study from the Darjeeling Himalaya, India. Palaeogeogr. Palaeoclimatol. Palaeoecol. 2017, 475, 23–40. [Google Scholar] [CrossRef]
- Gou, H.; Wei, H.; Duan, R.; Tianyuan, C. Spatial distribution of modern pollen and fungal spores and their ecological indication in Qinghai Lake on northeastern Tibetan Plateau, China. Ecol. Indic. 2022, 144(19), 109474. [Google Scholar] [CrossRef]
- Guo, Y.N.; Zhang, H.D.; Bao, Y.Y.; Tan, H.Z.; Liu, X.H.; Rahman, Z.U. Distribution characteristics of soil AM fungi community in soft sandstone area. J. Environ. Manag. 2022, 316, 115193. [Google Scholar] [CrossRef]
- Selivanov, I.A. Mikosimbiotrofizm kak forma konsortivnykh svyazei v rastitel’nom pokrove Sovetskogo Soyuza (Mycosymbiotrophism as a Form of Consortive Relations in Vegetation Cover of Soviet Union); Nauka: Moscow, Russia, 1981. [Google Scholar]
- Lavrenov, N.G.; Zernov, A.S.; Kipkeev, A.M.; Tekeev, D.K.; Semenova, R.B.; Akhmetzhanova, A.A.; Perevedentseva, L.G.; Sudzilovskaya, N.A.; Korneecheva, M.Yu.; Onipchenko, V.G. Plant mycorrhiza under extreme conditions of snow beds Alpine communities in Armenia. Biol. Bull. Rev. 2018, 8(5), 401–405. [Google Scholar] [CrossRef]
- Lugo, M.A.; Ferrero, M.; Menoyo, E.; Estévez, M.C.; Siñeriz, F.; Anton, A. Arbuscular mycorrhizal fungi and rhizospheric bacteria diversity along an altitudinal gradient in South American Puna grassland. Microb. Ecol. 2008, 55, 705–713. [Google Scholar] [CrossRef]
- Lugo, M.A.; Negritto, M.A.; Jofré, M.; Anton, A.; Galetto, L. Colonization of native Andean grasses by arbuscular mycorrhizal fungi in puna: a matter of altitude, host photosynthetic pathway and host life cycles. FEMS Microbiol. Ecol. 2012, 81, 455–466. [Google Scholar] [CrossRef]
- Kernaghan, G.; Harper, K.A. Community structure of ectomycorrhizal fungi across an alpine/subalpine ecotone Ecography 2001, 24(2), 181–188. [CrossRef]
- De Mesquita, C.P.B.; Sartwell, S.A.; Ordemann, E.V.; Porazinska, D.L.; Farrer, E.C.; King, A.J.; Spasojevic, M.J.; Smith, J.G.; Suding, K.N.; Schmidt, S.K. Patterns of root colonization by arbuscular mycorrhizal fungi and dark septate endophytes across a mostly-unvegetated, high-elevation landscape. Fungal Ecol. 2018, 36, 63–74. [Google Scholar] [CrossRef]
- Nozadze, L.M. Mycosymbiotrophism of herbaceous plants in some plant communities of the Inguri River basin related to vertical zonality. In Mikoriza i drugie formy konsortativnykh otnoshenii v prirode (Mycorrhiza and Other Forms of Consortive Relations in Nature); Permsk. Gos. Pedagog. Inst.: Perm, Russia, 1981; pp. 50–52. [Google Scholar]
- Hempel, S.; Gotzenberger, L.; Kuhn, I.; Michalski, S.G.; Rillig, M.C.; Zobel, M.; Moora, M. Mycorrhizas in the Central European flora: relationships with plant life history traits and ecology. Ecology 2013, 94(6), 1389–1399. [Google Scholar] [CrossRef]
- Soudzilovskaia, N.A.; Douma, J.C.; Akhmetzhanova, A.A.; van Bodegom, P.M.; Cornwell, W.C.; Moens, E.; Treseder, K.; Tibbett, M.; Wang, Y.; Cornelissen, J. Global patterns of plant root colonization intensity by mycorrhizal fungi explained by climate and soil chemistry. Global Ecol. Biogeogr. 2015, 24(3), 371–382. [Google Scholar] [CrossRef]
- Lenoir, I.; Fontaine, J.; Sahraoui, A.L. Arbuscular mycorrhizal fungal responses to abiotic stresses: a review. Phytochemistry 2016, 1(123), 4–15. [Google Scholar] [CrossRef]
- Dumbrell, A.J.; Nelson, M.; Helgason, T.; Dytham, C.; Fitter, A.H. Relative roles of niche and neutral processes in structuring a soil microbial community. ISME J. 2010, 4, 337–345. [Google Scholar] [CrossRef]
- López-Angulo, J.; Pescador, D.S.; Sánchez, A.M.; Luzuriaga, A.L.; Cavieres, L.A.; Escudero, A. Impacts of climate, soil and biotic interactions on the interplay of the different facets of alpine plant diversity. Sci. Total Environ. 2020, 698, 133960. [Google Scholar] [CrossRef]
- Makarov, M.I. The role of mycorrhiza in transformation of nitrogene compounds in soil and nitrogene nutrition of plant: a review. Eurasian Soil Sci. 2019, 52(2), 193–205. [Google Scholar] [CrossRef]
- Soteras, F.; Menoyo, E.; Grilli, G.; Becerra, A.G. Arbuscular mycorrhizal fungal communities of high mountain ecosystems of South America: relationship with microscale and macroscale factors. In Mycorrhizal Fungi in South America; Springer: Cham, Switzerland, 2019; pp. 257–275. [Google Scholar]
- Farish, N.R.; Lavrenov, N.G. Statistical analysis of the mycorrhizae impact on communities of alpine maedows. Reports of Int. Conf. “Mathematical Biology AND BioInformatics”; V.D. Lahno; IMPB RAN: Puschino, Russia, 2018; 7, e102. [CrossRef]
- Sigüenza, C.; Espejel, I.; Allen, E. Seasonality of mycorrhizae in coastal sand dunes of Baja California. Mycorrhiza 1996, 6, 151–157. [Google Scholar] [CrossRef]
- Liu, M.; Yue, Y.J.; Wang, Z.H.; Li, L.; Duan, G.Z.; Bai, S.L.; Li, T. Composition of the arbuscular mycorrhizal fungal community and changes in diversity of the rhizosphere of Clematis fruticosa over three seasons across different elevations. Eur. J. Soil Sci. 2020, 71, 511–523. [Google Scholar] [CrossRef]
- Berruti, A.; Lumini, E.; Balestrini, R.; Bianciotto, V. Arbuscular mycorrhizal fungi as natural biofertilizers: let's benefit from past successes. Front. Microbiol. 2016, 6, 1559. [Google Scholar] [CrossRef]
- Pellegrino, E.; Piazza, G.; Arduini, I.; Ercoli, L. Field inoculation of bread wheat with Rhizophagus irregularis under organic farming: variability in growth response and nutritional uptake of eleven old genotypes and a modern variety. Agronomy 2020, 10(3), 333. [Google Scholar] [CrossRef]
- Wang, J.; Fu, W.; Sun, C.; Cai, S.; Tang, C. Funneliformis mosseae inoculation enhances Cucurbita pepo L. plant growth and fruit yield by reshaping rhizosphere microbial community structure. Diversity 2022, 14(11), 932. [Google Scholar] [CrossRef]
- Veresoglou, S.D.; Shaw, L.J.; Sen, R. Glomus intraradices and Gigaspora margarita arbuscular mycorrhizal associations differentially affect nitrogen and potassium nutrition of Plantago lanceolata in a low fertility dune soil. Plant Soil 2011, 340, 481–490. [Google Scholar] [CrossRef]
- Kaur, S.; Campbell, B.J.; Suseela, V. Root metabolome of plant-arbuscular mycorrhizal symbiosis mirrors the mutualistic or parasitic mycorrhizal phenotype. New Phytol. 2022, 234, 672–687. [Google Scholar] [CrossRef]
- Edlinger, A.; Garland, G.; Hartman, K.; Banerjee, S.; Degrune, F.; García-Palacios, P.; Hallin, S.; Valzano-Held, A.; Herzog, C.; Jansa, J.; Kost, E.; Maestre, F.T.; Pescador, D.S.; Philippot, L.; Rillig, M.C.; Romdhane, S.; Saghaï, A.; Spor, A.; Frossard, E.; van der Heijden, M.G.A. Agricultural management and pesticide use reduce the functioning of beneficial plant symbionts. Nat Ecol Evol. 2022, 6(8), 1145–1154. [Google Scholar] [CrossRef]
- Kakouridis, A.; Hagen, J.A.; Kan, M.P.; Mambelli, S.; Feldman, L.J.; Herman, D.J.; Weber, P.K.; Pett-Ridge, J.; Firestone, M.K. Routes to roots: direct evidence of water transport by arbuscular mycorrhizal fungi to host plants. New Phytol. 2022, 236(1), 210–221. [Google Scholar] [CrossRef]
- Bioproject PRJNA646244 in GenBank NCBI. 2023. Available online: https://www.ncbi.nlm.nih.gov/bioproject/?term=PRJNA646244 (accessed on 30 October 2023).
- Thiéry, O.; Moora, M.; Vasar, M.; Zobel, M.; Öpik, M. Inter- and intrasporal nuclear ribosomal gene sequence variation within one isolate of arbuscular mycorrhizal fungus, Diversispora sp. Symbiosis. 2012, 58(1-3), 135-147. [CrossRef]
- Warton, D.I.; Wright, T.W.; Wang, Y. Distance-based multivariate analyses confound location and dispersion effects. Methods Ecol Evol. 2012, 3, 89–101. [Google Scholar] [CrossRef]
- Oksanen, J.; Simpson, G.; Blanchet, F.; Kindt, R.; Legendre, P.; Minchin, P.; O'Hara, R.; Solymos, P.; Stevens, M.; Szoecs, E.; et al. _vegan: Community Ecology Package_. R package version 2.6-4. Available online: https://CRAN.R-project.org/package=vegan, last updated 11 Oct 2022 (accessed on 30 November 2023).
- Ma, X.; Xu, X.; Geng, Q.; Luo, Y.; Ju, C.; Li, Q.; Zhou, Y. Global arbuscular mycorrhizal fungal diversity and abundance decreases with soil available phosphorus. Glob Ecol Biogeogr. 2023, 32(8), 1423–1434. [Google Scholar] [CrossRef]
- Wang, G.M. Effects of pH on arbuscular mycorrhiza I. Field observations on the long-term liming experiments at Rothamsted and Woburn. New Phytol. 1993. 124, 465–472. [CrossRef]
- Coughlan, A.P. , Dalpé, Y., Lapointe, L., Piché, Y. Soil pH-induced changes in root colonization, diversity, and reproduction of symbiotic arbuscular mycorrhizal fungi from healthy and declining maple forests. CJFR 2000. 30, 1543–1554. [CrossRef]
Figure 1.
Heat map: frequency of occurrence of identified species in the ITS1 (A) and ITS2 (B) regions in three biotopes: subalpine meadow, forest and river valley (calculated by the number of reads). The dark blue color on the heat map indicates a higher number of reads, and the light blue color indicates a lower number of reads.
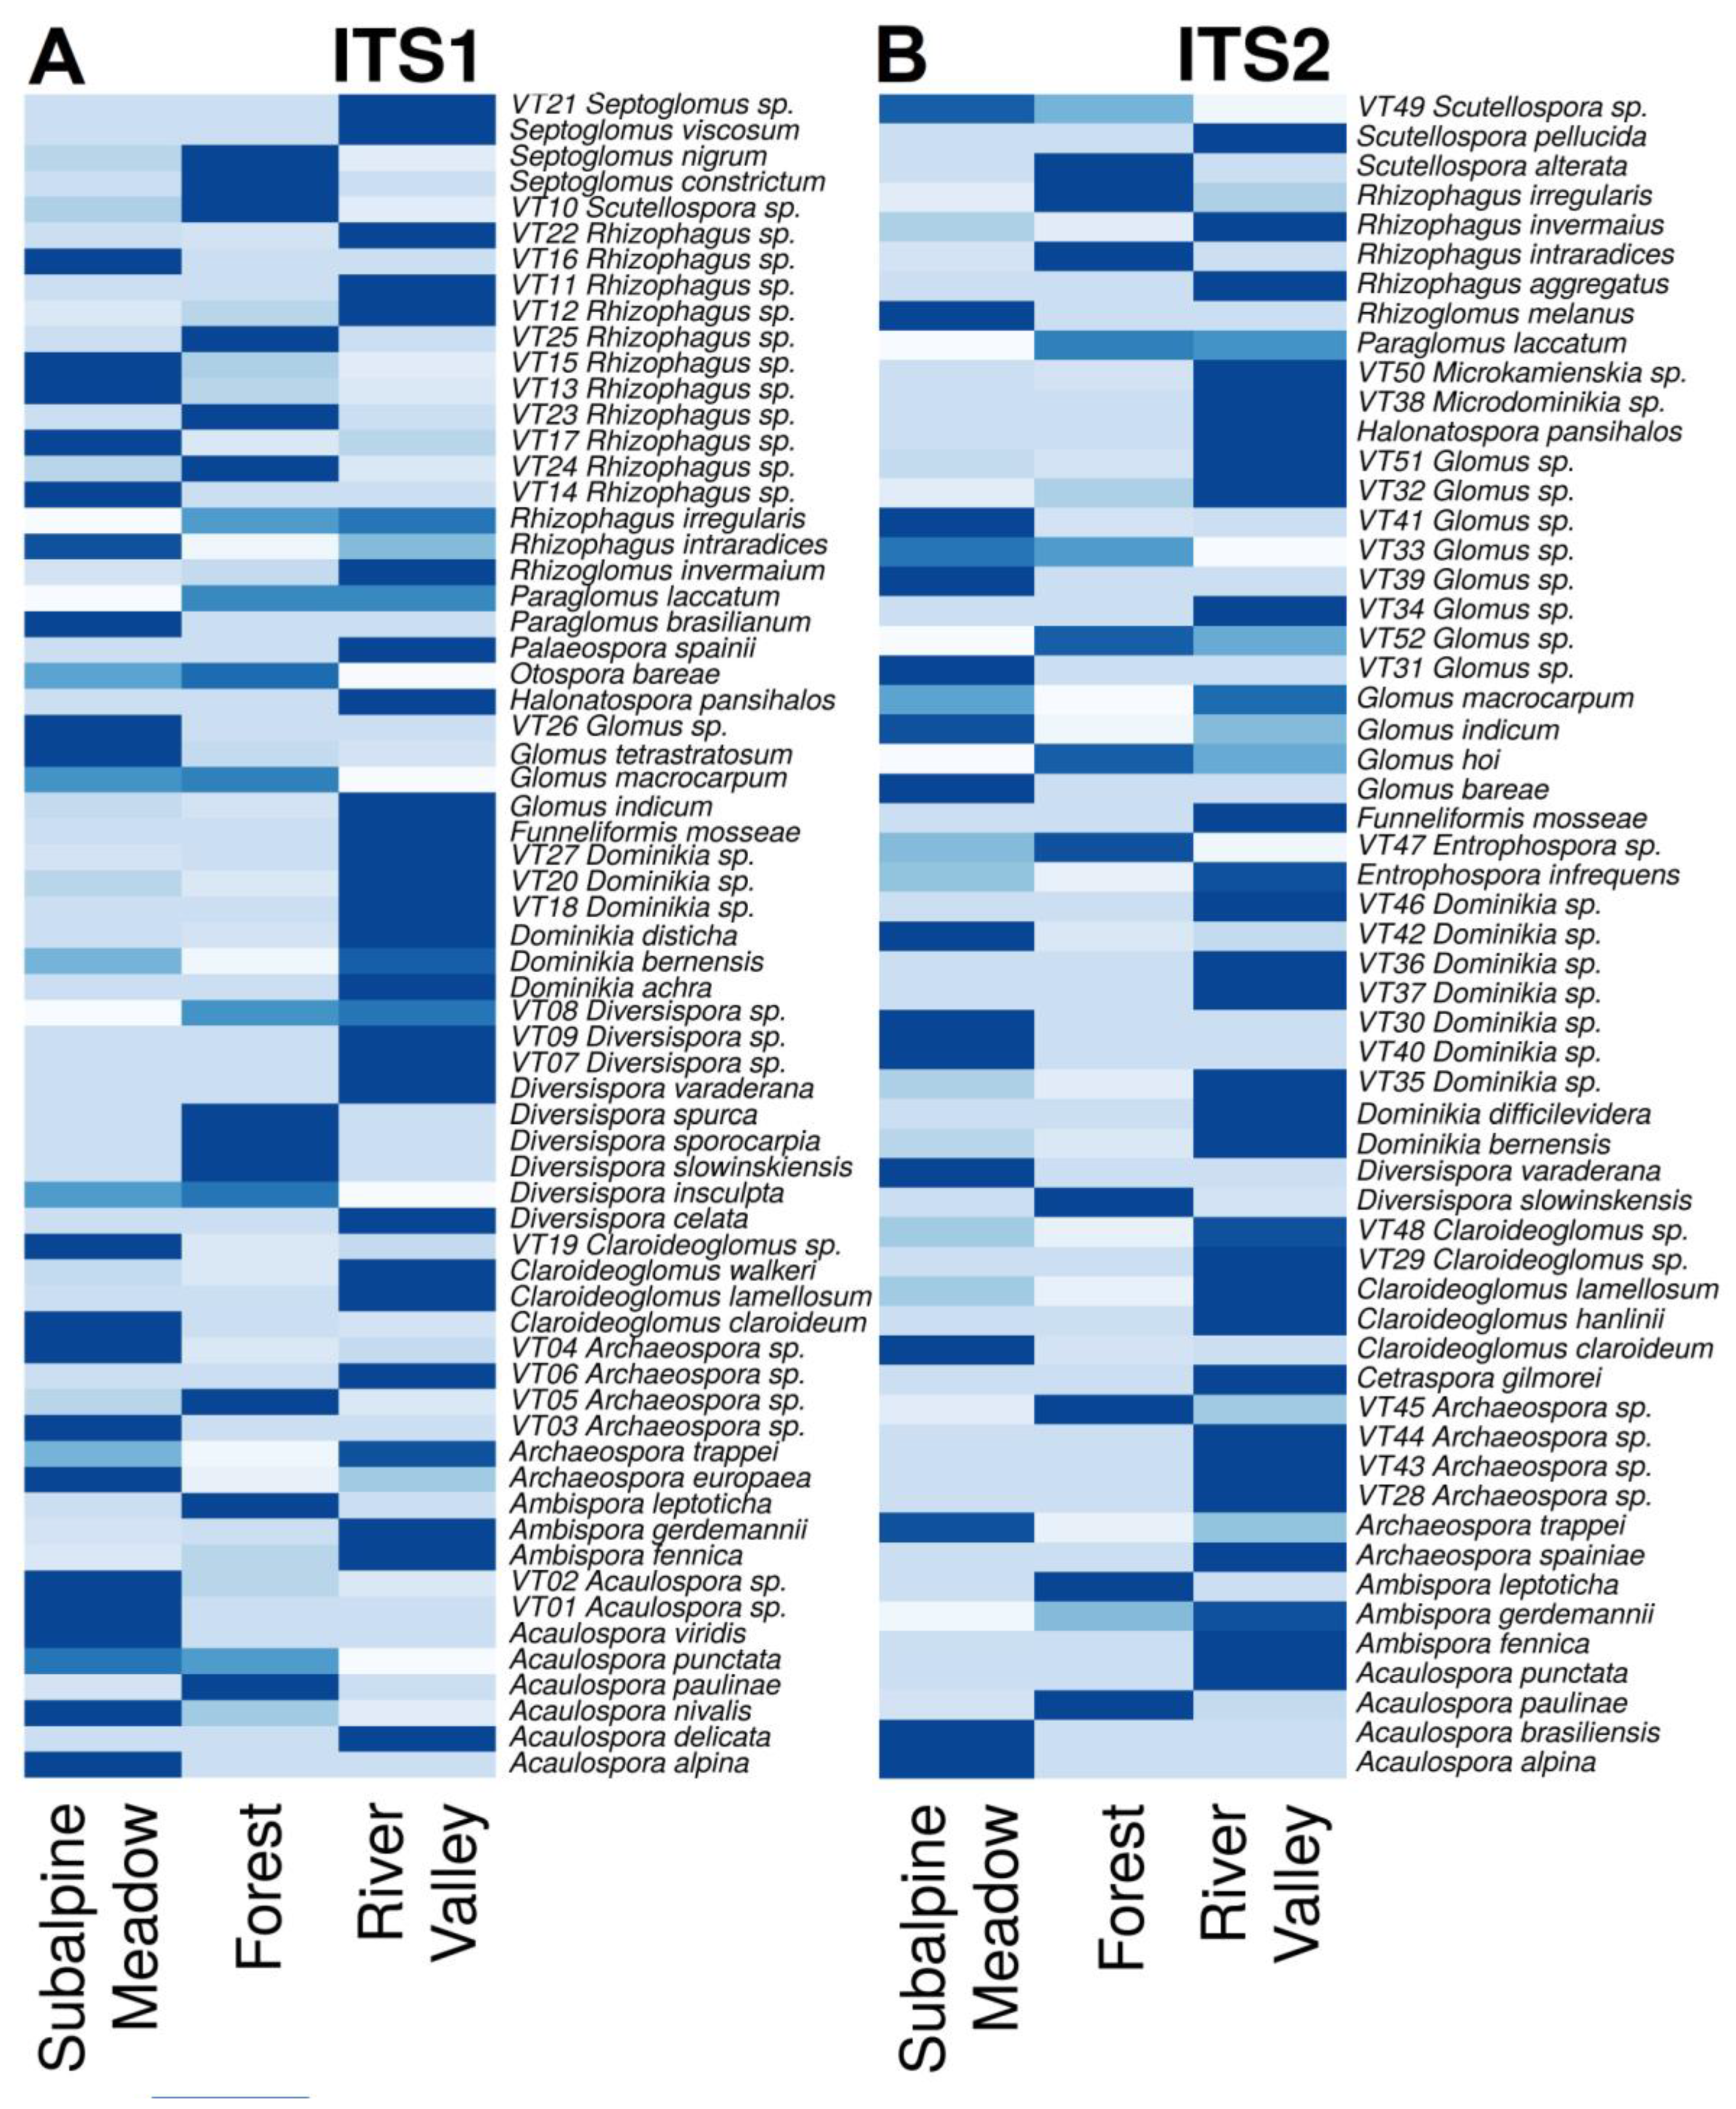
Figure 5.
Venn diagram: the number of identified OTUs (left) and AMF species (right) in subalpine meadow, forest and river valley based on ITS1 analysis.
Figure 5.
Venn diagram: the number of identified OTUs (left) and AMF species (right) in subalpine meadow, forest and river valley based on ITS1 analysis.
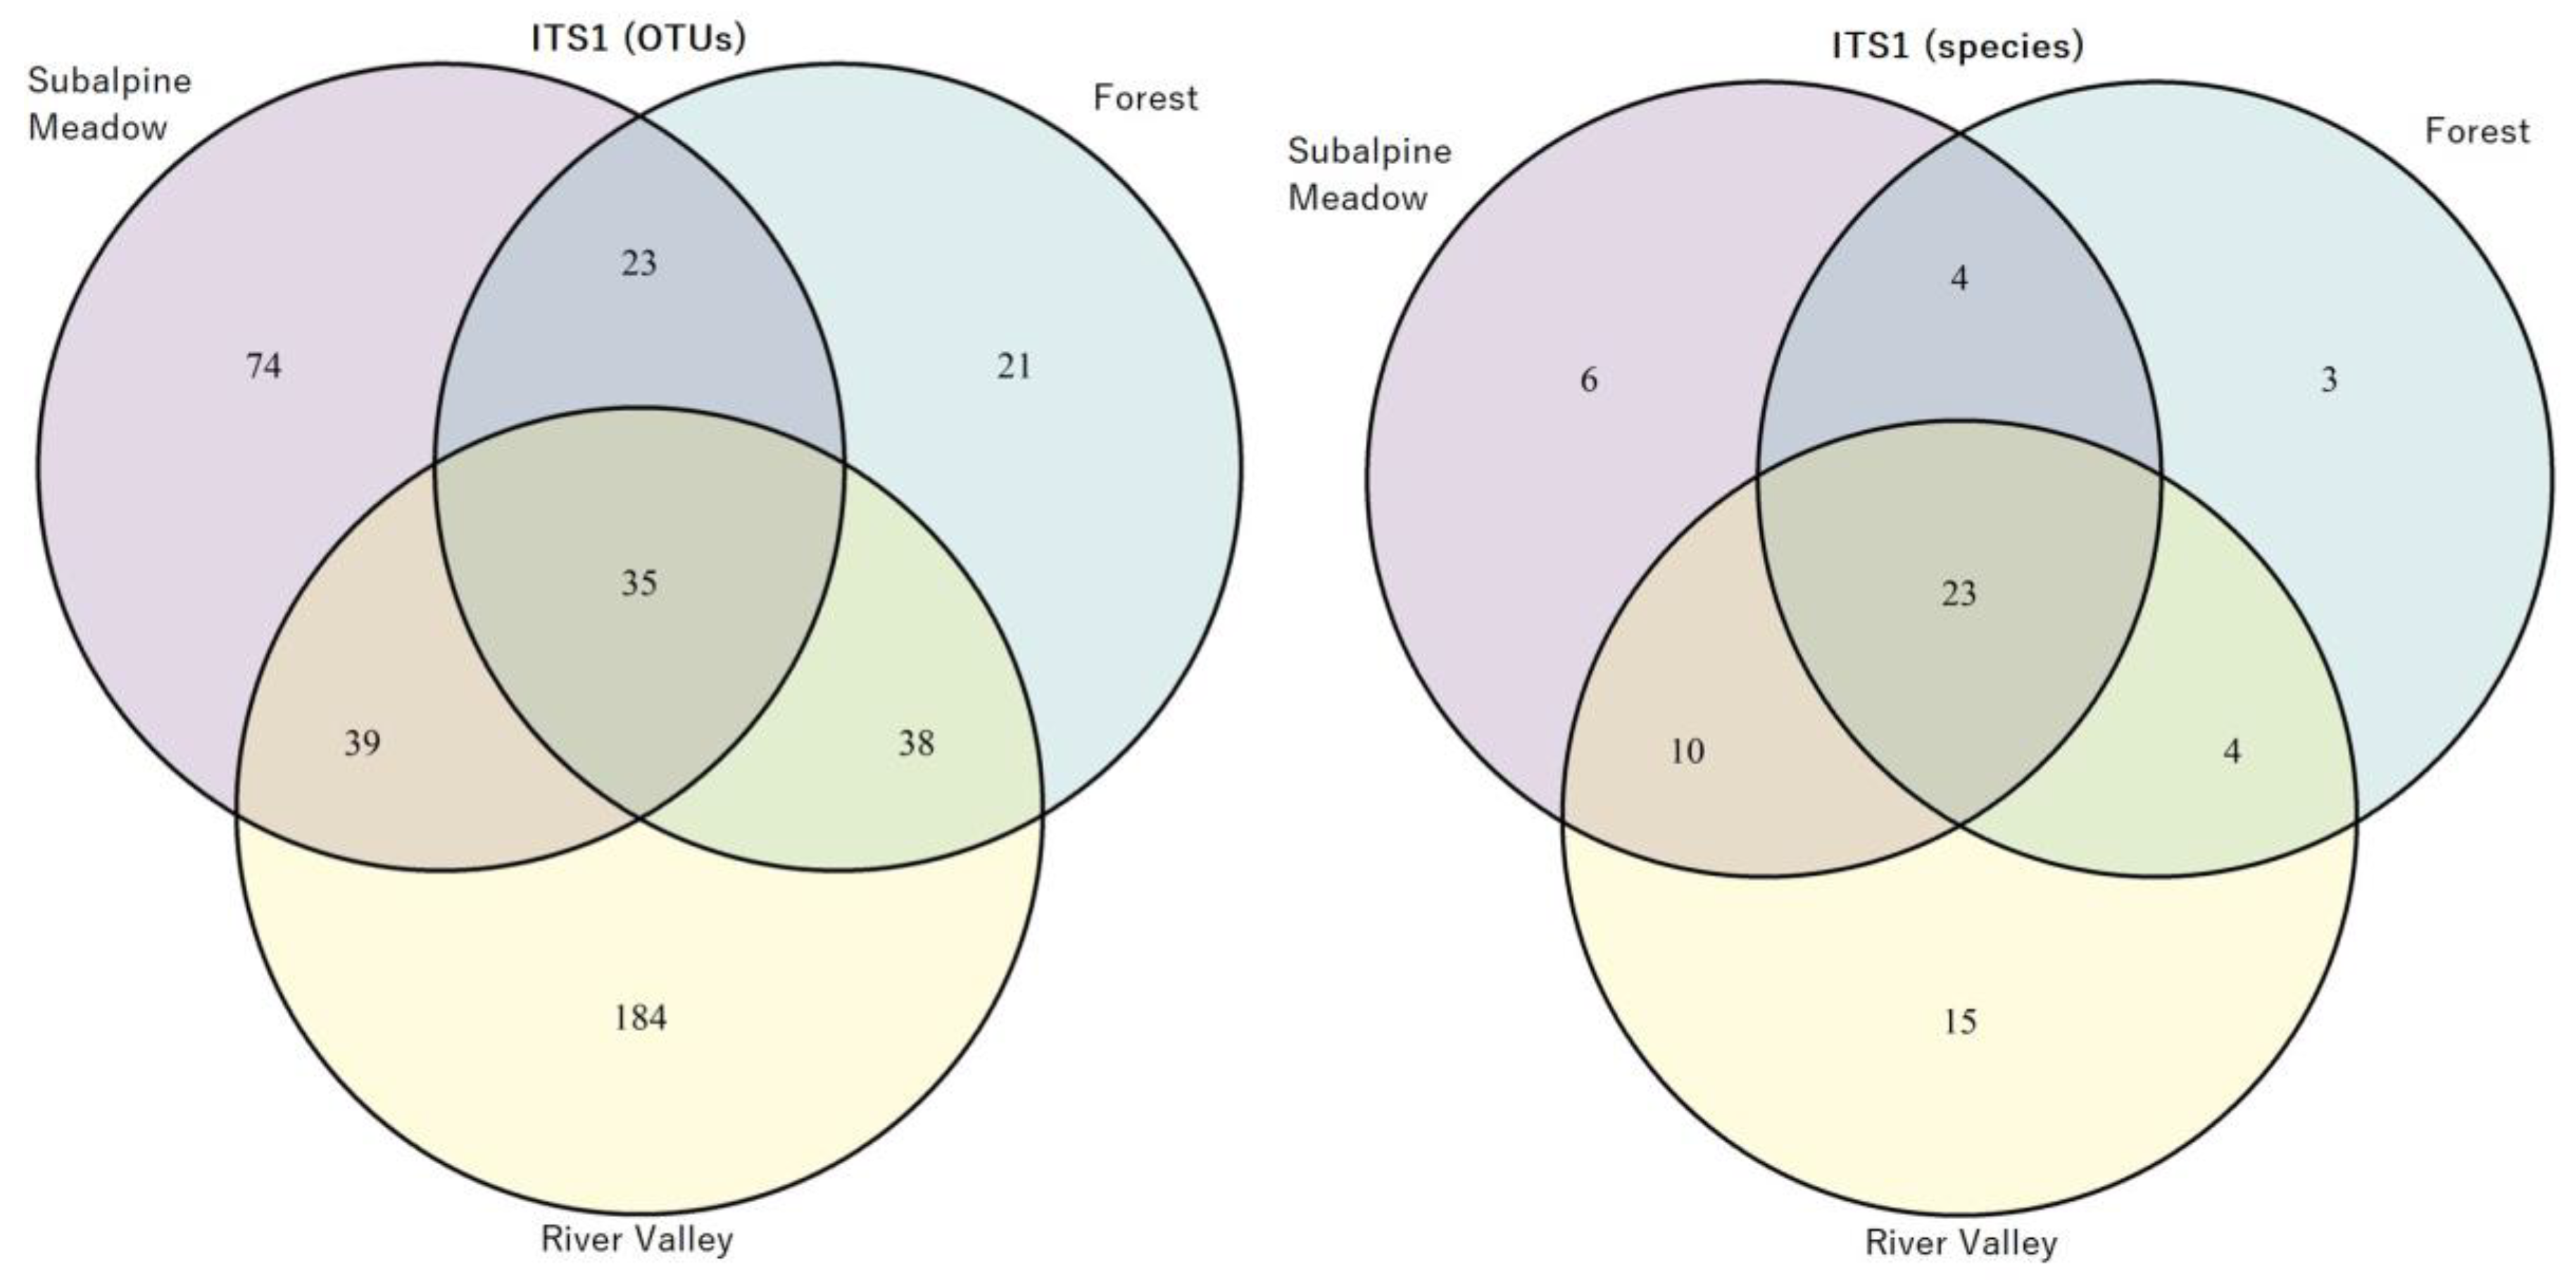
Figure 6.
Venn diagram: the number of identified OTUs (left) and AMF species (right) in subalpine meadow, forest and river valley based on ITS2 analysis.
Figure 6.
Venn diagram: the number of identified OTUs (left) and AMF species (right) in subalpine meadow, forest and river valley based on ITS2 analysis.
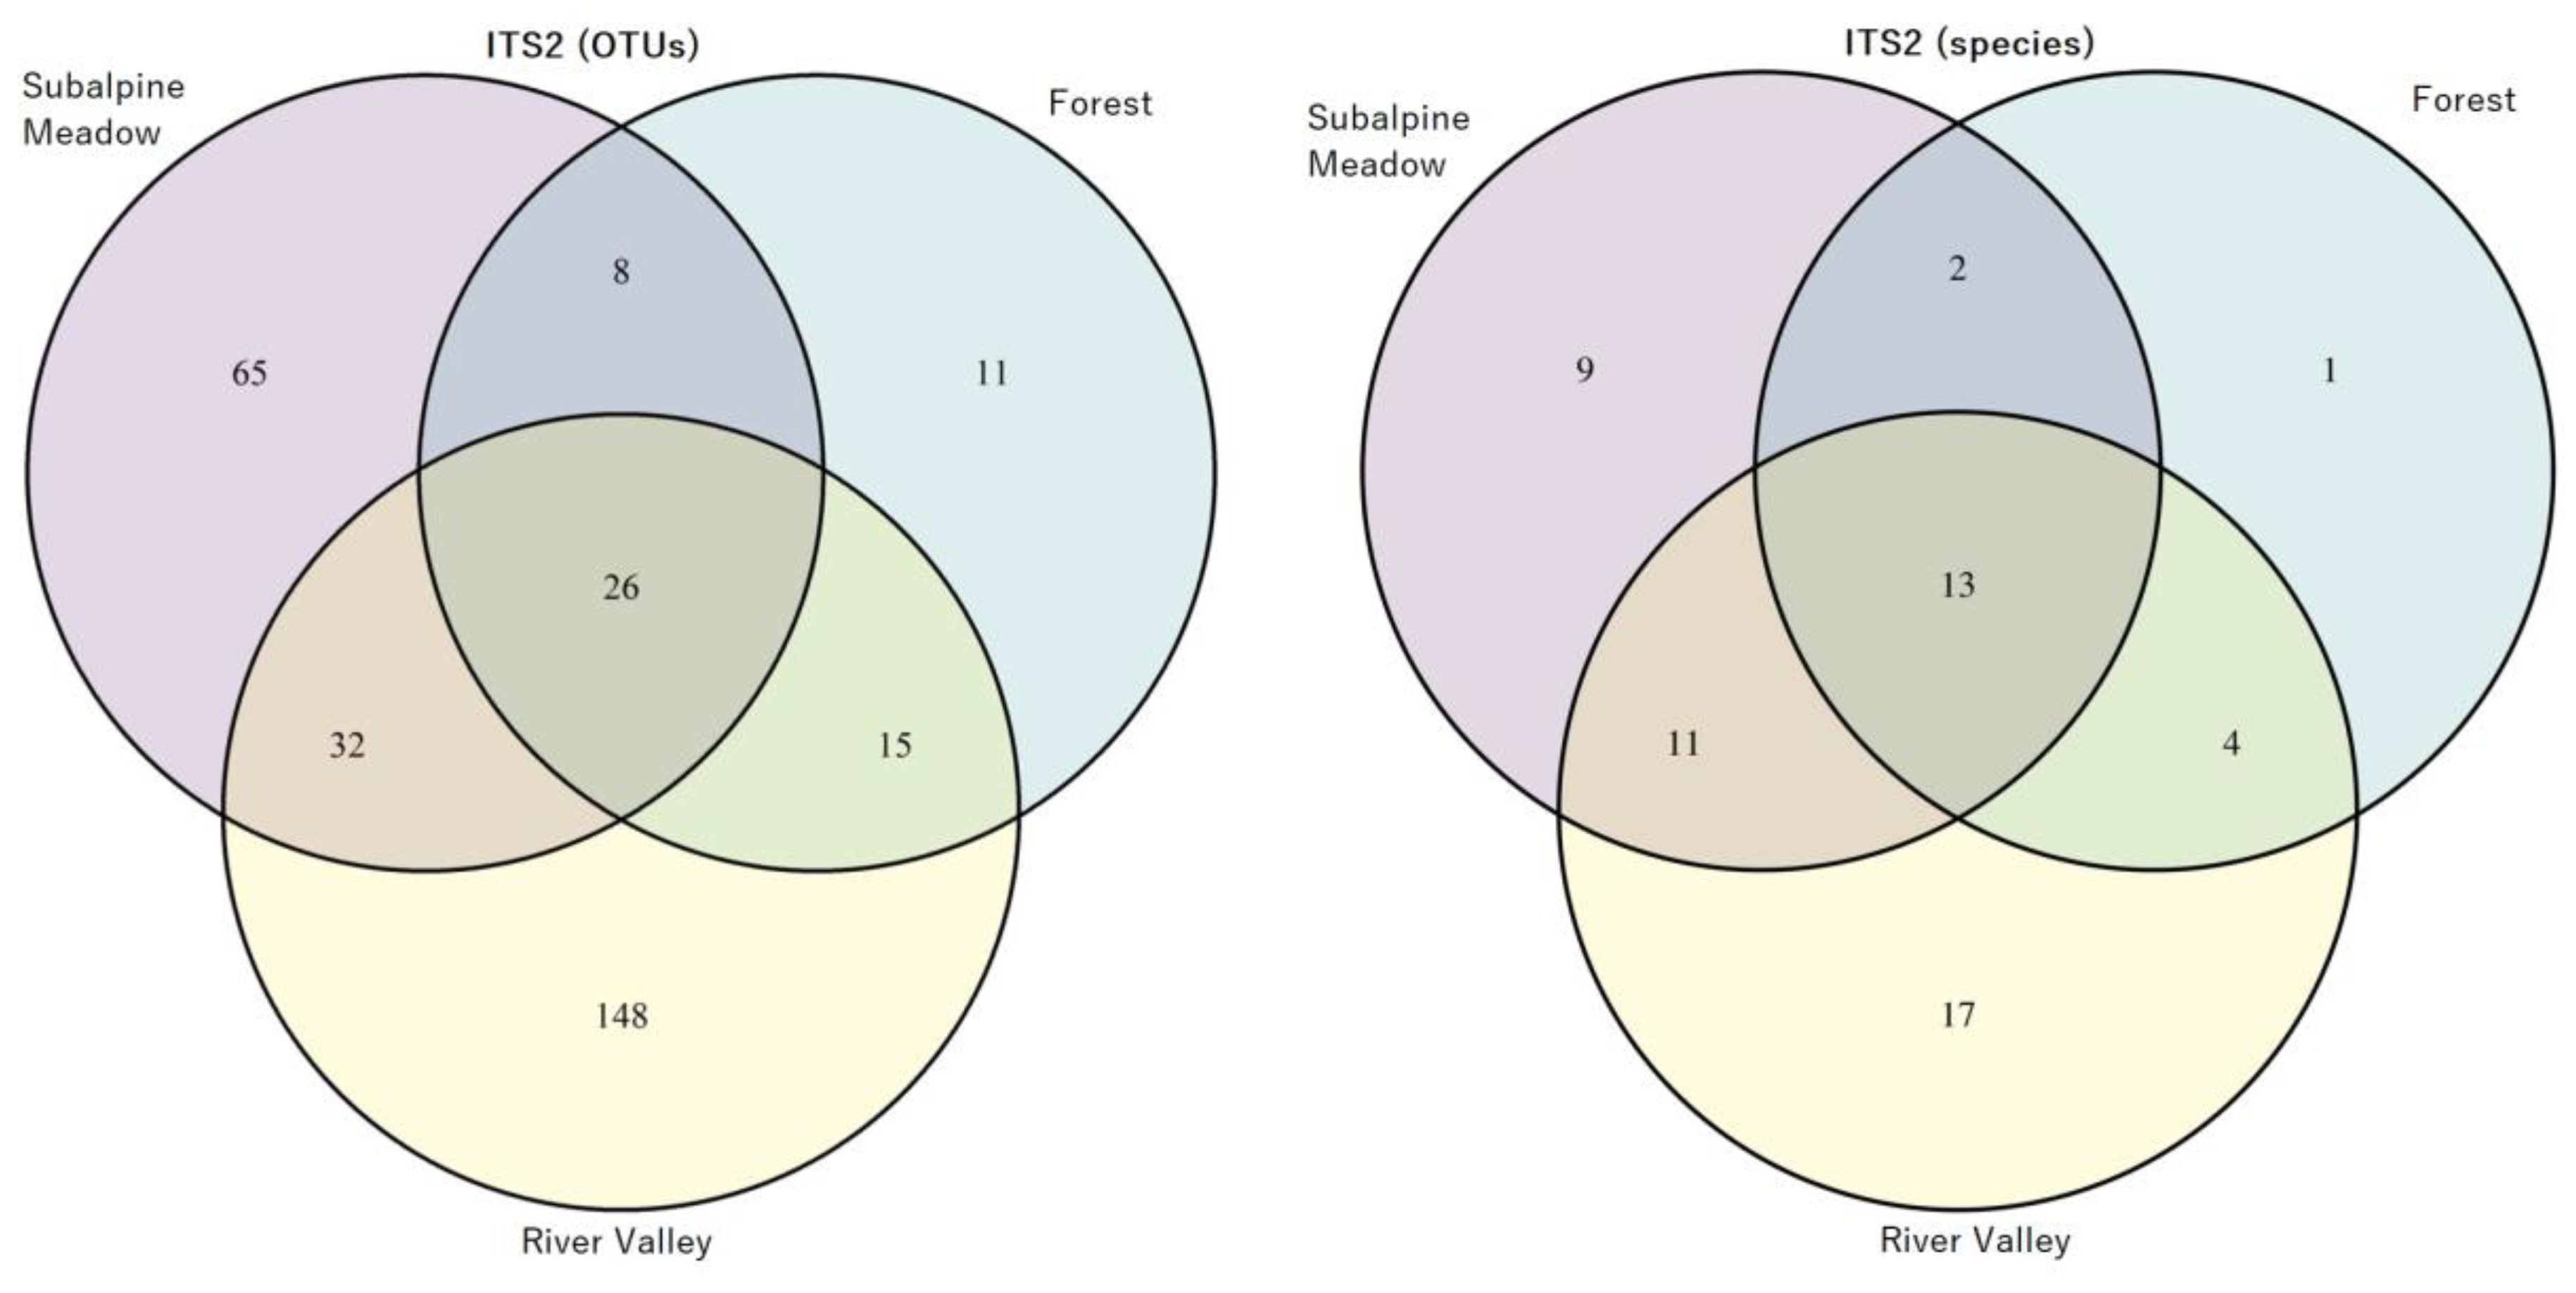

Table 1.
Locations and soils for analyzed stationary trial plots.
| STP Number | Stationary Trial Plot | Coordinates | Altitude, m | Type of Soil | Soil Profile |
|---|---|---|---|---|---|
| 1 | Subalpine Meadow-4, Malaya Hatipara ridge | 43°25'50.0"N 41°42'20.0"E | 2437 | ID 199 Mountain-meadow sod-peatyWRB, 2006. Umbric LeptosolsFAO, 1988. Umbric Leptosols | О1/А1v-А1Вр-ВСр-Ср |
| 3 | Subalpine Meadow-3, Malaya Hatipara ridge | 43°25'48.0"N 41°42'31.0"E | 2401 | ID 200 Mountain-meadow soddyWRB, 2006. Umbric LeptosolsFAO, 1988. Umbric Leptosols | A1-A2-B |
| 4 | Subalpine Meadow-2, Malaya Hatipara ridge | 43°25'51.0"N 41°42'55.0"E | 2186 | –//– | –//– |
| 7 | Fir Forest-3, Malaya Hatipara mountain | 43°26'07.3"N 41°43'14.1"E | 1900 | ID 68 Brownzems raw-humic illuvial-humicWRB, 2006. Haplic CambisolsFAO, 1988. Dystric Cambisols | О(АО)-А1-А1А2-Вm,f,h(Bh,m)-С |
| 8 | Pine Forest-3, Malaya Hatipara mountain | 43°26'07.3"N 41°43'14.1"E | 1890 | –//– | –//– |
| 9 | Mixed forest near the Bolshaya Hatipara river, Bolshaya Hatipara mountain | 43°24'56.0"N 41°42'49.0"E | 1507 | –//– | –//– |
| 11 | Grassland in the valley of the Teberda river, Teberda town | 43°25'12.0"N 41°43'45.0"E | 1342 | ID 191 Alluvials compactWRB, 2006. Gleyic VertisolsFAO, 1988. Eutric Vertisols | A1v-A1-Bve-BC-C |
| 12 | Grassland in the valley of the Teberda river, the border of the New Teberda village | 43°39'37.0"N 41°53'12.0"E | 1026 | ID 188 Alluvials saturatedWRB, 2006. Haplic FluvisolsFAO, 1988. Eutric Fluvisols | A1-AB-B-BC-D |
| 13 | Grassland in the valley of the Kuban river, Ordzhonikidzevsky village | 43°51'38.0"N 41°54'22.0"E | 795 | –//– | –//– |
Table 2.
The number of fungal reads and OTUs for ITS1 and ITS2 in the analyzed samples of 9 STPs.
| Analyzed | Subalpine Meadow | Forest | River Valley | Total for 9 STPs | ||||||
|---|---|---|---|---|---|---|---|---|---|---|
| Parameters | STP 1 | STP 3 | STP 4 | STP 7 | STP 8 | STP 9 | STP 11 | STP 12 | STP 13 | |
| Total reads | 1494700 | 619855 | 1648642 | 652998 | 1469158 | 970340 | 1108444 | 1271980 | 862545 | 10 098 662 |
| Merged reads after length trim | 401850 | 255057 | 626988 | 102472 | 586935 | 539334 | 363547 | 160449 | 347435 | 3 384 067 |
| Glomeromycota ITS1 total reads | 1243 | 1011 | 1116 | 183 | 76 | 697 | 6670 | 335 | 4638 | 15 969 |
| Glomeromycota ITS1 OTU number | 100 | 59 | 86 | 29 | 26 | 80 | 197 | 66 | 109 | 414 |
| 171 | 117 | 296 | ||||||||
| Glomeromycota ITS2 total reads | 546 | 493 | 580 | 7 | 24 | 583 | 1624 | 885 | 1758 | 6 500 |
| Glomeromycota ITS2 OTU number | 72 | 49 | 74 | 3 | 10 | 58 | 128 | 93 | 76 | 305 |
| 131 | 60 | 221 | ||||||||
Note: The values of the number of OTUs before filtering the sequences unidentified at the species level are presented. The significance of dissimilarity in ITSs compositions (the OTU number) analyzed for different biotopes, assessed as Spearman’s distances (1-r), was confirmed by ANOSIM tests (P=0.003 for ITS1 and P=0.004 for ITS2). After identifying AMF to the species level, OTU statistics is provided in Tables S4–S7.
Disclaimer/Publisher’s Note: The statements, opinions and data contained in all publications are solely those of the individual author(s) and contributor(s) and not of MDPI and/or the editor(s). MDPI and/or the editor(s) disclaim responsibility for any injury to people or property resulting from any ideas, methods, instructions or products referred to in the content. |
© 2023 by the authors. Licensee MDPI, Basel, Switzerland. This article is an open access article distributed under the terms and conditions of the Creative Commons Attribution (CC BY) license (http://creativecommons.org/licenses/by/4.0/).
Copyright: This open access article is published under a Creative Commons CC BY 4.0 license, which permit the free download, distribution, and reuse, provided that the author and preprint are cited in any reuse.


