Submitted:
09 December 2023
Posted:
11 December 2023
You are already at the latest version
Abstract
There is a need to develop enriched milk drinks with healthy and natural additives. A consumer test was conducted to compare milk (cow and camel) flavored with date syrup (Khlass and Sukkary varieties) at different percentage. The objective of the present work was to study consumers liking patterns for flavored milk drinks from dates syrup (from Khlass and Sukkary dates), at different percentages, added to milk (cow and camel) utilizing preference mapping analysis. A total of sixteen trained panelists took part in the test. The obtained data were used to develop an internal preference map for these samples. Principal component analysis (PCA) and Agglomerative hierarchical clustering (AHC) algorithms were used to construct the preference map. The first component signifies overall acceptance of taste and color, while the second focuses on texture and flavor. Consumers were grouped into five clusters based on preferences. Cluster two favored both components positively, while cluster four leaned negatively on both. A factorial ANOVA was performed and the results showed a significant effect of the main factors as well as the interactions. Panelists preferred cow's milk over Camel’s milk in all aspects. For taste, cow’s milk with 20% Khlass syrup or 10% Sukkary syrup was favored, while in flavor, it was cow’s milk with 5% Khlass syrup and Camel’s milk with 10% Sukkary syrup. Texture-wise, Camel’s milk with 5% Khlass syrup and 15% Sukkary syrup, along with cow’s milk with 10% Khlass syrup, received top marks. In color evaluation, cow’s milk with 15% Sukkary syrup was the preferred choice. Finally, for overall color score, cow’s milk with 10% Sukkary syrup led, followed by cow’s milk with 5% Sukkary syrup. This research suggests that dairy companies may have more impact if they use date syrup as a natural and healthy flavor. The preference map includes two main dimensions; the first represents overall acceptance, taste, and color while the second is related to flavor and texture attributes. The preference map can be used in product optimization and development.
Keywords:
flavored milk
; cow
; camel
; date syrup
; preference mapping
; PCA
; AHC
PRACTICAL APPLICATIONS
- Dates, a major agricultural product in Saudi Arabia, with an annual production of 1.6 million tons. Among its valuable by-products is dates syrup, a sweetener that also enhances nutritional content in various products, including dairy drinks.
- Studies showed 25% losses in date production, which necessities searching for further marketing channels. The introduction of date syrup-flavored milk emerges as a potentially successful venture for the advanced dairy industry in Saudi Arabia.
- Despite the dairy industry's success, with an annual production of 1.68 tons of milk, the dependence on imported mostly artificial flavors lacking nutritional value as well as processed sucrose sugars remains a challenge.
- Furthermore, the growing interest in camel milk presents an opportunity for date syrup industries to introduce dates syrup as flavors and sweeteners to maximize its utilization in the dairy sector
- The importance of this work is to utilize date syrup as a natural nutritional and sweetener product that can be added to various dairy products such as milk to obtain a unique drink with high nutritional value for consumers.
- It is expected that this dairy drink will be a competitive and may replace milk flavored with synthetic/extracted flavors as well as sucrose.
- The utilization of date syrup will reduce date losses and convert it to added value and nutritious drinks.
- Furthermore, the utilization of dairy products into more innovative milk drinks flavored with dates syrup would enhance the public diet on the national level at schools, hospitals as well as other sectors of the society.
1. INTRODUCTION
Dates is one of the major agricultural products in Saudi Arabia in which the production reaches 1.6 million tons in 2021. One of the most important by-products of dates is dates syrup which can be utilized as a sweetener and nutritious in many products including dairy drinks. Studies indicated that the total losses of date in Saudi Arabia reach up to 25% [1,2,3,4,5]. This requires efforts for marketing dates with its derivatives that milk flavored with date syrup would be a potential success for the dairy and dates industries.
Date Syrup (locally called Dibbs) is a natural sweetener, that can be an appropriate ingredient in developing new dairy products to improve their nutrient properties [4,6,7]. Date syrup is a thick dark brown in color with a total sugar 70 to 80%, (mostly reducing sugars of glucose and fructose). Furthermore, macro and micro components of dates syrup may play a significant role in considering it rich in nutrition [8]. Thermal and rheological behavior and quality of date syrup, mostly manufactured from second and third-quality dates grades, at different processing stages should be evaluated [9,10,11,12]. Several studies have been conducted to determine the rheological, thermal, and physical properties of date syrup as well as cow’s and camel’s milk [4,6,8,13,14,15,16,17,18]. Other researchers showed that the ingredient of date syrup in the formulation of dairy products led to good outcomes and had potential health benefits, thereby, increasing sales and have consumer satisfaction [2,19,20,21].
The dairy industry in Saudi Arabia is a very advanced sector and the most successful food industrial projects with 1.68 tons of milk annually. Thus, the dairy industry based on cow’s milk has a potential of a vital role in SA's dairy industry[22].
Camel milk is getting more attention recently, that needs efforts for best utilization. Saudi Arabia has the largest number of camels in the Arabian Peninsula (1.4 million camels) with an average daily milk yield of 5 – 20 Kg [22]. This makes SA among the highest consumption of camel’s milk in the world [13]. Nevertheless, this camel milk industry is facing several challenges including the needs of new product development, and technological innovations [23,24].
The utilization of dairy milk (cow and camel) into dairy drinks with flavor and sweeteners is getting popularity especially with youngsters and in schools. However, most of the flavors and sweeteners added to milk drinks are imported and may lack some nutritional value to complement that of milk. Dates syrup would be an excellent candidate as a natural flavor and sweetener additive in dairy drinks. One of those suggested products is the milk (camel or cow) drink flavored with date syrup, which combines the nutritional value of both milk and dates [6]. Thus, dates syrup would have a positive impact on public health as well as national economy.
New product development can be conducted from either innovative technologies or market opportunities. Irrespective of where the new product originates, the success of these products depends on consumer judgment. Therefore, consumer research should be conducted during the process of product development [25]. One of the powerful scientific tools is sensory analysis which can be used to distinguish differences in visual features and assess a product’s acceptability. The difference in responses of consumers may present differentiated preference patterns [26]. While, in classic consumer science, liking is measured with the 9-point hedonic scale [27,28], principal component analysis (PCA) is widely used as a multivariate analytical, statistical technique that can be applied to quantitative descriptive analysis for sensory evaluation of various food and dairy products [29,30,31,32,33,34,35,36].
Recently, interest increased in research dealing with product preference mapping [37]. Preference mapping can be defined as a group of methods for exploring the responses of consumers to a set of products through multivariate statistical mapping [31,34,38,39,40,41,42,43].
Very limited work is available that relates adding dates syrup (from different varieties ) as flavors and sweeteners to milk (from "milch" animals). The objective of the present work was to study consumers liking patterns for flavored milk drinks from dates syrup (from Khlass and Sukkary dates), at different percentage, added to milk (cow and camel) utilizing preference mapping analysis.
2. MATERIALS AND METHODS
2.1. Extraction of date syrup
Two varieties of fully-ripen date fruits (Sukkary and Khlass); free of physical damage, insects, and fungal infection, were obtained. The selected fruits were cleaned and stones were removed. The date fruit pulp was blended with distilled water (1 date pulp: 3 distilled water; w/w). The date syrup was prepared following the method described by [4,14,44], with slight modification. Briefly, 500 g from each date variety was mixed with 1500 ml of purified water. Then, the mixture was placed in water bath with a mixer at 80 °C for 15 min (Kenwood, FPP230 Series, United Kingdom-Cole Parmer BT-15 and Laboratory Heated Water Bath Recirculating 12"x12") to extract sugar from dates pulp into water. The resulting date pulp-water suspension was filtered using paper filter-press (Seitz Pilot Filter Press, Model A20z, K150, Germany) The semi-industrial mechanical filtration device is based on the use of Seitz-EK (Seitz-Filter-Werke Theo and Geo Seitz Pall Filter Systems GmbH and Co., D-55543 Bad KreuZnach, Germany) cellulose filter sheets (Filter Sheets). Then the filtrate further centrifuged at 3000 rpm for 15 minutes using Digital Bench-Top Centrifuge (High-Speed 1500~12000RPM 24 Glass Capillary Capaci). The purified date juice was then concentrated at 65 °C under vacuum using climbing film evaporator (QVF Teaching system, CTSY EVAPO RATION Climbing Film and Natural Circulation Eva Porator) to obtain the date syrup (80 Brix). Dates syrup was then kept in refrigerated storage until the start of analysis and application.
2.2. Sample preparation
2.3. Sensory evaluation
Using the XLSTAT design of experiment for sensory analysis tool (XLSTAT Version 2016.01.26040), 16 milk drinks (two date syrup varieties × two types of milk × four addition,%) were prepared and served in four sessions to the 16 trained assessors. In each session, four products were randomly served. The four samples were prepared two hours before each evaluation session and kept in thermos flasks at 5 ºC. Mineral water at ambient temperature (~24°C) was used to rinse the mouth between tests. The samples were presented to the consumers in random order, labeled with three-digit codes randomly generated by the software. Sensory testing was conducted in the standard sensory laboratory of the College of Food and Agriculture Sciences, equipped with individual booths.
The trained panel consisted of sixteen judges (men aged 30 to 50). All assessors were previously trained and involved in similar sensory evaluations. Five attributes were evaluated using nine hedonic scales from (‘‘1-dislike extremely’’ to ‘‘9-like extremely’’). The attributes were Taste, Flavor, Texture, Color, and Overall acceptance. The selected attributes were chosen from previous consumer tests on similar samples [26], and which are of common use for consumer tests in the beverage industry [45].
2.4. Data analysis
The nine hedonic scales
Factorial analysis of variance was performed on the assessors overall acceptance scores, considering milk (two types), date syrup (two varieties), and percentage of addition (four %) as sources of variation, and significant differences were checked using Fisher’s LSD test (p < 0.05). The results were analyzed using SAS 9.2 software [46].
Cluster analysis
Agglomerative hierarchical clustering (AHC) (XLSTAT software) was performed to classify groups of consumers. This analysis was performed on standardized liking scores, using Euclidean distances and Ward’s method as the agglomeration criterion. The differences between the clusters were calculated with a one-way ANOVA and Duncan’s significance (p<0.05).
Preference mapping
Preference mapping was conducted using (PREFMAP) tool of XLSTAT (Version 2016.01.26040) to relate the preference patterns to the assessors as well as the intensities of the measured attributes. The external preference mapping approach was described by [47], and [37]. The details of using this method by the XLSTAT tool were discussed by [19].
3. RESULTS
3.1. Trained panel sensory evaluation
The factorial analysis of variance showed that there was a significant effect of the main factors: milk type and add% on the five attributes. Moreover, dates syrups variety had a significant effect on taste, color, and overall acceptance evaluations (p<0.05), as shown in Table 1. However, it had no significant effect on flavor and texture evaluations. All interactions showed significant effects on all five attributes.
There were variations in score preferences of syrup, milk, and add% based on the attributes selected as shown in Table 2. For the overall acceptance evaluation, the cow’s milk with 15 (w/w %) of Khlass syrup followed by cow’s milk with 10 (w/w %) of Sukkary syrup were the most liked samples.
The panelist gave all Camel’s milk samples lower liked than those of cow’s milk (Table 2). Ccow’s milk flavored with 20 (w/w %) of Khlass syrup or 10 (w/w %) of Sukkary syrup was the most liked in taste evaluation, followed by camel’s milk with 10 (w/w %) of Sukkary syrup or 15 (w/w %) of Khlass syrup (Table 2).
The cow’s milk with 5 (w/w %) of Khlass syrup followed by Camel’s milk with 10 (w/w %) of Sukkary syrup were the most liked in flavor evaluation, whereas texture evaluation showed that the Camel’s milk with 5 (w/w %) of Khlass syrup and 15 (w/w %) of Sukkary syrup followed by cow’s milk with 10 (w/w %) of Khlass syrup were the most liked ones. On the other hand, the cow’s milk with 15 (w/w %) of Sukkary syrup followed by cow’s milk with 10 (w/w %) of Khlass syrup was the most liked in color (Table 2). Finally, the cow’s milk with 10 (w/w %) of Sukkary syrup followed by cow’s milk with 5 (w/w %) of Sukkary syrup was the most liked score in color.
3.2. Sensory map
The Principal Component Analysis (PCA) results indicated that all sensory variables measured on the sixteen samples can be summarized in two main orthogonal components accounting for 83.25% of the total variance. The scree plot (Figure 1) addressed the two main components. To improve the elucidation of the two PCA components analysis, the total variability for each component and the accumulated variability for all components were obtained (Table 3). Even though the change aggregated by the first two components stays at 83.25% of the aggregate, the first component has 46.7 % of variability while the second component has 36.7% of variability.
Table 4 represents the contribution of the variables in each of the two main components. It can be construed that the first component represents the following variables: overall acceptance, taste, and color, while the second component refers to flavor and texture. The first is representing more overall acceptance; more liked the taste and more acceptance color in the positive range, and less acceptance and less desired color in the negative range. The second component, the flavor, and texture can be further distinguished in the positive range, and less flavored recognized and more disliked texture in the negative range (Figure 2).
Samples CS10, CKH15, and KKh20 are located on the positive side of the map for the first component (overall acceptance, taste) as well as the positive range for the second component (Flavor). Although samples KS10, CKH5, KKH10, KKH5, and KS20 are in the positive range of the second component (flavor), they are in the negative range of the first component (acceptance and taste). Finally, samples CS20, CS5, and KS5 are situated in the negative range of both components.
3.3. Cluster analysis
Consumers were grouped into five clusters based on the scores given to the tested samples. Cluster analysis was achieved based on Ward's method through the agglomerative hierarchical clustering (AHC) included in XLSTAT software. Table 5 describes the parameters obtained from AHC analysis, culster2, and culster1 have the same percentage of appearance (29%, and 28% respectively) followed by culster4 (19%), then cluster3 (13%) and finally culster5 (11%).
Table 6 represents the consumer’s overall acceptance liking for each cluster and the sample preferences within each cluster. Cluster 1 (28% of consumers) shows samples CKH10 as the most liked one followed by CS5, CKH15, and KKH15 at the same level of liking. Cluster 2 (29%) shows samples CKH20 as the most liked one followed by CKH15, and KKH10 at the same degree of liking while CS5 was the most disliked one. Cluster 3 (13%) shows the samples KS10 and KKH10 with the same liking score level as the most preferred followed by KS10 and KS15; respectively. While CKH15 is the most liked in Cluster 4 (19%), CKH20 and KKH5 have the lowest liking score. Finally, Cluster 5 (11%) shows CS5 andKS10 as the most liked samples.
3.4. Preference Map
In Figure 3, bi-dimensional Preference Maps can be noticed. This map indicates the direction of maximum preference for each one of the clusters. The position or direction for each cluster confirms the existence of two main component analyses. One group of consumer clusters includes cluster2 located on the positive side of both dimensions, whereas the other group is made of cluster4 located on the downside of both dimensions. On the other hand, culster1 is located on the positive side of the first component (overall acceptance, taste, and color) and the negative side of the second component (flavor and texture). Finally, clusters three and five are located on the positive side of the second component and the negative side of the first component.
As can be observed from Figure 3, consumers in cluster2 prefer samples KS10, CS10, CKH15, and KKH20 with all studied attributes positively. The two clusters of consumers prefer samples with high and medium values of flavor and texture including samples CKH5, KKH10, KKH5, and KS20. Cluster1 with 28% of consumers with cluster2 with 29% of consumers, low values for F1 and F2. For these consumers, willfully to cluster4 (19% of consumers), there is a negatively lower value for all.
4. DISCUSSION
4.1. Trained panel sensory evaluation
In general, the overall acceptance scores were in average values of the hedonic scale (3.8–5.9) and influenced by all factors, which was inferable from the detailing of the sample formulation (Table 2). However, one of the interesting results of this research work is in predicting product performance in the market and distinguishing between different formulations, so the focus of this work was on the patterns of liking.
Exploration of the interaction between factors for the samples and their attributes, generally it was found that the samples with cow’s milk were more liked in all attributes. The more Khlass syrup with cow’s milk or camel milk, the more tastes like. In contrast, the more Khlass syrup with cow’s milk or camel milk, the less flavor liked. From the texture point of view, more Khlass syrup with camel milk, less liking was found.
Unlike Khlass syrup, the Sukkary syrup is inversely liked by adding a percentage to Camel’s milk concerning texture attribute. Finally, no trend was discovered for color attributes. These results are in agreement with those found by [48]. Although the overall acceptance averaging the liking considering the samples that are liked the least, and vice versa, the other attribute's intensity plays an impotent role in trained panelist scores.
4.2. Sensory map
Unlike conventional dairy products, Camel’s milk is slightly saltier and has a heavy taste, thus most of the Camel’s milk samples are located on the negative side of the first component in a sensory map (Figure 2). Additionally, Camel’s milk taste is very sensitive to its compositions, and these compositions are wildly variated due to several factors [49]. Thus, most of the camel’s milk samples are located on the positive side of the second component in the sensory map which represents flavor and texture attributes.
4.3. Cluster and preference mapping analysis
The cluster analysis results in five consumer groups; cluster two which accounts for 29% of the consumers extends to more overall acceptance, more liking taste includes samples CS10, KS10, CKH15, and KKH20. As a result, adding 10% (w/w) of Sukkary syrup to cow’s or camel’s milk will be more acceptable to the consumer if these drinks are commercially produced. On the other hand, adding 15% (w/w) and 20% (w/w) of Khlass syrup to cow’s and camel’s milk respectively led to the same results. However, no report was published on preference maps for such drinks; these findings may be in concordance with previous for other dairy products flavored with date syrup.
Hashim [51] stated that adding 25% of date syrup to ice cream enhanced consumer’s overall acceptance. In another study, [52] indicated that adding date syrup to ice cream had a similar degree of likeness and overall acceptance as regular ice cream. Even though, it is not a simple task to translate the preference map component values for preferred products into practical standard measurements of quality [27].
CONCLUSION
A preference map for new dairy beverages has been developed. The preference map includes two main dimensions; the first represents overall acceptance, taste, and color while the second is related to flavor and texture attributes. The sixteen samples incorporated into the test have been placed on the map and consumers have been segmented into five clusters according to their preferences. Cluster2 (29% of consumers) which character overall acceptance and taste prefer cow’s and camel’s milk flavored with 10% (w/w) of Sukkary date syrup and 15%(w/w) and 20% (w/w) of Khlass date syrup. The importance of extensive studies of the consumer behavior of such dairy beverages has emerged to develop and support such healthy products and the preference map can be used in product optimization and development.
Funding
Funding this research from project # IFKSURC-1-5617.
Institutional Review Board Statement
Not applicable.
Informed Consent Statement
Not applicable.
Data Availability Statement
Data is contained within the article.
Acknowledgments
The authors extend their appreciation to the Deputyship for Research & Innovation, Ministry of Education in Saudi Arabia for funding this research. (IFKSURC-1-5617)
Conflicts of Interest
The author declares no conflict of interest.
References
- Al-Farsi*, M.A.; Lee, C.Y. Nutritional and Functional Properties of Dates: A Review. Critical Reviews in Food Science and Nutrition 2008, 48, 877–887. [CrossRef]
- Raiesi Ardali, F.; Rahimi, E.; Tahery, S.; Shariati, M.A. Production of a New Drink by Using Date Syrup and Milk; 2014; Vol. 4, pp. 67–72;.
- FAOSTAT. Food and Agriculture Organization 2016.
- Elamshity, M.G.K. Development of a Nutritional Drink from Cow’s and Camel’s Milk with Date Syrup, King Saud University: Riyadh, 2014.
- Ministry of Environment Water and Agriculture Annual Agricultural Statistical Yearbook. Department of Planning and Statistics, Ministry of Environment, Water and Agriculture. 2014, 27.
- Alhamdan, A.M. Rheological Properties of a Newly Nutritious Dairy Drink from Milk and Date Extract Concentrate (DIBBS). International Journal of Food Properties 2002, 5, 113–126. [CrossRef]
- Alhamdan, A. Applications of Neural Networks in Predicting Apparent Viscosity of Milk-Dibbs Drink; 2001;
- Ginat, E.-S.G.; Gado, B.; Rizk, ; E M Physiochemical Properties of Nectar Prepared From Nectarine Juice with Different Ratios of Date Syrup; 2012; Vol. 8, pp. 139–143;.
- Anand, T.; Prakash, K.B.; Pandareesh, M.D.; Khanum, F. Development of Bacoside Enriched Date Syrup Juice and Its Evaluation for Physical Endurance. J Food Sci Technol 2014, 51, 4026–4032. [CrossRef]
- Sabanci, S.; Cevik, M.; Cokgezme, O.F.; Yildiz, H.; Icier, F. Quality Characteristics of Pomegranate Juice Concentrates Produced by Ohmic Heating Assisted Vacuum Evaporation. Journal of the Science of Food and Agriculture 2019, 99, 2589–2595. [CrossRef]
- Al-Hilphy, A.R.; Al-Behadli, T.K.M.; Al-Mtury, A.A.; Abd Al-Razzaq, A.A.; Shaish, A.S.; Liao, L.; Zeng, X.A.; Manzoor, M.F. Innovative Date Syrup Processing with Ohmic Heating Technology: Physiochemical Characteristics, Yield Optimization, and Sensory Attributes. Heliyon 2023, 9. [CrossRef]
- Surin, S.; Thakeow, P.; Seesuriyachan, P.; Angeli, S.; Phimolsiripol, Y. Effect of Extraction and Concentration Processes on Properties of Longan Syrup. J Food Sci Technol 2014, 51, 2062–2069. [CrossRef]
- Faye, B.; Madani, H.; El-Rouili, S.A.H. Camel Milk Value Chain in Northern Saudi Arabia. Emirates Journal of Food and Agriculture 2014, 26, 359–365. [CrossRef]
- Abbès, F.; Kchaou, W.; Blecker, C.; Ongena, M.; Lognay, G.; Attia, H.; Besbes, S. Effect of Processing Conditions on Phenolic Compounds and Antioxidant Properties of Date Syrup. Industrial Crops and Products 2013, 44, 634–642. [CrossRef]
- ALEID, S.M. Date Palm Biotechnology; Springer Netherlands, 2011;
- Croissant, A.E.; Washburn, S.P.; Dean, L.L.; Drake, M.A. Chemical Properties and Consumer Perception of Fluid Milk from Conventional and Pasture-Based Production Systems. Journal of Dairy Science 2007, 90, 4942–4953. [CrossRef]
- Al-Farsi, M.A.; Lee, C.Y. Nutritional and Functional Properties of Dates: A Review. Critical Reviews in Food Science and Nutrition 2008, 48, 877–887. [CrossRef]
- Al-Hooti, S.N.; Sidhu, J.S.; Al-Saqer, J.M.; Al-Othman, A. Chemical Composition and Quality of Date Syrup as Affected by Pectinase/Cellulase Enzyme Treatment. Food Chemistry 2002, 79, 215–220. [CrossRef]
- Bonany, J.; Brugger, C.; Buehler, A.; Carbó, J.; Codarin, S.; Donati, F.; Echeverria, G.; Egger, S.; Guerra, W.; Hilaire, C.; et al. Preference Mapping of Apple Varieties in Europe. Food Quality and Preference 2014, 32, 317–329. [CrossRef]
- Gad, A.S.; Kholif, A.M.; Sayed, A.F. Evaluation of the Nutritional Value of Functional Yogurt Resulting from Combination of Date Palm Syrup and Skim Milk. American Journal of Food Technology 2010, 5, 250–259. [CrossRef]
- Mrabet, A.; Rodríguez-Gutiérrez, G.; Rodríguez-Arcos, R.; Guillén-Bejarano, R.; Ferchichi, A.; Sindic, M.; Jiménez-Araujo, A. Quality Characteristics and Antioxidant Properties of Muffins Enriched with Date Fruit (Phoenix Dactylifera L.) Fiber Concentrates. Journal of Food Quality 2016, 39, 237–244. [CrossRef]
- Saudi Arabia - Agricultural Census, 2015 Available online: https://microdata.fao.org/index.php/catalog/1641 (accessed on 2 November 2023).
- Sadi, M.A.; Henderson, J.C. In Search of Greener Pastures: Al-Marai and Dairy Food Business in Saudi Arabia. British Food Journal 2007, 109, 637–647. [CrossRef]
- Sadi, M.A. Marketing Trends and Future Challenges: A Review of Dairy Industry in Saudi Arabia. International Journal of Dairy Technology 2014, 67, 459–466. [CrossRef]
- Urban, G.L.; Hauser, J.R. Design and Marketing of New Products. 1993, 701.
- Ares, G.; Giménez, A.; Barreiro, C.; Gámbaro, A. Use of an Open-Ended Question to Identify Drivers of Liking of Milk Desserts. Comparison with Preference Mapping Techniques. Food Quality and Preference 2010, 21, 286–294. [CrossRef]
- Crisp, R. Equality, Priority, and Compassion. Ethics 2003, 113, 745-763+929. [CrossRef]
- Zaki Dizaji, H.; Adibzadeh, A.; Aghili Nategh, N. Application of E-Nose Technique to Predict Sugarcane Syrup Quality Based on Purity and Refined Sugar Percentage. J Food Sci Technol 2021, 58, 4149–4156. [CrossRef]
- Chapman, K.W.; Lawless, H.T.; Boor, K.J. Quantitative Descriptive Analysis and Principal Component Analysis for Sensory Characterization of Ultrapasteurized Milk. Journal of Dairy Science 2001, 84, 12–20. [CrossRef]
- Dos Santos, B.A.; Bastianello Campagnol, P.C.; da Cruz, A.G.; Galvão, M.T.E.L.; Monteiro, R.A.; Wagner, R.; Pollonio, M.A.R. Check All That Apply and Free Listing to Describe the Sensory Characteristics of Low Sodium Dry Fermented Sausages: Comparison with Trained Panel. Food Research International 2015, 76, 725–734. [CrossRef]
- van Kleef, E.; van Trijp, H.C.M.; Luning, P. Consumer Research in the Early Stages of New Product Development: A Critical Review of Methods and Techniques. Food Quality and Preference 2005, 16, 181–201. [CrossRef]
- Oupadissakoon, G.; Chambers, D.H.; Chambers IV, E. Comparison of the Sensory Properties of Ultra-High-Temperature (UHT) Milk from Different Countries. Journal of Sensory Studies 2009, 24, 427–440. [CrossRef]
- Gheisari, H.R.; Heydari, ;; Basiri, S. The Effect of Date versus Sugar on Sensory, Physicochemical, and Antioxidant Properties of Ice Cream; 2020; Vol. 21, pp. 9–14;.
- Tuorila, H.; Monteleone, E. Sensory Food Science in the Changing Society: Opportunities, Needs, and Challenges. Trends in Food Science and Technology 2009, 20, 54–62. [CrossRef]
- Husson, F.; Lê, S.; Pagès, J. Confidence Ellipse for the Sensory Profiles Obtained by Principal Component Analysis. Food Quality and Preference 2005, 16, 245–250. [CrossRef]
- Amerinasab, A.; Labbafi, M.; Mousavi, M.; Khodaiyan, F. Development of a Novel Yoghurt Based on Date Liquid Sugar: Physicochemical and Sensory Characterization. J Food Sci Technol 2015, 52, 6583–6590. [CrossRef]
- Næs, Tormod.; Brockhoff, P.B.; Tomić, Oliver. Statistics for Sensory and Consumer Science; Wiley, 2010; ISBN 978-0-470-51821-2.
- Cadena, R.S.; Cruz, A.G.; Faria, J.A.F.; Bolini, H.M.A. Reduced Fat and Sugar Vanilla Ice Creams: Sensory Profiling and External Preference Mapping. Journal of Dairy Science 2012, 95, 4842–4850. [CrossRef]
- Cadena, R.S.; Cruz, A.G.; Netto, R.R.; Castro, W.F.; Faria, J.D.A.F.; Bolini, H.M.A. Sensory Profile and Physicochemical Characteristics of Mango Nectar Sweetened with High Intensity Sweeteners throughout Storage Time. Food Research International 2013, 54, 1670–1679. [CrossRef]
- Cortez, P.; Cerdeira, A.; Almeida, F.; Matos, T.; Reis, J. Modeling Wine Preferences by Data Mining from Physicochemical Properties. Decision Support Systems 2009, 47, 547–553. [CrossRef]
- Cruz, A.G.; Cadena, R.S.; Castro, W.F.; Esmerino, E.A.; Rodrigues, J.B.; Gaze, L.; Faria, J.A.F.; Freitas, M.Q.; Deliza, R.; Bolini, H.M.A. Consumer Perception of Probiotic Yogurt: Performance of Check All That Apply (CATA), Projective Mapping, Sorting and Intensity Scale. Food Research International 2013, 54, 601–610. [CrossRef]
- van Kleef, E.; van Trijp, H.C.M.; Luning, P. Internal versus External Preference Analysis: An Exploratory Study on End-User Evaluation. Food Quality and Preference 2006, 17, 387–399. [CrossRef]
- Gaze, L.V.; Oliveira, B.R.; Ferrao, L.L.; Granato, D.; Cavalcanti, R.N.; Conte Júnior, C.A.; Cruz, A.G.; Freitas, M.Q. Preference Mapping of Dulce de Leche Commercialized in Brazilian Markets. Journal of Dairy Science 2015, 98, 1443–1454. [CrossRef]
- Abbès, F.; Bouaziz, M.A.; Blecker, C.; Masmoudi, M.; Attia, H.; Besbes, S. Date Syrup: Effect of Hydrolytic Enzymes (Pectinase/Cellulase) on Physico-Chemical Characteristics, Sensory and Functional Properties. LWT - Food Science and Technology 2011, 44, 1827–1834. [CrossRef]
- Castro, W.F.; Cruz, A.G.; Bisinotto, M.S.; Guerreiro, L.M.R.; Faria, J.A.F.; Bolini, H.M.A.; Cunha, R.L.; Deliza, R. Development of Probiotic Dairy Beverages: Rheological Properties and Application of Mathematical Models in Sensory Evaluation. Journal of Dairy Science 2013, 96, 16–25. [CrossRef]
- Documentation, I. System Requirements for SAS ® 9.2 Foundation for Microsoft ® Windows ® for X64; 2011;
- McEwan, J.A.; Schlich, P. Correspondence Analysis in Sensory Evaluation. Food Quality and Preference 1991, 3, 23–36. [CrossRef]
- Jridi, M.; Souissi, N.; Salem, M.B.; Ayadi, M.A.; Nasri, M.; Azabou, S. Tunisian Date (Phoenix Dactylifera L.) by-Products: Characterization and Potential Effects on Sensory, Textural and Antioxidant Properties of Dairy Desserts. Food Chemistry 2015, 188, 8–15. [CrossRef]
- Soomro, A.H.; Qureshi, T.A.; Khaskheli, M.; Arain, M.A.; Chaudhry, S.; Soomro, A.H. PhysicoChemical Quality of Camel Milk Physico-Chemical Quality of Camel Milk;
- Kouřimská, L.; Legarová, V.; Panovská, Z.; Pánek, J. Quality of Cows’ Milk from Organic and Conventional Farming. Czech Journal of Food Sciences 2014, 32, 398–405. [CrossRef]
- Hashim, I.B. Physiochemical and Sensory Properties of Ice-Cream Sweetened with Date Syrup. MOJ Food Processing & Technology 2016, 2. [CrossRef]
- Hashim, I.; Fathelrahman, E.; Hashim, I.B.; Omer, T.A. Consumer Acceptance and Marketing of Date Syrup Ice Cream in United Arab Emirates University; 2016; Vol. 5, pp. 7–11;.
Figure 1.
Scree plot of principal component analysis.
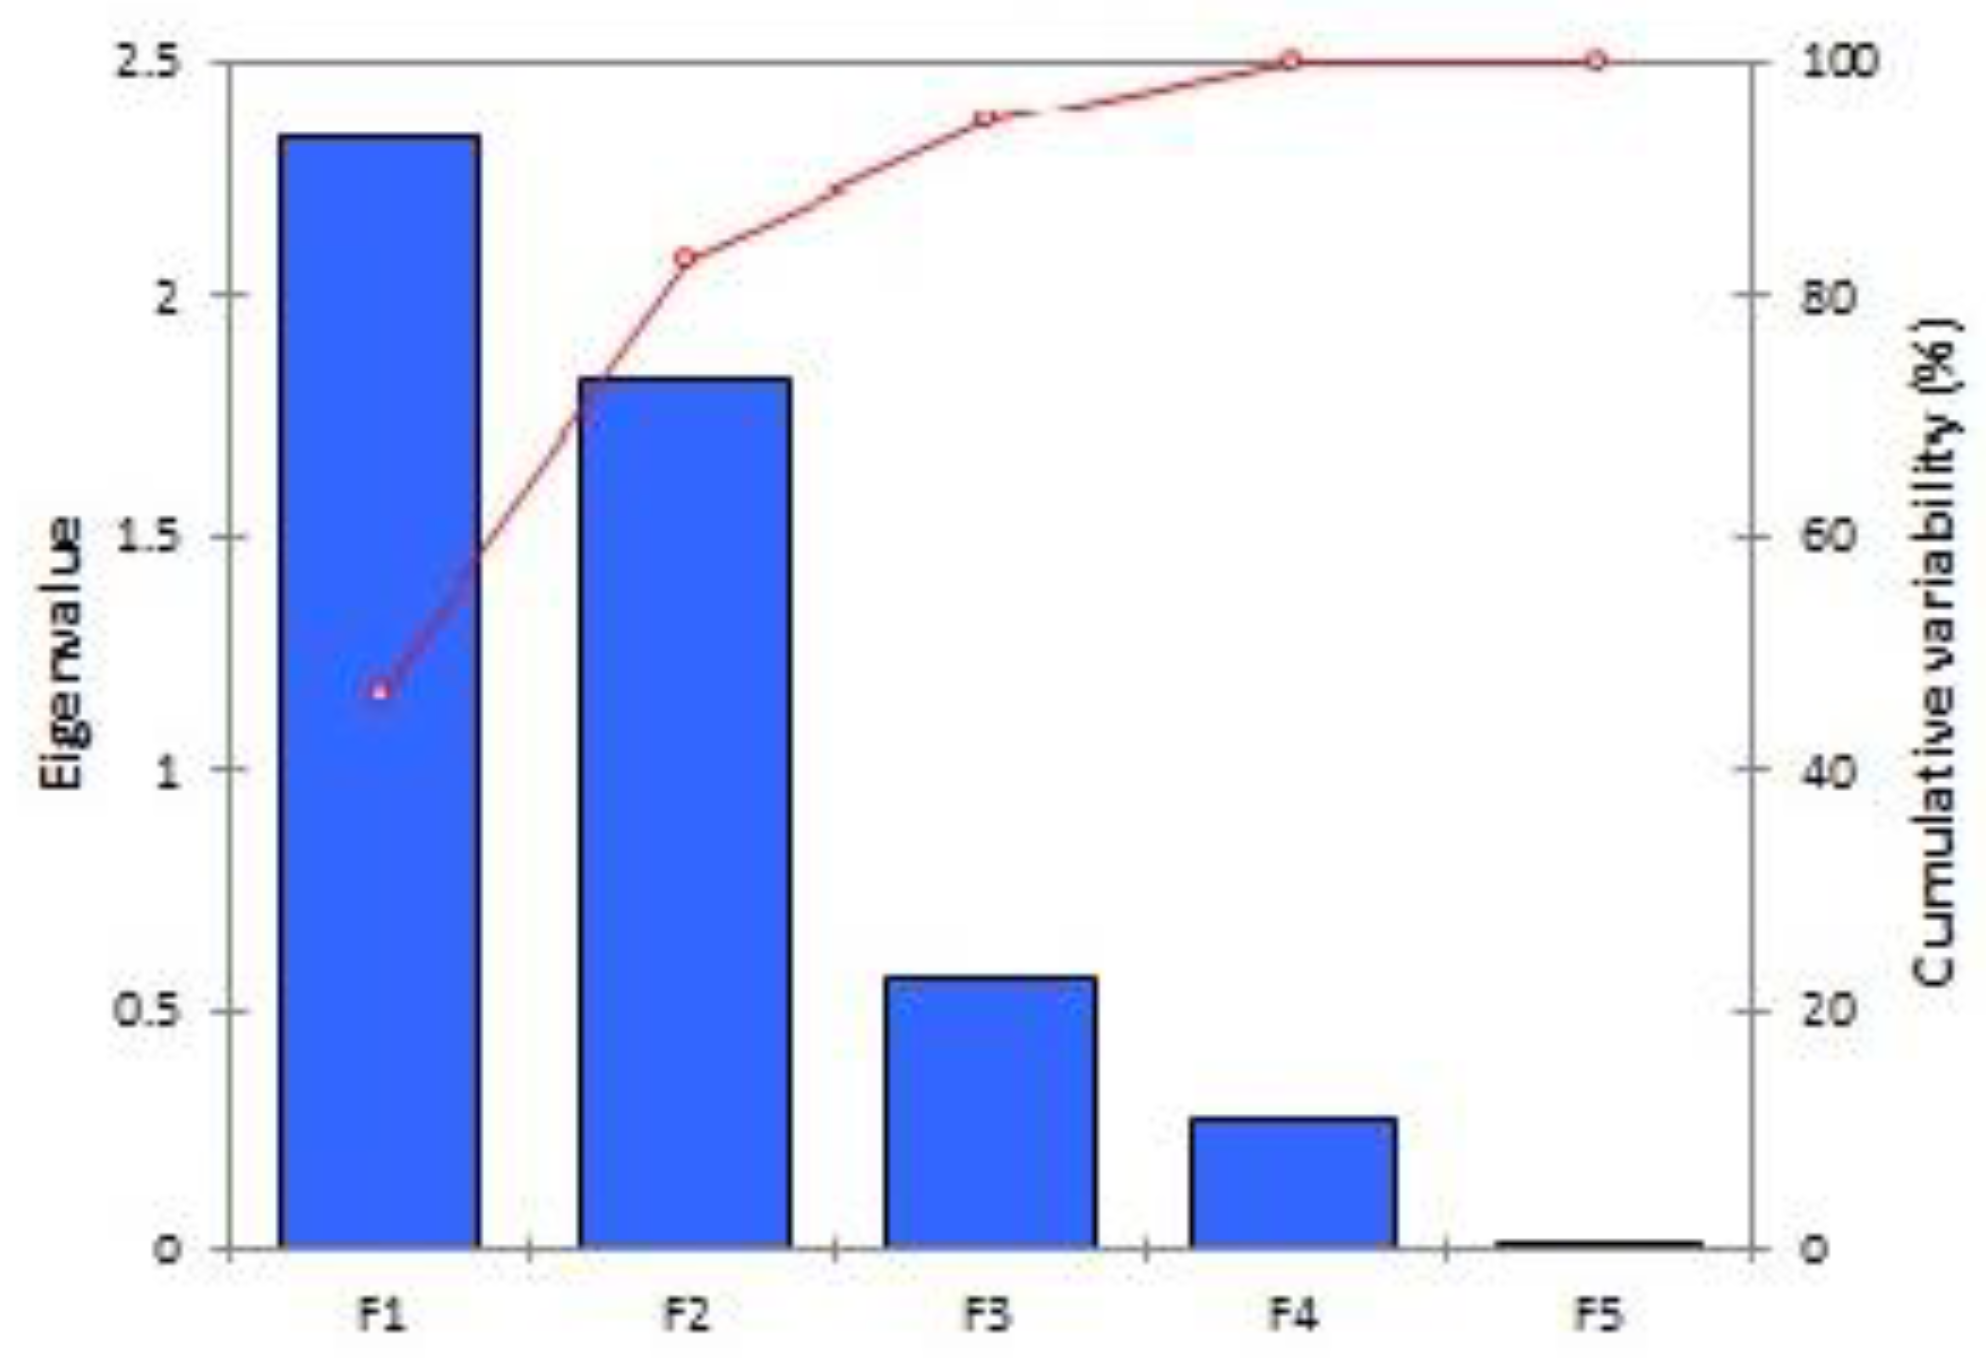
Figure 2.
Bi plot of sensory variables and samples in the first and second component sensory map. KH: Khlass variety, S: Sukkary variety, C: cow milk, K: camel milk, 5 to 25: Add-%.
Figure 2.
Bi plot of sensory variables and samples in the first and second component sensory map. KH: Khlass variety, S: Sukkary variety, C: cow milk, K: camel milk, 5 to 25: Add-%.
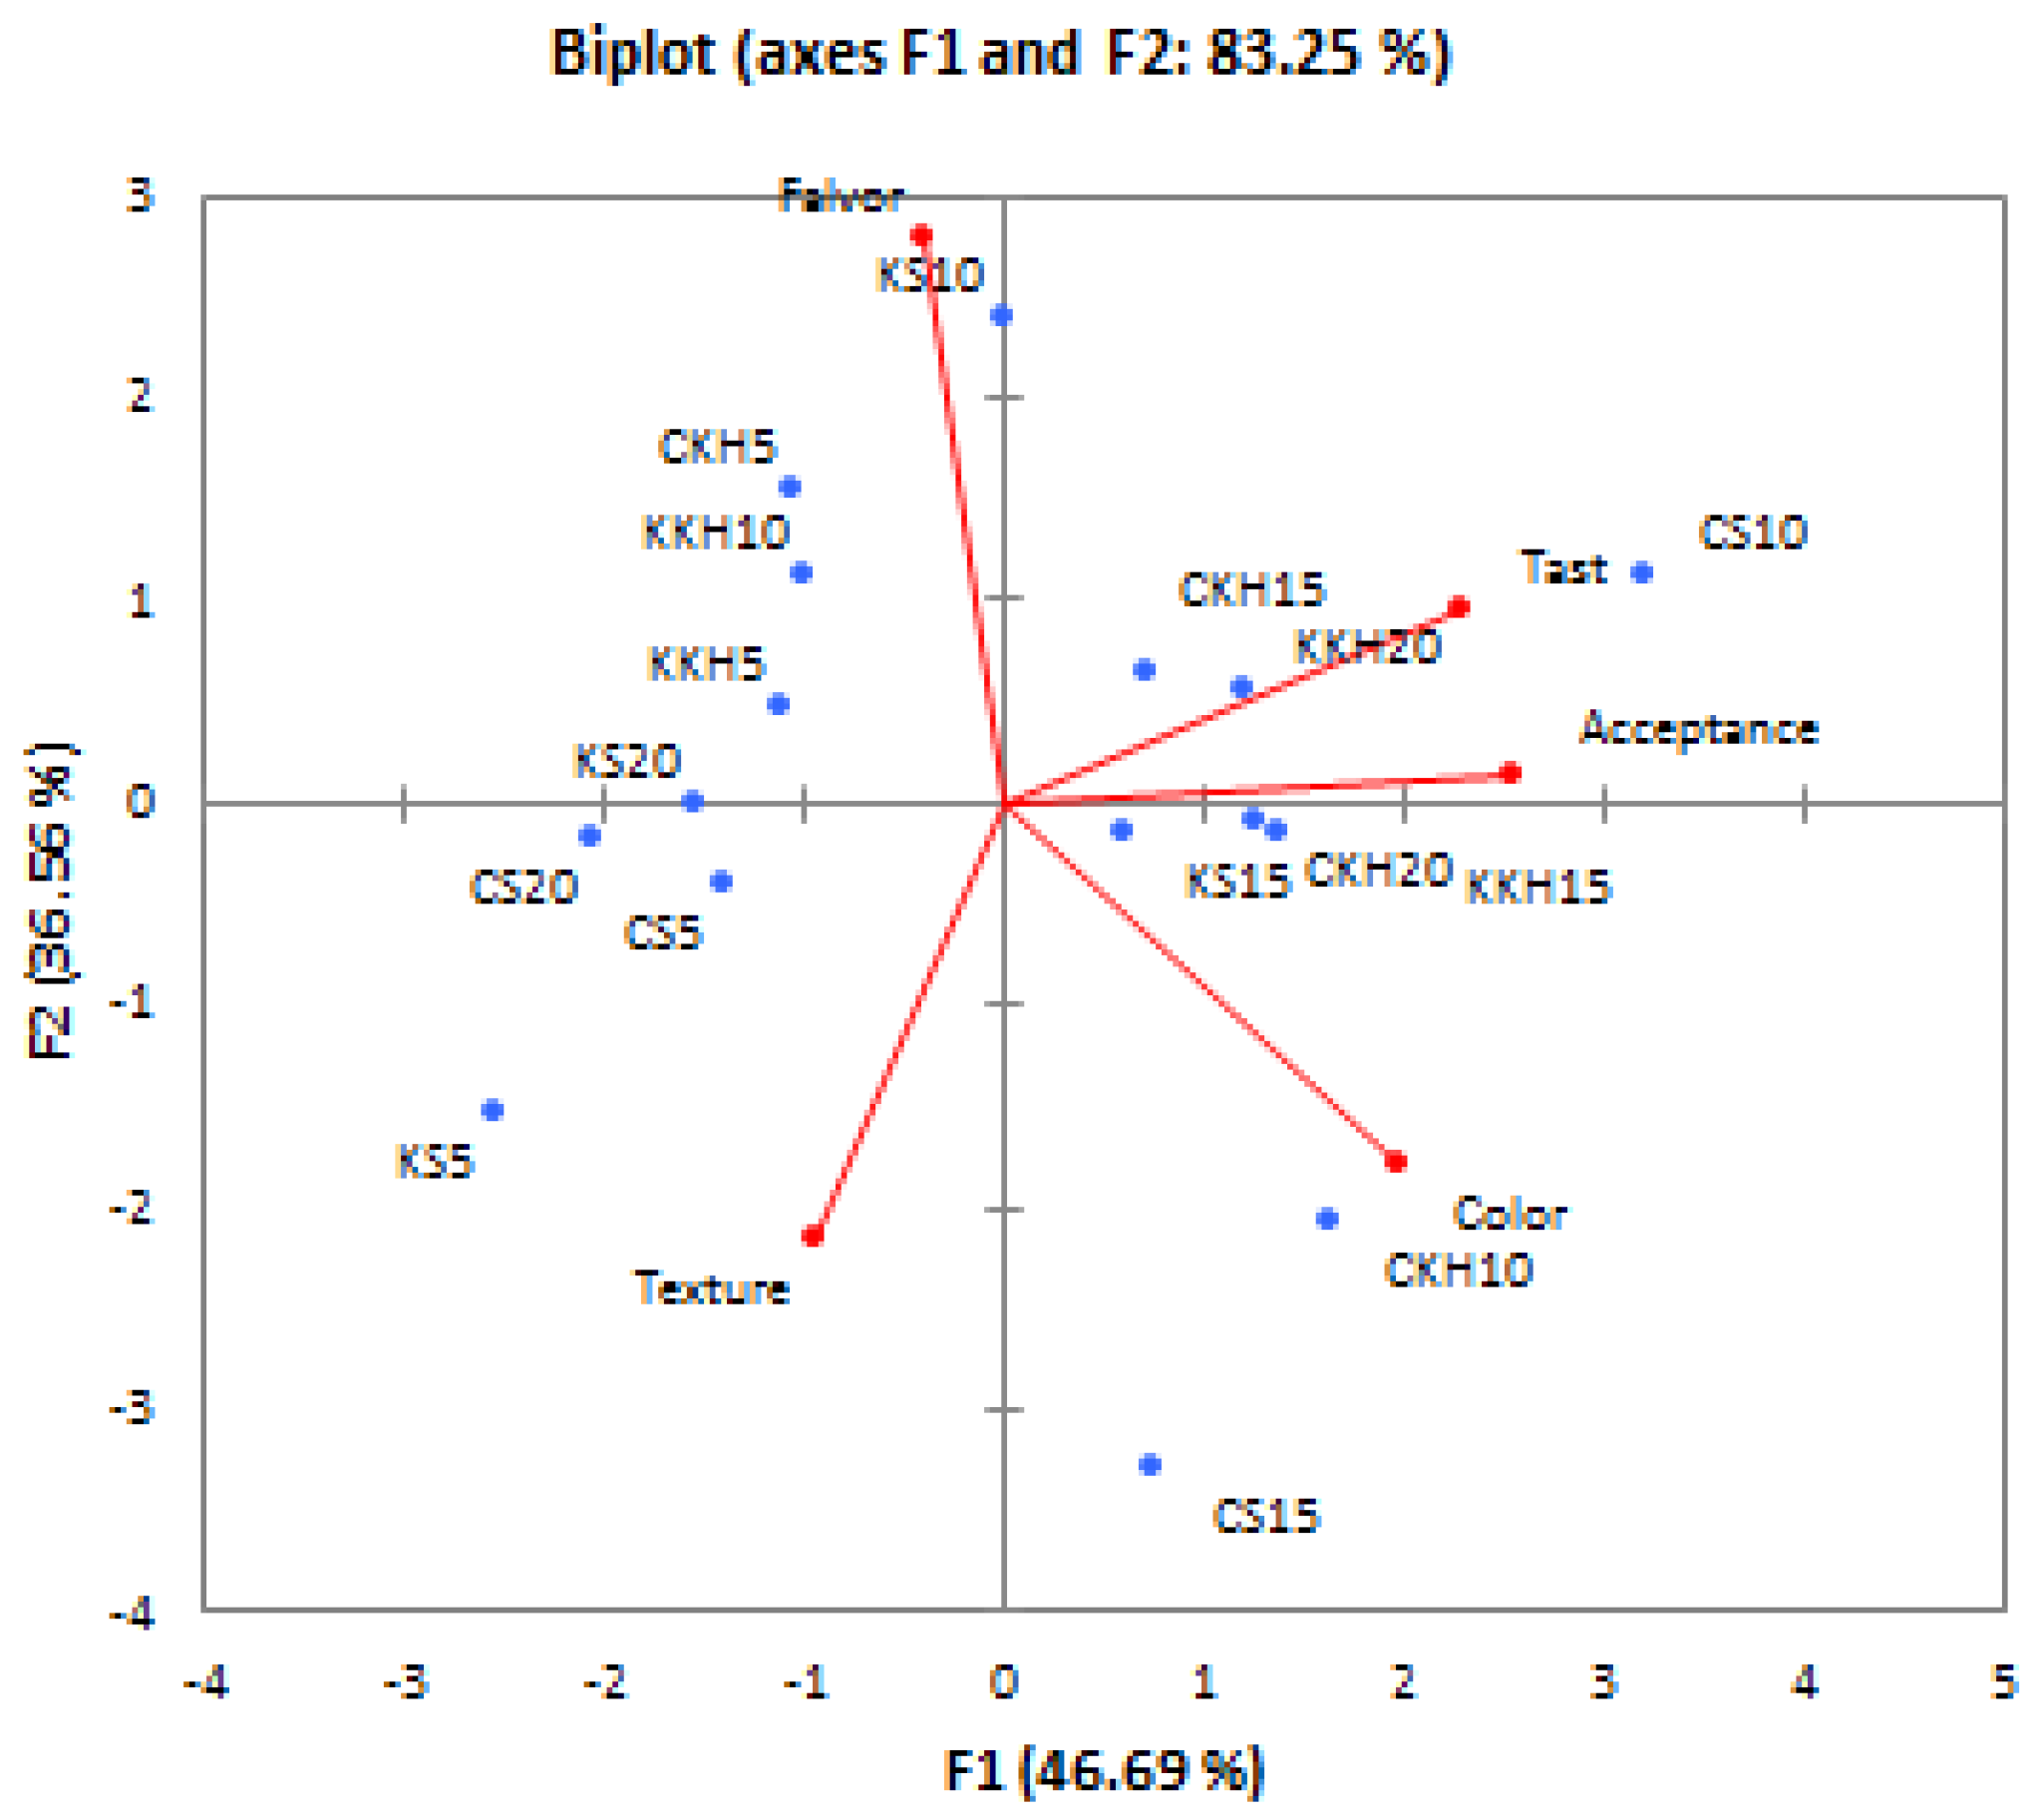
Figure 3.
Bi-dimensional preference map of components F1 and F2 with a demonstration of each sample. KH: Khlass variety, S: Sukkary variety, C: cow milk, K: camel milk, 5 to 25: Add-%.
Figure 3.
Bi-dimensional preference map of components F1 and F2 with a demonstration of each sample. KH: Khlass variety, S: Sukkary variety, C: cow milk, K: camel milk, 5 to 25: Add-%.
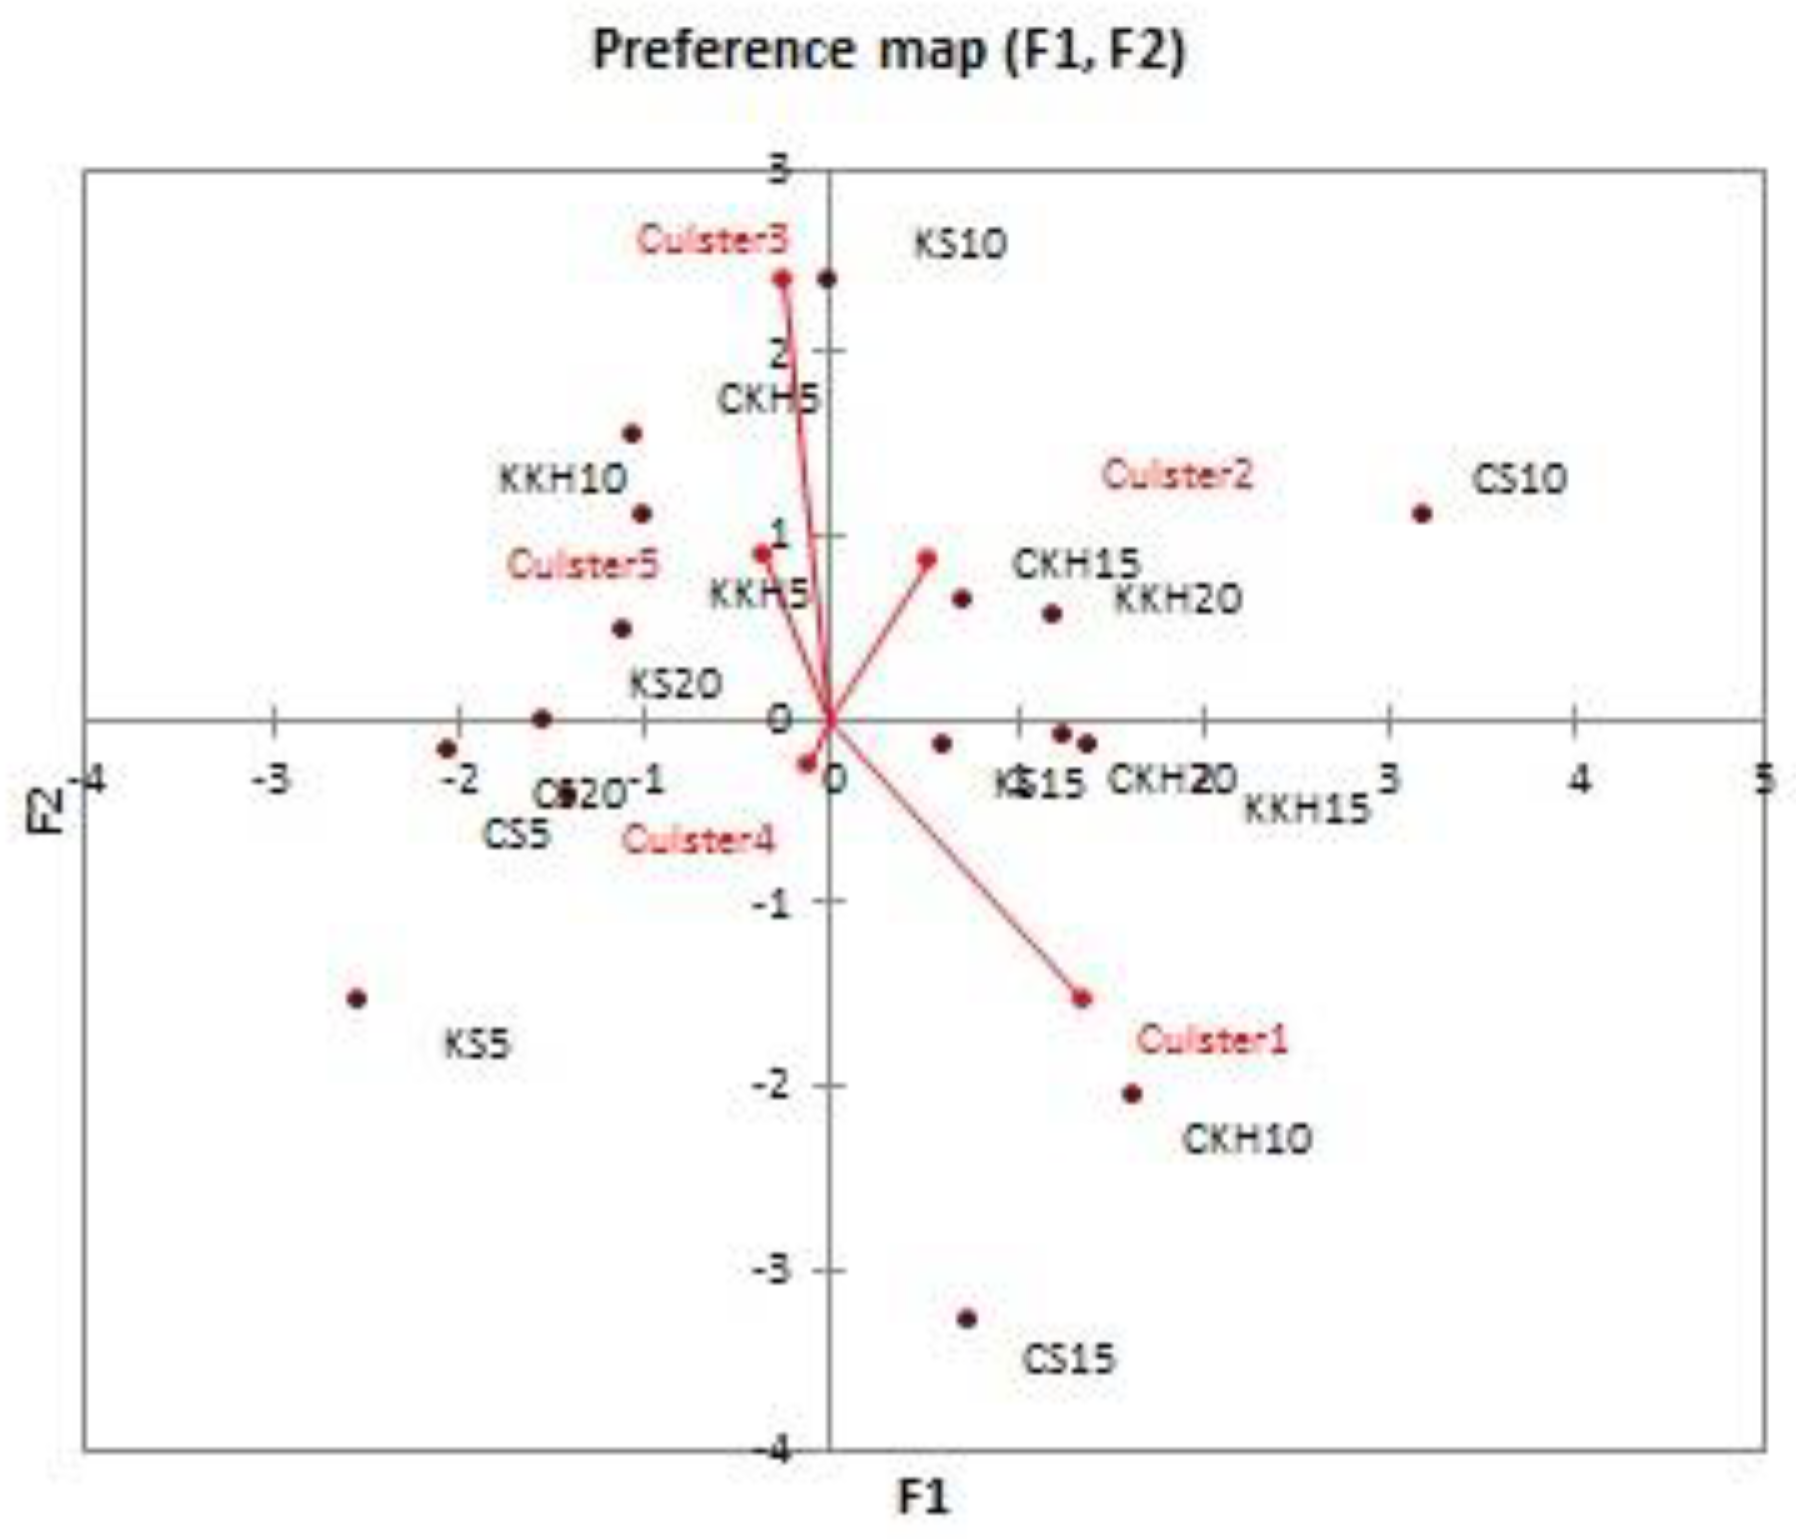

Table 1.
Main and interaction effect of milk type (cow and camel), date syrup (Sukkary and Khlass), and add-percentage (5-20%) on sensory evaluation. .
Table 1.
Main and interaction effect of milk type (cow and camel), date syrup (Sukkary and Khlass), and add-percentage (5-20%) on sensory evaluation. .
| Source of variation | Taste | Flavor | Texture | Color | Acceptance |
|---|---|---|---|---|---|
| Milk | *** | ** | *** | *** | *** |
| syrup | * | ns | ns | * | ** |
| Add% | *** | ** | *** | *** | *** |
| Milk*Add | *** | ** | ** | *** | * |
| Milk*Syrup | ** | *** | ** | ** | * |
| Syrup*Add% | *** | ** | * | *** | ** |
| Syrup*Add%*Milk | ** | *** | * | ** | ** |
* p<0.05, **p<0.01, ***p<0.001, and ns not significant.
Table 2.
Multipole comparison of sensory evaluation scores of the five attributes of dates syrup of (Sukkkary vs. Khlass), milk (cow vs. camel), add% (5 to 20%). * **.
Table 2.
Multipole comparison of sensory evaluation scores of the five attributes of dates syrup of (Sukkkary vs. Khlass), milk (cow vs. camel), add% (5 to 20%). * **.
| Milk | Date Syrup | Add % | Taste | Flavor | Texture | Color | Overall acceptance |
|---|---|---|---|---|---|---|---|
| Cow | Khlass | 5 | 4.5F | 6.7A | 5.5E | 1.9H | 4.7G |
| 10 | 5.6D | 4.7D | 5.9BC | 7.7B | 5.4B | ||
| 15 | 5.3E | 5.0C | 5.0G | 5.0G | 5.1CD | ||
| 20 | 6.0A | 3.6G | 5.8DC | 3.8I | 5.2C | ||
| Sukkary | 5 | 4.3G | 3.6G | 5.7D | 2.8K | 4.1I | |
| 10 | 7.7A | 4.7D | 4.3K | 6.7C | 5.9A | ||
| 15 | 5.4E | 2.9I | 6.0AB | 8.7A | 4.9FE | ||
| 20 | 3.5I | 4.3E | 5.7D | 2.2L | 4.0I | ||
| Camel | Khlass | 5 | 3.2J | 4.9C | 6.1A | 4.1H | 4.3H |
| 10 | 4.5F | 3.0I | 4.9HG | 2.8K | 4.1I | ||
| 15 | 6.2B | 3.0I | 4.8HI | 5.8D | 5.0DE | ||
| 20 | 6.0C | 3.5HG | 4.3K | 5.5E | 4.8FG | ||
| Sukkary | 5 | 3.2J | 3.0I | 4.3K | 2.8K | 3.6K | |
| 10 | 6.2B | 6.2B | 4.6IJ | 1.7N | 4.7G | ||
| 15 | 6.0C | 3.8F | 5.2F | 5.2F | 4.9FE | ||
| 20 | 3.9H | 3.4H | 5.0G | 3.0J | 3.8J |
* The similar letter in each column indicates that the average values are not significantly different at P<0.05. ** The nine hedonic scale from (1): dislike extremely to (9): like extremely.
Table 3.
Percentage of variance and percentage accumulated variance for each principal component.
| F1 | F2 | F3 | F4 | F5 | |
|---|---|---|---|---|---|
| Variability (%) | 46.692 | 36.557 | 11.363 | 5.379 | 0.009 |
| Cumulative (%) | 46.692 | 83.249 | 94.612 | 99.991 | 100.000 |
Table 4.
Contribution of the variables (%).
| F1 | F2 | |
|---|---|---|
| Taste | 31.356 | 5.435 |
| Flavor | 0.899 | 46.902 |
| Color | 23.195 | 19.325 |
| Texture | 5.423 | 28.210 |
| Overall Acceptance | 39.127 | 0.129 |
Table 5.
Frequencies and involvement percentage for each cluster.
| Culster1 | Culster2 | Culster3 | Culster4 | Culster5 | |
|---|---|---|---|---|---|
| Frequencies | 134 | 140 | 62 | 92 | 52 |
| Percentage | 28% | 29% | 13% | 19% | 11% |
| Variance Within cluster | 19.697 | 24.206 | 14.236 | 19.270 | 15.155 |
| Minimum distance to centroid | 3.759 | 3.722 | 3.244 | 3.507 | 3.220 |
| Average distance to centroid | 4.392 | 4.875 | 3.718 | 4.304 | 3.828 |
| Maximum distance to centroid | 6.406 | 5.953 | 4.834 | 5.643 | 4.290 |
Table 6.
The overall liking for each cluster and the sample preferences within clusters.*.
| Culster1 | Culster2 | Culster3 | Culster4 | Culster5 | |
|---|---|---|---|---|---|
| CS5 | 3.88B | 2.42I | 2.82F | 3.49E | 4.59A |
| CS10 | 2.57F | 3.32BCD | 3.95C | 4.35C | 1.98G |
| CS15 | 3.04D | 2.54HI | 3.18E | 4.60AB | 3.31D |
| CS20 | 3.11D | 2.91F | 2.23G | 4.48BC | 1.00K |
| CKH5 | 2.54F | 3.39BC | 3.96D | 3.73D | 2.42F |
| CKH10 | 4.33A | 2.65HG | 1.98H | 2.16H | 1.59I |
| CKH15 | 3.96B | 3.45B | 1.73I | 4.76A | 2.40F |
| CKH20 | 2.19H | 4.01A | 2.06GH | 2.66G | 1.92GH |
| KS5 | 2.27H | 2.82FG | 2.76F | 3.09F | 3.04E |
| KS10 | 2.79E | 1.78J | 4.31A | 3.46E | 4.48A |
| KS15 | 2.21H | 3.11E | 4.16AB | 2.58G | 1.40J |
| KS20 | 2.78E | 3.24BCD | 4.00BC | 3.02F | 1.79H |
| KKH5 | 2.31HG | 3.21DE | 2.18G | 2.52G | 2.52F |
| KKH10 | 2.47HG | 3.45B | 4.29A | 1.91I | 3.31D |
| KKH15 | 4.00B | 2.69HG | 2.24G | 2.17H | 3.81B |
| KKH20 | 3.40C | 2.91F | 3.11E | 2.26H | 3.58C |
* The similar letter in each column indicates that the average values are not significantly different at P<0.05. ** KH: Khlass variety, S: Sukkary variety, C: cow milk, K: camel milk, 5 to 25: Add-%.
Disclaimer/Publisher’s Note: The statements, opinions and data contained in all publications are solely those of the individual author(s) and contributor(s) and not of MDPI and/or the editor(s). MDPI and/or the editor(s) disclaim responsibility for any injury to people or property resulting from any ideas, methods, instructions or products referred to in the content. |
© 2023 by the authors. Licensee MDPI, Basel, Switzerland. This article is an open access article distributed under the terms and conditions of the Creative Commons Attribution (CC BY) license (http://creativecommons.org/licenses/by/4.0/).
Copyright: This open access article is published under a Creative Commons CC BY 4.0 license, which permit the free download, distribution, and reuse, provided that the author and preprint are cited in any reuse.


