
Submitted:
20 April 2024
Posted:
23 April 2024
You are already at the latest version
Abstract
Tomato is considered moderately sensitive to salinity, which detracts from the quality and yield of its fruit; therefore, wild populations have been used as a genetic resource. The aim of this research was to identify lines derived from wild tomato populations with tolerance to salinity during the germination and seedling stages. During germination, 52 wild lines and 2 commercial hybrids (Imperial®, Reserva®) were subjected to 150 mM and 0 mM NaCl and evaluated. The test was carried out for 20 days in a germination chamber with constant darkness, temperature of 25±2 °C and relative humidity of 80±4%. At the seedling stage, 22 wild tomato lines with the best performance in the germination test and 2 commercial hybrids (Imperial®, Topanga®) were evaluated for 12 days in a floating raft system. Concentrations of 175 mM and 0 mM NaCl were used. During germination, the saline condition decreased germination percentage (65.2%), speed of germination (88.2%), steam length (72.5%), root length (46.56%), normal plants number (59.5%), stem dry matter (68.78%), root dry matter (61.99%), and total dry matter (67.1%). At the seedling stage, this condition decreased (P<0.05) the aerial part dry matter (46.37%), leaf area (59.35%), root length (42.43%), final plant height (40.24%), and growth rate (71.42%). Seventeen tolerant genotypes were identified at one of both developmental stages, while one genotype showed tolerance at both stages. These results indicate that there are different response mechanisms in each developmental stage. Native tomatoes play an important role in the identification of tolerant genotypes since they can be used as genetic resources for obtaining commercial genotypes with salt tolerance.
Keywords:
salt tolerant genotypes
; wild tomato
; developmental stages
; seed germination
1. Introduction
Nine percent of the Earth’s land surface (1257 million ha) and 50% of its agricultural land is affected by salts [1]; this condition is responsible for significant crop yield losses, with an annual value of up to $30 billion [2]. In Mexico, the irrigated agricultural area is 9.23 million hectares, out of which 60% is affected by sodium and salinity whereas from the rainfed agricultural area, 8.91 million hectares, 19.7% suffers from these conditions [3]; indicating that almost a fifth of the agricultural land area faces these problems. Salt-affected areas are increasing due to the use of saline water and intensive use of groundwater for irrigation, excessive application of chemical fertilizers and irrational crop rotation [4]; therefore, one of the current challenges facing agriculture is to increase crop production under salinity conditions. One of the strategies being followed to address this problem is the development of salt stress-tolerant varieties.
Excess soil salinity generates ionic stress in plants due to the increase in toxic ions such as Na+ and Cl- that alter the ionic balance of the cell membrane, causing organ destruction, alterations in protein synthesis, structural changes of enzymes and respiratory disorders [5]. Osmotic stress is also generated due to the limited availability of water resulting from the increase in osmotic pressure, which decreases growth by inhibiting water uptake by the roots, which in turn generates oxidative damage and may cause plant death [6,7,8]. Some agronomically important traits adversely affected by salt stress include germination, leaf development, leaf area, plant height, root length, dry matter accumulation, photoassimilate production, etc. [9,10].
Plant salinity tolerance is directly associated with the phenological stage, the affected plant organ, the duration and severity of the stress, and the environmental factors that cause it [11,12,13,14]. The genetic component is also of great importance since wild tomatoes with salt tolerance have multiple regulatory mechanisms of Na+ accumulation, including osmoregulation, regulation of ion uptake and distribution, and efficient antioxidant defense [11,15,16].
Wild tomato species represent a valuable genetic resource for improving commercial varieties since genetic variability in cultivated tomato is scarce; however, it is necessary to initially characterize native materials to identify the type of tolerance they may possess [17], since the use of uncharacterized accessions may indicate that commercial cultivars have greater tolerance to salinity [18,19,20]. This is especially true in the case of wild species phylogenetically related to tomato, which have greater resistance to salts; such is the case of Solanum sitiens, Solanum pimpinellifolium, Solanum galapaguense, Solanum cheesmaniae, Solanum chilense and Solanum peruvianum [2,21,22,23,24,25,26].
Some S. pimpinellifolium accessions have high salt tolerance, making them potential candidates for breeding [2,27], since being closely related to S. lycopersicum they have been used as a donor to commercial tomato of many important traits [27]. S. galapaguense and S. cheesmaniae, wild species endemic to the Galapagos Islands, have been harnessed to transfer salinity tolerance, so that improved plants can be irrigated with one-third seawater [25].
Tomato wild populations are still very frequent, and it is possible to find them in a tolerated, promoted, and even cultivated form; in fact, wild tomato has showed high ability to disperse and overrun perturbated areas; it is used as food, in the preparation of sauces and as a medicinal plant [28]. Ramírez-Ojeda et al. [29] identified areas of high diversity of wild tomato populations into areas with high-diversity climate conditions, which coincide with known areas of great diversity and regional use of wild tomatoes.
Given the great genetic variation of wild species and especially those native to Mexico, one of the centers of domestication of this species [30], information on its tolerance to salts is still scarce since its study initially requires phenotypic characterization and subsequently the identification of specific genes that confer resistance to this condition. Therefore, the evaluation of phenotypic traits of a plant, such as its architecture and biochemical properties, is key to explaining plant growth and yield under salt stress conditions [31]. The limited study of native materials is due to their low commercial importance, and hence their scarce cultivation, despite their extraordinary culinary and nutraceutical characteristics. Thus, they are used mainly for local consumption in regional stews, associated to the cultural richness of the different cultures in the country.
Because commercial tomato breeding has focused on the development of disease-resistant cultivars with commercial fruit quality [32], tolerance to abiotic stresses has not been decisively addressed; moreover, the difficulty of identifying this tolerance in conventional germplasm forces us to resort to wild populations as an alternative that is still far from being properly addressed in view of the wide diversity of native and wild tomatoes.
This research aimed to identify lines, derived from wild tomato populations, with tolerance to salinity during germination and seedling stages for their probable use in breeding.
2. Materials and Methods
The experiments were established in Tomato Breeding Program (PMGT) greenhouses operated by the Universidad Autónoma Chapingo (UACh) located at NL 19°30’0.0” and WL 98°53’00 and 2247 masl.
The genotypes evaluated were lines derived from wild tomato populations of the PMGT and the Wild Tomato Breeding Program of the Colegio de Postgraduados (Table A1), as well as three commercial hybrids used as controls: Imperial® (Enza Zaden), Reserva® (Vilmorin) and Topanga® (Rogers Seeds). The evaluated lines were derived from wild population by mean of individual selection and were maintained by selfing.
2.1. Germination Salt Tolerance Test
Fiftyfive wild tomato lines and the commercial hybrids Imperial® (Enza Zaden) and Reserva® (Vilmorin) were evaluated using a sodium chloride concentration of 150 mM (13.7 dS·m-1), as well as a control with the absence of NaCl (0 mM). The used NaCl concentration was selected based on previous laboratory tests and various investigations [Cuartero et al. 1992; Singer, 1994; El-Habbasha et al. 1996; Sri-nivas, 2001; Sholi, 2012; Goykovic et al. 2014; Albalejo et al. 2017; Adilu & Gebre, 2021; Ávila-Amador et al. 2023; Bogoutdinova et al. 2023]. Since the concentration of 150 mM NaCl was not a lethal dose, it allowed us to discriminate tolerant genotypes from those susceptible. The Imperial variety has an indeterminate habit for greenhouse production systems, it has large fruits (260 g), round type, red in color, with high commercial quality, long shelf life, high firmness and high yield. The Reserva variety has the same characteristics, although its fruit is a medium-sized saladette type (120 g) and develops better in temperate to cold environments.
The experimental unit consisted of a 5.5 cm diameter Petri dish, with 25 seeds and filter paper as substrate, saturated with 2 ml of distilled water or with the saline solution (150 mM). A completely randomized experimental design with four replicates was used. The germination test was carried out for 20 days in a germination chamber (LAB-TECH INC Model D-7140) in constant darkness, a temperature of 25±2 °C and relative humidity of 80±4%.
Germinated seeds were counted daily for 20 days. A seed was considered germinated when radicle protrusion occurred. At the end of the test, the following were evaluated: germination percentage (GP), stem length (SL, in cm), root length (RL, in cm), number of normal plants (NP), accumulated stem dry matter (SDM, in mg), accumulated root dry matter (RDM, in mg), total dry matter (TOTDM, in mg) and speed of germination (SG), according to the formula proposed by Maguire [33]:
where: number of counts performed during the test; number of seeds germinated between count and count ; number of days after sowing at count i.
Analysis of variance and Tukey’s multiple comparison test (α≤0.05) were performed on the evaluated traits. Additionally, Pearson linear correlations were obtained for each pair of variables. The SAS statistical package, version 9.1, was used.
2.2. Salt Tolerance Test in Seedlings
Twenty-two wild tomato lines (with the best performance in the germination test) and 2 commercial hybrids were evaluated: Imperial® (Enza Zaden) and Topanga® (Rogers Seeds). The Topanga variety has a semi-indeterminate habit, irregular semi-round type, with intermediate performance in greenhouse production systems. The experiment was conducted under greenhouse covered with 30% shade plastic. The minimum, maximum and average temperatures recorded were 6.2 °C, 34.3 °C and 21.3 °C, respectively. The relative humidity ranged from 17.2 to 80.0%, with an average of 61.9%; and the radiation ranged from 23.6 to 500.8 umol·s-1, with an average of 114.2 umol·s-1.
The genotypes were planted in 200-cavity polystyrene trays with Oasis® peat foam substrate. Transplanting was carried out in a floating raft system (expanded polystyrene plates) in wooden boxes measuring 2.4 m x 1.2 m and 20 cm high, covered with polyethylene and with a capacity of 500 liters of nutrient solution. The nutrient solution used was 0.589 kg·m-3 Ca(NO3)2, 0.101 kg·m-3 KNO3, 0.123 kg·m-3 KH2PO4, 0.171 kg·m-3 MgSO4, 0.033 kg·m-3 librel mix, 0.012 kg·m-3 FeSO4, 0.007 kg·m-3 borax and 0.022 kg·m-3 H2SO4. Transplanting to the floating raft system was performed 20 days after sowing.
Four days after transplanting (DAT), NaCl was applied to the nutrient solution to achieve the concentration of 175 mM NaCl (15.9 dS·m-1); likewise, a treatment without salt application (0 mM NaCl) was considered. The 175 mM NaCl concentration was obtained by considering the molecular weight of NaCl (58.4398), multiplied by 0.175. This corresponds to adding 10.227 g of NaCl to a liter of nutritive solution. The selection of NaCl concentration was based on previous tests and the results by Saeed et al. 2010; Wafa’a, 2010; Sanjuan-Lara et al. 2015; Ávila-Amador et al. 2023; Bogoutdinova et al. 2023. The floating raft system used with this concentration allowed the survival of seedlings for 12 days after the application of treatments used to discriminate tolerant and susceptible genotypes.
The experimental unit consisted of 5 seedlings of which the three central ones were evaluated. A randomized complete block experimental design with three replicates was used for each NaCl concentration.
Seedling height (SH, in cm) was recorded from three EU seedlings every three days. At the end of the trial, 12 days after the application of NaCl (16 DAT), the following were quantified: root length (RL, in cm), aerial part dry matter (APDM, in g), and root dry matter (RDM, in g). Leaf area (LA, in cm2) was determined by capturing digital photographs and processing with ImageJ software (v1.4.3.67; National Institutes of Health).
The evaluated traits were subjected to analysis of variance as a series of experiments (NaCl concentrations) in a randomized complete block design; additionally, Tukey's test (α≤0.05) was performed, and Pearson linear correlations were obtained for each pair of variables.
Plant height (PH) was measured on four occasions (3, 6, 9 and 12 DAT); a regression analysis with the exponential model was performed for each experimental unit:
where: expectancy for plant height, days after transplanting, parameter indicating plant height growth rate, natural logarithm base 2.718281828).
Statistical analyses were obtained with the SAS package version 9.1.
3. Results
3.1. Germination under Salinity Conditions
The analysis of variance (Table 1) showed significance (α≤0.05) in all traits evaluated for concentration (CON), genotypes (GEN) and their interaction (CONxGEN), except for RL in CON. This indicates differential effects caused by salt stress, and by genotypic differences; in addition, some genotypes had different behavior across NaCl concentrations. Coefficients of variation were high due to the high-level salt stress, which increased variations within treatments.
Mean comparisons of NaCl concentrations (Table 2) indicated that the 150 mM dose decreased (α≤0.05) all evaluated traits. Salt stress reduced GP by 65.2% and SG by 88.2%, causing the germination period to extend to 20 days in most genotypes evaluated. In contrast, in the absence of stress, germination occurred within 10 days. SL and RL reduced by 72.5% and 46.56%, respectively and the dry weights SDM, RDM and TOTDM by 68.78%, 61.99% and 67.1%, respectively.
Linear correlations (Table 3) indicated that the evaluated traits are strongly associated with each other in a positive way (α≤0.05), because they assess seed vigor during germination, which is reduced in the presence of NaCl; hence the negative correlations with this factor, especially with SG and SL (α≤0.05). These results agree with what is indicated by the comparisons of means of the NaCl concentration factor (Table 2).
Mean comparisons of the genotype x NaCl concentration (GENxCON) interactions of 19 selected genotypes are presented in Table 4, which includes 12 genotypes with outstanding performance, 7 with the highest susceptibility (the information of the 57 genotypes is presented in Table S1 of the Supplementary Materials).
3.2. Development of Tomato Seedlings under Salinity Conditions
Analyses of variance of the seedling NaCl tolerance test (Table 5) indicated that at least one genotype (GEN) and NaCl concentrations (CON) had different behavior (α≤0.05) in all traits evaluated. The interaction of both factors (GENxCON) showed significance in APDM, RDM, LA and PH (α≤0.05), so the genotypes have different behavior across NaCl concentrations. The coefficients of variation (CV) were low, less than 21.5%, so the information generated can be considered reliable.
Mean comparisons of the CON factor (Table 6) indicate that the 175 mM concentration reduced (α≤0.05) all evaluated variables except RDM. APDM was reduced by 46%, attributed to a 59% reduction in LA and a 40% decrease in PH, while RDM had no significant reduction. The β coefficient, which represents the PH daily growth rate, decreased (α≤0.05) by 71%, and was the trait most affected by NaCl. The trend of increasing RDM under salt stress is striking, although such differences were not significant (α≤0.05) with respect to the absence of NaCl.
Pearson correlations (Table 7) indicated that the evaluated variables are strongly associated with NaCl concentration, especially plant height growth rate (β), RL and LA (α≤0.05). Increases in PH corresponded with increases in APDM and LA (α≤0.05). They also indicated that APDM had a strong association with LA.
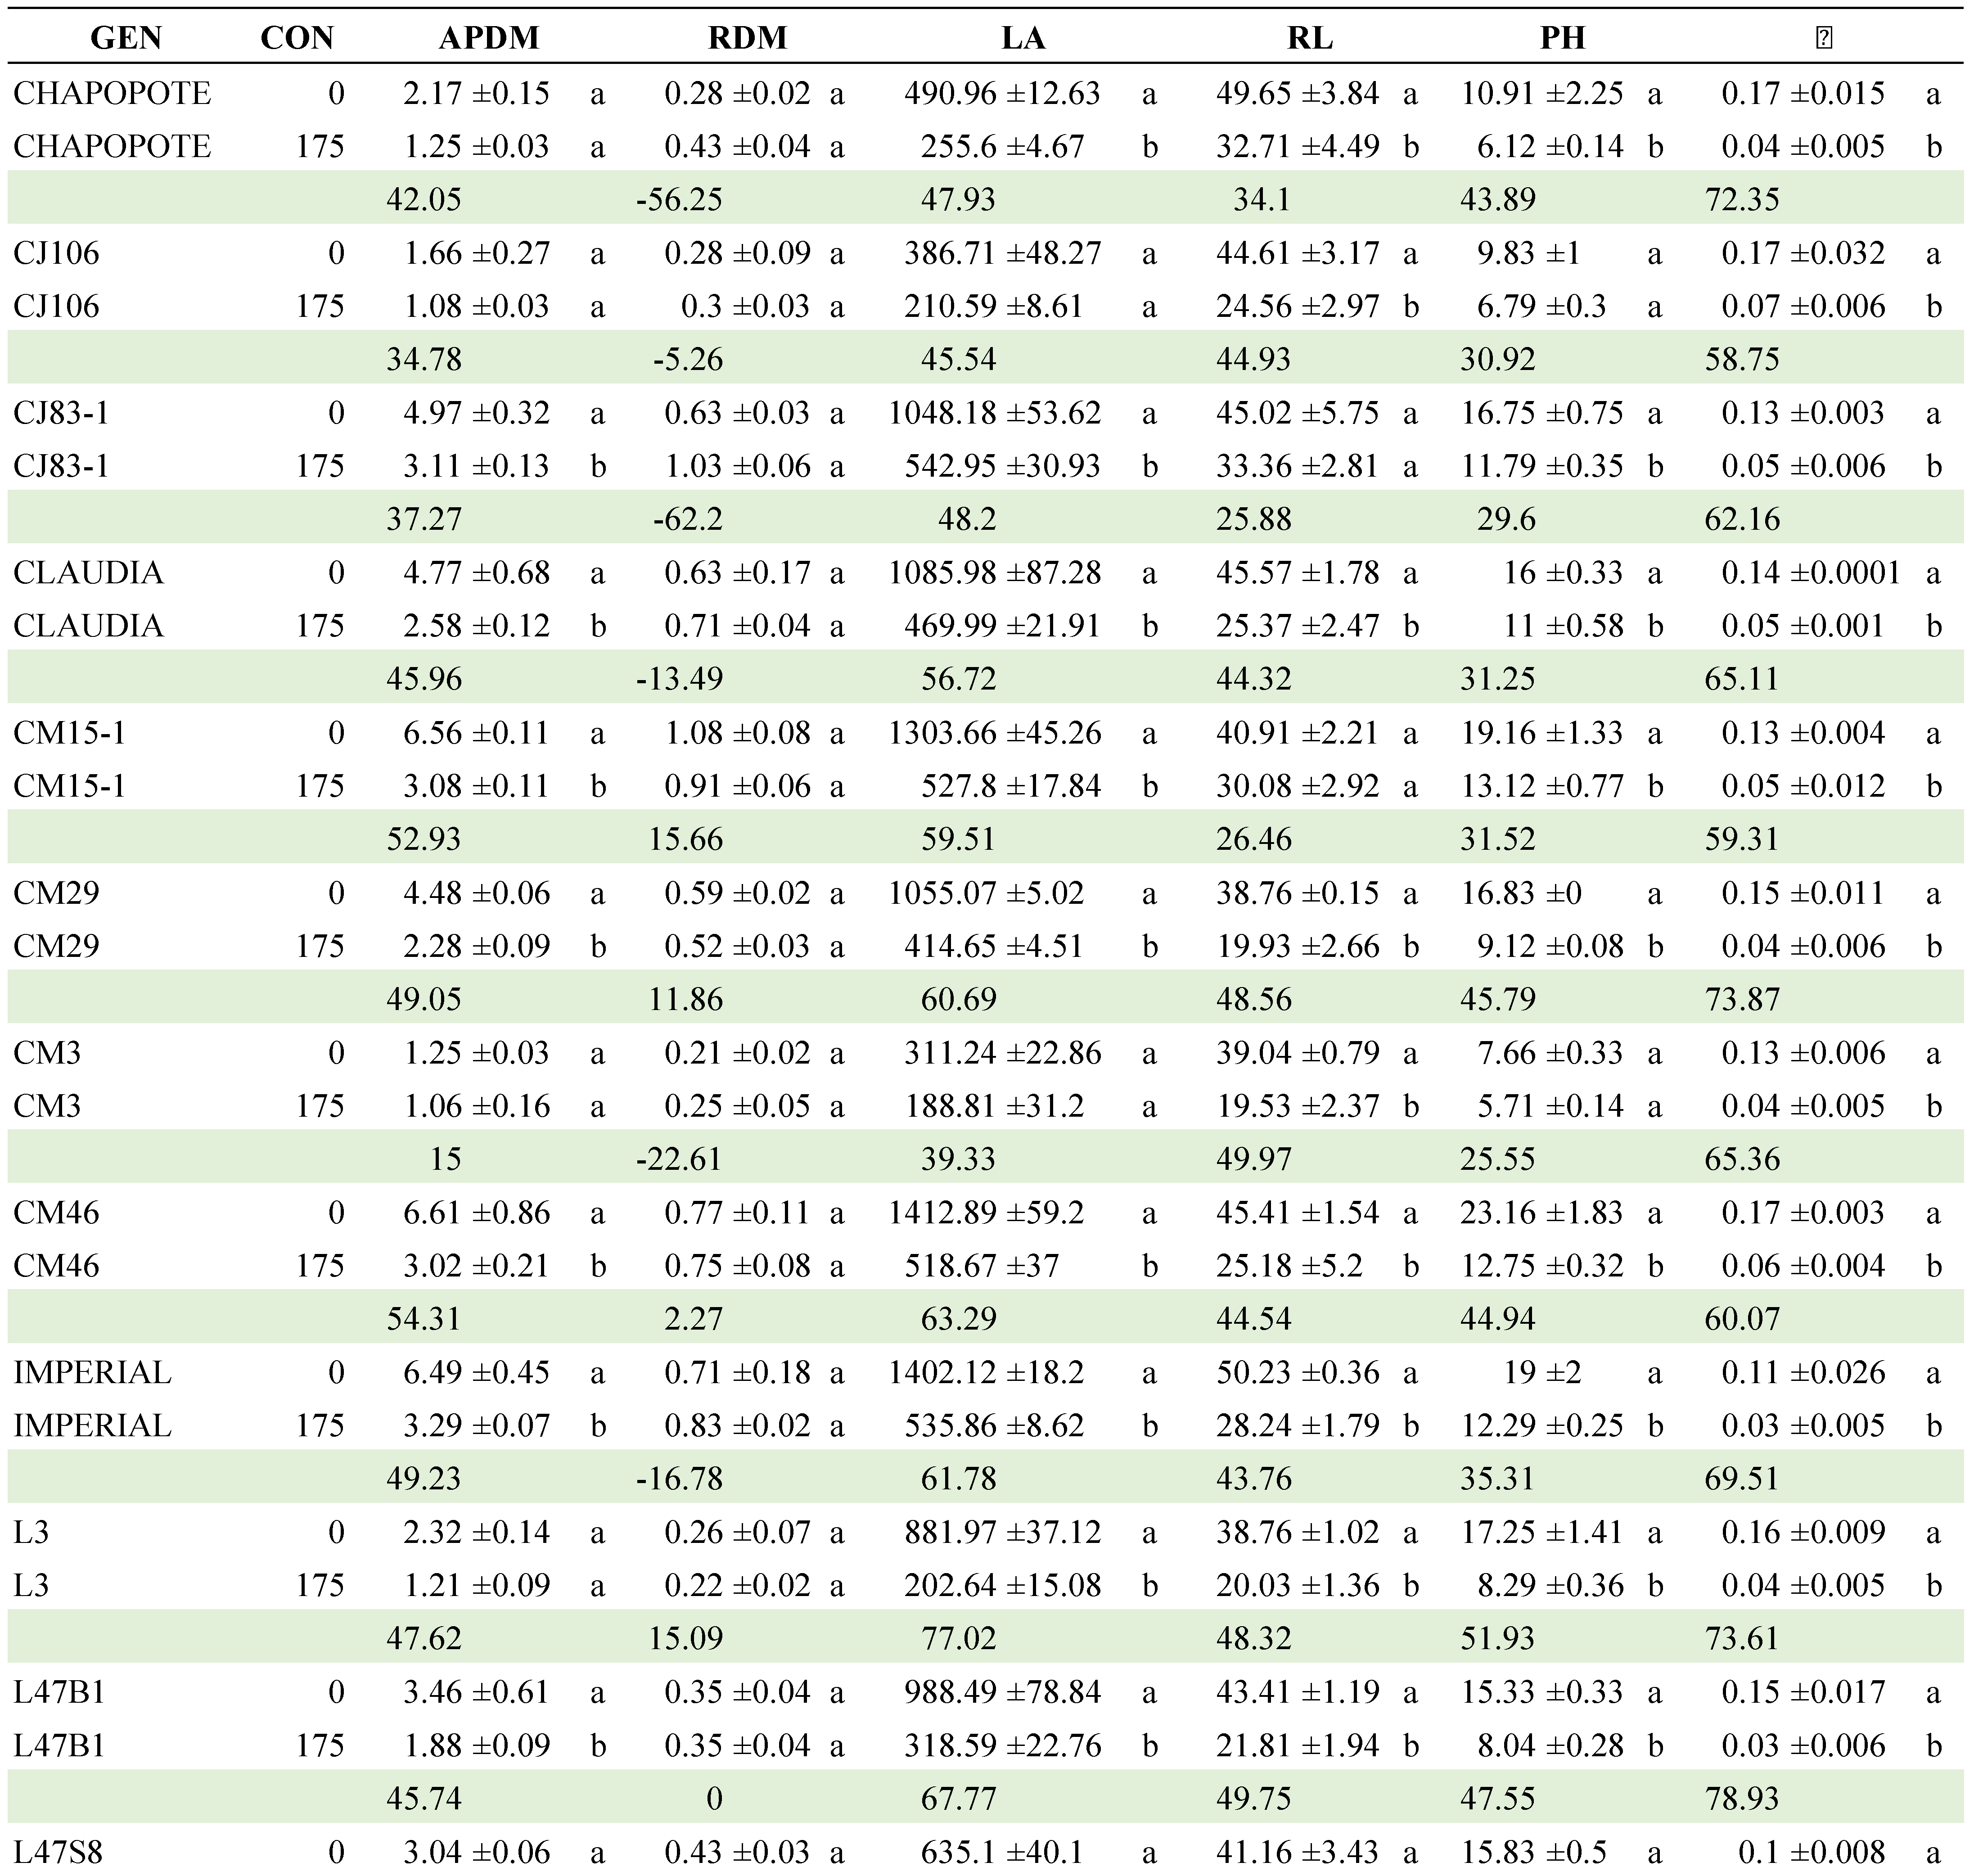
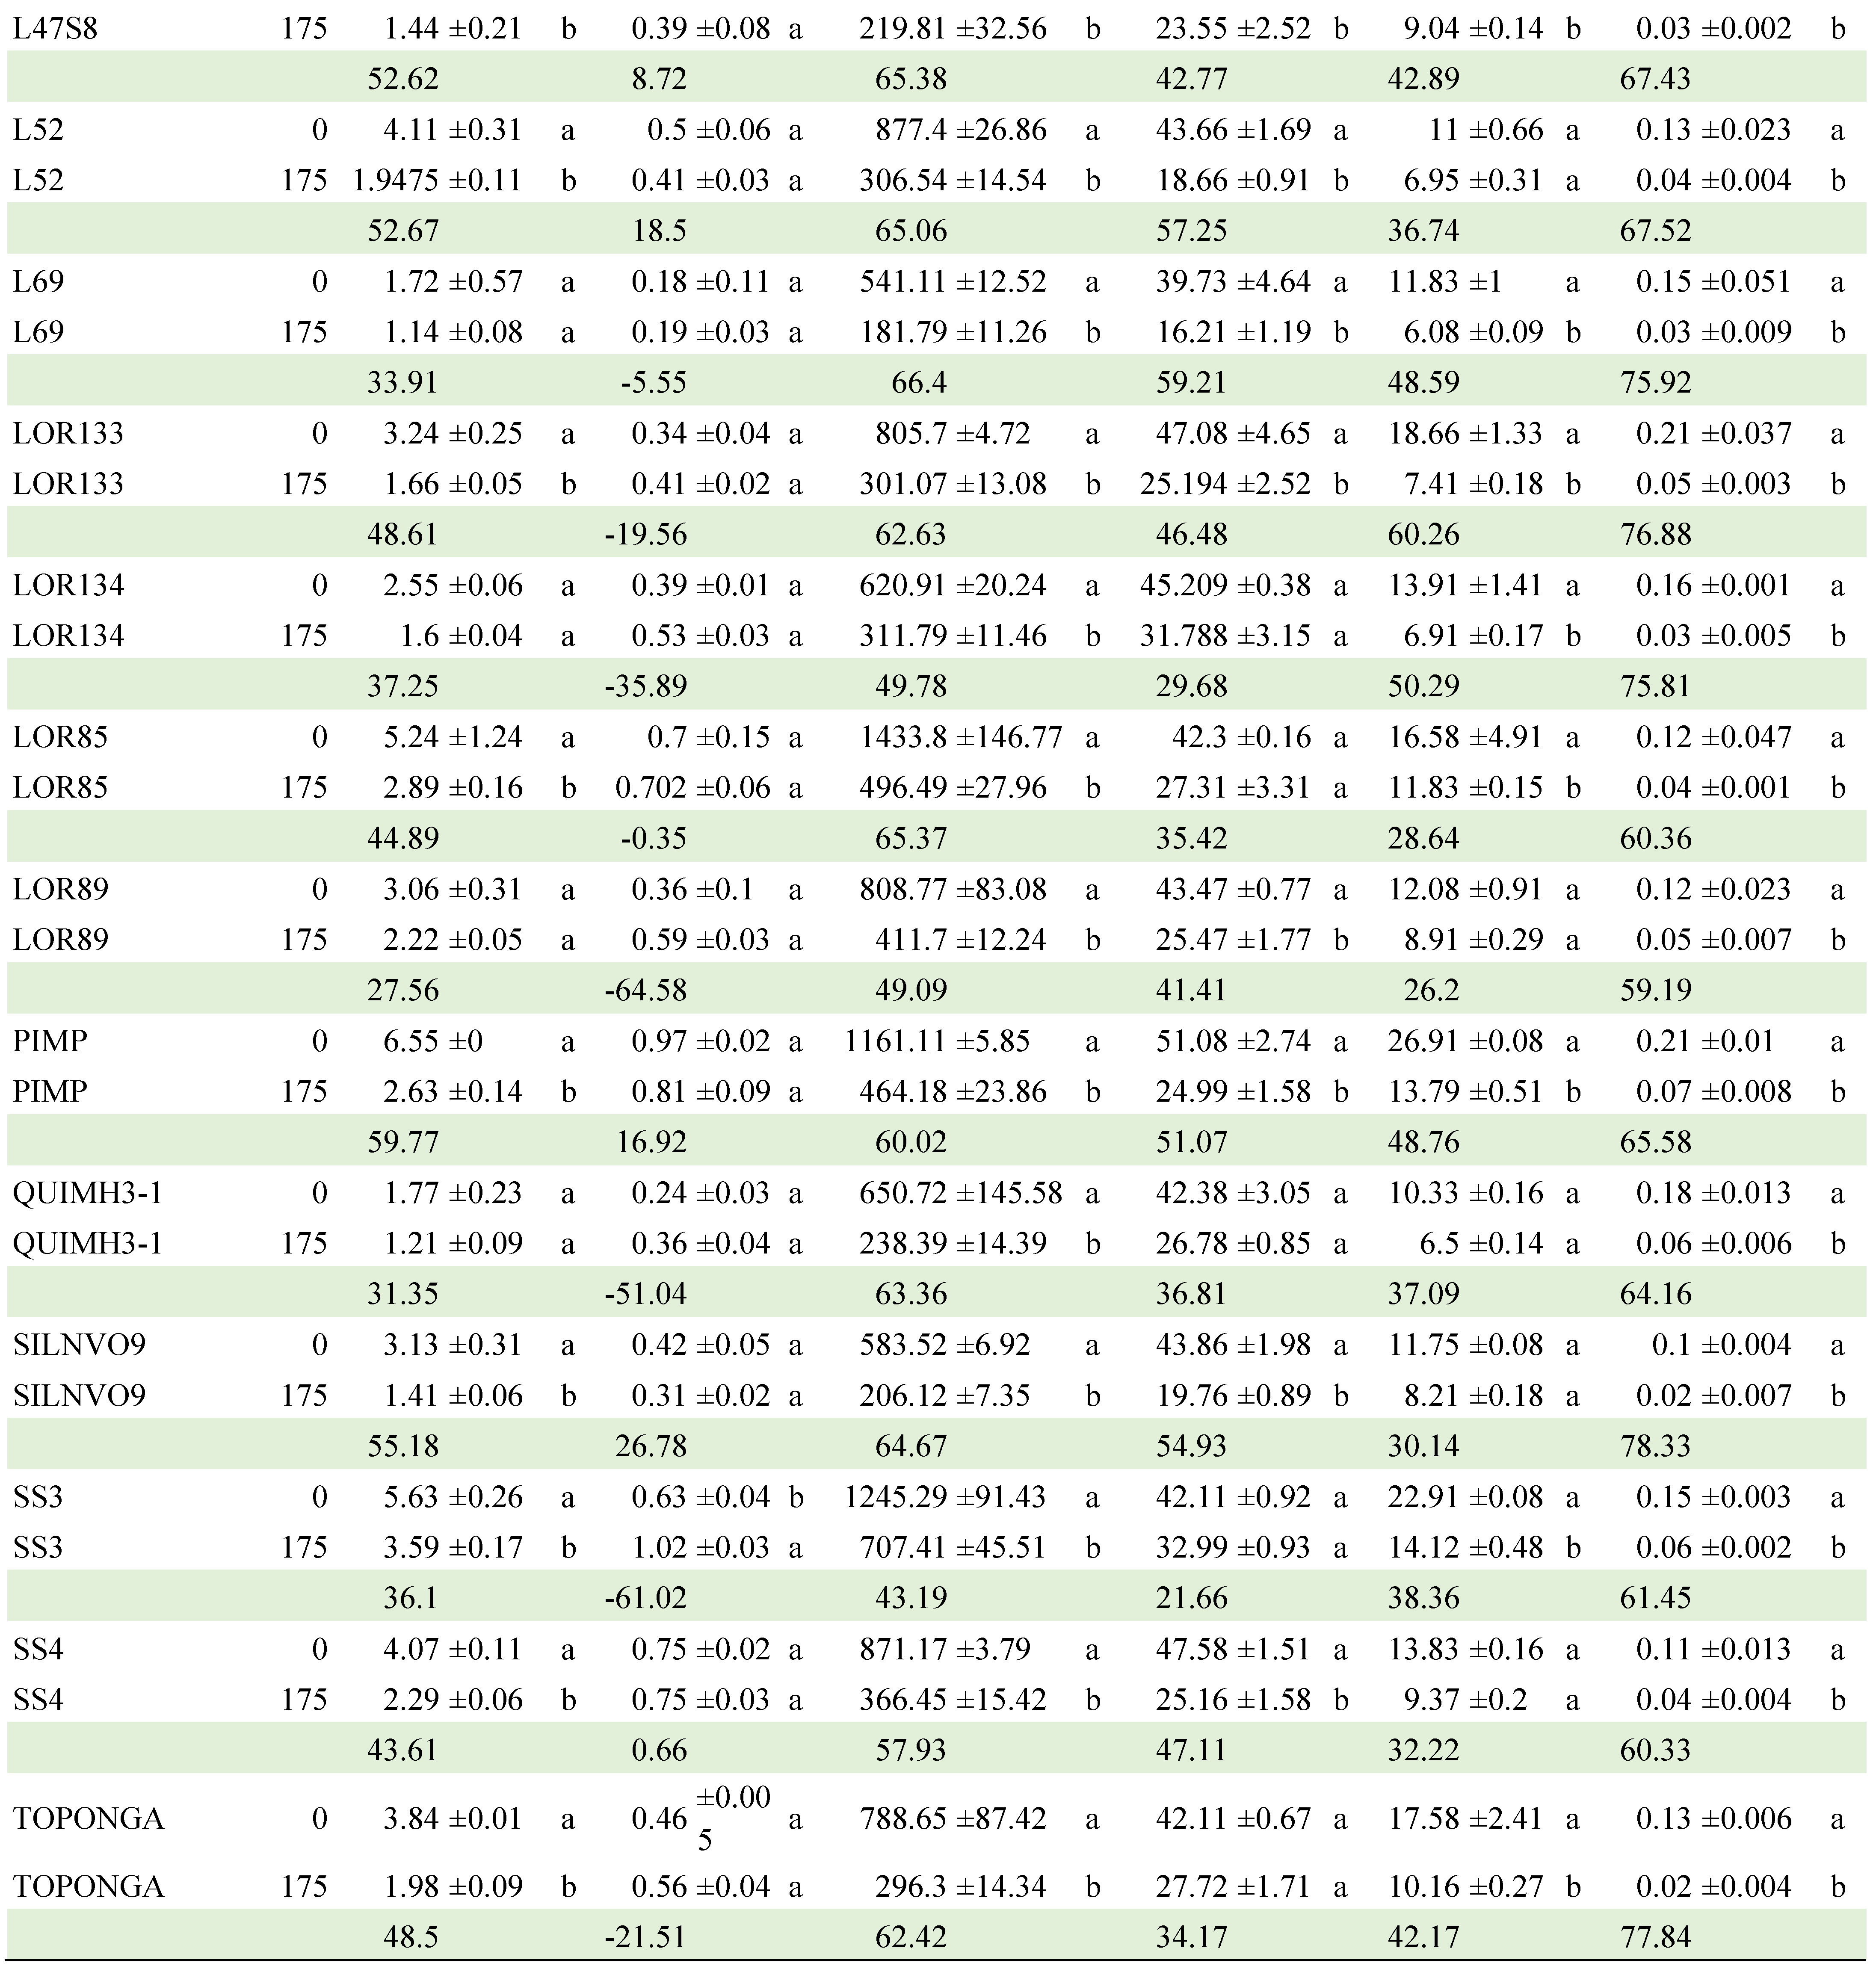
Regarding the CON x GEN interaction, Table 8 presents the comparison of means between the two NaCl concentrations within each of the genotypes (Table A2). CJ106, CM3 and QUIMH3-1 did not differ (α≤0.05) when going from 0 to 175 mM NaCl in four of the six variables evaluated; that is, these genotypes can be considered as the most tolerant to NaCl exposure. In contrast, Claudia, CM29, CM46, Imperial, L47B1, L47S8, LOR133, Pimpinellifolium and SS3 had statistical differences in 5 of the 6 traits evaluated, making them the genotypes with the lowest tolerance. The commercial hybrids did not tolerate the saline condition and, in general, the native lines performed better in this condition.
4. Discussion
4.1. Germination Test
All evaluated characters were highly susceptible to saline concentration, since their expression decreased more than 50%, where germination speed and stem length were the most affected with reductions greater than 72%.
The significant decrease in germination speed and seed development during germination is due to the inhibition of water uptake caused by NaCl [9,13]. This leads to the reduction in the germination percentage and prolongs the germination period by more than 50% with 80 mM NaCl, and by almost twice as long with 190 mM NaCl [18,34,35].
In our research, GP decreased 65.2% with 150 mM NaCl; in contrast, the Rio Grande variety, when subjected to 85 mM NaCl, decreased by only 6.4% compared to the control, while, in 171 and 257 mM NaCl, the germination percentage on the third day was 2.0 and 0.8%, respectively [36].
There are multiple mechanisms that explain the salt tolerance of wild tomatoes such as the regulation of Na+ and Cl- ion absorption and distribution, osmoregulation and antioxidant defense [10,15]. Likewise, wild tomatoes have shown advantages over commercial varieties under salt stress conditions (3, 6, 9 and 10.2 dS·m-1), highlighting their importance as a genetic reservoir for tolerance to this condition [37,38,39].
Under concentrations of 112 mM NaCl (10.2 dS·m-1), Solanum peruvianum accessions have been identified with greater tolerance than S. pimpinellifolium and S. lycopersicum, showing greater germination and plumule and root growth [37]. At 150 mM (13.7 dS·m-1), NaCl, significant reductions in germination percentage and biomass production occur; however, at this concentration Solanum chilense and Solanum peruvianum showed outstanding performance [40].
One of the processes involved in salt tolerance is associated with the regulation of water potential by osmotic regulation, through the synthesis of amino acids, sugars and other osmoregulators [41]. These results and those of our research indicate the possibility of selecting salinity-tolerant genotypes during germination, as there is variation in the responses of the genotypes to this condition, so it is necessary to identify the mechanisms and their association with visual and physiological characteristics for improvement.
One of these mechanisms is the speed of germination rate, which is a reliable and easy to verify indicator (Maguire). With 0 and 150 mM, the time required to reach 50% germination was 2.45 days in the control, while with 150 mM it took 8.51 days; susceptible genotypes further decreased their germination speed. Research on the subject reports germination delays of 100% due to inefficient regulatory processes [42]. Increasing the concentration (50, 100 and 150 mM) of salt delayed seed germination of four tomato cultivars; at 150 mM, after 10 days of incubation, only one of the evaluated cultivars achieved 50% germination [43]. NaCl concentrations of 50, 100 and 200 mM NaCl reduced the speed and percentage of tomato seed germination, which may be due to the deterioration of enzymatic activity by Na+ and Cl- ion toxicity [44], while with 0 and 4 dS·m-1, they managed to germinate at 5.3 and 8.34 days after sowing, respectively [45].
Low NaCl concentrations induce seed dormancy, since, with increasing salinity concentrations, the germination speed and germination percentage decreased, but mean germination time increased, while high concentrations inhibit germination due to the decrease in the water potential gradient between the seeds and the surrounding medium; coupled with this, the osmotic and toxic effects of NaCl reduce enzymatic activity and ABA content [46,47].
Previous studies have indicated the negative root: stem relationship in terms of increasing salt concentration, that is, stem growth is restricted while root growth is less hindered [46], whereas in this study the RL:SL ratio showed a positive relationship (0.63) which is high, attributed to high expression in the roots of transporters such as HKT1:2, which participate in the transfer of Na+ from the shoot to the root [48]. Thus, growth inhibition is due to the toxicity of Cl- and Na+ ions and the nutritional imbalance they generate [49].
Our results (Table 7), like those of Ludwiczak et al. [50] show that the greater sensitivity to salt in aerial and/or root growth is a particular genotypic response, because the effects of salt on the morphology of the different organs of plants occur at all stages of development and negatively affect diverse organs such as the stem, root and leaves (size, weight, dry matter); and characteristics like percentage and speed of germination and root/shoot ratio [51].
4.2. Development of Tomato Seedlings under Salinity Conditions
Tukey's mean comparisons of the evaluated traits (Table 6) indicate that the 175 mM concentration reduced (α≤0.05) all evaluated variables except for RDM. APDM was reduced by 46%, while RDM had no significant reduction. Considering that salt stress also implies osmotic stress, similar to that caused by drought, the low water availability could have contributed to modifying the relationship between the growth of the aerial part and that of the root, since the latter continued its development in search of water in deeper areas, while the aerial part stopped its growth [47]. However, these results suggest that an ionic stress could be affected the plant performance due to high NaCl concentrations [49].
PH reduced (α≤0.05) in saline conditions since this stress causes reductions in plant height and changes in the number and size of leaves. This could be due to the toxicity of Na+ and Cl- ions and the nutritional imbalance induced by salinity [49]. Likewise, root length of tomato lines is severely reduced at a concentration of 150 mM [5]
During the first hours of exposure to salts, stomatal closure and inhibition of cell expansion occur, mainly in the growth buds. Therefore in prolonged periods of salt-induced stress, leaves decrease their growth, become stunted and frequently turn blue-green. This is due to the increase in respiration and the activity of the chlorophyllase enzyme, which decreases chloroplast activity, photosynthesis and chlorophyll content, triggering chlorosis symptoms (CIAT). Similarly, metabolic disorders ensue and decrease their efficiency and speed of these process, leading to premature senescence and ultimately cell death (Isayenkov and Maathuis, 2019; Rosca et al., 2023).
By reducing the availability of soil water, salinity causes a decrease in the water and osmotic potential of the plant to maintain water absorption by the root (Sheldon et al. 2017), however, in the face of high concentrations or prolonged stress conditions plant growth is compromised, causing a decrease in fresh weight and dry matter accumulation (Derkaoui et al. 2022). We observed a similar phenomenon in our study, as the provided saline conditions decreased the dry weight of the aerial plant tissue, affecting overall development by reducing leaf size, plant height and leaf number.
Sánchez et al. [52] observed that leaf area decreased by 33% in the Raf cultivar under a salinity level of 11 dS·m-1. Likewise, De Pascale et al. (2012) [53] indicate that saline water with electrical conductivity of 4.4 dS·m-1 used in tomato irrigation reduced leaf area by 47.55% with respect to the control.
SanJuan-Lara et al. [14] evaluated the response of 48 lines obtained by individual selection in a native tomato population at five levels of electrical conductivity (4, 6, 8, 8, 10 and 12 dS·m-1) at seedling stage, finding that salinity reduced the number of leaves by 12%, stem diameter by 17%, leaf area by 38% and plant height by 40%, some percentages being similar to those obtained in the present study.
According to the above, it is possible that tomato genotypes have various strategies to tolerate salinity depending on morphology and growth habits [54]. Plant tolerance to salt is mediated by several biochemical pathways that favor the retention and/or acquisition of water, the protection of chloroplast functions, and the maintenance of ion homeostasis [55]. The lower tolerance of the cultivars may be due to excessive sodium accumulation in the cells which rapidly causes ionic stress and cell death [56].
The above is because there are phenotypic differences in the size of the fruits and vegetative organs, with leaves exhibiting the greatest differences in size and morphology. This phenotypic divergence has been shown to be an important factor determining the ability of wild species to thrive in extreme environments [57]. During the seedling stage, tomato is more sensitive to high salt concentrations compared to later growth stages [58].
To design an experiment that will assist with the selection of salt-tolerant genotypes, it is necessary to consider the phenological stage of the crop, since through the development of a particular genotype the susceptibility to this condition is variable due to the expression of specific genes at each stage (Ludwiczak et al. 2021; Rosca et al. 2023). Another factor to consider is the degree of stress to be applied, which must avoid the lethality of the plants, although it must be high enough so that in a short time it allows tolerance levels to be assessed through characters such as dry matter accumulation, chlorophyll concentration, structures length, leaf area, etc. and other traits such as plant tissue concentration of antioxidants, chlorine, sodium, enzymes, nutrients, flavonoids, phytohormones, sugars, proteins, among others (Yang and Guo, 2018; Isayen-kov and Maathuis, 2019; Chen et al. 2021; Parra-Terraza et al. 2021). Tolerance mechanisms activity is highly dependent on the level of salinity. For example, Na+ exclusion is more effective under high salinity conditions, while osmotic tolerance may be the most important tolerance mechanism under moderate salinity (Rosca et al. 2023).
Additionally, managing stress level is essential; if it is too high, the variation in the response of a genotype will increase too much, even in the same condition, resulting in estimates of experimental error with lower precision, preventing the detection of statistical differences between treatments. Similarly, it is necessary to consider that in production on saline soils or with the use of saline water, conditions that are increasingly common in agriculture, the presence of this stress will be continuous during the development of the crop. Thus, the maintenance of growth, dry matter accumulation and yield will be primary indicators for the selection of genotypes tolerant to continuous salt stress. Despite the above, it is also necessary to quantify the damage caused by salt stress using physiological indicators to identify diverse tolerance mechanisms. Additionally, controlling the stress level is essential; if it is too high, the variation in the response of a genotype will increase too much, even in the same condition, resulting in estimates of experimental error with lower precision, preventing the detection of statistical differences between treatments. Likewise, it is necessary to consider that in production on saline soils or with the use of saline water, conditions that are increasingly common in agriculture, the presence of this stress will be continuous during the development of the crop. Thus, sustained growth and dry matter accumulation and yield will be necessary indicators for the selection of genotypes tolerant to continuous salt stress. Despite the above, it is also necessary to quantify the damage caused by salt stress using physiological indicators to identify diverse tolerance mechanisms.
At the seedling stage, decreased stem and root length, as well as reduced wet and dry weights of the aerial part and root occur with an increasing salinity concentration [59], resulting in reduction percentages of up to 40%.
In a study by Sánchez et al. [52], tomato seedlings of the Raf cultivar were exposed to a salinity level of 5.5 dS·m-1 where they obtained 2708 cm2 of leaf area, while at 11 dS·m-1 their leaf area decreased to 1815 cm2.
Plants adapt to salt stress through multiple biochemical and molecular pathways, where Na+ and K+ transporters across the plasma membrane play an important role, especially the HKT and HAK families of transporters [60].
Salinity induces Ca+ accumulation, which is a rapid signal to detect this condition. This occurs by means of Ca+ dependent proteins that decode Ca+ input routes to the cytoplasm, such as the hypersensitive salt route (SOS) dependent on Ca+ that activates antiporters Na+/H+ and K+/H+ to expel salt and improve tolerance to this condition [61].
Osmotic adjustment is used to reduce osmotic stress, as a mean to aid the plants to absorb water and maintain turgor in cells by increasing solute concentration, which plays a protective role in stabilizing the structure of biological macromolecules. Osmotic regulators mainly include inorganic ions and organic substances such as sugar, complex sugars, proline, glycinbetaine, polyamines and late embryogenesis abundant (LEA) proteins [62,63,64].
Saline stress induces the production of reactive oxygen species (ROS) in apoplasts, chloroplasts, mitochondria and peroxisomes of the plant [65]. The MAPK3 gene can increase tolerance to salts by the RBOH1-dependent anti-oxidant system [66]. Melatonin also decreases the production of ROS by balancing the distribution of electron flow in the photosynthesis and promoting the activity of enzymes involved in the ascorbate-glutathione cycle [67]. Superoxide dismutase is the most efficient enzyme of ROS eli-miners by converting O2 to H2O2 and subsequently to H2O. Flavonoids and phytohormones (ABA) also play an important role as antioxidants [68].
Epigenetic modifications are molecular mechanisms that regulate gene expression under salt stress, conferring adaptations to unfavorable conditions. In tomato, eleven DNA methyltransferase genes have been identified (MET, MET1, CMT2, CMT3, CMT4, DRM5, DRM6, DRM7, DRM8, DNMT2 and METL); These genes are regulated by salt stress, suggesting that they are involved in the adaptive response to this stress [9]. In the PI365967 accession of S. pimpinellifolium, 86 genes involved in sallicylic acid signaling, SOS pathway, transcriptional regulation and ROS removal have been identified, suggesting the role of multiple strategies for tolerance to salt in wild species [11].
5. Conclusions
Salinity produces negative effects on germination and the early developmental stages of tomato seedlings. Furthermore, the results of this study suggest that the effects of salinity differ depending on the cultivar, where mainly genetics and the developmental stage play an important role in tolerance and/or susceptibility to salinity.
During germination, the saline condition decreased germination percentage (65.2%), speed of germination (88.2%), steam length (72.5%), root length (46.56%), normal plants number (59.5%), stem dry matter (68.78%), root dry matter (61.99%), and total dry matter (67.1%).
At the seedling stage, the 175 mM NaCl decreased the aerial part dry matter (46.37%), leaf area (59.35%), root length (42.43%), final plant height (40.24%), and growth rate (71.42%).
A total of 15 tolerant genotypes were identified at both developmental stages, while one genotype (CJ106) showed tolerance at both stages studied. These genotypes showed the best response in the variables evaluated.
The plant morphology and physiological responses expressed by the native tolerant genotypes are associated to tolerant mechanisms such as osmotic adjustments, genetic resistance, production of antioxidants and expression of specific genes that avoid the modification of metabolic processes due to diverse saline stress conditions.
Author Contributions
Conceptualization, A.G.L.M., J.E.R.P. and J.O.M.G.; methodology, A.G.L.M., J.E.R.P., J.O.M.G. and R.L.O.; validation, A.G.L.M. and J.O.M.G.; formal analysis, A.G.L.M., J.E.R.P. and J.S.C.; investigation, A.G.L.M., J.E.R.P., J.O.M.G., J.S.C. and R.L.O.; resources, J.E.R.P. and J.S.C.; writing—original draft preparation, A.G.L.M., J.E.R.P. and J.O.M.G.; writing—review and editing, R.L.O. and J.S.C.; supervision, J.E.R.P., J.S.C., J.O.M.G. and R.L.O.; funding acquisition, J.E.R.P. and J.S.C. All authors have read and agreed to the published version of the manuscript.
Funding
This research received funding from Universidad Autónoma Chapingo through project: D.G.I.P. 23005-ECI2-C66.
Acknowledgments
For assistance in experimental conduction to Jorge Luis Sánchez Galicia and Ricardo Gaspar Hernández.
Conflicts of Interest
The authors declare no conflict of interest.
Appendix A

Table A1.
Origins of evaluated lines, derived from wild tomato populations of Mexico.

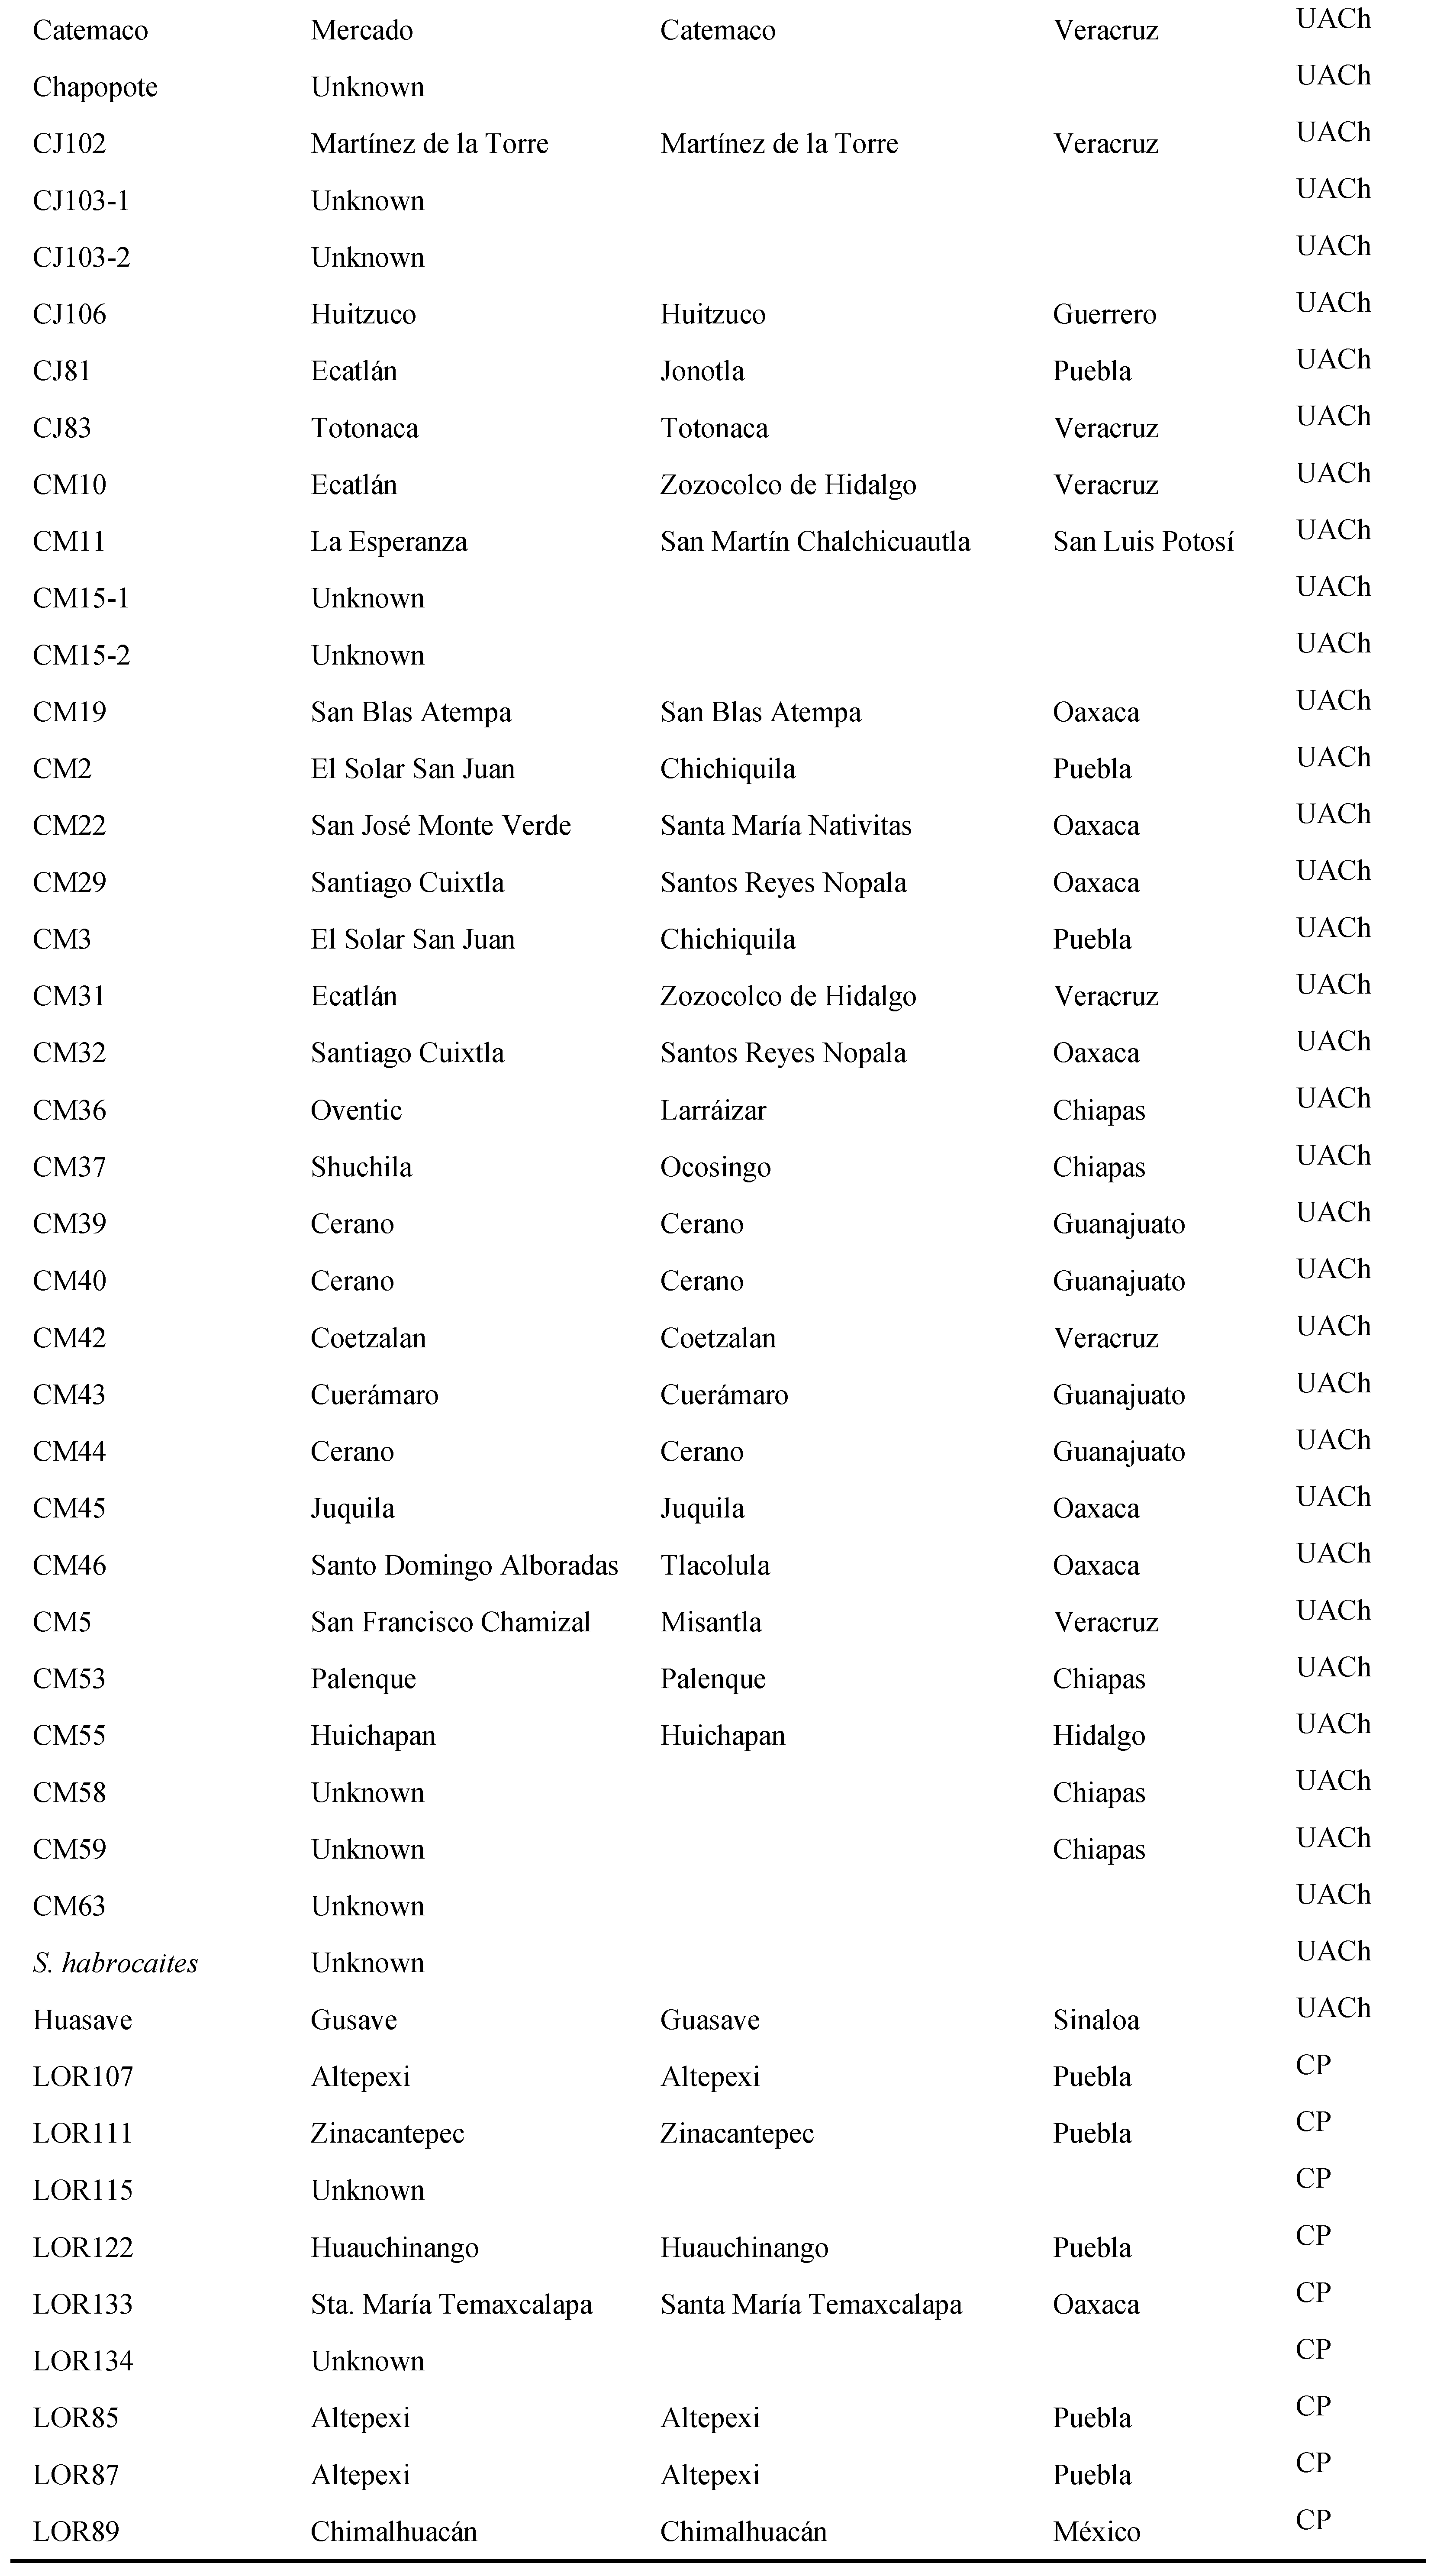
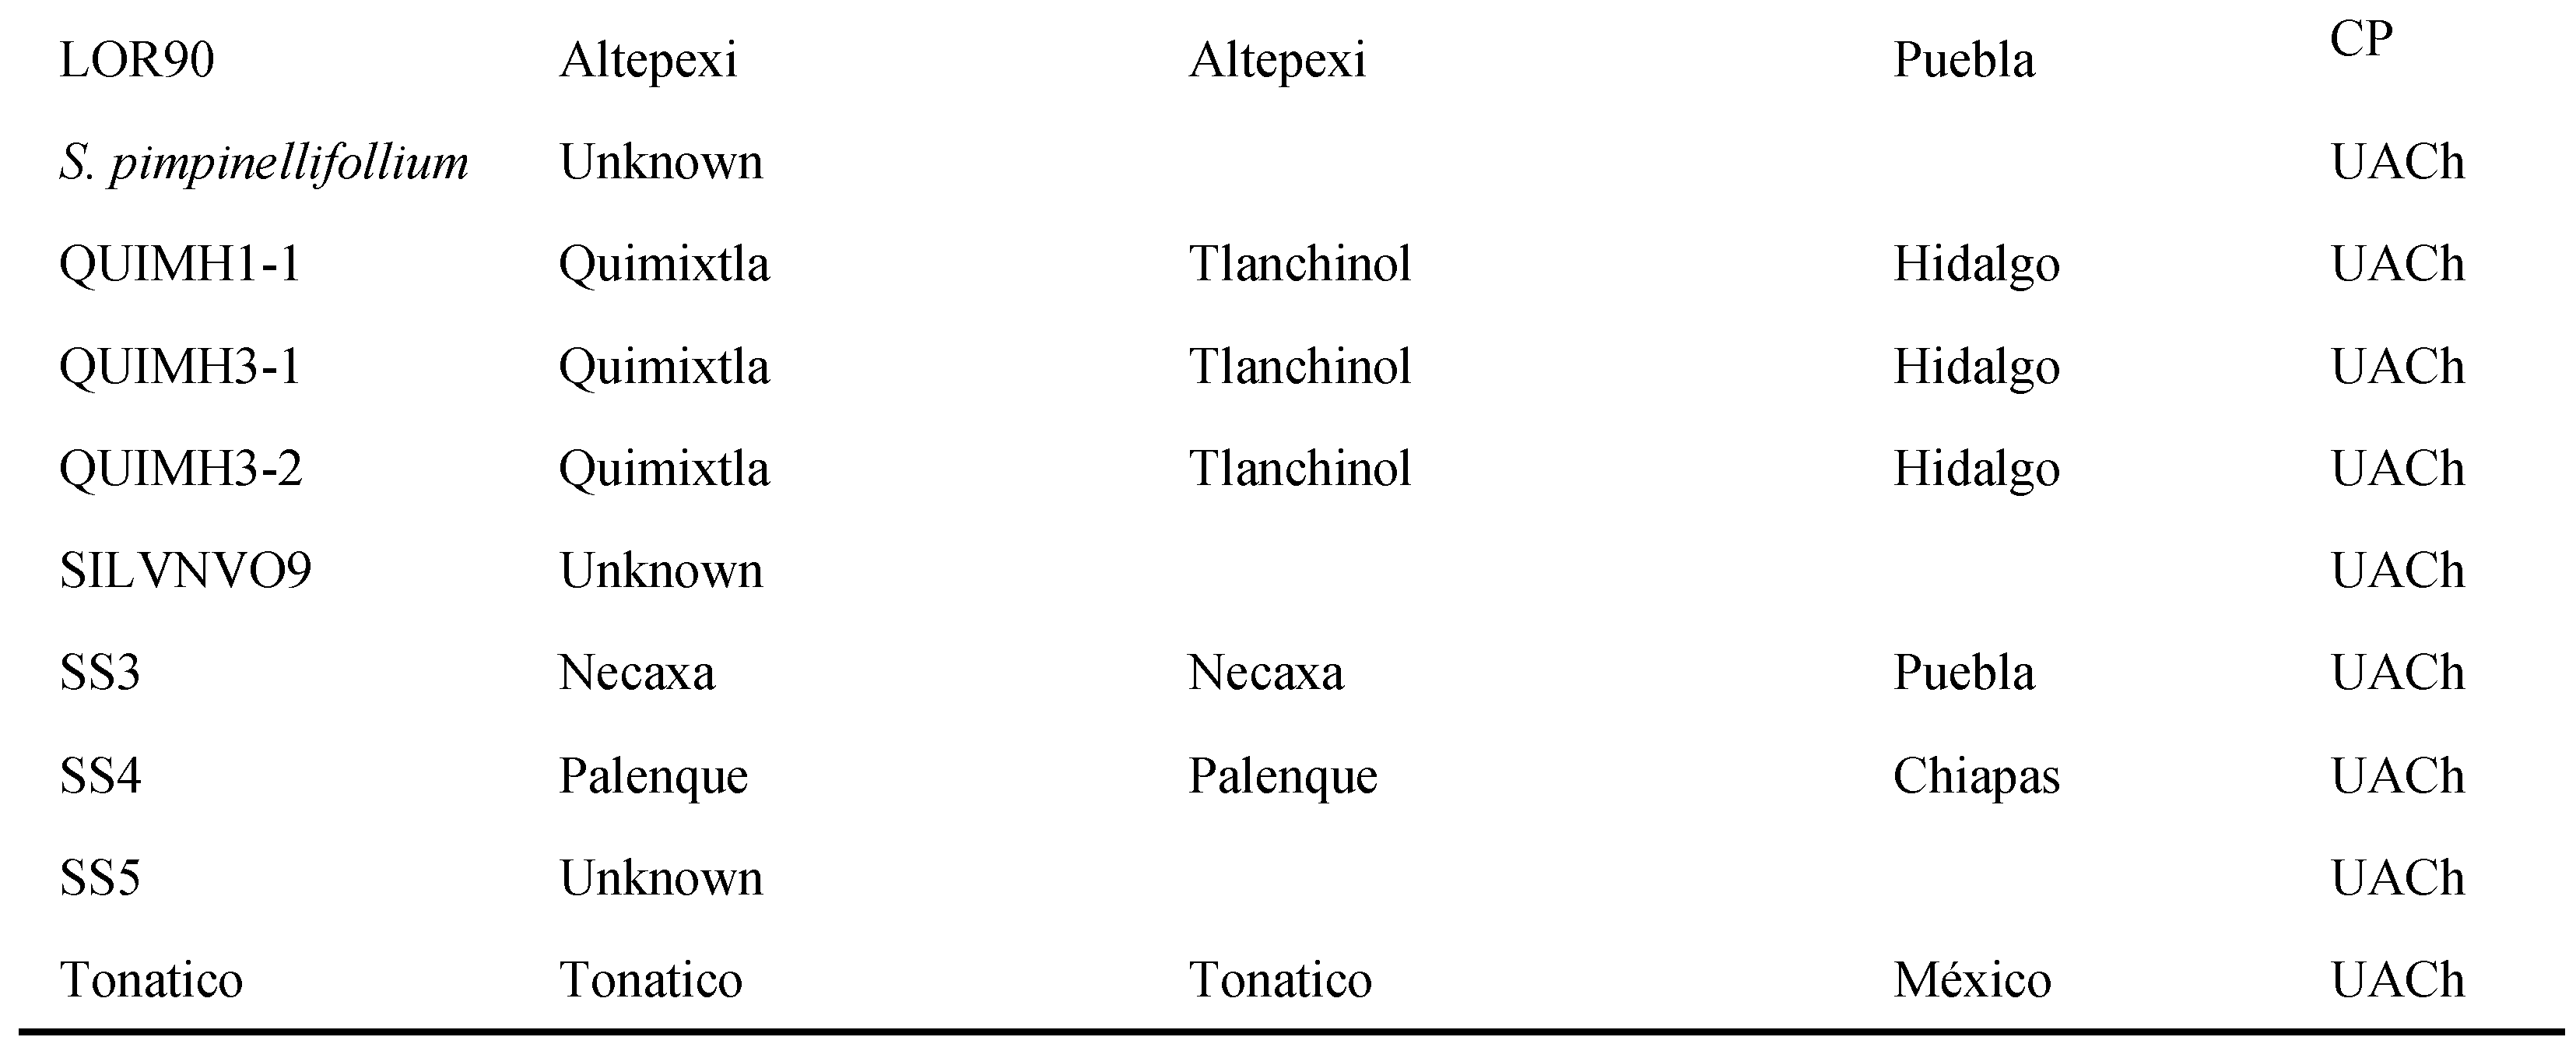
Table A2.
Mean comparisons of GEN x C interaction of 24 selected tomato genotypes exposed to two salinity concentrations (0 and 175 mM). Comparisons are between concentrations within each genotype.
Table A2.
Mean comparisons of GEN x C interaction of 24 selected tomato genotypes exposed to two salinity concentrations (0 and 175 mM). Comparisons are between concentrations within each genotype.
References
- FAO. 2021. Global Map of Salt Affected Soils Version 1.0. https://www.fao.org/soils-portal/data-hub/soil-maps-and-databases/global-map-of-salt-affected-soils/en/.
- Johansen, K., Morton, M.J.L., Malbeteau, Y.M., Aragon, B., Al-Mashharawi, S. K., Ziliani, M. G., Angel, Y., Fiene, G. M., Negrão, S.S.C.; Mousa, M.A.A.; Tester, M.A. and McCabe, M.F. Unmanned Aerial Vehicle-Based Phenotyping Using Morphometric and Spectral Analysis Can Quantify Responses of Wild Tomato Plants to Salinity Stress. Front. Plant Sci., 2019, 10:370. [CrossRef]
- Secretaría de Agricultura y Desarrollo Rural. 2021. Mapa Agrícola de afectación por salinidad en México. https://www.gob.mx/agricultura/acciones-y-programas/mapa-agricola-de-afectacion-por-salinidad-en-mexico.
- Li, H.; Zhu, Y.; Hu, Y.; Han, W. and Gong, H. Beneficial effects of silicon in alleviating salinity stress of tomato seedlings grown under sand culture. Acta Physiologiae Plantarum, 2015, 37(4). [CrossRef]
- Bogoutdinova, L.R.; Baranova, E.N.; Kononenko, N.V.; Chaban, I.A.; Konovalova, L.N.; Gulevich, A.A.; Lazareva, E.M. and Khaliluev, M.R. Characteristics of Root Cells during In Vitro Rhizogenesis under Action of NaCl in Two Tomato Genotypes Differing in Salt Tolerance. Int. J. Plant Biol., 2023, 14, 104–119. [CrossRef]
- Horie, T.; Karahara, I., and Katsuhara, M. Salinity tolerance mechanisms in glycophytes: An overview with the central focus on rice plants. Rice, 2012, 5, 11. [CrossRef]
- Safdar, H.; Amin, A.; Shafiq, Y.; Ali, A.; Yasin, R.; Shoukat, A. and Sarwar, M.I. A review: Impact of salinity on plant growth. Nat. Sci., 2019, 17, 34.
- Frukh, A.; Siddiqi, T. O.; Khan, M. I. R. and Ahmad, A. Modulation in growth, biochemical attributes and proteome profile of rice cultivars under salt stress. Plant Physiology and Biochemistry, 2020, 146, 55–70. [CrossRef]
- Guo, M.; Wang, X.S.; Guo, H.D.; Bai, S.Y.; Khan, A.; Wang, X.M.; Gao, Y.M. and Li, J.S. Tomato salt tolerance mechanisms and their potential applications for fighting salinity: A review. Front. Plant Sci., 2022, 13:949541. [CrossRef]
- Parra-Terraza, S.; Angulo-Castro, A.; Sánchez-Peña, P.; Valdez-Torres, J.B. and Rubio-Carrasco, W. Effect of Cl- and Na+ ratios nutrient solutions on tomato (Solanum lycopersicum L.) yield in a hydroponic system. Revista Chapingo Serie Horticultura, 2021, 28(1), 67-78. [CrossRef]
- Sun, W.; Xu, X.; Zhu, H.; Liu, A.; Liu, L.; Li, J. and Hua, X. Comparative transcriptomic profiling of a salt-tolerant wild tomato species and a salt-sensitive tomato cultivar. Plant Cell Physiol., 2010, 51:997-1006. [CrossRef]
- Peleg, Z.; Apse, M. P. and Blumwald, E. Engineering Salinity and Water-Stress Tolerance in Crop Plants: Getting Closer to the Field. Advances Bot. Res., 2021, 57, 407-443. [CrossRef]
- Ruiz-Espinoza, F.H.; Villalpando-Gutiérrez, R.L.; Murillo-Amador, B.; Beltrán-Morales, F.A. and Hernández-Montiel, L.G. Respuesta diferencial a la salinidad de genotipos de tomate (Lycopersicon esculentum Mill.) en primeras etapas fenológicas. Terra latinoamericana, 2014, 32(4), 311-323.
- Sanjuan-Lara, F.; Ramírez-Vallejo, P.; Sánchez-García, P.; Sandoval-Villa, M.; Livera -Muñoz. M.; Carrillo-Rodríguez, J. C. and Perales-Segovia, C. Tolerancia de líneas nativas de tomate (Solanum lycopersicum L.) a la salinidad con NaCl. Interciencia, 2015, 40(10), 704-709. ISSN: 0378-1844.
- Cuartero, J., Yeo, A. R. and Flowers, T. J. Selection of donors for salt-tolerance in tomato using physiological traits. New Phytol., 1992, 121, 63-69. [CrossRef]
- Martínez, J.P.; Antúnez, A.; Araya, H.; Pertuzé, R.; Fuentes, L.; Lizana, X. C. and Lutts, S. Salt stress differently affects growth, water status and antioxidant enzyme activities in Solanum lycopersicum and its wild relative Solanum chilense. Aust. J. Bot., 2014, 62, 359–368. [CrossRef]
- Marín-Montes, I. M.; Rodríguez-Pérez, J. E.; Sahagún-Castellanos, J.; Hernández-Ibáñez, L. and Velasco-García, A.M. Morphological and molecular variation in 55 native tomato collections from Mexico. Revista Chapingo Serie Horticultura, 2016, 22(2), 117-131. [CrossRef]
- Cuartero, J. and Fernández-Muñoz, R. Tomato and salinity. Scientia Horticulturae, 1999, 78, 83-125. [CrossRef]
- Foolad, M.R. and Lin, G.Y. Genetic potential for salt tolerance during germination in Lycopersicon species. HortScience., 1997, 32(2): 296-300. [CrossRef]
- Pérez-Alfocea, F.; Balibrea, M.E.; Santa-Cruz, A. and Están, M.T. Agronomical and physiological characterization of salinity tolerance in a commercial tomato hybrid. Plant and Soil., 1996, 180 (2): 251-257. [CrossRef]
- Chetelat, R.T. and Rick, C.M. Tomato Genetics Resource Center Department of Vegetable Crops. University of California. Davis, U.S.A., 2004. http://tgrc.ucdavis.
- Rick, C. M. and Chetelat, R.T. Utilization of related wild species for tomato improvement. Acta Hort., 1995, 412: 21-38. [CrossRef]
- Zegarra, R. Biodiversidad y taxonomía de la flora desértica sur peruana: familia solanáceae. Idesia., 2005, 22: 64-69. [CrossRef]
- Chetelat, R.T.; Pertuzé, R.A.; Faúndez, L.; Graham, E.B. and Jones, C.M. Distribution, ecology and reproductive biology of wild tomatoes and related nightshades from the Atacama desert region of Northern Chile. Euphytica, 2009, 167: 77-93. [CrossRef]
- Hoyt, E. Conservando los Parientes Silvestres de las Plantas Cultivadas. Addison-Wesley Iberoamericana. Wilmington, U.S.A., 1992, 52 pp.
- Pailles, Y.; Awlia, M.; Julkowska, M.M.; Passone, L.; Zemmouri, K.; Negrão, S. and Tester, M. Diverse traits contribute to salinity tolerance of wild tomato seedlings from the Galapagos Islands. Plant Physiology, 2019, 00700. [CrossRef]
- Razali, R.; Bougouffa, S.; Morton, M. J. L.; Lightfoot, D. J.; Alam, I.; Essack, M.; … Negrão, S. The genome sequence of the wild tomato Solanum pimpinellifolium provides insights into salinity tolerance. Front. Plant Sci., 2018, 9, 1402. [CrossRef]
- Rodríguez-Guzmán, E.; Vargas-Canela, D.; de Sánchez-González, J.J.; Lépiz-Idelfonso, R.; Rodríguez-Contreras, A.; Ruiz-Corral, J.A.; Puente-Ovalle, P. and Miranda-Medrano, R. Etnobotánica de Solanum var cerasiforme en el occidente de México. Nat. Desarro., 2009, 7, 45–57.
- Ramírez-Ojeda, G.; Rodríguez-Pérez, J. E.; Rodríguez-Guzmán, E.; Sahagún-Castellanos, J.; Chávez-Servia J. L.; Peralta I. E. and Barrera-Guzmán, L. Á. Distribution and Climatic Adaptation of Wild Tomato Populations (Solanum lycopersicum L.) in Mexico. Plants, 2022, 11(1595):1-13. [CrossRef]
- Ramírez-Ojeda, G.; Peralta, I. E.; Rodríguez-Guzmán, E.; Chávez-Servia, J. L.; Sahagún-Castellanos, J. and Rodríguez-Pérez, J.E. Climatic Diversity and Ecological Descriptorsof Wild Tomato Species (Solanum sect. Lycopersicon) and Close Related Species (Solanum sect. Juglandifolia y sect. Lycopersicoides) in Latin America. Plants, 2021, 10, 855. https://doi.org./10.3390/plants10050855.
- Yang, G.; Liu, J.; Zhao, C.; Li, Z.; Huang, Y.; Yu, H.; B. Xu; X. Yang; D. Zhu; X. Zhang; R. Zhang; H. Feng; X. Zhao; Z. Li; H. Li and H. Yang. Unmanned aerial vehicle remote sensing for field-based crop phenotyping: current status and perspectives. Front. Plant Sci., 2017, 8:1111. [CrossRef]
- Khan, T.A.; Saleem, M. and Fariduddin, Q. Melatonin influences stomatal behavior, root morphology, cell viability, photosynthetic responses, fruit yield, and fruit quality of tomato plants exposed to salt stress. J Plant Growth Regul., 2022, 42(4):1-25. [CrossRef]
- El-Habbasha, K.M.; Shaheen, A.M. and Rizk, F.A. Germination of some tomato cultivars as affected by salinity stress condition. Egyptian-Journal-of-Horticulture, 1996, 23 (2): 179-190.
- Singer, S.M. Germination responses of some tomato genotypes as affected by salinity and temperature stress. Egyptian Journal of Horticulture, 1994, 21 (1): 47-64.
- Srinivas, T. R. Salinity tolerance of tomato germplasm during germination. Seed Science and Technology, 2001, 29(3), 673-677.
- Goykovic-Cortés, V.; Nina-Alanoca, P. and Calle-Llave, M. Efecto de la salinidad sobre la germinación y crecimiento vegetativo de plantas de tomate silvestres y cultivadas. Interciencia, 2014, 39(7), 511-517. ISSN: 0378-1844.
- Ávila-Amador, C.; Argentel-Martínez, L.; Peñuelas-Rubio, O.; López-Sánches, R. C. and González-Aguilera, J. Variabilidad de respuesta de 8 cultivares de tomate al estrés salino durante los primeros estadios de desarrollo. Ciencia em Foco, 2023, 6:5, 52-64. [CrossRef]
- Sholi, N.J.Y. Effect of salt stress on seed germination, plant growth, photosynthesis and ion accumulation of four tomato cultivars. Am. J. Plant Physiol., 2012, 7, 269–275. [CrossRef]
- Adilu, G.S. and Gebre, Y.G. Effect of salinity on seed germination of some tomato (Lycopersicon esculentum mill.) varieties. J. Aridland Agric., 2021, 76–82. [CrossRef]
- Maguire, J. D. Speed of germination, aid in selection and evaluation of seedling emergence vigor. Crop Science, 1962, 2,176-177. [CrossRef]
- Wafa’a, A. Comparative effects of drought and salt stress on germination and seedling growth of Pennisetum divisum (Gmel.) Henr. Amer. J. Appl. Sci., 2010, 7, 640–646. ISSN 1546-9239.
- Saeed, A.; Shahid, M.Q.; Anjum, S.A.; Khan, A.A.; Shakeel, A.; Saleem, M.F. and Saeed, N. Genetic analysis of NaCl tolerance in tomato. Genet. Mol. Res., 2010, 10, 1754–1776. [CrossRef]
- González-Grande, P.; Suárez, N. and Marín, O. Effect of salinity and seed salt priming on the physiology of adult plants of Solanum lycopersicum cv. ‘Río Grande’. Braz. J. Bot., 2020, 43, 775–787. [CrossRef]
- Faisal-Alharby, H. Using some growth stimuli, a comparative study of salt tolerance in two tomatoes cultivars and a related wild line with special reference to superoxide dismutases and related micronutrients. Saudi Journal of Biological Sciences, 2021, 28(11): 6133–6144 . [CrossRef]
- Moles, T.M.; Guglielminetti, L. and Reyes, T.H. Differential effects of sodium chloride on germination and post-germination stages of two tomato genotypes. Scientia Horticulturae, 2019, 257, 108730. [CrossRef]
- Argentel-Martínez, L.; Garatuza-Payan, J.; Yepez, E.A.; Arredondo, T. and De los Santos-Villalobos, S. Water regime and osmotic adjustment under warming conditions on wheat in the Yaqui Valley, Mexico. PeerJ, 2019, 7, e7029. https:// doi.org/10.7717/peerj.7029.
- Abdel-Farid, I.B.; Marghany, M.R.; Rowezek, M.M. and Sheded, M.G. Effect of salinity stress on growth and metabolomic profiling of Cucumis sativus and Solanum lycopersicum. Plants (Basel), 2020, 9, 1626. [CrossRef]
- Singh, J.; Sastry, E.V. and Singh, V. Effect of salinity on tomato (Lycopersicon esculentum Mill.) during seed germination stage. Physiol. Mol. Biol. Plants, 2012, 18, 45–50. [CrossRef]
- Florido-Bacallao, M. and Bao-Fundora, L. Tolerancia a estrés por déficit hídrico en tomate (Solanum lycopersicum L.). Cultivos Tropicales, 2014, 35(3), 70-88. ISSN 0258-5936.
- Almeida, P.; de Boer, G.J and de Boer, A.H. Differences in shoot Na+ accumulation between two tomato species are due to differences in ion affinity of HKT1;2. J Plant Physiol., 2014, 171, 438–447. [CrossRef]
- Assimakopoulou, A.; Nifakos, K.; Salmas, I. and Kalogeropoulos, P. Growth, ion uptake, and yield responses of three indigenous small-sized greek tomato (Lycopersicon esculentum) cultivars and four hybrids of cherry tomato under NaCl salinity stress. Communication in Soil Science and Plant Analisys, 2015, 46, 2357–2377. [CrossRef]
- Ludwiczak, A.; Osiak, M.; Cárdenas-Pérez, S.; Lubińska-Mielińska, S. and Piernik. A. Osmotic stress or ionic composition: Which affects the early growth of crop species more? Agronomy, 2021, 11, 435. [CrossRef]
- Rosca, M.; Mihalache, G. and Stoleru, V. Tomato responses to salinity stress: From morphological traits to genetic changes. Frontiers in Plant Science, 2023, 14, 1118383. [CrossRef]
- Isayenkov, S.V. and Maathuis, F.J. Plant salinity stress: Many unanswered questions remain. Frontiers in Plant Science, 2019, 10:80. [CrossRef]
- Sheldon, A.R.; Dalal, R.C.; Kirchhof, G.; Kopittke, P.M. and Menzies, N.W. The effect of salinity on plant-available water. Plant Soil, 2017, 418(1-2), 477-491. [CrossRef]
- Derkaoui, M.K.; Sahnoune, M. and Belkhodja, M. Effect of Salinity on Some Physiological Parameters in Tomato. International Journal for Research in Applied Science & Engineering Technology, 2022, 10(2):1161-1169. [CrossRef]
- Sánchez, A.; Membrives, J.; Valenzuela, J. L. and Guzmán, M. Effects of saline stress and Ca2+/K+ interaction on biomass and mineral contents of tomato. Acta Hortic., 2012, 932, 345–350. [CrossRef]
- De Pascale, S.; Orsini, F.; Caputo, R.; Palermo, M.A.; Barbieri, G. and Maggio, A. Seasonal and multiannual effects of salinization on tomato yield and fruit quality. Funct. Plant Biol., 2012, 39, 689. [CrossRef]
- Casierra-Posada, Fánor, J.A and Arias-Aguirre; C.A; Efecto de la salinidad por NaCl en híbridos de tomate (Lycopersicon esculentum Miller). Orinoquia, 2013, 17: 23-29. ISSN: 0121-3709.
- Ludwiczak, A.; Osiak, M.; Cárdenas-Pérez, S.; Lubińska-Mielińska, S. and Piernik, A. Osmotic stress or ionic composition: Which affects the early growth of crop species more? Agronomy, 2021, 11, 435. [CrossRef]
- Shrivastava, P. and Kumar, R. Soil salinity: A serious environmental issue and plant growth promoting bacteria as one of the tools for its alleviation. Saudi J. Biol. Sci., 2015, 22, 123–131. [CrossRef]
- Muir, C.D.; Hangarter, R.P.; Moyle, L.C.; Davis, P.A. Morphological and anatomical determinants of mesophyll conductance in wild relatives of tomato (Solanum sect. Lycopersicon, sect. Lycopersicoides; Solanaceae). Plant Cell Environ, 2014, 37, 1415–1426. [CrossRef]
- Chen, T.; Shabala, S.; Niu, Y.; Chen, Z. H.; Shabala, L.; Meinke, H.; Venkataraman, G.; Pareek, A.; Xu, J. and Zhou, M. Molecular mechanisms of salinity tolerance in rice. Crop J., 2021, 9, 506–520. [CrossRef]
- Yang, Y. and Guo, Y. Unraveling salt stress signaling in plants. J. Integr. Plant Biol., 2018, 60, 796–804. https:// doi.org/10.1111/jipb.12689.
- Kronzucker, H.J. and Britto, D.T. Sodium transport in plants: A critical review. New Phytol., 2011, 189, 54–81. [CrossRef]
- Zhao, S.; Zhang, Q.; Liu, M.; Zhou, H.; Ma, C. and Wang, P. Regulation of plant responses to salt stress. Int. J. Mol. Sci., 2021, 22:4609. [CrossRef]
- Lv, X.; Chen, S. and Wang, Y. Advances in understanding the physiological and molecular responses of sugar beet to salt stress. Front. Plant Sci., 2019, 10:1431. [CrossRef]
- Liu, J.; Fu, C.; Li, G.; Khan, M.N. and Wu, H. ROS homeostasis and plant salt tolerance: Plant nanobiotechnology updates. Sustainability, 2021, 13:3552. [CrossRef]
- Shu, P.; Li, Y.; Li, Z.; Sheng, J. and Shen, L. SlMAPK3 enhances tolerance to salt stress in tomato plants by scavenging ROS accumulation and up-regulating the expression of ethylene signaling related genes. Environ. Exp. Bot., 2022, 193:104698. [CrossRef]
- Yin, Z.; Lu, J.; Meng, S.; Liu, Y.; Mostafa, I.; Qi, M. and Li, T. Exogenous melatonin improves salt tolerance in tomato by regulating photosynthetic electron flux and the ascorbate–glutathione cycle. J. Plant Interact., 2019, 14, 453–463. [CrossRef]
Table 1.
Sources of variation (SV), degrees of freedom (DF) and mean squares (MS) of the analysis of variance of traits evaluated in 54 tomato lines under saline condition (150 mM NaCl) during germination.
Table 1.
Sources of variation (SV), degrees of freedom (DF) and mean squares (MS) of the analysis of variance of traits evaluated in 54 tomato lines under saline condition (150 mM NaCl) during germination.
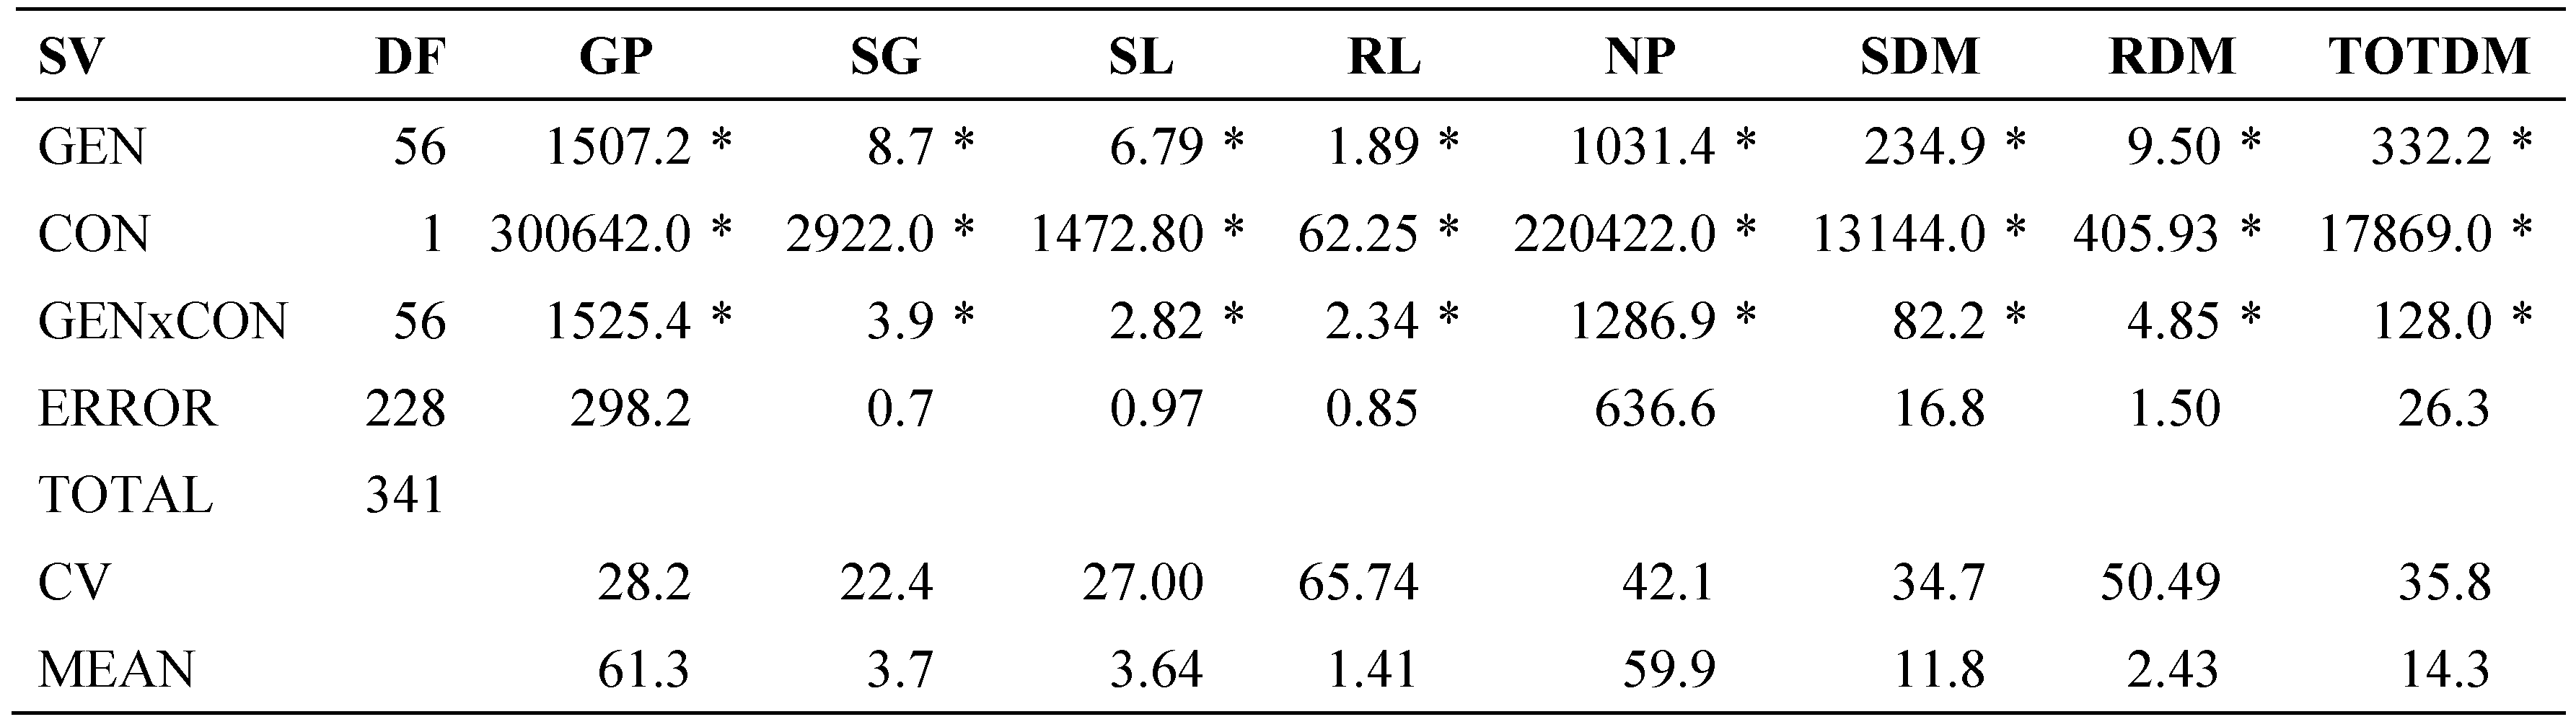
GEN: genotype, CON: concentration, GP: germination percentage, SG: speed of germination, SL: stem length, RL: root length, NP: normal plants, SDM: stem dry matter, RDM: root dry matter, TOTDM: total dry matter, CV: Coefficient of variation. * Significant with α≤0.05.
Table 2.
Mean comparisons of NaCl concentrations and percentage reduction due to the salt stress effect of traits evaluated in 57 tomato lines during germination.
Table 2.
Mean comparisons of NaCl concentrations and percentage reduction due to the salt stress effect of traits evaluated in 57 tomato lines during germination.
CON: concentration, GP: germination percentage, SG: speed of germination, SL: stem length, RL: root length, NP: normal plants, SDM: stem dry matter, RDM: root dry matter, TOTDM: total dry matter. HSD= honest significant difference; Means with the same letter within columns do not differ statistically (Tukey, α≤0.05).
Table 3.
Linear correlations between pairs of traits evaluated in 57 tomato lines under salinity stress.
Table 3.
Linear correlations between pairs of traits evaluated in 57 tomato lines under salinity stress.
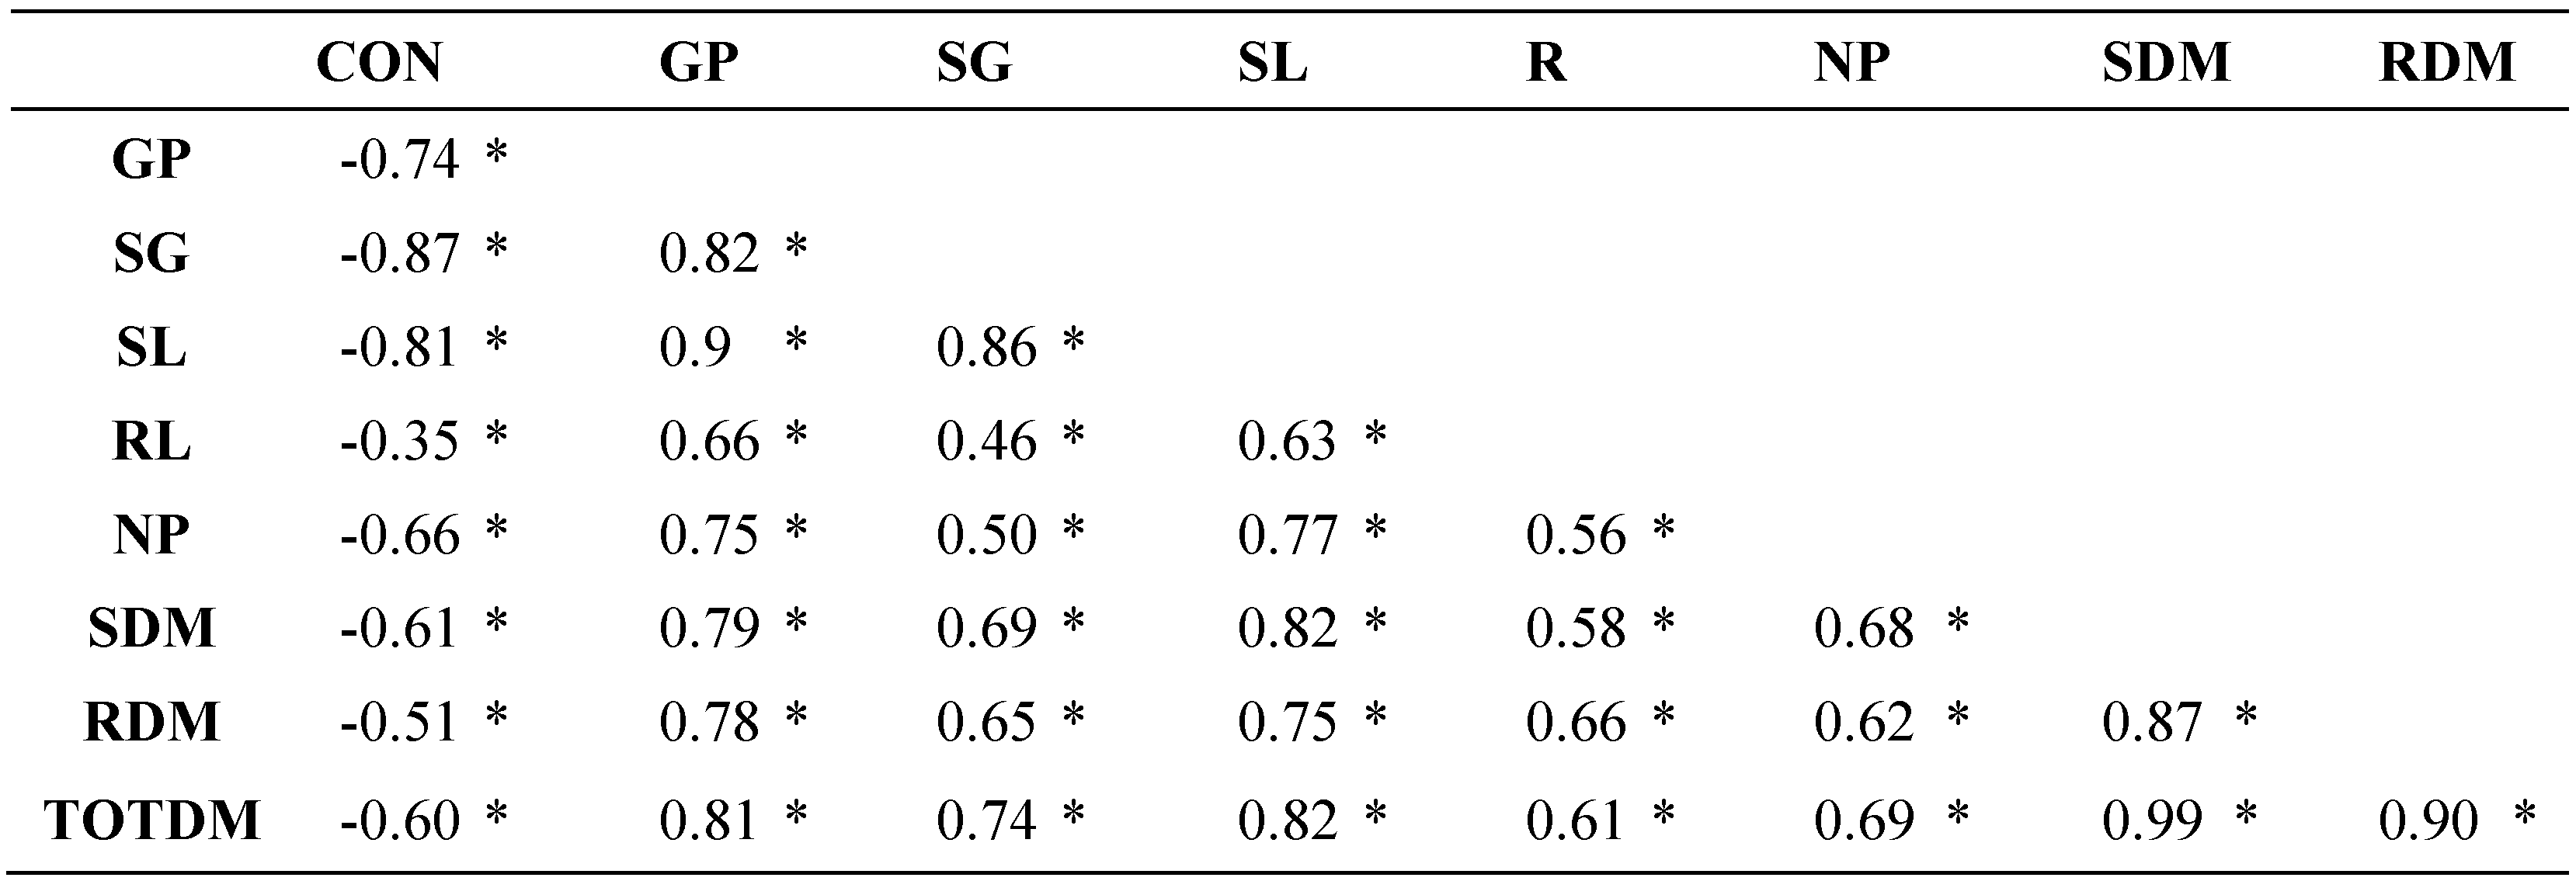
CON: concentration, GP: germination percentage, SG: speed of germination, SL: stem length, RL: root length, NP: normal plants, SDM: stem dry matter, RDM: root dry matter, TOTDM: total dry matter. * Significant at α≤0.05.
Table 4.
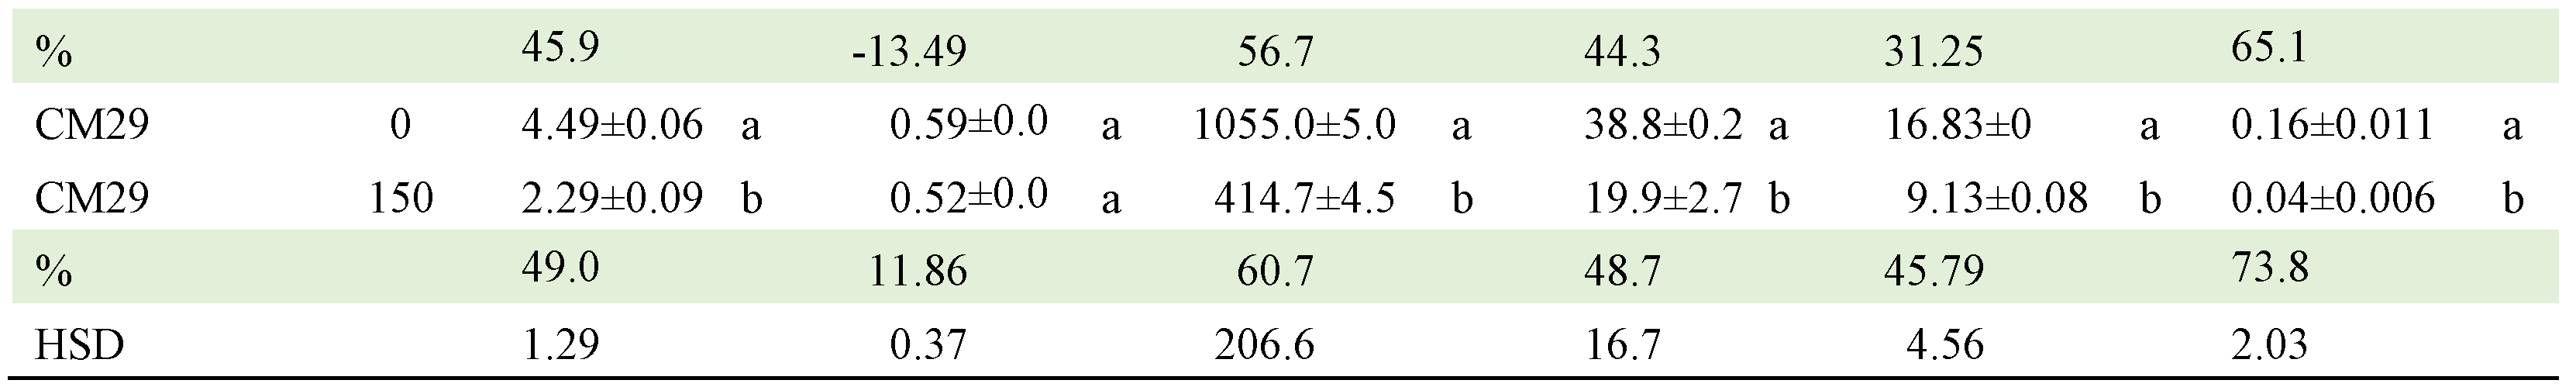
Mean comparisons of the Genotype x NaCl Concentration (GENxCON) interaction of tomato genotypes selected exposed to two NaCl concentrations (0 and 150 mM). Comparisons are between concentrations within each genotype.
Table 4.
Mean comparisons of the Genotype x NaCl Concentration (GENxCON) interaction of tomato genotypes selected exposed to two NaCl concentrations (0 and 150 mM). Comparisons are between concentrations within each genotype.
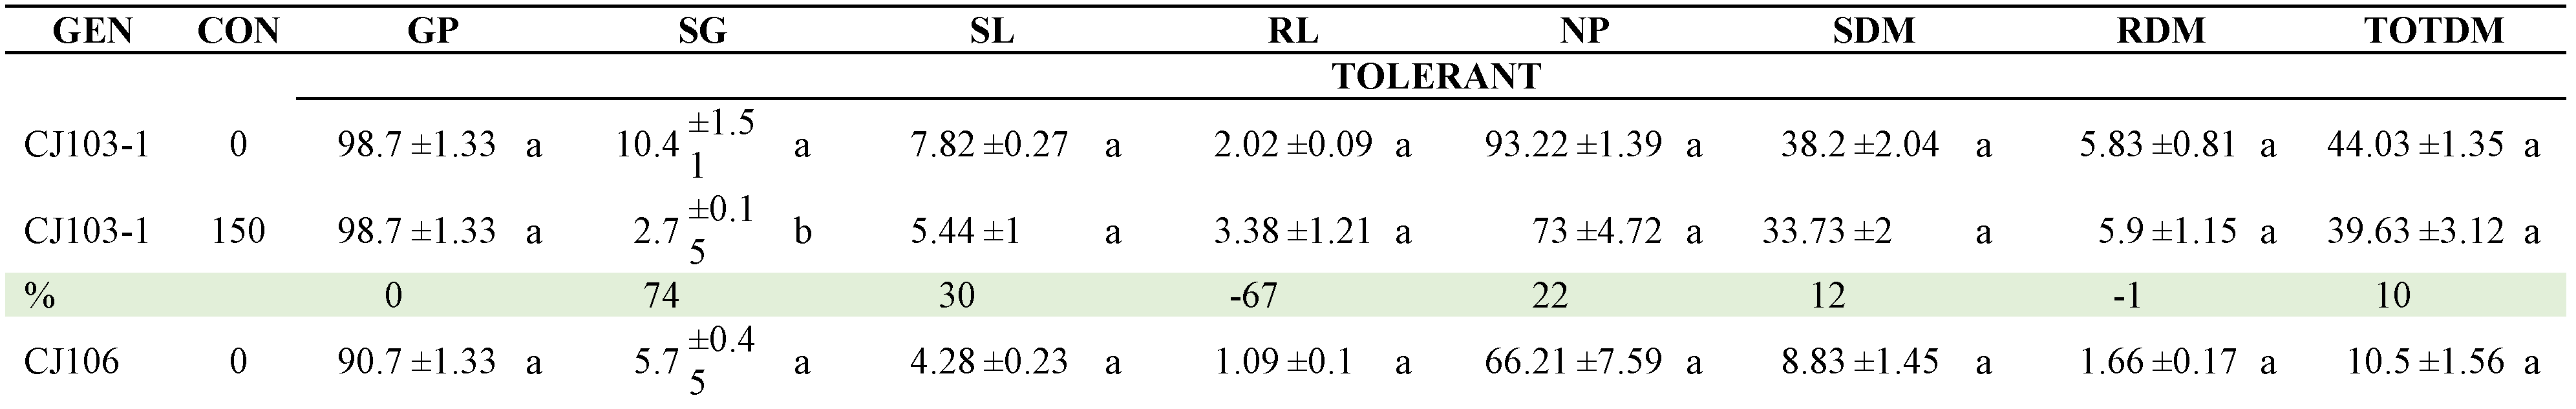
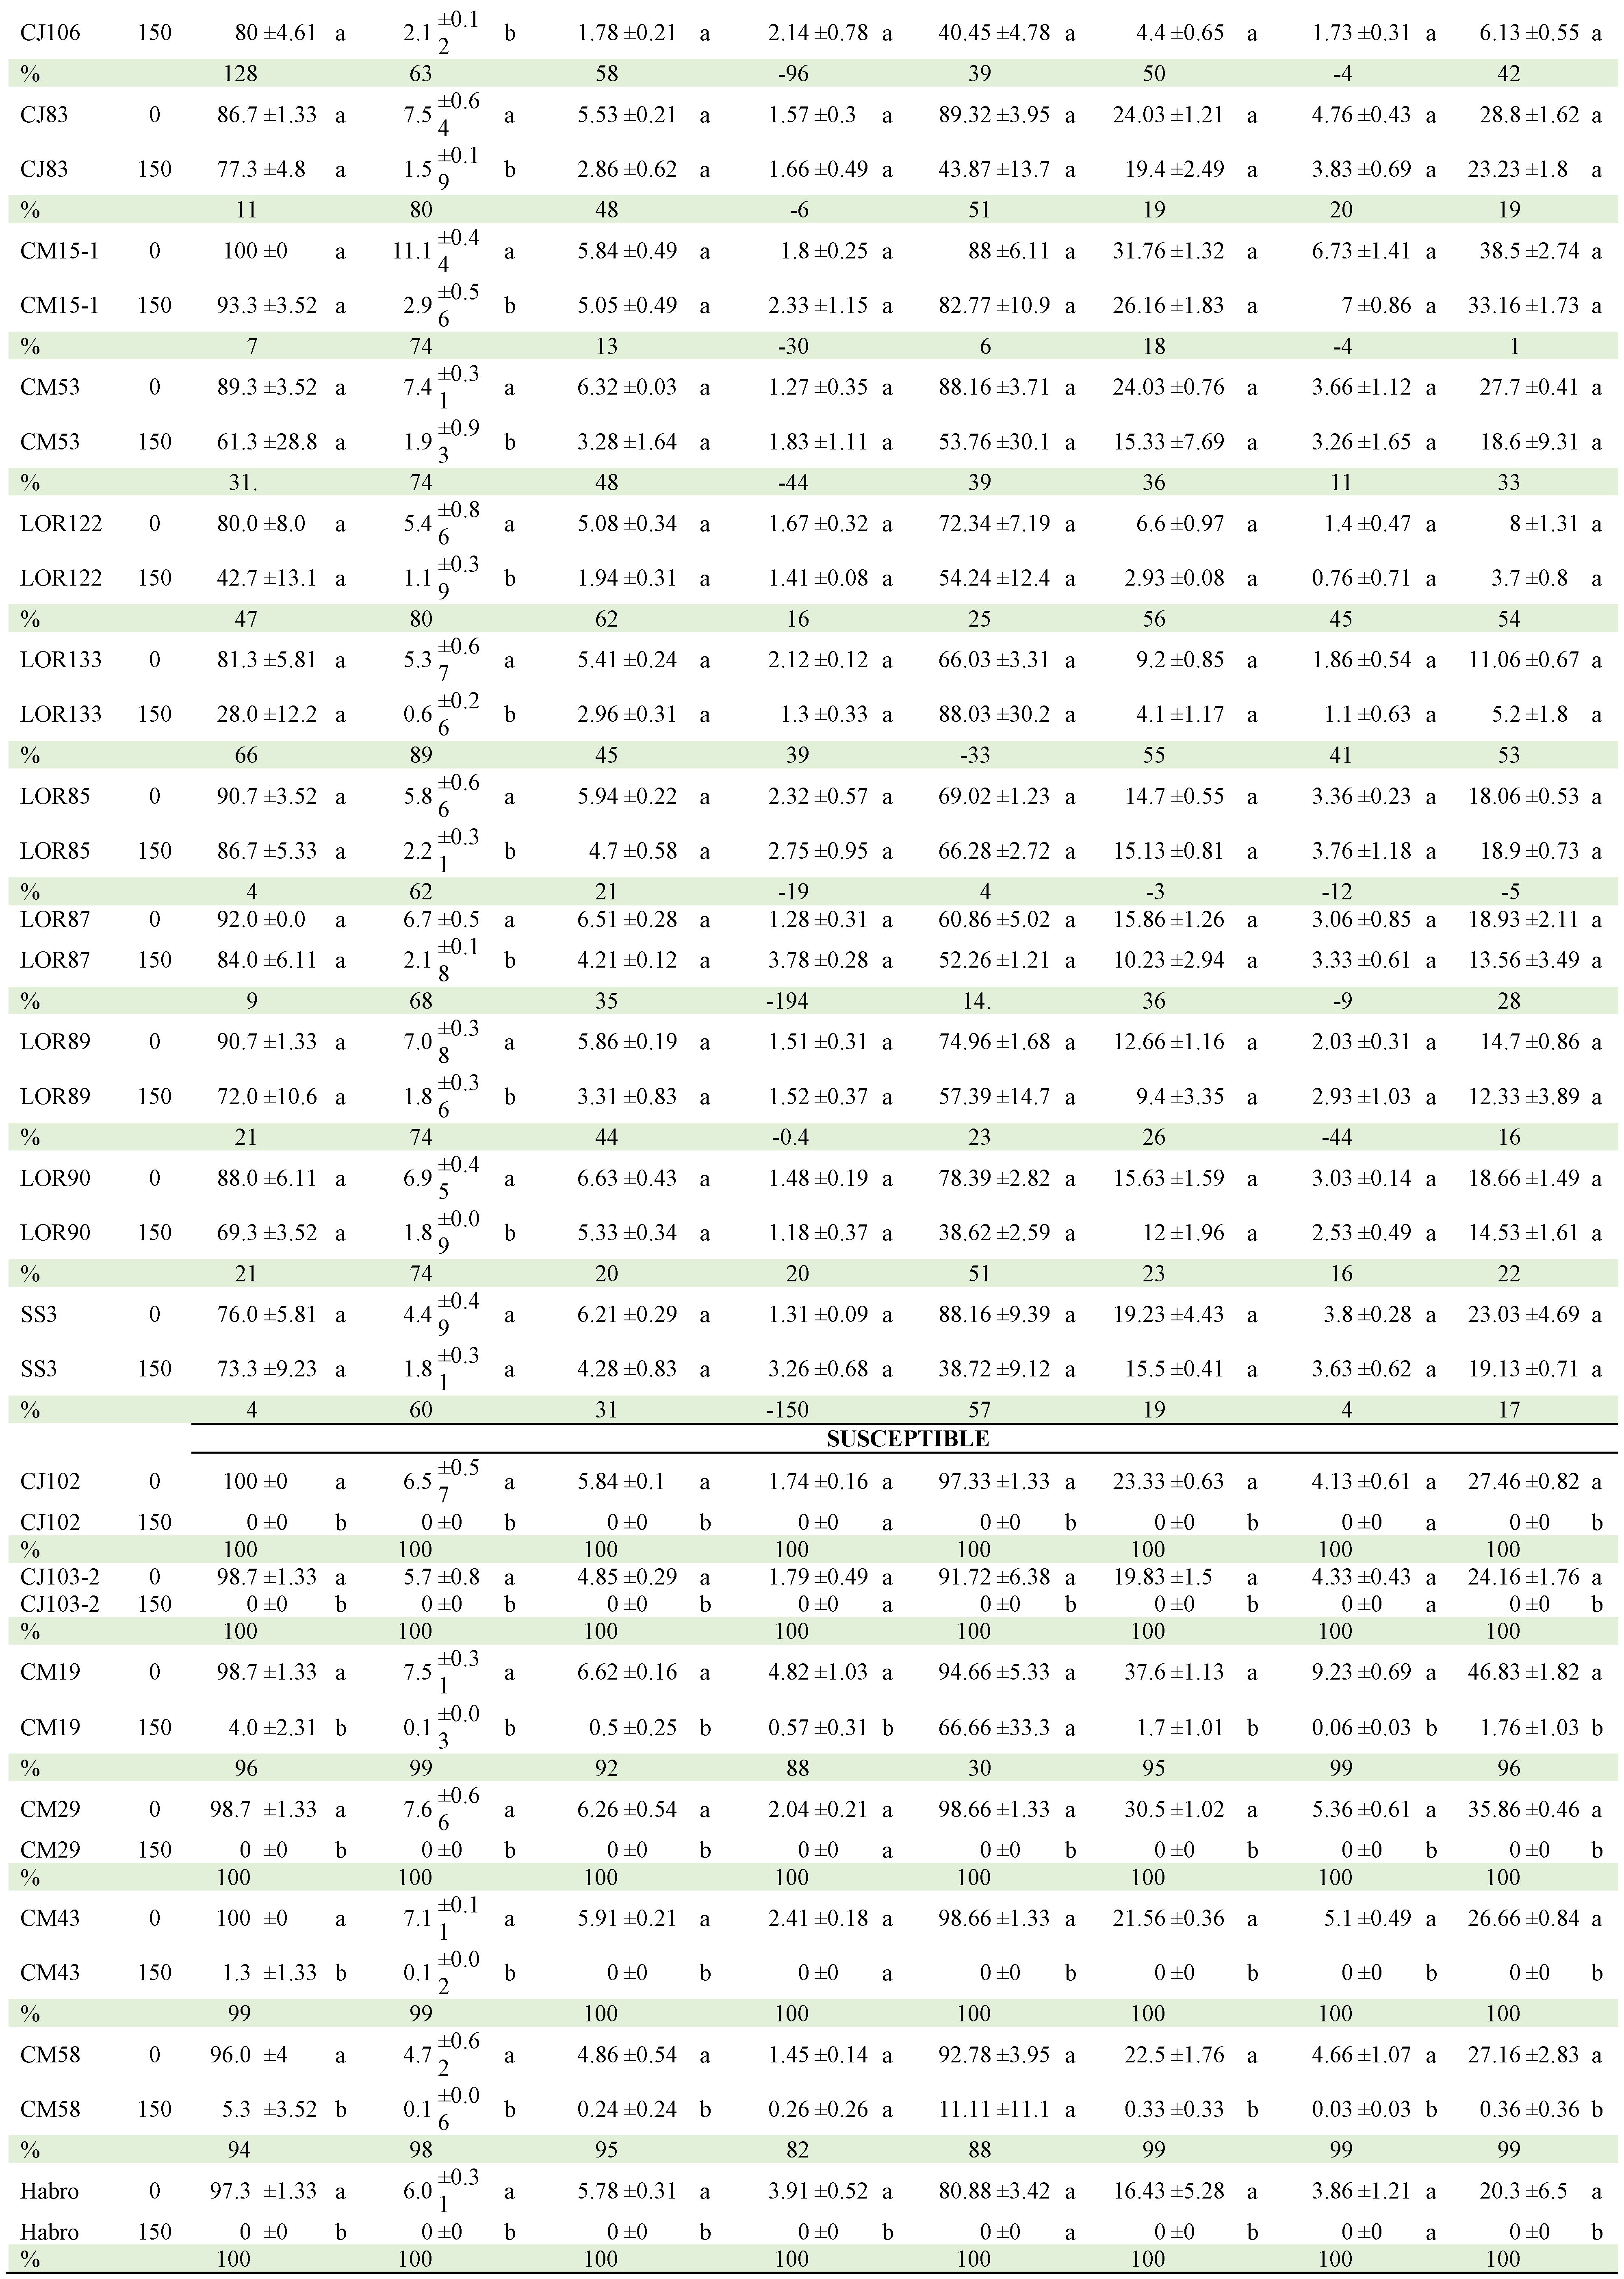
Means with the same letter vertically and within each genotype did not differ statistically (Tukey, α≤0.05). GEN: genotype, %: percentage decrease, GP: germination percentage (%), SG: speed of germination, SL: stem length (cm), RL: root length (cm), NP: number of normal plants, SDM: stem dry matter (mg), RDM: root dry matter (mg), TOTDM: total dry matter (mg). HSD: honestly significant difference.
Table 5.
Sources of variation (SV), degrees of freedom (DF) and mean squares (MS) of the analysis of variance of traits evaluated in 24 tomato lines under saline condition (175 mM NaCl) during seedling stage.
Table 5.
Sources of variation (SV), degrees of freedom (DF) and mean squares (MS) of the analysis of variance of traits evaluated in 24 tomato lines under saline condition (175 mM NaCl) during seedling stage.
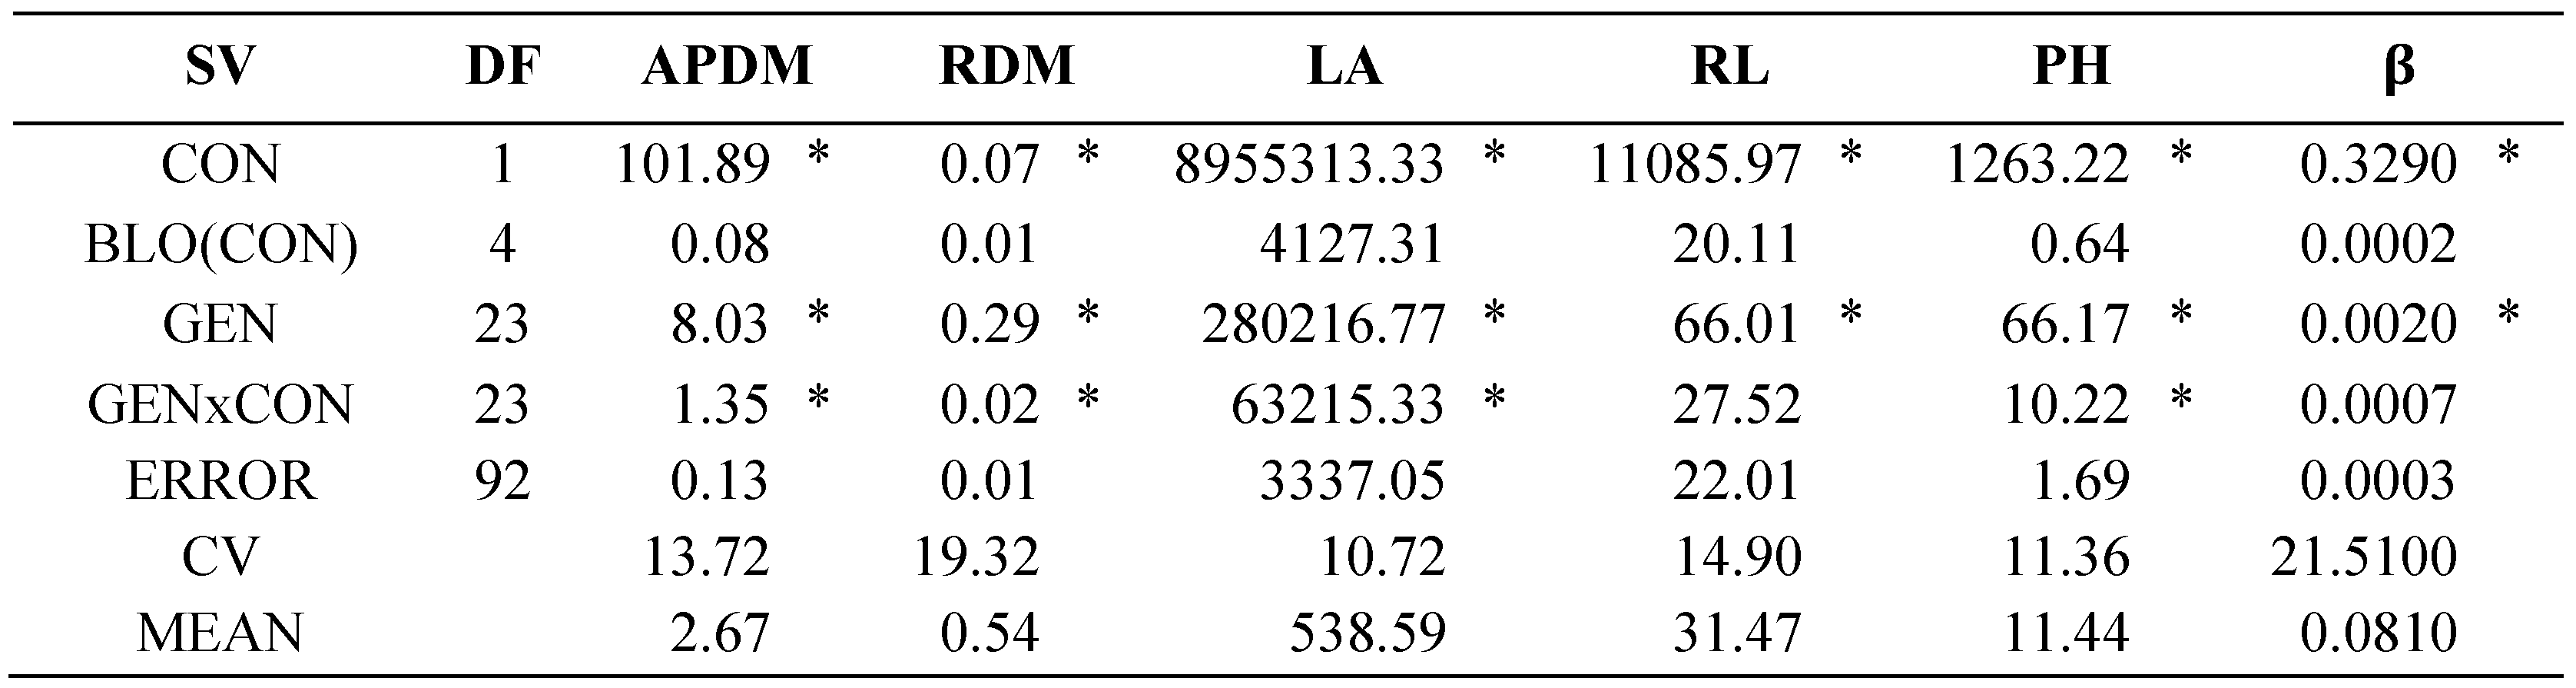
SV: source of variation, DF: degrees of freedom, CON: concentration, G: genotype, BLO(CON): nested block in concentration, GEN*CON: genotype*concentration, CV: coefficient of variation, APDM: aerial part dry matter, RDM: root dry matter, LF: leaf area, RL: root length, PH: final plant height, β: PH growth rate. * Significant with α≤0.05.
Table 6.
Mean comparisons by concentration and percentage reduction of ratios under saline condition with respect to the control of traits evaluated in 24 tomato lines under saline and control conditions.
Table 6.
Mean comparisons by concentration and percentage reduction of ratios under saline condition with respect to the control of traits evaluated in 24 tomato lines under saline and control conditions.
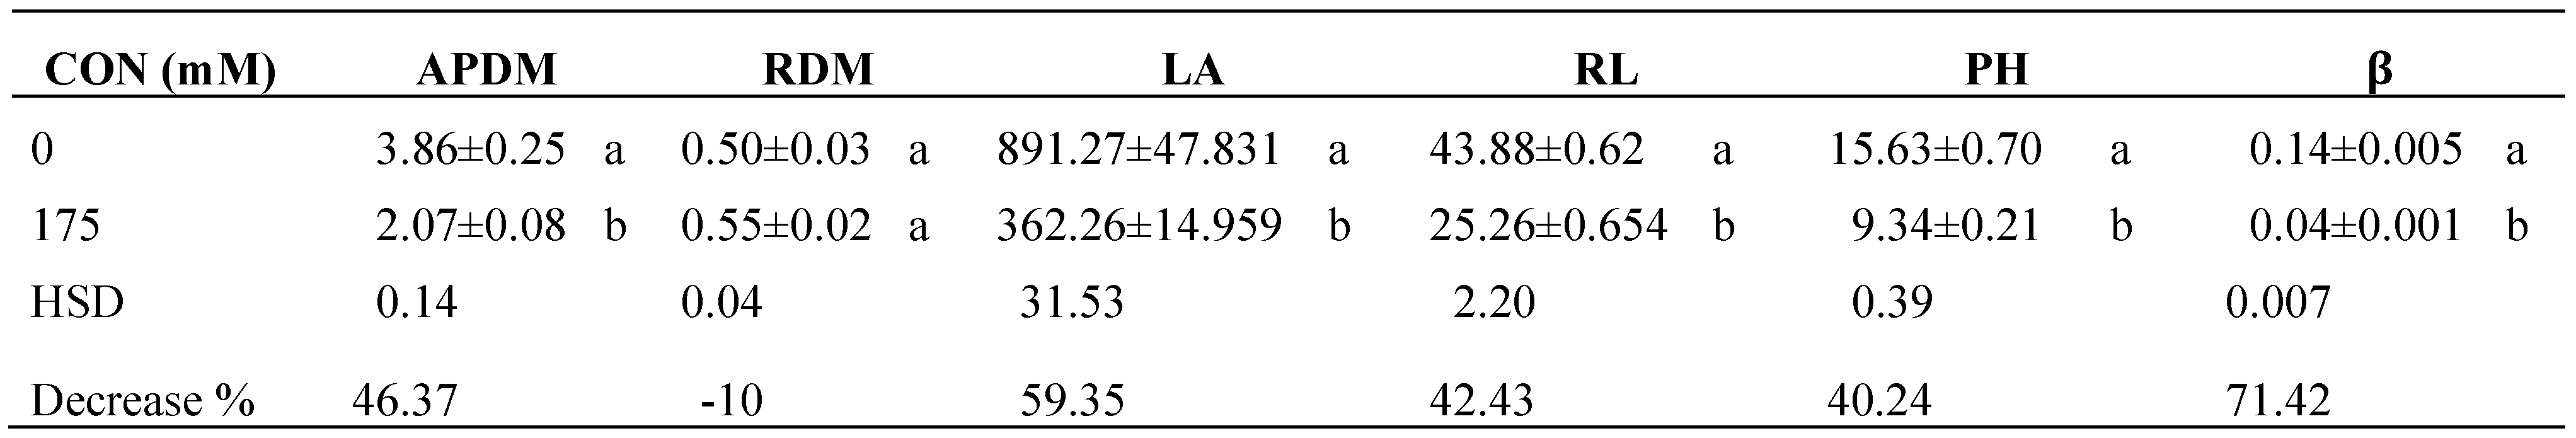
CON: concentration, APDM: aerial part dry matter, RDM: root dry matter, LA: leaf area, RL: root length, PH: final plant height, β: PH growth rate. HSD= honest significant difference; Means with the same letter within columns do not differ statistically (Tukey, α≤0.05).
Table 7.
Linear correlations between pairs of traits evaluated in 24 tomato wild lines under salinity conditions.
Table 7.
Linear correlations between pairs of traits evaluated in 24 tomato wild lines under salinity conditions.
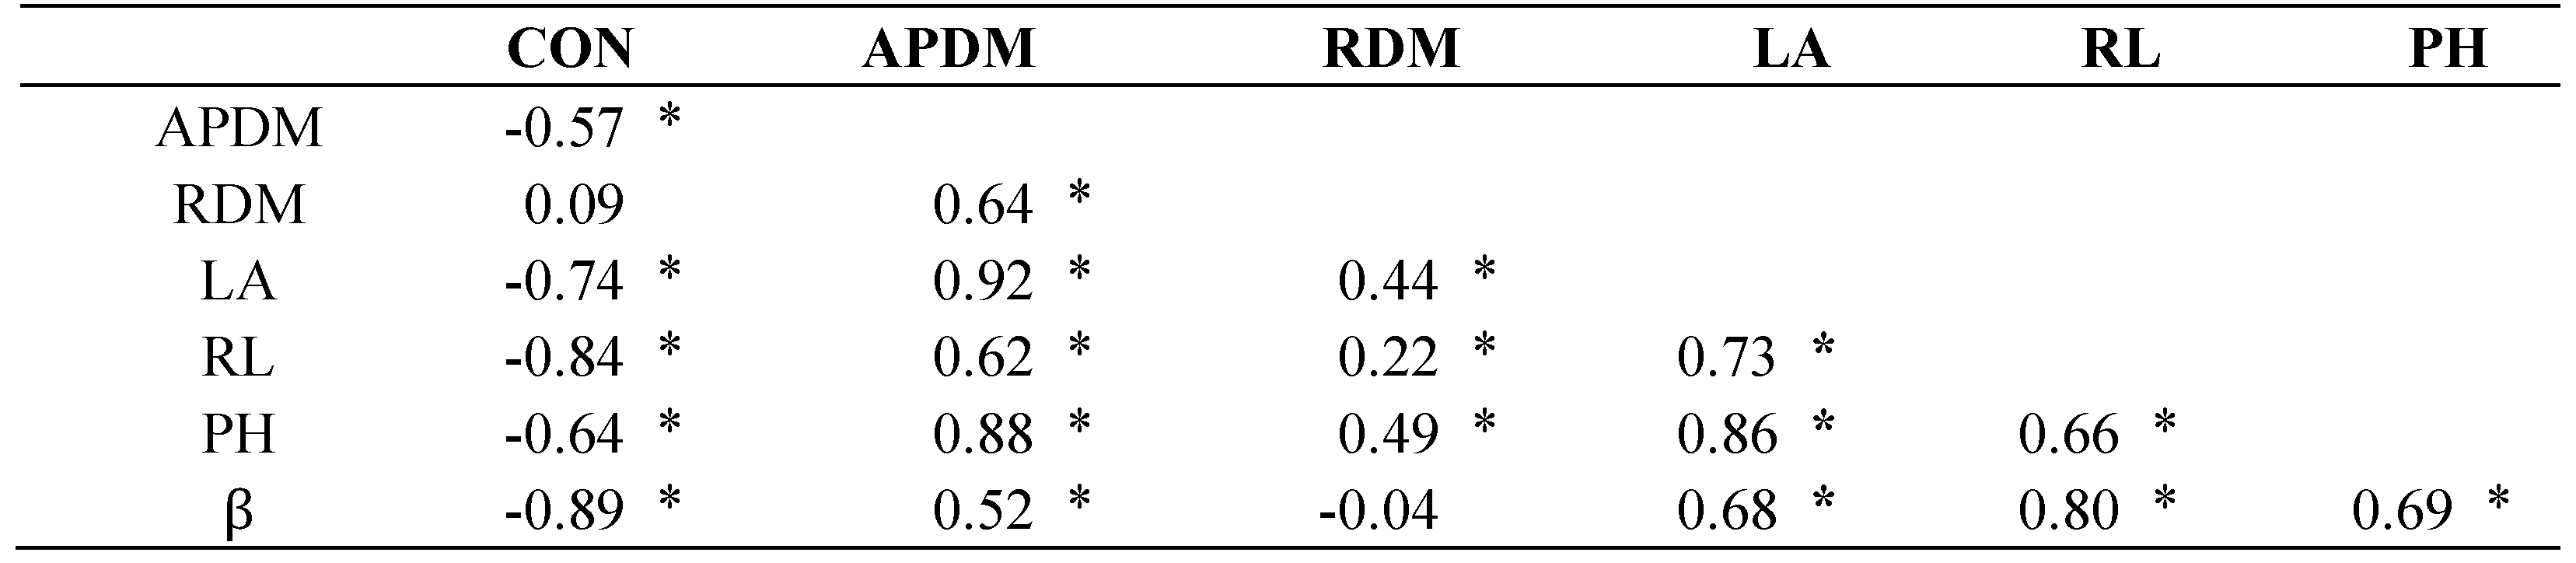
CON: concentration, APDM: aerial part dry matter, RDM: root dry matter, LA: leaf area, RL: root length, PH: final plant height, β: PH growth rate. * Significant with α≤0.05.
Table 8.
Mean comparisons of GEN x C interaction of 24 selected tomato genotypes exposed to two salinity concentrations (0 and 175 mM). Comparisons are between concentrations within each genotype.
Table 8.
Mean comparisons of GEN x C interaction of 24 selected tomato genotypes exposed to two salinity concentrations (0 and 175 mM). Comparisons are between concentrations within each genotype.
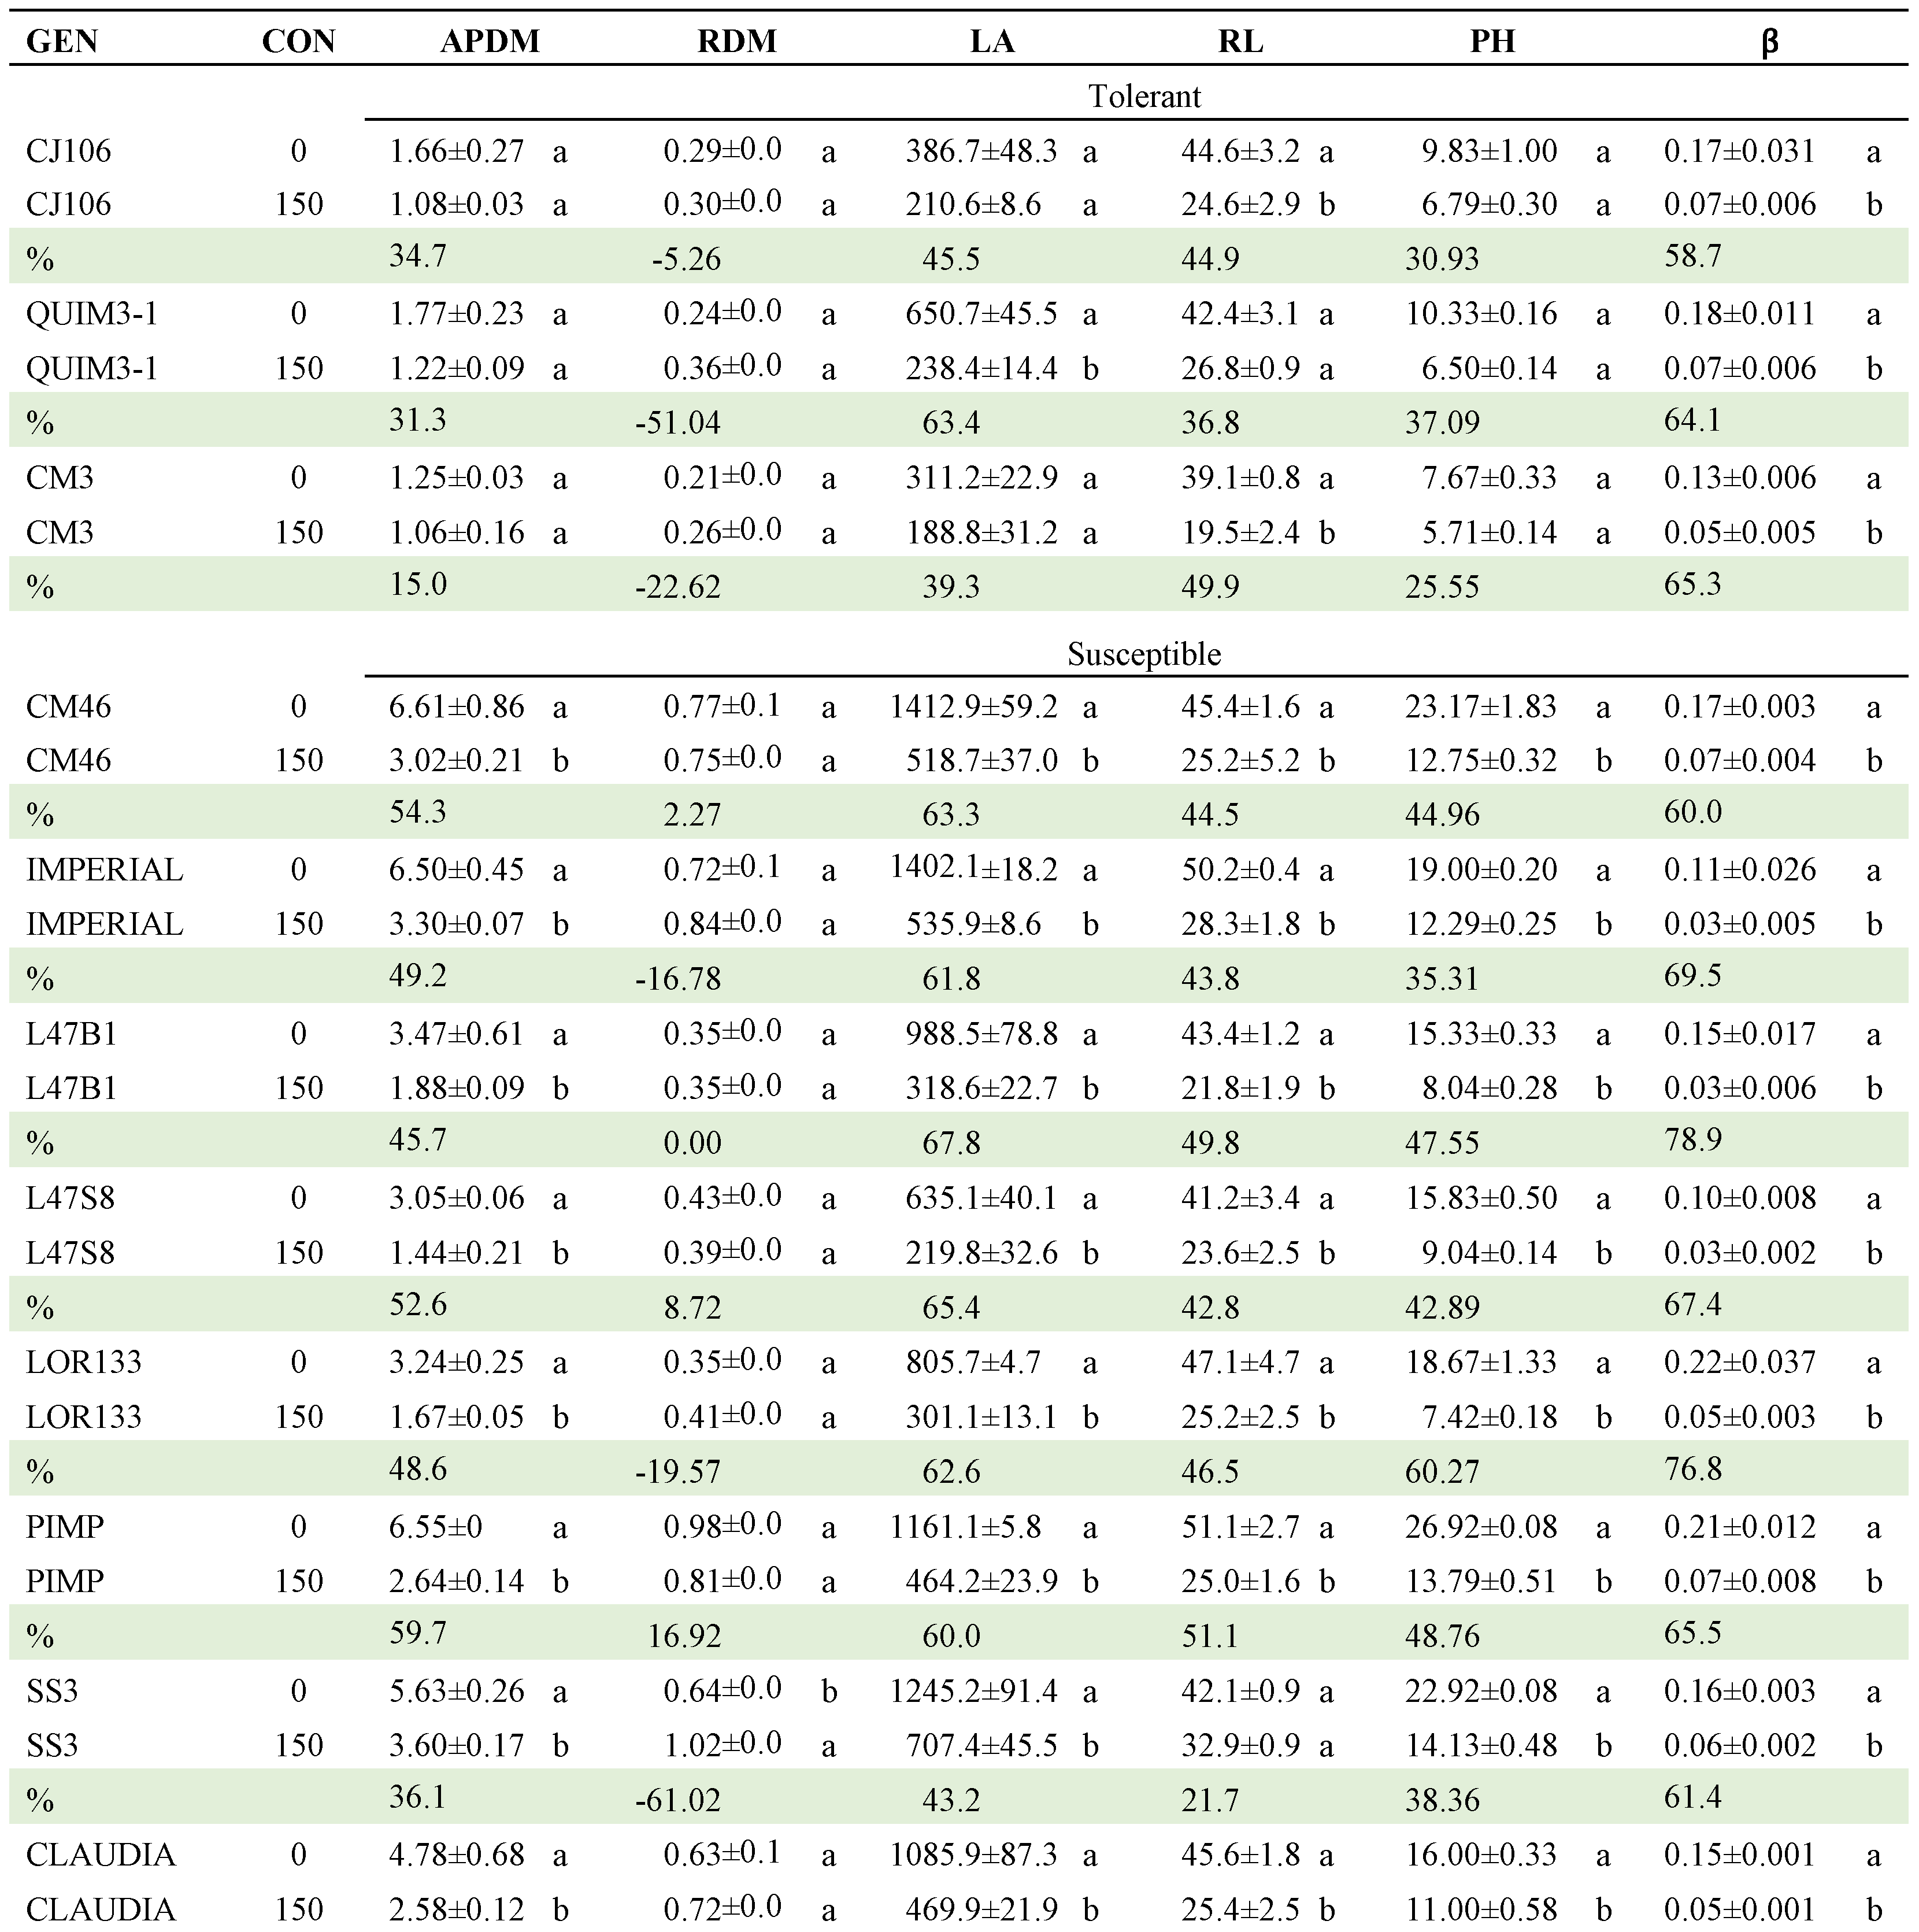
GEN: genotype, CON: concentration, %: reduction percentage, APDM: aerial part dry matter, RDM: root dry mater, LA: leaf area, RL: root length, PH: final plant height, β: PH growth rate. HSD = honest significant difference. Means with the same letter within columns do not differ statistically (Tukey, α≤0.05).
Disclaimer/Publisher’s Note: The statements, opinions and data contained in all publications are solely those of the individual author(s) and contributor(s) and not of MDPI and/or the editor(s). MDPI and/or the editor(s) disclaim responsibility for any injury to people or property resulting from any ideas, methods, instructions or products referred to in the content. |
© 2024 by the authors. Licensee MDPI, Basel, Switzerland. This article is an open access article distributed under the terms and conditions of the Creative Commons Attribution (CC BY) license (http://creativecommons.org/licenses/by/4.0/).
Copyright: This open access article is published under a Creative Commons CC BY 4.0 license, which permit the free download, distribution, and reuse, provided that the author and preprint are cited in any reuse.


