Submitted:
06 December 2023
Posted:
06 December 2023
You are already at the latest version
Abstract
In this study, we investigated the surface modification of LiNi1/3Co1/3Mn1/3O2 cathode material by coating it with ZnO and examined the changes in surface composition using X-ray diffraction (XRD) and X-ray photoelectron spectroscopy (XPS) analysis. Furthermore, we investigated the electrochemical properties, including discharge capacity and initial irreversible capacity, of the modified materials. The results revealed that ZnO predominantly existed on the material surface, exerting influence on both surface composition and electrochemical characteristics. As the ZnO coating amount increased, the nickel and manganese content on the material surface also increased, and heat treatment at 400 °C resulted in the formation of composite oxides of transition metals and zinc on the material surface. The bonding energy of transition metals increased, and ZnO coating at a mass fraction of 2 % effectively suppressed irreversible reactions around 3.6 V at 55 °C, thereby improving initial coulombic efficiency. Battery materials coated with 2% ZnO exhibited optimal discharge capacity and cycle life at 55 °C/0.5 C.
Keywords:
ESS lithium-ion Battery
; Cathode Materials
; ZnO
; LiNi1/3Co1/3Mn1/3O2
1. Introduction
Due to their high energy density, lithium-ion secondary batteries have expanded their market to include large-scale batteries such as energy storage systems (ESS) [1,2]. In lithium-ion batteries applied to ESS, the storage capacity and cycle life are crucial factors. As a result, there has been a continuous increase in the demand for improving battery performance. Research on electrode materials has been conducted to enhance the performance of batteries, and improvements in battery design have also been implemented [3,4].
Since its introduction by Ohzuku in 2001 [5], the NCM (LiNi1/3Co1/3Mn1/3O2) cathode material has been widely recognized for its excellent cycling performance and safety, and it possesses great potential as a cathode material. However, it has the drawback of low practical density and large irreversible capacity, leading to issues such as rapid capacity decay when used at temperatures above room temperature, particularly in Energy Storage Systems (ESS) [6].
The surface structure of electrode materials generally has a significant impact on their electrochemical performance. During the initial electrochemical reaction, the material surface reacts irreversibly with the electrolyte, forming a solid electrolyte interphase (SEI) [7,8], which causes the first irreversible capacity loss. Excessive discharge leads to the dissolution of active materials and the destruction of the material surface structure, resulting in a rapid decrease in battery capacity. Surface coating is an effective method to improve electrochemical performance and enhance the surface stability of cathode materials, thus improving initial efficiency and cycle life. Metal oxides such as Al2O3, AlPO4, and ZrO2 are commonly used as coating materials.
ZnO has been applied to spinel-type cathode materials such as LiMn2O4 and LiNi0.5Mn1.5O4 to suppress manganese dissolution within the electrode. Coating LiNi1/3Co1/3Mn1/3O2 cathode material with ZnO can enhance the cycling performance of batteries [9].
In this paper, we investigated the surface state and electrochemical performance during charge/discharge at various temperatures of ZnO-coated LiNi1/3Co1/3Mn1/3O2 cathode material.
2. Experiment
The precursor for the cathode material, LiNi1/3Co1/3Mn1/3O2, is prepared by NiSO4 · 6H2O, CoSO4 · 7H2O, and MnSO4 · H2O in a 1:1:1 molar ratio. The mixture is then dissolved in a 1 mol/L NaOH solution and a complexing agent NH4OH solution, while adjusting the pH to 11.0-11.5 at a temperature of 55°C. Afterwards, LiOH · H2O is added to the mixture in a 1:1.05 molar ratio and the resulting precursor is calcined at 900 °C for 24 hours to produce LiNi1/3Co1/3Mn1/3O2 cathode material.
Zn(CH3COO)2 · 2H2O is used as the source material for ZnO. It is added in 1 % and 2 % ratios to the LiNi1/3Co1/3Mn1/3O2 material, and the mixture is ultrasonically blended. After that, the mixture is dried at 120°C for 6 hours to remove moisture, then crushed and sieved to 300 mesh after being calcined at 400 °C for 1 hour in a furnace. This process results in the production of cathode active material coated with ZnO. Uncoated LiNi1/3Co1/3Mn1/3O2 and ZnO-coated cathode materials with 1 % and 2 % ZnO are separately prepared.
For the cathode electrode, acetylene black and polyvinylidene fluoride (PVDF) are mixed in a mass ratio of 85:9:6, respectively. N-methyl-2-pyrrolidone (NMP) is added as a solvent in a 1:1 ratio to create a homogeneous mixture. This mixture is uniformly coated onto an aluminum foil and dried at 100 °C for 12 hours to fabricate the cathode. The fabricated cathode is then cut into strips of approximately 12 mm in width.
To assemble the button-type battery, the fabricated cathode, lithium foil as the anode, and a polypropylene film separator (Celgard 2300) are combined with a 1 mol/L LiPF6 electrolyte solution in ethylene carbonate (EC), ethyl methyl carbonate (EDC), and dimethyl carbonate (DMC) in a 1:1:1 volume ratio. The assembly is performed in an argon-filled glovebox.
The cathode material coated with ZnO is analyzed using X-ray diffraction (XRD) with a wavelength of 0.15418 nm, voltage of 40 kV, current of 20 mA, scan speed of 5 mm/min, step size of 0.02 mm, and scan range of 10-80 degrees to determine the crystalline structure of the material. The Zn2+ content is measured using an ICPS-1000II analyzer. The surface composition and oxidation states of the material's elements are determined using a Phi 5500 instrument, with electron energy values calibrated against the C1s peak (284.6 eV).
The performance of the fabricated batteries is then tested using a Blue battery tester (CT2001A) within a voltage range of 2.75 ~ 4.2 V to evaluate their electrochemical properties.
3. Result and Discussion
3.1. The Crystal Structure of the Cathode Material with ZnO Coating
Table 1 represents the zinc content of ZnO-coated LiNi1/3Co1/3Mn1/3O2 cathode powder measured by vacuum induction-coupled plasma mass analysis and ICP analysis. The samples without ZnO coating, denoted as a, and those with 1 % and 2 % ZnO coating, denoted as b and c, respectively, show that the ZnO content closely matches the design values. Figure 1 displays the XRD spectra of LiNi1/3Co1/3Mn1/3O2 cathode materials with different ZnO coatings. From Figure 1, it can be observed that the ZnO coating does not alter the crystal structure of the LiNi1/3Co1/3Mn1/3O2 material. The XRD spectra of the three materials are very similar, indicating a typical layered oxide structure, namely nano-NaFeO2 structure, belonging to the R-3m space group with no noise. The characteristic peaks of ZnO are not detected in the spectra, likely due to the difficulty of detection caused by the low ZnO content. Only when the ZnO coating exceeds 4 %, the characteristic peaks of ZnO are observed.
Suggest that the XRD spectra intensity ratio of (003) and (104) diffraction peaks, denoted as I003/I104, can be used to indicate the degree of cation mixing in the nickel-cobalt-manganese ternary layered material structure. If I003/I104 is greater than 1.2, it indicates a lower degree of cation mixing, a more stable layered structure, and superior electrochemical performance[10]. The calculated values of I003/I104 for a, b, and c are 1.5, 1.3, and 1.4, respectively, indicating that the layered structure of the three materials is very good and the degree of cation mixing is extremely low. Additionally, use the (I106 + I102)/I101 ratio to indicate the order of the hexagonal lattice. A smaller value represents a higher order of the hexagonal lattice. The calculated values of (I106 + I102)/I101 for a, b, and c are 0.44, 0.48, and 0.48, respectively. Although the (I106 + I102)/I101 value of a is the smallest, after ZnO coating, it indicates a decrease in the crystal lattice order of the material, suggesting the possibility of some Zn atoms entering the lattice.
Table 2 shows that the binding energies of Zn 2p3/2 and Zn 2p1/2 in sample c are 1022.1 eV and 1045.4 eV, respectively, which are similar to the previously reported values for ZnO (1022.5 eV and 1045.5 eV) [11]. This indicates that the major zinc species present on the surface after the ZnO coating are zinc ions. As a result, the binding energies of excessive metallic Ni2+, Co3+, and Mn4+ increase. Table 2 also demonstrates the matching of the energy values of peak 1 and the binding energies of Ni2+, Co3+, and Mn4+, while peak 2 represents the increased binding energy. In sample c, energy values of 642.7 eV corresponding to 70 % manganese, 781.9 eV corresponding to 25 % cobalt, and 856.7 eV corresponding to 33 % nickel are observed. XPS chemical shifts reflect different bonding environments of elements, so the presence of high binding energy components of excessive metals could be due to value appreciation or the formation of new compounds, such as LiAlCoO2, where the addition of Al leads to an increased binding energy of Co [12].
Table 3 presents the molar ratio test results of surface elemental compositions for the three materials. Assuming that Zn2+ from ZnO is entirely diffused into the material, the Zn/Co molar ratios for 1 % and 2 % ZnO coatings would be 0.035 and 0.071 on average, respectively. However, based on the surface Zn/Co molar ratios obtained from XPS testing in Table 3, it can be inferred that Zn2+ did not fully diffuse into the LiNi1/3Co1/3Mn1/3O2 lattice but mostly distributed on the particle surface.
Furthermore, on the surface of LiNi1/3Co1/3Mn1/3O2, the transition metal ratios deviated from the chemical formula composition, with higher nickel and manganese contents. There are also findings regarding the difference between surface composition and crystal interior of the cathode material [14], but after ZnO coating, the nickel and manganese contents increased on the surfaces of materials a and b compared to material a alone. Moreover, these contents increased as the coating amount increased. These changes are clearly associated with the presence of ZnO on the material surface. The analysis indicates that, after ZnO coating, the surface of the material exhibits increased nickel and manganese contents, which further increase with higher coating amounts. Therefore, it is presumed that the high binding energy portion of surface transition metals is possibly attributed to the formation of a complex oxide (Zn, Ni, Mn)O through the combination with zinc.
3.2. Electrochemical Characteristics
Swag-type batteries assembled with materials a, b, and c underwent charge-discharge testing at room temperature and 55 ℃. Initially, a cycling test was conducted at a rate of 0.1 C for two weeks, followed by cycling at a rate of 0.5 C. Figure 2 represents the initial charge-discharge curve at 0.1 C, and Figure 3 shows the capacity retention curve after 50 cycles at 0.5 C.
For material a, the initial discharge capacity at 0.1 C is 183/16498 mAh/g, with an initial Coulombic efficiency of 89.4 %. After 50 cycles, the capacity of battery a decreased from 126.8 mAh/g to 125.8 mAh/g, resulting in a capacity retention of 99.2 %. The inclusion of ZnO at different amounts in batteries b and c resulted in a decrease in the initial discharge capacity compared to battery a. This could be attributed to ZnO being electrochemically inactive and not participating in the battery reaction. The ZnO coating layer formed on the surface may hinder the diffusion of lithium ions, thereby reducing the initial discharge capacity.
The 0.5 C discharge capacity of battery b is similar to battery a, while battery c exhibits relatively lower discharge capacity. This suggests that the benefits of ZnO coating were not evident in the room temperature discharge.
The initial charge-discharge curves at 55 °C and 0.1 C for batteries a, b, and c are depicted in Figure 4. At 55 °C, the charge-discharge capacity of battery a increased to 232.9/155.4 mAhg-1 compared to the capacity at room temperature. This can be attributed to faster ion diffusion, allowing for more Li+ insertion/extraction. However, the initial cycle efficiency was low at 66.7 %, indicating increased side reactions on the surface of the active material, in addition to some Li+ consumption associated with the thickened solid-electrolyte interface (SEI) layer. These additional reactions on the surface of the active material are considered major side reactions, leading to electrolyte decomposition, metal dissolution, or oxidation within the active material, which can cause structural degradation [15].
Batteries b and c, on the other hand, exhibited slightly decreased discharge capacities of 134.6 mAhg-1 and 158.3 mAhg-1, respectively, but with improved initial efficiencies. They achieved efficiencies of 67.8 % and 74.0 %, respectively. This suggests that the appropriate amount of ZnO coating can suppress some side reactions by preventing direct contact between the electrode material and the electrolyte, thereby enhancing the initial efficiency.
The initial charge-discharge curves for batteries a, b, and c are presented in Figure 5. In the oxidation curve, a reaction was observed around 3.7~3.9 V, and battery a exhibited a reaction even at 3.6 V. However, in the reduction curve, the corresponding reaction peak was not observed, indicating its irreversibility. This reaction can be attributed to byproduct reactions on the surface of the active material or SEI formation and growth. Battery b showed a small irreversible reaction peak near 3.6 V in the oxidation curve, while this peak was less distinct in battery c, indicating the lowest irreversible capacity.
This is consistent with the initial efficiency results and suggests that an appropriate amount of ZnO coating modifies the surface state of LiNi1/3Co1/3Mn1/3O2 material, suppressing irreversible reactions around 3.6 V.
The cycling lifespan curves at 55 °C/0.5 C for batteries a, b, and c are shown in Figure 6. The initial cycling discharge capacity for battery a is 129.7 mAh/g, and the capacity retention after 50 cycles is 96.7 %. The initial cycling capacities for batteries b and c are 127.2 mAh/g and 136.9 mAh/g, respectively, and the capacity retentions after 50 cycles are 95.8 % and 96.4 %, respectively. The differences in capacity retention among the three materials are not significant, with all of them being approximately 96 %. This indicates that the cycling lifespan of the LiNi1/3Co1/3Mn1/3O2 material is excellent under typical cutoff voltage and low-rate conditions (C/2, below 4.2 V), and the ZnO coating did not alter this characteristic.
4. Conclusion
The transition metal ratio on the surface of LiNi1/3Co1/3Mn1/3O2 indicates an excess of nickel and manganese content compared to the chemical formula composition. After incorporating ZnO, the nickel and manganese content on the material surface increased proportionally to the amount of ZnO inclusion. Zinc on the surface primarily exists in the form of Zn2+. The ZnO coating increased the binding energy of the transition metals Ni, Co, and Mn. It exhibited a binding energy of 642.8 eV, corresponding to 70 % of manganese, 782.0 eV, corresponding to 25 % of cobalt, and 856.8 eV, corresponding to 33 % of nickel. The high binding energy of nickel and manganese can be attributed to the formation of a composite oxide (Zn, Ni, Mn) O on the surface. The ZnO coating altered the surface condition of the material, effectively suppressing irreversible reactions around 3.6 V and improving the initial coulombic efficiency from 66.7 % to 74.0 %. The 2 % ZnO coating exhibited higher discharge capacity and cycle lifespan at 55 °C/0.5 C.
References
- J. M. Tarascon and M. Armand, ‘Issues and challenges facing rechargeable lithium batteries’, Nature. 414, 359(2001). [CrossRef]
- H. Li, Z.X. Wang, L.Q. Chen, and X.J. Huang, ‘Research on Advanced Materials for Li-ion Batteries’, Adv. Mater., 21, 4593 (2009). [CrossRef]
- Y. Kuang, C. Chen, D. Kirsch, and L. Hu, ‘Thick Electrode Batteries: Principles, Opportunities, and Challenges’, Adv. Energy Mater., 9, 1901457 (2019). [CrossRef]
- M. Singh, J. Kaiser, and H. Hahn, ‘Thick Electrodes for High Energy Lithium Ion Batteries’, J. Electrochem. Soc., 162, A1196 (2015). [CrossRef]
- Ohzuku T, Makimura Y., “Layered lithium insertion material of LiNi1/3Co1/3Mn1/3O2 for lithium-ion battery,” Chemistry Letters, 2001, 68(7): 642-643. [CrossRef]
- Myung S T, Lee M H, Komaba S, et al. “Hydrothermal synthesis of layered Li[Ni1/3Co1/3Mn1/3]O2 as positive electrode material for lithium secondary battery,” Electrochimica Acta, 2005, 50(24): 4800-4806. [CrossRef]
- Wang Z X, Sun Y C, Chen L Q, et al. “Electrochemical characterization of positive electrode material LiNi1/3Co1/3Mn1/3O2 and compatibility with electrolyte for lithium-ion batteries,” Journal of The Electrochemical Society, 2004, 151(6): A914-A921. [CrossRef]
- Aurbach D. “Electrode-solution interactions in Li-ion batteries: A short summary and new insights,” Journal of Power Sources, 2003, 119-121: 497-503. [CrossRef]
- Tan L, Liu H W. “Influence of ZnO coating on the structure,morphology and electrochemical performances for LiNi1/3Co1/3Mn1/3O2 material,” Russian Journal of Electrochemistry, 2011, 4(2): 156-160. [CrossRef]
- Li D C, Muta T, Zhang L Q, et al. “Effect of synthesis method on the electrochemical performance of LiNi1/3 Mn1/3Co1/3O2,” Journal of Power Sources, 2004, 132(1/2): 150-155. [CrossRef]
- Saw K G, Ibrahim K, Lim Y T, et al. “Self-compensation in ZnO thin films: An insight from X-ray photoelectron spectroscopy, Raman spectroscopy and time-of-flight secondary ion mass spectroscopy analyses,” Thin Solid Films, 2007, 515(5): 2879-2884. [CrossRef]
- Daheron L, Dedryvere R, Martinez H, et al. “Possible explanation for the efficiency of Al-based coatings on LiCoO2 surface properties of LiCo1-xAlxO2 solid solution,” Chemistry of Materials, 2009, 21(23): 5607-5616. [CrossRef]
- Choa T H, Parka S M, Yoshio M, et al. “Effect of synthesis condition on the structural and electrochemical properties of Li[Ni1/3Mn1/3Co1/3]O2 prepared by carbonate coprecipitation method,” Journal of Power Sources, 2005, 142(1/2): 306-312. [CrossRef]
- Kosova N V, Devyatkina E T, Kaichev V V. “Optimization of Ni2+/Ni3+ ratio in layered Li(Ni, Mn, Co)O2 cathodes for better electrochemistry,” Journal of Power Sources, 2007, 174(2): 965-969. [CrossRef]
- Aurbach D, Markovsky B, Rodkin A, et al. “On the capacity fading of LiCoO2 intercalation electrodes: The effect of cycling, storage, temperature, and surface film forming additives,” Electrochimica Acta, 2002, 47 (27): 4291-4306. [CrossRef]
Figure 1.
XRD patterns.
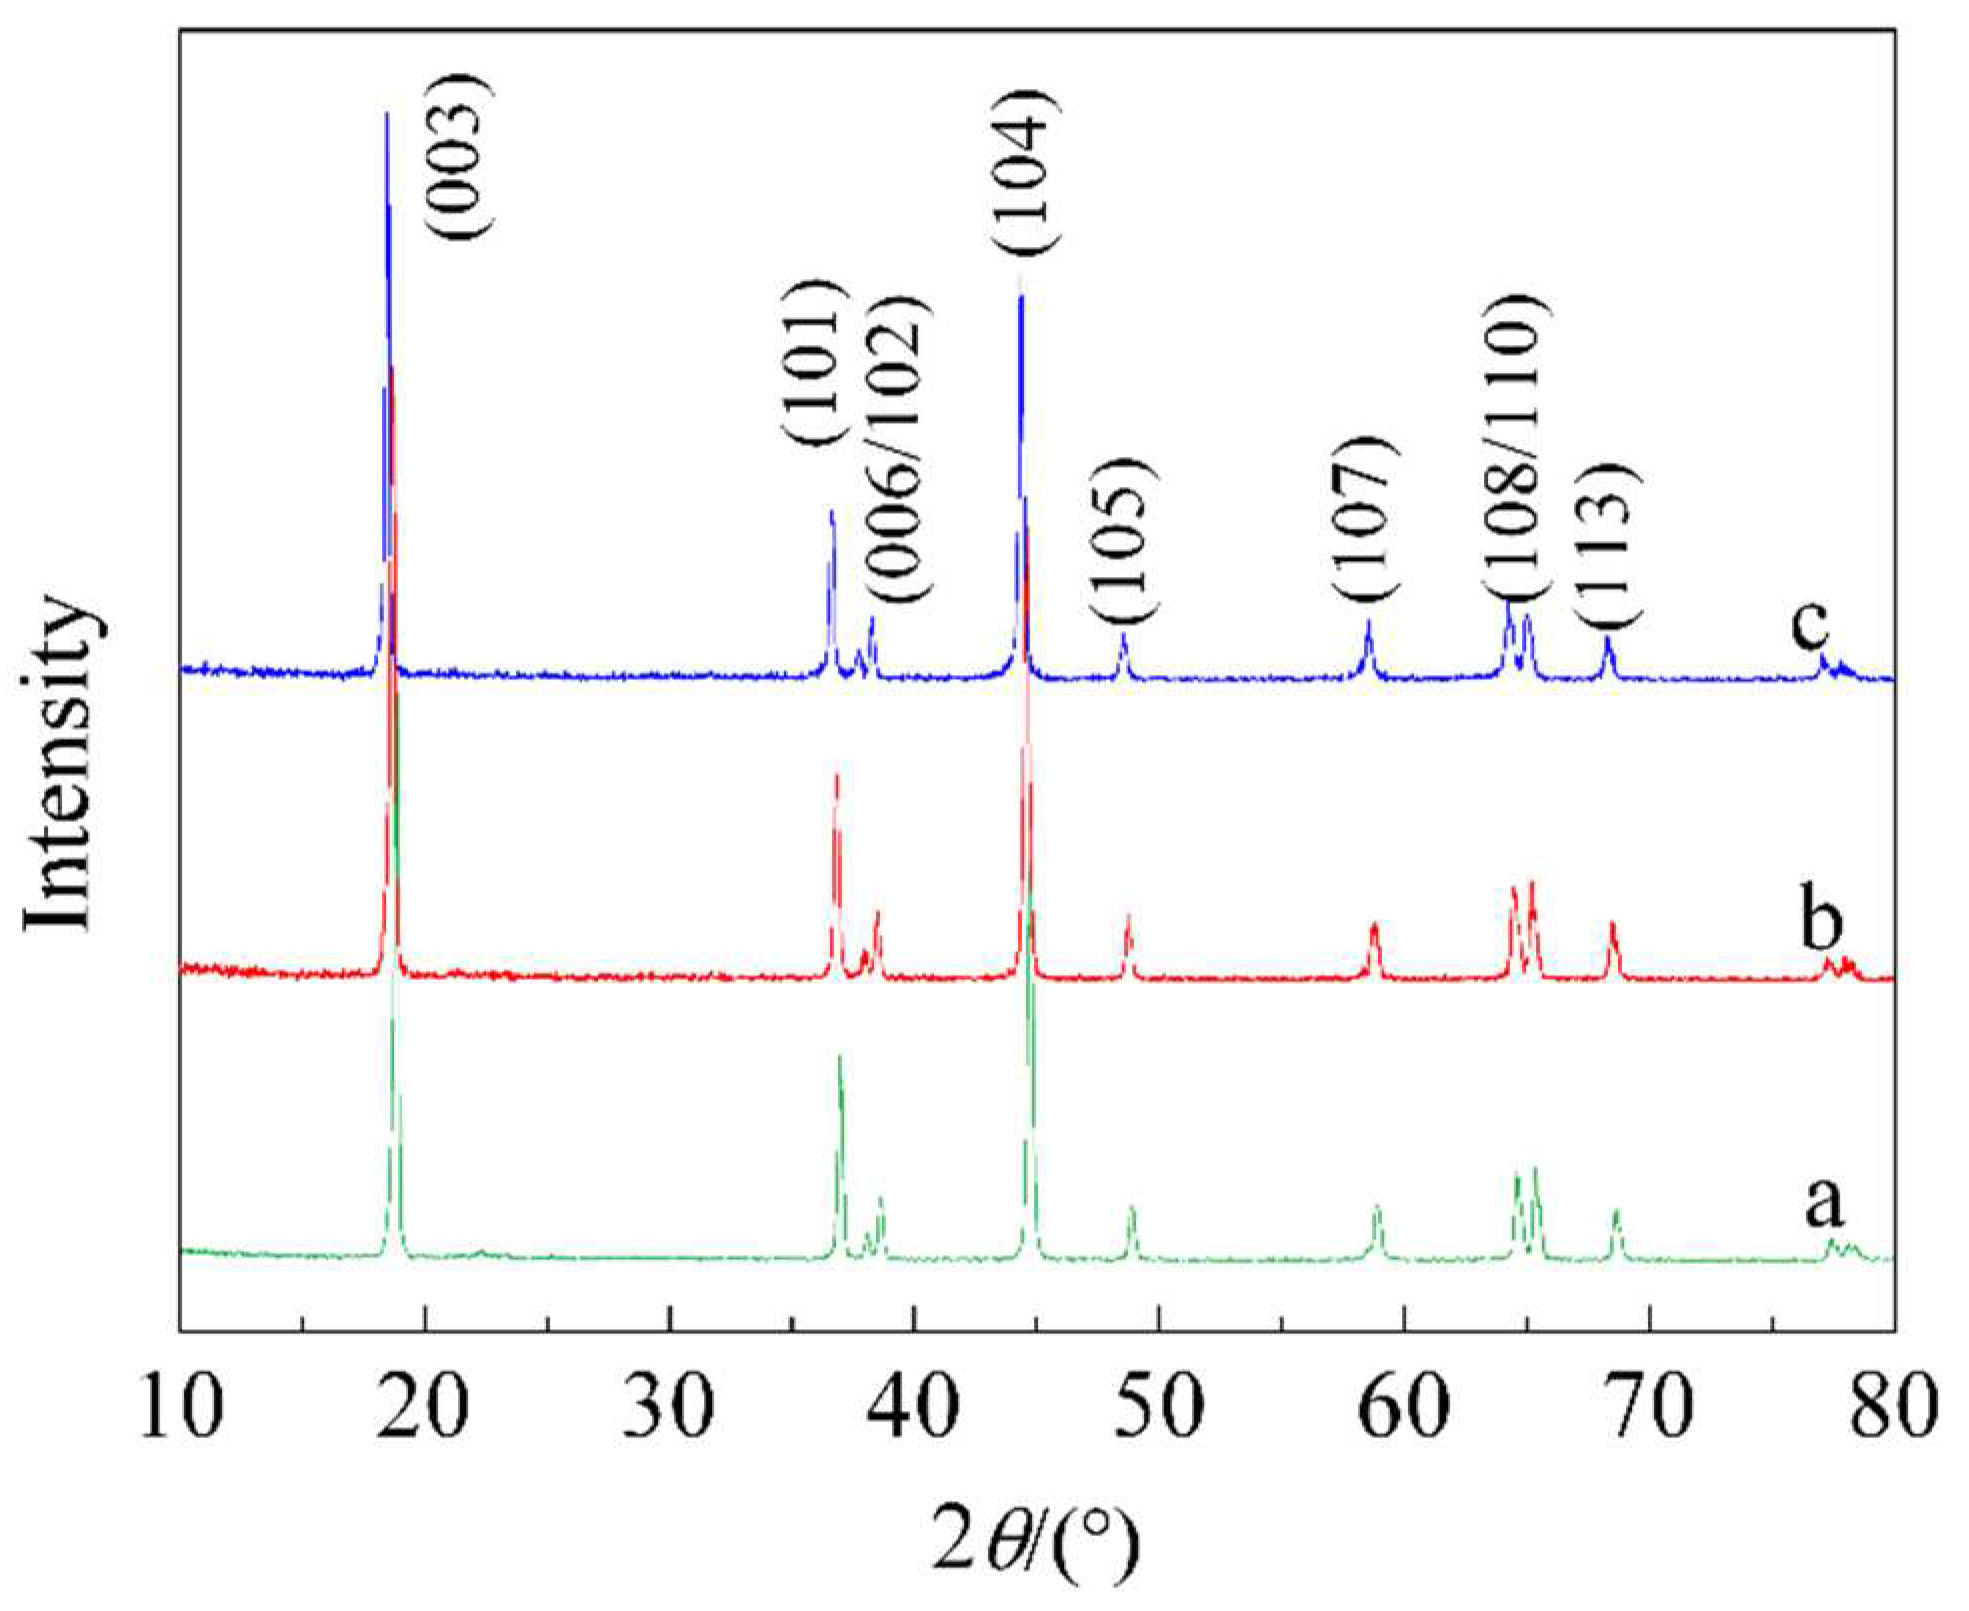
Figure 2.
The first charge-discharge curves.
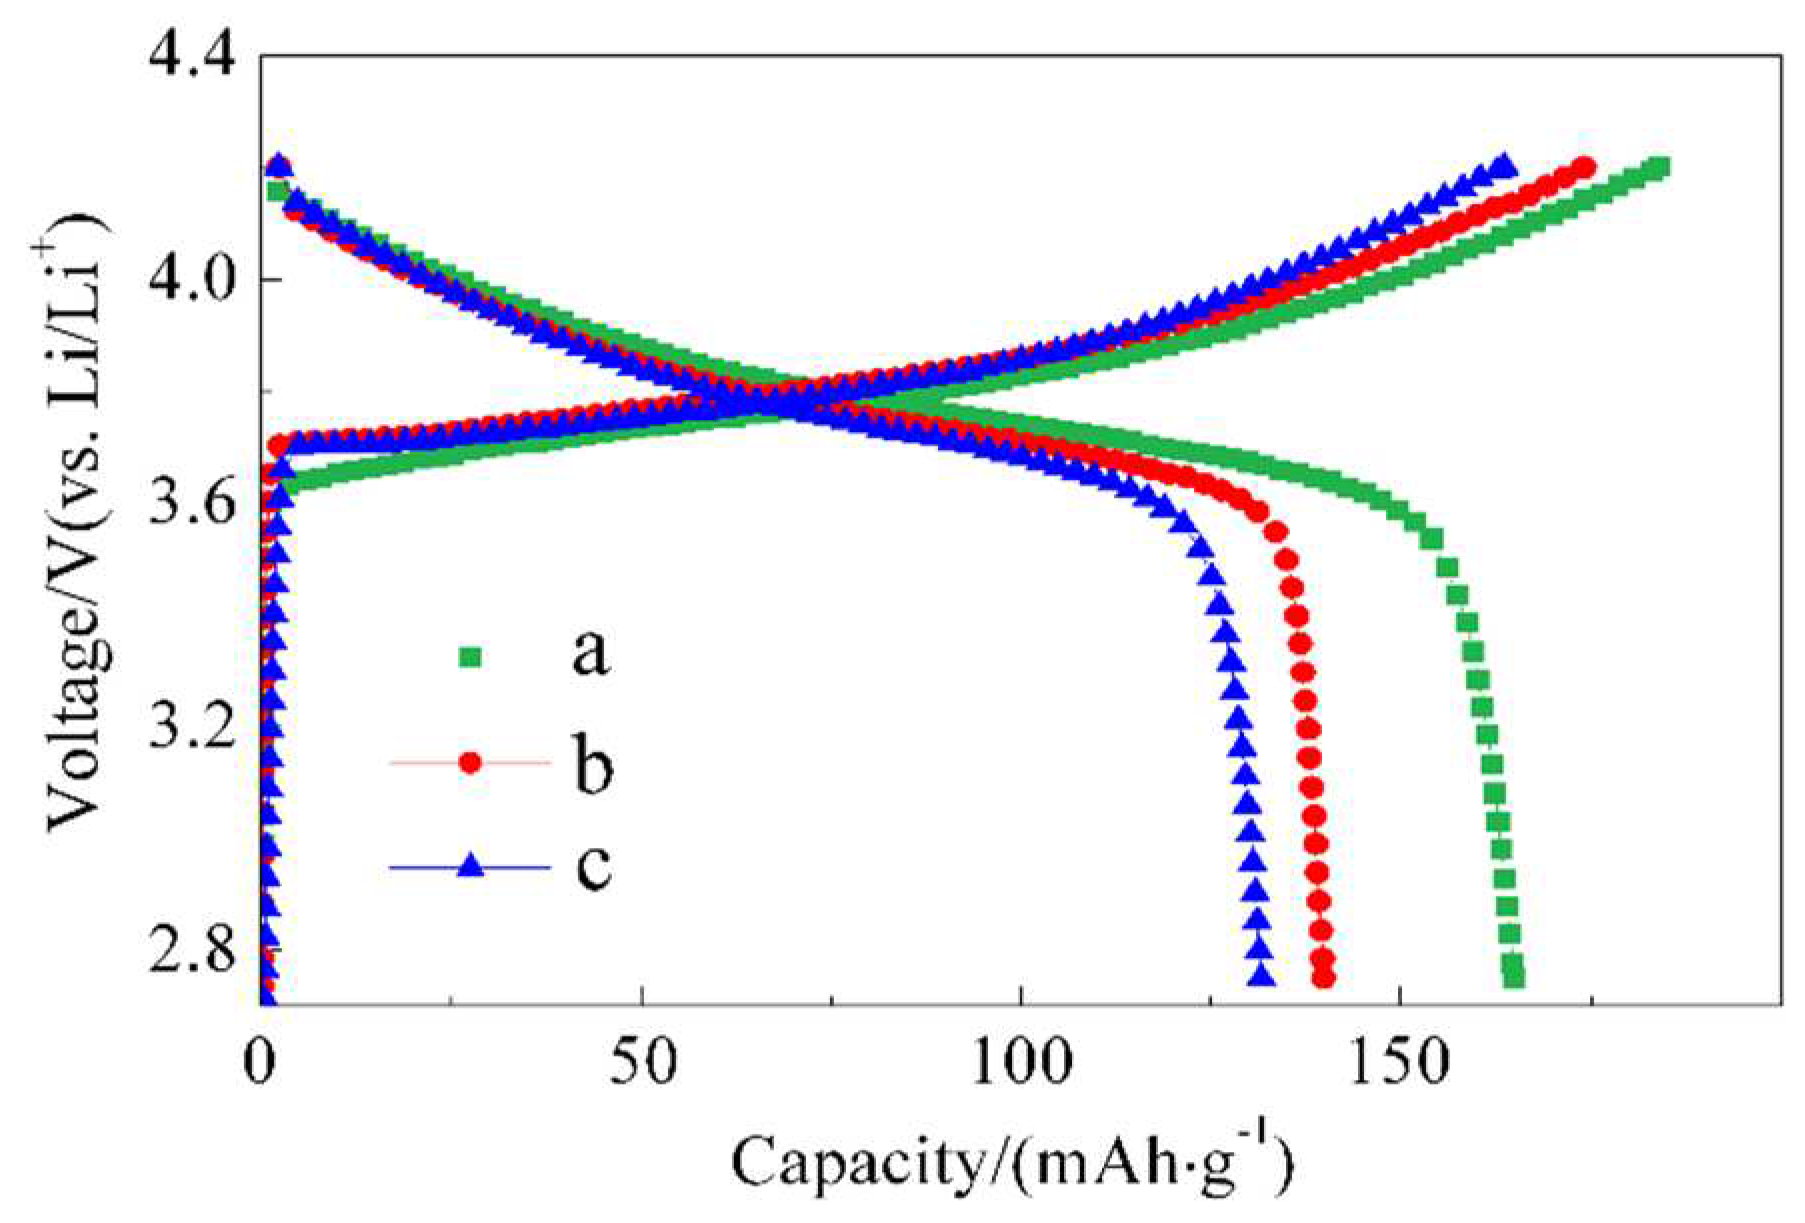
Figure 3.
Cycling performance curves.
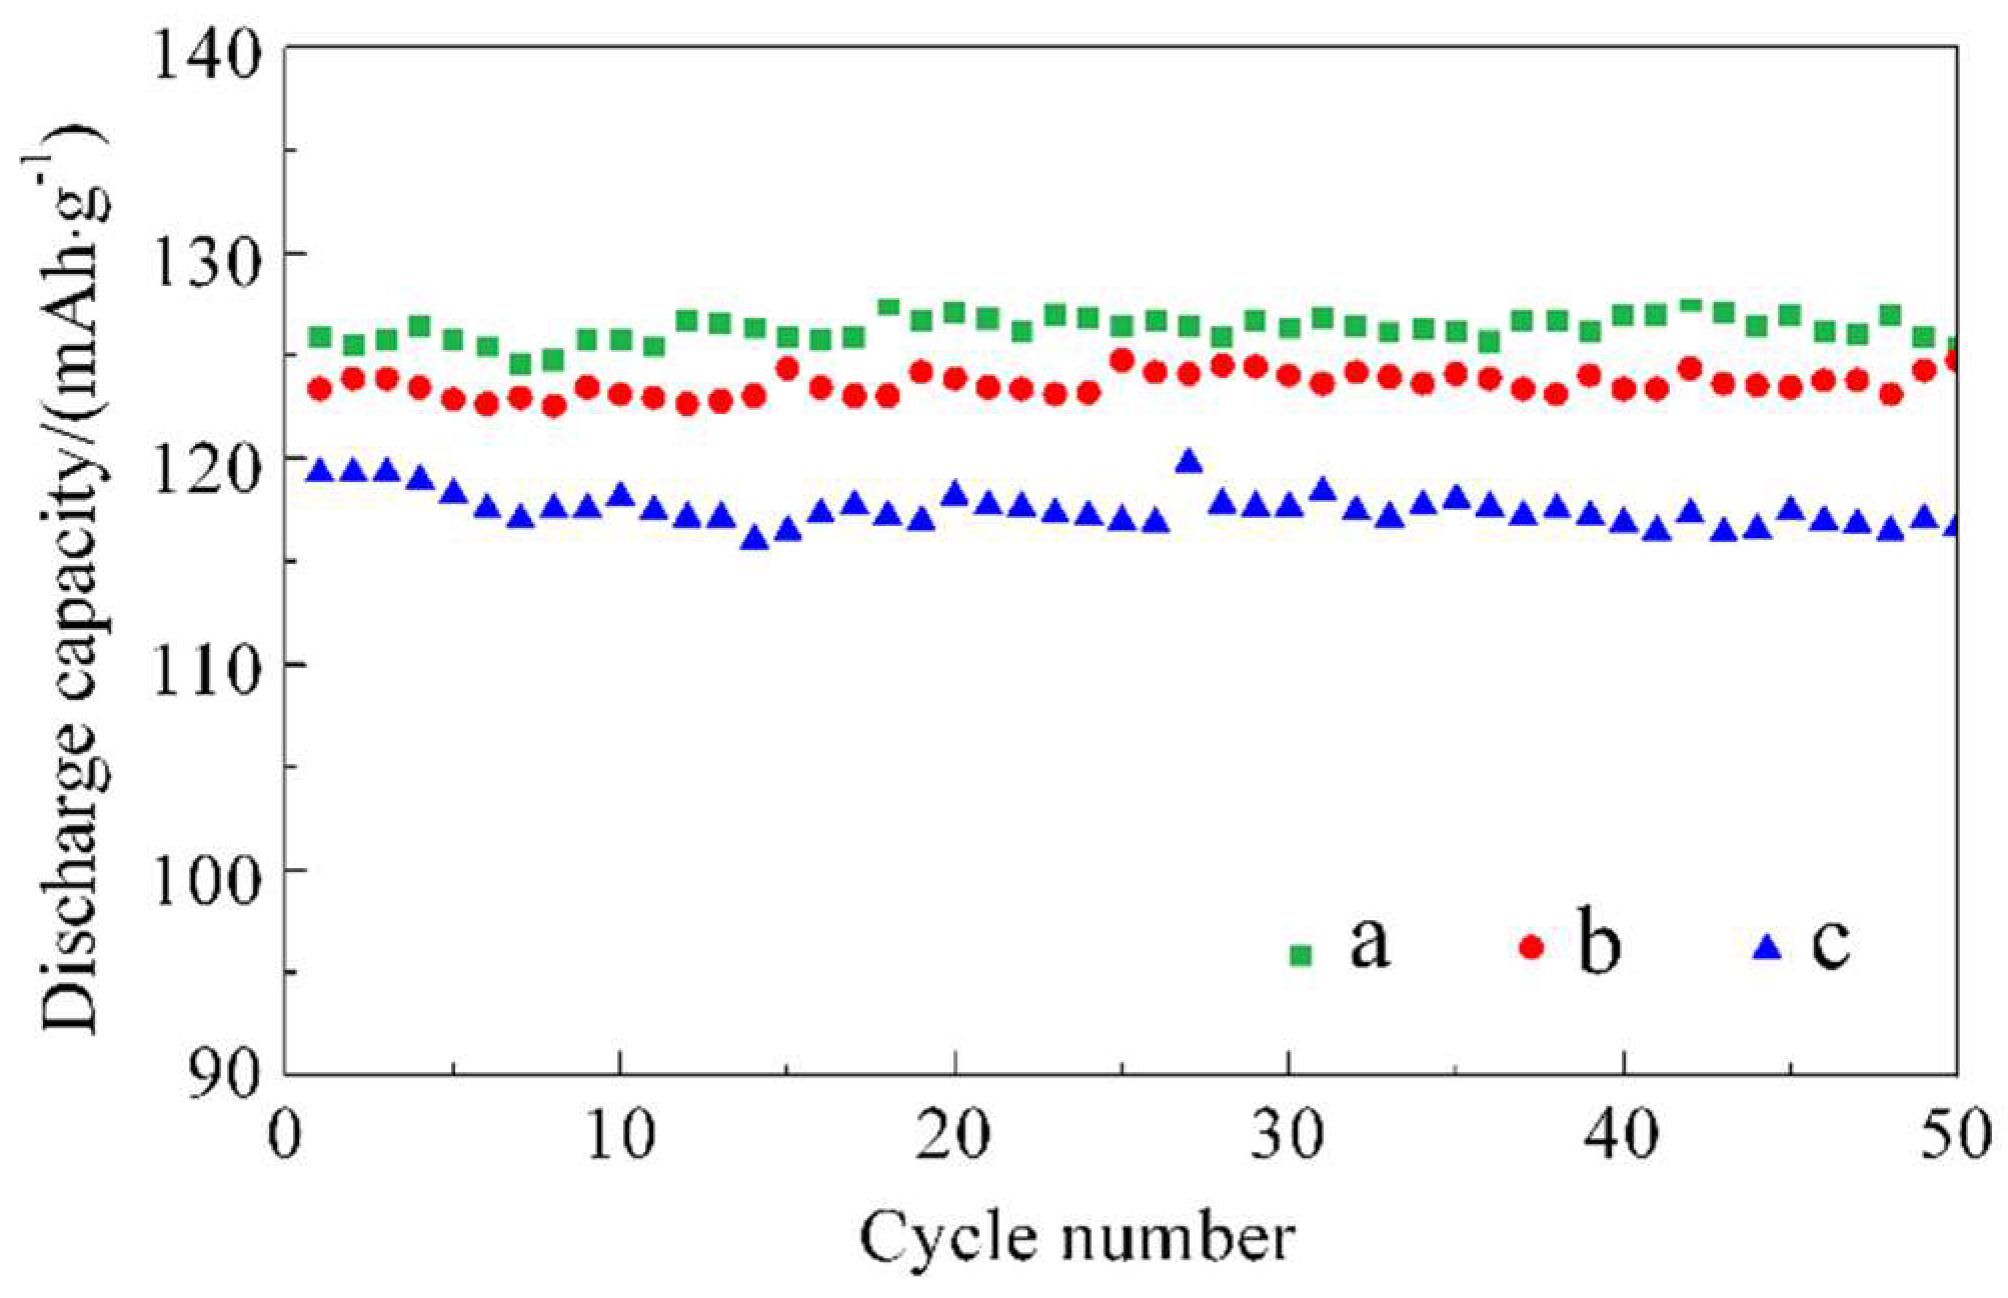
Figure 4.
The first charge-discharge curves of a, b and c.samples tested at 55 oC/0.1 C
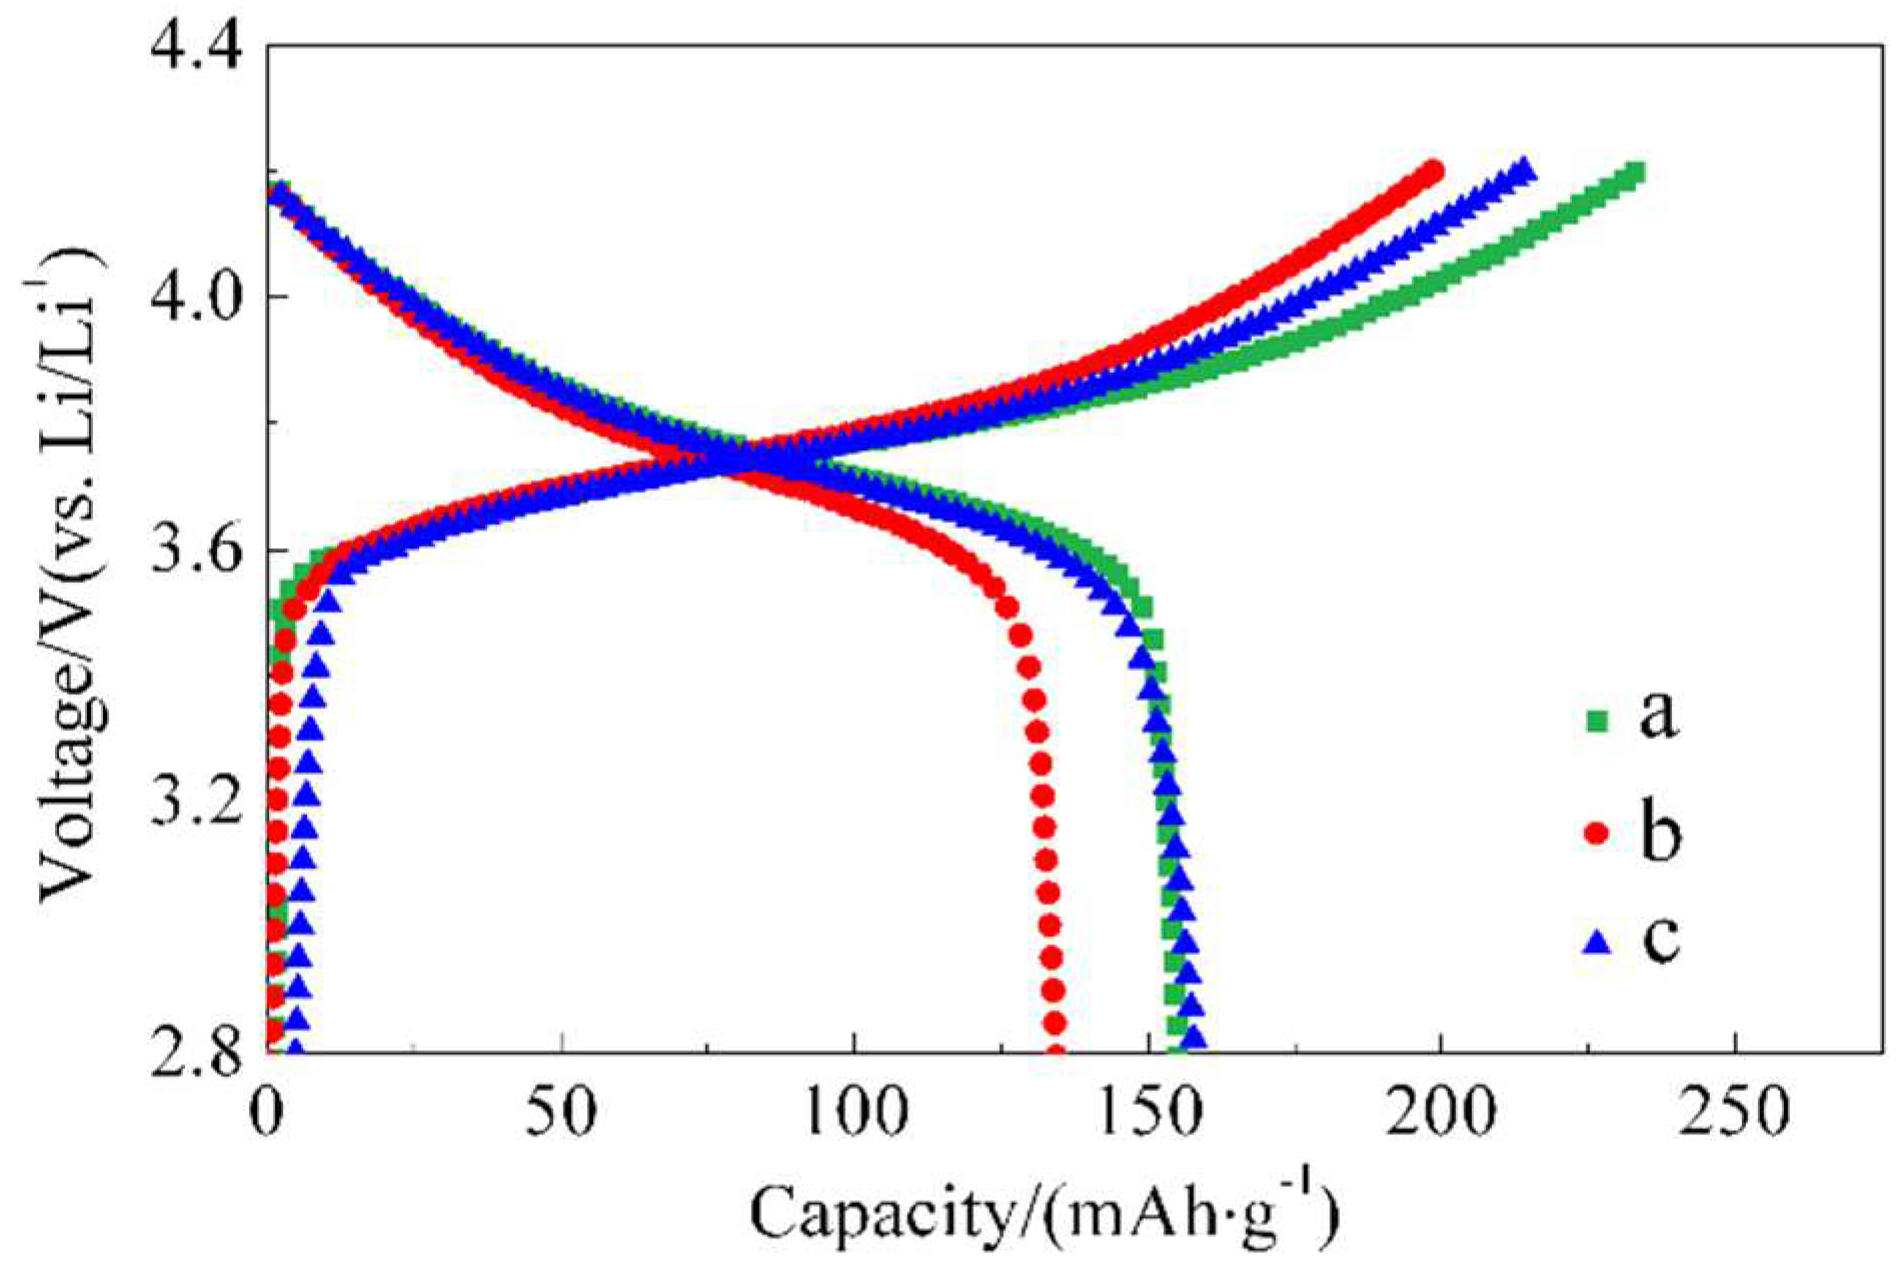
Figure 5.
Differential capacity curves of of a, b and c.
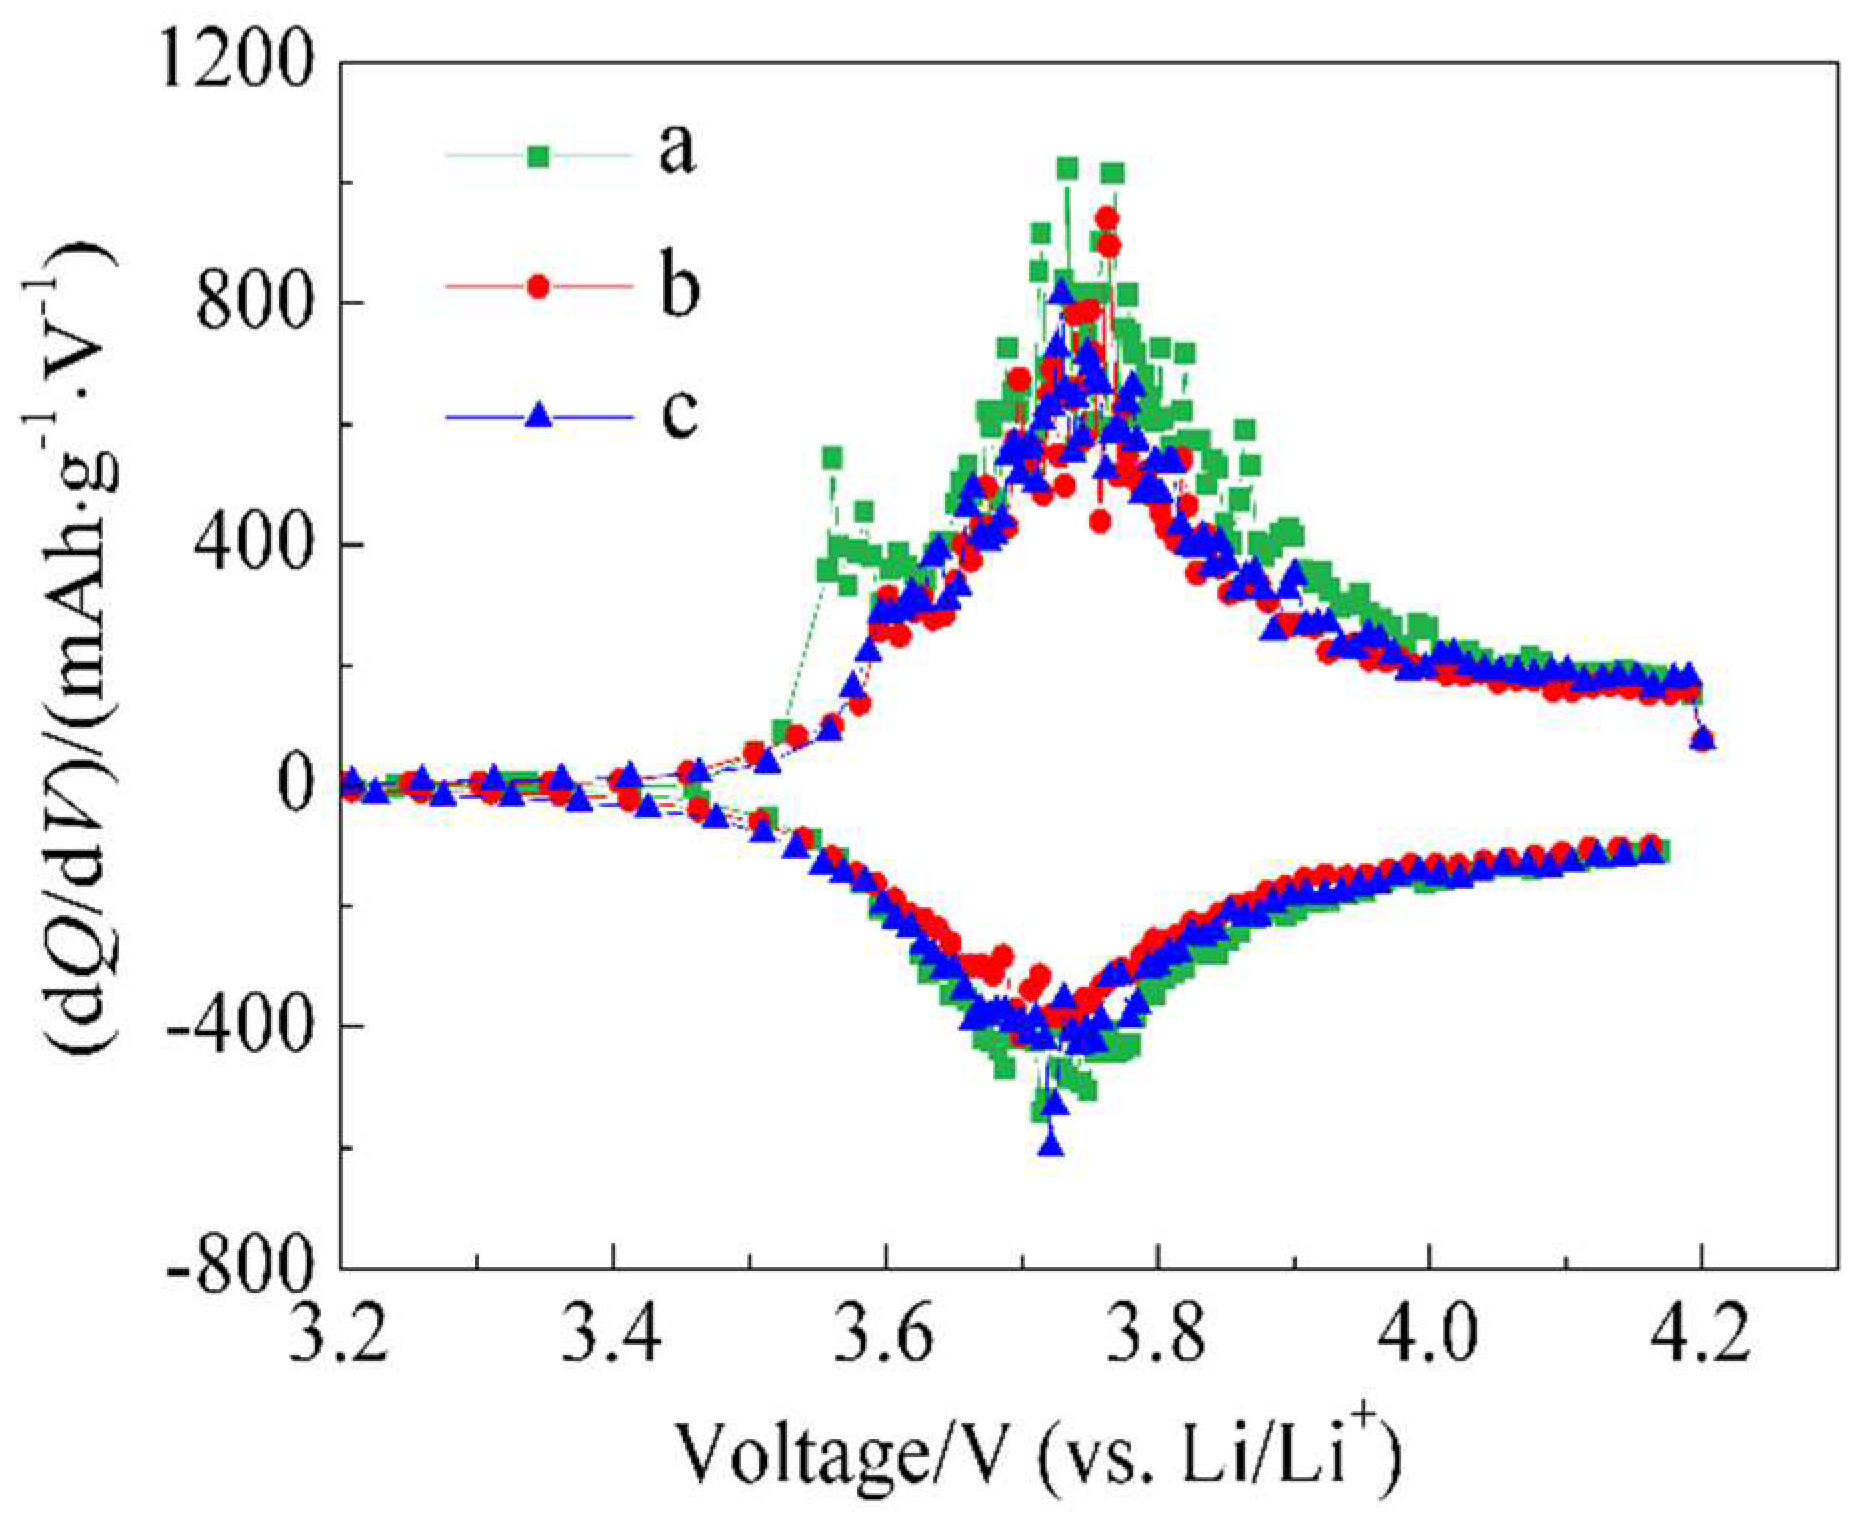
Figure 6.
The cycling performances of a, b and c samples. tested at 55 oC/0.5C
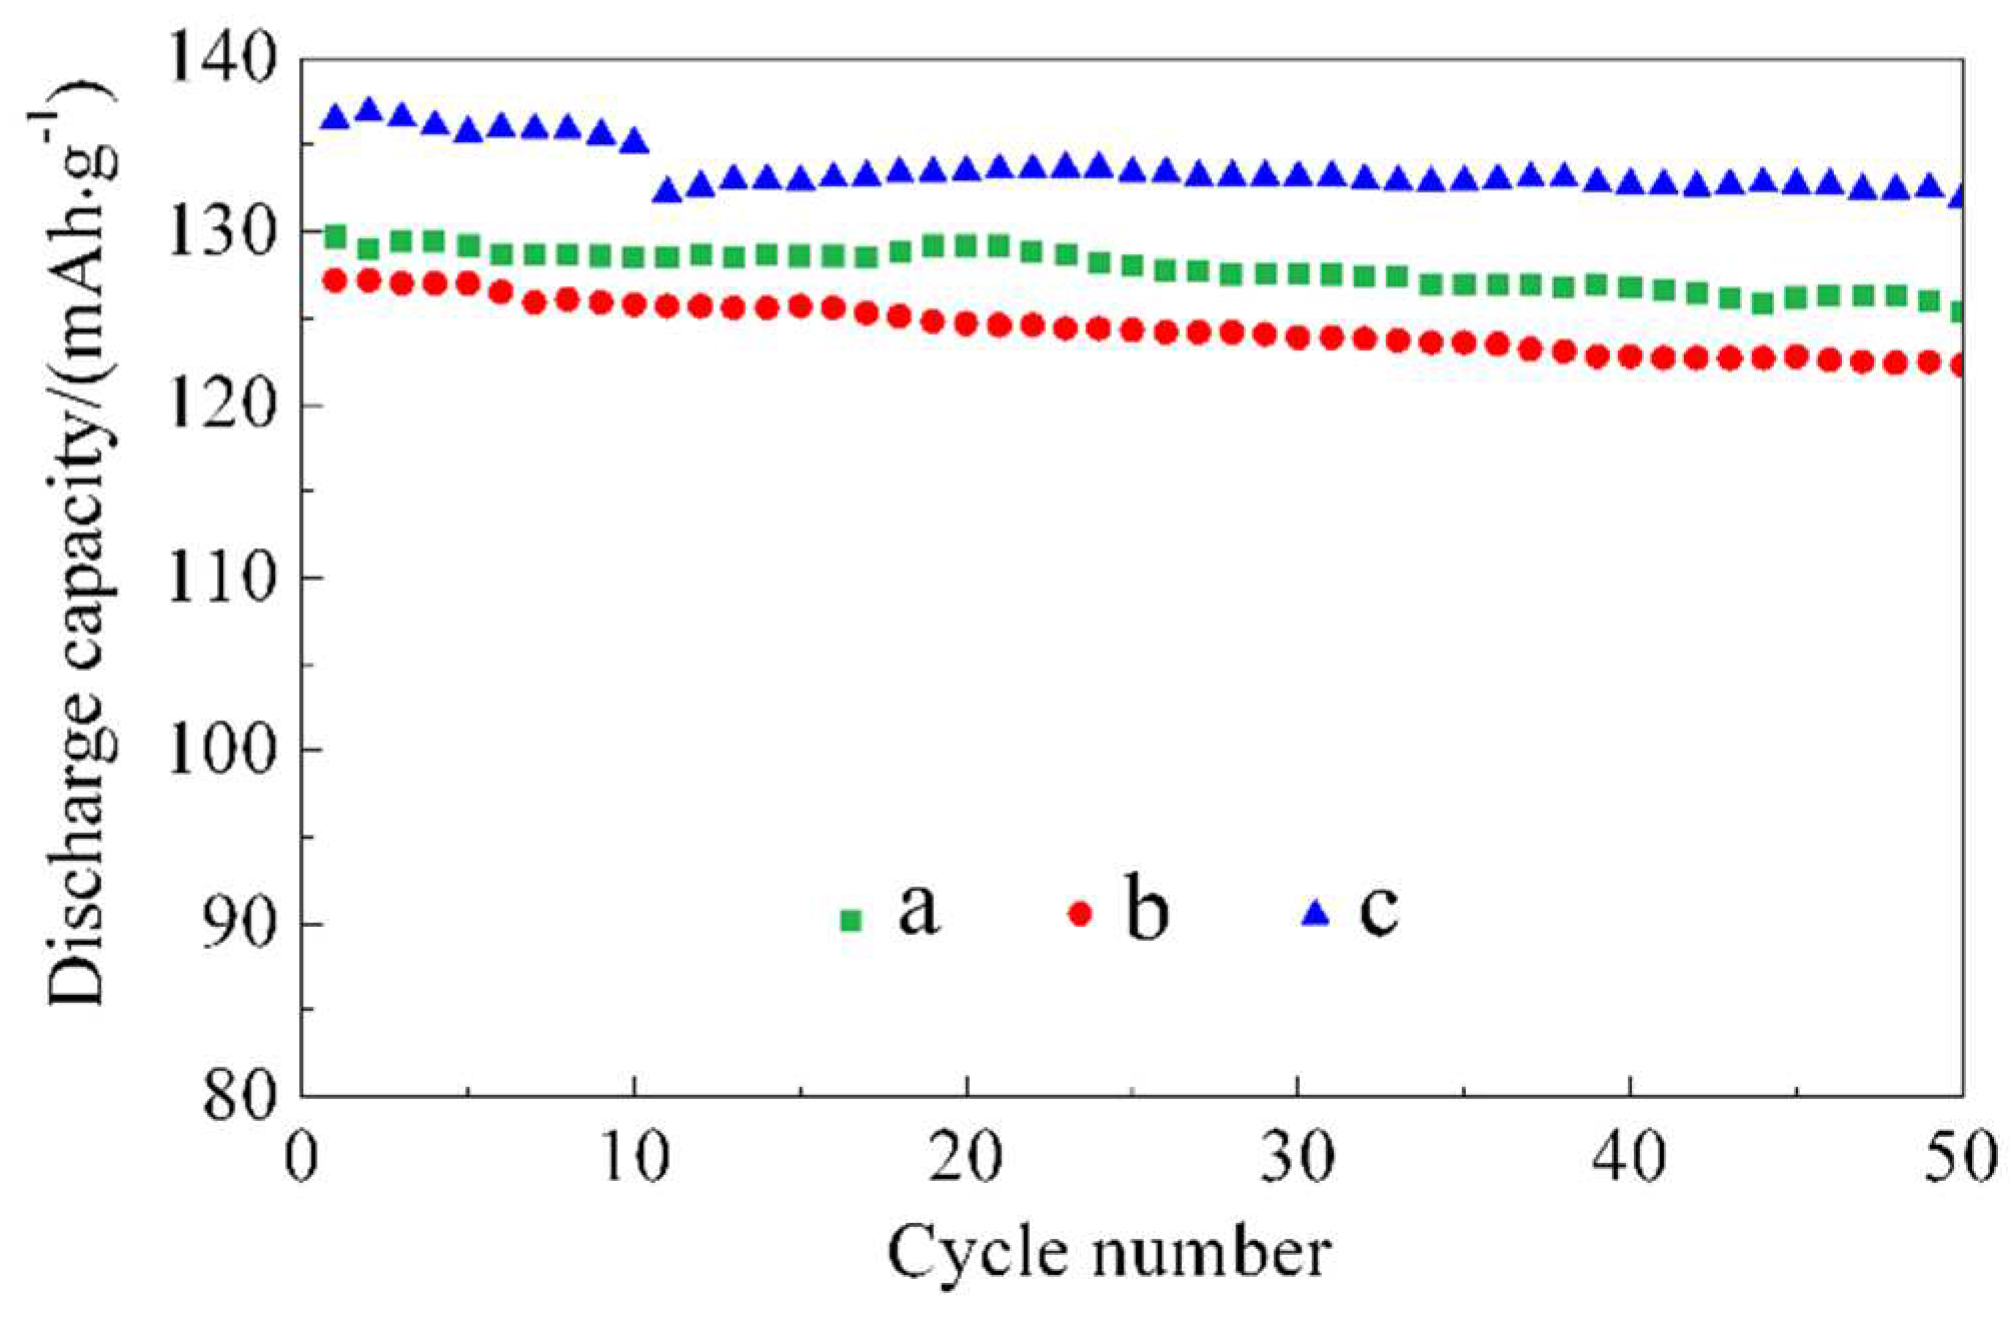

Table 1.
The contents of zinc obtained from ICP (%, by mass).
| ratio | Zn/% | ZnO/% |
|---|---|---|
| a | 0 | 0 |
| b | 0.81 | 1.01 |
| c | 1.60 | 2.00 |
Table 2.
Binding energy (eV) and data of peak fitting from XPS[13].
Table 2.
Binding energy (eV) and data of peak fitting from XPS[13].
| raito | Ni 2p | Co 2p | ||
|---|---|---|---|---|
| Peak1 | Peak2 | Peak1 | Peak2 | |
| a | 855.5 | - | 780.5 | - |
| b | 855.2 | 857.5 | 780.4 | 782.4 |
| c | 855.0 | 856.7 | 780.2 | 781.9 |
| Ref | 854.5 | 857.4 | 779.9 | - |
| raito | Mn 2p | Zn 2p | ||
| Peak1 | Peak2 | Peak1 | Peak2 | |
| a | 642.5 | - | - | - |
| b | 642.5 | 644.2 | 1022.1 | 1045.4 |
| c | 641.0 | 642.7 | 1022.1 | 1045.4 |
| Ref | 641.9 | - | 1022.5 | 1045.5 |
Table 3.
Molar ratios of the samples a, b and c.
| raito | Zn/Co | Ni/Co | Mn/Co |
|---|---|---|---|
| a | - | 1.22 | 1.33 |
| b | 1.96 | 1.81 | 2.00 |
| c | 4.35 | 2.52 | 2.31 |
Disclaimer/Publisher’s Note: The statements, opinions and data contained in all publications are solely those of the individual author(s) and contributor(s) and not of MDPI and/or the editor(s). MDPI and/or the editor(s) disclaim responsibility for any injury to people or property resulting from any ideas, methods, instructions or products referred to in the content. |
© 2023 by the authors. Licensee MDPI, Basel, Switzerland. This article is an open access article distributed under the terms and conditions of the Creative Commons Attribution (CC BY) license (http://creativecommons.org/licenses/by/4.0/).
Copyright: This open access article is published under a Creative Commons CC BY 4.0 license, which permit the free download, distribution, and reuse, provided that the author and preprint are cited in any reuse.


