Submitted:
06 December 2023
Posted:
06 December 2023
You are already at the latest version
Abstract
Hypoeutectic Al-Si-Cu-Mg alloys are promising candidates for use in automobile parts. Therefore, various attempts have been made to develop alternative casting technologies to improve the mechanical properties of cast alloys. In this study, the effects of modification with different levels of strontium (Sr) on primary and eutectic silicon (Si) in hypoeutectic Al-Si-Cu-Mg alloys were investigated. Using a gravity cast process, the Sr-modified samples were prepared from melts with four levels (100, 200, 300, and 400 ppm) of Sr. In addition, the wear properties of the cast samples were studied using a block-on-ring wear-testing machine. The sizes of the primary Si phases increased with increasing Sr content in the alloys. Moreover, more finely dispersed eutectic Si was observed with higher Sr content. In frictional wear tests, the specific wear rates of the test specimens decreased as the Sr content increased from 200 to 400 ppm. Coarse Si phases are considered to act as solid lubricants in the contact region during sliding.
Keywords:
aluminum alloy
; wear
; hypoeutectic
; strontium
; Al-Si
; modification
1. Introduction
Increasing emissions of greenhouse gases, particularly carbon dioxide (CO2), have exacerbated global warming, with advanced countries tightening their gas emission regulations. In the automotive and transportation industry, which constitutes a significant portion of CO2 emissions, efforts toward lightweighting of vehicles have become a trend for improving fuel efficiency. Therefore, light-weighting of vehicles presents an opportunity for cutting greenhouse gas emissions. Aluminum (Al) alloys are lightweight materials that satisfy the safety and performance requirements for vehicles [1]. Consequently, there is a growing trend to replace heavy steels with Al alloys in automotive components. In particular, the hypereutectic Al-Si alloy family, known for its high strength, good castability, and low density, is widely used in the automotive industry.
Al alloys are classified in detail based on additive elements and casting/processing methods. Among them, hypereutectic Al-Si alloys, characterized by silicon (Si) additives, exhibit better wear resistance, favorable thermal expansion characteristics, and good castability. The Al-Si-Cu-Mg alloy used in this study was a commercial hypereutectic Al-Si16-Cu4-Mg0.6 alloy (JIS, Japanese Industrial Standards, ADC14). This alloy has also found extensive applications in various automotive parts, such as linerless engine blocks, pistons, pumps, and compressors. Consequently, the global usage of cast Al-Si-Cu-Mg alloys for automotive components is increasing. In the hypereutectic Al-Si alloy, a distinctive feature is the precipitation of primary silicon (Si) clusters within the microstructure during solidification. The microstructure of cast Al-Si-Cu-Mg alloy mainly comprises coarse α-Al, primary Si, and needle-shaped eutectic phases, which significantly influence the mechanical properties of the alloy [2].
The Al-Si-Cu-Mg alloys, especially when compared to Al-Si-Cu alloys, have demonstrated good wear resistance. However, their mechanical properties are significantly influenced by the size and morphology of the precipitated Si [3,4,5], making microstructural control a significant challenge. Various methods such as heat treatment, additives, and optimisation of casting techniques have been used as the primary means to control the Si phases in the microstructure.
Strontium (Sr) has been used as a modifier in the Al-Si alloy family because it is easy to add to the alloy melt and offers a semipermanent modifying effect on the microstructure of the alloy [6]. For example, Sr has been reported to alter the morphology of the eutectic Si phase from coarse plates to fine fbrous-like networks [7]. The cause of this modification behaviour has also been explained by various researchers [8,9].
However, research on microstructural control in hypereutectic Al-Si-Cu-Mg alloys has predominantly focused on verifying their mechanical properties, particularly their tensile strength and ductility, with relatively few studies considering both microstructural control and wear characteristics. Therefore, the effects of different levels of Sr on the as-cast microstructures, in a hypereutectic Al-Si-Cu-Mg alloy with different Sr contents (100, 200, 300, and 400 ppm), were studied to gain further understanding in this work. The microstructural evolution of the primary and eutectic Si was analyzed using optical microscopy (OM), scanning electron microscopy (SEM), and energy-dispersive X-ray spectroscopy (EDS).
2. Materials and Methods
The samples were prepared by gas (GC) process, as shown in Figure 1. Figure 1a shows a schematic of a conventional GC arrangement consisting of a metal mould, an electric furnace, and a crucible. The Al-Si-Cu-Mg ingot was placed and melted in a crucible at approximately 910 K for 1 h in an electric furnace. The molten alloy was then solidified in a wide rectangular mould. The chemical compositions of–the Al–Si Cu–Mg samples used in this study are listed in Table 1. ADC14, also known as high-silicon aluminum alloy, is characterized by wear resistance due to Si and excellent strength due to copper (Cu) and magnesium (Mg). The structure consists of primary Si, Al dendrites (α phase), and Al-Si eutectic phases. The Al-Si system has a eutectic point at 12.6% mass of Si. Above this point, it becomes a hypereutectic Al-Si alloy, and below it, a hypoeutectic Al-Si alloy. Consequently, the casting structures significantly differ between the two. In hypereutectic Al-Si alloys, Si that cannot be dissolved in the matrix beyond the solid solubility limit precipitates as primary crystals, and then eutectic phases precipitate, completing solidification at approximately 850 K. On the other hand, in hypoeutectic Al-Si alloys, dendritic aluminum (α phase) precipitates as primary crystals.
After the GC process, Al-Si-Cu-Mg rods with a diameter of 10 mm were cut for use as cylindrical blocks in the frictional wear tests. The sampling locations of the test blocks used in the wear test are illustrated in Figure 1b. Furthermore, high-speed steel (HSS) was used as the ring and counter material in the wear-testing system, as shown in Figure 1b, exhibiting the specifications of the rod used for fixing the blocks and adding a normal load of 7.3 N to the blocks. The rotation speed of the disk for the wear test was 100 rpm, which indicates the sliding speed of 0.79 m/s. The surfaces of the test blocks for the wear tests were first metallographically polished using up to a 4000 grit-sized silicon carbide paper and were subsequently buff-polished using an Al2O3 powder with an average diameter of 0.3 μm. Furthermore, before and after each wear test, the test blocks made of Al-Si-Cu-Mg were cleaned with acetone and dried in air at room temperature for 21.6 ks in order to avoid contamination. The weight of each test block before (W1) and after (W2) the wear test was measured using a precise electric balance. Moreover, high speed steel (HSS) was used as a disk and a counter material in this wear-testing system, as shown in Figure 1 (b). Figure 1 (c) exhibits specification of the rod used for fixing the blocks and adding the normal load of 7.3 N to the blocks.
In this study, the heating time and temperature of the molten metal were maintained constant, and the GC casting samples were produced by changing only the Sr content. First, an Al-Si-Cu-Mg ingot was charged in an alumina crucible. The ingot was then melted in atmospheric atmosphere by heating in an electric furnace. After a holding time of 1 h and stabilisation of the temperature of the molten metal, the Sr additive was added and stirred. Subsequently, approximately 0.3% of the commercial flux was injected based on the weight of the molten metal to remove the oxide for a holding time of 10 min. The molten metal was then poured into a steel mold with a thickness of 10 mm, as shown in Figure 1b. Finally, the sample was cooled to room temperature (approximately 290 K) and collected for GC sample. The GC samples were prepared from melts with four levels (100, 200, 300, and 400 ppm) of Sr in this study.
Moreover, based on the experimental observations of the microstructures, the particle diameters of the primary and eutectic Si phases were determined using ImageJ software (v1.53, National Institutes of Health, MD, USA). Figure 2 illustrates how the OM images were processed using ImageJ software. ImageJ is an image-processing software developed by the National Institutes of Health (USA). This software can be used to analyse geometric characteristics, such as length, area, major axis, minor axis, perimeter, and Feret’s diameter [10]. In Figure 2b, the primary Si phases in the OM image were converted into binary images using the Make Binary tool. The geometric characteristics were obtained from the outlined image shown in Figure 2c using the Analyse Particles function in the Analyse toolbar.
3. Results and Discussion
Figure 3 shows the optical micrographs of the microstructures of the samples produced by GC. The microstructure of an as-cast sample basically consists of primary Si, embedded between primary α-Al grains, as shown in Figure 3a. Furthermore, the microstructures of the Sr-modified Al-Si-Cu-Mg alloys with 100–400 ppm Sr were also observed (Figure 3b–e). It is clearly observed that the sizes of the primary Si phases increase with increasing Sr content in the Al-Si-Cu-Mg alloy.
Phosphorus (P) normally exists as an impurity in commercial Al-Si foundry alloys. It reacts with Al in the liquid and produces a fine dispersion of aluminium phosphide (AlP) particles that act as potent nuclei for both primary and eutectic Si [11,12]. The refinement mechanism of primary Si can be explained by the hetero-nucleation theory. As shown in Figure 4, this theory suggests that primary Si grows not as a Si nucleus but as an AlP nucleus since the lattice constants and the crystal structure (diamond-like cubic crystal) of AlP are similar to those of primary Si. Therefore, due to the increased number of apparent crystal nuclei, the number of grown primary Si crystals increases, leading to refinement of primary Si.
However, the ability of the AlP particles to nucleate the Si phase is reduced by the competitive formation of Al2Si2Sr, which nucleates on AlP [13]. The nucleation of AlP, which was used as a refinement agent, was consequently suppressed by the addition of a high Sr content in this study. Therefore, it is considered that the primary Si phase becomes coarse because of the suppressed refinement effect of P by Sr.
Figure 5 shows the results of the geometric analyses of the primary Si phases obtained using Image J software. The primary Si phases in Al-Si-Cu-Mg alloys are irregular in shape; therefore, performing a morphological analysis of these phases is challenging. In this case, the Feret diameter or equivalent circular diameter (ECD) is generally used to evaluate the sizes of the phase particles. First, the Feret diameter of a particle refers to the longest dimension of a particle independent of its orientation and is defined as the distance between two parallel planes [14]. These two parallel planes must restrict the grains between them and must be perpendicular to a specified direction [15]. Secondly, the ECD of a particle represents the diameter of a sphere that occupies the same two-dimensional surface area as the particle [16]. In this study, the average particle diameter of the primary Si was measured using the ECD method from the ImageJ results.
As shown in Figure 5a and b, there was no sharp difference in either the grain size or the area ratio of primary Si as the Sr content increased from 100 ppm to 200 ppm. The grain size increased dramatically as the Sr content increased from 200 to 400 ppm (Figure 5a). However, the average area ratio of the primary Si phases increased with increasing Sr content, as shown in Figure 3b. It should be noted that the area ratio of phases in optical micrographs can be considered as the Vf of phases in the samples. Consequently, the primary Si phases at a Sr level of 400 ppm show the largest mean grain size and Vf.
Optical micrographs of the microstructures of the samples focusing on eutectic Si are shown in Figure 6. Coarse acicular Si structures are observed in the as-cast samples (Figure 6a). Moreover, more finely dispersed eutectic Si was observed with higher Sr content. The well-modified structures of the fine fibrous eutectic Si are shown in Figure 6e.
Figure 7 shows the results of the geometric analyses of the eutectic Si phases. Both the grain size and aspect ratio decreased with increasing Sr content, as shown in Figure 7a and b. It was clearly observed that refined spherical eutectic Si phases were formed with a high level of Sr addition, as shown in Figure 6e. This structure is typical of that required to obtain good mechanical properties, as the hard acicular Si phases (Figure 6a) can act as crack nucleation sites. Therefore, the addition of Sr improves the mechanical properties of the Al-Si-Cu-Mg alloy in terms of the morphology of the eutectic Si phases.
The specific wear rates (Ws) of the blocks made of the Al-Si-Cu-Mg GC samples after the wear tests are shown in Figure 8. The weight loss during the wear test (Wloss) was obtained from the following equation:
Wloss can be converted into the volume loss (Vloss) in mm3 using the following equation:
Dalloy is the weight per unit volume for the density of Al-Si-Cu-Mg block (approximately 2.73 g/cm3) obtained by calculations based on molecular weights. Then, the specific wear rate (Ws) was calculated using the following equation:
where Fn is the normal load applied in N and L is the sliding distance in m.
Wloss = W2 − W1,
It is clearly observed that Ws of the test blocks linearly decreases with Sr content from 200 to 400 ppm. The microstructures of hypereutectic Al-Si-Cu-Mg samples basically consist of primary Si, embedded between primary α-Al grains, and eutectic Si, as shown in Figure 3,5 above. In particular, the microstructures of the samples with more than 200 ppm of Sr consisted of large primary Si with more finely dispersed eutectic Si, as shown in Figure 4,6. This finely dispersed eutectic Si in hypereutectic Al-Si alloys is typically required to obtain the best mechanical properties [3]. These hard and dispersed phases can improve surface hardness, which is one of the most important parameters determining abrasion resistance in abrasive wear [17].
A large amount of blocky debris, oxide debris, and crushed debris was also observed in all the samples after the wear tests, as shown in Figure 9. The blocky debris is roughly round because it is abraded or deformed during sliding. It should be noted that blocky debris is generated by the abrasion of the test block or ring or the fragmentation of large debris [10]. Consequently, it is believed that the predominant wear mechanism in the wear tests performed in this study was abrasive wear. Moreover, the ratio of the oxide debris and fine crushed debris increases with higher Sr content, indicating the transition in the wear mechanism to mild abrasive wear, as shown in Figure 9d,e.
In addition, EDS analysis was performed to analyze the wear debris, as shown in Figure 10. In Figure 10b, strong Al peaks are detected, which indicate that they originate from the test blocks rather than from the ring. The EDS map (Figure 10c) also shows Al element is more highly identified, compared to Si element (Figure 10d).
Figure 11 shows a schematic drawing of the differences during the wear tests between the fine primary Si phases with lower Sr content and coarse primary Si phases with higher Sr content. In Figure 10a, it is considered that fine primary Si phases, with an average diameter of approximately 1 μm, is dispersed in the wear surface of the Al-Si-Cu-Mg test block with lower Vf, as shown in Figure 3,4. Furthermore, it is considered that the large blocky debris was mainly generated from the Al phase rather than from the Si phase, as shown in Figure 10.
However, in Figure 11b, it is considered that coarser primary Si is dispersed on the wear surface with a higher Vf, as shown in Figure 5,6. As mentioned above, the ability of the AlP particles to nucleate the Si phase is reduced by the competitive formation of Al2Si2Sr, which nucleates on AlP. It has reported that Sr tends to eliminate the refining effect of P by introducing not only Al2Si2Sr but also Sr3P2 to the melt, by the following equation:
3Sr + 2P = Sr3P2,
On increasing this addition of modifier to 400 ppm Sr, primary Si refinement disappeared while modification of the eutectic was complete. This elimination of the refining effect of P on primary Si on addition of Sr along with P has been attributed to the formation of a new compound Sr3P2 as a result of decomposition of AlP as a consequence of adding Sr [18].
Moreover, the hardness of a composite alloy is generally improved at the periphery of the dispersed-phase particles in the matrix [19,20]. This was probably because the presence of hard-reinforced particles improved the strain energy and resistance to plastic deformation [21].
The hardness of the Si phase is much higher than that of the Al phase. Therefore, the surface hardness of the test block was improved by the coarse and high Vf values of the primary Si. Consequently, the improvement in hardness also leads to increased material resistance to plastic deformation of the Al-Si-Cu-Mg alloy, which is necessary to avoid severe abrasive wear. In conclusion, because the Si phase can act as a solid lubricant in the contact region during sliding, Ws decreases by increasing both the size and Vf of the Si-phase particles in the matrix of the alloy.
4. Conclusions
In this study, the effects of Sr on the microstructures and wear properties of Sr-modified hypereutectic Al-Si-Cu-Mg alloys were investigated. The primary findings of this study are as follows:
- It is clearly observed that the sizes of the primary Si phases increase with increasing Sr content in the Al-Si-Cu-Mg alloy.
- P reacts with Al to produce a fine dispersion of AlP particles, which act as potent nuclei for both types of primary Si. However, in this study, the potency of the AlP particles to nucleate the Si phase was reduced owing to the addition of a high Sr content. It is thought that the primary Si phase became coarse because of the suppressed refinement effect of P due to the addition of Sr.
- Moreover, more finely dispersed eutectic Si is observed with increasing Sr content. Consequently, well-modified structures of fine fibrous eutectic Si were observed at high Sr content.
- Ws of the test blocks decreased linearly as the Sr content increased from 200 to 400 ppm. This is because the microstructures of the samples with more than 200 ppm Sr consisted of large primary Si-phase particles. The Si phase can act as a solid lubricant at the contact region during sliding because the existence of hard-reinforced particles improves the strain energy and resistance to plastic deformation.
Author Contributions
Conceptualization, Y.-S.L.; methodology, Y.-S.L.; software, H.K.; validation, Y.-S.L.; formal analysis, Y.-S.L.; investigation, Y.-S.L.; resources, H.K.; data curation, Y.-S.L.; writing—original draft preparation, Y.-S.L.; writing—review and editing, H.K.; visualization, Y.-S.L.; supervision, H.K.; project administration, H.K.; funding acquisition, H.K. All authors have read and agreed to the published version of the manuscript.
Data Availability Statement
All raw data supporting the conclusions of this study were provided by the authors.
Conflicts of Interest
The authors declare no conflict of interest.
References
- Kim, H.-J.; Keoleian, G.A.; Skerlos, S.J. Economic assessment of greenhouse gas emissions reduction by vehicle lightweighting using aluminum and high-strength steel. J. Ind. Ecol. 2011, 15, 64–80. [Google Scholar] [CrossRef]
- Closset, B.; Gruzleski, J.E. Structure and Properties of Hypoeutectic Al-Si-Mg Alloys Modified with Pure Strontium. J. Ind. Ecol. 2011, 15, 64–80. [Google Scholar] [CrossRef]
- Okayasu, M.; Takeuchi, S.; Shiraishi, T. Crystallisation characteristics of primary silicon particles in cast hypereutectic Al–Si alloy. Metall. Mater. Trans. A 1982, 13, 945–951. [Google Scholar] [CrossRef]
- Derin, S.; Birol, Y.; Aybarc, U. Effect of strontium addition on microstructure and mechanical properties of AlSi7Mg0.3 alloy. Int. J. Metalcast. 2017; 11, 688. [Google Scholar]
- Sangchan, A.; Plookphol, T.; Wannasin, J.; Wisutmethangoon, S. Effect of strontium on microstructure and mechanical properties of semi-solid A356 Al alloy. Adv. Mater. Res. 2014, 353, 893. [Google Scholar] [CrossRef]
- Wang, D.; Zhang, H.; Han, X.; Shao, B.; Li, L.; Cui, J. The Analysis of Strontium Modification on Microstructure and Mechanical Properties of Al-25%Mg2Si In Situ Composite. J. Mater. Eng. Perform. 2017, 26, 4415. [Google Scholar] [CrossRef]
- Ganesh, M.S.; Reghunath, N.; Levin, M.J.; Prasad, A.; Doondi, S.; Shankar, K.V. Strontium in Al–Si–Mg Alloy: A Review. Met. Mater. Int. 2022; 1–40. [Google Scholar]
- Lu, S.Z.; Hellawell, A. The mechanism of silicon modification in aluminum-silicon alloys: Impurity induced twinning. Metall. Trans. A 1987, 18, 1721–1733. [Google Scholar] [CrossRef]
- Srirangam, P.; Chattopadhyay, S.; Bhattacharya, A.; Nag, S.; Kaduk, J.; Shankar, S.; Banerjee, R.; Shibata, T. Probing the local atomic structure of Sr-modified Al–Si alloys. Acta Mater. 2014, 65, 185–193. [Google Scholar] [CrossRef]
- Lee, Y.-S.; Niinomi, M.; Nakai, M.; Narita, K.; Cho, K. Differences in wear behaviors at sliding contacts for β-type and (α+ β)-type titanium alloys in Ringer’s solution and air. Mater. Trans. 2015, 56, 317–326. [Google Scholar] [CrossRef]
- Li, J.; Hage, F.S.; Liu, X.; Ramasse, Q.; Schumacher, P. Revealing heterogeneous nucleation of primary Si and eutectic Si by AlP in hypereutectic Al-Si alloys. Sci. rep. 2016, 6, 25244. [Google Scholar] [CrossRef] [PubMed]
- Dahle, A.K.; Nogita, K.; McDonald, S.D.; Dinnis, C.; Lu, L. Eutectic modification and microstructure development in Al–Si Alloys. Mater. Sci. Eng. A, 2005, 413, 243–248. [Google Scholar] [CrossRef]
- Zhou, B.; Laschet, G.; Eiken, J.; Behnken, H.; Apel, M. Multiscale solidification simulation of Sr-modified Al-Si-Mg alloy in die casting. In IOP Conference Series: Materials Science and Engineering. 2020, 861, 012034. [Google Scholar] [CrossRef]
- Lee, Y.-S.; Niinomi, M.; Nakai, M.; Narita, K.; Cho, K.; Liu, H. Wear transition of solid-solution-strengthened Ti–29Nb–13Ta–4.6 Zr alloys by interstitial oxygen for biomedical applications. J. Mech. Behav. Biomed. Mater. 2015, 51, 398–408. [Google Scholar] [CrossRef]
- Geng, F.; Niinomi, M.; Nakai, M. Observation of yielding and strain hardening in a titanium alloy having high oxygen content. Mater. Sci Eng. A, 2011, 528, 5435–5445. [Google Scholar] [CrossRef]
- Switek, W. Early stage crack propagation in fretting fatigue. Mech. Mater. 1984, 3, 257–267. [Google Scholar] [CrossRef]
- Hokkirigawa, K.; Kato, K. An experimental and theoretical investigation of ploughing, cutting and wedge formation during abrasive wear. Tribo. Int. 1988, 21, 51–57. [Google Scholar] [CrossRef]
- Faraji, M. The Effect of Solidification Variables on the Microstructure of Hypereutectic Al-Si Alloys. Doctoral dissertation, South Yorkshire, England, 20 January.
- Ramesh, C.S.; Keshavamurthy, R.; Channabasappa, B.H.; Ahmed, A. Microstructure and mechanical properties of Ni–P coated Si3N4 reinforced Al6061 composites. Mater. Sci. Eng. A, 2009, 502, 99–106. [Google Scholar] [CrossRef]
- Fjellstedt, C.J. Crystallisation Processing of Al-base Alloys. Doctoral dissertation, The Royal Institute of Technology (KTH), Stockholm, Sweden, June 2001. [Google Scholar]
- Bharath, V.; Auradi, V.; Nagaral, M.; Boppana, S.B.; Ramesh, S.; Palanikumar, K. Microstructural and wear behavior of Al2014-alumina composites with varying alumina content. Transactions of the Indian Institute of Metals, 2022, 1–15. Transactions of the Indian Institute of Metals 2022, 1–15. [Google Scholar]
Figure 1.
Schematic drawings of (a,b) gravity cast (GC) process and (b) block-on-ring frictional wear-testing machine.
Figure 1.
Schematic drawings of (a,b) gravity cast (GC) process and (b) block-on-ring frictional wear-testing machine.
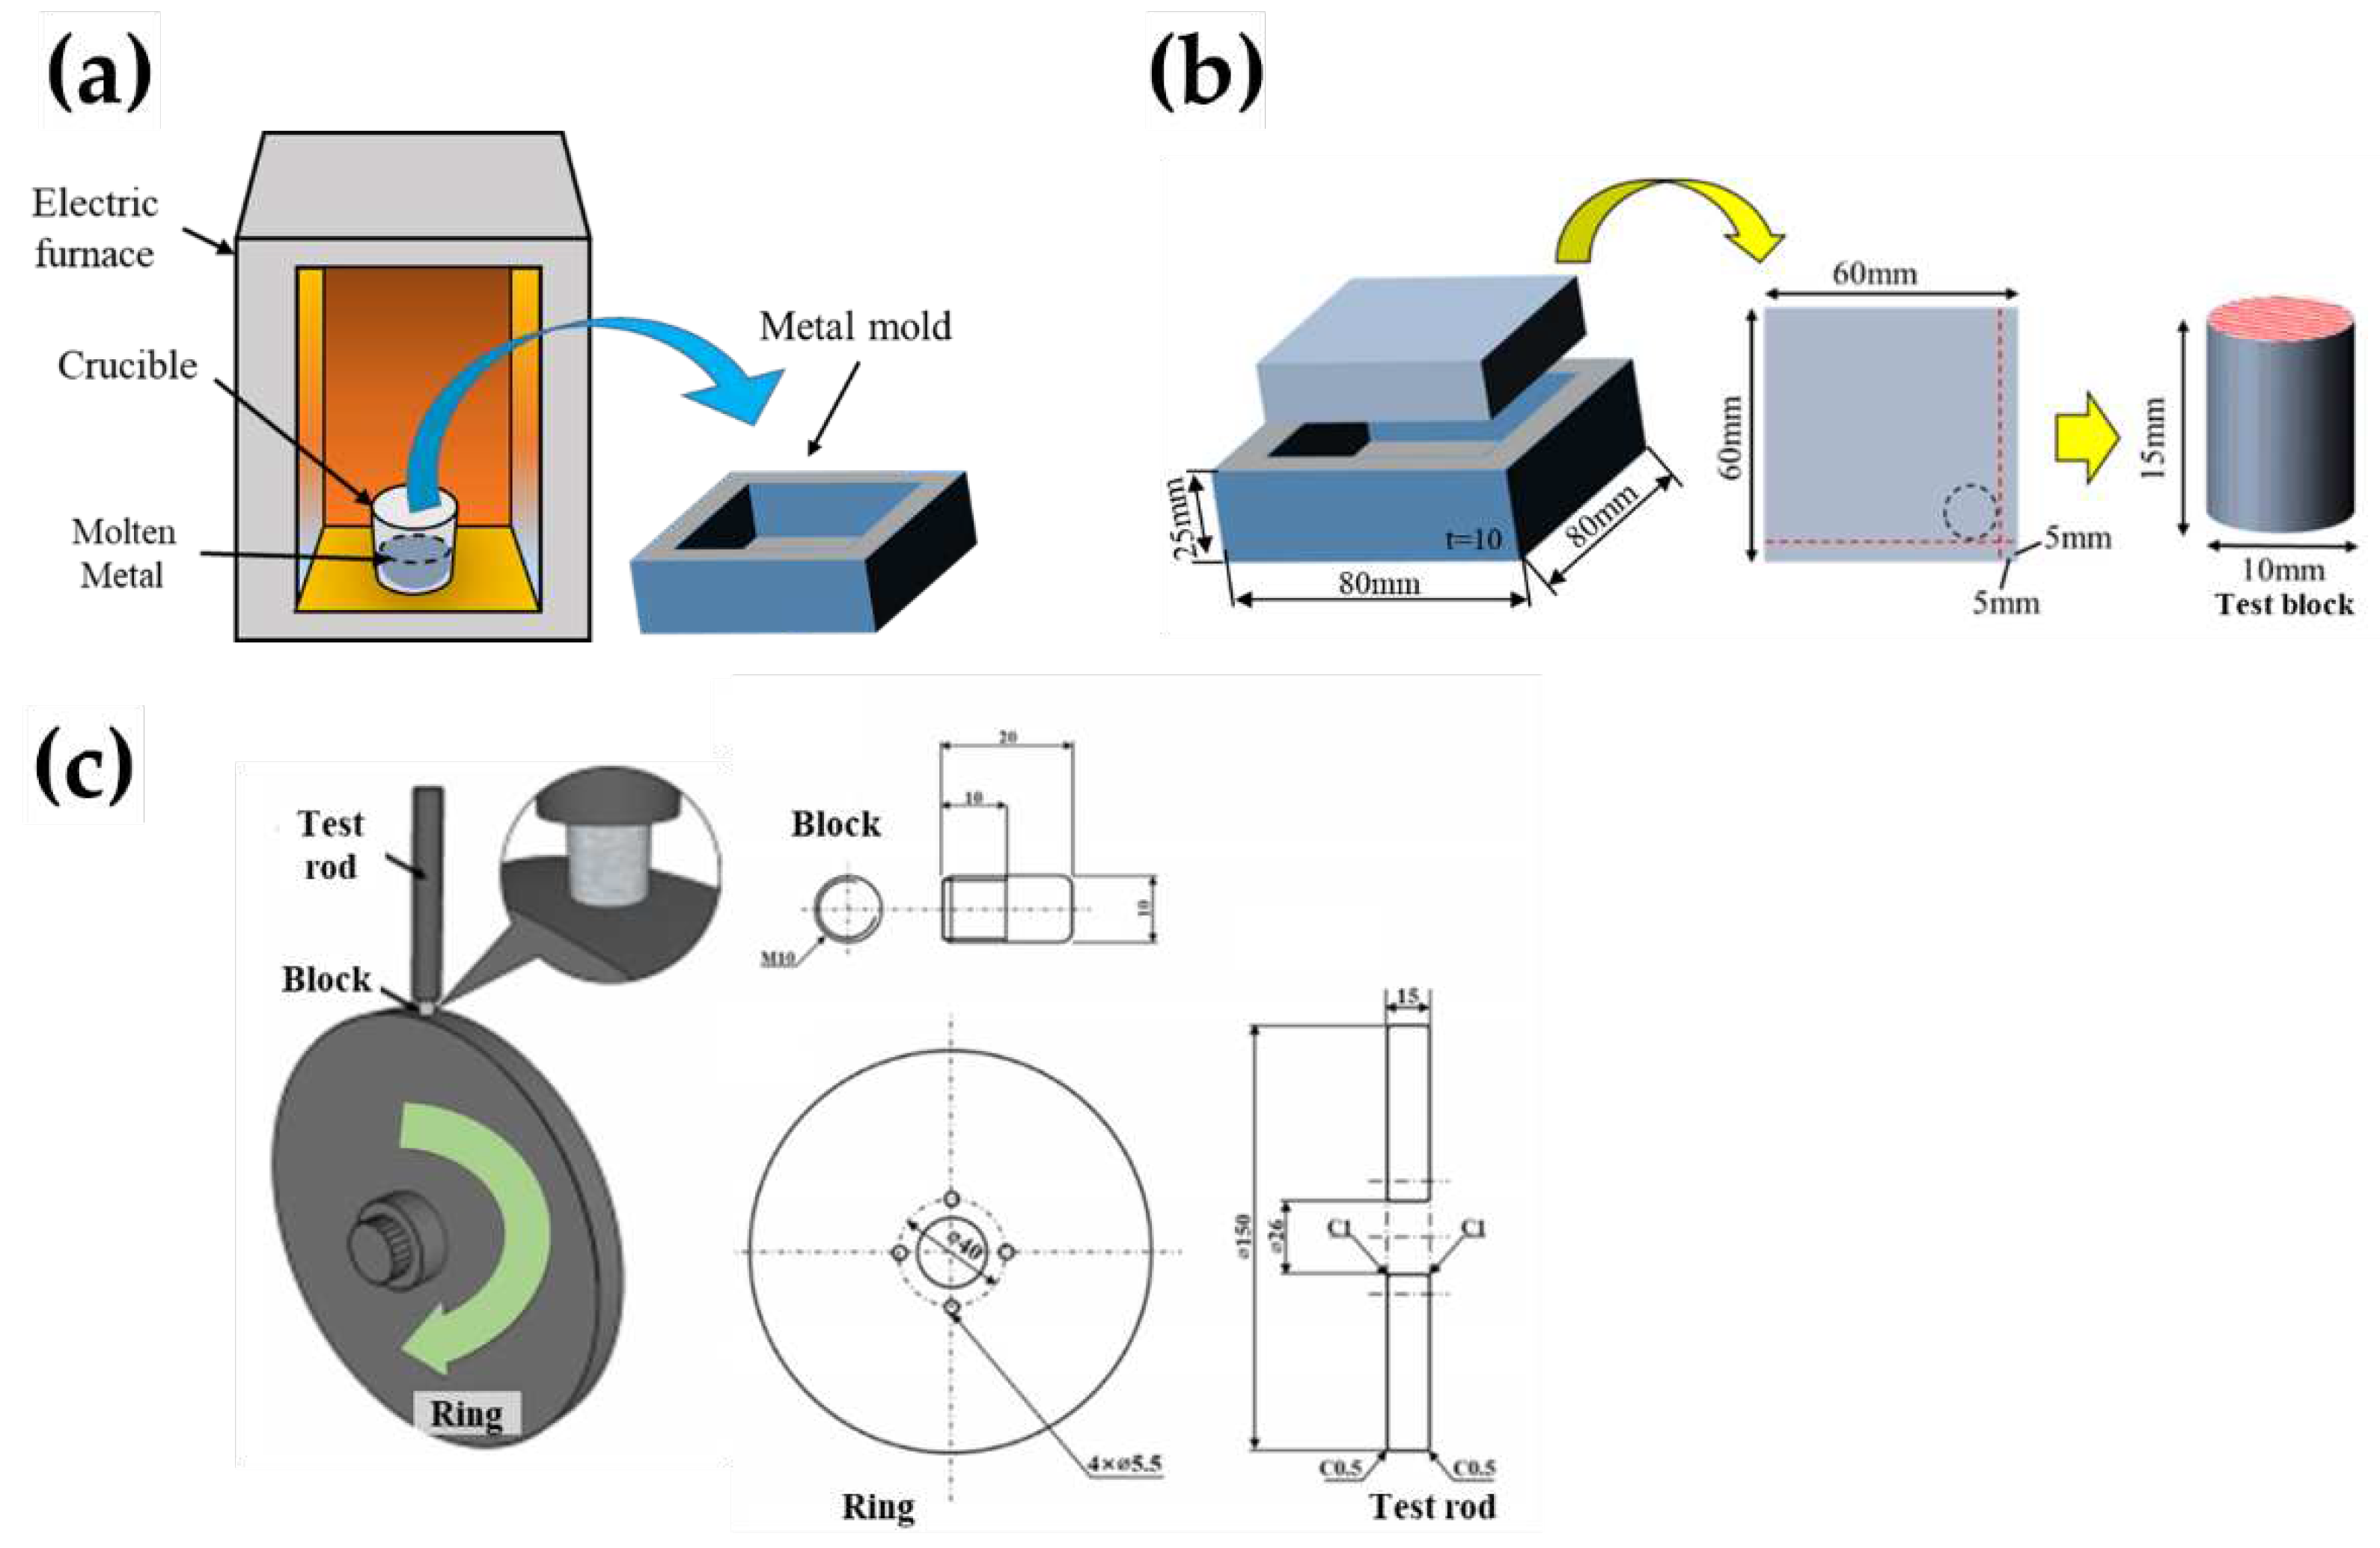
Figure 2.
Optical micrograph of cast sample and corresponding ImageJ analysis; (a) optical micrograph, (b) converting (a) to a binary image, and (c) converting (a) to an outline image and corresponding results.
Figure 2.
Optical micrograph of cast sample and corresponding ImageJ analysis; (a) optical micrograph, (b) converting (a) to a binary image, and (c) converting (a) to an outline image and corresponding results.
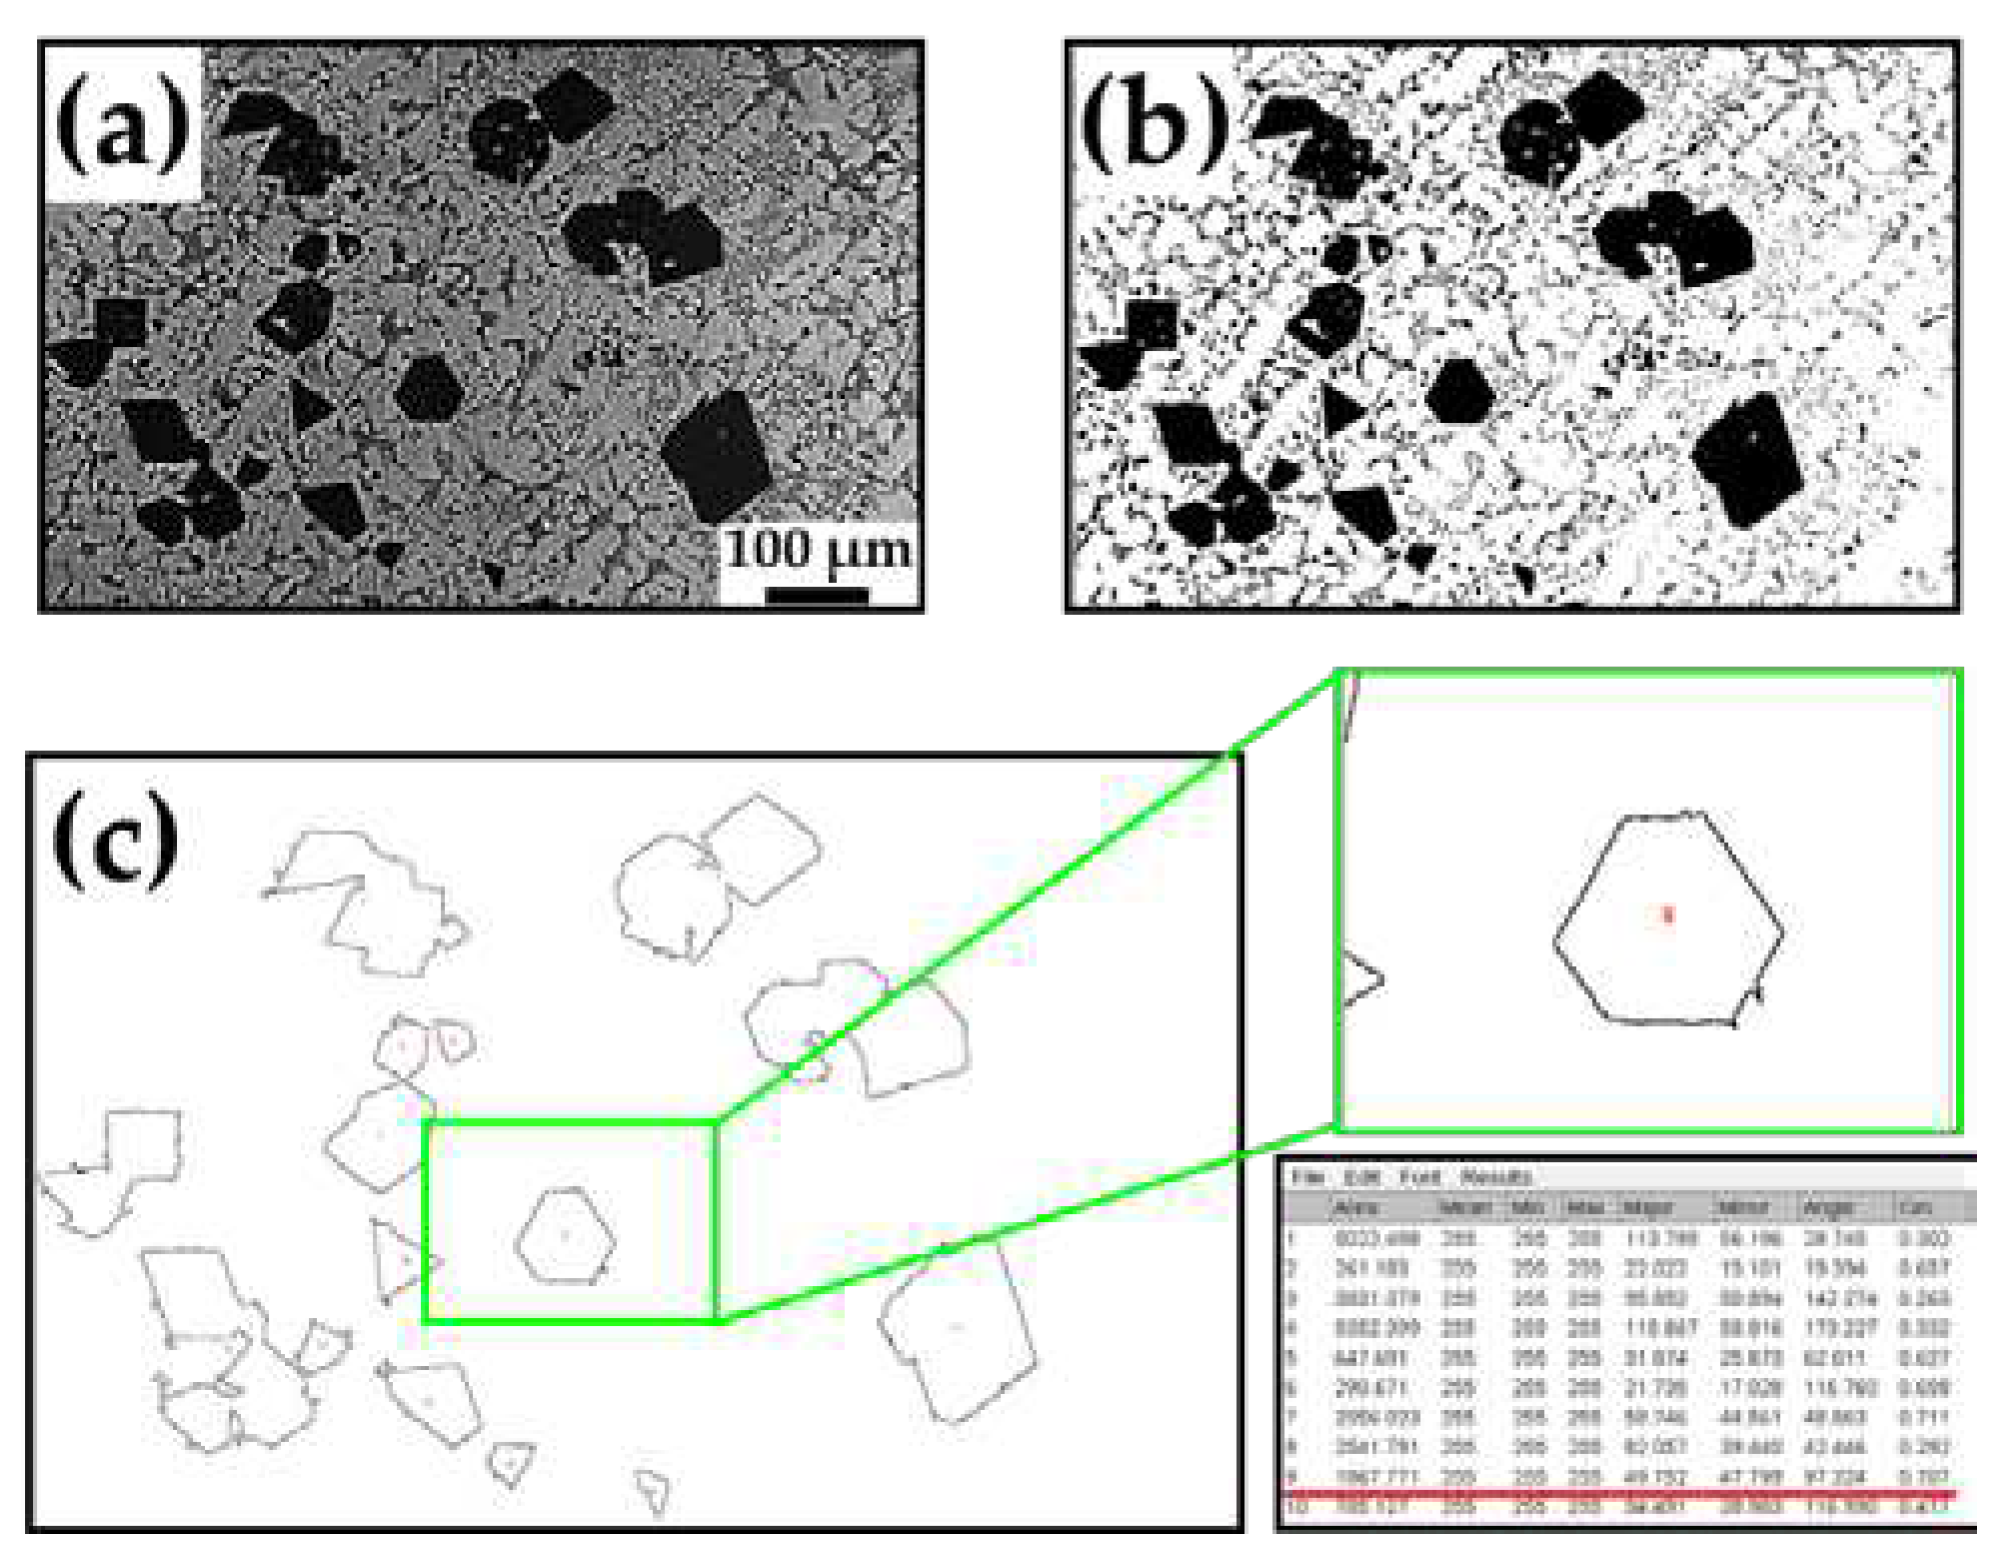
Figure 3.
Optical micrographs microstructures of GC samples; (a) as cast and modified with (b) 100 ppm, (c) 200 ppm, (d) 300 ppm, and (e) 400 ppm Sr.
Figure 3.
Optical micrographs microstructures of GC samples; (a) as cast and modified with (b) 100 ppm, (c) 200 ppm, (d) 300 ppm, and (e) 400 ppm Sr.
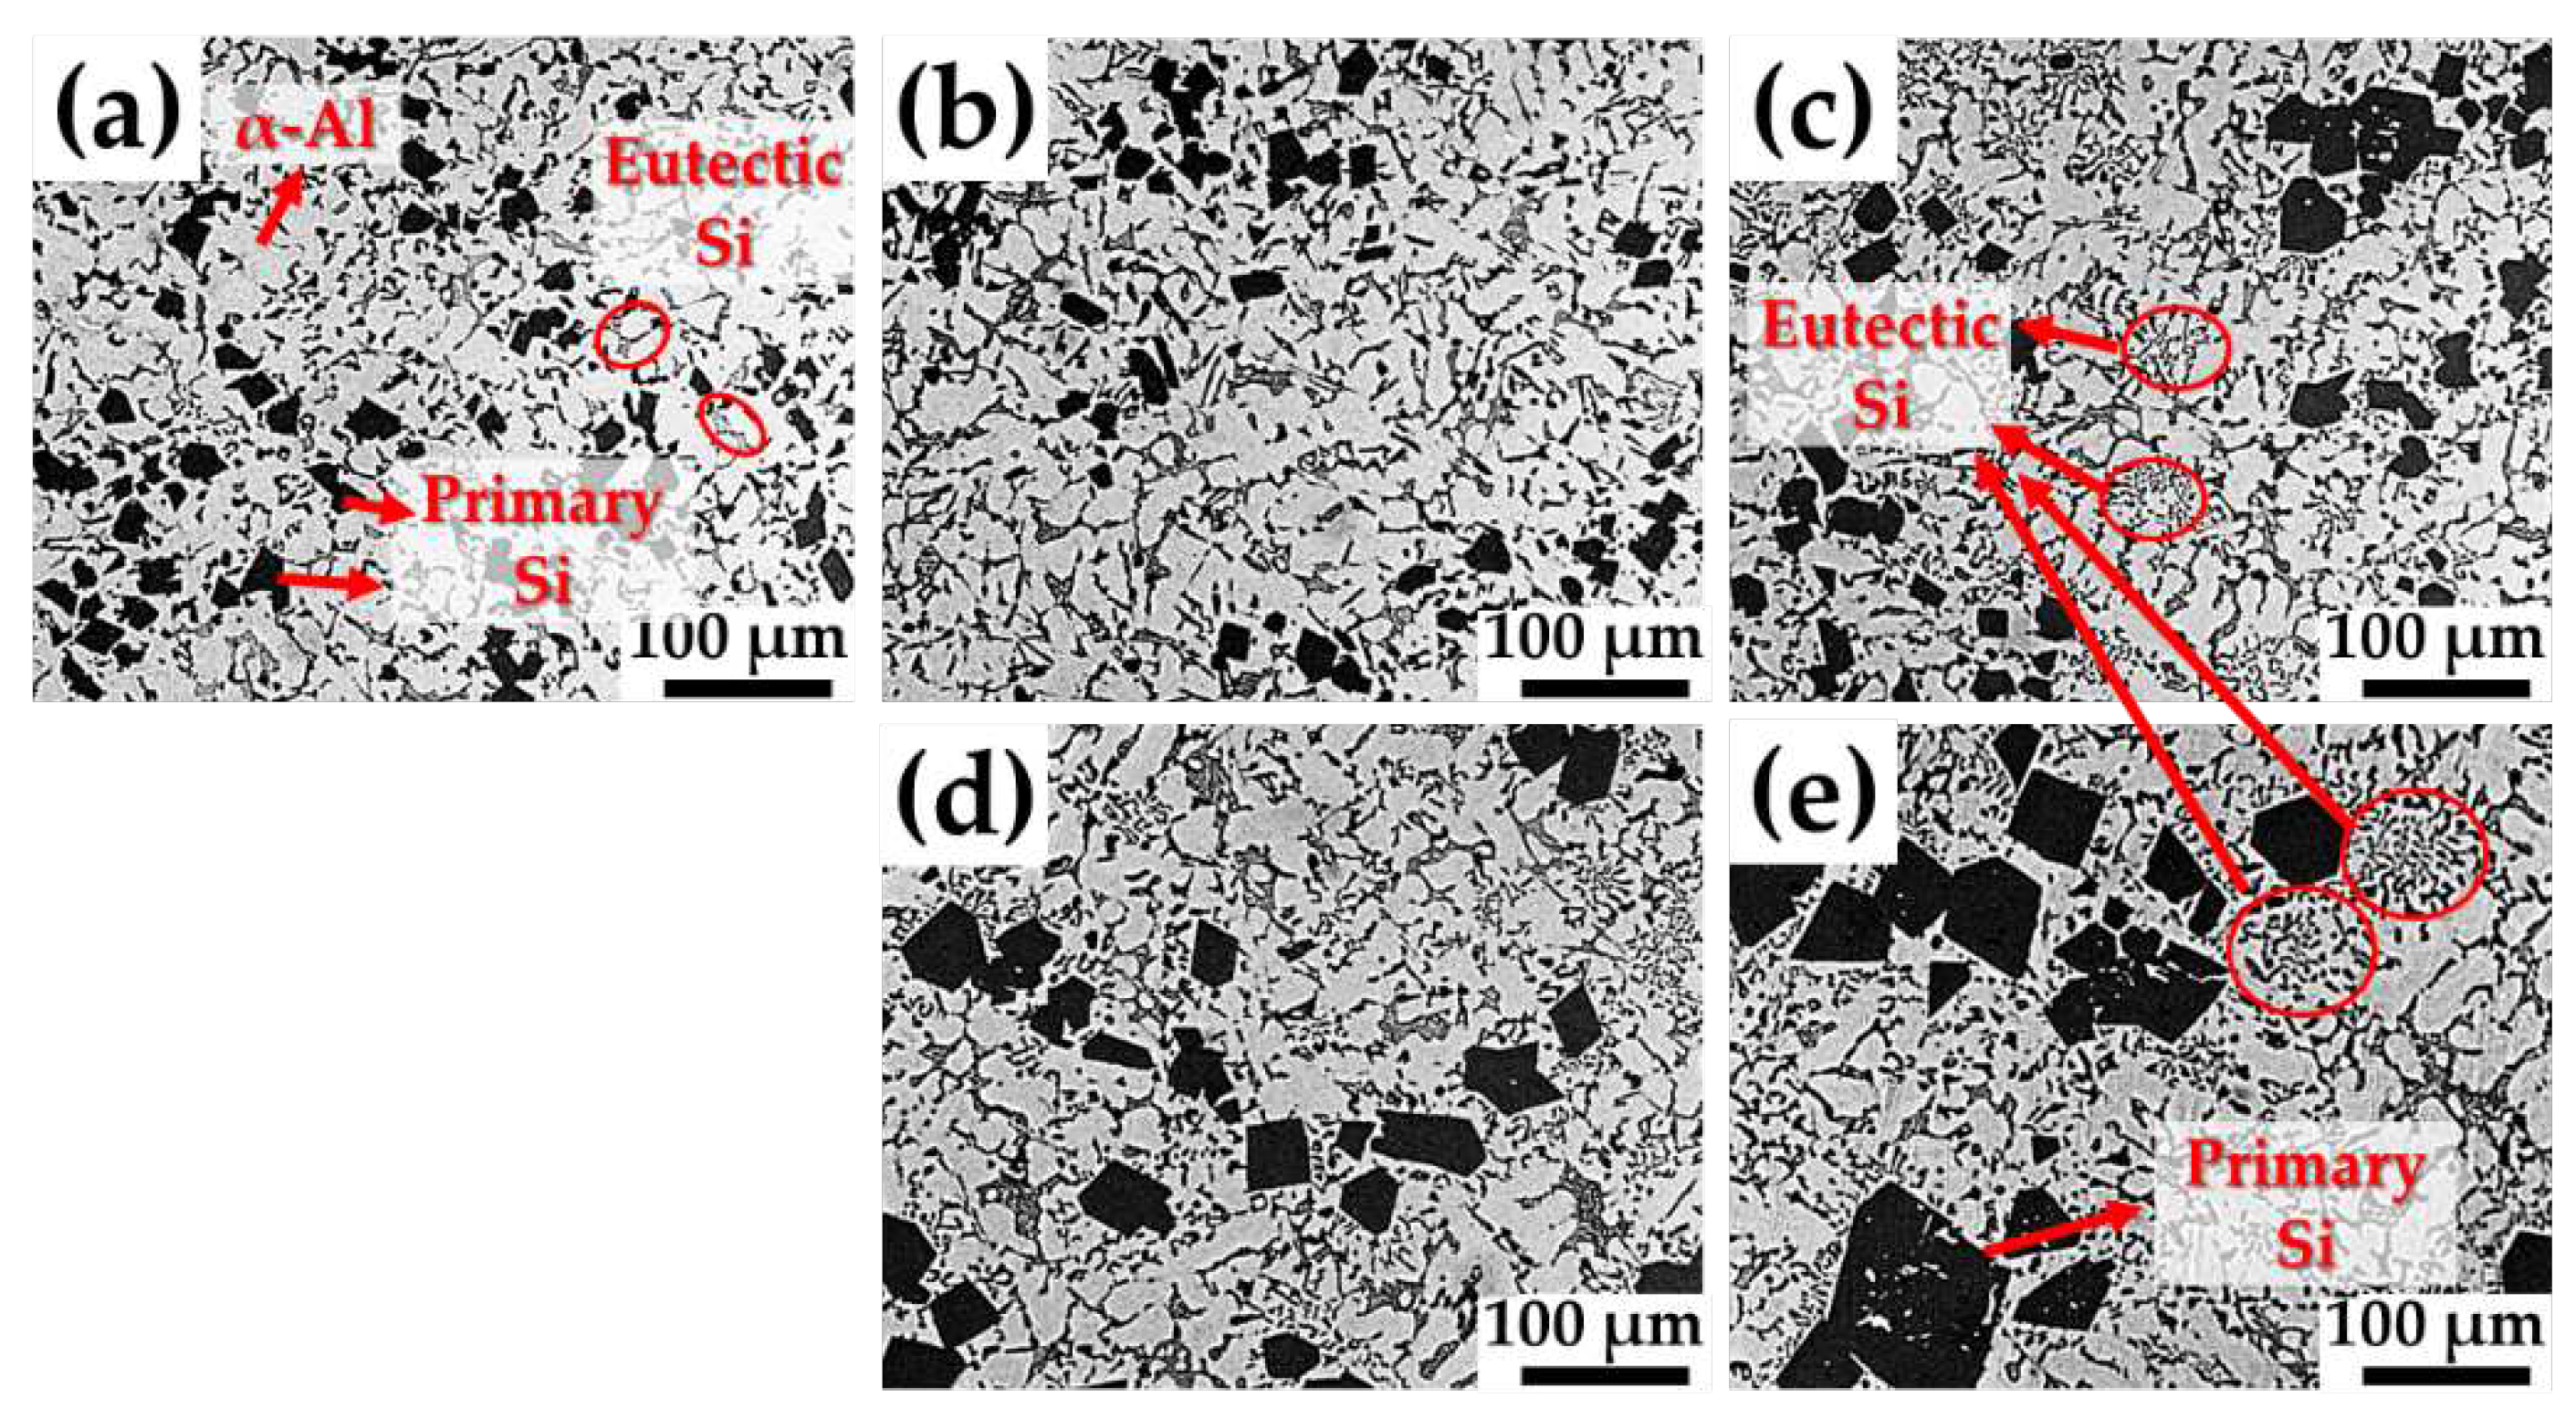
Figure 4.
Schematic drawings of crystal structures of (a) Si and (b) AlP.
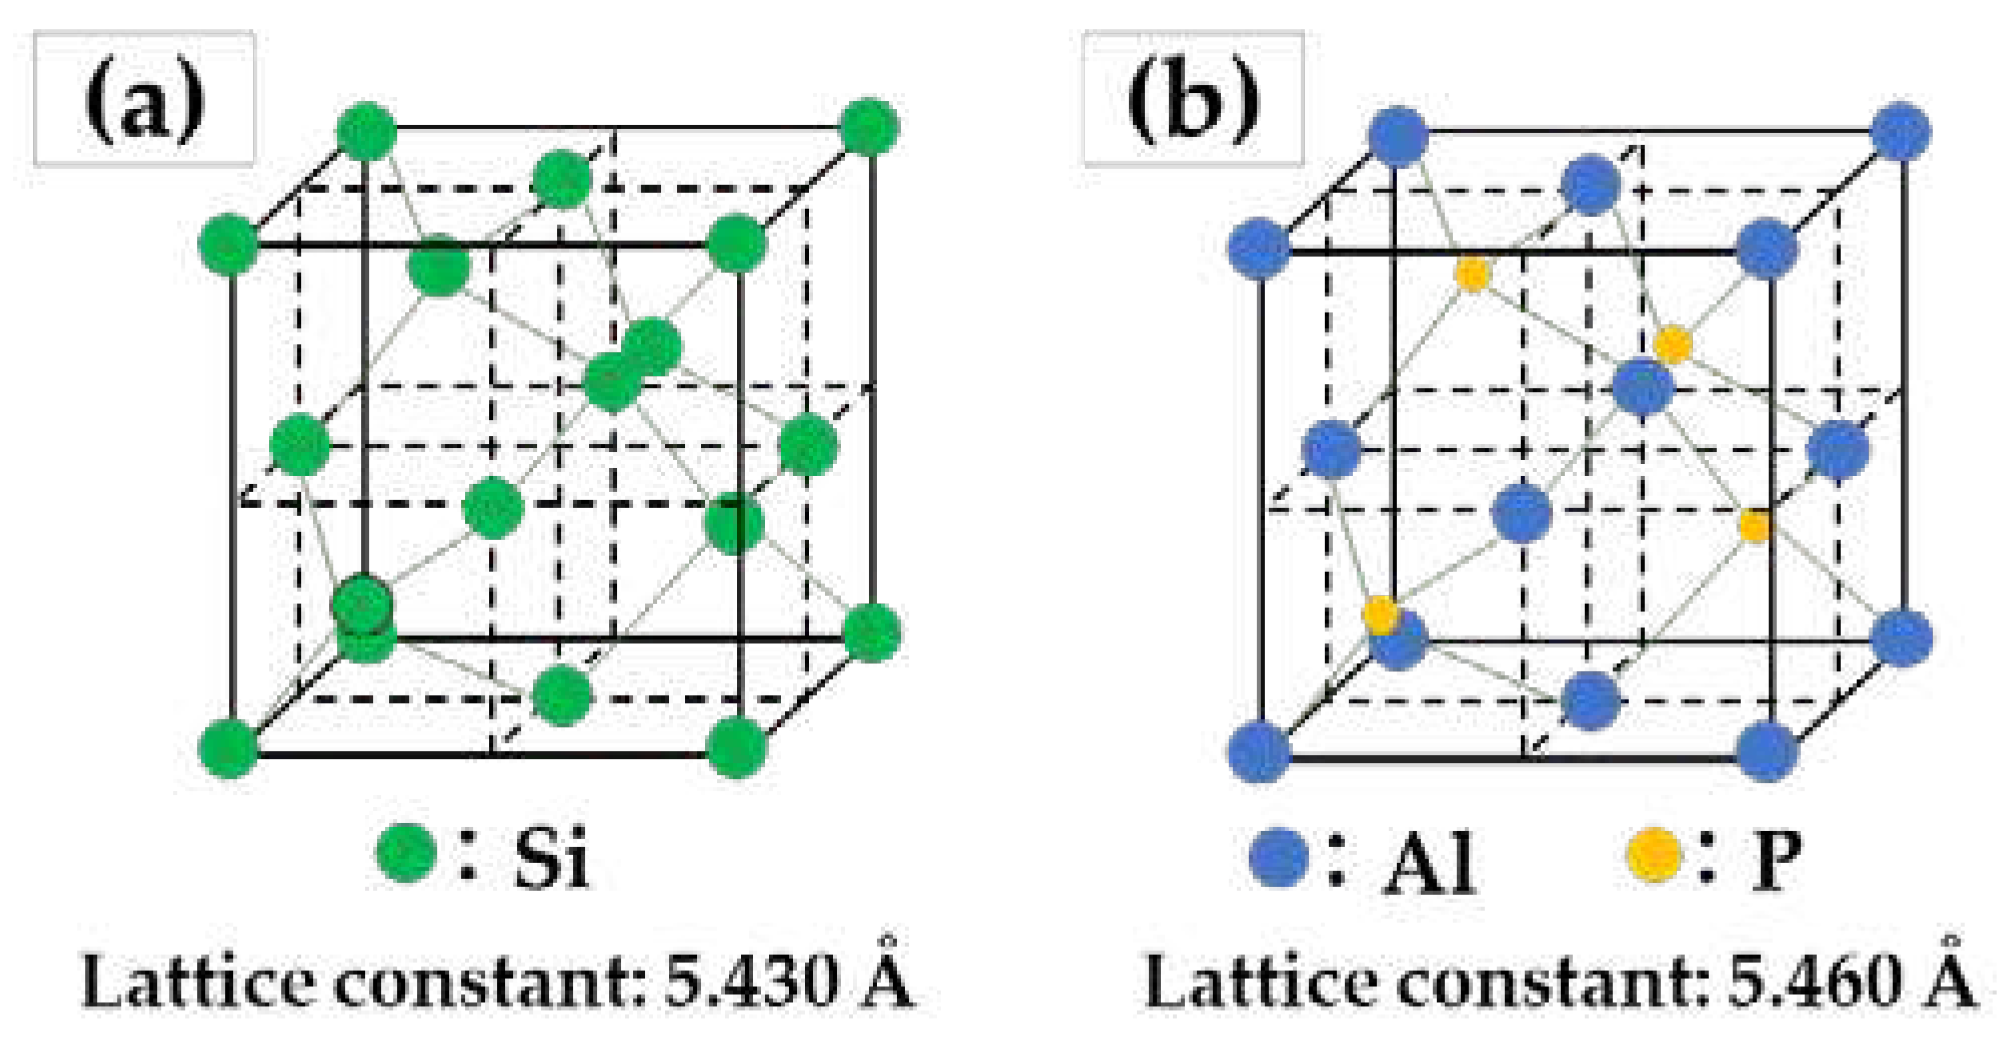
Figure 5.
Distributions of (a) the numbers and (b) area ratio of primary Si phases obtained from samples with different additions of Sr.
Figure 5.
Distributions of (a) the numbers and (b) area ratio of primary Si phases obtained from samples with different additions of Sr.
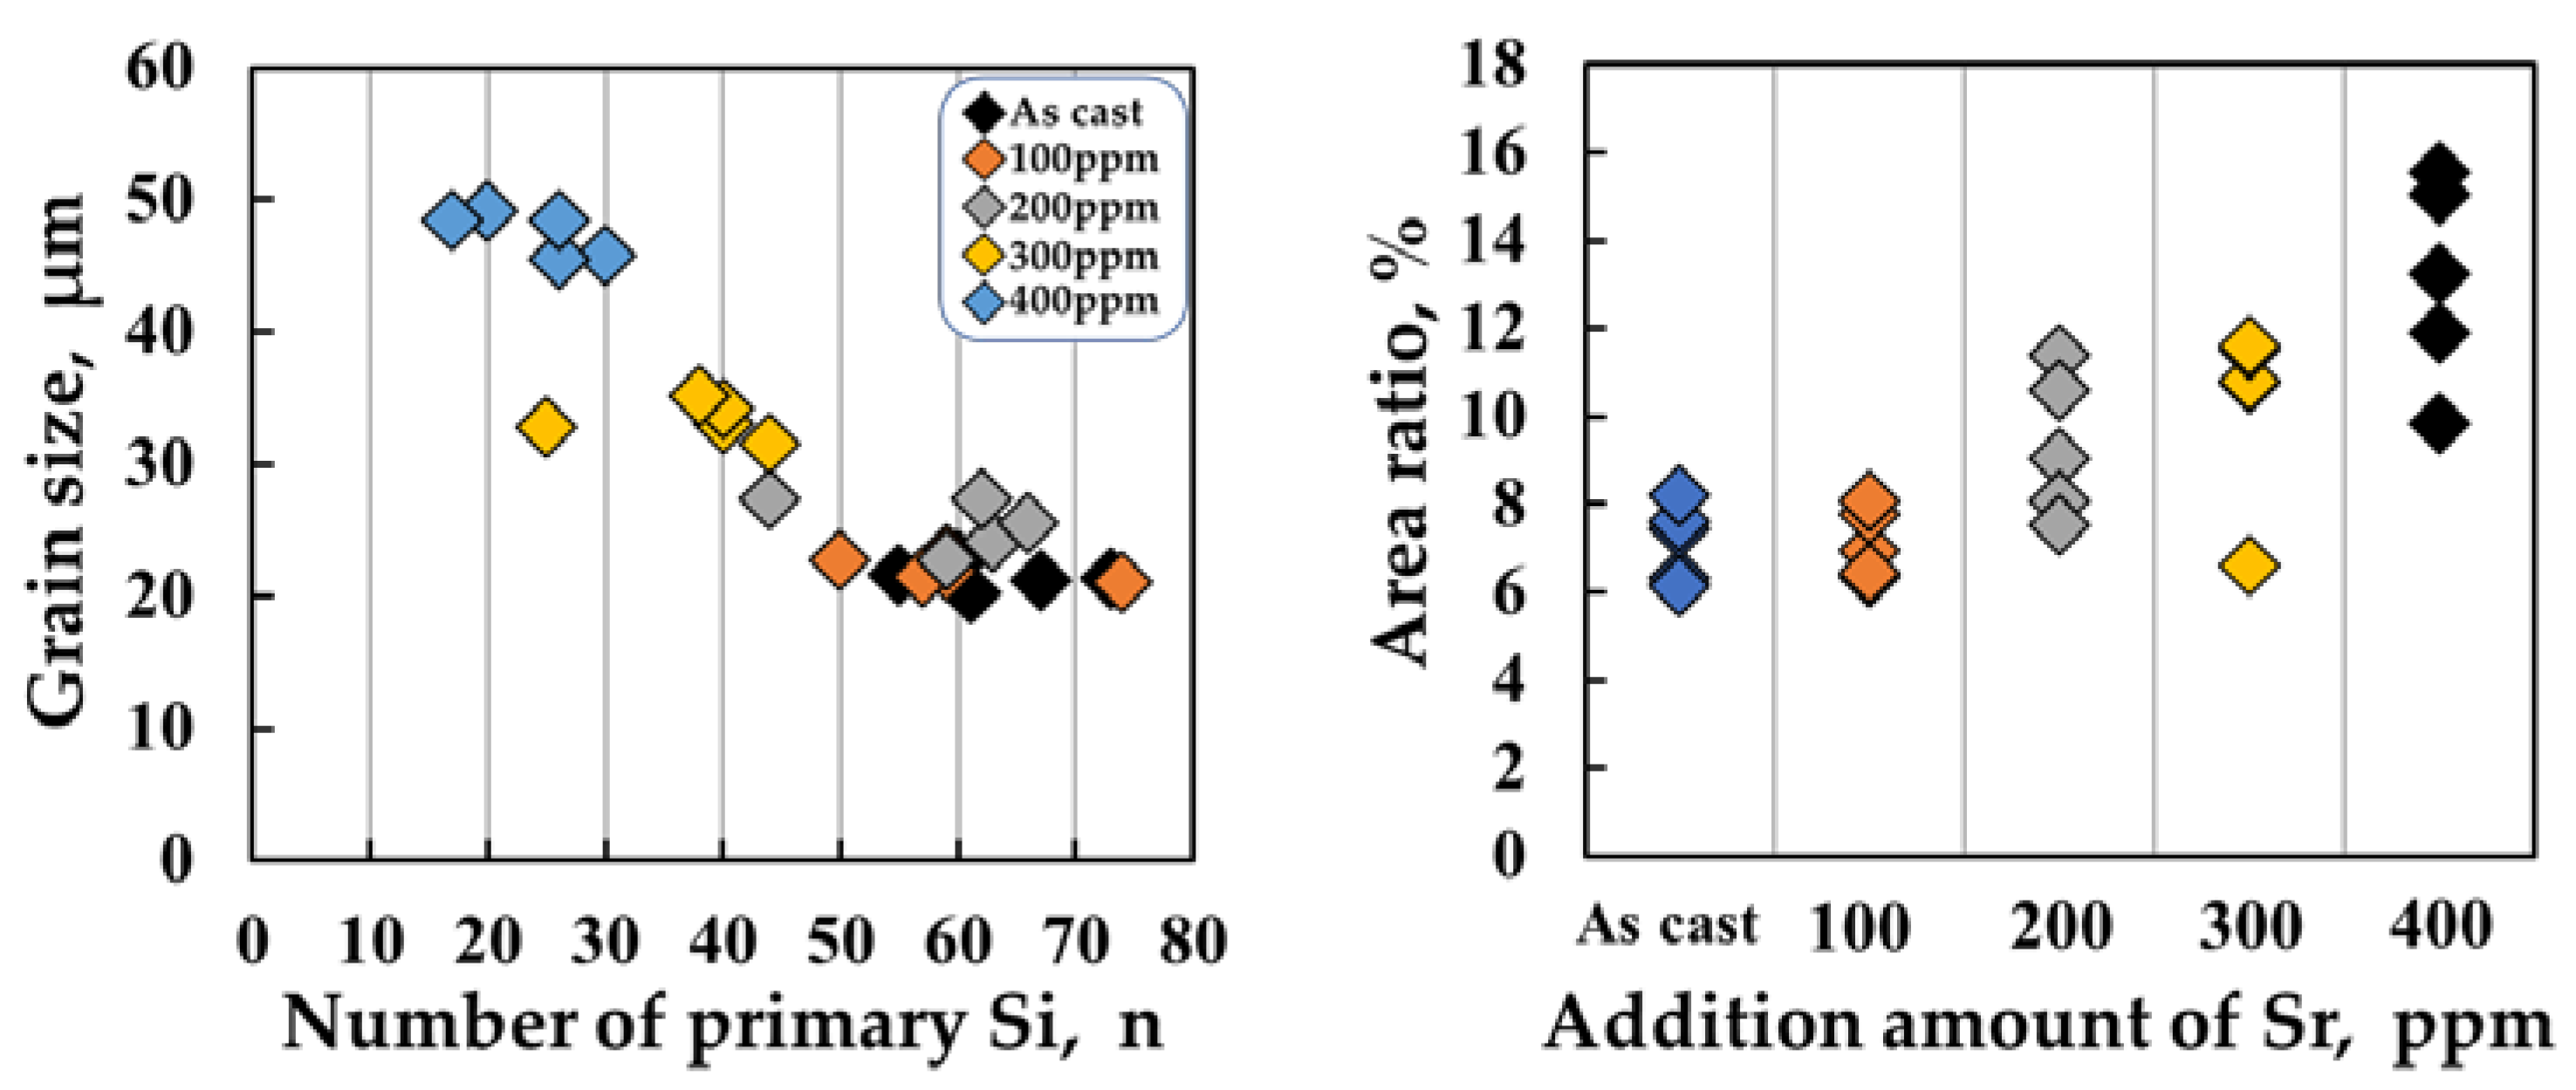
Figure 6.
Optical micrographs microstructures of GC samples, showing eutectic Si; (a) as cast and modified with (b) 100 ppm, (c) 200 ppm, (d) 300 ppm, and (e) 400 ppm Sr.
Figure 6.
Optical micrographs microstructures of GC samples, showing eutectic Si; (a) as cast and modified with (b) 100 ppm, (c) 200 ppm, (d) 300 ppm, and (e) 400 ppm Sr.
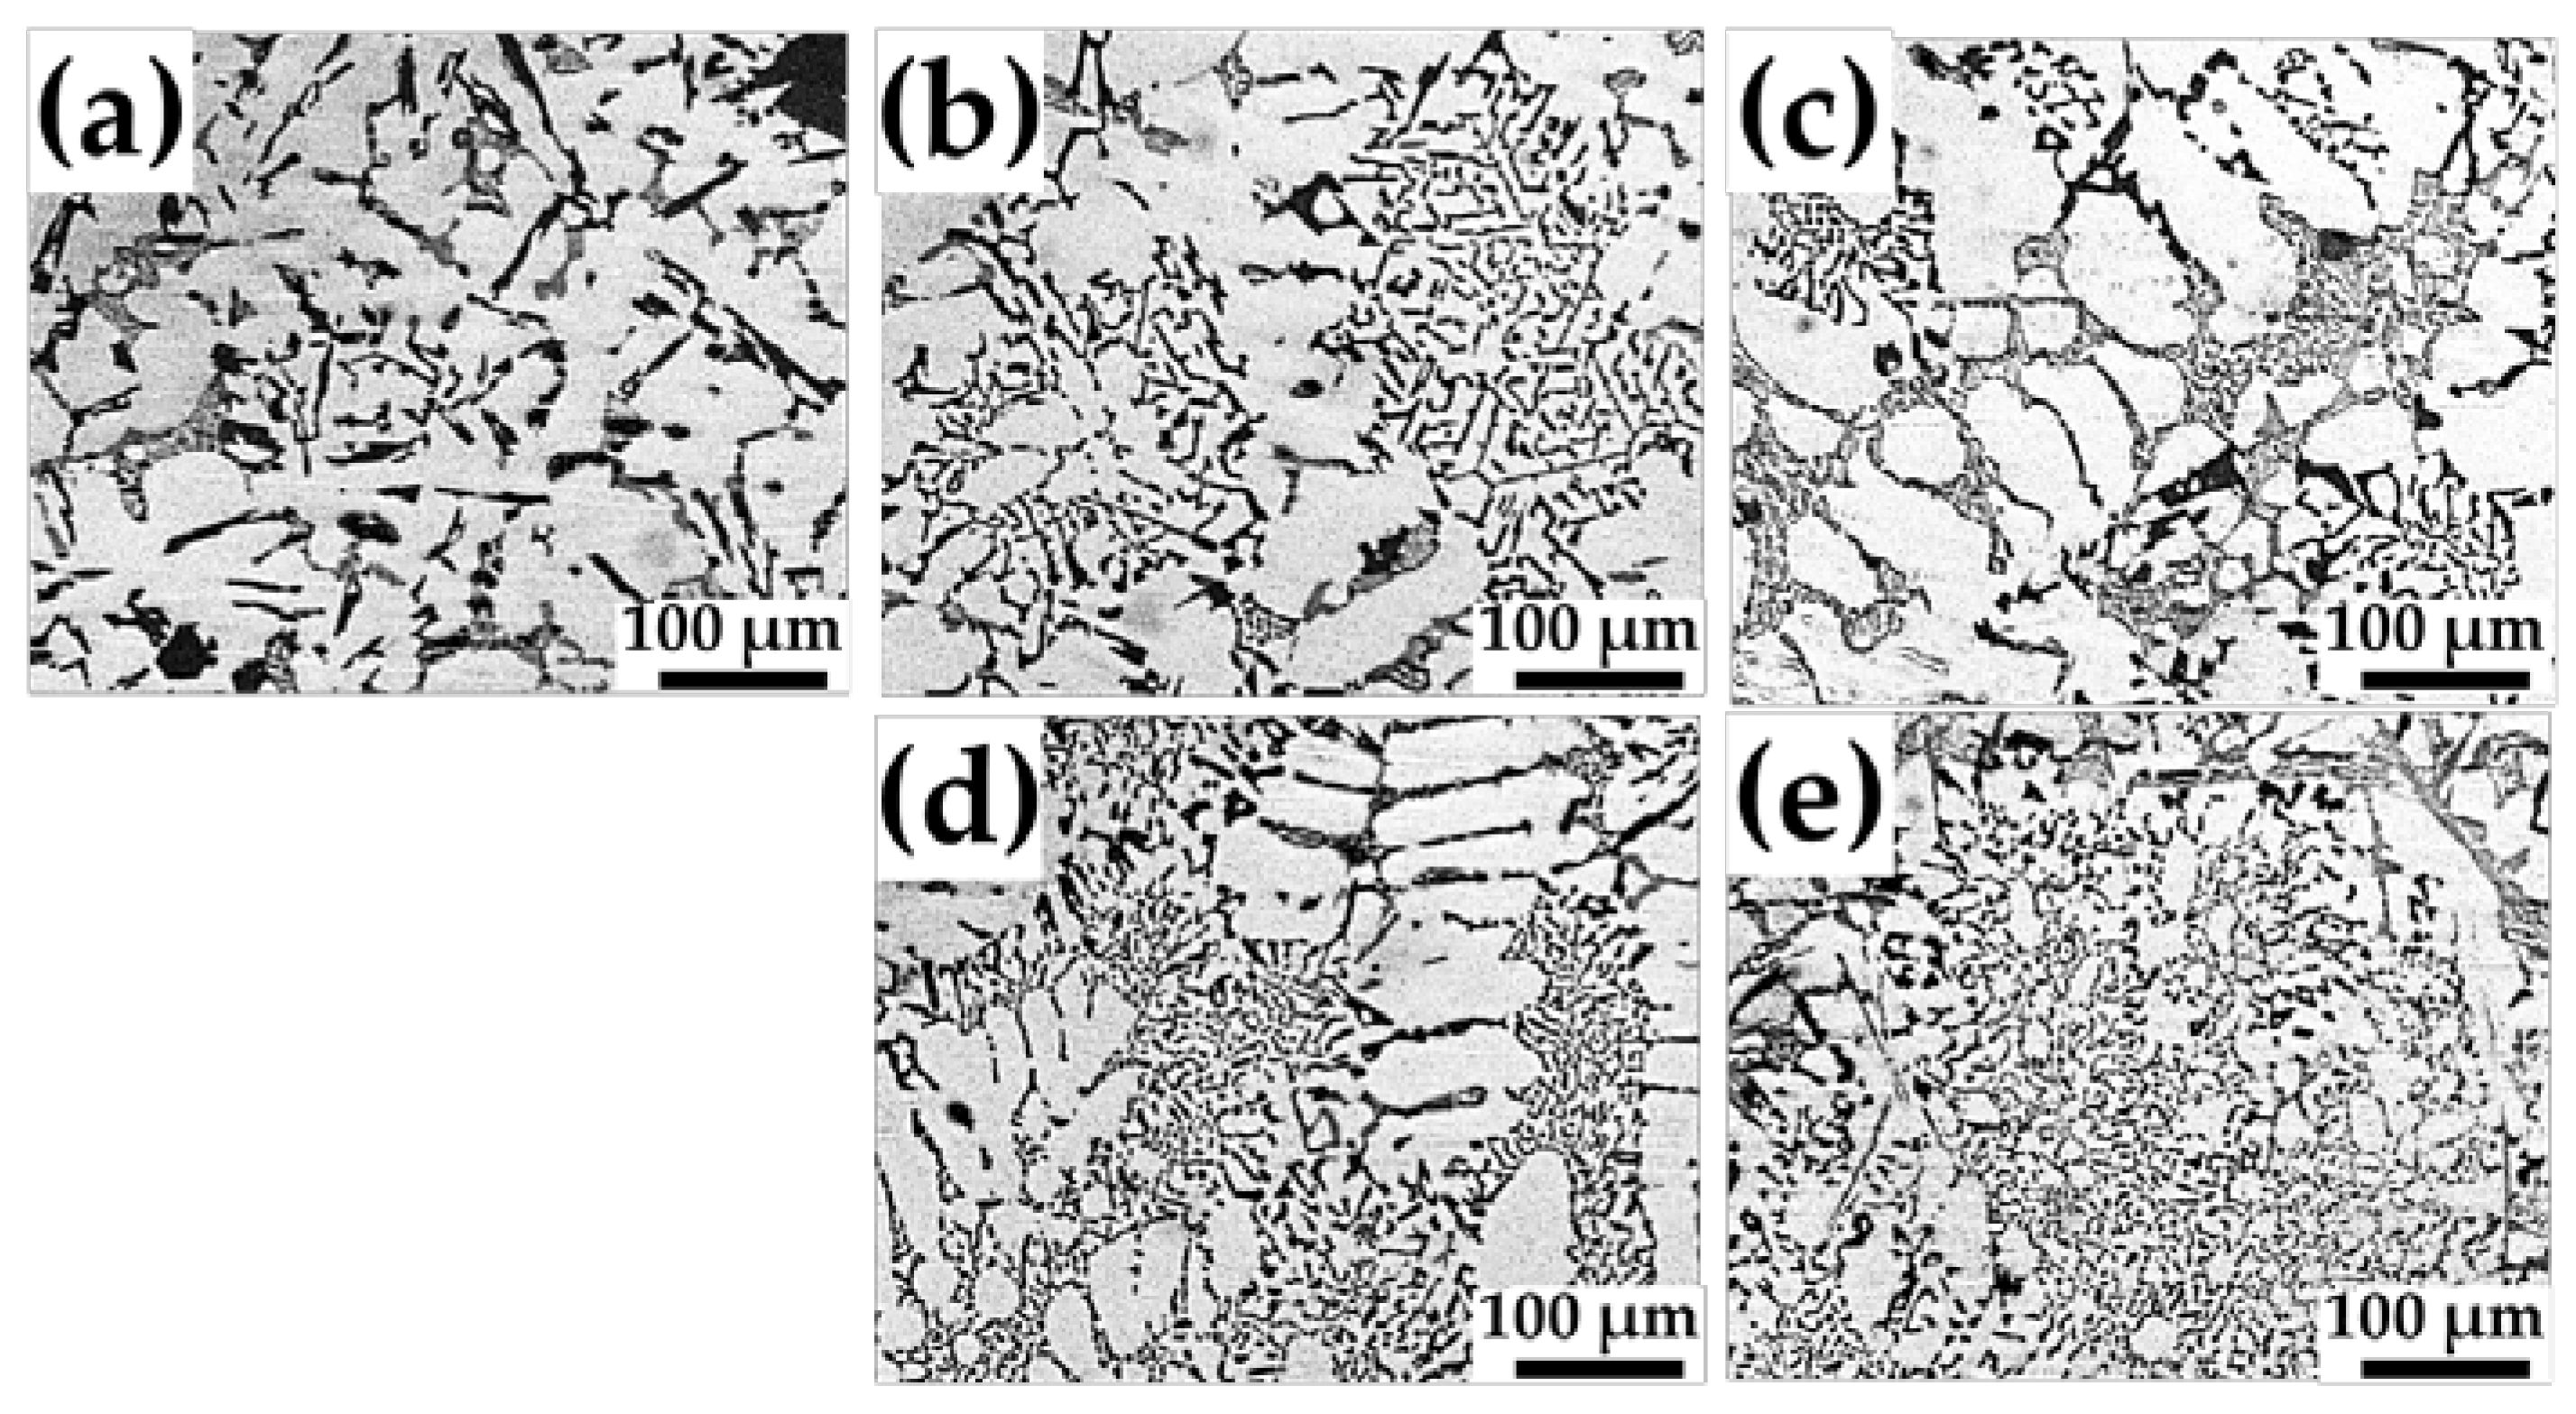
Figure 7.
Distributions of (a) grain sizes and (b) area ratio of eutectic Si phases obtained different additions of Sr.
Figure 7.
Distributions of (a) grain sizes and (b) area ratio of eutectic Si phases obtained different additions of Sr.

Figure 8.
Ws of Al-Si-Cu-Mg blocks against HSS disk with the different Sr content, obtained from wear tests.
Figure 8.
Ws of Al-Si-Cu-Mg blocks against HSS disk with the different Sr content, obtained from wear tests.
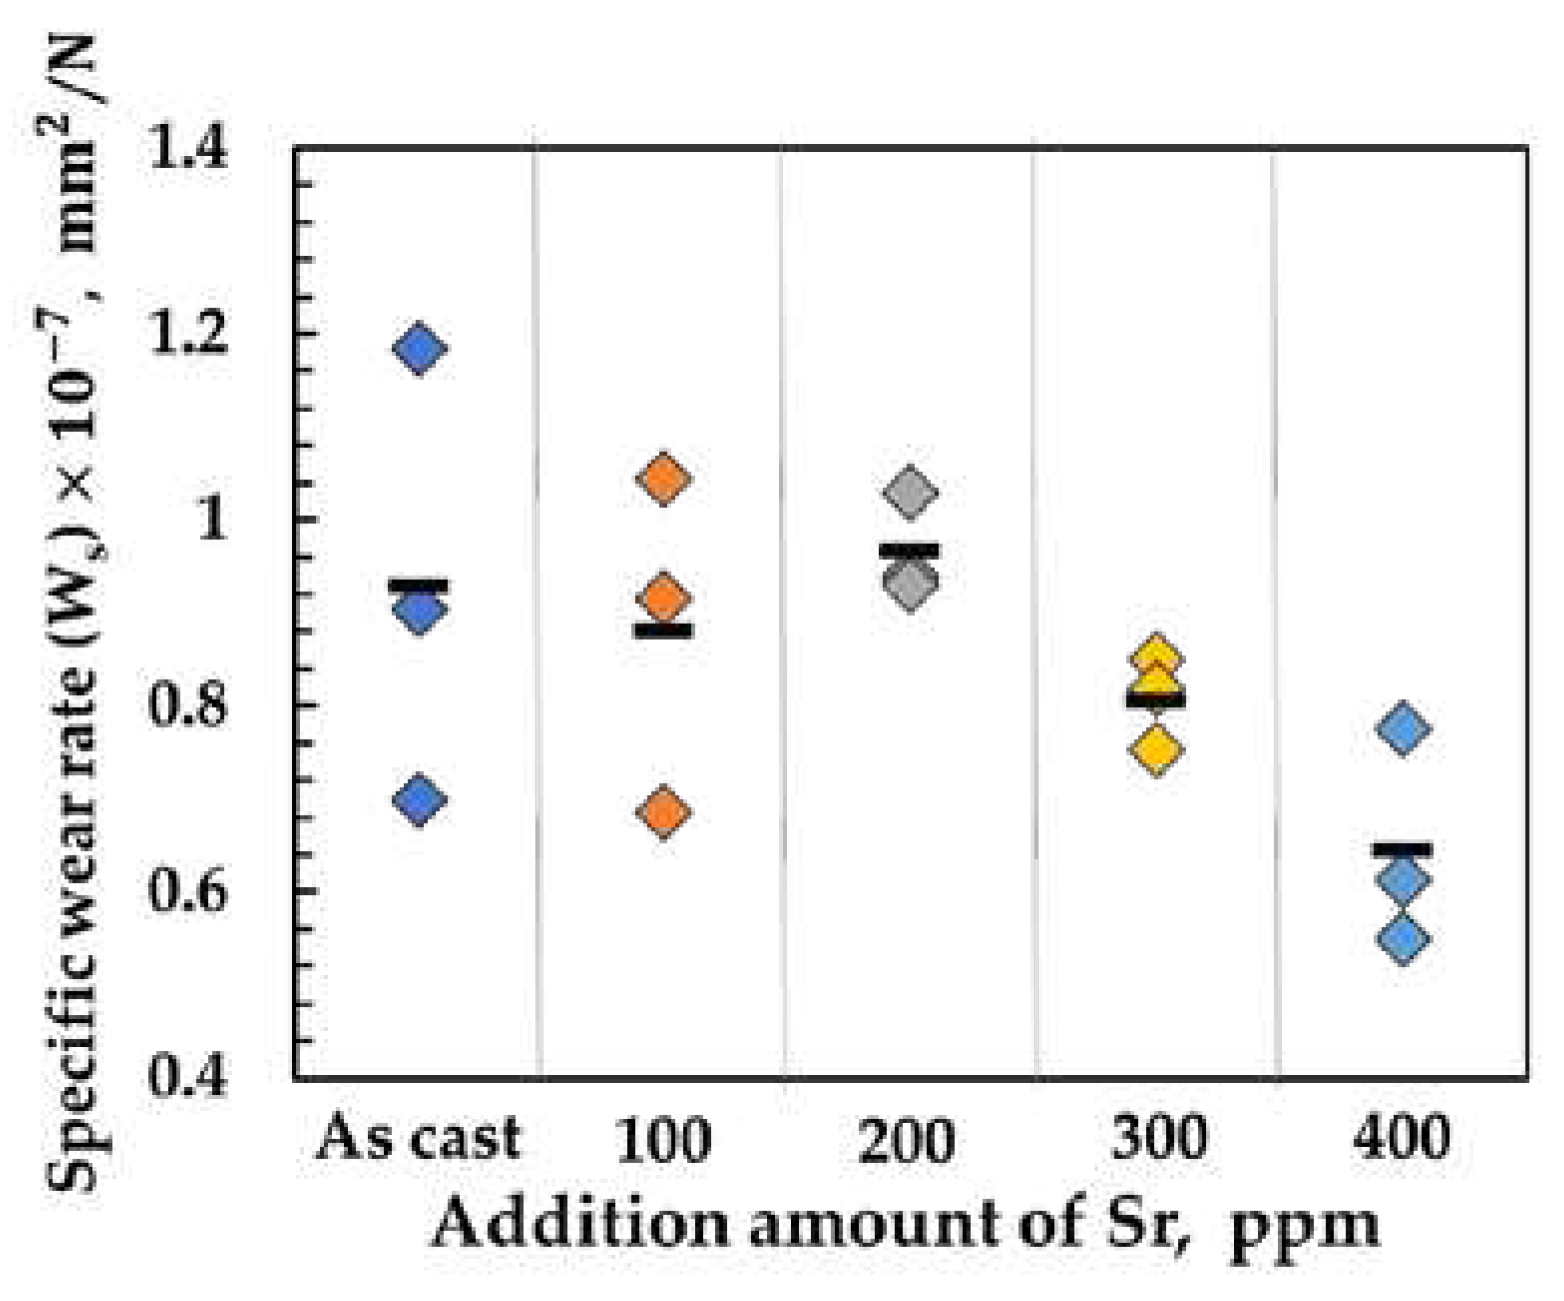
Figure 9.
Morphologies of blocky debris collected at the end of wear tests; (a) as cast and modified with (b) 100 ppm, (c) 200 ppm, (d) 300 ppm, and (e) 400 ppm Sr.
Figure 9.
Morphologies of blocky debris collected at the end of wear tests; (a) as cast and modified with (b) 100 ppm, (c) 200 ppm, (d) 300 ppm, and (e) 400 ppm Sr.
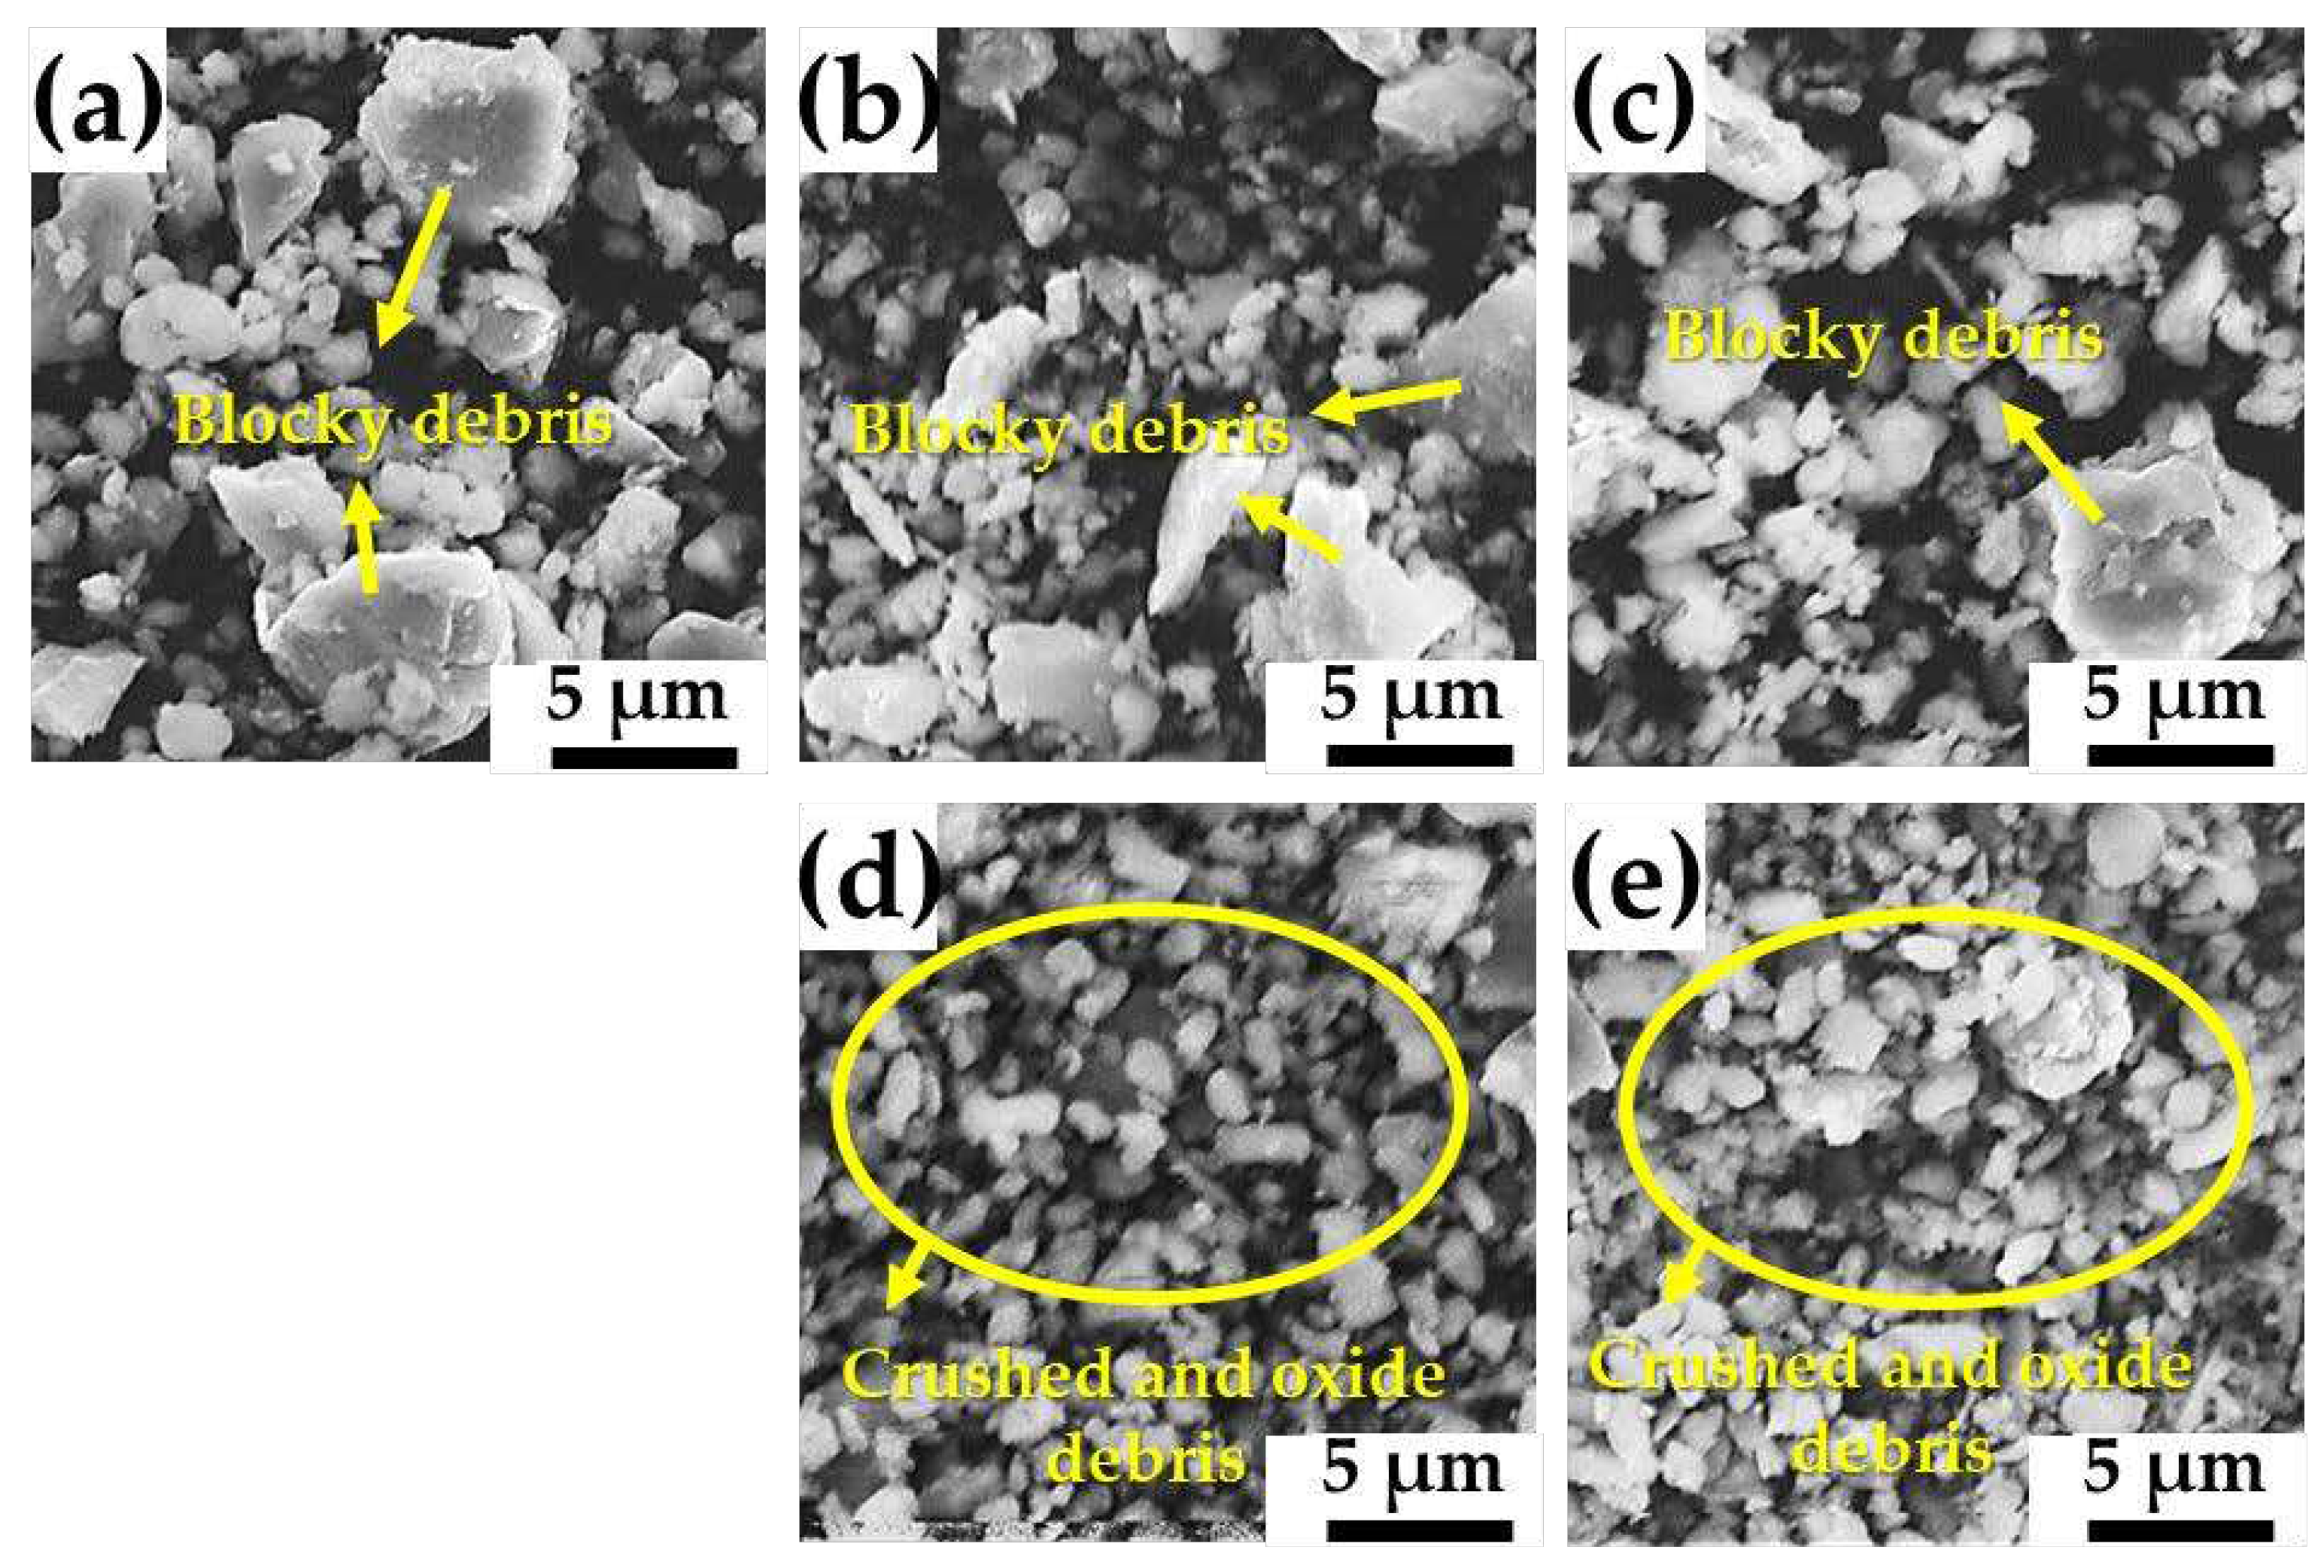
Figure 10.
SEM micrographs of (a) debris collected from unmodified Al-Si-Cu-Mg block, corresponding EDS pattern for (a) point A, and EDS maps of the distribution of (c) Al and (d) Si elements.
Figure 10.
SEM micrographs of (a) debris collected from unmodified Al-Si-Cu-Mg block, corresponding EDS pattern for (a) point A, and EDS maps of the distribution of (c) Al and (d) Si elements.
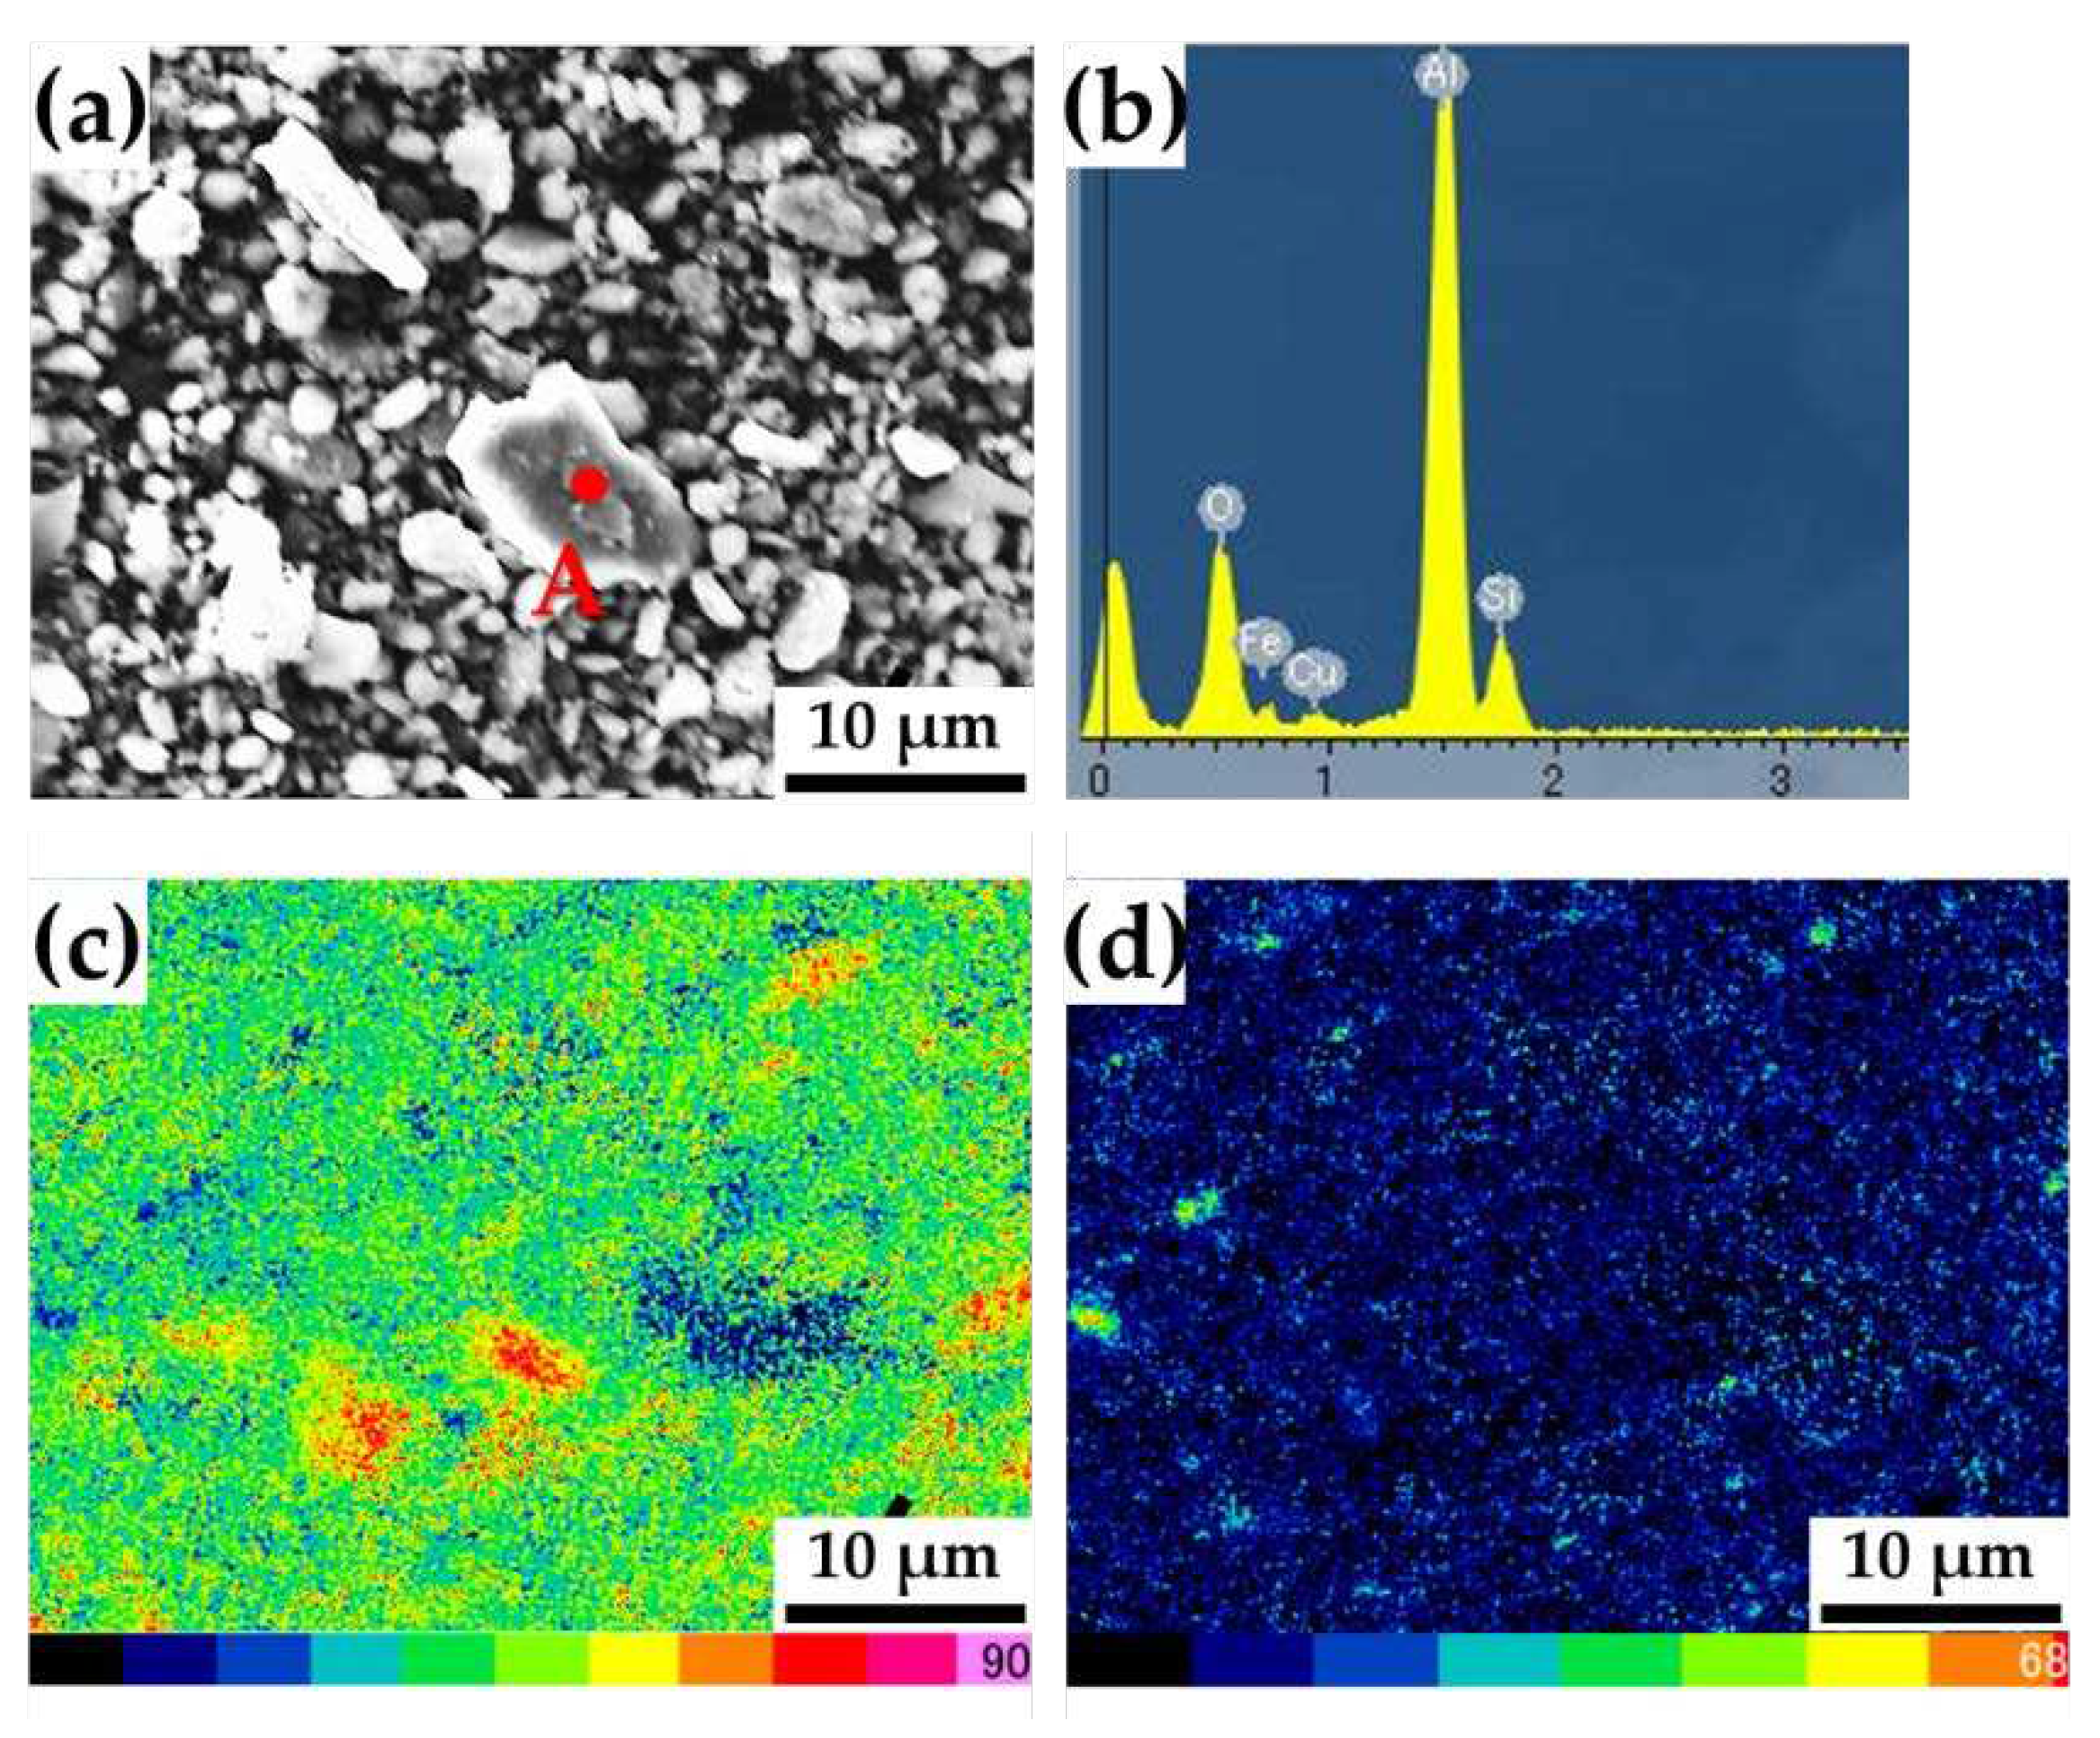
Figure 11.
Schematic drawing of the differences during frictional wear between (a) fine primary Si phases and (b) coarse primary Si phases in Al-Si-Cu-Mg alloys.
Figure 11.
Schematic drawing of the differences during frictional wear between (a) fine primary Si phases and (b) coarse primary Si phases in Al-Si-Cu-Mg alloys.
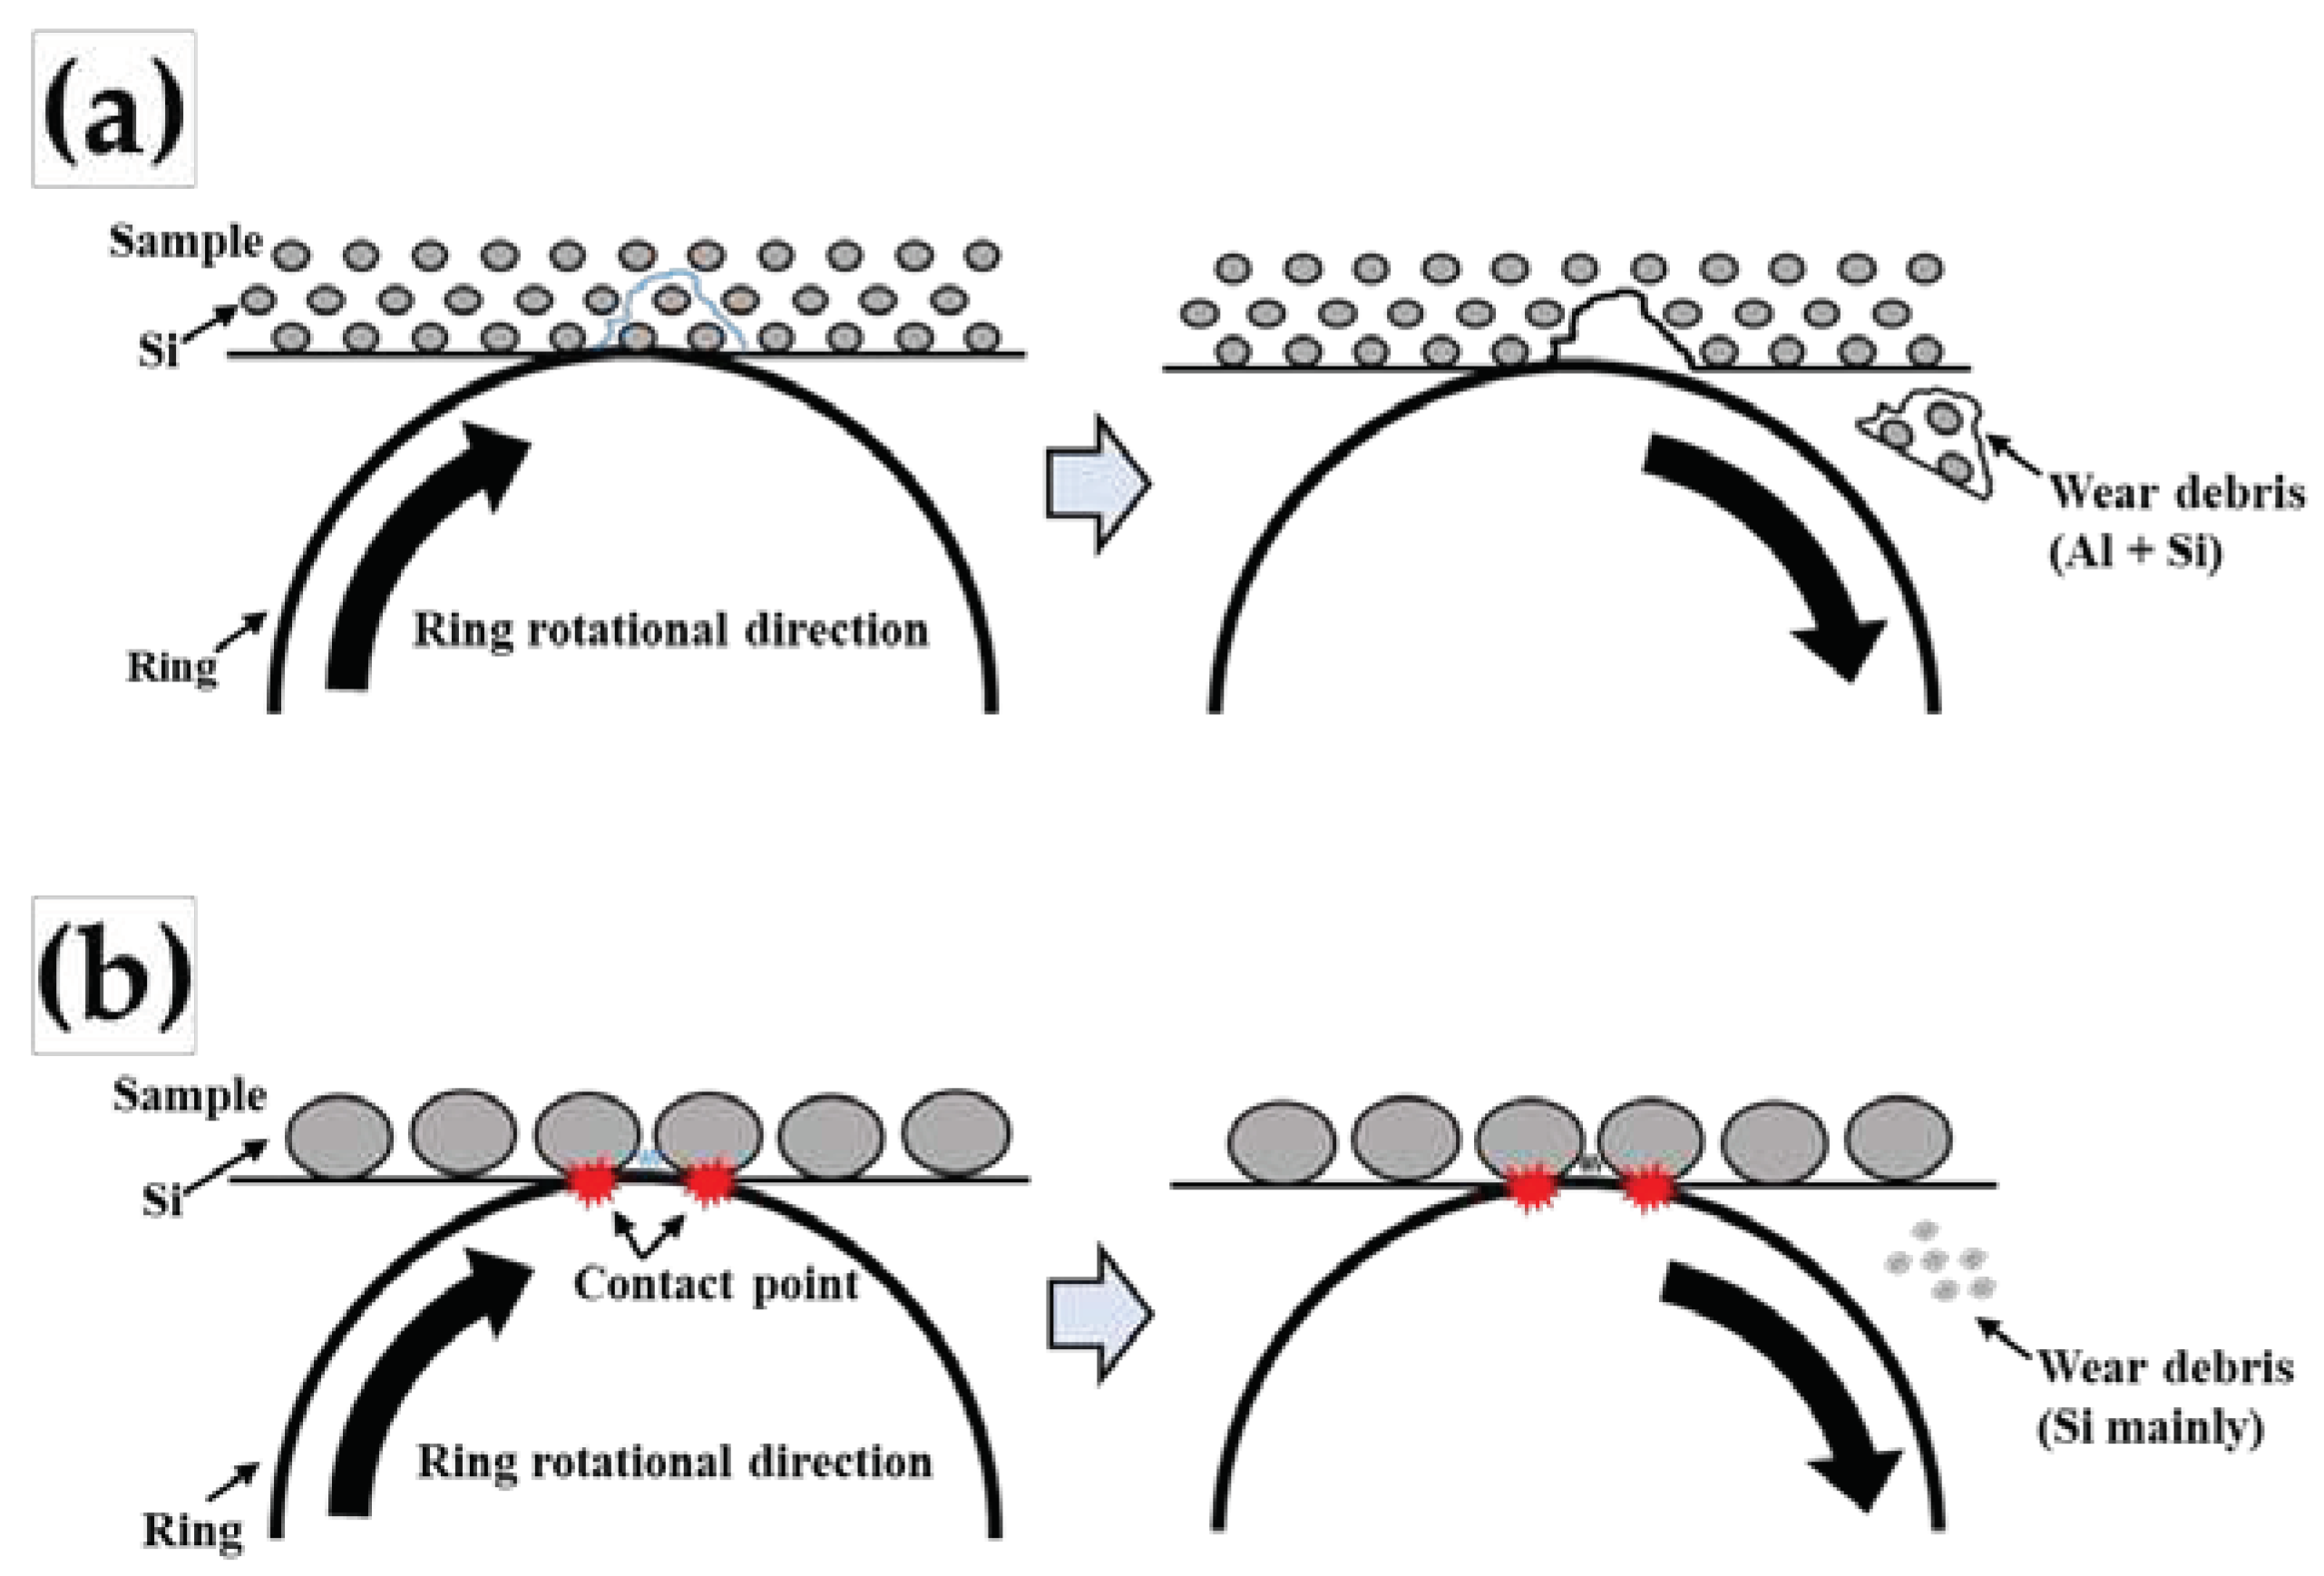

Table 1.
Chemical compositions (mass%) of Al–Si–Cu–Mg alloy (JIS ADC14) used in this study.
| Element Alloy |
Cu | Si | Mg | Zn | Fe | Mn | Al |
|---|---|---|---|---|---|---|---|
| Al–Si–Cu–Mg | 4.20 | 16.49 | 0.61 | 0.37 | 0.72 | 0.31 | bal. |
Disclaimer/Publisher’s Note: The statements, opinions and data contained in all publications are solely those of the individual author(s) and contributor(s) and not of MDPI and/or the editor(s). MDPI and/or the editor(s) disclaim responsibility for any injury to people or property resulting from any ideas, methods, instructions or products referred to in the content. |
© 2023 by the authors. Licensee MDPI, Basel, Switzerland. This article is an open access article distributed under the terms and conditions of the Creative Commons Attribution (CC BY) license (http://creativecommons.org/licenses/by/4.0/).
Copyright: This open access article is published under a Creative Commons CC BY 4.0 license, which permit the free download, distribution, and reuse, provided that the author and preprint are cited in any reuse.


