Submitted:
01 December 2023
Posted:
05 December 2023
You are already at the latest version
Abstract
Within the past few decades, thousands of experiments have been performed to characterize waste and biomass to estimate the bioenergy potential and product identification. There is a need to develop an integrated process model based on experimental literature, and simulation to obtain suitable products. In this study municipal solid waste (MSW) characterization and integrated process model have been developed to optimize final products in a reactor system. The process model has two modes R&D and reactor control (RC) to obtain suitable products including bio-oil, char, and gases. A database was integrated based on thermokinetics, machine learning and simulation models to optimize product efficiency. The experimental data includes thermogravimetric analysis, Fourier transform Infrared Spectroscopy, Gas chromatography, and Mass spectrometry, which are linked with pyrolysis experimental setup. Feedstock-product mapping models were incorporated into the database along with the temperature, heating rates, elemental analysis, and final product concentration, which are utilized for pyrolysis reactor setup. Product feasibility is conducted based on lifecycle cost, affordability, and product efficiency. The present work will bridge the gap between experimental study and decision making based on obtained products at several experimental conditions around the world.
Keywords:
Process optimization
; Waste conversion
; Life cycle analysis
; Machine learning
1. Introduction
Municipal Solid Waste (MSW) management is a crucial component in the advancement of the bioeconomy, as it is considered the primary source for bioenergy generation in the United States, Canada, and Brazil [1]. However, the utilization of biomass presents a challenge due to the diverse range of feedstocks and complex chemical structures [2]. Global plastic consumption was estimated to be 299 million tons in 2013, with an expected increase of several folds by 2050, which is alarming to the earth due to hard to degrade in the environment and rapidly trailing landfills [3,4]. Process optimization plays critical role in converting raw materials like paper waste and plastic waste (PPW) into valuable products and chemicals through experiments and computational work [5]. Currently, there are only a limited number of innovative process integration models have emerged in the United States, Brazil, and certain regions of Europe, and further investigation into their development is necessary [6,7]. Nonetheless, a significant amount of research is being conducted on low-carbon and carbon-neutral technologies [8]. A wide range of waste to energy conversion technologies are available, including gasification, anaerobic digestion, coal-fired boilers, power plants, and biomass-to-ethanol processes (as well as other methods for producing transportation fuels) [9]. Therefore, it is reasonable to inquire about the optimal combination of technologies, biomass types, and their locations that would result in the most efficient (i.e., cost-effective) approach to the expansion of the MSW industry both domestically and internationally. This work aims to formulate an optimization strategy to address these questions.
The process of thermochemical conversion of plastic and waste involves the utilization of a distributed network of fast pyrolyzers to thermally transform biomass into synthesis gas (syngas), bio-oil, and biochar [10]. This approach presents a sustainable means of generating energy from plastics and paper waste, as the syngas produced can provide the energy needed for the pyrolysis process. The resulting bio-oil is a valuable energy source, with a calorific value of approximately 17 MJ/kg, which can be used for heat generation or sent to a refinery for further processing into transportation fuels [11]. However, biochar produced from co-pyrolysis of plastic and wastes can improve soil quality in many ways. It is challenging to define the exact thermochemical conditions due to complex nature and structure of biomass to obtain different products (biofuel, gases, biochar) [12]. It is needed to optimize the co-pyrolysis process of PPW including corn straw, corn stover and barley straw and plastic waste which will help to improve product recovery and energy efficiency through co-pyrolysis and machine learning process.
In the past few decades, numerous studies have focused on optimizing the thermochemical process (pyrolysis, gasification) to produce valuable products (biofuel, biogas and biochar). A few have focused on utilizing biosolids from large industrial and municipal solid waste plants to detoxify the residuals and produce biochar and/or bio-oil simultaneously. In addition, minimal research has been done on co-pyrolysis of biomass and plastic. A recent study has shown that the biochar yield has been improved to 44-49% in co-pyrolysis of biomass and plastic instead of single pyrolysis [13]. However, the synergetic effects of char yield lowered the pyrolysis temperature, when mixing biomass with different ratio (25-50%) of plastic derivatives [14]. Another study focused on different favorable optimization make development temperature ranges of co-pyrolysis of plastic and tires. But more critical aspects of co-pyrolysis are not explored including underlying mechanism, thermo-kinetics, synergetic effects of developing improved mechanistic models to obtain co-pyrolysis products [15]. Likewise, the co-pyrolysis study on truck tires and fruit bunches increased oil yield by 20% as compared to single tire pyrolysis [16]. Furthermore, a recent study quantified the pyrolytic and gaseous products through machine learning approaches [17]. Therefore, using machine learning in the co-pyrolysis process of paper and plastic (MSW) is a novel idea in integrated biorefinery. Therefore, optimization framework for the strategic identification, development and commercialization of bio-based feed stocks for biomaterials, biochemicals and bioenergy will first be developed. The model will seek to provide an understanding of emerging opportunities, and their underlying challenges for solid waste management companies and the applicability of the model will be demonstrated with a case study focusing on new markets for MSW’s operations, integrated analytical framework will be applied to comparing the results with recent literature [18]. However, several barriers [19] for integration of process model must first be identified and recommendations would be provided to develop integrated process models in other parts of Canada by policy makers wishing to facilitate the development of novel biomass or other paper waste in other parts of Canada.
The current study is presenting an exploratory case-study analysis of paper waste and plastic waste (MSW) through process integration to develop biobased production systems. MSW is selected due to its abundance, easy availability whereas plastic derivatives are hard to degrade and combustion is an environment harness. Therefore, it would be important to know the co-pyrolysis behavior of MSW, wherever paper waste is a profuse biological resource while plastic is a detrimental environmental waste. Considering Canada's abundant natural resources, the utilization of lignocellulosic residues obtained from agricultural sources and plastic derivatives as feedstocks presents a favorable opportunity for the development of advanced biofuel and biochar utilization industries [20]. Therefore, it would be worthwhile to produce valuable chemicals and products from MSW handling industry. In upcoming years, with the growing population of Ontario, its crucial to be addressed the proper conversion of these waste materials into useful chemicals and products [21]. The economic feasibility of biobased materials relies on the optimization of their efficiency and the reduction of toxic gas emissions during pyrolysis, gasification, and combustion processes.
A complete range of experimental and simulation analyses were performed including process system engineering, reaction engineering, pyrolysis and co-pyrolysis experiments to obtain useful energy products (bio-oil, gases, biochar) in terms of energy generation and product optimization. Therefore, each pyrolysis product (bio-oil, gases, biochar) recovery will also be optimized through some complex mechanistic models through machine learning and detailed experimental characterization [22]. As a result, it is possible to provide the cheapest solution for the industrialist to adopt our expanded new strategy to contrivance on large-scale reactor modeling. It will also help to determine the overall cost of the process, the rate at which MSW bought from and the financial and environmental benefits. It will also address the loopholes to finalize the co-pyrolysis technology.
2. Materials and Methods
A series of experiments including thermogravimetric analysis, machine learning, pyrolysis, simulation modeling was performed as shown detailed frame work in Figure 1.
2.1. Integration of experimental setup (reactor) with TG-FTIR-GCMS system
The experimental setup was connected, including TGA-FTIR and GCMS to characterize the small amount of the MSW to obtain products and to study the reaction chemistry. For this purpose, a 10mg sample was characterize in a nitrogen environment under the controlled environment at different heating rates (10-40 ℃/min) to study the reaction chemistry and kinetic analysis using different isoconversion models to obtain thermogravimetric parameters including activation energy, pre-exponential factor, enthalpy, entropy and Gibbs free energy. These parameters are stored in the database for future reference and to obtain suitable products based on experimental conditions. The obtained analysis results were stored in the database integrated as a part of process model to analyze the feasibility of the products through lab scale pyrolysis process. The integrated algorithm to obtain the thermodynamic and reaction chemistry was shown in Figure 2.Interventionary studies involving animals or humans, and other studies that require ethical approval, must list the authority that provided approval and the corresponding ethical approval code.
Evaluation of the reaction mechanism underlying biomass degradation is difficult due to the complexity of the chemical makeup of biomass. Kinetic analysis is a useful tool to assess the thermal stability of materials during combustion and pyrolysis. A single-step biomass degradation process is shown in equation Eq. 1 as follows
The instantaneous conversion function α and the pyrolytic temperature have an impact on the rate of the chemical reaction. Consequently, it can be expressed as follows in Eq. 2
Where m0 denotes the initial mass, mt denotes its mass at a certain point in the reaction time (t) and m∞ denotes its mass at the end of the reaction.
The response rate dα/dt, which is a function of α in these processes, can be expressed as follows in Eq. 3
where Eq. 3 is the fundamental kinetic equation for solid-state mass loss processes. In the case of thermally stimulated processes, the Arrhenius equation is frequently used to replace the value of the rate constant k in Eq. (3), which then has the following form
where A is the pre-exponential factor, Eα is the energy of activation, f(α) is the function of the degree of conversion, called the reaction model, and R is the gas constant. In terms of physics, A describes the frequency of collisions between the particles involved in the production of activated complex(es), Eα is the activation energy barrier(s), and f(α) is an expression for the reaction mechanism.
Re-arranging Eq.3
Substituting the constant heating rate (with increasing temperature)
in Eq.5
The term g(α) is the integral expression of the conversion-dependent function, while the term is used in Eq. 6 is the integral of the temperature, which lacks an explicit integral solution. After resolving numerous empirical interpolation equations, several researchers have put forth an approximation of the solution.
Calculations of the KAS, OFW and Starink methods can be established as follows
Thermodynamic parameters in this study, including ΔG, ΔH, and ΔS were determined using the following formulas
where kb is the Boltzmann constant, that has a value of 1.38 × 10⁻²³ J K-1
2.2 Simulation integration in the process model with machine learning
The simulation software results were integrated to obtain suitable products and analysis based on simulation results related to temperature and heating rate conditions. The simulation was used to obtain the gaseous products based on elemental analysis results that also integrated with the process model. ASPEN plus process simulator, a stoichiometric steady-state model was created in order to mimic the process of municipal solid waste. The elemental analysis results of five samples MSW1, MSW2, MSW3, MSW4 and MSW5 were used as input simulated based on our previous studied data [23]. The model was used to study the influence of proximate and ultimate analysis on gasification behavior.
Additionally, it was utilized to break down volatile yields that were produced during the process as shown in Figure 3. The detail mechanism was discussed in next section.
Mathematical Modeling
Equations for Machine Learning:
2.3. Process Model integrated with WTE database
To further power the process model designs a database was integrated in the lab scale reactor. It was integrated with datasets obtained from experimental, simulation and literature data related to temperature profiles, mass degradation pattern, heating rates and product analysis based on similar waste samples. It gave information regarding mass degradation pattern at different heating rates and temperature ranges that can further validated through our experimental setup values as shown in Figure 4.
2.4 Life cycle analysis (LCA)
Here we will check the sustainability of the MSW that will benefit in accusation of raw material and ecological damage. The primary purpose of this objective is to estimate the sustainability of product using cost analysis with environmental impact assessment. The Process have been taken from ELCD European database to study the LCA based on CML 2001 ecoinvent method to study the 1000 kg of reactor as if we increase the capacity of the reaction the emission will increase with the same ratio with capacity of the reactor.
LCC = IC +ESPWF (Cost energy + Cost main)
LCC = Life cycle Cost
IC: Initial Cost
ESPWF: Equal Series Present Worth Factors
3. Results and Discussion
3.1. Integration of thermal analysis
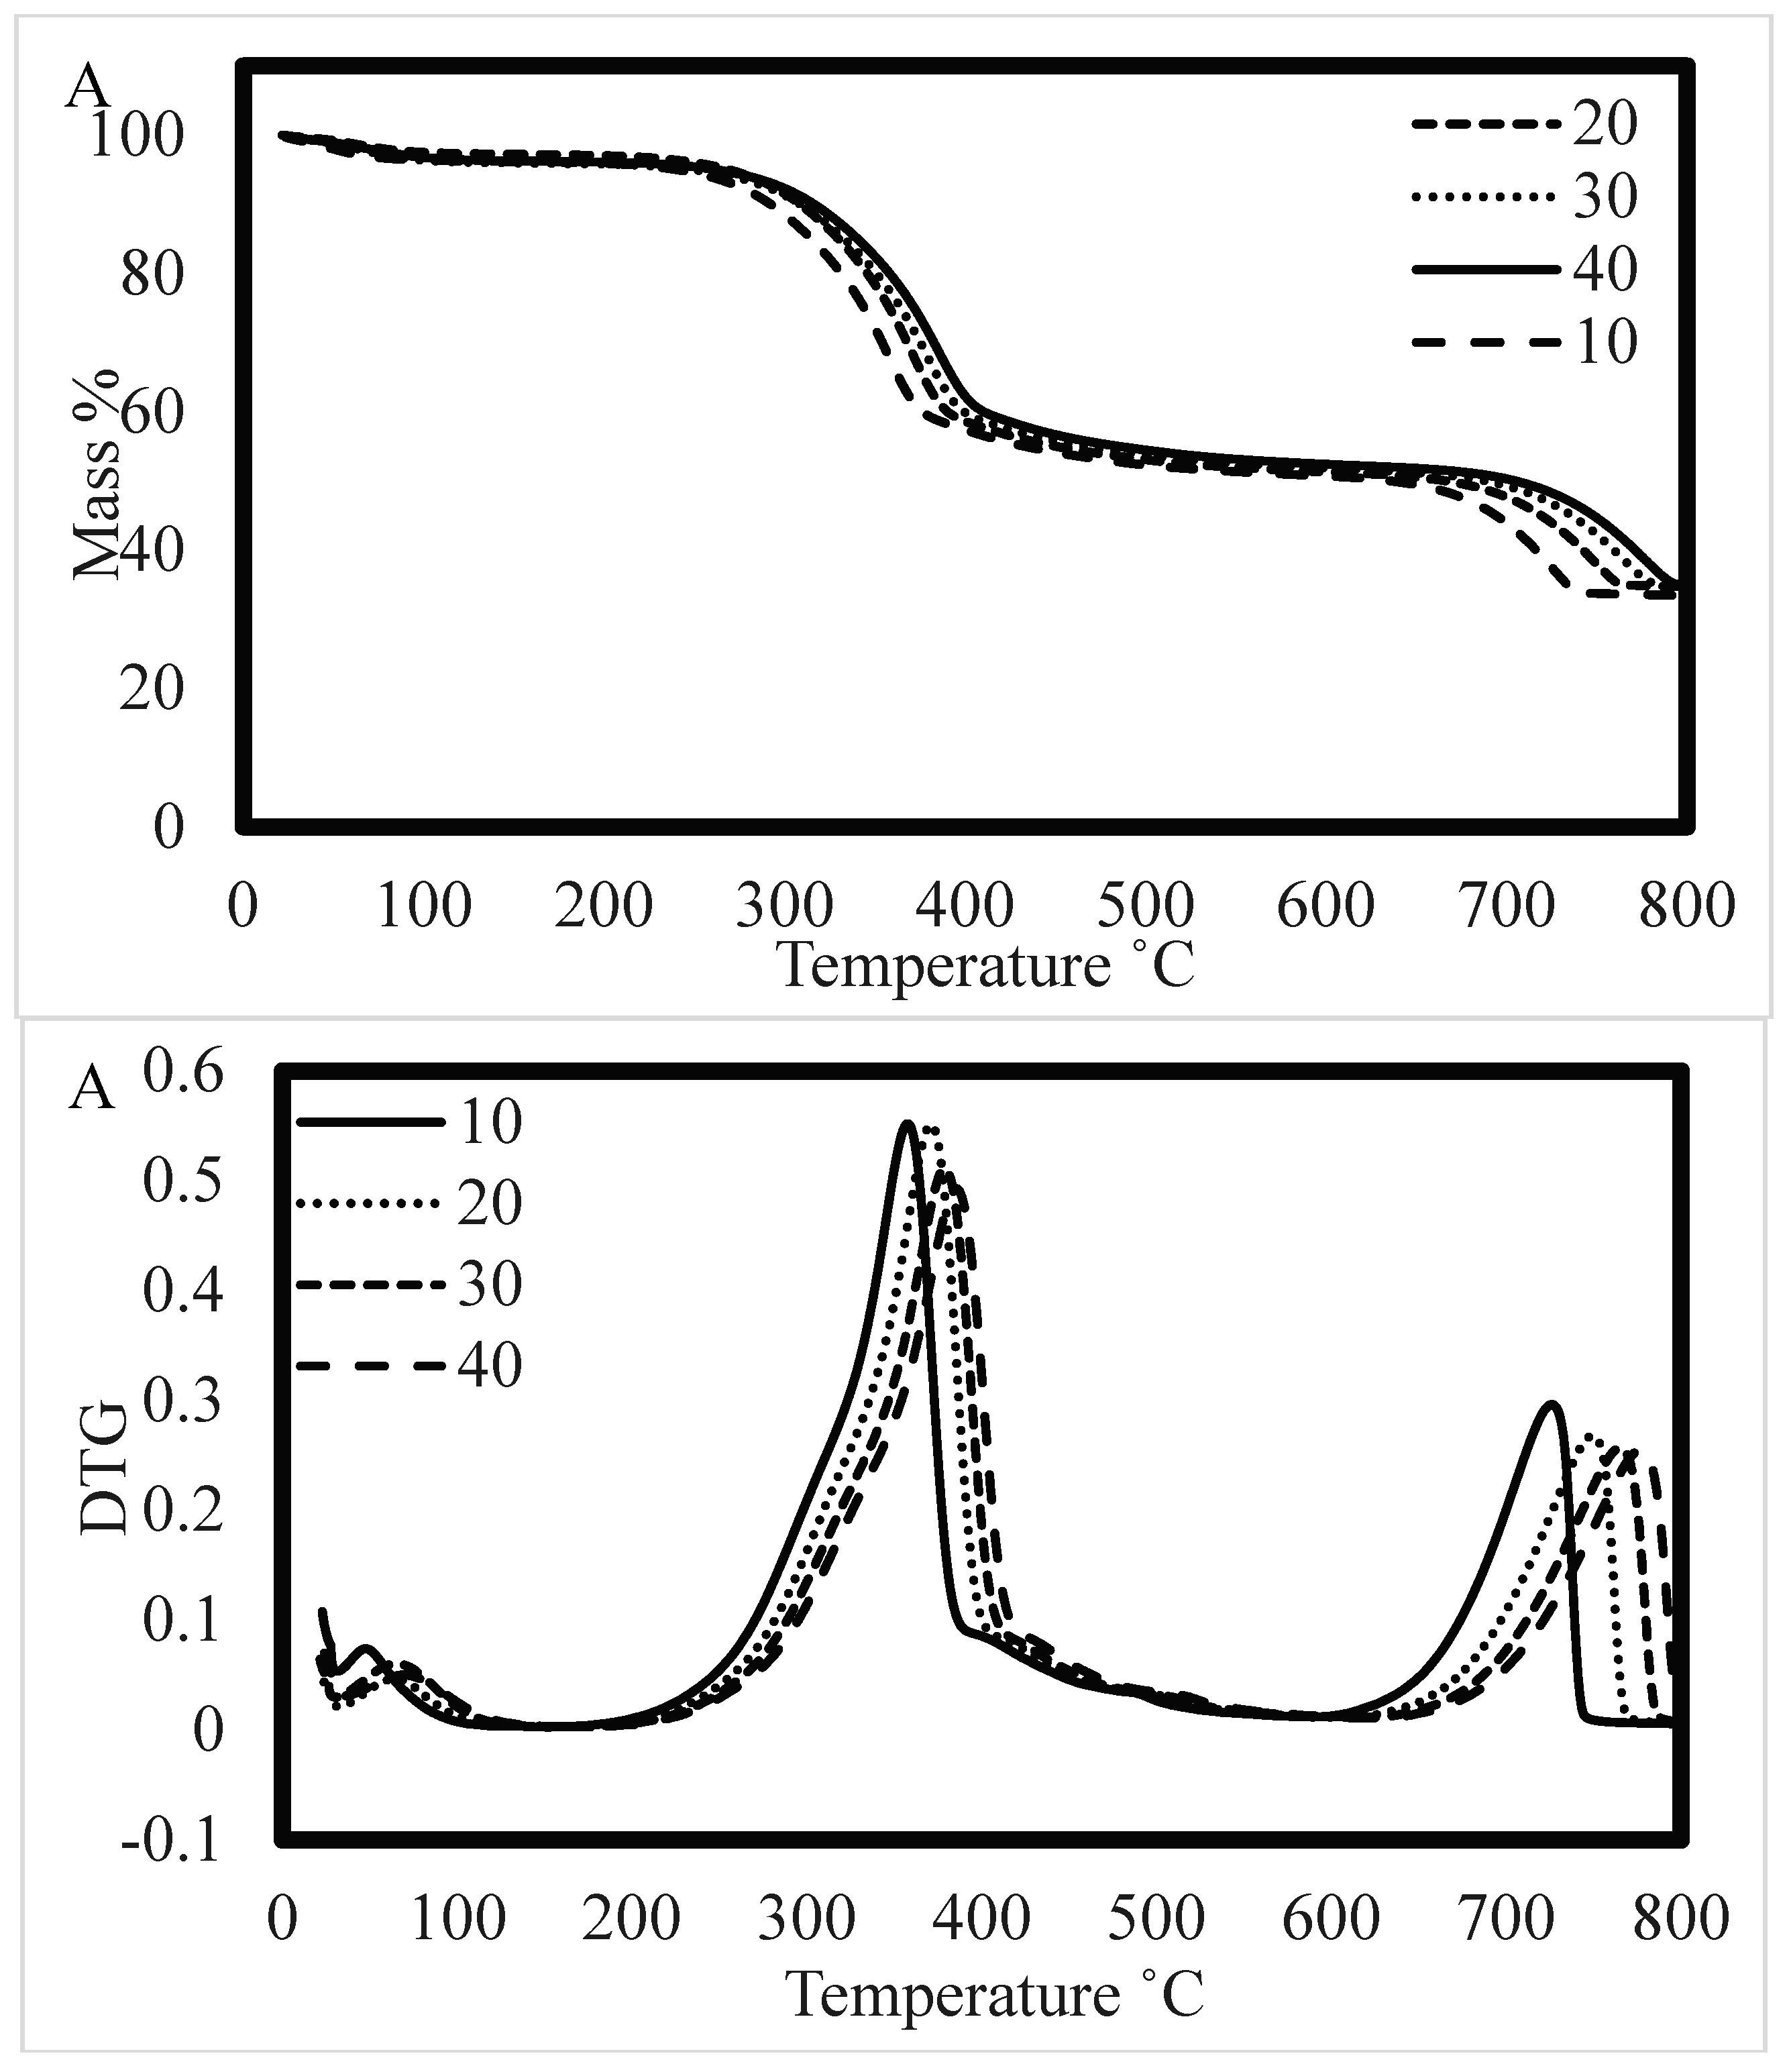
The thermal analysis was performed to obtain degradation pattern, temperature profiles and kinetic analysis to integrate in the process design to optimize conditions for various products. The thermal behavior of MSW was evaluated at four different heating rates (10, 20, 30 and 40 ℃/min). Thermogravimetry (TG-DTG) revealed that mass in continuously being lost, as the temperature is increased. Different stages of mass loss were observed from the TG-DTG curves of the model compounds namely cellulose, hemicellulose and lignin XX. Hemicellulose and lignin depict two major peaks because of the presence of light as well as heavy chemicals in their intricately branched structures. On the other hand, only one main peak has been observed for cellulose owing to its structure, that is in good order and free of branches. Because of this, hemicellulose and lignin can be combusted at a variety of temperatures. During the degradation reaction, dehydration occurs at temperatures below 140 ℃, followed by the decomposition of the organic components (Figure 5A). Hemicellulose, cellulose, and lignin were decomposed at temperatures between 180 ℃ to 330 ℃, 330 ℃ to 490 ℃, and 180 ℃ to 800 ℃ respectively [24].
The rate of heating (β) has a substantial impact on the rate of breakdown, total weight loss, and the temperature at which the highest weight loss occurs (DTGmax). When the heating rate was increased, a higher rate of biomass decomposition was observed, causing the DTGmax peaks to move toward the higher temperature region (Figure 5B), which is attributed to the poor conductivity of the biomass. Therefore, a higher heating rate results in a shorter residence time for heat transmission and a higher temperature need to break down organic matter [25]. Interestingly, here in the cellulose breakdown predominated (300-361 ℃) with DTGmax peak centered at 273 ℃, 276 ℃, 279 ℃ and 281 ℃ at 10 ℃/min, 20 ℃/min, 30 ℃/min and 40 ℃/min.. The weight loss was found to be 18 %, 17 %, 18% and 18 % at heating rates of 10 ℃/min, 20 ℃/min, 30 ℃/min and 40 ℃/min. The phenomenon of degradation pattern and temperature associated with each stage is shown in Table 1(A & B). It is obvious that a reaction rate depends primarily on the temperature of the reacting particles, with higher temperatures causing faster reactions with a lower reaction time, thus subsequently increasing the surface temperature. However, biomass almost approaches thermal equilibrium due to lower heating rates and prolonged thermal energy supply [26]. Thus, the maximum decomposition is shifted to an area of high temperature as a result of a high heating rate. Interestingly, increased gas production is made possible by rapid degradation of biomass components and breakdown of more volatile elements; therefore, a lower residue and a higher devolatilization rate were obtained, while at a slower heating rate, secondary reactions that include re-polymerization and re-condensation had been reported to produce more tar/char, thus reducing the weight loss of biomass samples XX [27]. Furthermore, pyrolytic decomposition of biomass components occurs individually at a lower heating rate, while the immediate reaction causes the disintegration of various components concurrently at a higher heating rate.
Furthermore, thermal data obtained from TGA experiment were directly stored in the integrated process model for lab scale reactor for product optimization and control based on temperature ranges, mass degradation pattern and heating rates.
Figure 5.
(A & B): (A) Thermogravimetric Curves of MSW sample at different heating rates, (B) Differential thermogravimetric curves for MSW sample at four heating rates.
Figure 5.
(A & B): (A) Thermogravimetric Curves of MSW sample at different heating rates, (B) Differential thermogravimetric curves for MSW sample at four heating rates.
3.1.1. Kinetic Analysis
The activation energy (Ea) of the MSW at 10, 20, 30 and 40 ℃/min was investigated using Friedman, FWO and KAS methods. The reaction was carried out under slow pyrolysis conditions with non-isothermal heating, which helps to estimate kinetic parameters using thermogravimetry, making it easy to obtain temperature-resolved measurements over an extended period. Calculations of the kinetic parameters were made for conversion values ranging from 0.2 to 0.8 and activation energies were calculated using the slopes. For conversion of 0.1, the regression coefficient has a very low; thus it is considered negligible, and therefore ignored [28]. For all models, smooth fits were achieved and for various conversion fractions, the estimated Ea values and R2 are shown in Table 2. During pyrolysis, it was observed that the Ea values ranged from 132-243 kJ mol-1 when using the OFW technique, 123-227 kJ mol-1 when using the KAS model and 123-224 kJ mol-1 when using the Starink. Variation in Ea with conversion values (Figure 6A) indicates that the pyrolysis of MSW involves a parallel, multi-step devolatilization reaction pathway XX. The mean Ea values were found to be 185 kJ mol-1, 172 kJ mol-1, and 173 kJ mol-1 by OFW, KAS and Starink moldes. The comparison of each activation energy at continuous increase with conversion point (α) is shown in Figure 6A. The linear plots of Friedman, OFW, and KAS with a small correlation factor suggest the accuracy of the Ea recorded from the experimental data. The results obtained from kinetic model were integrated in a database to optimize the efficiency of reaction chemistry that directly linked with the production of biochar, biofuel and gaseous products.
3.1.2. Thermodynamic Analysis
In an inert environment, various thermodynamic state variables including enthalpy (ΔH) and Gibbs free energy (ΔG) have been calculated using the kinetic parameters derived from OFW model-free method, as shown in Table 1. These parameters are critical in the design of the pyrolysis reactor [29]. The differences in energy levels that are observed between the reactants and activated complexes, as well as the quantity of energy required for the dissociation of chemical bonds, are referred to as ΔH. In this work, the mean ΔH value was recorded as 178 kJ mol-1, 166 kJ mol-1 and 166 kJ mol-1. The comparison of ΔH with conversion point (α) is shown in Figure 6B. The positive ΔH values confirmed that the EG undergoes endothermic reactions during thermal breakdown. For the each value of conversion, the minimal difference between the ΔH and Ea demonstrates the reaction's feasibility under current conditions and the fact that the chemical reactions can begin right away [30]. The reaction mechanism lies as Fn with multiple reactions because of the complex nature of the material as shown in Figure 7. However, keeping in view the first and second laws of thermodynamics, the change in the Gibbs free energy ΔG indicates the overall increase in energy of the system and the tendency of the reaction to occur in a particular direction. The results showed increasing trends in the ΔG for conversion values (0.2 to 0.8) that confirms the suitability for co-pyrolysis and co-gasification. More importantly, it is observed that throughout the whole reaction, a relatively constant energy output is yielded. ΔS of a system measure how, disorderly it is and how close it is to thermodynamic equilibrium. The results showed decreasing trends in the ΔS for the conversion values (0.2-0.75) that tends the system moves toward thermodynamic equilibrium by employing physical and chemical processes [31]. This may be attributed to the complex nature of biomass, so properties are difficult predicted.
Figure 6.
(A & B): (A)The comparison of each Activation Energy at continuous increase with conversion point (α) for different kinetic models and (B) The comparison of each change in Enthalpy (ΔH) at continuous increase with conversion point (α) for different kinetic models
Figure 6.
(A & B): (A)The comparison of each Activation Energy at continuous increase with conversion point (α) for different kinetic models and (B) The comparison of each change in Enthalpy (ΔH) at continuous increase with conversion point (α) for different kinetic models
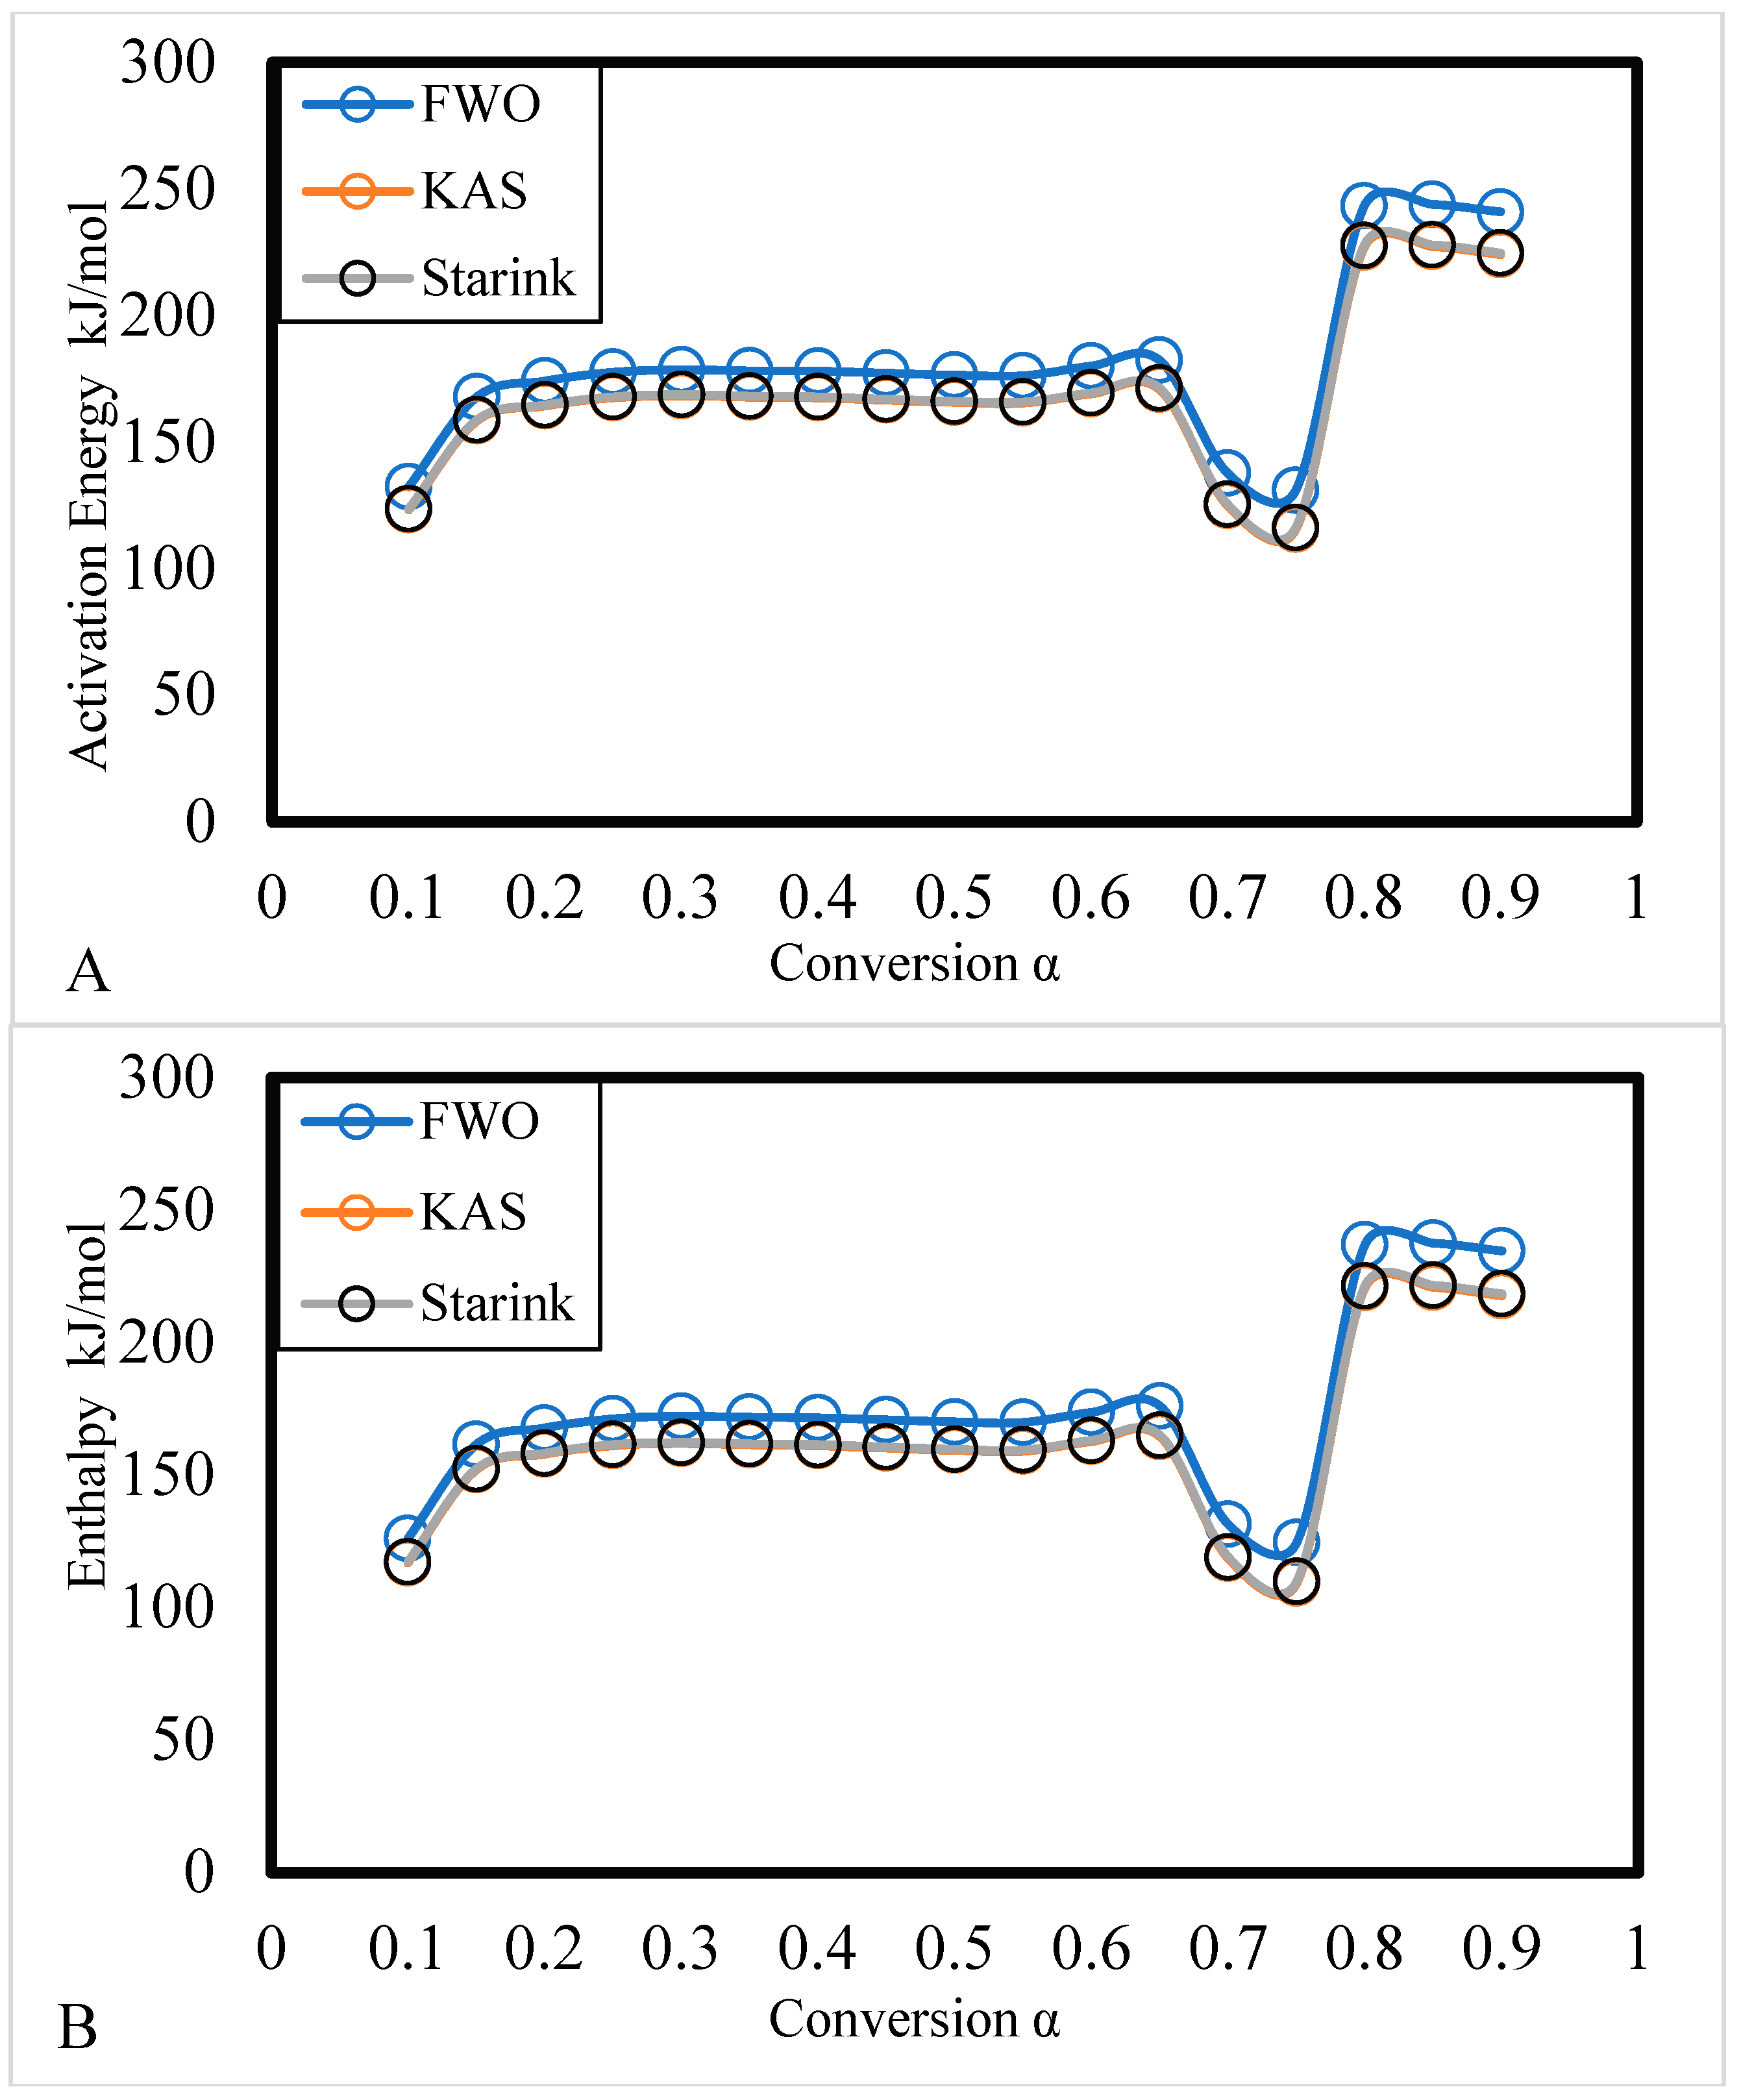
Figure 7.
Reaction mechanism of the MSW using reaction kinetics.
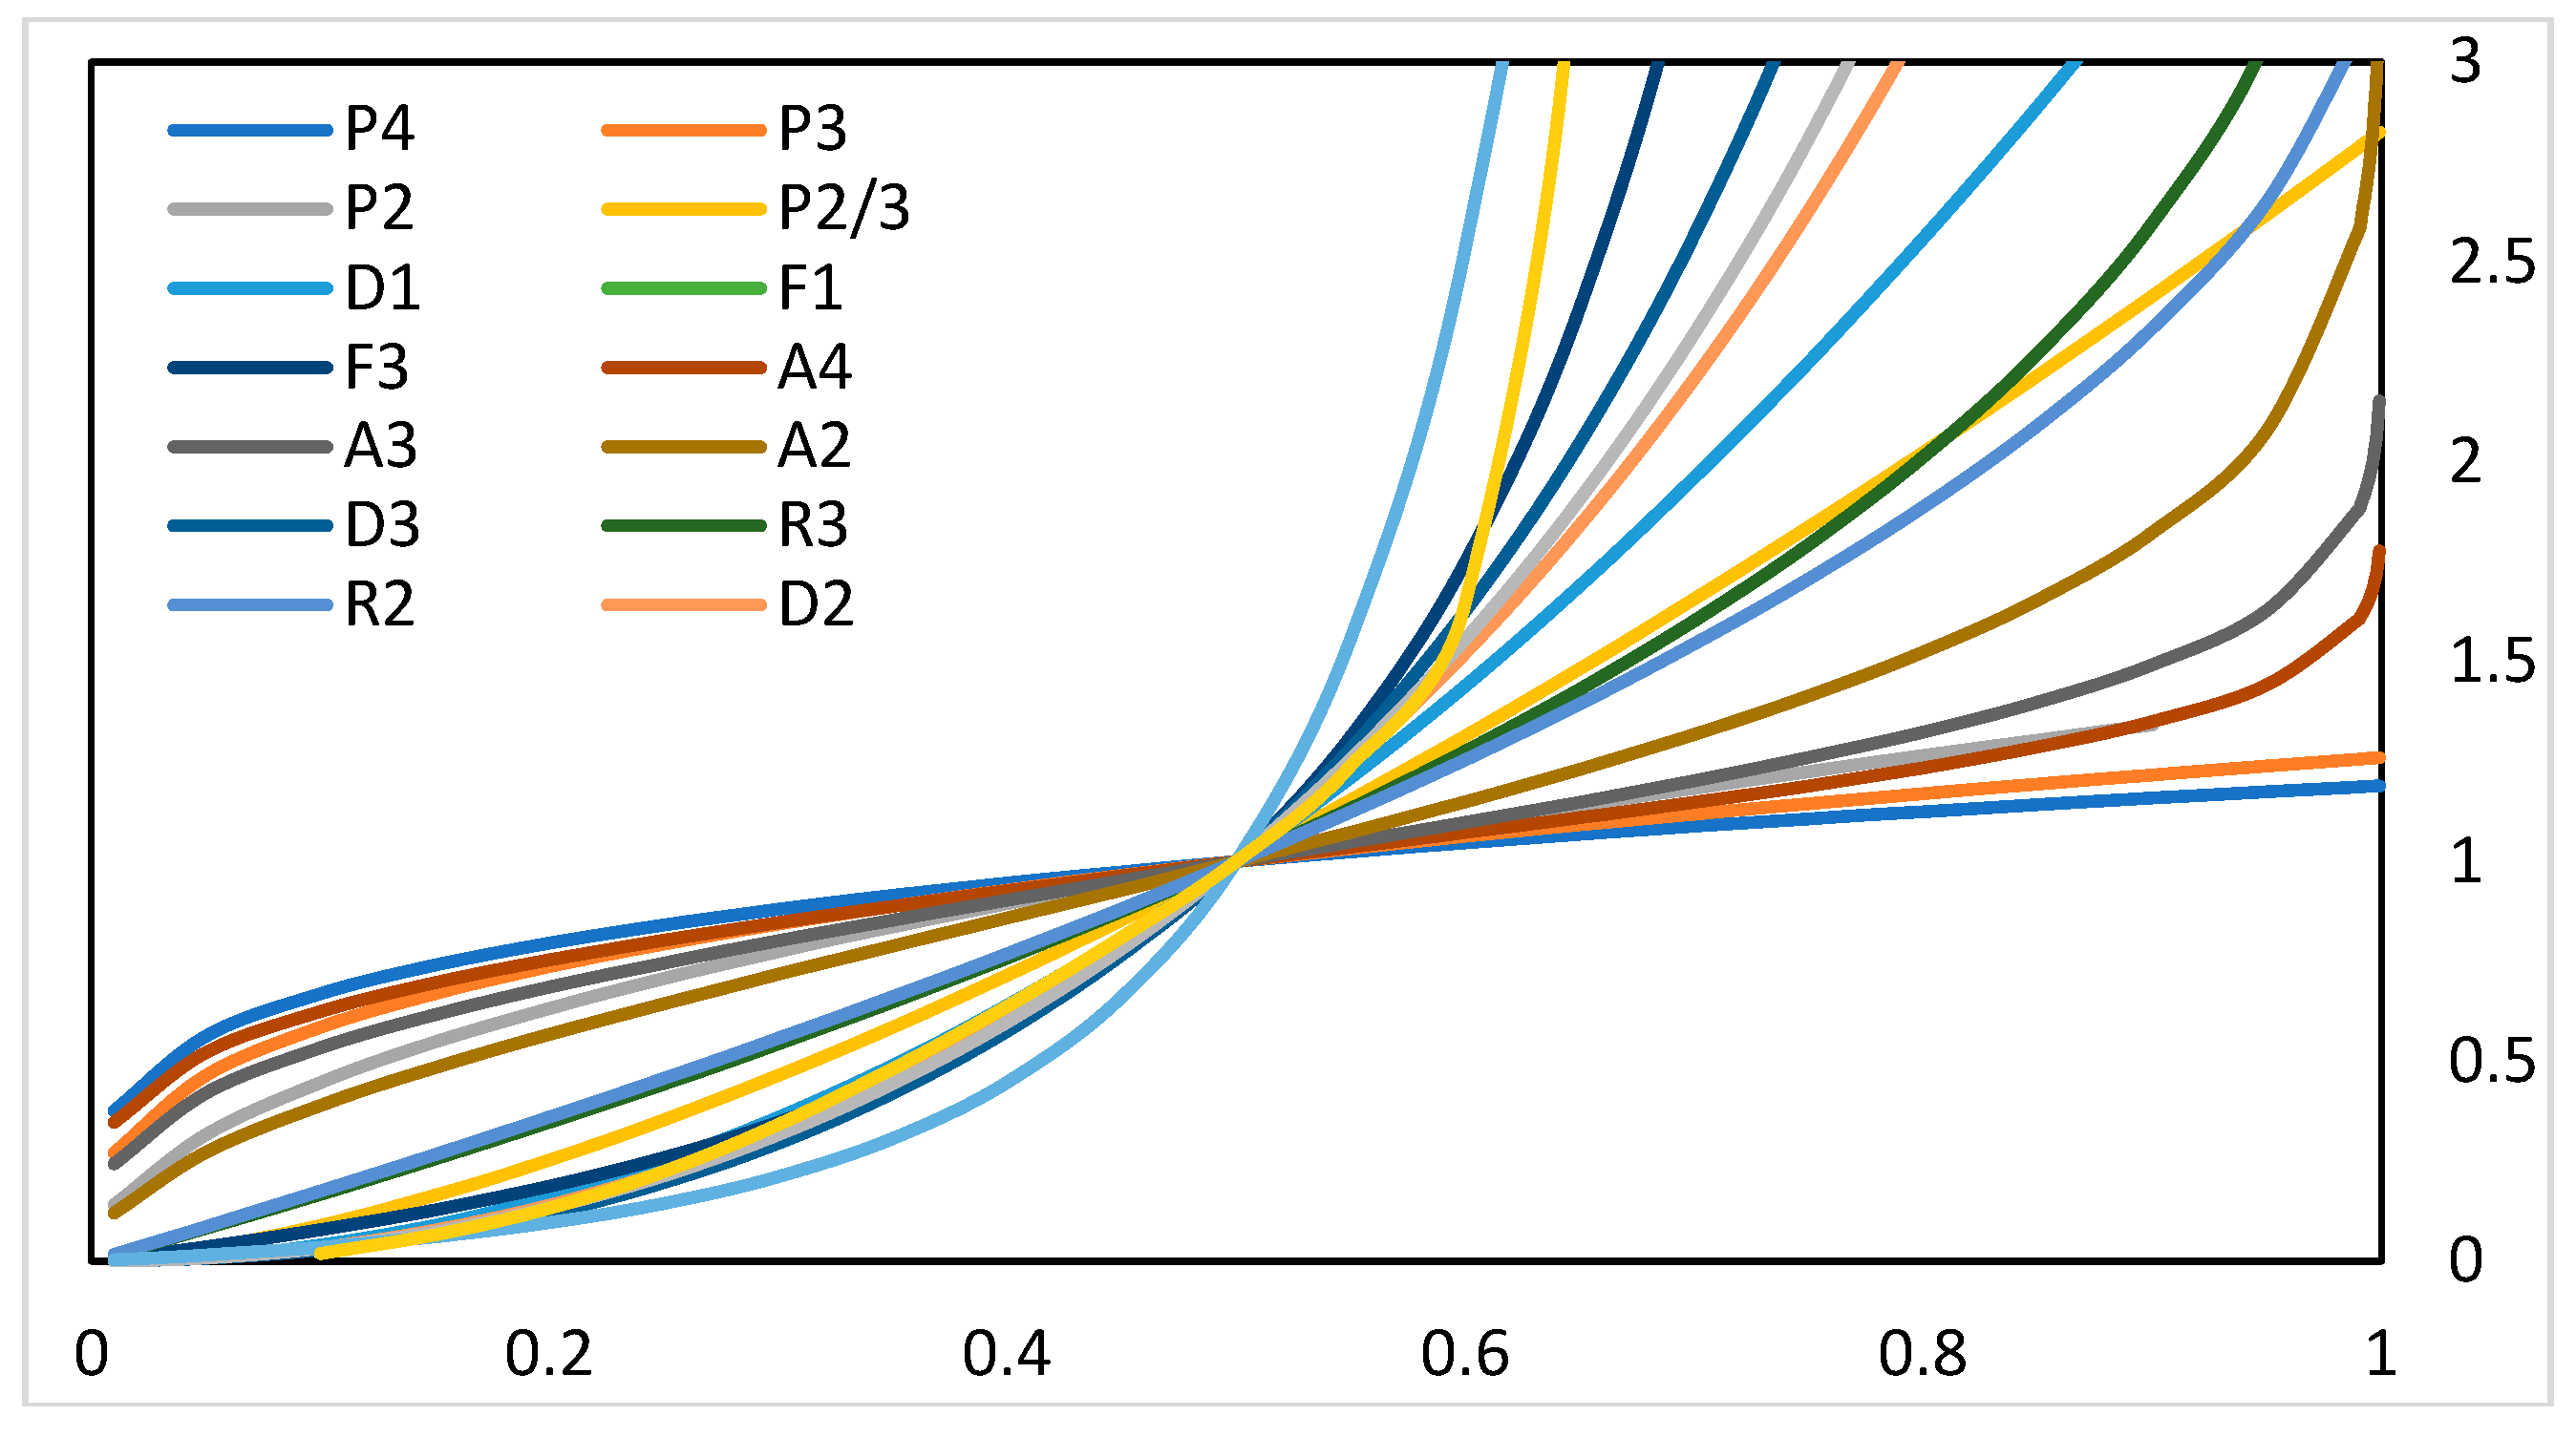

Table 1.
The thermodynamic parameters with continuous increase of conversion (α) with all kinetic models.
Table 1.
The thermodynamic parameters with continuous increase of conversion (α) with all kinetic models.
| Alpha | Activation Energy (E) kJ/mol | Pre-exponential factor (A) | R2 | Enthalpy (∆H) kJ/mol |
Gibbs Free Energy (∆G) kJ/mol |
Entropy (∆S) J/mol |
| FWO Model | ||||||
| .10 | 132.37 | 3.52E+97 | 0.68 | 126.02 | -1099.63 | 1606.35 |
| .15 | 167.92 | 2.54E+124 | 0.91 | 161.57 | -1456.38 | 2120.52 |
| .20 | 174.11 | 1.20E+129 | 0.96 | 167.77 | -1518.50 | 2210.04 |
| .25 | 177.56 | 4.84E+131 | 0.98 | 171.21 | -1553.09 | 2259.90 |
| .30 | 178.55 | 2.73E+132 | 0.99 | 172.21 | -1563.06 | 2274.27 |
| .35 | 178.17 | 1.40E+132 | 0.99 | 171.82 | -1559.20 | 2268.71 |
| .40 | 177.97 | 1.00E+132 | 1.00 | 171.63 | -1557.27 | 2265.93 |
| .45 | 177.19 | 2.55E+131 | 1.00 | 170.84 | -1549.39 | 2254.56 |
| .50 | 176.44 | 6.93E+130 | 0.99 | 170.10 | -1541.88 | 2243.74 |
| .55 | 176.26 | 5.05E+130 | 0.99 | 169.91 | -1540.05 | 2241.10 |
| .60 | 180.04 | 3.63E+133 | 0.98 | 173.70 | -1578.00 | 2295.80 |
| .65 | 182.40 | 2.20E+135 | 0.81 | 176.05 | -1601.66 | 2329.90 |
| .70 | 137.77 | 4.24E+101 | 0.61 | 131.42 | -1153.84 | 1684.49 |
| .75 | 130.94 | 2.95E+96 | 0.55 | 124.60 | -1085.32 | 1585.73 |
| .80 | 243.30 | 2.25E+181 | 0.98 | 236.96 | -2212.82 | 3210.72 |
| .85 | 243.87 | 6.02E+181 | 0.99 | 237.52 | -2218.49 | 3218.89 |
| .90 | 240.91 | 3.48E+179 | 1.00 | 234.56 | -2188.76 | 3176.04 |
| 185.03 | 178.69 | -1628.09 | 2367.99 | |||
| KAS Model | ||||||
| .10 | 123.22 | 4.33E+90 | 0.65 | 116.88 | -1007.85 | 1474.086 |
| .15 | 158.35 | 1.49E+117 | 0.90 | 152.00 | -1360.35 | 1982.111 |
| .20 | 164.26 | 4.39E+121 | 0.95 | 157.92 | -1419.70 | 2067.653 |
| .25 | 167.49 | 1.21E+124 | 0.98 | 161.15 | -1452.10 | 2114.354 |
| .30 | 168.30 | 4.95E+124 | 0.99 | 161.96 | -1460.24 | 2126.075 |
| .35 | 167.76 | 1.93E+124 | 0.99 | 161.42 | -1454.82 | 2118.263 |
| .40 | 167.44 | 1.11E+124 | 0.99 | 161.10 | -1451.60 | 2113.624 |
| .45 | 166.55 | 2.32E+123 | 1.00 | 160.20 | -1442.59 | 2100.643 |
| .50 | 165.69 | 5.26E+122 | 0.99 | 159.35 | -1434.02 | 2088.298 |
| .55 | 165.40 | 3.15E+122 | 0.99 | 159.05 | -1431.07 | 2084.034 |
| .60 | 169.01 | 1.70E+125 | 0.98 | 162.67 | -1467.36 | 2136.338 |
| .65 | 170.84 | 4.09E+126 | 0.79 | 164.50 | -1485.71 | 2162.784 |
| .70 | 124.87 | 7.69E+91 | 0.56 | 118.53 | -1024.44 | 1498 |
| .75 | 115.57 | 7.19E+84 | 0.48 | 109.22 | -931.07 | 1363.429 |
| .80 | 227.05 | 1.18E+169 | 0.98 | 220.70 | -2049.68 | 2975.598 |
| .85 | 227.27 | 1.73E+169 | 0.99 | 220.92 | -2051.91 | 2978.817 |
| .90 | 224.06 | 6.58E+166 | 1.00 | 217.72 | -2019.76 | 2932.471 |
| 172.77 | 166.43 | -1505.07 | 2190.69 | |||
| Starink Model | ||||||
| .10 | 123.59 | 8.19E+90 | 0.65 | 117.24 | -1011.52 | 1479.38 |
| .15 | 158.73 | 2.91E+117 | 0.91 | 152.39 | -1364.19 | 1987.65 |
| .20 | 164.66 | 8.72E+121 | 0.96 | 158.31 | -1423.65 | 2073.35 |
| .25 | 167.90 | 2.43E+124 | 0.98 | 161.55 | -1456.14 | 2120.18 |
| .30 | 168.71 | 1.01E+125 | 0.99 | 162.37 | -1464.35 | 2132.00 |
| .35 | 168.18 | 3.99E+124 | 0.99 | 161.84 | -1458.99 | 2124.28 |
| .40 | 167.86 | 2.30E+124 | 0.99 | 161.52 | -1455.82 | 2119.72 |
| .45 | 166.97 | 4.87E+123 | 1.00 | 160.63 | -1446.86 | 2106.80 |
| .50 | 166.12 | 1.11E+123 | 0.99 | 159.78 | -1438.34 | 2094.52 |
| .55 | 165.83 | 6.71E+122 | 0.99 | 159.49 | -1435.42 | 2090.32 |
| .60 | 169.45 | 3.66E+125 | 0.98 | 163.11 | -1471.78 | 2142.72 |
| .65 | 171.30 | 9.15E+126 | 0.79 | 164.96 | -1490.34 | 2169.47 |
| .70 | 125.39 | 1.89E+92 | 0.56 | 119.05 | -1029.62 | 1505.46 |
| .75 | 116.18 | 2.09E+85 | 0.49 | 109.84 | -937.24 | 1372.32 |
| .80 | 227.70 | 3.65E+169 | 0.98 | 221.35 | -2056.21 | 2985.00 |
| .85 | 227.93 | 5.50E+169 | 0.99 | 221.59 | -2058.58 | 2988.42 |
| .90 | 224.74 | 2.12E+167 | 1.00 | 218.39 | -2026.52 | 2942.21 |
| 173.26 | 166.92 | -1509.99 | 2197.78 | |||
3.2. Simulation and comparison of experimental vs model results
Several product species have been discovered through the thermochemical process, the previous results showed the feasibility of the process is comparable with already studied municipal waste samples. The CO concentration is higher as compared to other gaseous products, but if we compare CO2 with already studies waste samples are also feasible in the gasification experimental data in recent years. The CO is higher when compared to PE, PP and PC at 750 ℃ but same when we compare with waste polythene [32]. When it was compared with H2 is lower in PE and PP studied by Cao et al [33] but it is almost comparable in recent studied by Dogu et al [34]. However, CO2 percentage is high as compared to polythene bags [35] but lower as compared to Cao et al experimental work related to gasification [33] gasification is almost same when compared to experimental gasification of general plastic waste [36]. On the basis of these results, It can be predicted the reactor model showed prominent results when compared with experimental data in recent years as shown in Table 2.
Table 2.
Comparison of Experimental and Simulated Results.
| Feedstock | Gasification | H2 | CO2 | CH4 | CO | C2H4 | C2H6 | Reference |
|---|---|---|---|---|---|---|---|---|
| PE (polyethylene) | 750 C | 41.67 | 20.77 | 30.22 | 1.14 | 1.35 | 4.86 | [33] |
| PP (polypropylene) | 750 C | 36.99 | 27.82 | 26.57 | 1.68 | 0.86 | 6.08 | [33] |
| PC (polycarbonate) | 750 C | 36.35 | 36.80 | 23.19 | 2.34 | 0.27 | 1.06 | [33] |
| Plastic Waste | 650 – 1100 C | 64 | 4-6 | 3.30 | 25.7 | [36] | ||
| Plastic Waste (polyethylene box used for fruit packing) |
850 C – 1100 C | 40.86 | 0.37 | 9.10 | 0.1 | C3H8 (12.8) |
28 | [35] |
| thermoset-insulated wire and cable waste was investigated | 750 C (10-14 L in 20 g waste) |
4-7 | 10-13 | 7-13 | [37] | |||
| waste polyethylene | 700 C to 900 C | 16-36 | 35-20 | 21-9 | 20-27 | 3-4 | 2 | [32] |
| PE | 740 (Pyro) | 0.8 | 4.2 | 11.4 | 7.3 | [34] | ||
| PP | 760 (Pyro) | 0.7 | 4.8 | 6.6 | 6.4 | [34] | ||
| MSW1 | 750 | 0.46 | 3.3 | 0.03 | 21.67 | Simulation Work | ||
| MSW2 | 750 | 0.72 | 3.71 | 0.06 | 19.67 | Simulation Work | ||
| MSW3 | 750 | 0.57 | 4.86 | 0.03 | 32.78 | Simulation Work | ||
| MSW4 | 750 | 0.39 | 3.22 | 0.05 | 20.54 | Simulation Work | ||
| MSW5 | 750 | 0.42 | 4.51 | 0.02 | 24.89 | Simulation Work |
3.3. Integration of characteristics temperature profiles with degradation stages
The mass loss curves provide insights into the physical and chemical transformations that occur when MSW is thermally converted into various products [38,39]. Thermogravimetric analysis is commonly employed to quantify the percentage of mass loss in a sample as a function of pyrolysis temperature. In this study, the mass loss percentage of MSW was examined at different heating rates ranging from 5 to 50 ℃ min-1. Interestingly, the results indicated that the heating rate did not significantly impact the mass loss percentage. The curves displayed a typical pattern of degradation observed in lignocellulosic MSW, which is comparable to the DTG curves obtained from the pyrolysis of various waste material, including Delonix regia, food waste using leachate, potato stalk and peanut shell [27,40,41,42].
Based on literature search the samples with plastic and paper showed the same trends with TGA analysis. The mass loss can be classified into three stages, followed by a long tail, the initial stage began at room temperature and extended to a certain temperature. to 110 ℃ - 120 ℃ for moisture removal, second stage occurred with a major degradation pattern to degrade cellulose, hemicellulose and some lignin components that ranged from 120 ℃ to 450 ℃ - 520 ℃ for all observed plastic and paper samples [23,43,44,45,46,47,48,49,50]. Table 3 and Table 4 demonstrated the reaction chemistry and activation energy of plastic with temperature profiles that can be used for process optimization.
3.4. Machine learning integration
The data set for ML models including Artificial Neural Networks ANN, Advance regression trees were taken from already built datasets related to plastic pyrolysis. Using machine learning ML models, this model accurately predicted biochar outputs from the co-pyrolysis of Plastic and biomass based on ultimate and proximate analysis results. It was discovered that SANN and C &RT in predicting biomass and plastics co-pyrolysis yields. The research in the scientific literature that employed machine learning techniques do not compare their outcomes to those of conventional models. The model outcomes provide a way for identifying the influence of characteristics on the prediction of bio-char and yields from the co-pyrolysis of biomass and plastics. The data could also assist in forecasting gas outputs from biomass and plastics co-pyrolysis.
Figure 7 (A-D) depicted the mean values of the features used to train biochar data, in order to forecast yields using proximate and elemental analysis. For machine learning analysis, the top six training features proved to have a considerable impact on yield prediction, whilst other features had a small effect. With mean absolute values of 3.88 and 6.47, respectively, the weight percent of polymers in the mixture was shown to have a substantial effect on the accuracy of biochar and bio-oil model predictions. This is also evident in the effect of w% P on the prediction: a high value led to a low biochar yield; more plastic in the feedstock led to a higher liquid yield and a lower char yield. Fixed carbon in biomass influences char production; at all pyrolysis temperatures, the presence of more fixed carbon increases char formation. With a mean value of 2.47, the ML analysis indicated that fixed carbon was the second most influential factor in predicting biochar output. The similar conclusion was suggested by the effect of fixed carbon. Co-pyrolysis produced greater solid residue from biomass containing more fixed carbon.
Using machine learning, this work accurately predicted biochar yields from the co-pyrolysis of biomass and plastics based on feedstock properties, reaction conditions, and plastic feed quantities. models. It was discovered that dense neural network models excel at predicting biomass and plastics co-pyrolysis yields. The optimization of hyperparameters and the incorporation of proximate analysis into the features enhanced forecasts for bio-oil substantially. In light of the effect of parameters driving the synthesis of biochar, SHAP analysis has helped us comprehend the pyrolysis of biomass and plastics.
There are some latest studies that showed our model is better as compared to already studied ML models. Praporn predicted the model using XBoost for synergistic effect of co-pyrolysis of plastic that is < 90% accuracy [52]. Similarly, Zhu et al predicted the biochar percent using machine learning models with accuracy of =85% with experimental data. Additionally, biooil predicted model was made with accuracy of RMSE 92% by Tang et al [53].
Figure 7.
ML Models Biochar Yield, Histogram and C& RT model.
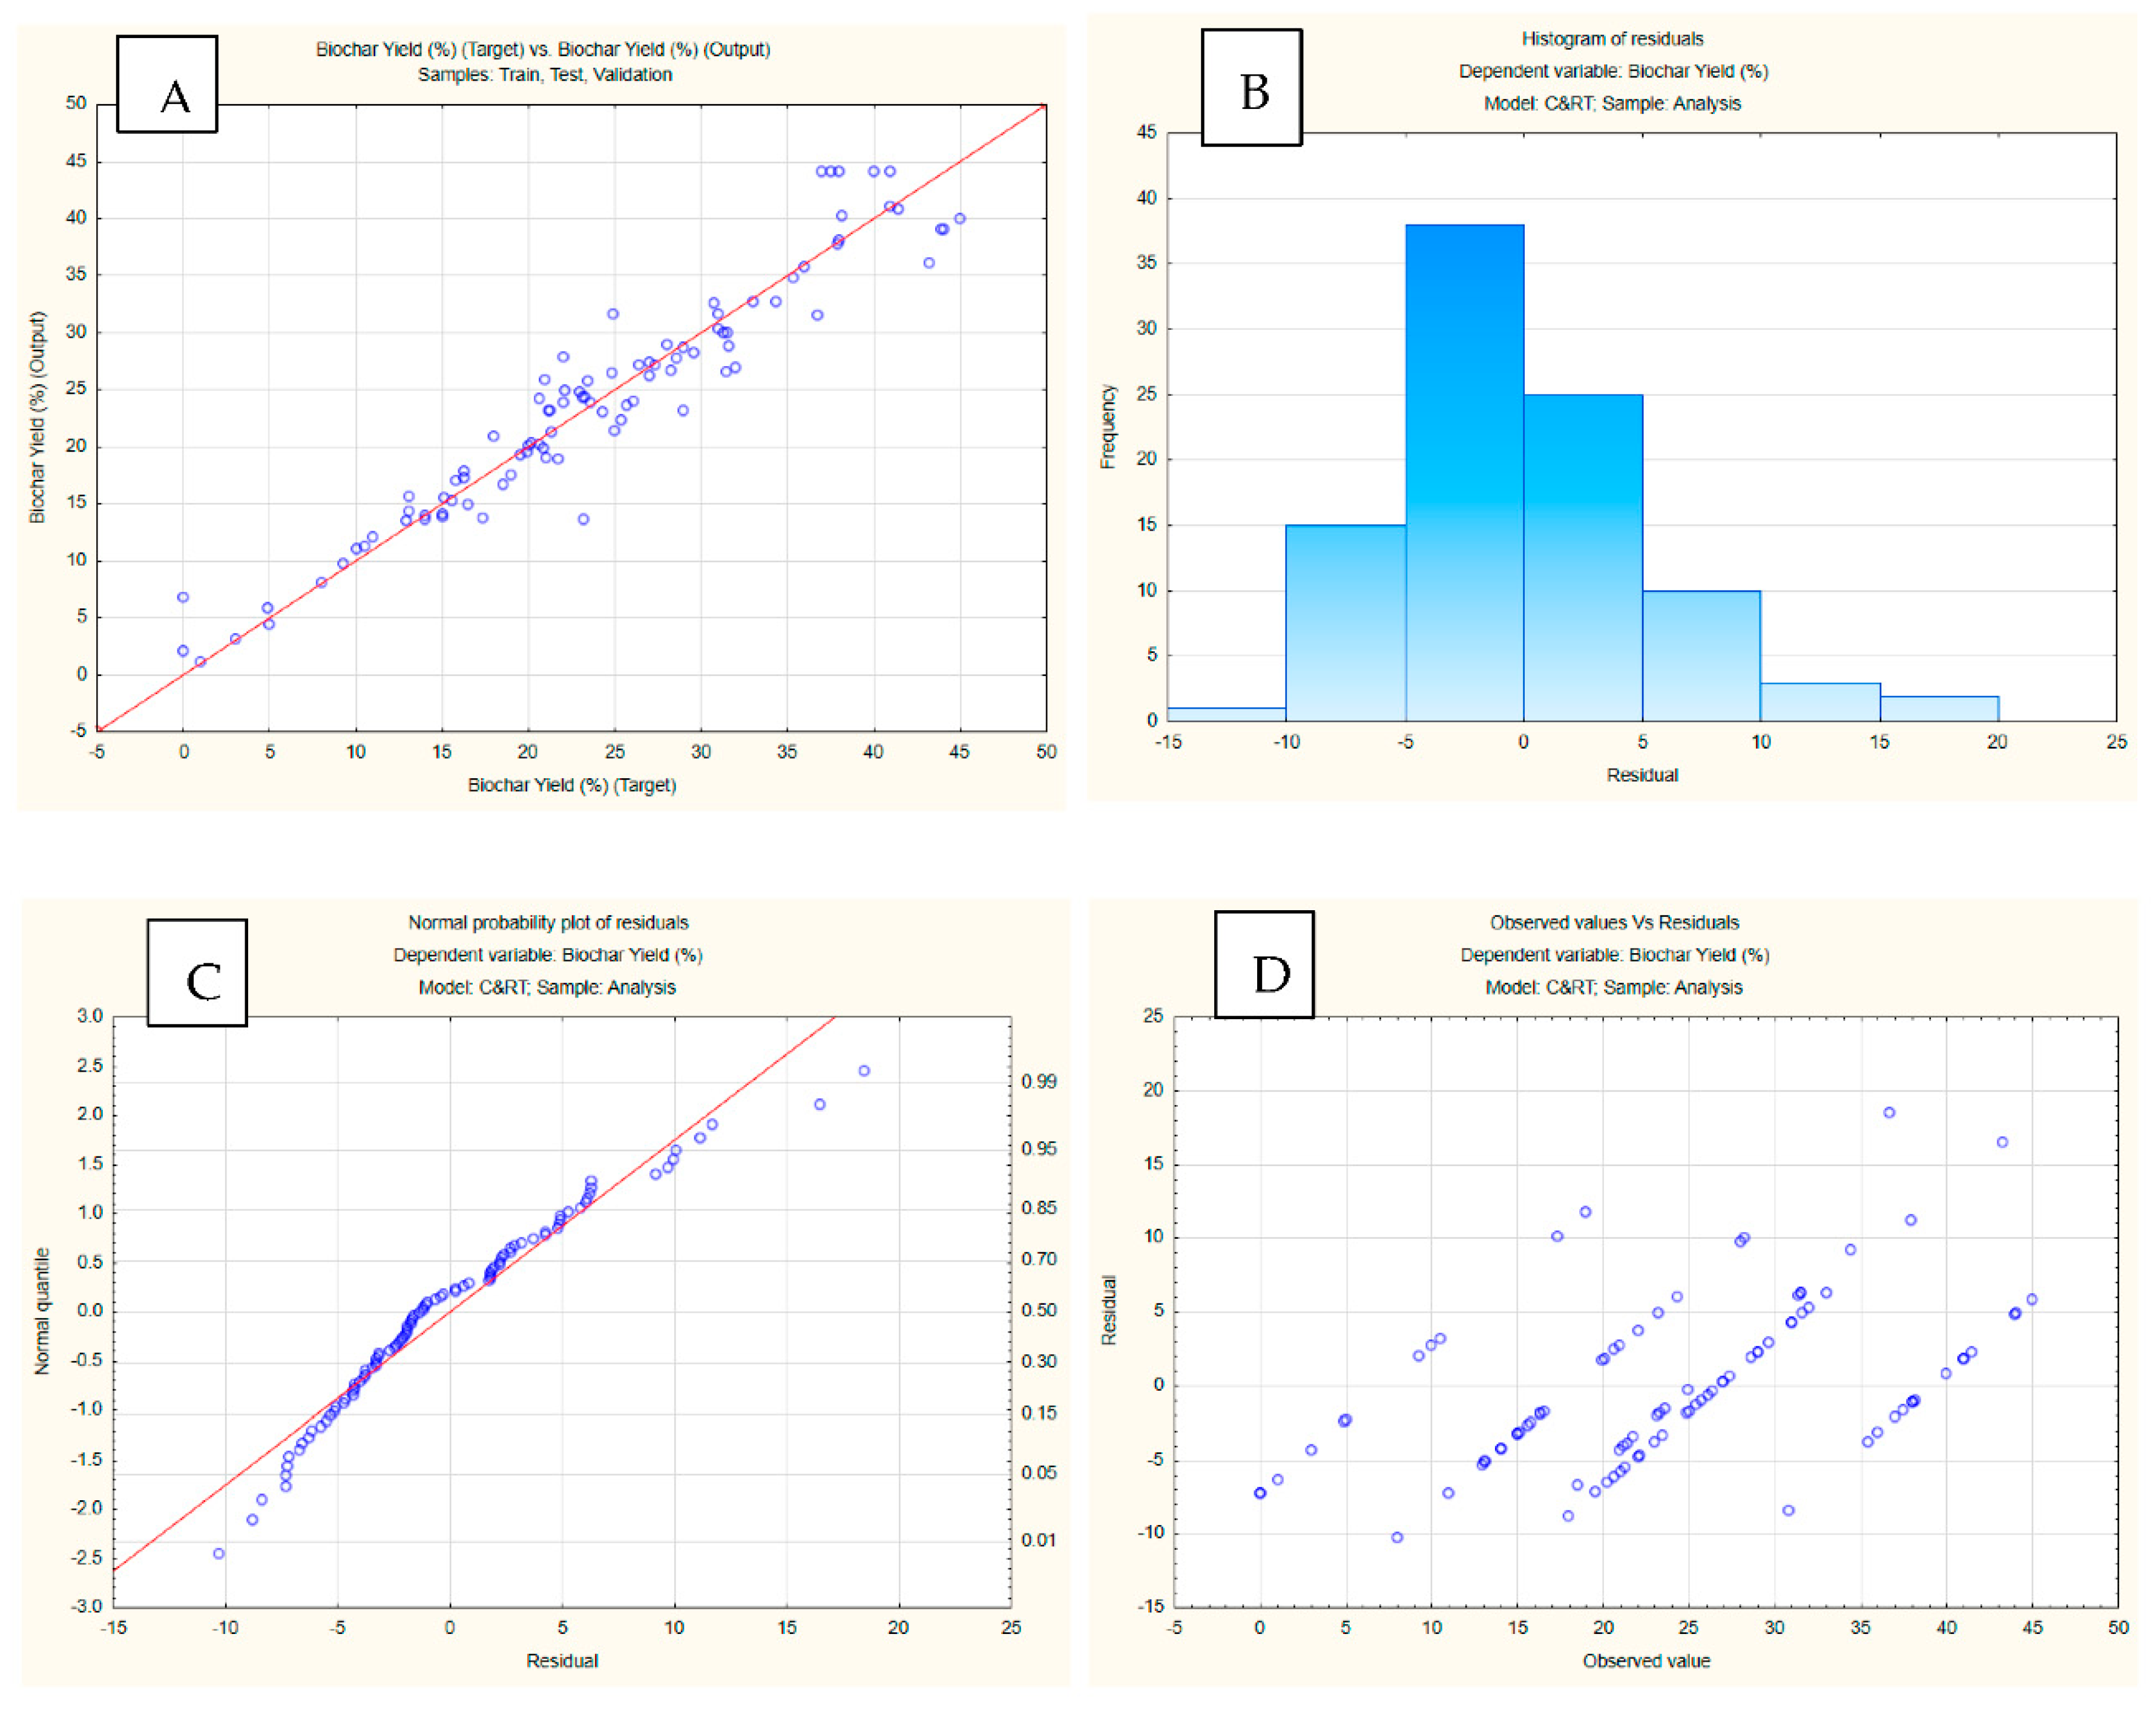
Table 5.
Sowing the Model Accuracy for validation, training and testing.
| Training perf. | Test perf. | Validation perf. | Training error | Test error | Validation error | Training algorithm | Error function | Hidden activation | Output activation | |
| MLP 17-4-1 | 0.965952 | 0.942402 | 0.983619 | 3.54672 | 8.411035 | 3.863005 | BFGS 39 | SOS | Exponential | Logistic |
Table 6.
Statistics for input data for ML Models.
| Name | Type | Mean | Std.Dev | Minimum | Maximum | |
| 1 | Mositure Biomass (%) | Continuous | 6.954043 | 3.647334 | 0.24 | 15.3 |
| 2 | Volatile Matter Biomass (%) | Continuous | 75.00191 | 10.64811 | 53.45 | 93.3 |
| 3 | Fixed Carbon Biomass (%) | Continuous | 12.05745 | 6.750243 | 0.5 | 26 |
| 4 | Ash Biomass (%) | Continuous | 6.439787 | 7.123538 | 0.1 | 30.77 |
| 5 | C Biomass (%) | Continuous | 47.84819 | 7.158147 | 26.99 | 63.85 |
| 6 | H Biomass (%) | Continuous | 6.223511 | 1.39789 | 2.2 | 8.77 |
| 7 | O Biomass (%) | Continuous | 41.735 | 11.70229 | 3.74 | 52.01 |
| 8 | N Biomass (%) | Continuous | 1.644362 | 2.053307 | 0 | 11.26 |
| 9 | C Polymer (%) | Continuous | 75.28128 | 17.49003 | 38.19 | 92.4 |
| 10 | H Polymer (%) | Continuous | 9.257128 | 3.663661 | 4.8 | 15.47 |
| 11 | O Polymer (%) | Continuous | 9.138617 | 13.94997 | 0 | 47.66 |
| 12 | N Polymer (%) | Continuous | 1.828936 | 2.816565 | 0 | 6.4 |
| 13 | Cl Polymer (%) | Continuous | 3.776596 | 13.85951 | 0 | 56.5 |
| 14 | Time (h) | Continuous | 0.440319 | 0.169226 | 0.17 | 0.83 |
| 15 | Heating Rate (oC/min) | Continuous | 22.76596 | 26.78686 | 5 | 100 |
| 16 | Polymer Ratio (%) | Continuous | 41.06383 | 29.13358 | 0 | 100 |
| 17 | Temperature (oC) | Continuous | 638.4043 | 197.9807 | 390 | 1250 |
| 18 | Biochar Yield (%) | Continuous | 23.95819 | 10.57809 | 0 | 45 |
3.5. Life cycle analysis
This approach is used to calculate the environmental effects of pyrolyzing mixed plastic waste. However, 1 ton on mixed plastic waste is the functional unit often used in all the impacts discussed below. The net climate change impact is estimated to be 713 kg CO2 eq./t. Before credits, the pyrolysis process accounts for two-thirds of the overall impact, followed by waste collection and sorting at 26% and pyrolysis oil purification at 8%. The 419 kg CO2 eq/t reduction in total impact can be attributed to the avoidance of naphtha production, which was replaced by pyrolysis oil. This substitution led to a significant decrease in greenhouse gas emissions, thereby contributing to the reduction of the carbon footprint. It is essential to recognize the positive environmental impact of this substitution and give credit to the efforts that led to this achievement. Such efforts could include the development and implementation of sustainable practices that promote the use of alternative fuels or the adoption of cleaner production processes. By acknowledging these contributions, we can encourage further progress towards more sustainable and eco-friendly practices in various industries. Ultimately, this can help to mitigate the adverse effects of climate change and promote a more sustainable future for generations to come.
Energy recovery, though, is a preferable choice for the other aspects considered here. All of the options, as depicted in net savings since the credits for the material or energy substitutions outweigh the system consequences. Chemical recycling and energy recovery have comparable process emissions, but the latter has credits that are roughly twice as high as the credits for naphtha replacement in the pyrolysis system. Apart from a few toxicity impacts (human toxicity- carcinogenic and non-carcinogenic; terrestrial and freshwater ecotoxicity), a similar pattern is observed for all other impacts measured by the Environmental Footprint techniques. For 1000 kg reactor the cost would be $176,093 with 10 years lifetime warranty, the profit would be $33,318 based on rough estimation. If the process is steady and efficient it can increase up to $55000.
| H2 | CO2 | CH4 | CO | |
| Percentage | 4 | 40.5 | 0.2 | 240 |
| Value $ | 12 | 3.5 | 1.2 | 0.2 |
| cost | 48 | 141.75 | 0.24 | 48 |
| Revenue | $237.99/Run and $33,318/Year | |||
3.6. Process controller
By utilizing the three distinctive modes of operation, namely experimental testing, simulation, and literature database analysis, we can effectively establish the critical connections required to pinpoint the ideal product outcomes under precise heating rate and temperature conditions for a given feedstock. This holistic approach to integrated process design not only streamlines the production process but also minimizes operational costs. Instead of allowing reactions to occur at varying temperatures and heating rates, leading to unnecessary time and financial resources wastage, we can strategically control these variables to yield the desired products, as exemplified in the below.
For every distinct feedstock, the selection of optimal product parameters can be achieved by defining specific operational conditions within a laboratory-scale pyrolysis reactor. This approach empowers us to fine-tune the pyrolysis process for each unique feedstock, enhancing the efficiency and effectiveness of product development and resource allocation.
Further investigations through process controller were carried out based on different scenarios of temperature, heating rate and flow control to evaluate the developed products of pyrolysis reactions. It was determined the best heating rate to achieve the highest efficiency maintaining a heating rate of 20 ℃/min with flow rate of 60 mL/min. It was intriguing to observe a significant presence of products associated with during the experiment. However, The products developed were a mixture of water (H2O), carbon dioxide (CO2), carbon monoxide (CO), nitric oxide (NO), methanol (MeOH), butane, ethane, ethylene, propylene, acetaldehyde, ammonia (NH3), and formaldehyde. Hydrocarbons showed on evolution stage with an order of acetaldehyde ˃ propylene ˃ ethane ˃ ethylene ˃ butane ˃ formaldehyde. In addition to hydrocarbons, oxygenated gases, including CO and CO2, have also been observed. Production of CO and CO2 at temperatures from 240 till 500 ℃ is attributed to the breakdown of C-C and C-O bonds with the decomposition of hemicellulose and cellulose, while at higher temperatures, the decomposition of lignin cleavage and the COOH group to generate CO and CO2. However, the release of H2 and H2O gases occurs during the primary pyrolysis stage, that is occurring at relatively low temperatures, and the release of H2 occurs during the secondary pyrolysis of heavy hydrocarbons or the charring reaction, at higher temperatures.
4. Conclusion
The current study provides a well-coordinated process integration for optimizing waste-to-energy processes for municipal solid waste (MSW) that is an essential prerequisite for achieving sustainable technology mitigating greenhouse gas emissions for clean energy. The three modes of operation were designed and integrated in the process design to obtain desired pyrolytic products based on temperature, heating rate and reaction conditions. The results obtained from characterization through thermogravimetric analysis predicted average values of activation energy (173-185) kJ/mol, enthalpy (166-178) kJ/mol with greater R2 values that showed suitability of MSW to generate energy, further evolved gas analysis established the potential to obtain useful product species including high ratio acetaldehyde ˃ propylene ˃ ethane ˃ ethylene ˃ butane ˃ formaldehyde. Furthermore, the simulation modeling results showed the gasification process is also considerable with pyro-gasification, gasification, catalytic pyrolysis to produce methanol and hydrogen. Additionally, life cycle analysis and process optimization can bridge the gap for rapid product optimization and estimated profit $33,318/Year for a small-scale plant. All results concluded the suitability of MSW for co-pyrolysis, and co-gasification process with various feedstocks to increase the process efficiency. Hence, we can unlock the potential of waste as a valuable resource for sustainable development. In the case of every unique feedstock, we have the capability to handpick the most suitable product parameters by establishing precise operational conditions within a laboratory-scale pyrolysis reactor. This method provides us with the means to finely calibrate the pyrolysis process to cater to the specific characteristics of each feedstock, ultimately elevating the efficiency and efficacy of our product development efforts and resource utilization.
References
- Liu, T.; McConkey, B.; Huffman, T.; Smith, S.; MacGregor, B.; Yemshanov, D.; Kulshreshtha, S. , Potential and impacts of renewable energy production from agricultural biomass in Canada. Applied Energy 2014, 130, 222–229. [Google Scholar] [CrossRef]
- Antar, M.; Lyu, D.; Nazari, M.; Shah, A.; Zhou, X.; Smith, D. L. , Biomass for a sustainable bioeconomy: An overview of world biomass production and utilization. Renewable and Sustainable Energy Reviews 2021, 139, 110691. [Google Scholar] [CrossRef]
- Gourmelon, G. , Global plastic production rises, recycling lags. Vital Signs 2015, 22, 91–95. [Google Scholar]
- Shan, C.; Pandyaswargo, A. H.; Onoda, H. , Environmental Impact of Plastic Recycling in Terms of Energy Consumption: A Comparison of Japan’s Mechanical and Chemical Recycling Technologies. Energies 2023, 16(5), 2199. [Google Scholar] [CrossRef]
- Ghiat, I.; Al-Ansari, T. , A review of carbon capture and utilisation as a CO2 abatement opportunity within the EWF nexus. Journal of CO2 Utilization 2021, 45, 101432. [Google Scholar] [CrossRef]
- Pant, D.; Misra, S.; Nizami, A.-S.; Rehan, M.; van Leeuwen, R.; Tabacchioni, S.; Goel, R.; Sarma, P.; Bakker, R.; Sharma, N.; Kwant, K.; Diels, L.; Elst, K. , Towards the development of a biobased economy in Europe and India. Crit. Rev. Biotechnol. 2019, 39(6), 779–799. [Google Scholar] [CrossRef] [PubMed]
- Williams, J. M.; Bourtsalas, A. , Assessment of Co-Gasification Methods for Hydrogen Production from Biomass and Plastic Wastes. Energies 2023, 16(22), 7548. [Google Scholar] [CrossRef]
- Grigorescu, A.; Lopez Ruiz, V. R.; Lincaru, C.; Condrea, E. , Specialization Patterns for the Development of Renewable Energy Generation Technologies across Countries. Energies 2023, 16(20), 7164. [Google Scholar] [CrossRef]
- Rathour, R. K.; Devi, M.; Dahiya, P.; Sharma, N.; Kaushik, N.; Kumari, D.; Kumar, P.; Baadhe, R. R.; Walia, A.; Bhatt, A. K. , Recent trends, opportunities and challenges in sustainable management of rice straw waste biomass for green biorefinery. Energies 2023, 16(3), 1429. [Google Scholar] [CrossRef]
- Ribeiro, L. S.; Stolz, C. M.; Amario, M.; Silva, A. L. N. d.; Haddad, A. N. , Use of Post-Consumer Plastics in the Production of Wood-Plastic Composites for Building Components: A Systematic Review. Energies 2023, 16(18), 6549. [Google Scholar] [CrossRef]
- Alam, M.; Bhavanam, A.; Jana, A.; Peela, N. R. , Co-pyrolysis of bamboo sawdust and plastic: Synergistic effects and kinetics. Renew. Energy 2020, 149, 1133–1145. [Google Scholar] [CrossRef]
- Özsin, G.; Pütün, A. E. , A comparative study on co-pyrolysis of lignocellulosic biomass with polyethylene terephthalate, polystyrene, and polyvinyl chloride: Synergistic effects and product characteristics. J. Clean. Prod. 2018, 205, 1127–1138. [Google Scholar] [CrossRef]
- Wang, X.; Ma, D.; Jin, Q.; Deng, S.; Stančin, H.; Tan, H.; Mikulčić, H. , Synergistic effects of biomass and polyurethane co-pyrolysis on the yield, reactivity, and heating value of biochar at high temperatures. Fuel Process. Technol. 2019, 194, 106127. [Google Scholar] [CrossRef]
- Özsin, G.; Kılıç, M.; Apaydin-Varol, E.; Pütün, A. E.; Pütün, E. , A thermo-kinetic study on co-pyrolysis of oil shale and polyethylene terephthalate using TGA/FT-IR. Korean J. Chem. Eng. 2020. [Google Scholar] [CrossRef]
- Hu, Q.; Tang, Z.; Yao, D.; Yang, H.; Shao, J.; Chen, H. , Thermal behavior, kinetics and gas evolution characteristics for the co-pyrolysis of real-world plastic and tyre wastes. J. Clean. Prod. 2020, 260, 121102. [Google Scholar] [CrossRef]
- Idris, R.; Chong, C. T.; Asik, J. A.; Ani, F. N. , Optimization studies of microwave-induced co-pyrolysis of empty fruit bunches/waste truck tire using response surface methodology. J. Clean. Prod. 2020, 244, 118649. [Google Scholar] [CrossRef]
- Zhang, J.; Liu, J.; Evrendilek, F.; Zhang, X.; Buyukada, M. , TG-FTIR and Py-GC/MS analyses of pyrolysis behaviors and products of cattle manure in CO2 and N2 atmospheres: Kinetic, thermodynamic, and machine-learning models. Energy Convers. Manage. 2019, 195, 346–359. [Google Scholar] [CrossRef]
- Kiminaitė, I.; González-Arias, J.; Striūgas, N.; Eimontas, J.; Seemann, M. , Syngas Production from Protective Face Masks through Pyrolysis/Steam Gasification. Energies 2023, 16(14), 5417. [Google Scholar] [CrossRef]
- Rotz, S.; Gravely, E.; Mosby, I.; Duncan, E.; Finnis, E.; Horgan, M.; LeBlanc, J.; Martin, R.; Neufeld, H. T.; Nixon, A.; Pant, L.; Shalla, V.; Fraser, E. , Automated pastures and the digital divide: How agricultural technologies are shaping labour and rural communities. Journal of Rural Studies 2019, 68, 112–122. [Google Scholar] [CrossRef]
- Mabee, W.; Saddler, J. , Bioethanol from lignocellulosics: status and perspectives in Canada. Bioresour. Technol. 2010, 101(13), 4806–4813. [Google Scholar] [CrossRef]
- Darmey, J.; Ahiekpor, J. C.; Narra, S.; Achaw, O.-W.; Ansah, H. F. , Municipal Solid Waste Generation Trend and Bioenergy Recovery Potential: A Review. Energies 2023, 16(23), 7753. [Google Scholar] [CrossRef]
- Liu, H.; Ahmad, M. S.; Alhumade, H.; Elkamel, A.; Sammak, S.; Shen, B. , A hybrid kinetic and optimization approach for biomass pyrolysis: The hybrid scheme of the isoconversional methods, DAEM, and a parallel-reaction mechanism. Energy Convers. Manage. 2020, 208, 112531. [Google Scholar] [CrossRef]
- Galiwango, E.; A. Gabbar, H. Synergistic interactions, kinetic and thermodynamic analysis of co-pyrolysis of municipal paper and polypropylene waste. Waste Manage. 2022, 146, 86–93. [Google Scholar] [CrossRef] [PubMed]
- Mumbach, G. D.; Alves, J. L. F.; Da Silva, J. C. G.; De Sena, R. F.; Marangoni, C.; Machado, R. A. F.; Bolzan, A. , Thermal investigation of plastic solid waste pyrolysis via the deconvolution technique using the asymmetric double sigmoidal function: Determination of the kinetic triplet, thermodynamic parameters, thermal lifetime and pyrolytic oil composition for clean energy recovery. Energy Conv. Manag. 2019, 200, 112031. [Google Scholar] [CrossRef]
- Yousef, S.; Eimontas, J.; Striūgas, N.; Zakarauskas, K.; Praspaliauskas, M.; Abdelnaby, M. A. , Pyrolysis kinetic behavior and TG-FTIR-GC–MS analysis of metallised food packaging plastics. Fuel 2020, 282, 118737. [Google Scholar] [CrossRef]
- Badshah, S. L.; Shah, Z.; Alves, J. L. F.; da Silva, J. C. G.; Iqbal, A. , Pyrolysis of the freshwater macroalgae Spirogyra crassa: evaluating its bioenergy potential using kinetic triplet and thermodynamic parameters. Renew. Energ. 2021, 179, 1169–1178. [Google Scholar] [CrossRef]
- Periyavaram, S. R.; Uppala, L.; Sivaprakash, S.; Reddy, P. H. P. , Thermal behaviour of hydrochar derived from hydrothermal carbonization of food waste using leachate as moisture source: Kinetic and thermodynamic analysis. Bioresour. Technol. 2023, 373, 128734. [Google Scholar] [CrossRef] [PubMed]
- Li, J.; Suvarna, M.; Li, L.; Pan, L.; Pérez-Ramírez, J.; Ok, Y. S.; Wang, X. , A review of computational modeling techniques for wet waste valorization: Research trends and future perspectives. Journal of Cleaner Production 2022, 133025. [Google Scholar] [CrossRef]
- Shagali, A. A.; Hu, S.; Li, H.; Chi, H.; Qing, H.; Xu, J.; Jiang, L.; Wang, Y.; Su, S.; Xiang, J. , Thermal behavior, synergistic effect and thermodynamic parameter evaluations of biomass/plastics co–pyrolysis in a concentrating photothermal TGA. Fuel 2023, 331, 125724. [Google Scholar] [CrossRef]
- Singh, B.; Singh, S.; Kumar, P. , In-depth analyses of kinetics, thermodynamics and solid reaction mechanism for pyrolysis of hazardous petroleum sludge based on isoconversional models for its energy potential. Process Safety and Environmental Protection 2021, 146, 85–94. [Google Scholar] [CrossRef]
- Wen, Y.; Zaini, I. N.; Wang, S.; Mu, W.; Jönsson, P. G.; Yang, W. , Synergistic effect of the co-pyrolysis of cardboard and polyethylene: A kinetic and thermodynamic study. Energy 2021, 229, 120693. [Google Scholar] [CrossRef]
- He, M.; Xiao, B.; Hu, Z.; Liu, S.; Guo, X.; Luo, S. , Syngas production from catalytic gasification of waste polyethylene: Influence of temperature on gas yield and composition. Int. J. Hydrog. Energy 2009, 34(3), 1342–1348. [Google Scholar] [CrossRef]
- Cao, C.; Bian, C.; Wang, G.; Bai, B.; Xie, Y.; Jin, H. , Co-gasification of plastic wastes and soda lignin in supercritical water. J. Chem. Eng. 2020, 388, 124277. [Google Scholar] [CrossRef]
- Dogu, O.; Pelucchi, M.; Van de Vijver, R.; Van Steenberge, P. H. M.; D'Hooge, D. R.; Cuoci, A.; Mehl, M.; Frassoldati, A.; Faravelli, T.; Van Geem, K. M. , The chemistry of chemical recycling of solid plastic waste via pyrolysis and gasification: State-of-the-art, challenges, and future directions. Prog. Energy Combust. Sci. 2021, 84, 100901. [Google Scholar] [CrossRef]
- Salavati, S.; Zhang, C.; Zhang, S.; Liu, Q.; Gholizadeh, M.; Hu, X. , Cross-interaction during Co-gasification of wood, weed, plastic, tire and carton. J. Environ. Manage. 2019, 250, 109467. [Google Scholar] [CrossRef] [PubMed]
- Saebea, D.; Ruengrit, P.; Arpornwichanop, A.; Patcharavorachot, Y. , Gasification of plastic waste for synthesis gas production. Energy Rep. 2020, 6, 202–207. [Google Scholar] [CrossRef]
- Ongen, A. , Methane-rich syngas production by gasification of thermoset waste plastics. Clean Technol. Environ. Policy 2016, 18(3), 915–924. [Google Scholar] [CrossRef]
- Ceylan, S.; Kazan, D. , Pyrolysis kinetics and thermal characteristics of microalgae Nannochloropsis oculata and Tetraselmis sp. Bioresour. Technol. 2015, 187, 1–5. [Google Scholar] [CrossRef]
- Maia, A. A. D.; de Morais, L. C. , Kinetic parameters of red pepper waste as biomass to solid biofuel. Bioresour. Technol. 2016, 204, 157–163. [Google Scholar] [CrossRef]
- Nawaz, A.; Kumar, P. , A novel pseudo-multicomponent isoconversional approach for the estimation of kinetic and thermodynamic parameters of potato stalk thermal degradation. Bioresour. Technol. 2023, 376, 128846. [Google Scholar] [CrossRef]
- Rammohan, D.; Kishore, N.; Uppaluri, R. V. S. , Insights on kinetic triplets and thermodynamic analysis of Delonix regia biomass pyrolysis. Bioresour. Technol. 2022, 358, 127375. [Google Scholar] [CrossRef] [PubMed]
- Kushwaha, R.; Singh, R. S.; Mohan, D. , Comparative study for sorption of arsenic on peanut shell biochar and modified peanut shell biochar. Bioresour. Technol. 2023, 375, 128831. [Google Scholar] [CrossRef]
- Lin, K.; Tian, L.; Zhao, Y.; Zhao, C.; Zhang, M.; Zhou, T. , Pyrolytic characteristics of fine materials from municipal solid waste using TG-FTIR, Py-GC/MS, and deep learning approach: Kinetics, thermodynamics, and gaseous products distribution. Chemosphere 2022, 293, 133533. [Google Scholar] [CrossRef] [PubMed]
- Xu, M.; Cao, C.; Hu, H.; Ren, Y.; Guo, G.; Gong, L.; Zhang, J.; Zhang, T.; Yao, H. , Perspective on the disposal of PVC artificial leather via pyrolysis: Thermodynamics, kinetics, synergistic effects and reaction mechanism. Fuel 2022, 327, 125082. [Google Scholar] [CrossRef]
- Liu, H.; Wang, C.; Zhang, J.; Zhao, W.; Fan, M., Pyrolysis Kinetics and Thermodynamics of Typical Plastic Waste. Energy & Fuels 2020, 34, (2), 2385-2390. [CrossRef]
- Zaker, A.; Chen, Z.; Zaheer-Uddin, M.; Guo, J. , Co-pyrolysis of sewage sludge and low-density polyethylene – A thermogravimetric study of thermo-kinetics and thermodynamic parameters. J. Environ. Chem. Eng. 2021, 9(1), 104554. [Google Scholar] [CrossRef]
- Xu, F.; Wang, B.; Yang, D.; Ming, X.; Jiang, Y.; Hao, J.; Qiao, Y.; Tian, Y. , TG-FTIR and Py-GC/MS study on pyrolysis mechanism and products distribution of waste bicycle tire. Energy Conv. Manag. 2018, 175, 288–297. [Google Scholar] [CrossRef]
- Sun, H.; Bi, H.; Jiang, C.; Ni, Z.; Tian, J.; Zhou, W.; Qiu, Z.; Lin, Q. , Experimental study of the co-pyrolysis of sewage sludge and wet waste via TG-FTIR-GC and artificial neural network model: Synergistic effect, pyrolysis kinetics and gas products. Renew. Energ. 2022, 184, 1–14. [Google Scholar] [CrossRef]
- Fang, S.; Lin, Y.; Huang, Z.; Huang, H.; Chen, S.; Ding, L. , Investigation of co-pyrolysis characteristics and kinetics of municipal solid waste and paper sludge through TG-FTIR and DAEM. Thermochim. Acta 2021, 700, 178889. [Google Scholar] [CrossRef]
- Kremer, I.; Tomić, T.; Katančić, Z.; Erceg, M.; Papuga, S.; Vuković, J. P.; Schneider, D. R. , Catalytic pyrolysis of mechanically non-recyclable waste plastics mixture: Kinetics and pyrolysis in laboratory-scale reactor. J. Environ. Manage. 2021, 296, 113145. [Google Scholar] [CrossRef]
- Zhang, Y.; Ahmad, M. S.; Shen, B.; Yuan, P.; Shah, I. A.; Zhu, Q.; Ibrahim, M.; Bokhari, A.; Klemeš, J. J.; Elkamel, A. , Co-pyrolysis of lychee and plastic waste as a source of bioenergy through kinetic study and thermodynamic analysis. Energy 2022, 256, 124678. [Google Scholar] [CrossRef]
- Prasertpong, P.; Onsree, T.; Khuenkaeo, N.; Tippayawong, N.; Lauterbach, J. , Exposing and understanding synergistic effects in co-pyrolysis of biomass and plastic waste via machine learning. Bioresour. Technol. 2023, 369, 128419. [Google Scholar] [CrossRef] [PubMed]
- Tang, Q.; Chen, Y.; Yang, H.; Liu, M.; Xiao, H.; Wu, Z.; Chen, H.; Naqvi, S. R., Prediction of Bio-oil Yield and Hydrogen Contents Based on Machine Learning Method: Effect of Biomass Compositions and Pyrolysis Conditions. Energy & Fuels 2020, 34, (9), 11050-11060. [CrossRef]
Figure 1.
Integrated framework to optimize pyrolysis products.
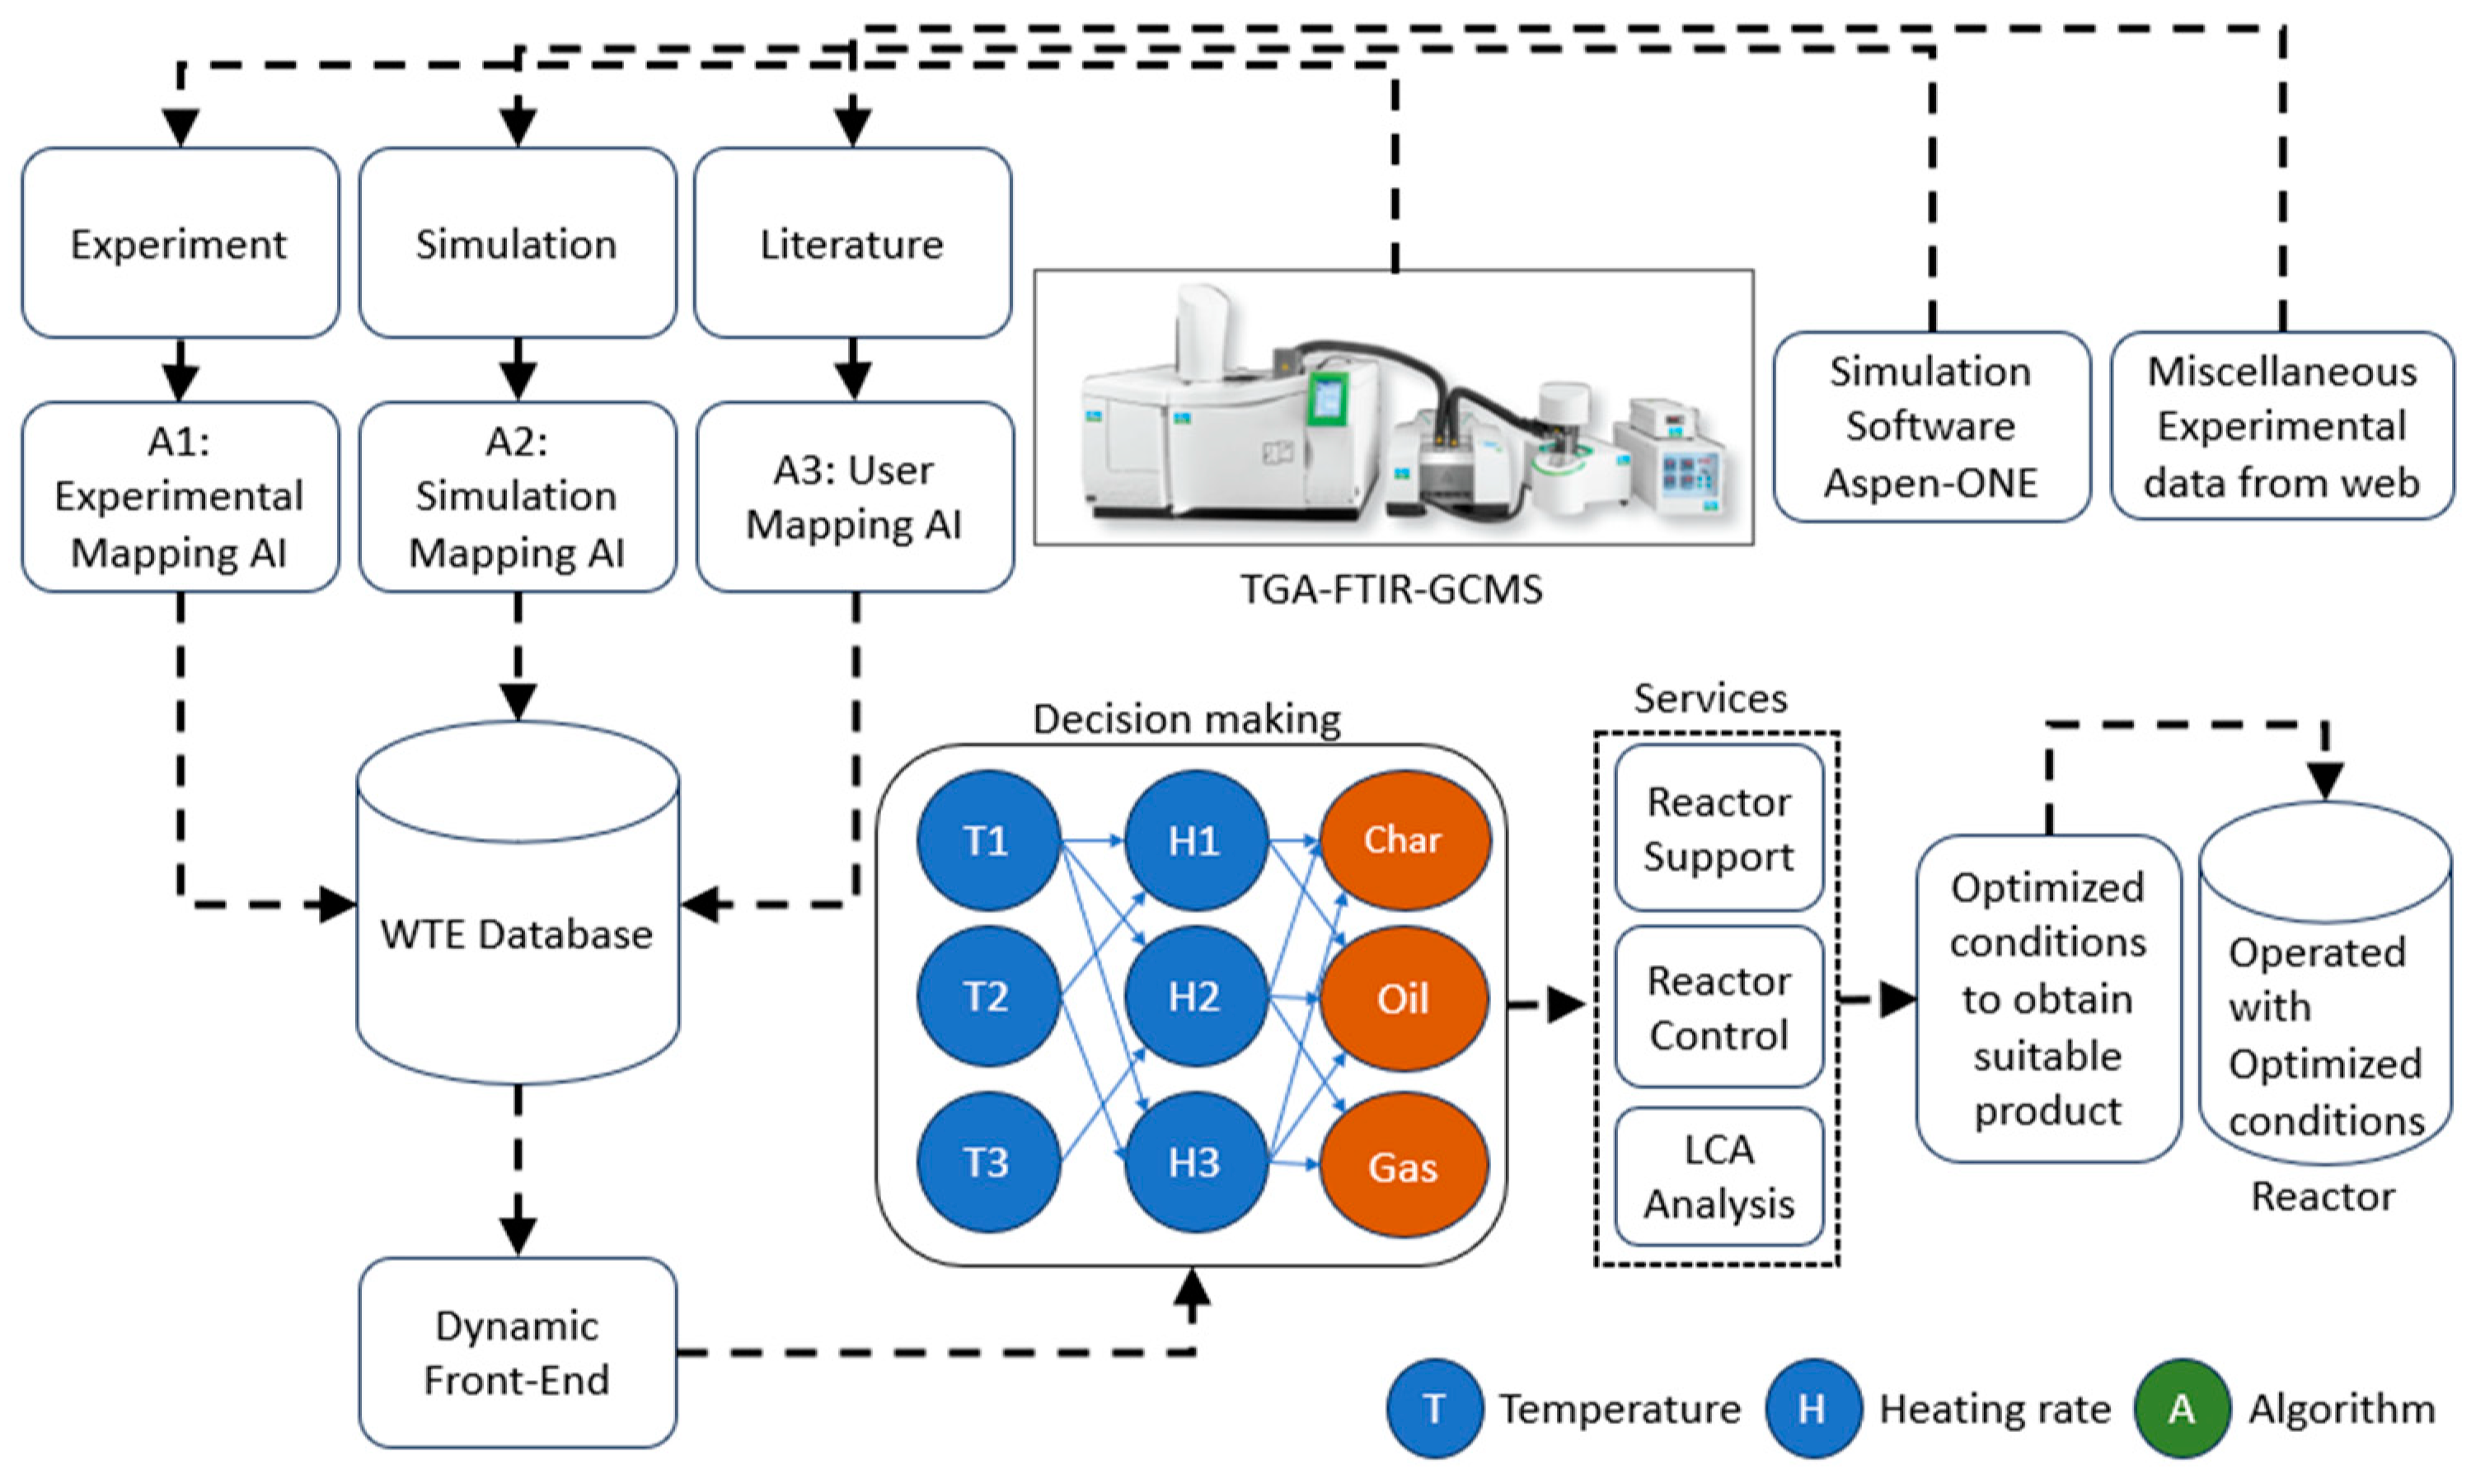
Figure 2.
Integrated algorithm to obtain thermodynamic and reaction chemistry parameters.
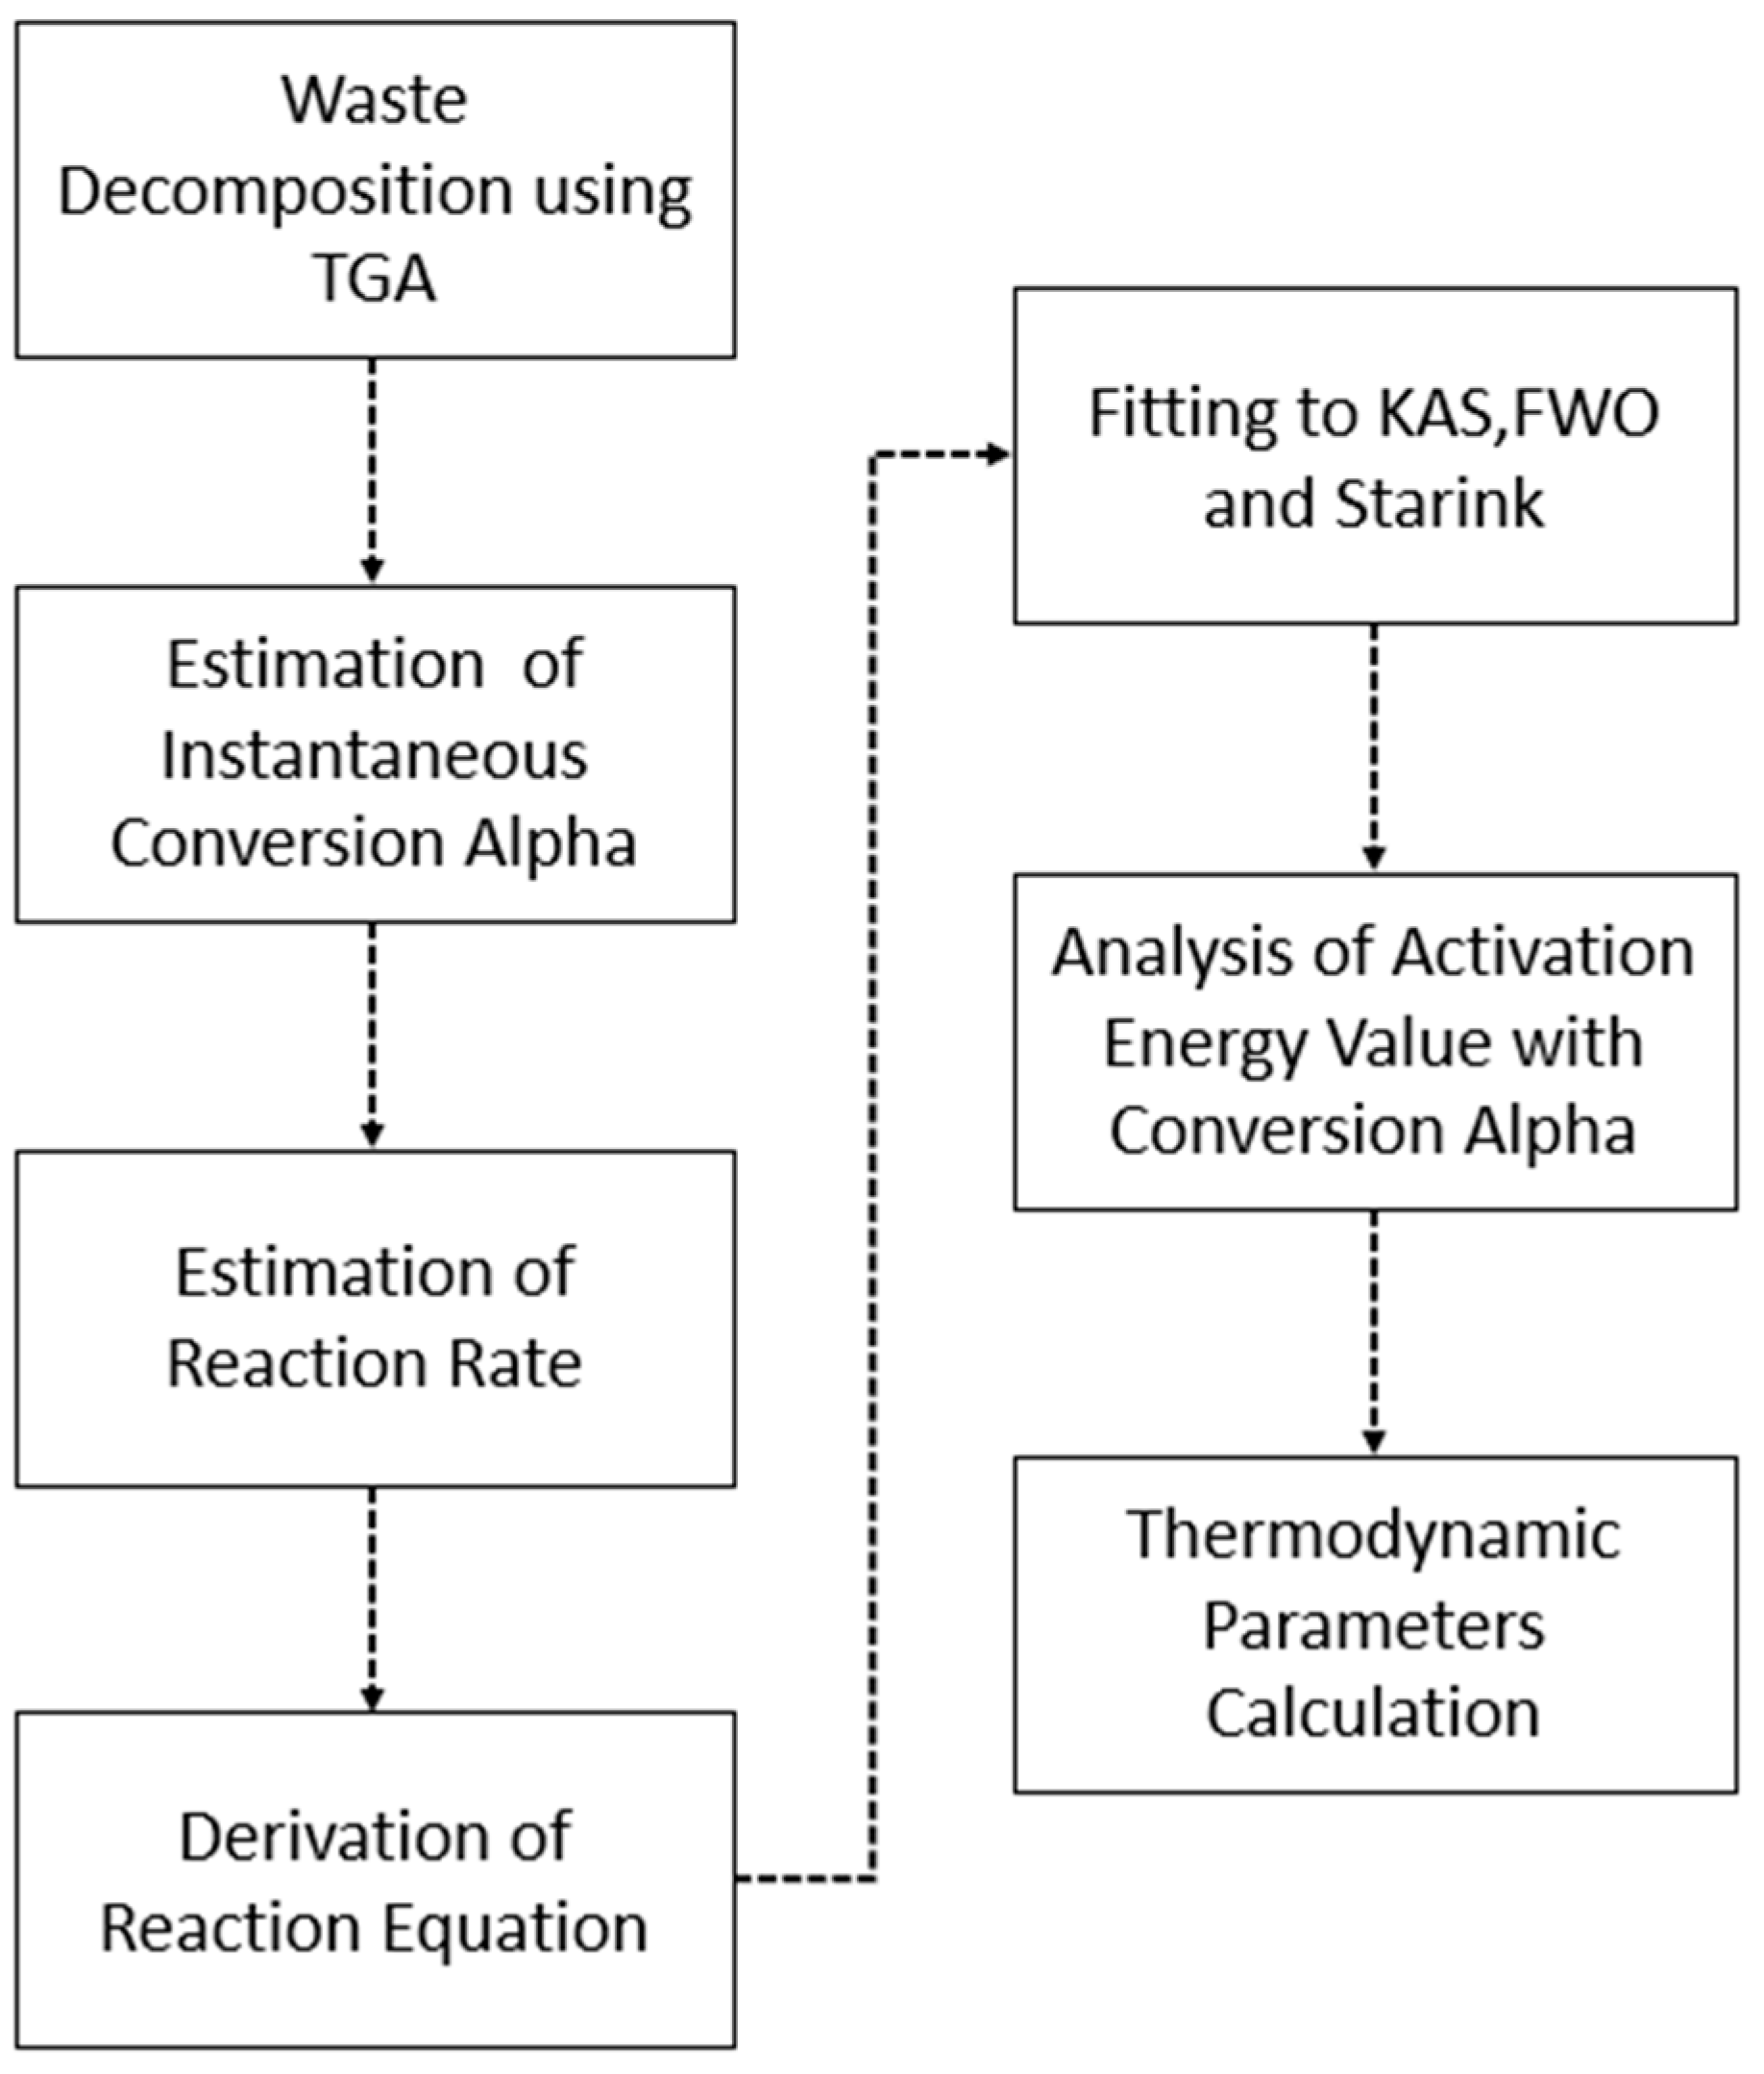
Figure 3.
Integrated algorithm to obtain pyrolysis products.
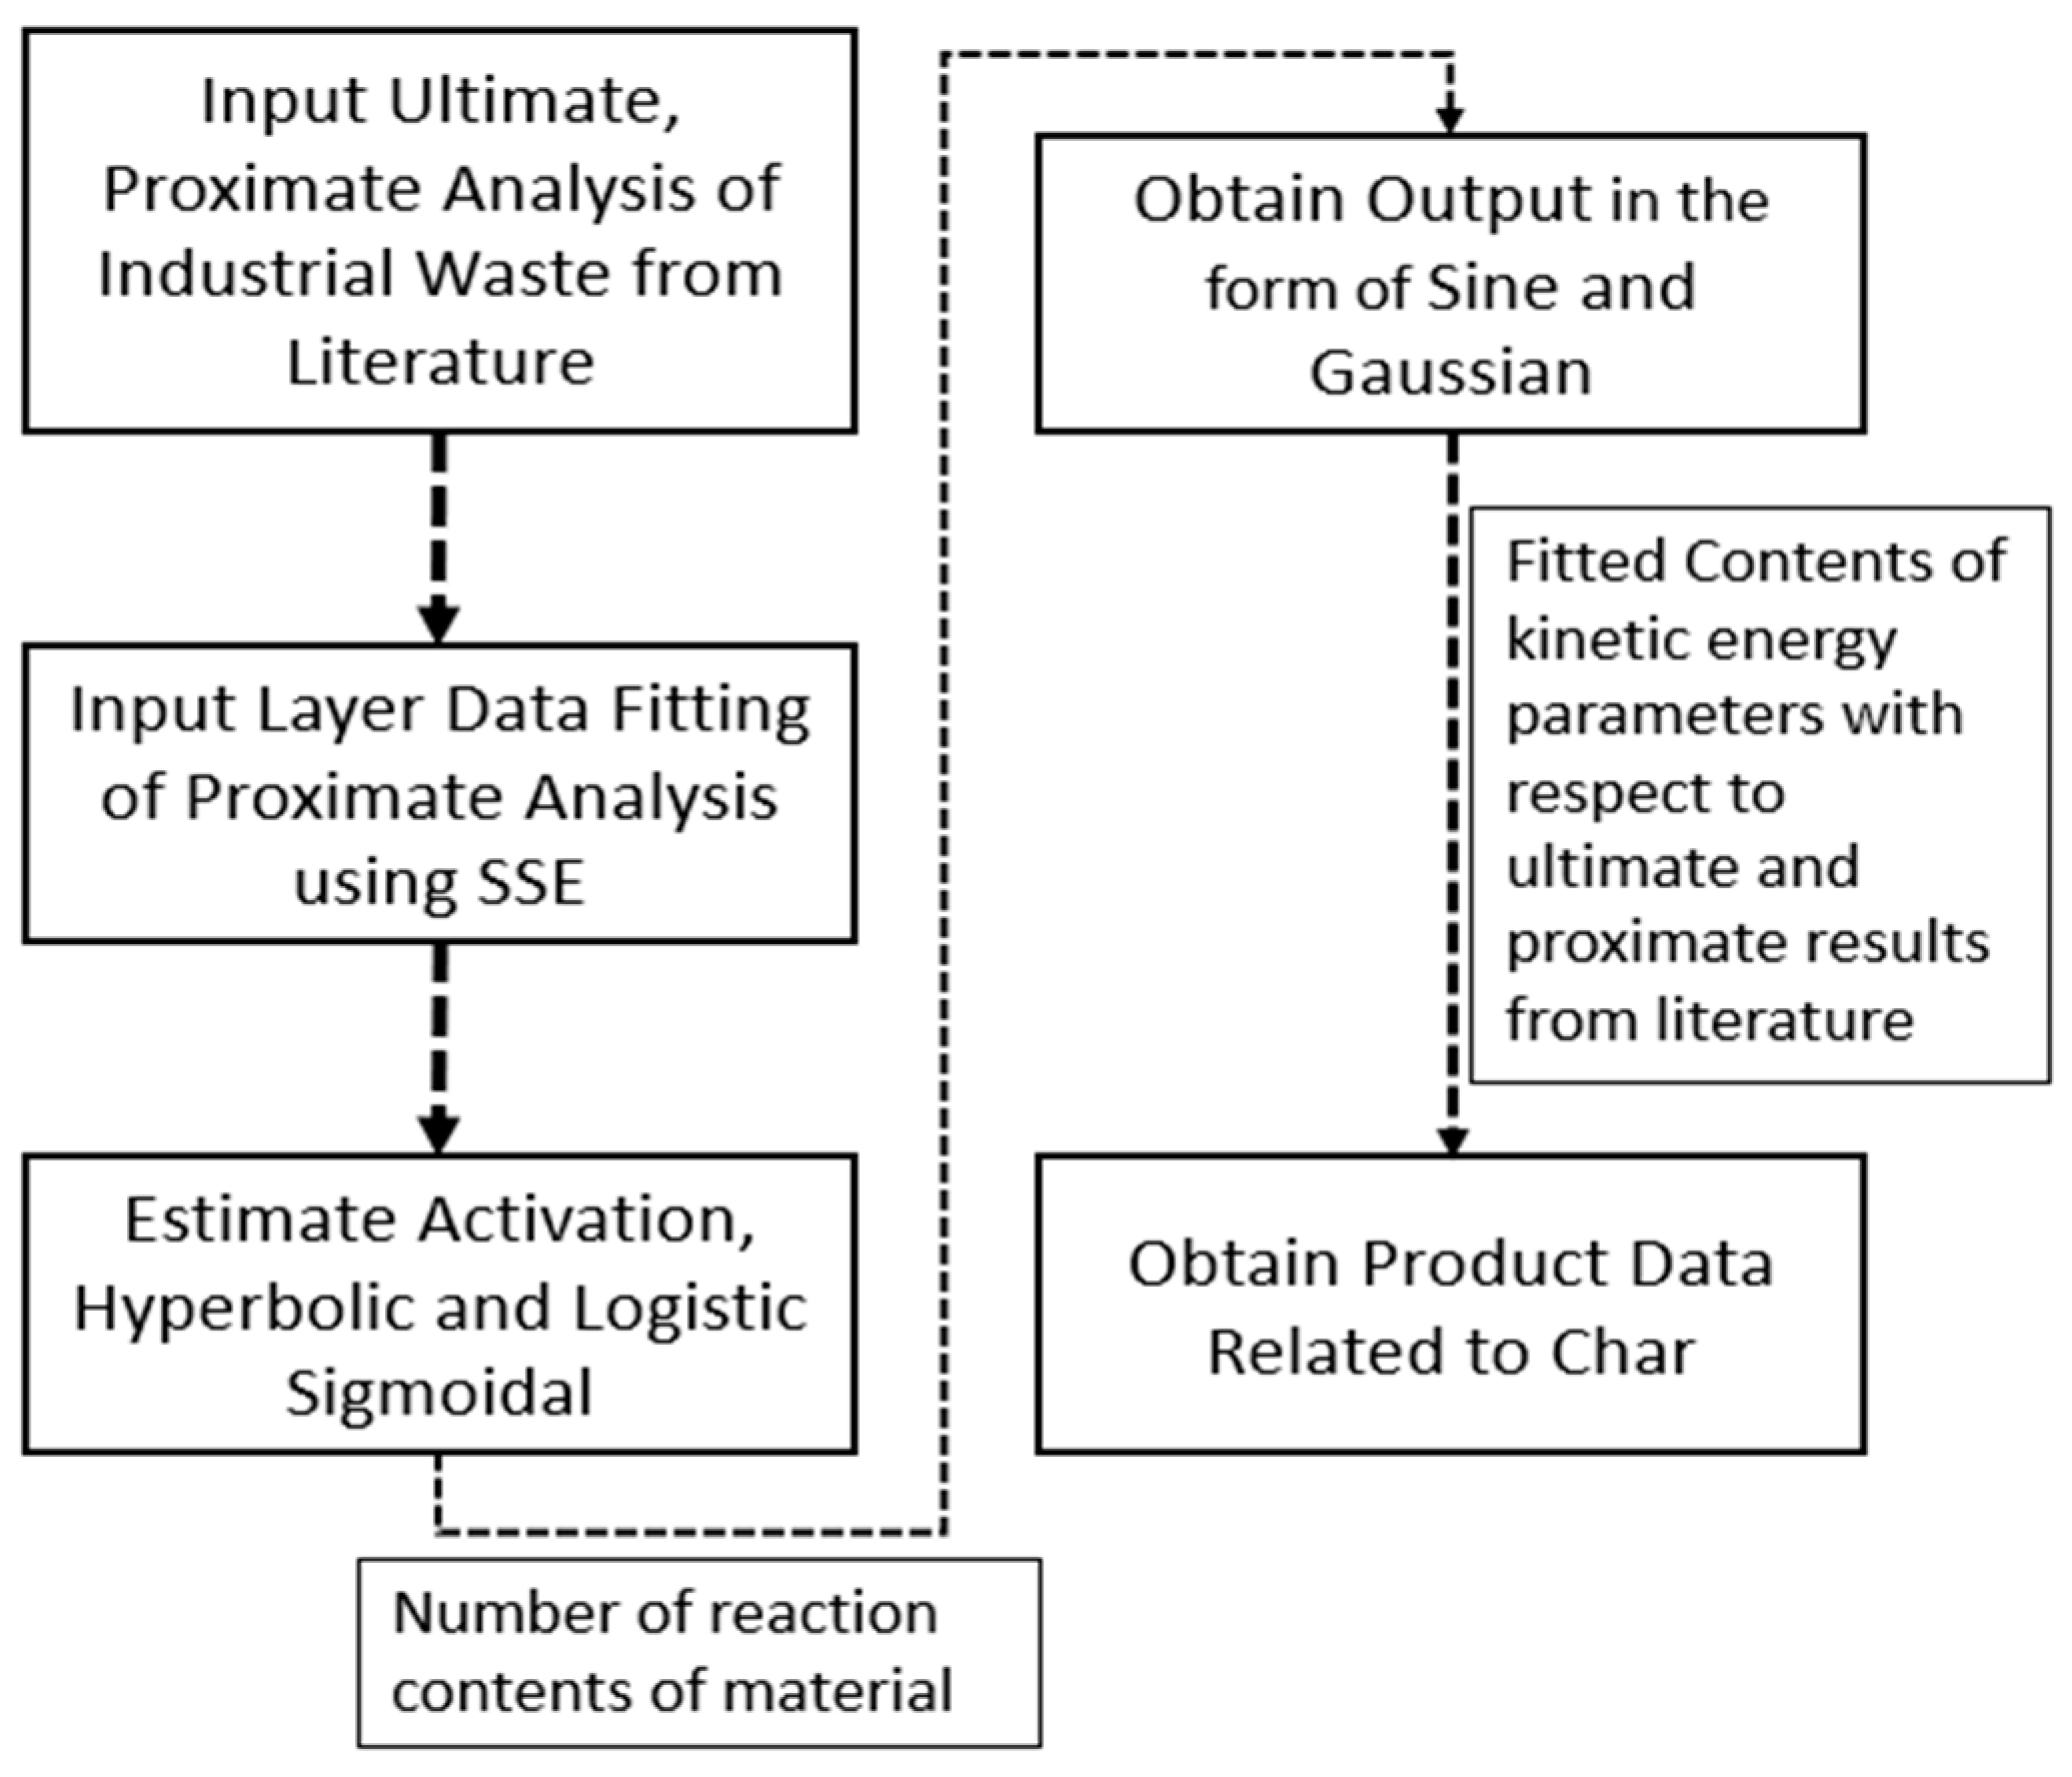
Figure 4.
Integrated process model with WTE database.
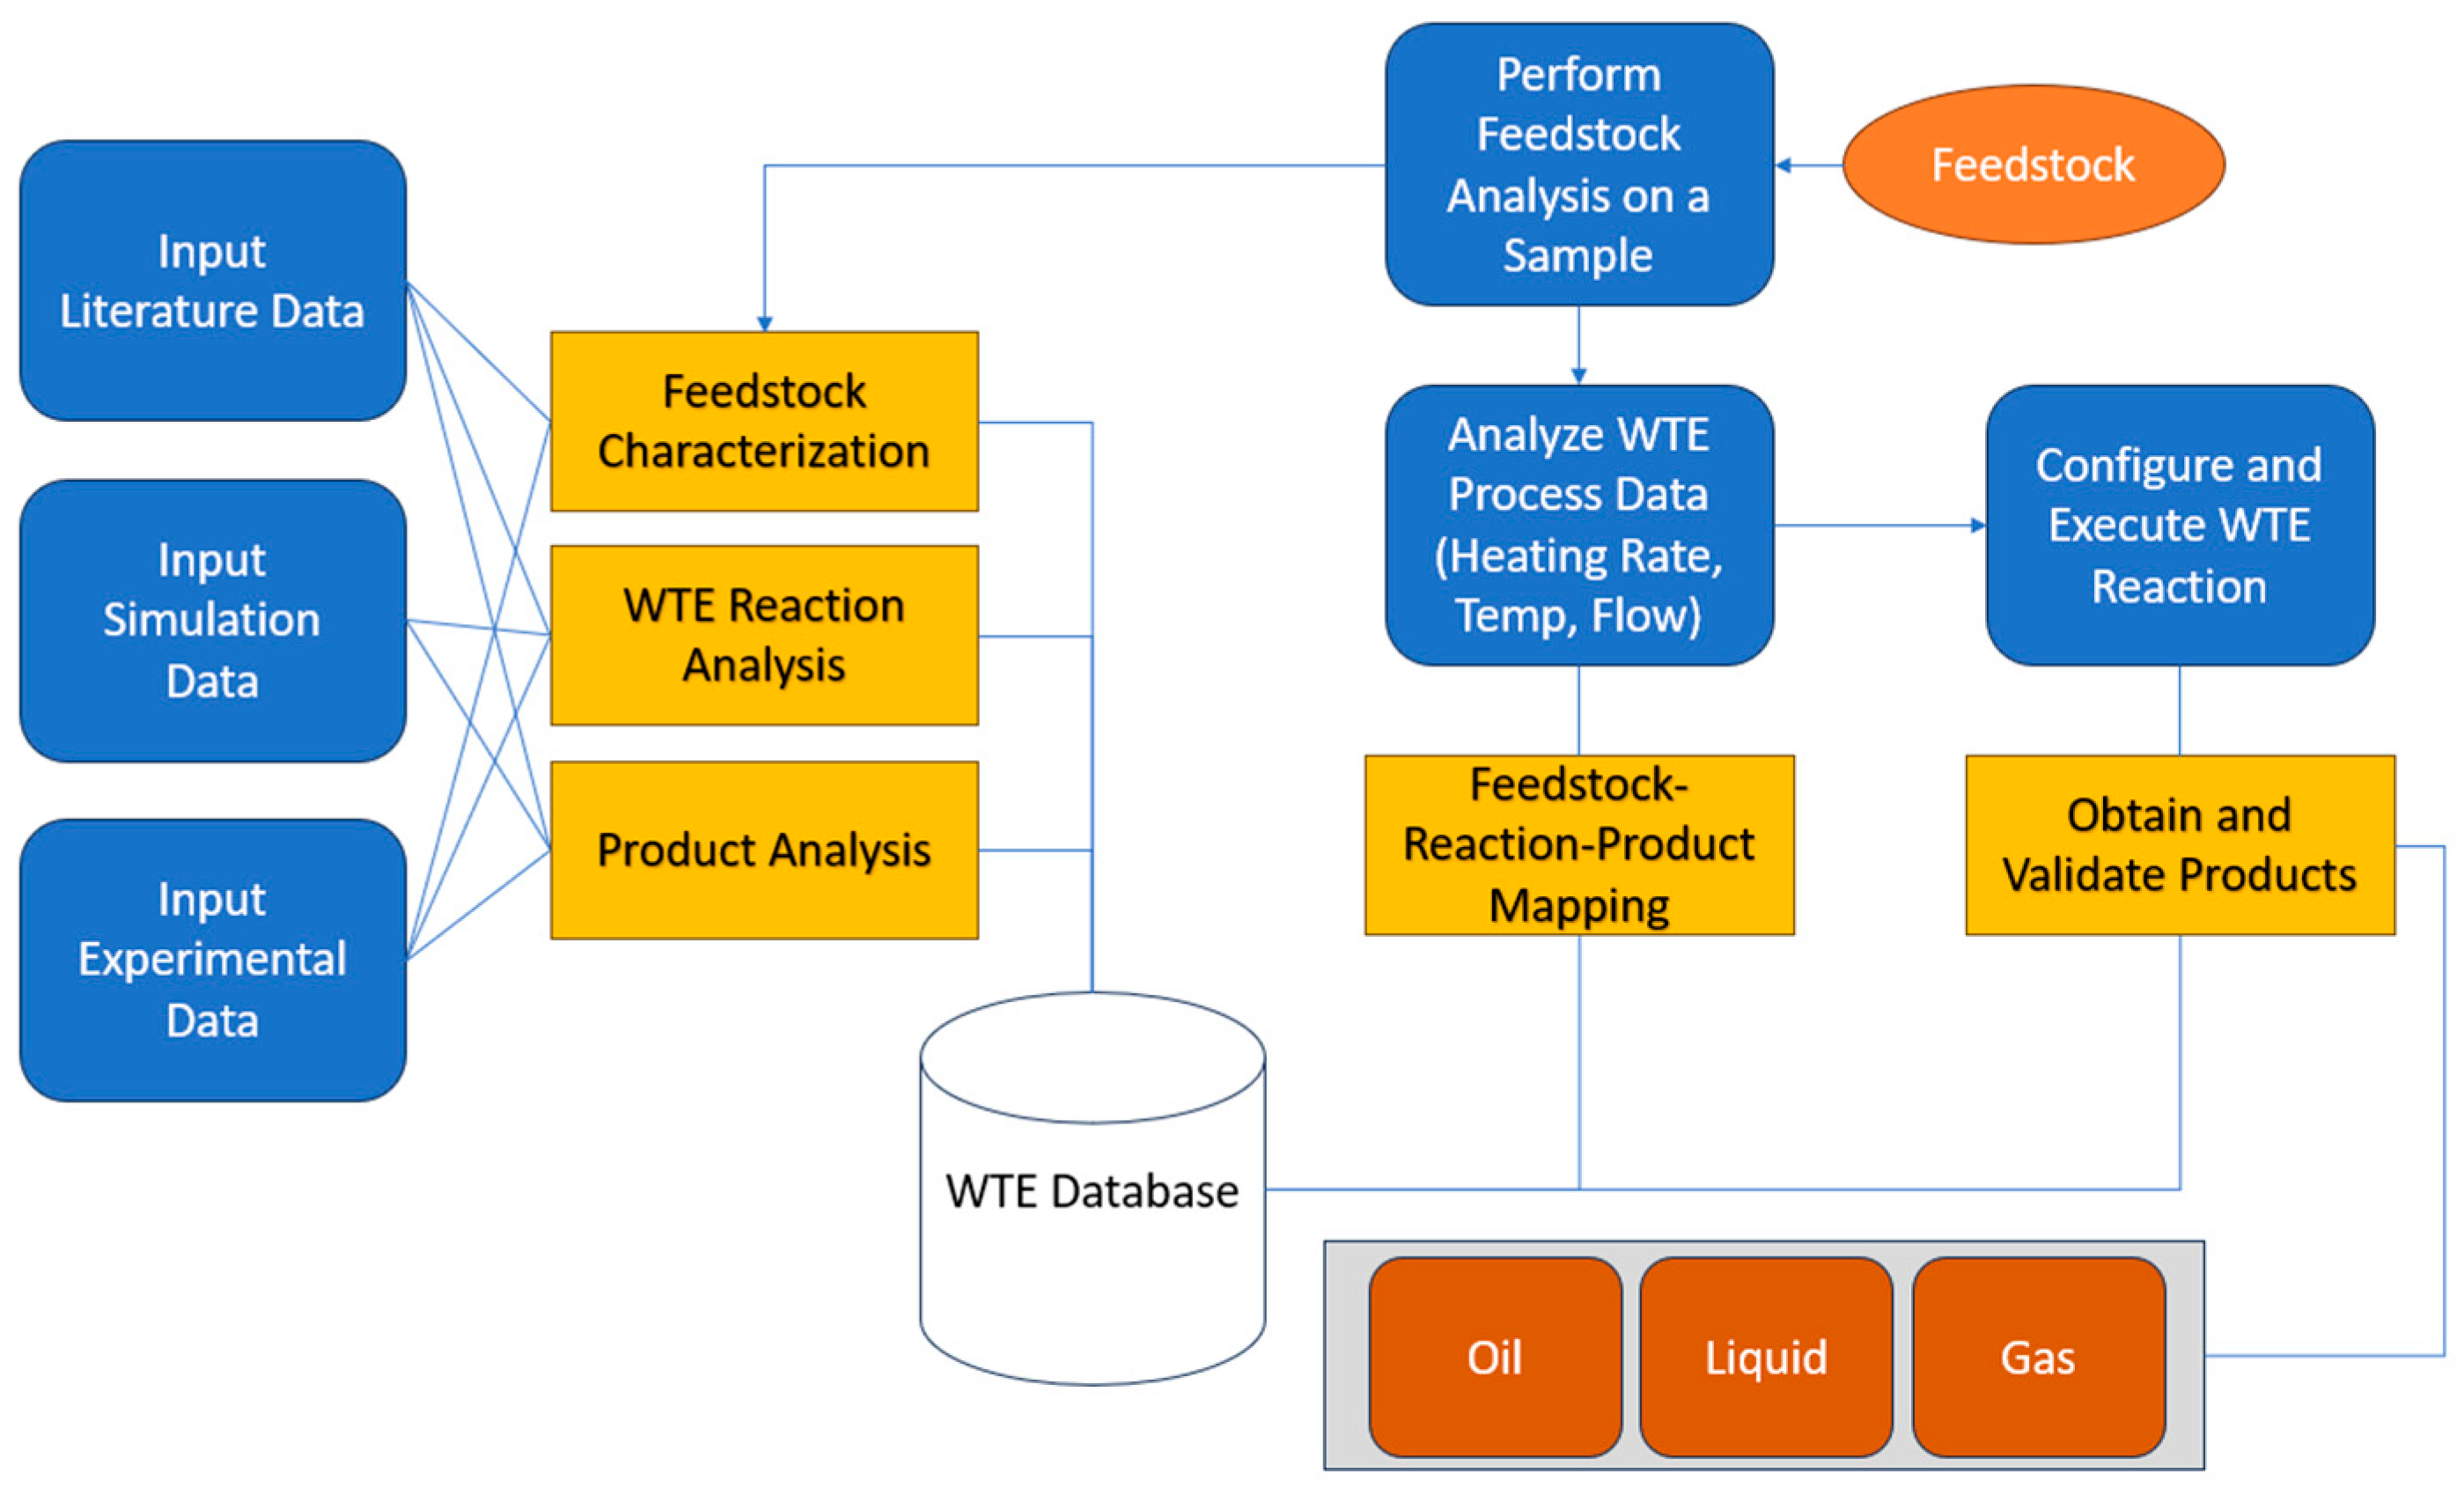
Table 3.
Relationship between conversion (α), temperature and activation energy [51].
Table 3.
Relationship between conversion (α), temperature and activation energy [51].
| Conversion range (α) | Temperature range (K) | Reactions | Activation energy (Ea) |
|---|---|---|---|
| α ≤ 0.17 | 25-380 | liberation of retained moisture and the simultaneous degradation of smaller sugar molecules | Increased from starting point to 100-150 kJ mol-1 |
| 0.17 ≤ α ≤ 0.5 | 380-470 | Degradation of cellulose, hemicellulose and pectin | Increased from 150-180 kJ mol-1, and then decreed from 180 to 140 kJ mol-1 |
| 0.5 ≤ α ≤ 0.8 | 470-520 | Degradation of lignin | from 180 to 220 kJ mol-1 |
| 0.8 ≤ α ≤ 1.0 | 520-800 | Lignin degradation and char formation | Decreased from 240 to 120 kJ mol-1 |
Table 4.
Relationship between conversion (α), temperature and activation energy [51].
Table 4.
Relationship between conversion (α), temperature and activation energy [51].
| Conversion range (α) | Temperature range (K) | Reactions | Activation energy (Ea) |
|---|---|---|---|
| α ≤ 0.17 | 25-370 | liberation of retained moisture and the simultaneous degradation of smaller sugar molecules | Increased from starting point to 100-140 kJ mol-1 |
| 0.17 ≤ α ≤ 0.5 | 370-480 | Degradation of cellulose, hemicellulose and pectin | Increased from 140-190 kJ mol-1, and then decreed from slightly with 5 kJ mol-1 and |
| 0.5 ≤ α ≤ 0.8 | 480-510 | Degradation of lignin | Increased from 190 to 260 kJ mol-1 |
| 0.8 ≤ α ≤ 1.0 | 510-800 | Lignin degradation and char formation | Decreased from 260 to 110 kJ mol-1 |
Disclaimer/Publisher’s Note: The statements, opinions and data contained in all publications are solely those of the individual author(s) and contributor(s) and not of MDPI and/or the editor(s). MDPI and/or the editor(s) disclaim responsibility for any injury to people or property resulting from any ideas, methods, instructions or products referred to in the content. |
© 2023 by the authors. Licensee MDPI, Basel, Switzerland. This article is an open access article distributed under the terms and conditions of the Creative Commons Attribution (CC BY) license (http://creativecommons.org/licenses/by/4.0/).
Copyright: This open access article is published under a Creative Commons CC BY 4.0 license, which permit the free download, distribution, and reuse, provided that the author and preprint are cited in any reuse.


